Download as PDF, PPTX

![Evaluating A Single Query
● Query Example: “Television Stands”
● Ground Truth Retrieved “Files”
[Mobile TV Cart, Universal TV Stand, TV Stand [2 feet]
● Predicted Retrieved “Files”
Model A [Mobile TV Cart, Universal TV Stand, Black Television]
Model B [Mobile TV Cart, Universal TV Stand, TV Stand [2 feet]
Evaluation score like Recall will be higher for Model B](https://image.slidesharecdn.com/bluelightaiwebinardeck1-250117214734-04c84aa3/75/How-to-Optimize-Your-Embedding-Model-Selection-and-Development-through-TDA-Clustering-12-2048.jpg)


![Case Study Data
100k subset of the Marqo-GS-10M dataset of 10 million queries+products from Google Shopping.
● Query Example: “Television Stands”
● Ground Truth are “Products” we want to retrieve from the Vector Database
[Mobile TV Cart, Universal TV Stand, TV Stand [2 feet]
● The performance metrics reward predicting both the presence and ranking of correct
products
-](https://image.slidesharecdn.com/bluelightaiwebinardeck1-250117214734-04c84aa3/75/How-to-Optimize-Your-Embedding-Model-Selection-and-Development-through-TDA-Clustering-32-2048.jpg)
![Evaluating A Single Query
● Query Example: “Television Stands”
● Ground Truth Retrieved “Files”
[Mobile TV Cart, Universal TV Stand, TV Stand [2 feet]
● Predicted Retrieved “Files”
Model A [Mobile TV Cart, Universal TV Stand, Black Television]
Model B [Mobile TV Cart, Universal TV Stand, TV Stand [2 feet]
Evaluation score like Recall will be higher for Model B](https://image.slidesharecdn.com/bluelightaiwebinardeck1-250117214734-04c84aa3/75/How-to-Optimize-Your-Embedding-Model-Selection-and-Development-through-TDA-Clustering-33-2048.jpg)


![Evaluating A Single Query
● Query Example: “Television Stands”
● Ground Truth Retrieved “Files”
[Mobile TV Cart, Universal TV Stand, TV Stand [2 feet]
● Predicted Retrieved “Files”
Model A [Mobile TV Cart, Universal TV Stand, Black Television]
Model B [Mobile TV Cart, Universal TV Stand, TV Stand [2 feet]
Evaluation score like Recall will be higher for Model B](https://crownmelresort.com/image.slidesharecdn.com/bluelightaiwebinardeck1-250117214734-04c84aa3/75/How-to-Optimize-Your-Embedding-Model-Selection-and-Development-through-TDA-Clustering-12-2048.jpg)


![Case Study Data
100k subset of the Marqo-GS-10M dataset of 10 million queries+products from Google Shopping.
● Query Example: “Television Stands”
● Ground Truth are “Products” we want to retrieve from the Vector Database
[Mobile TV Cart, Universal TV Stand, TV Stand [2 feet]
● The performance metrics reward predicting both the presence and ranking of correct
products
-](https://crownmelresort.com/image.slidesharecdn.com/bluelightaiwebinardeck1-250117214734-04c84aa3/75/How-to-Optimize-Your-Embedding-Model-Selection-and-Development-through-TDA-Clustering-32-2048.jpg)
![Evaluating A Single Query
● Query Example: “Television Stands”
● Ground Truth Retrieved “Files”
[Mobile TV Cart, Universal TV Stand, TV Stand [2 feet]
● Predicted Retrieved “Files”
Model A [Mobile TV Cart, Universal TV Stand, Black Television]
Model B [Mobile TV Cart, Universal TV Stand, TV Stand [2 feet]
Evaluation score like Recall will be higher for Model B](https://crownmelresort.com/image.slidesharecdn.com/bluelightaiwebinardeck1-250117214734-04c84aa3/75/How-to-Optimize-Your-Embedding-Model-Selection-and-Development-through-TDA-Clustering-33-2048.jpg)


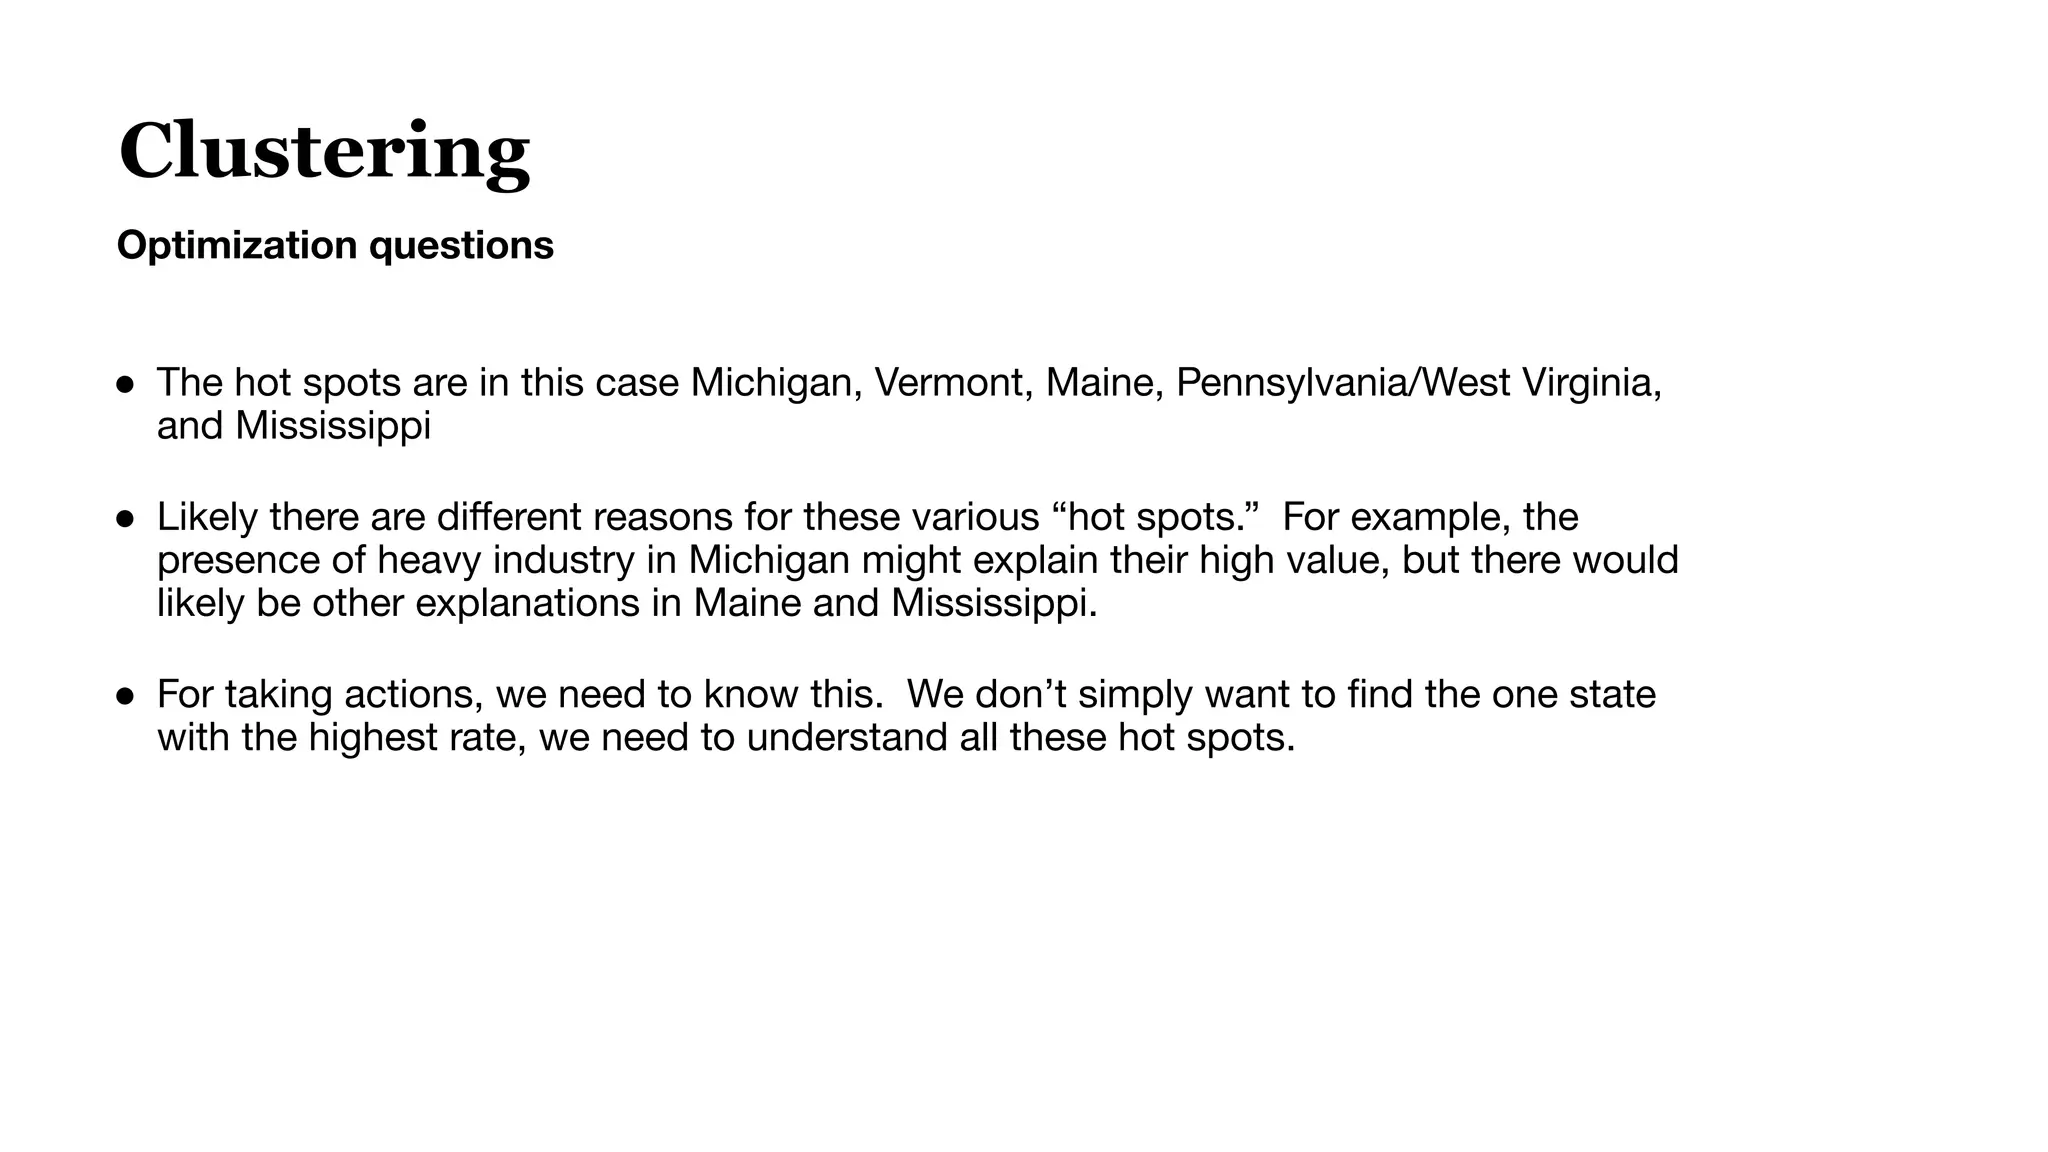
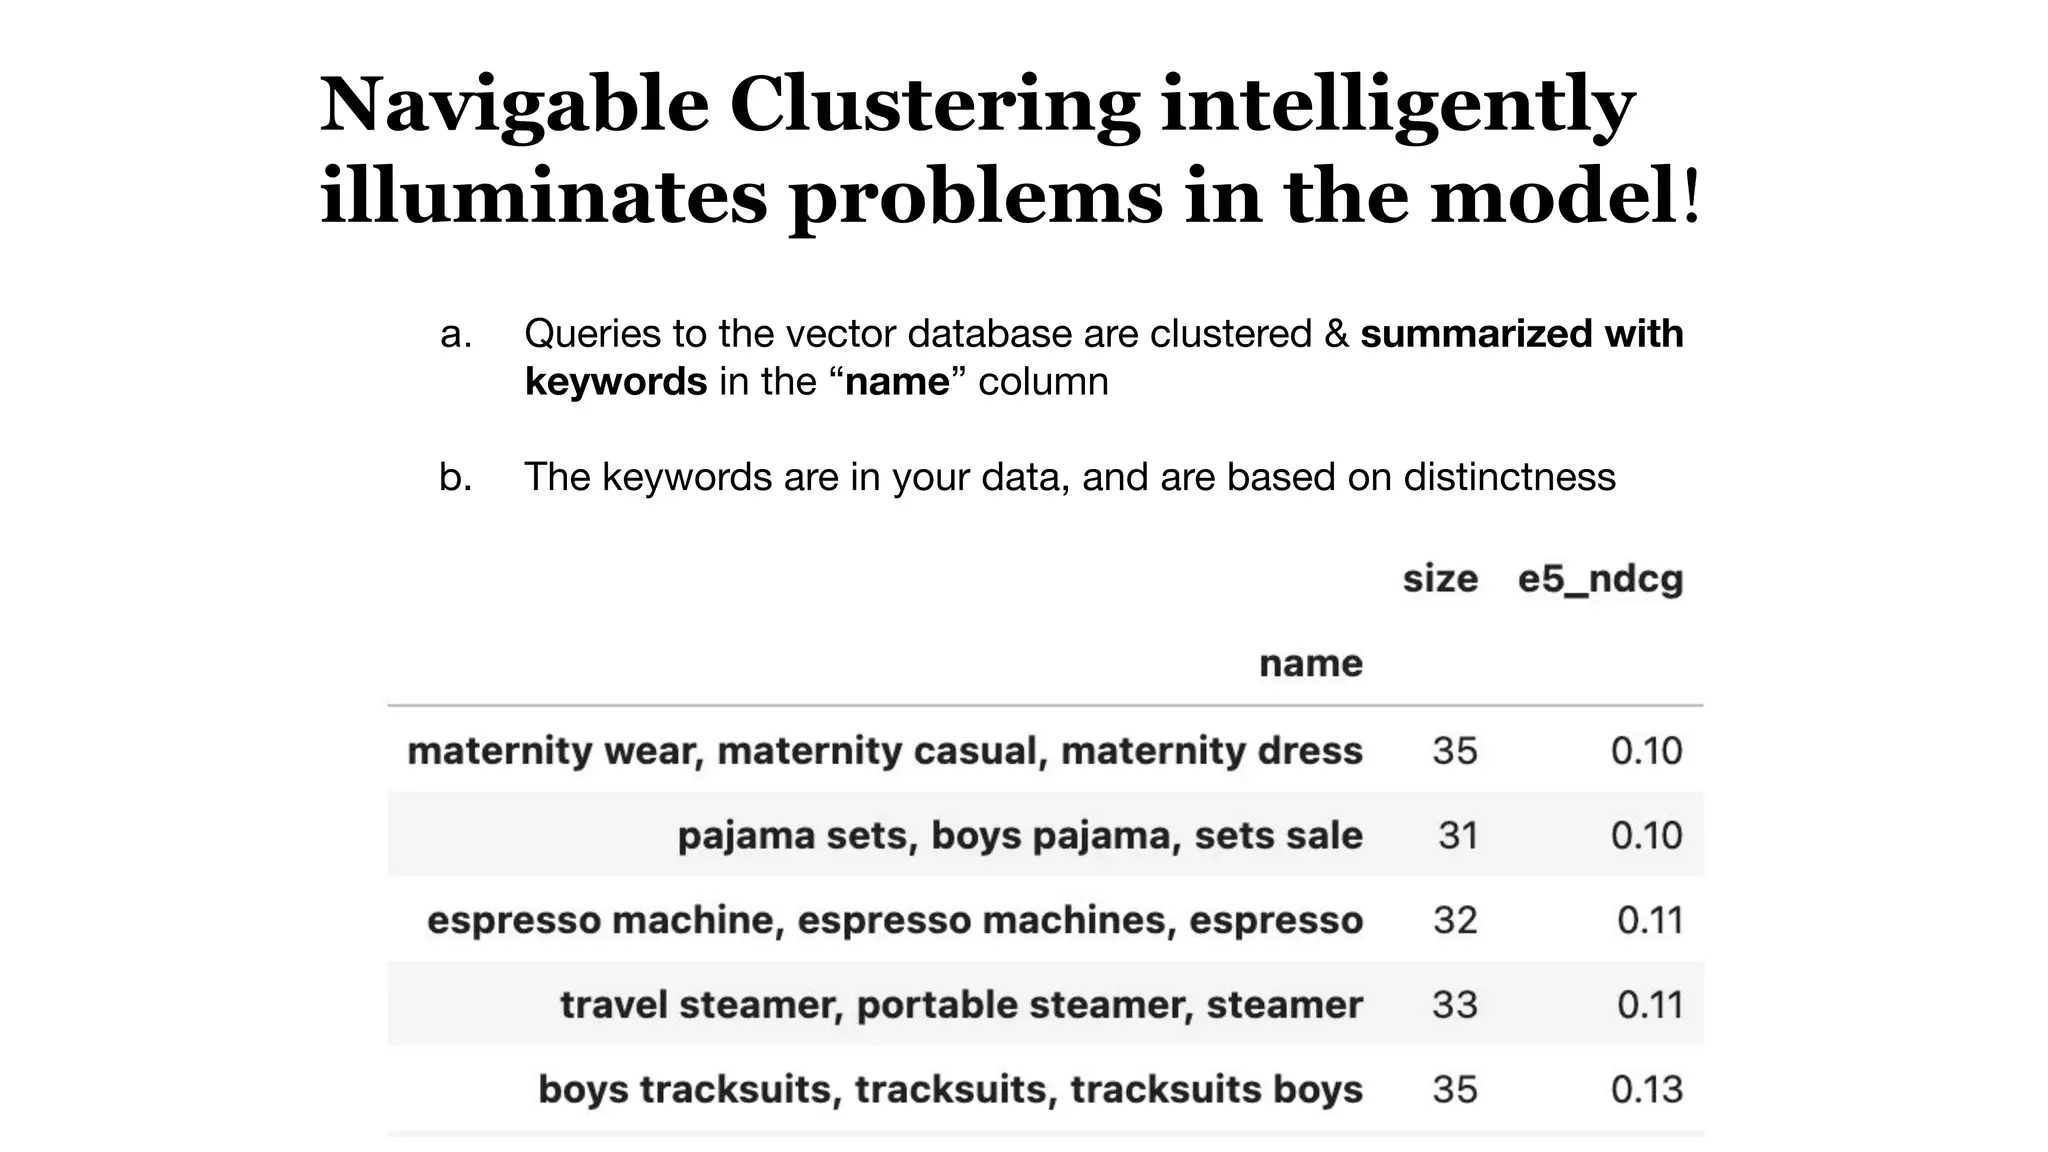
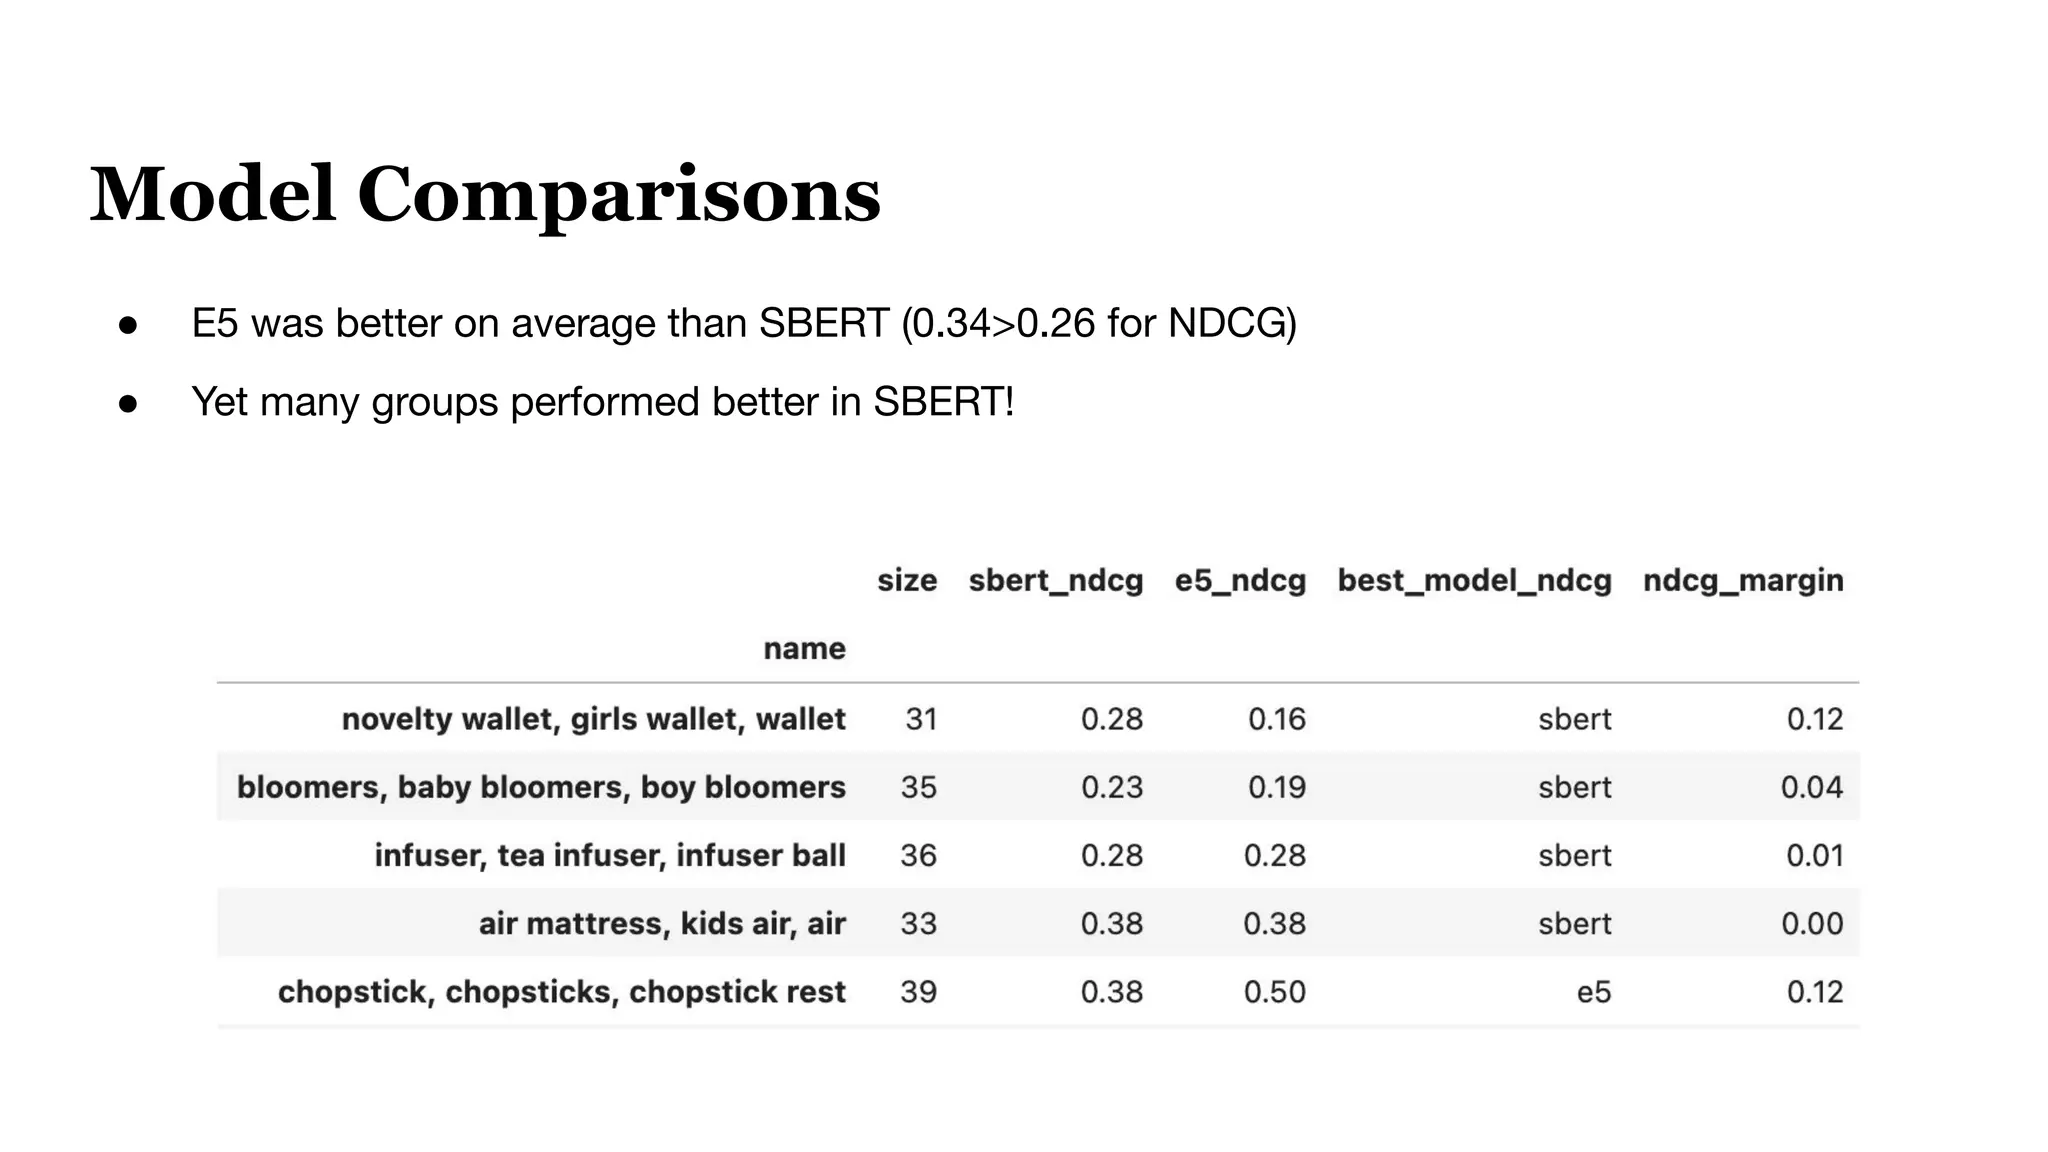
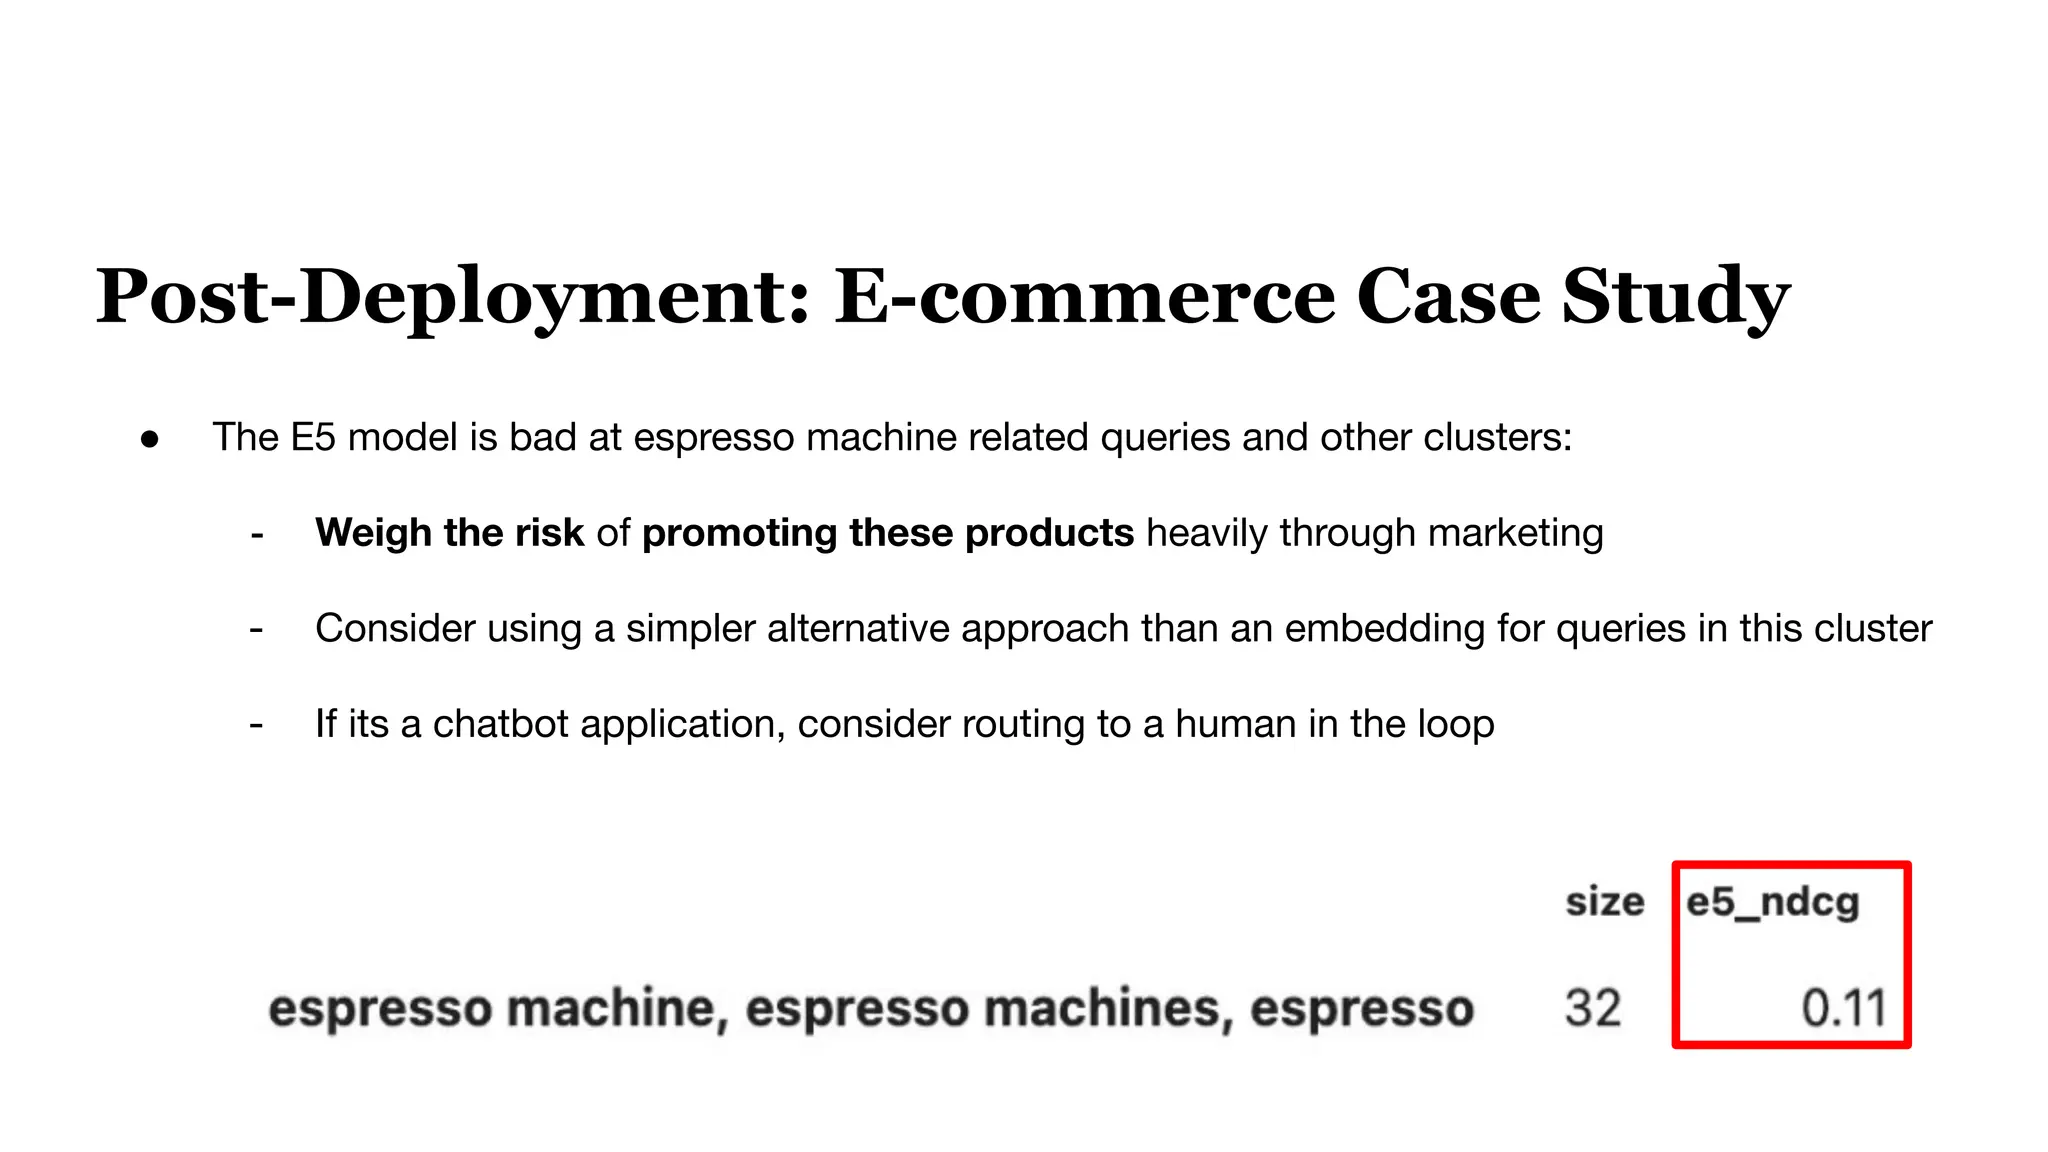
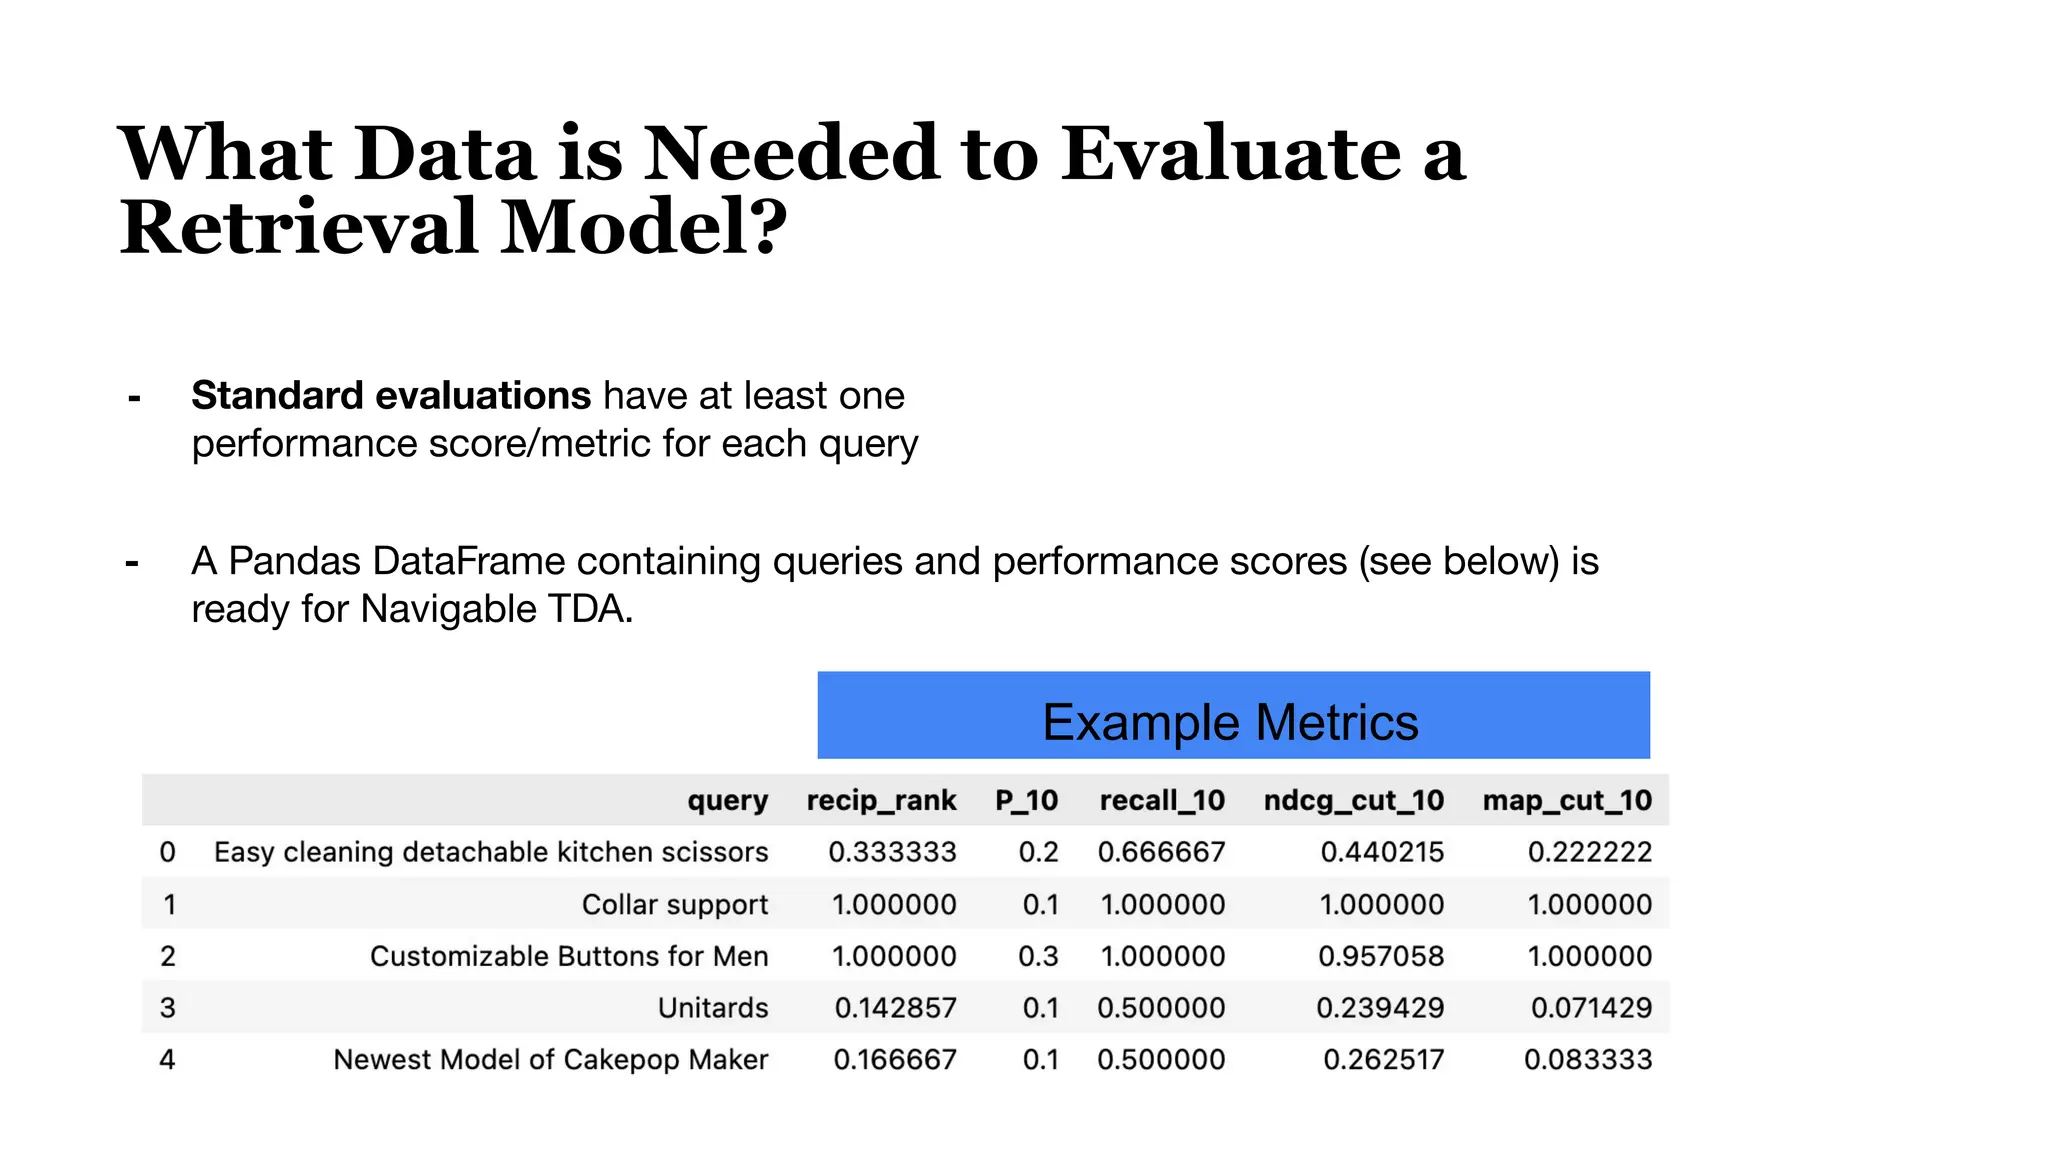
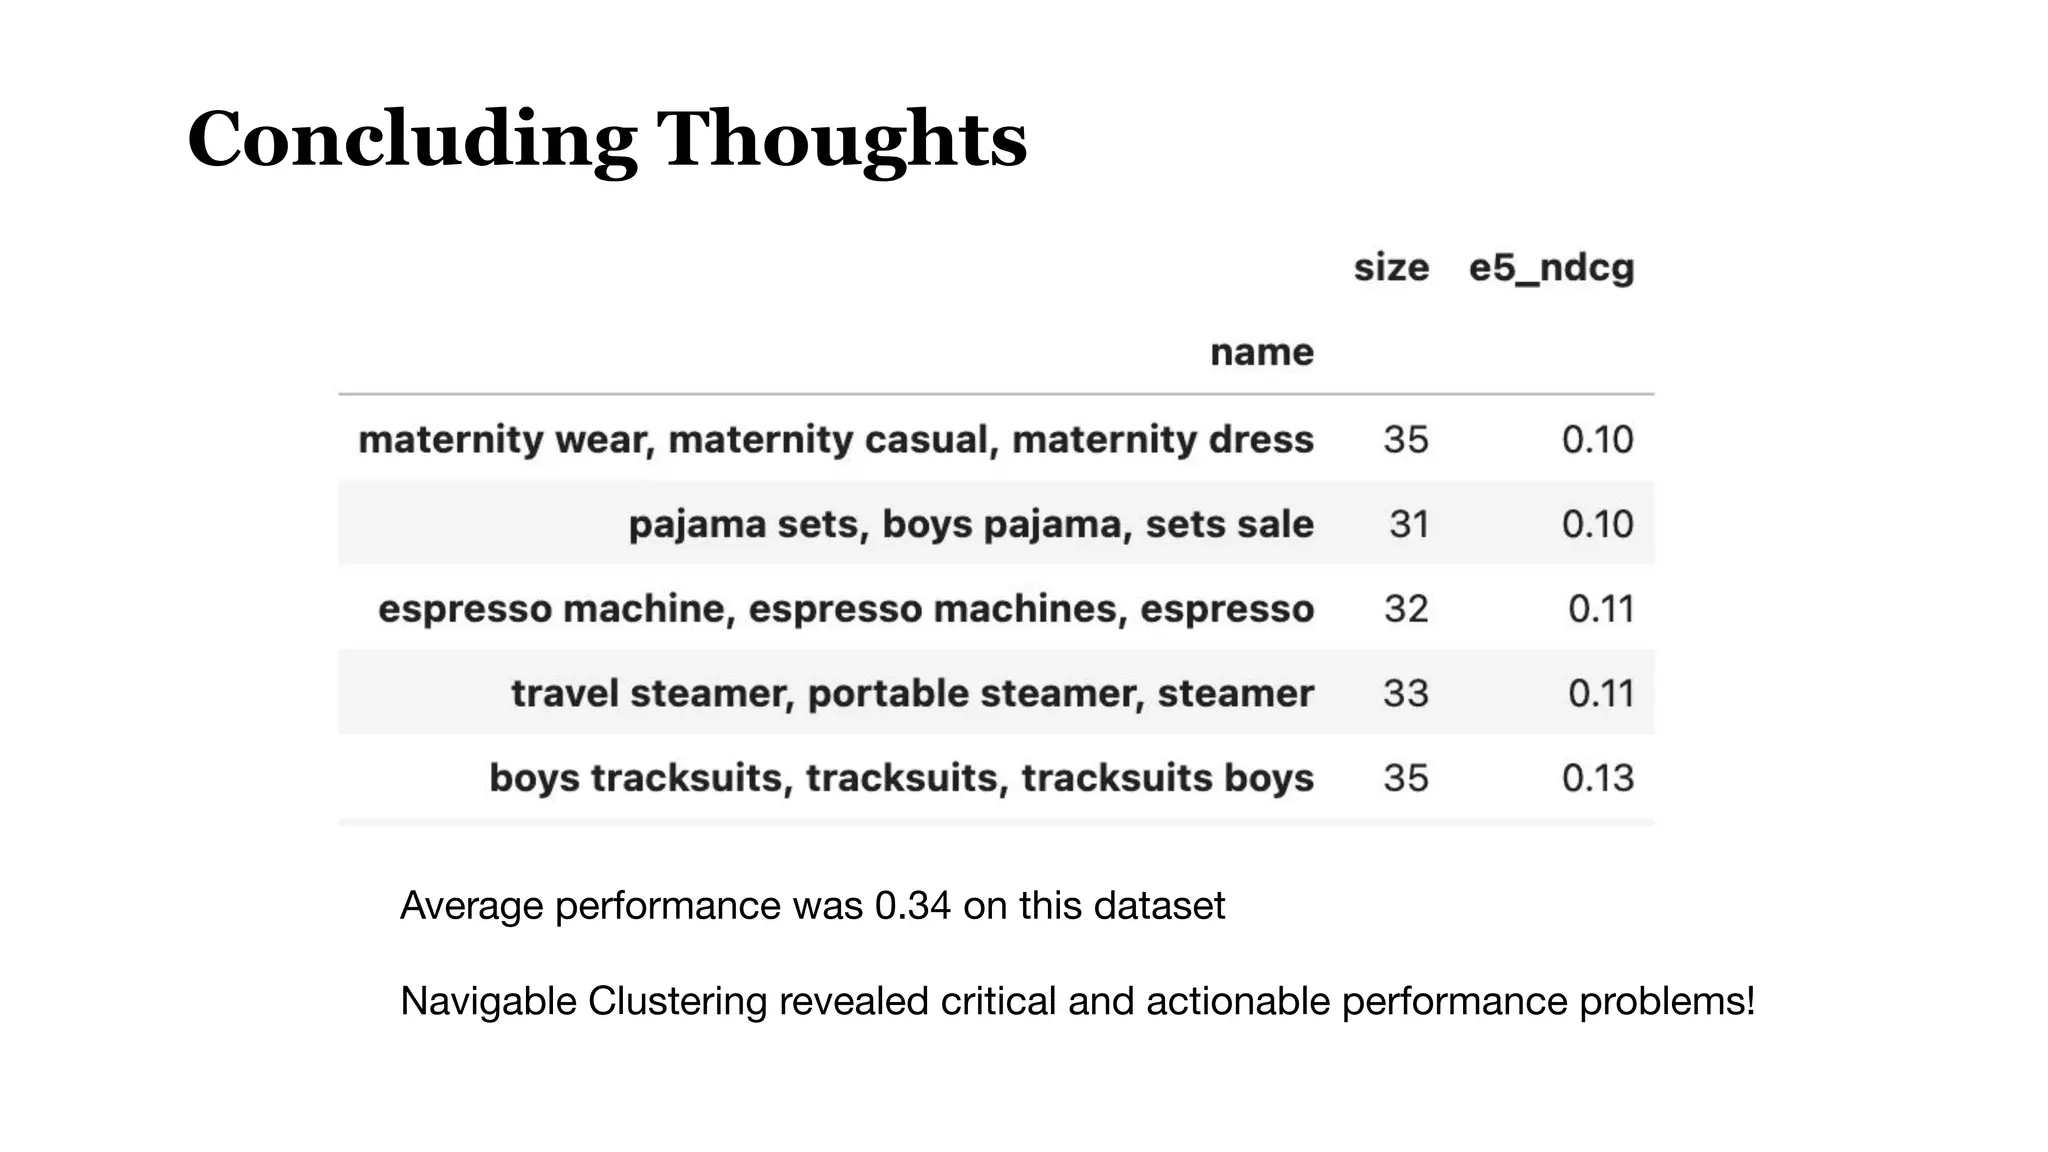
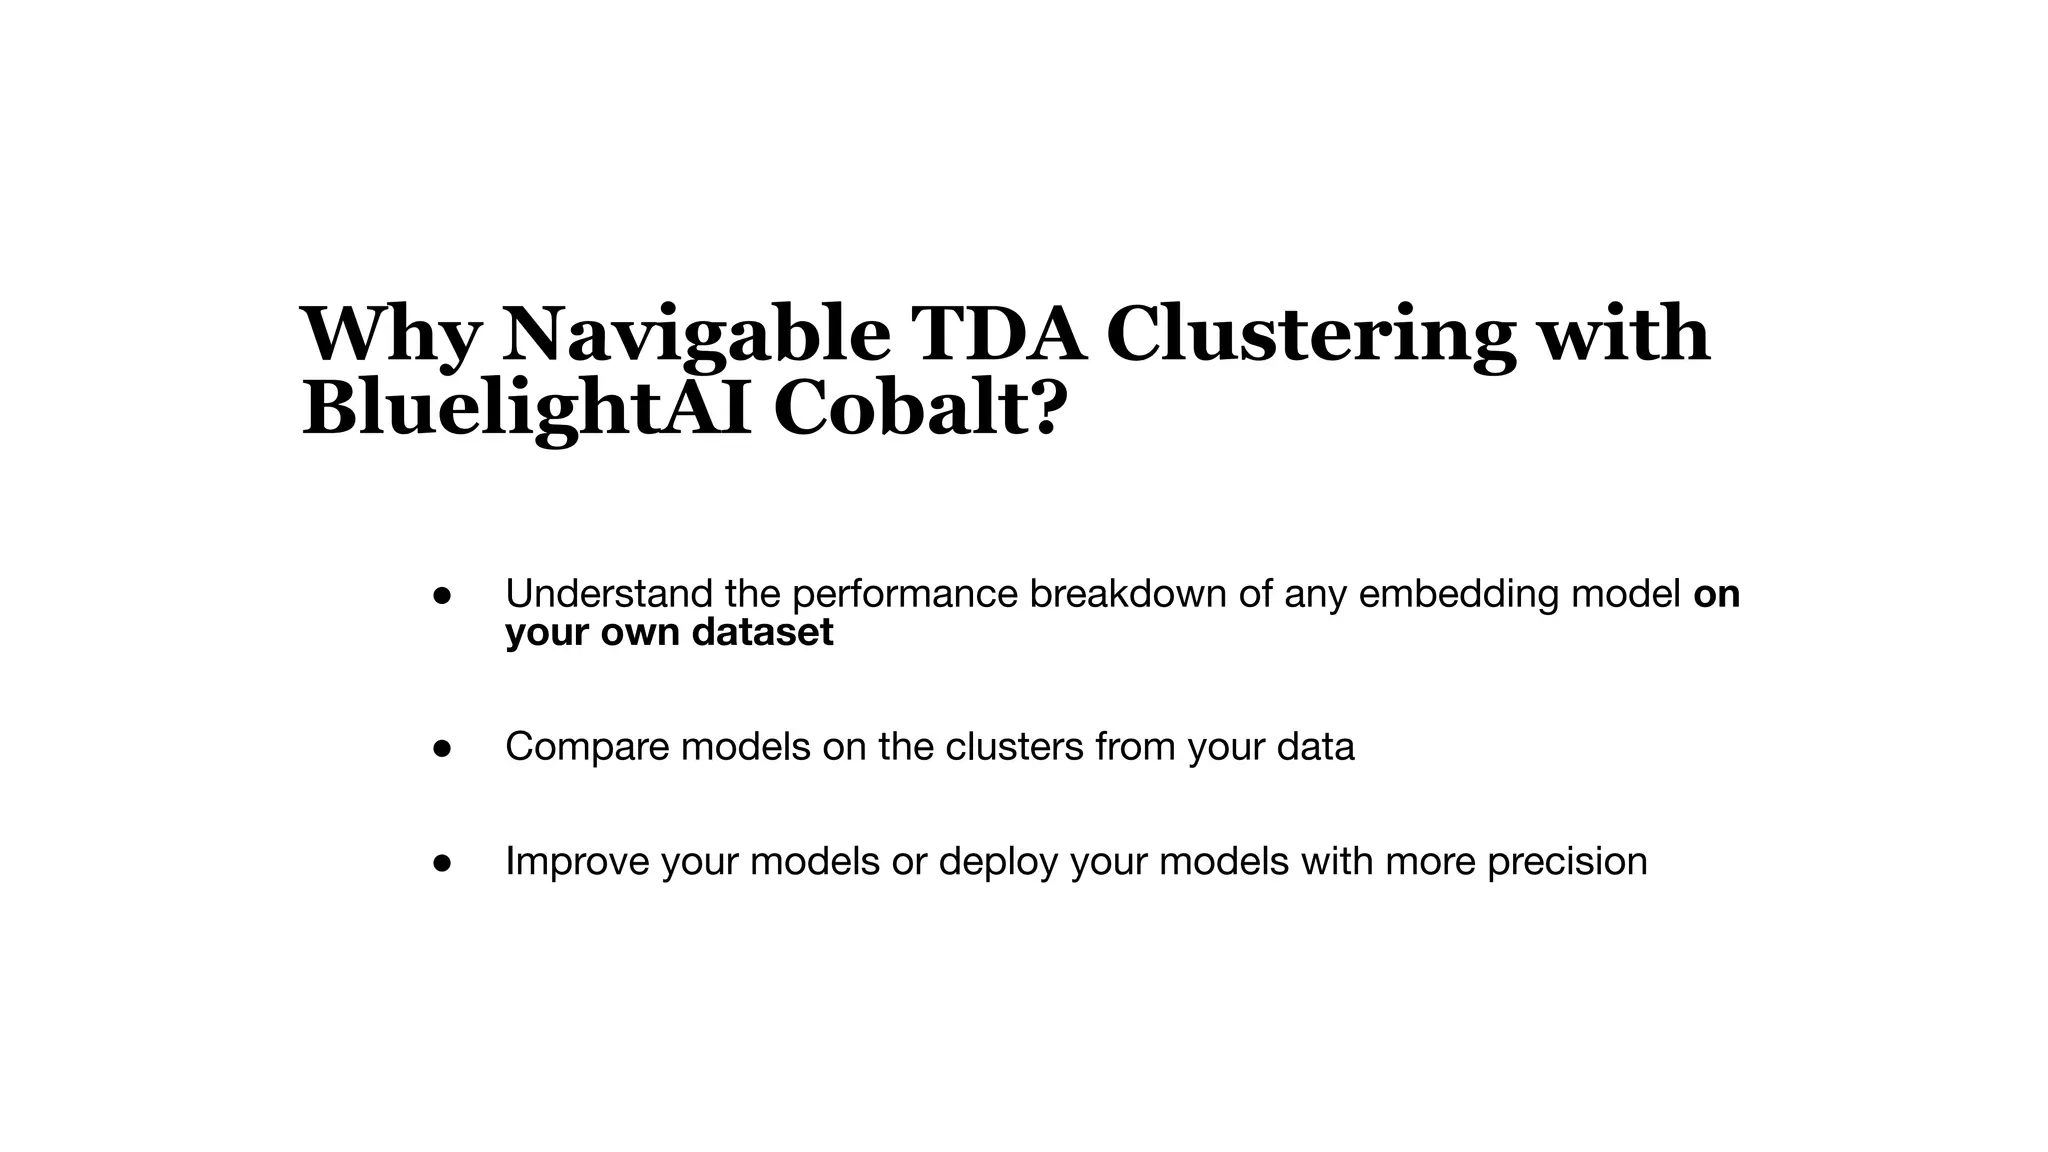
This document discusses optimizing embedding models through topological data analysis (TDA) and navigable clustering, emphasizing the importance of evaluating models on custom datasets to avoid performance misjudgments. It outlines current shortcomings in evaluation strategies and proposes a more granular approach to model assessment, enabling precise comparisons and improvements. Through case studies and performance metrics, the authors illustrate the effectiveness of their approach in enhancing AI retrieval tasks.


![Support, Monitoring, Continuous Improvement & Scaling Agentic Automation [3/3]](https://cdn.slidesharecdn.com/ss_thumbnails/agenticcommunityseries-day3-cfd-251120170304-ddef8112-thumbnail.jpg?width=640&height=640&fit=bounds)

