Downloaded 210 times
![Ownership history
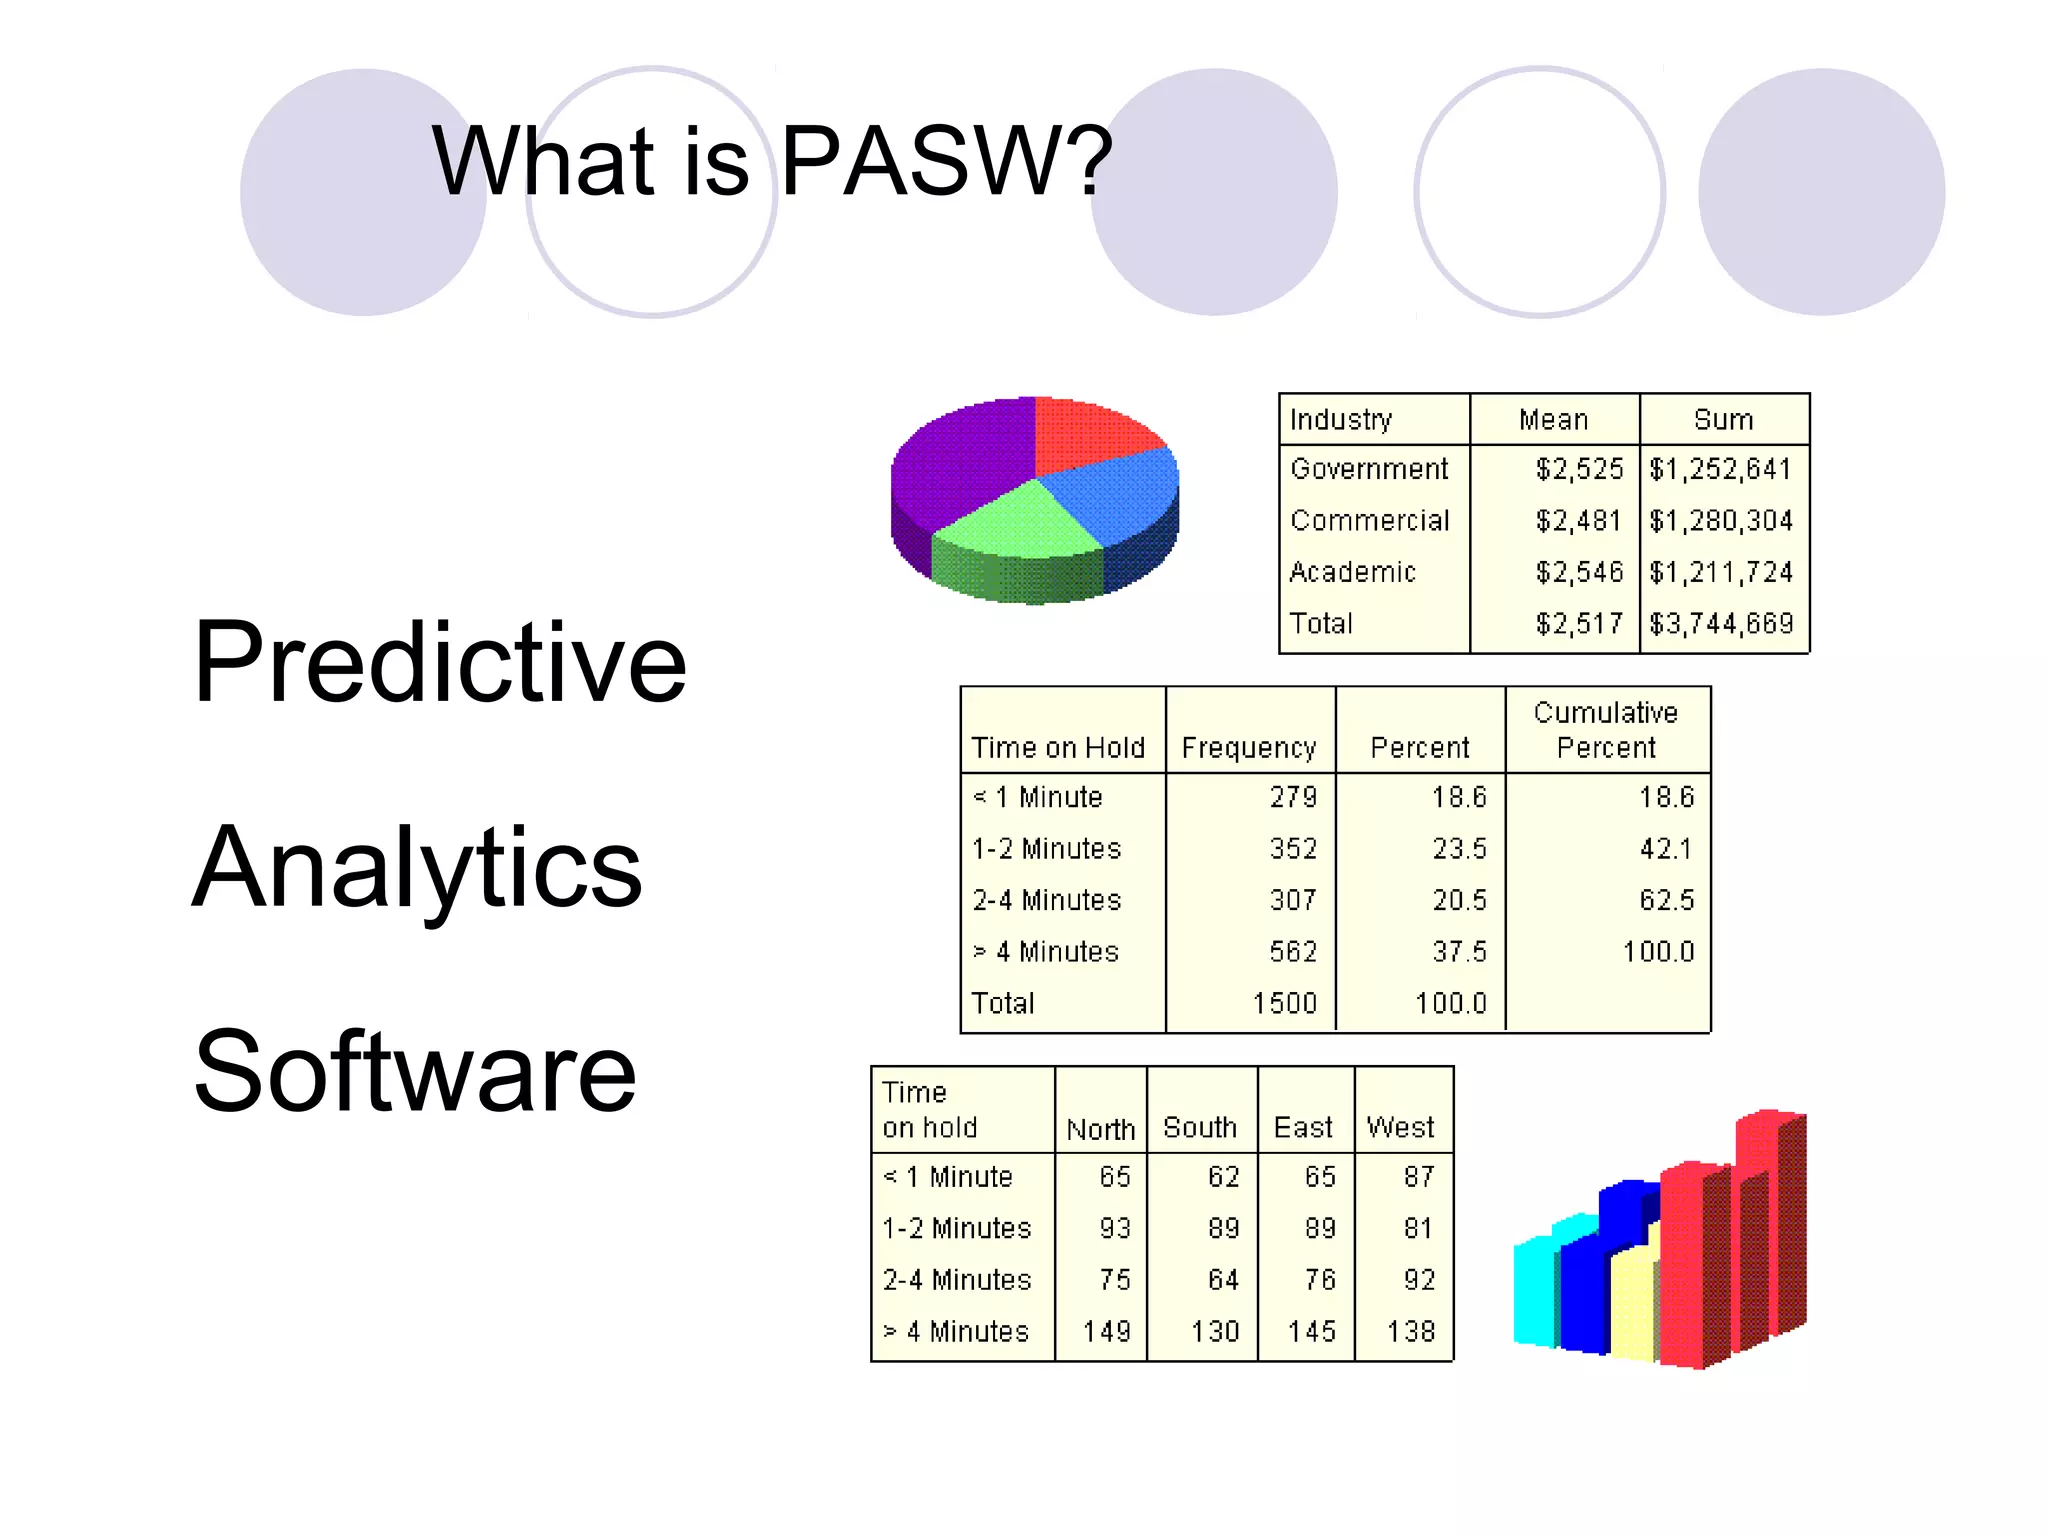
Between 2009 and 2010, the premier vendor for
SPSS was called PASW (Predictive Analytics
SoftWare) Statistics. The company announced
on July 28, 2009 that it was being acquired by
IBM for US$1.2 billion.[3]
IBM SPSS is now fully integrated into the IBM
Corporation, and is one of the brands under IBM
Software Group's Business Analytics Portfolio,
together with IBM Cognos.](https://image.slidesharecdn.com/introductiontospss-160308035359/75/An-Introduction-to-SPSS-5-2048.jpg)


![Ownership history
Between 2009 and 2010, the premier vendor for
SPSS was called PASW (Predictive Analytics
SoftWare) Statistics. The company announced
on July 28, 2009 that it was being acquired by
IBM for US$1.2 billion.[3]
IBM SPSS is now fully integrated into the IBM
Corporation, and is one of the brands under IBM
Software Group's Business Analytics Portfolio,
together with IBM Cognos.](https://crownmelresort.com/image.slidesharecdn.com/introductiontospss-160308035359/75/An-Introduction-to-SPSS-5-2048.jpg)


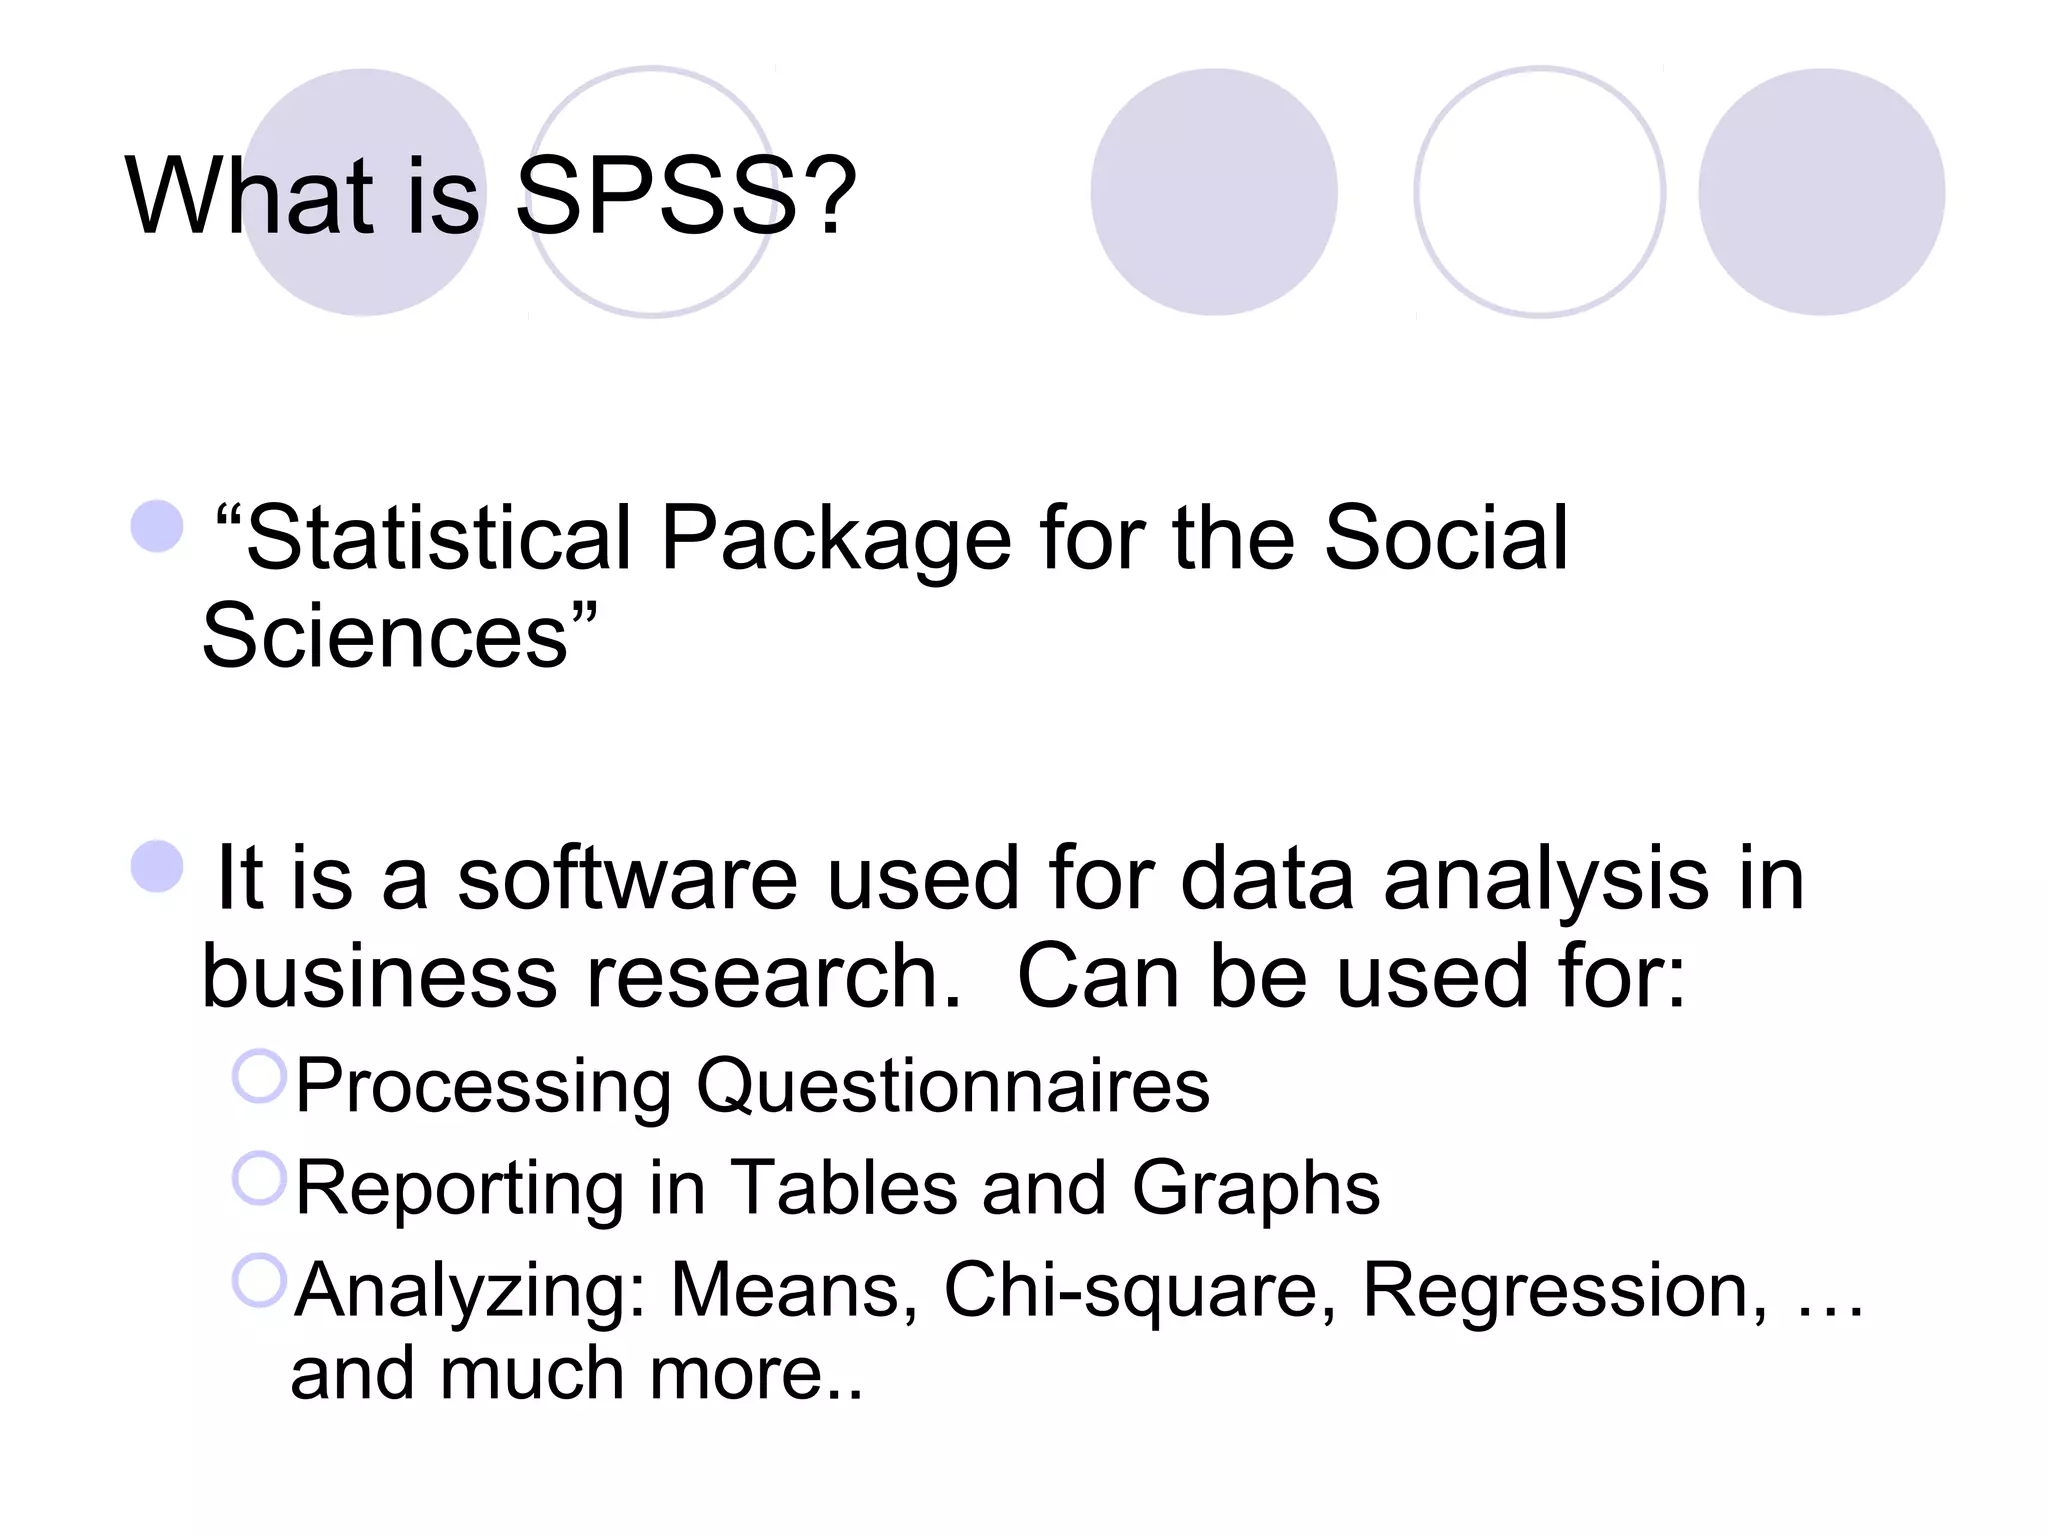
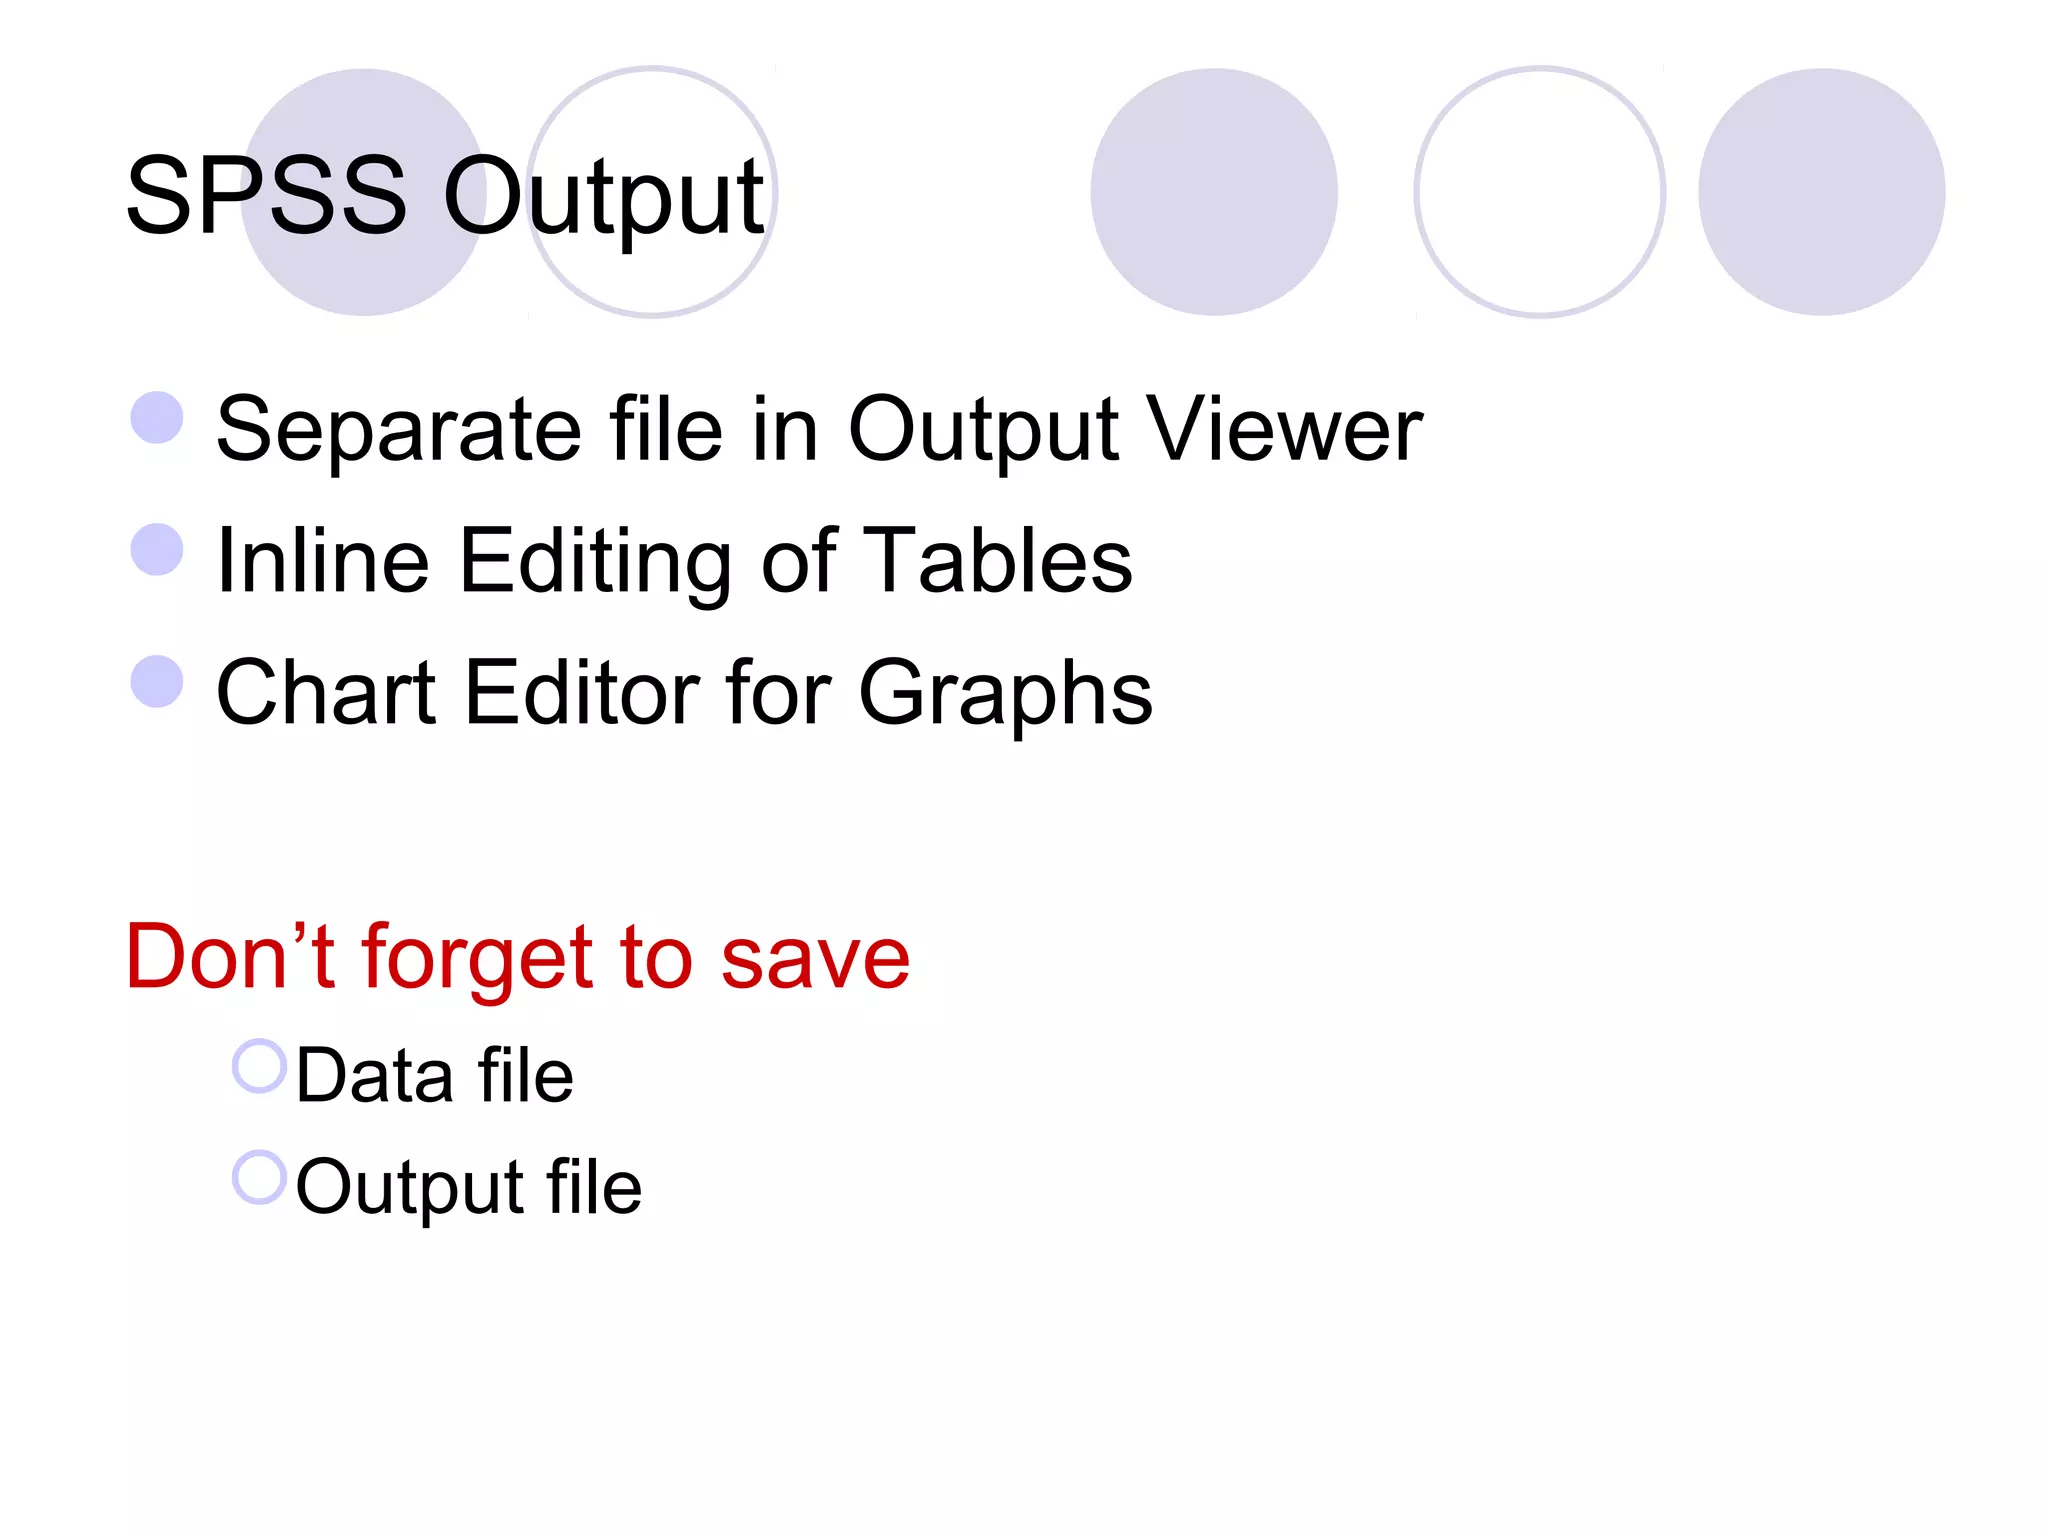
SPSS (Statistical Package for the Social Sciences) is statistical software used for data management and analysis. It allows users to process questionnaires, report data in tables and graphs, and analyze data through various tests like means, chi-square, and regression. Originally called SPSS Inc., it is now owned by IBM and known as IBM SPSS Statistics. The document provides an introduction to SPSS and outlines how to define variables, enter data, select cases, run descriptive statistics like frequencies and crosstabs, and manipulate output files.
SPSS (Statistical Package for the Social Sciences), a software for data analysis, its history, ownership by IBM, and services provided.
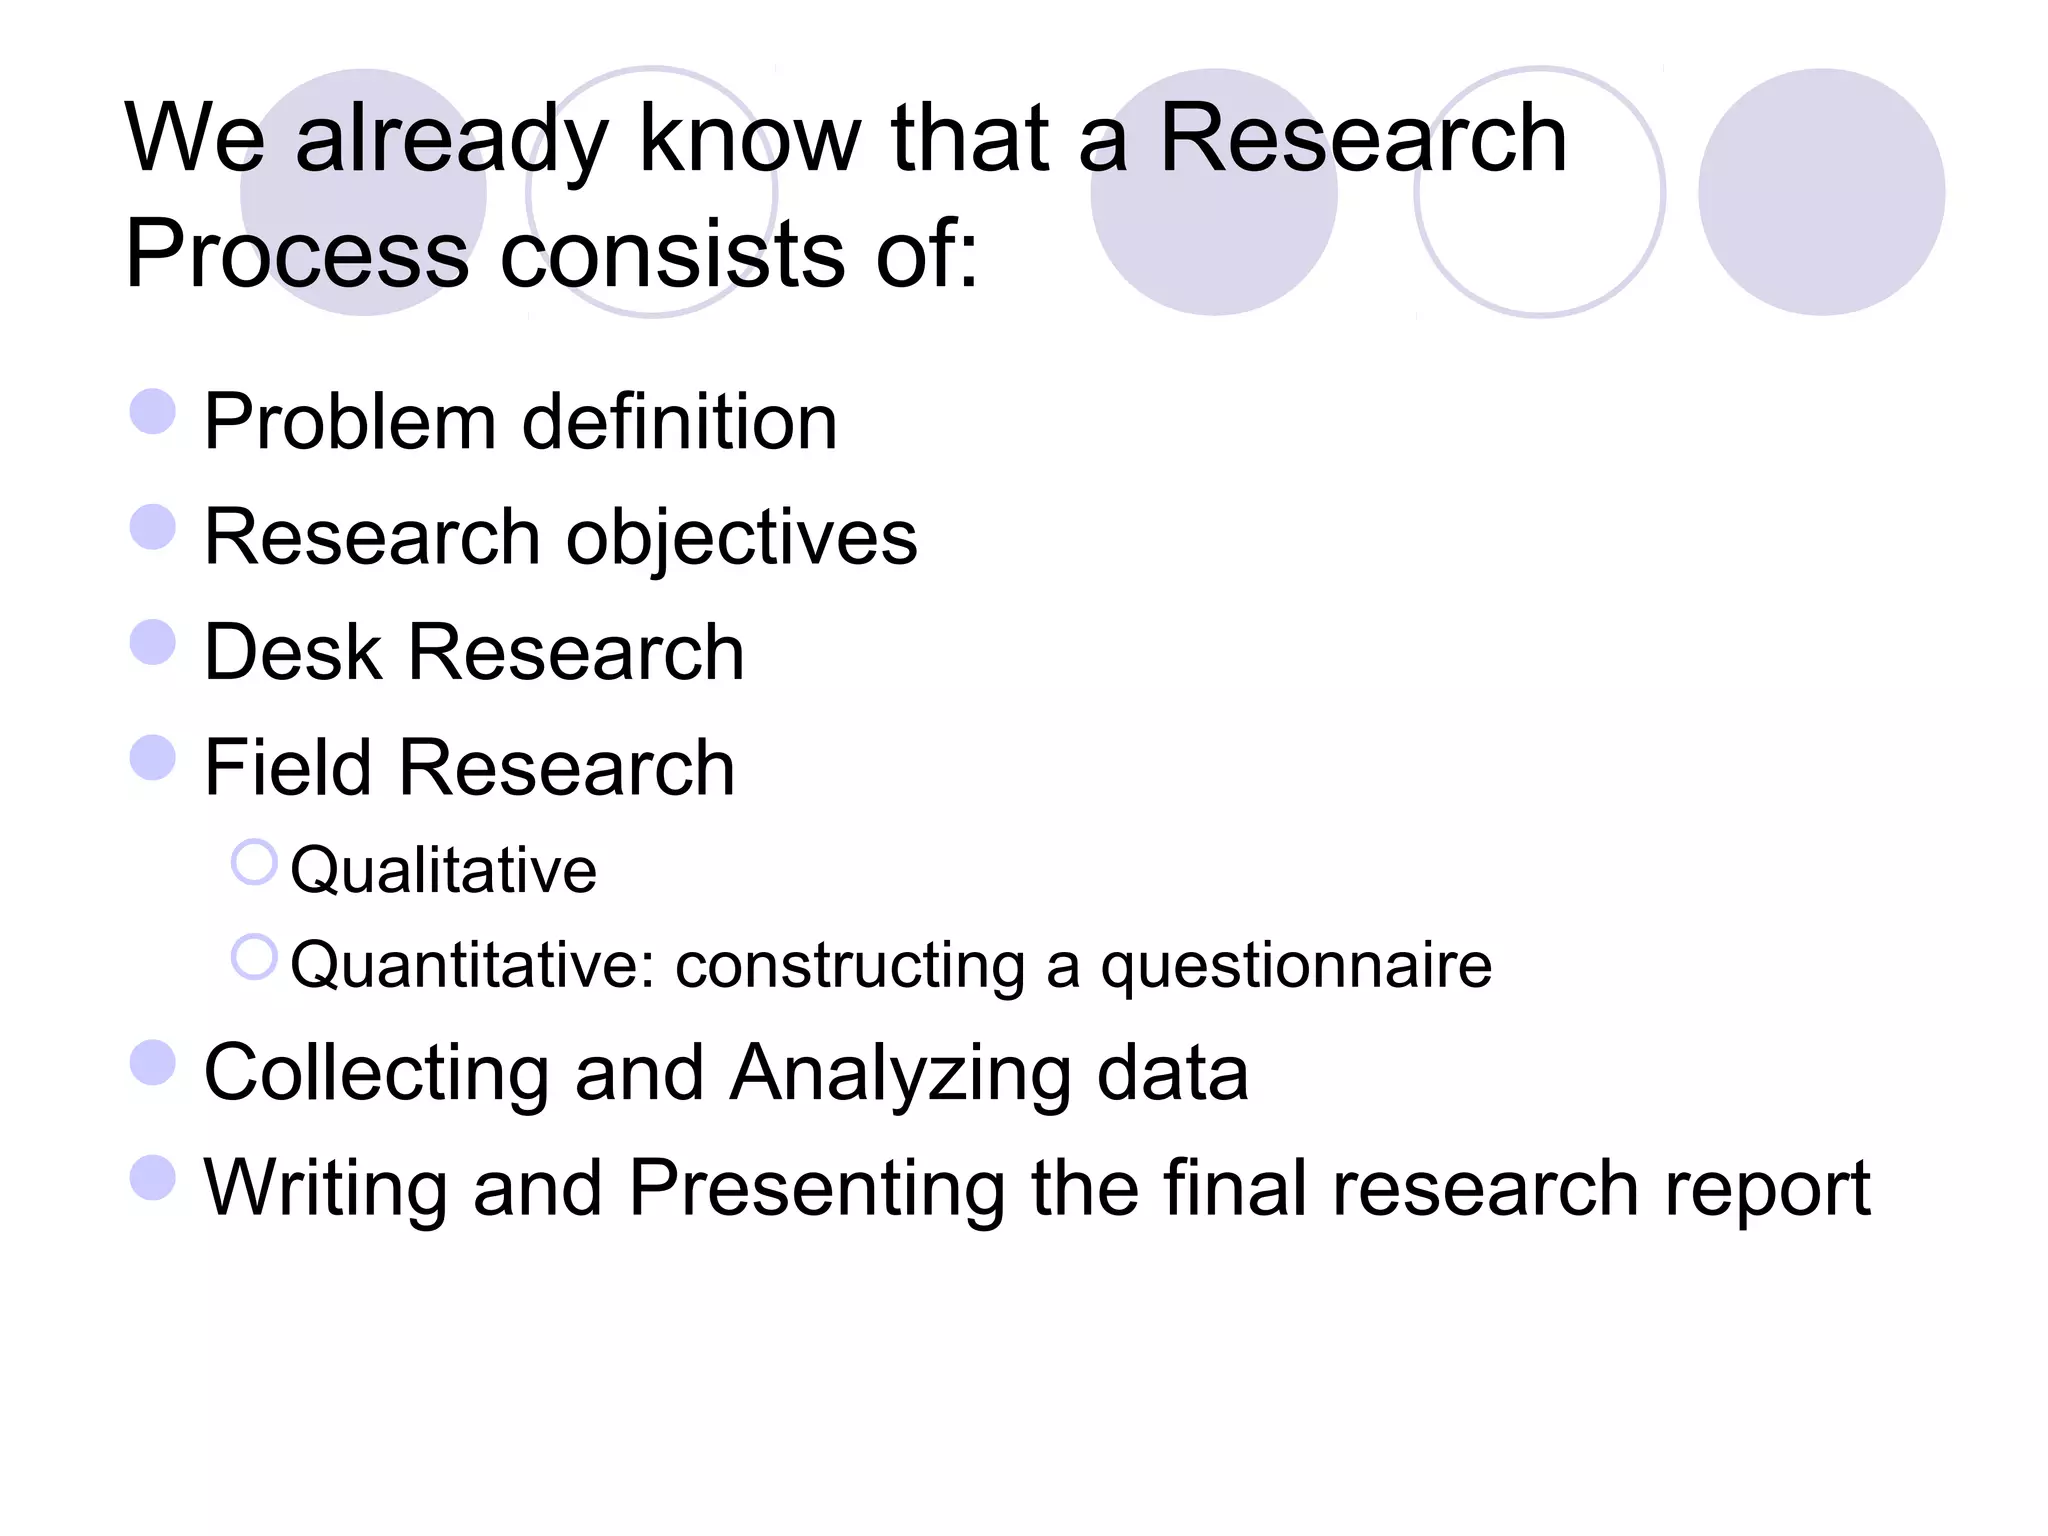
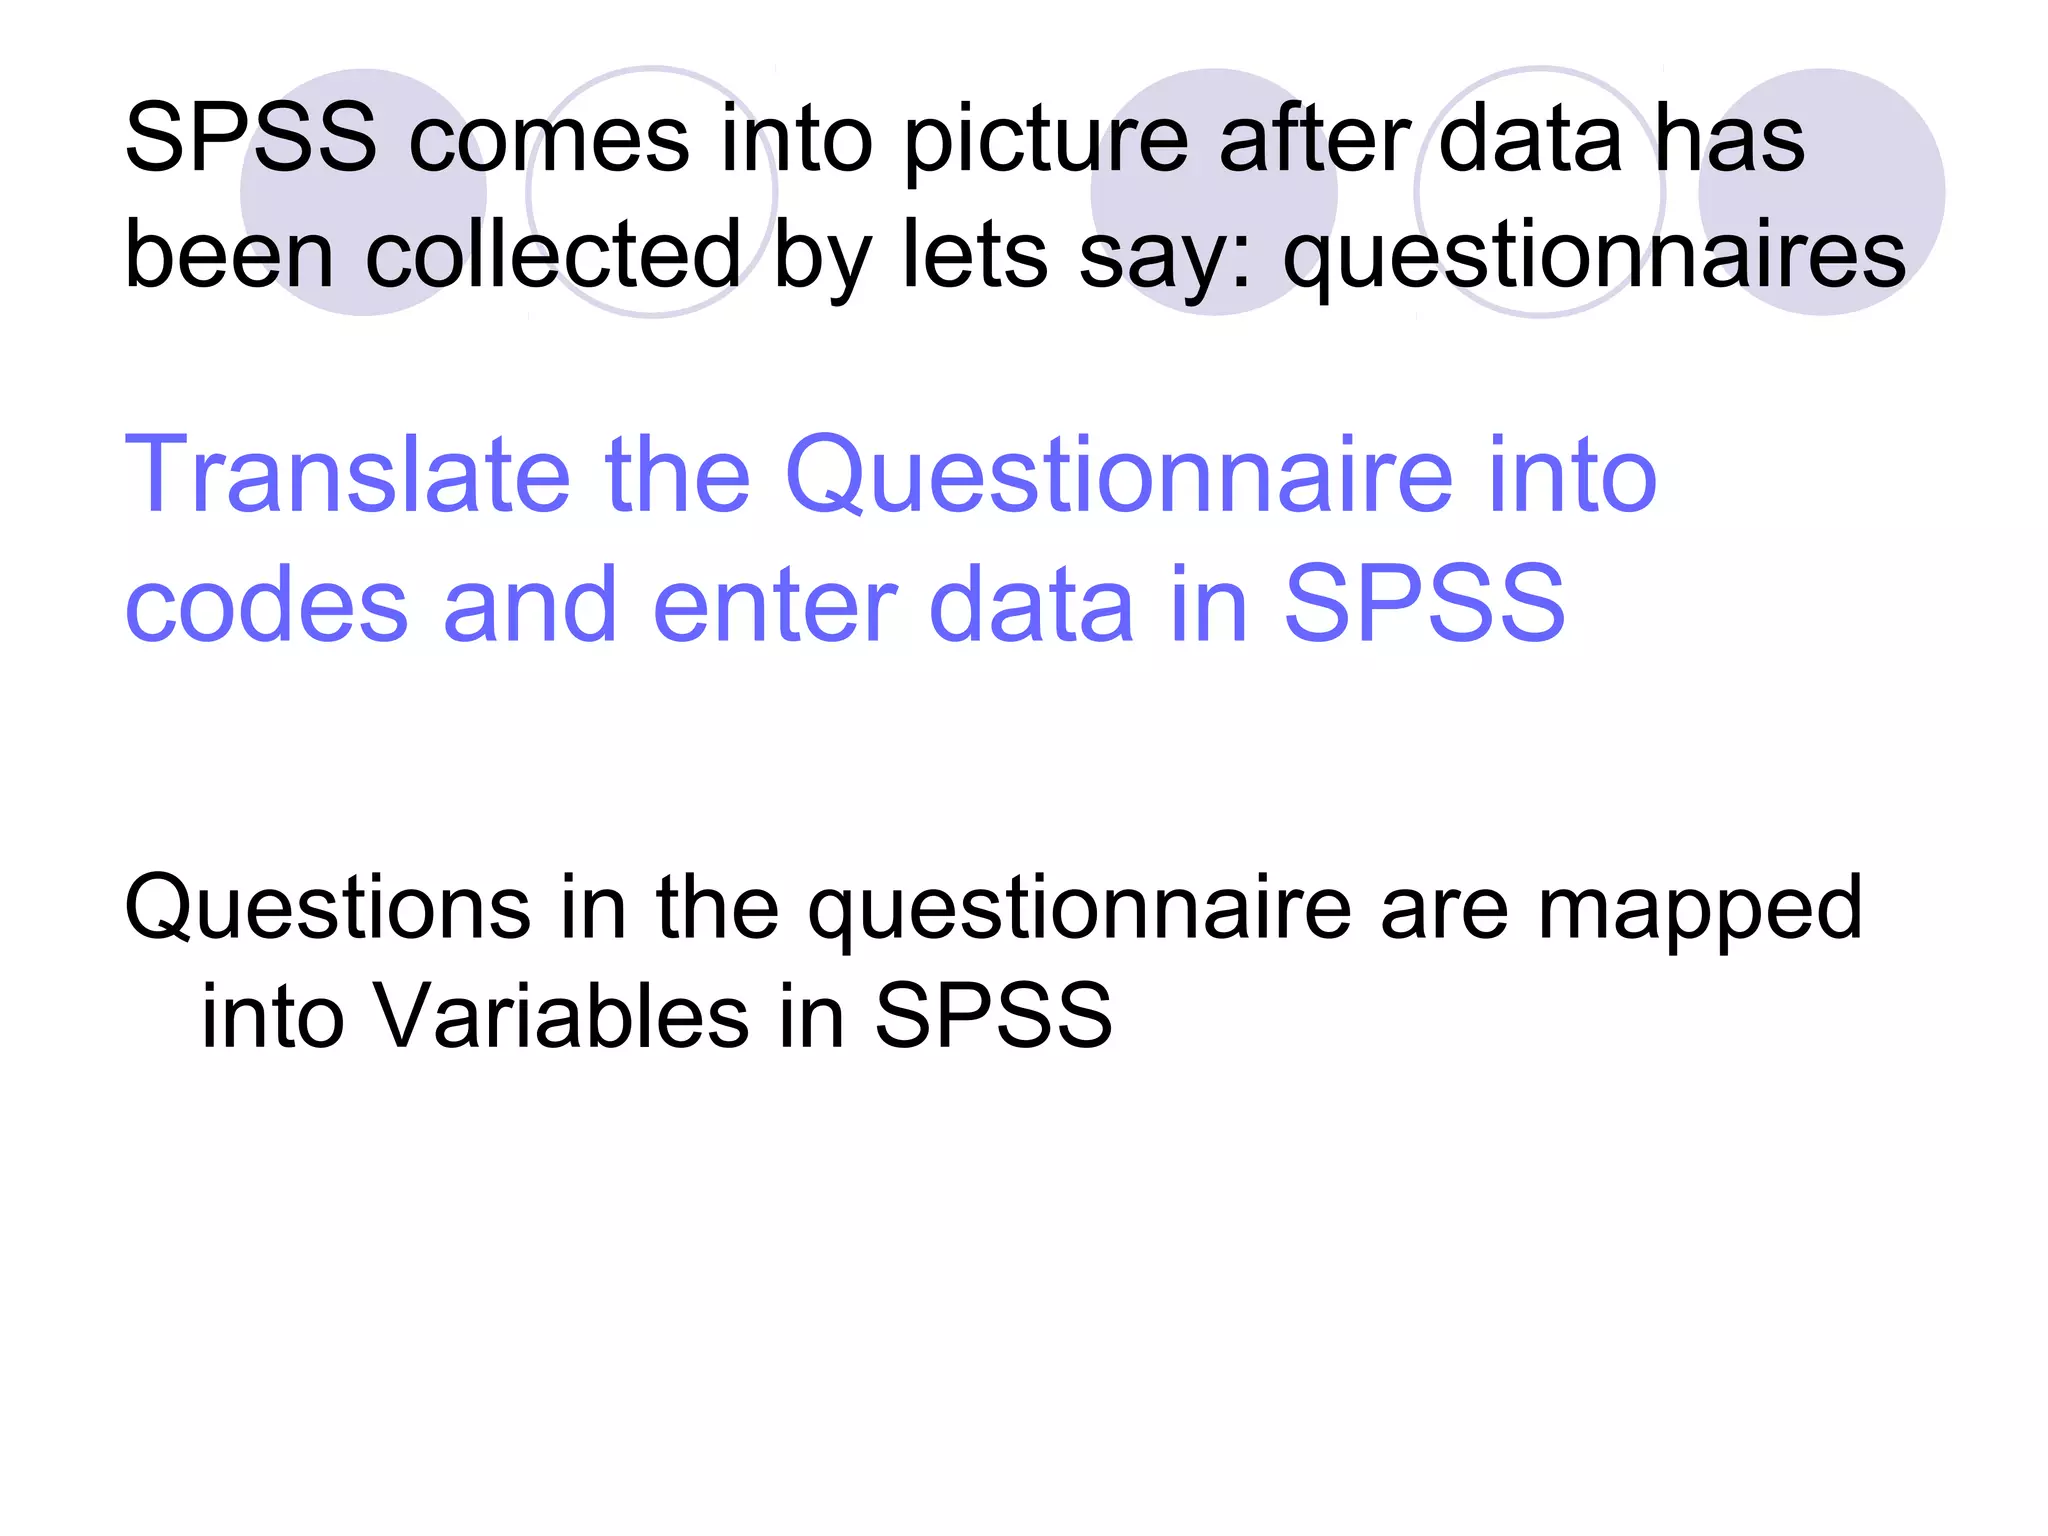
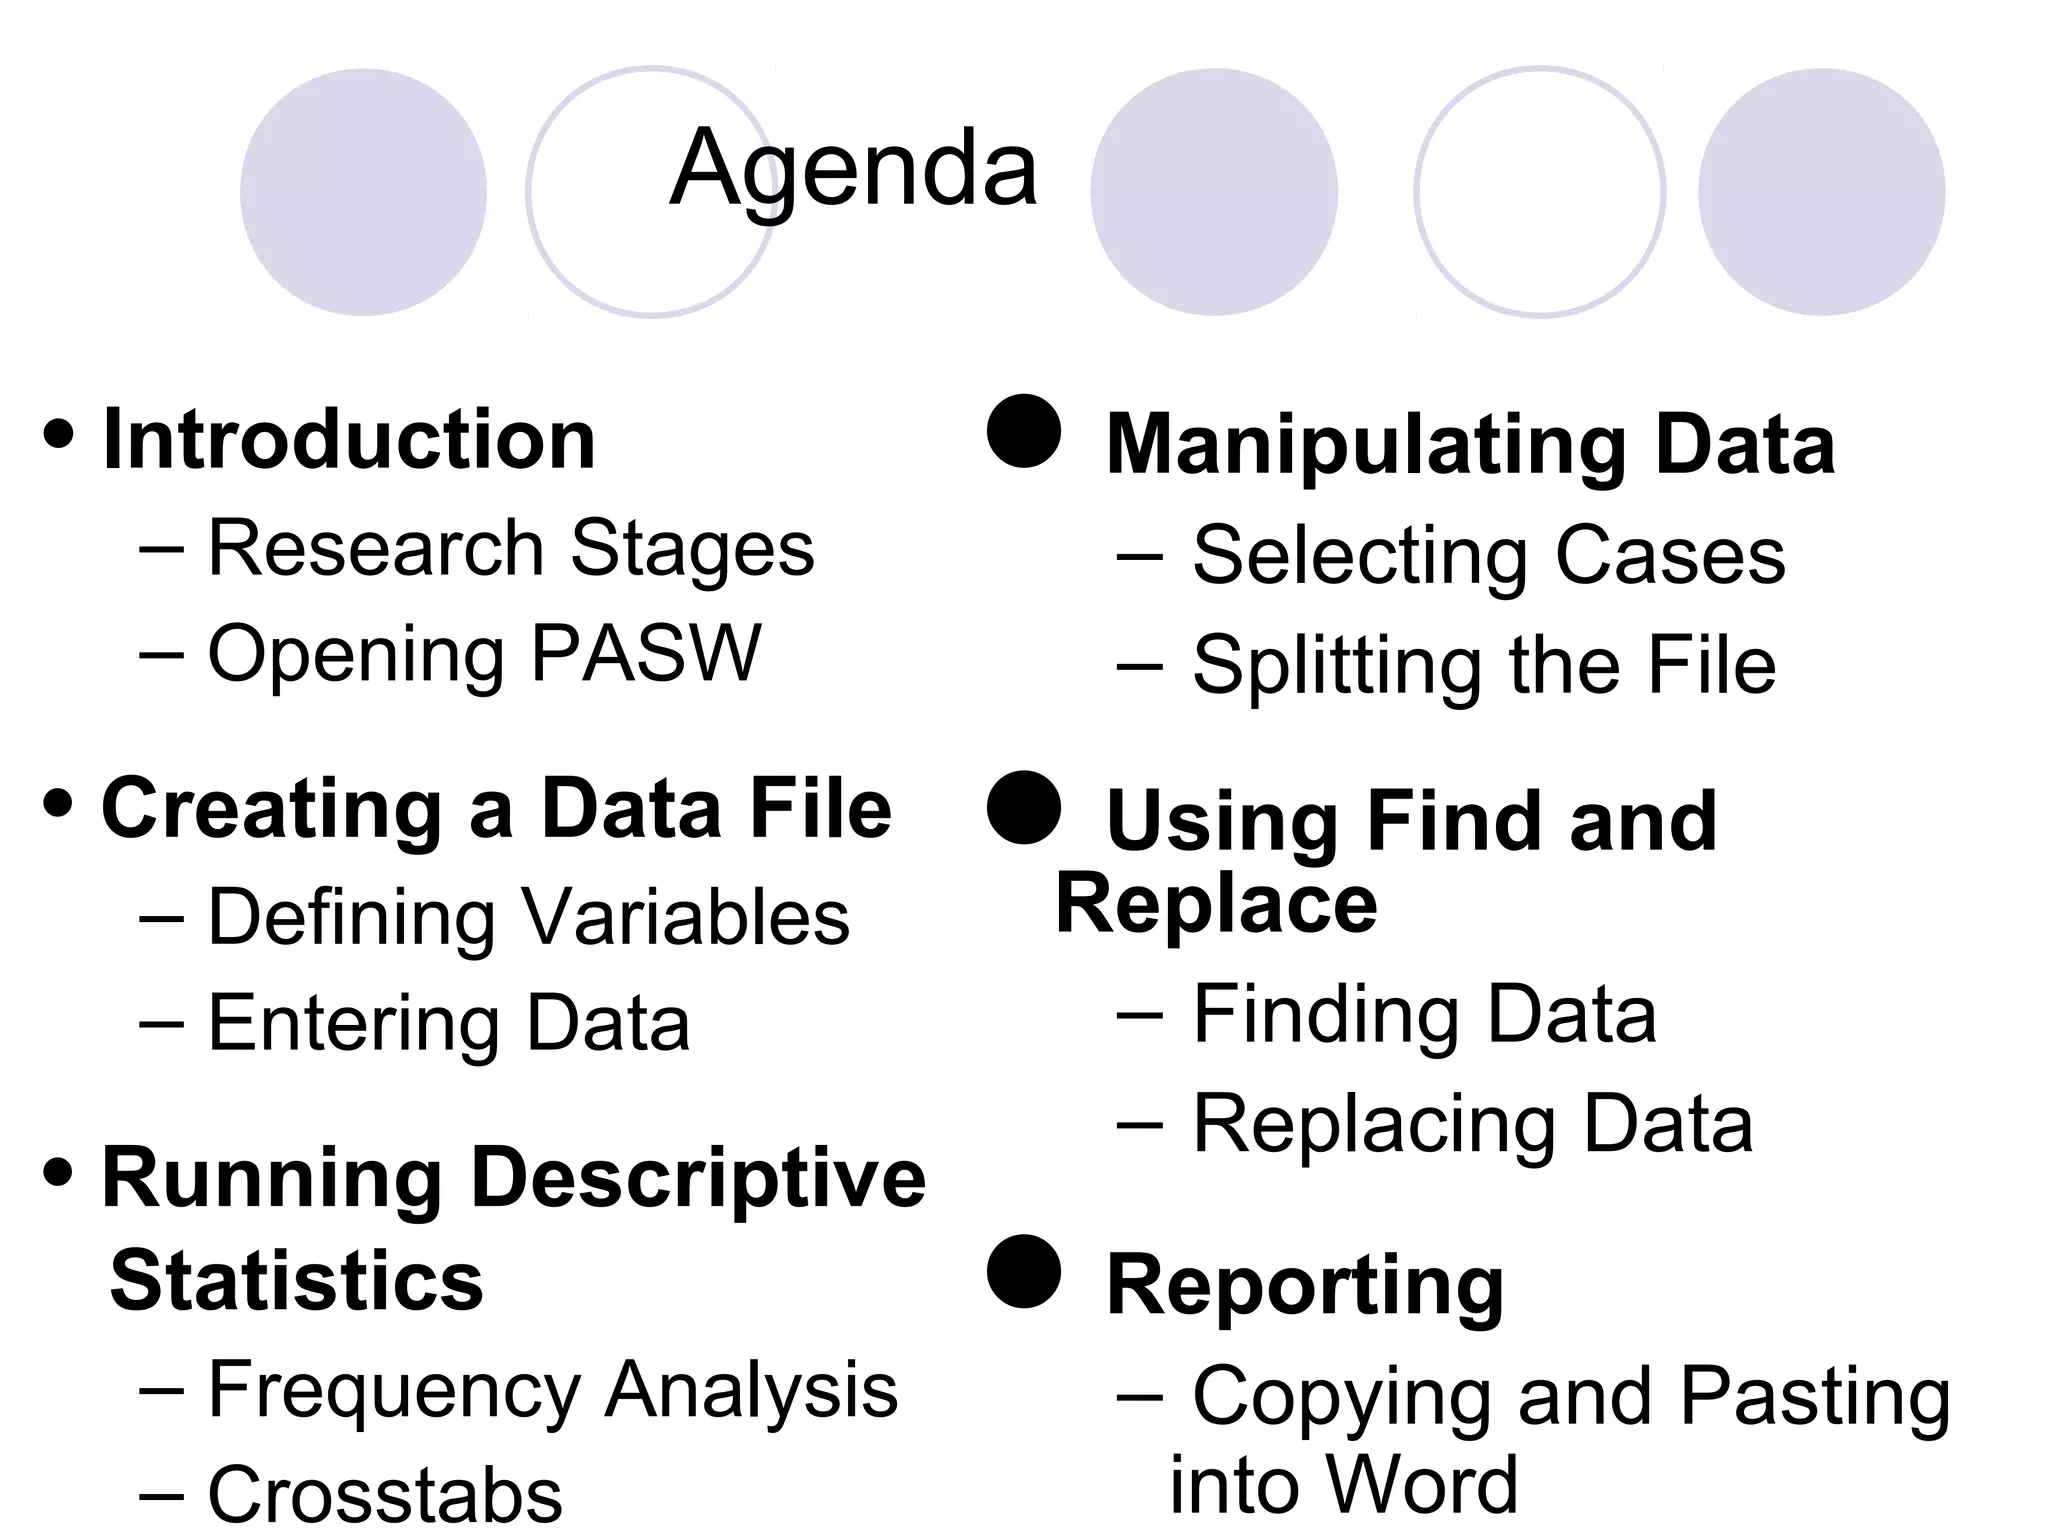
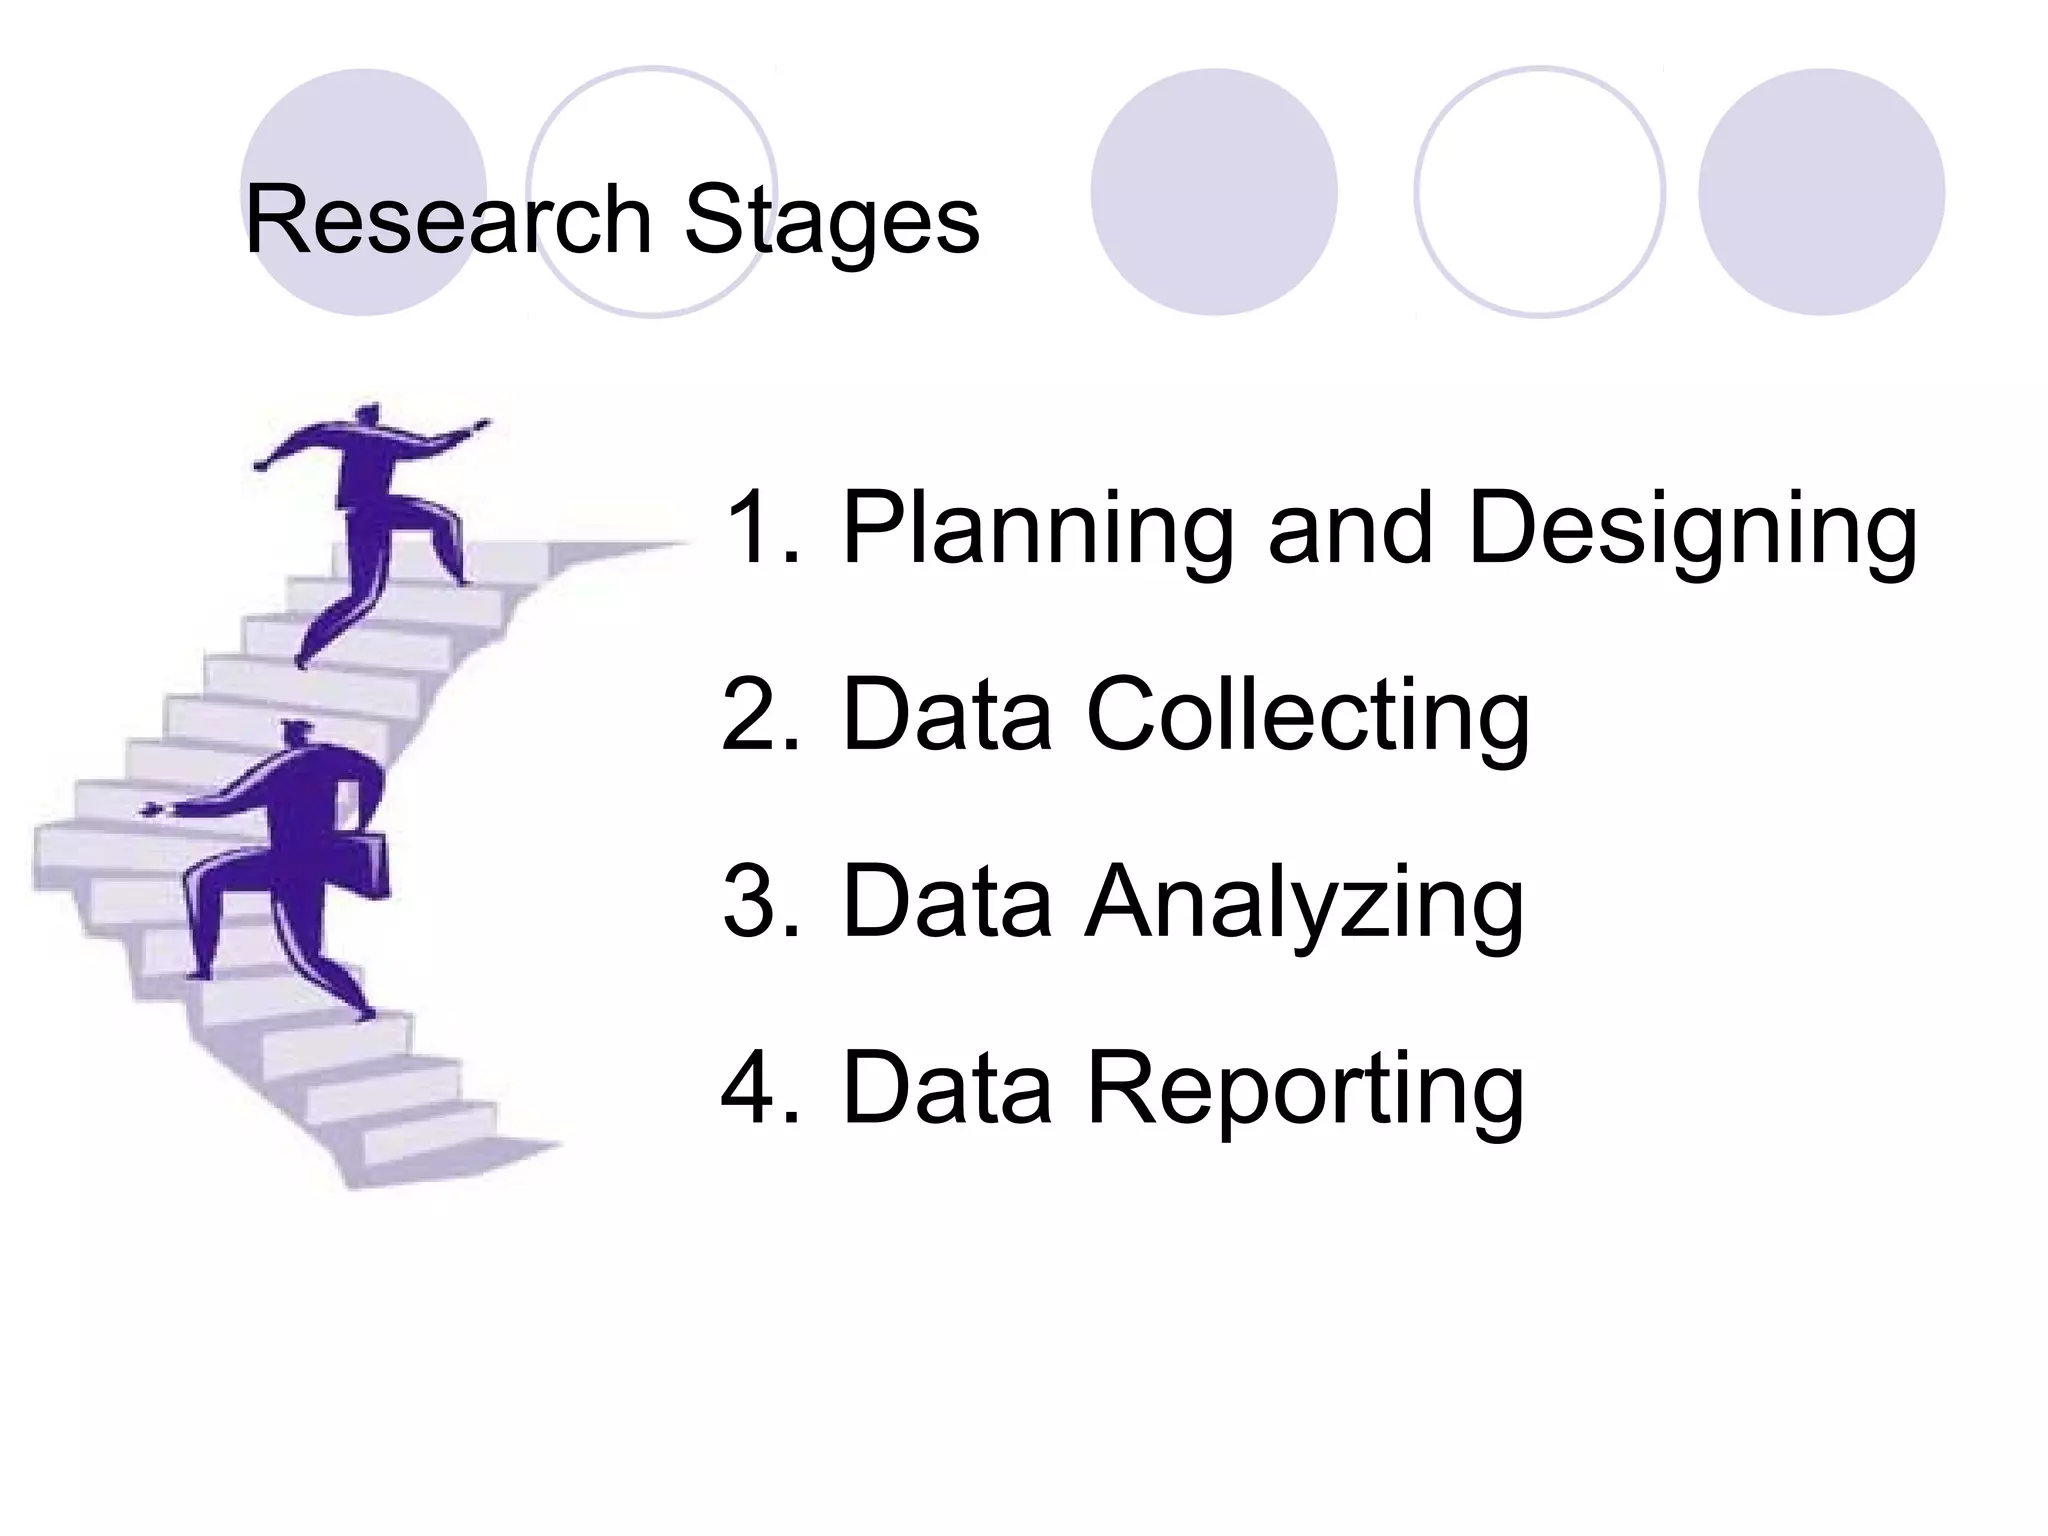
The research process consists of defining the problem, setting objectives, data collection methods, and data entry into SPSS.
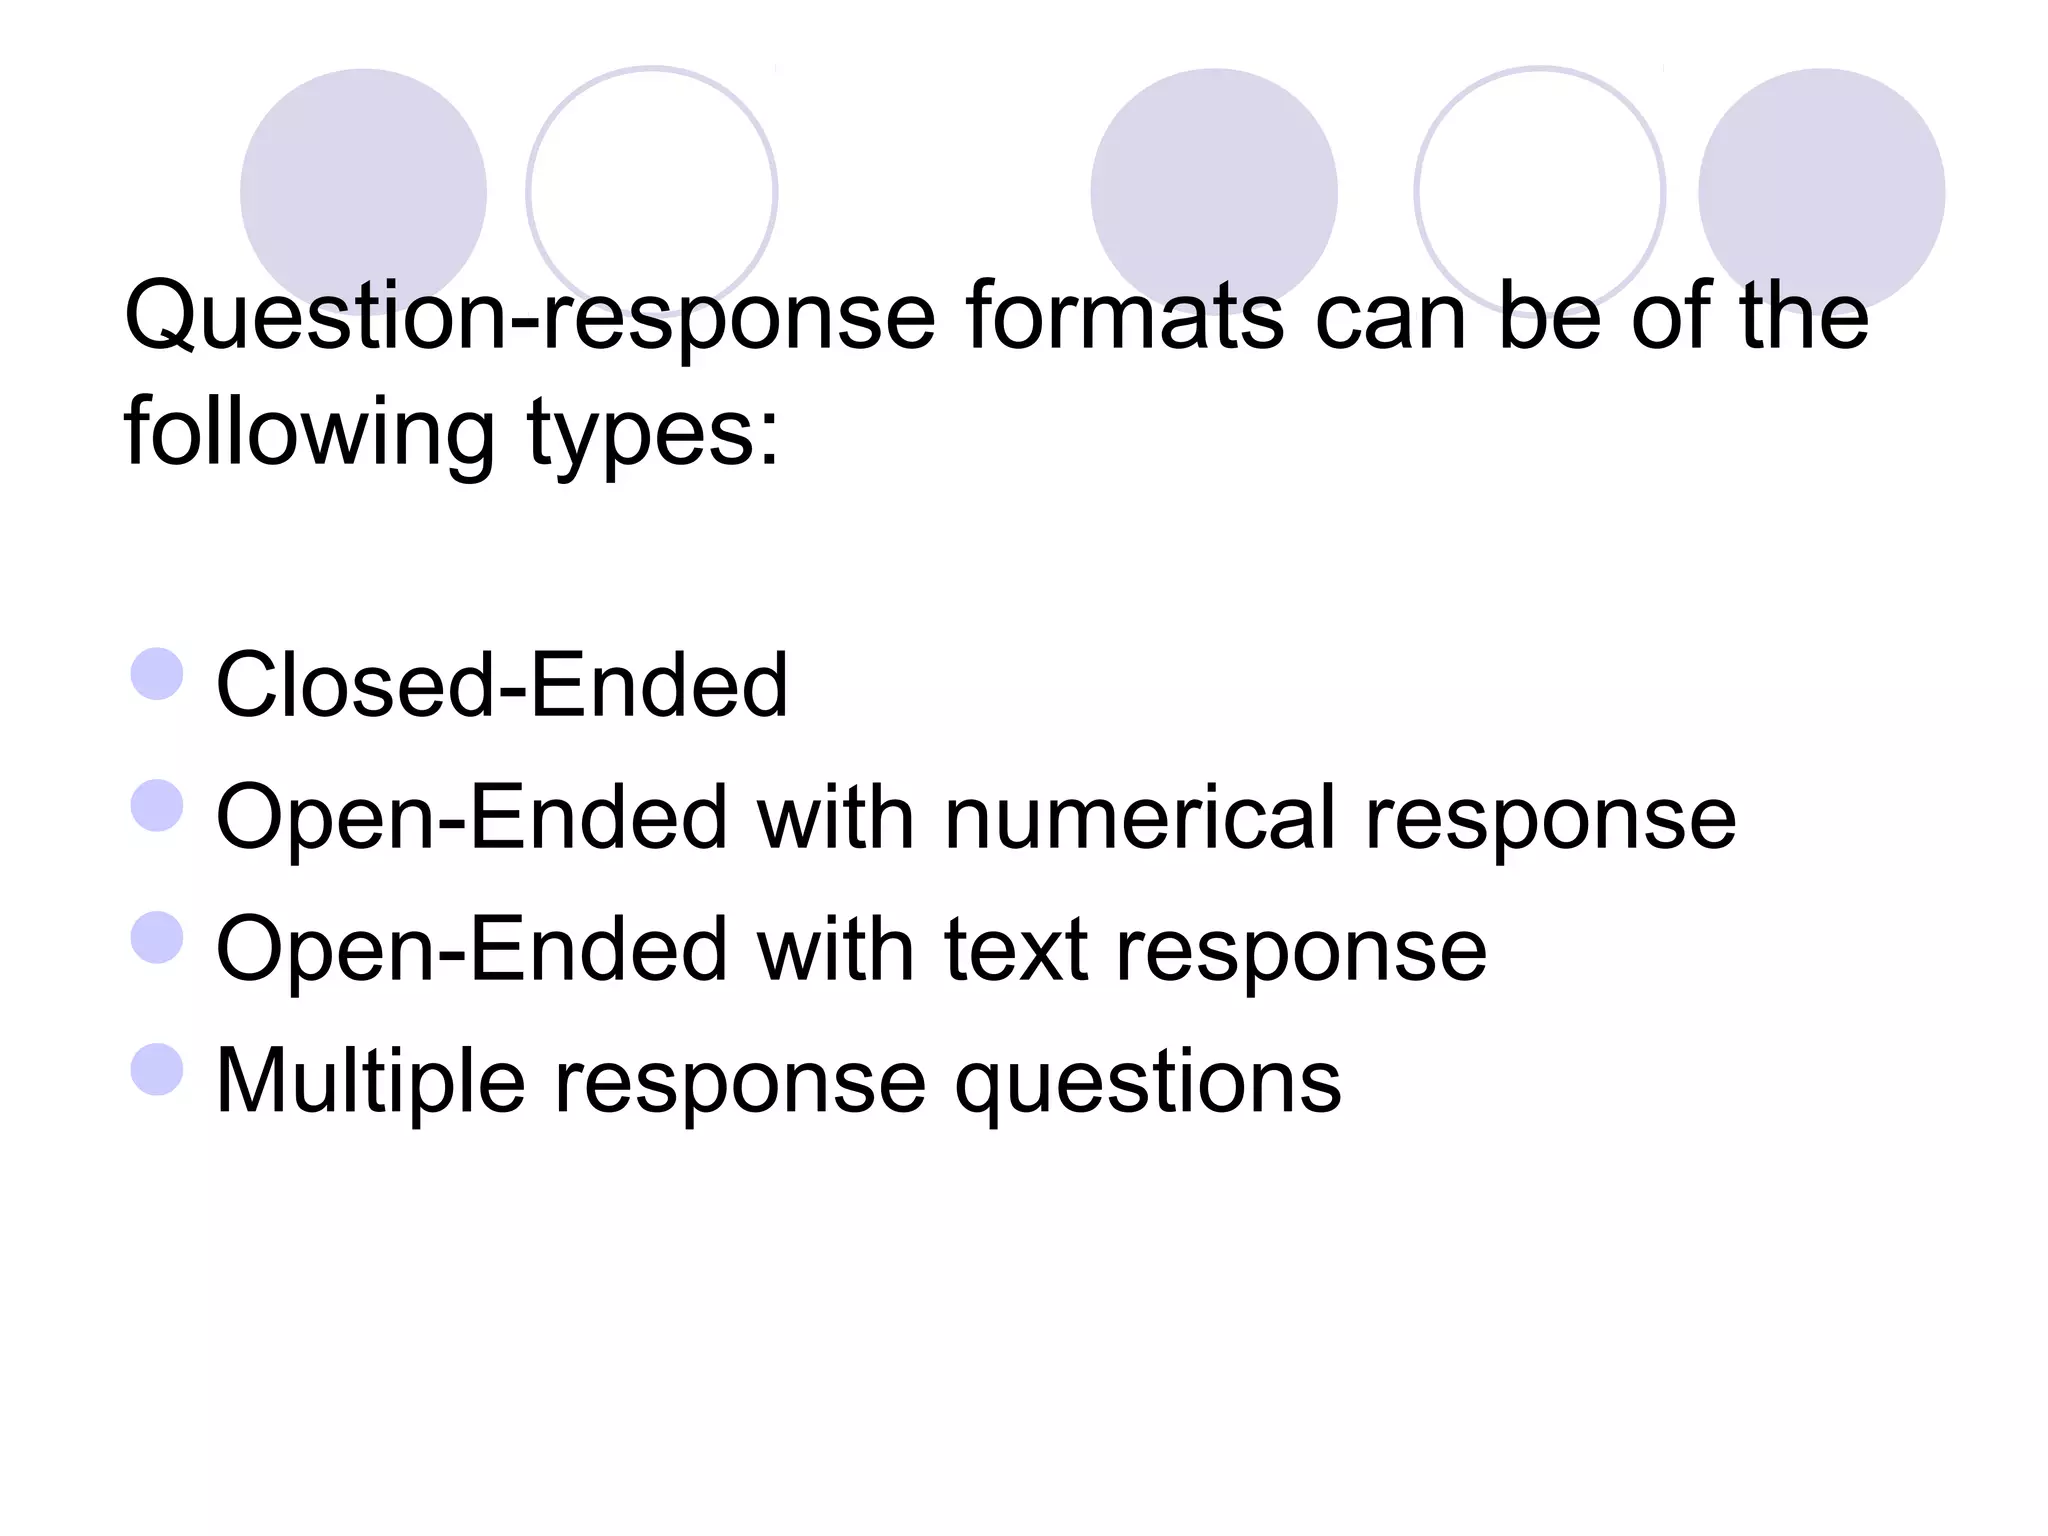
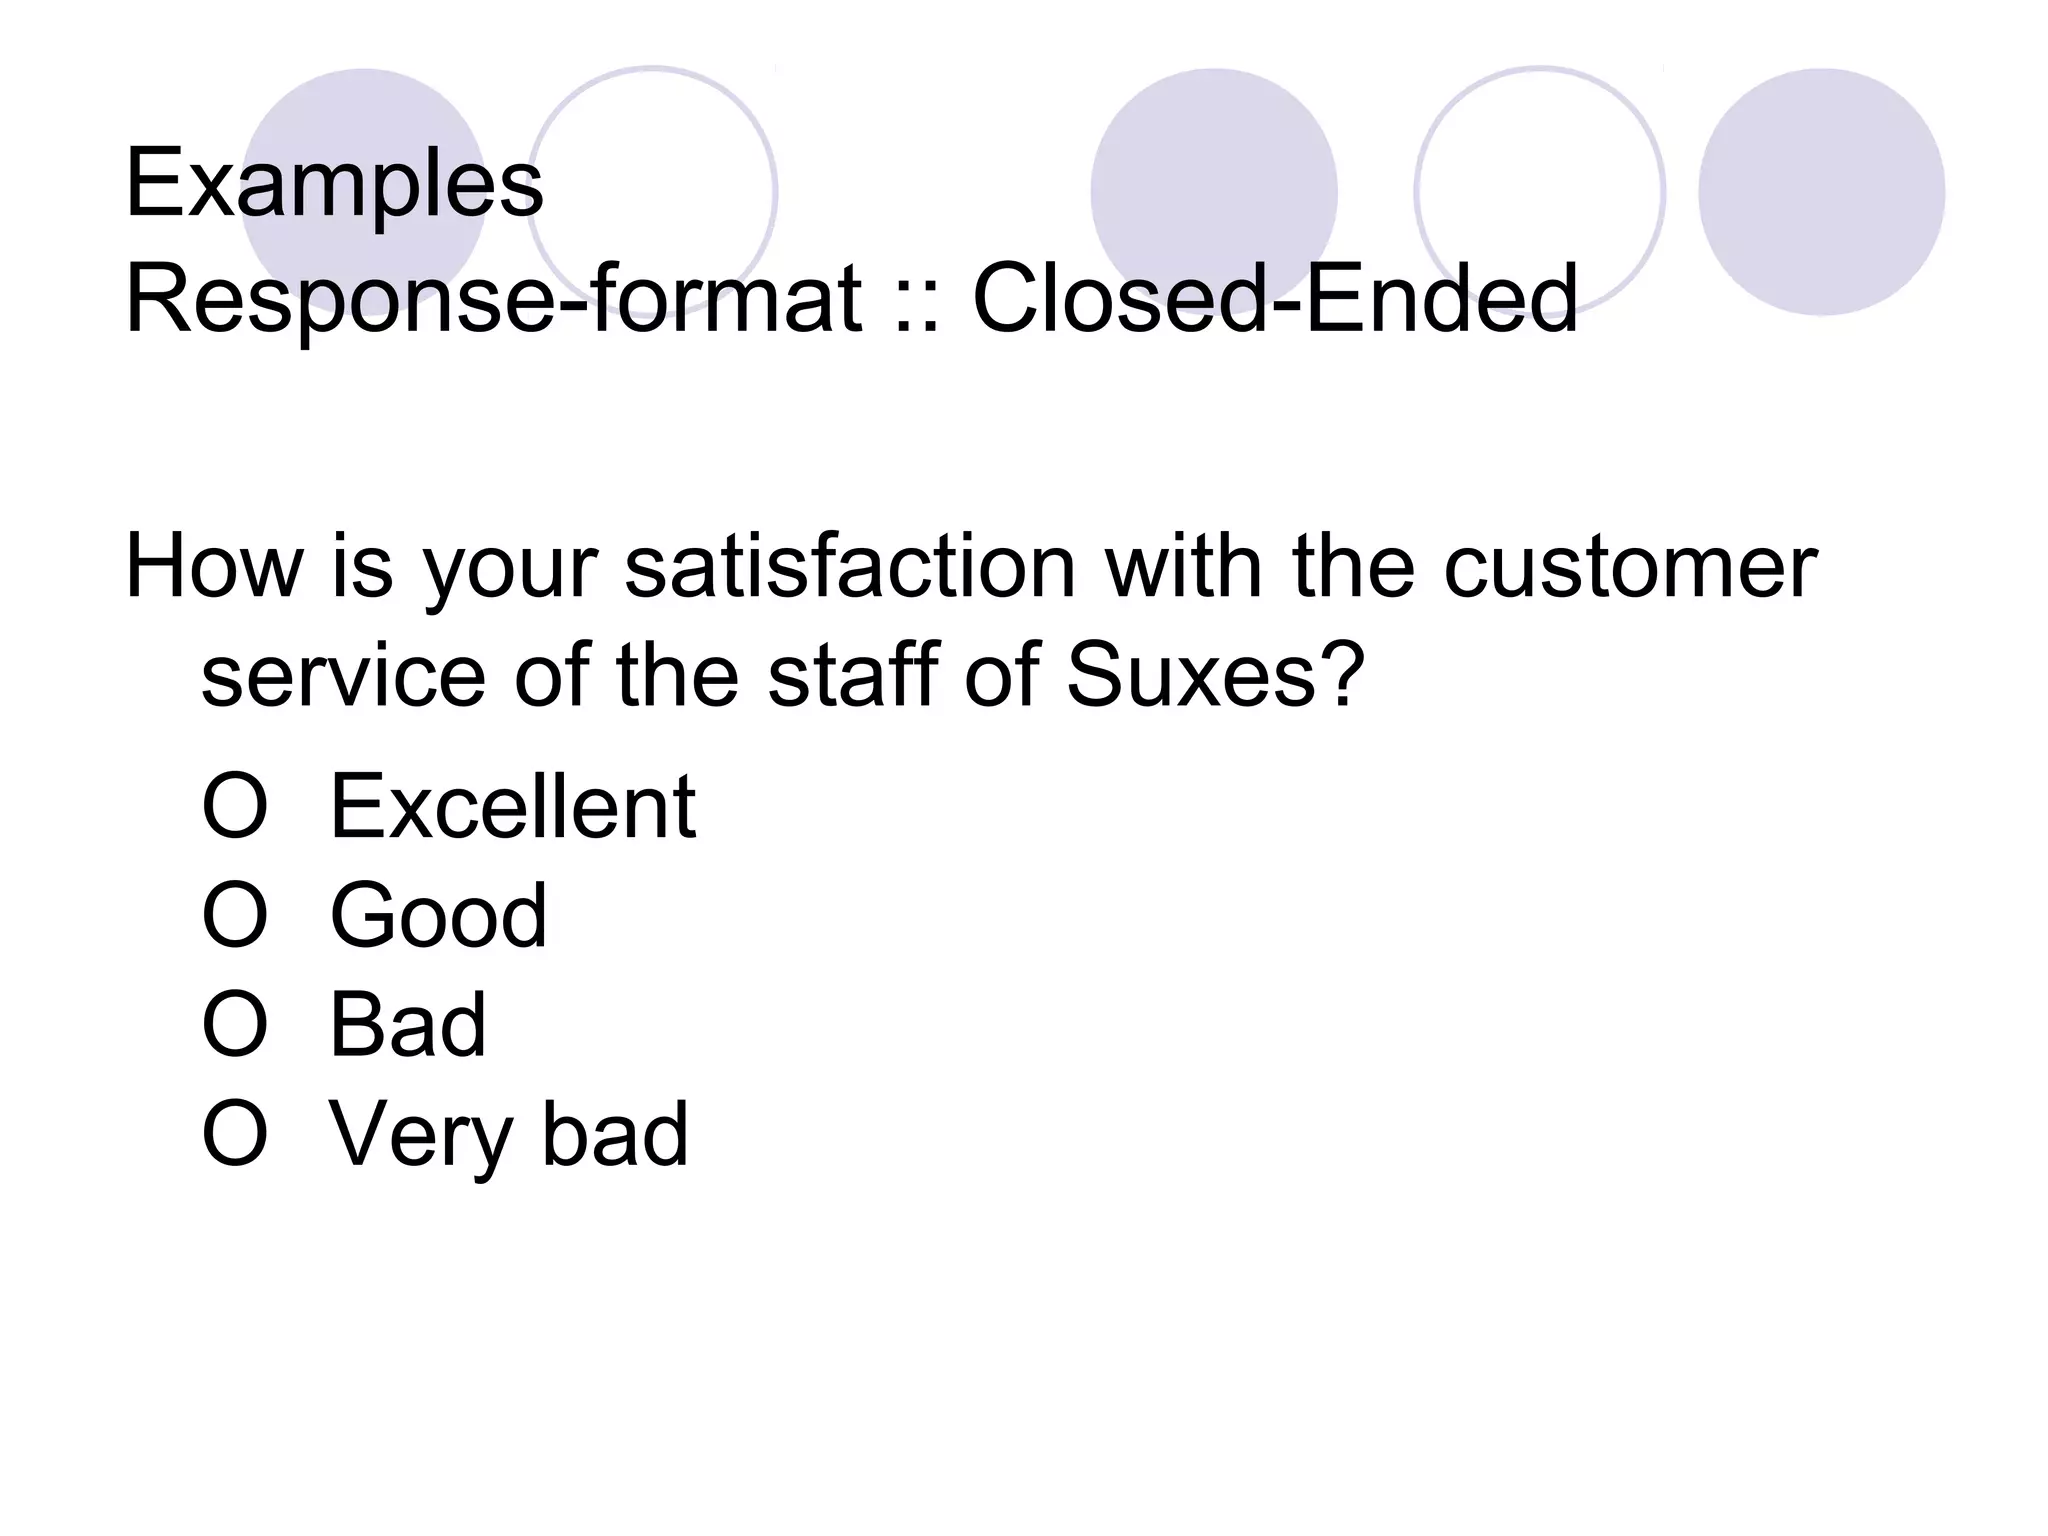
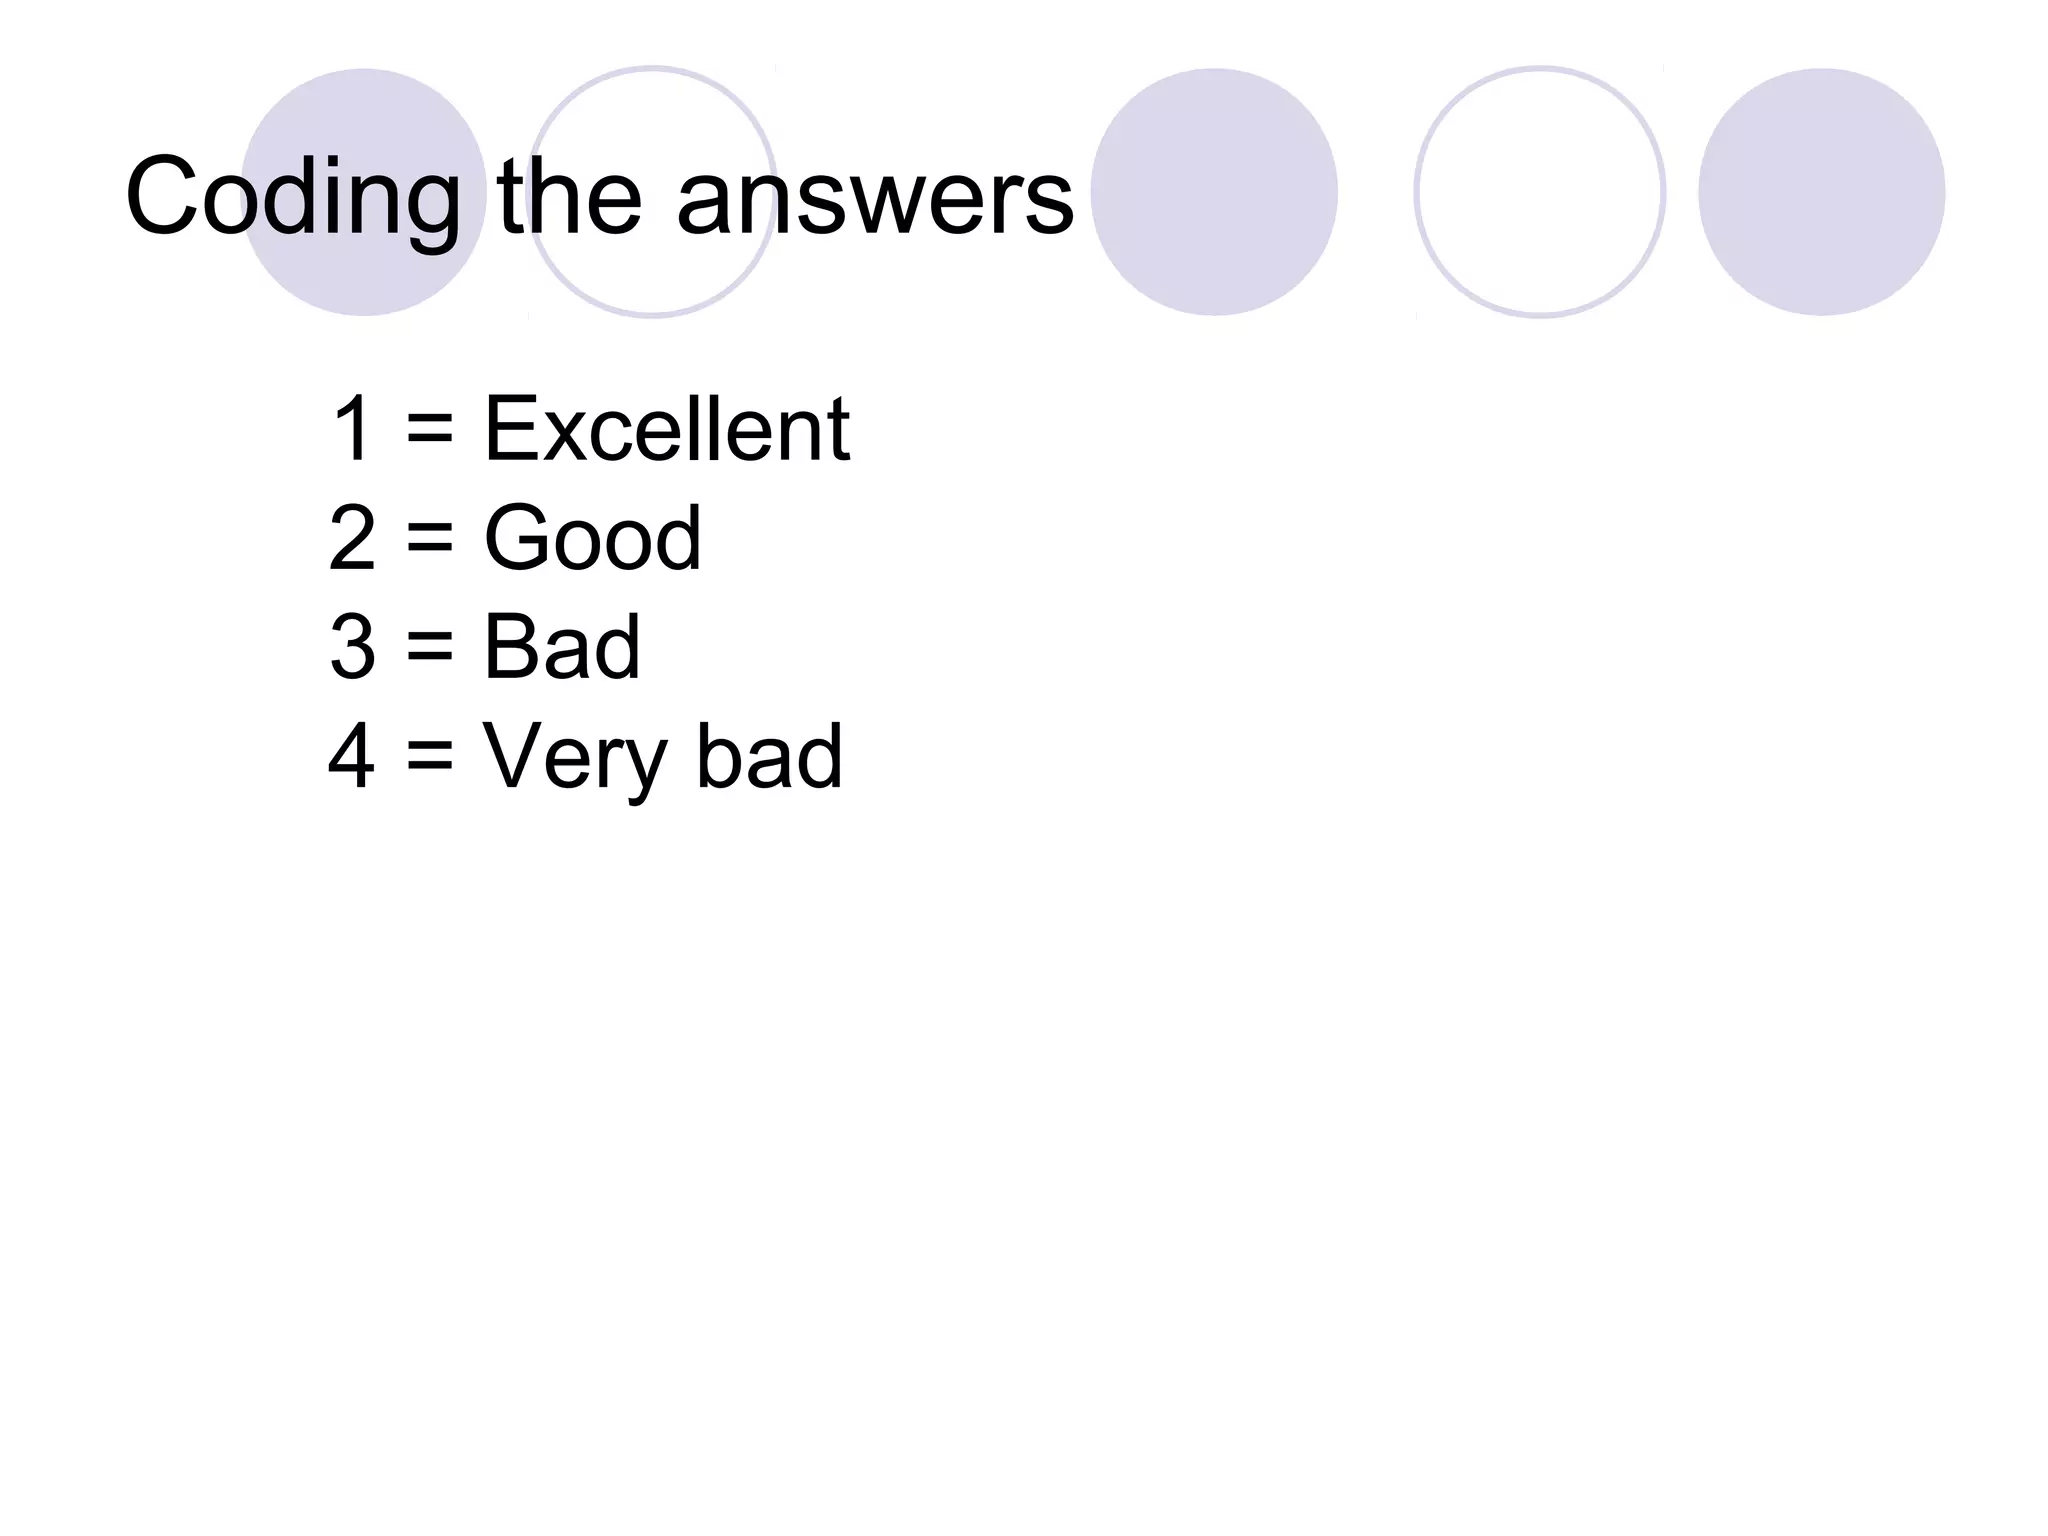
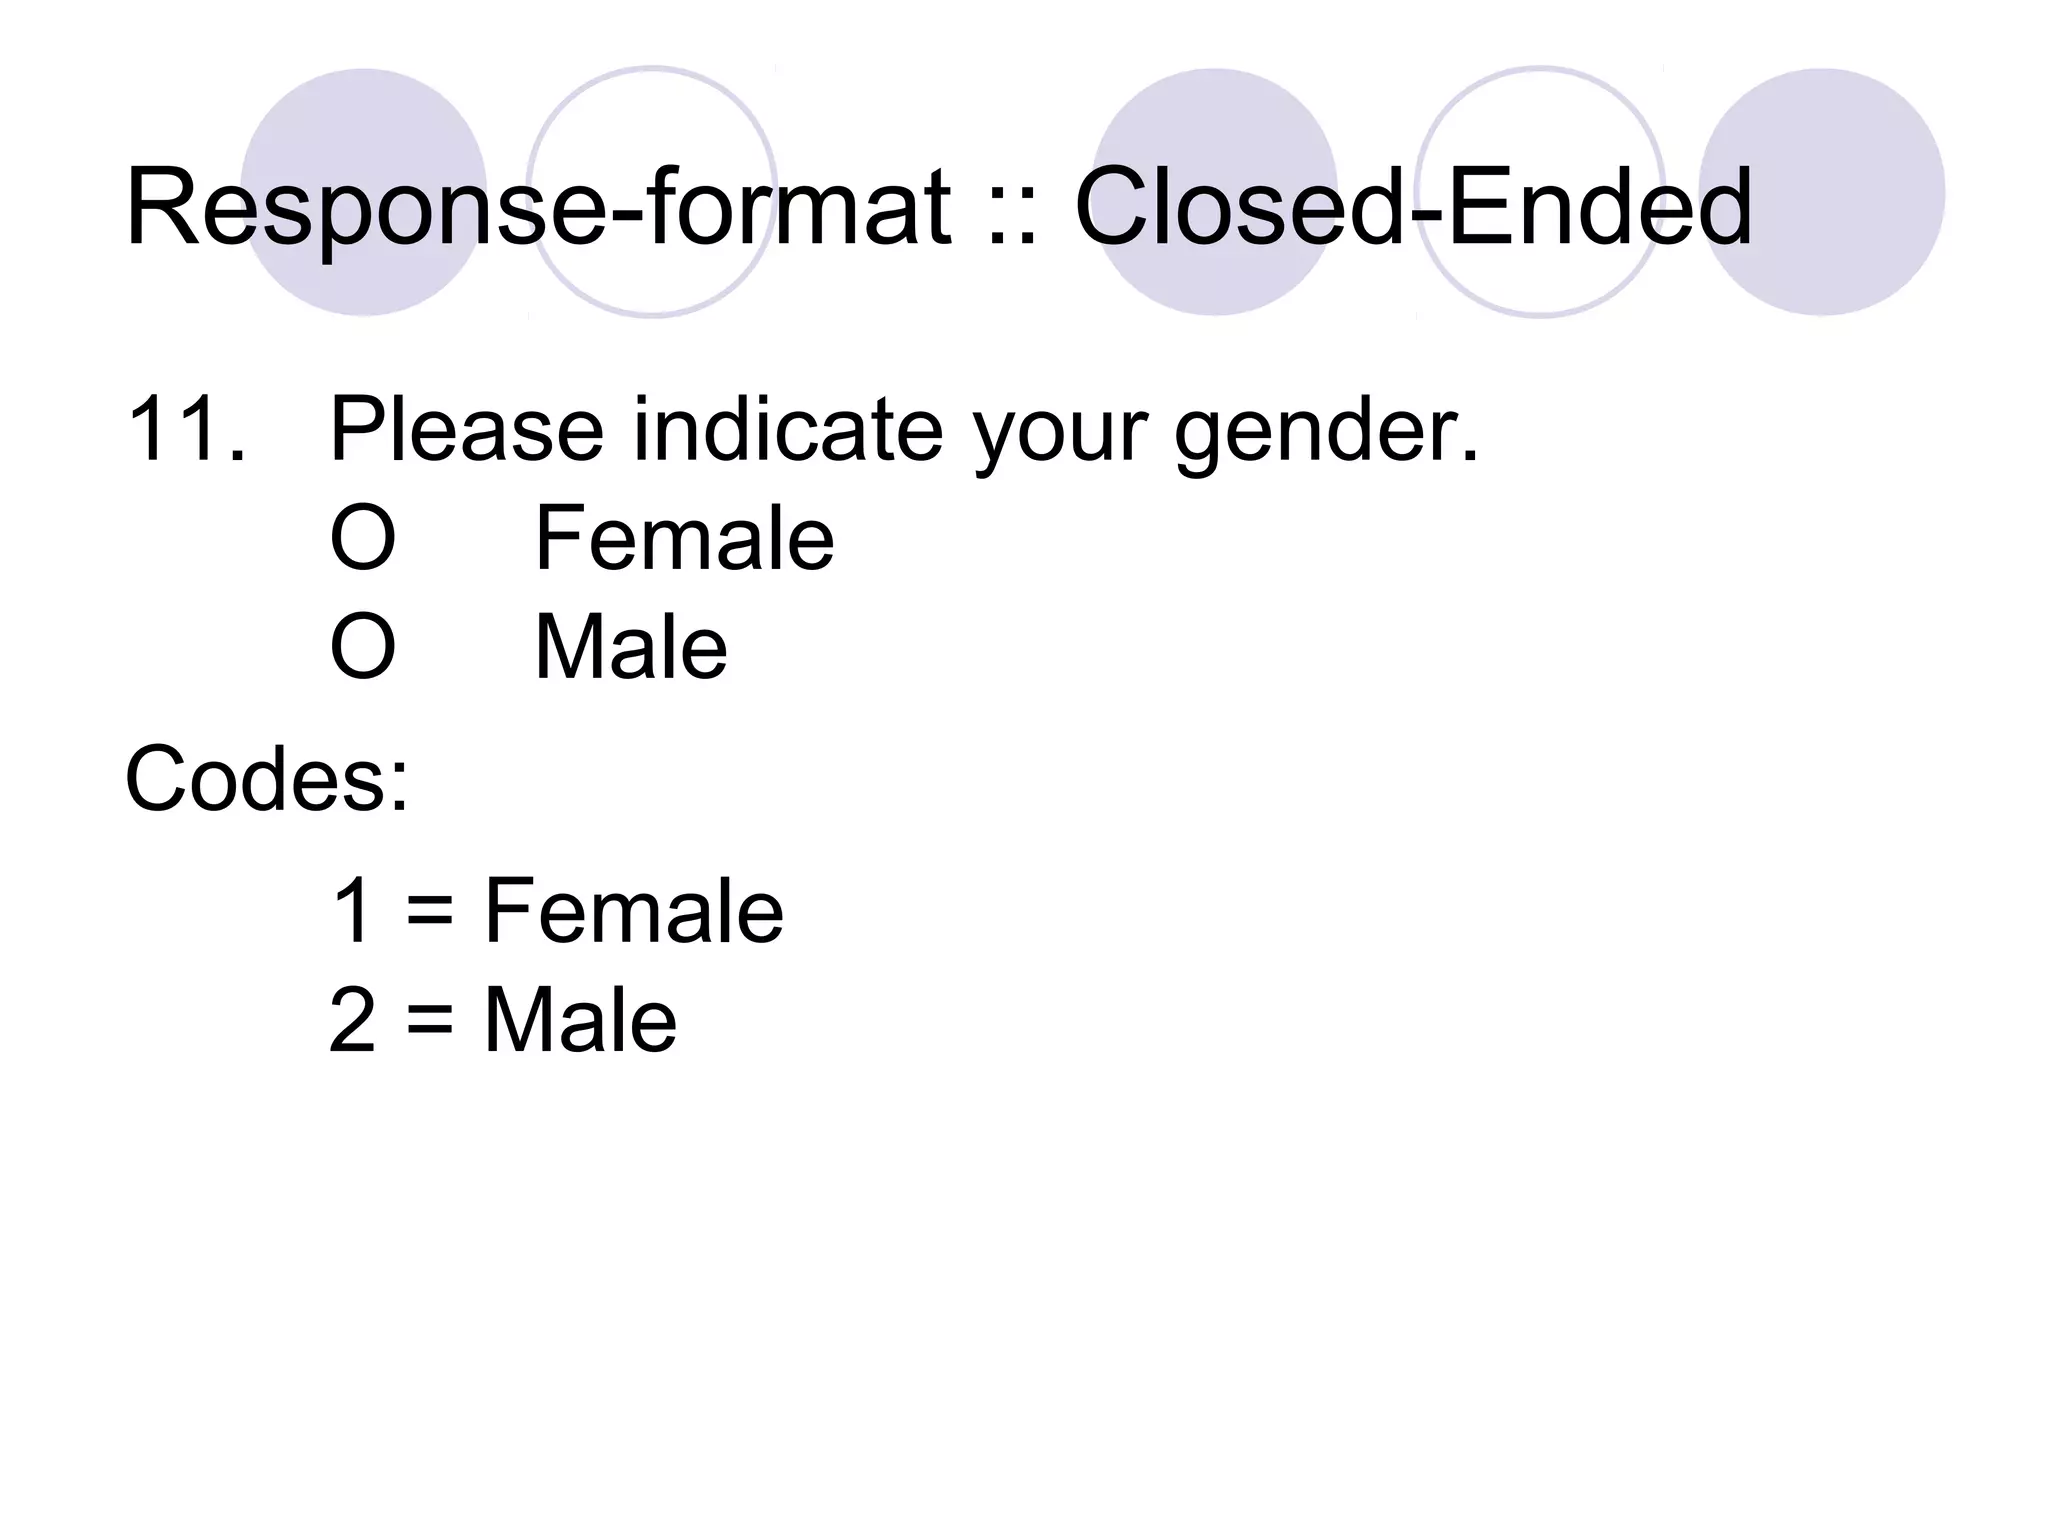
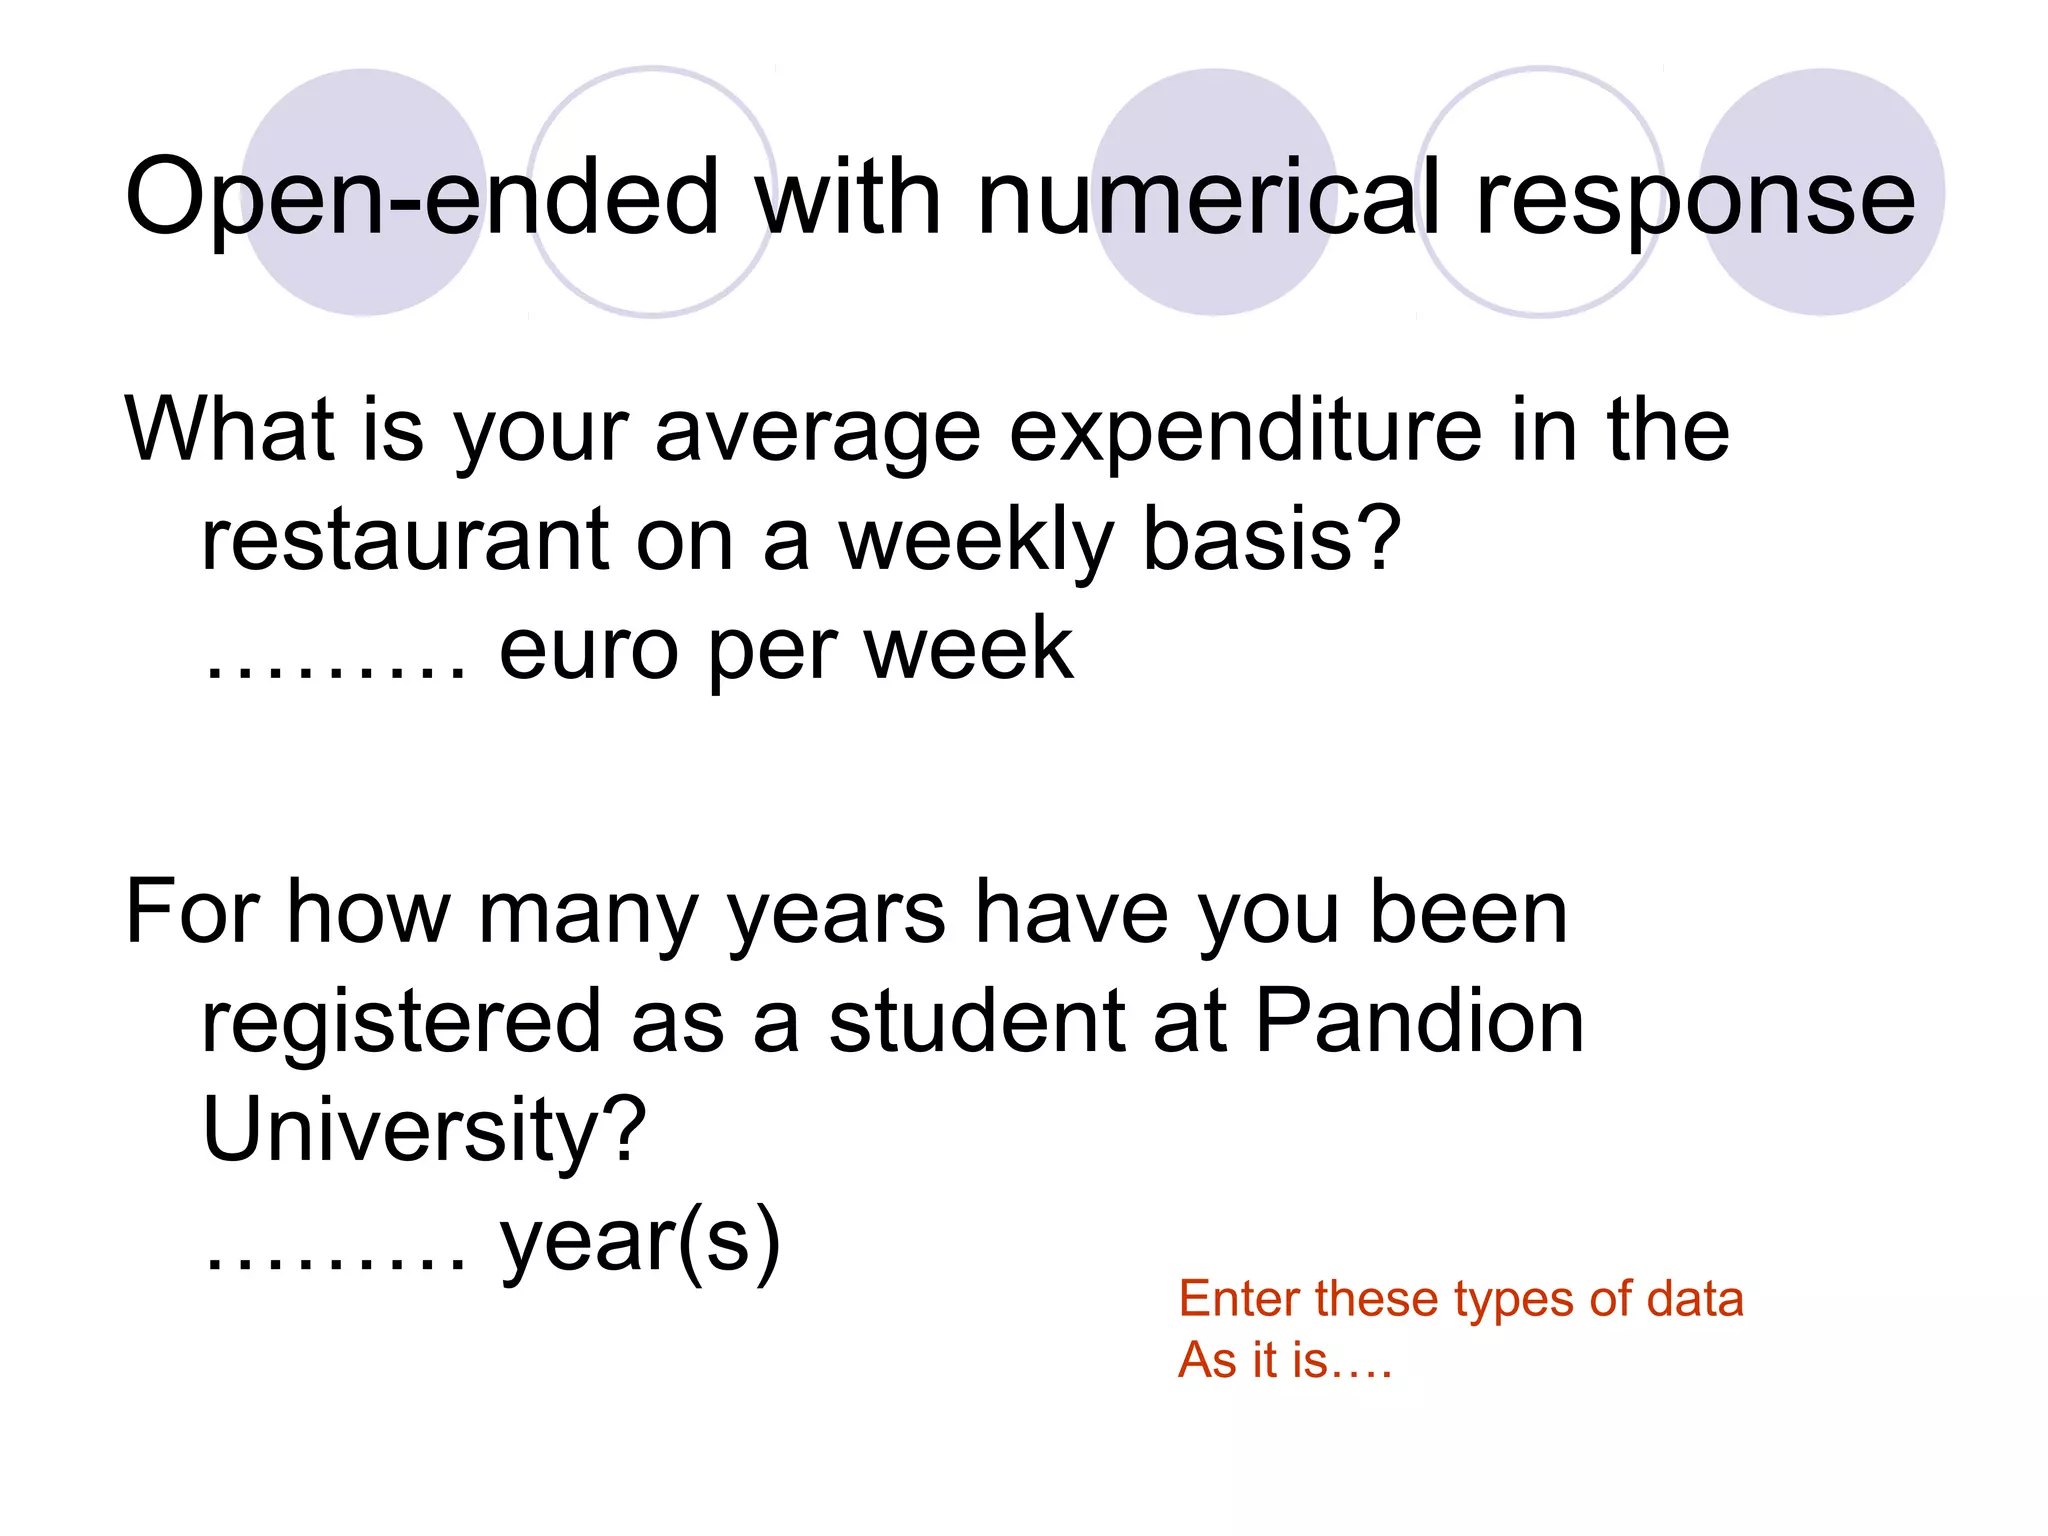
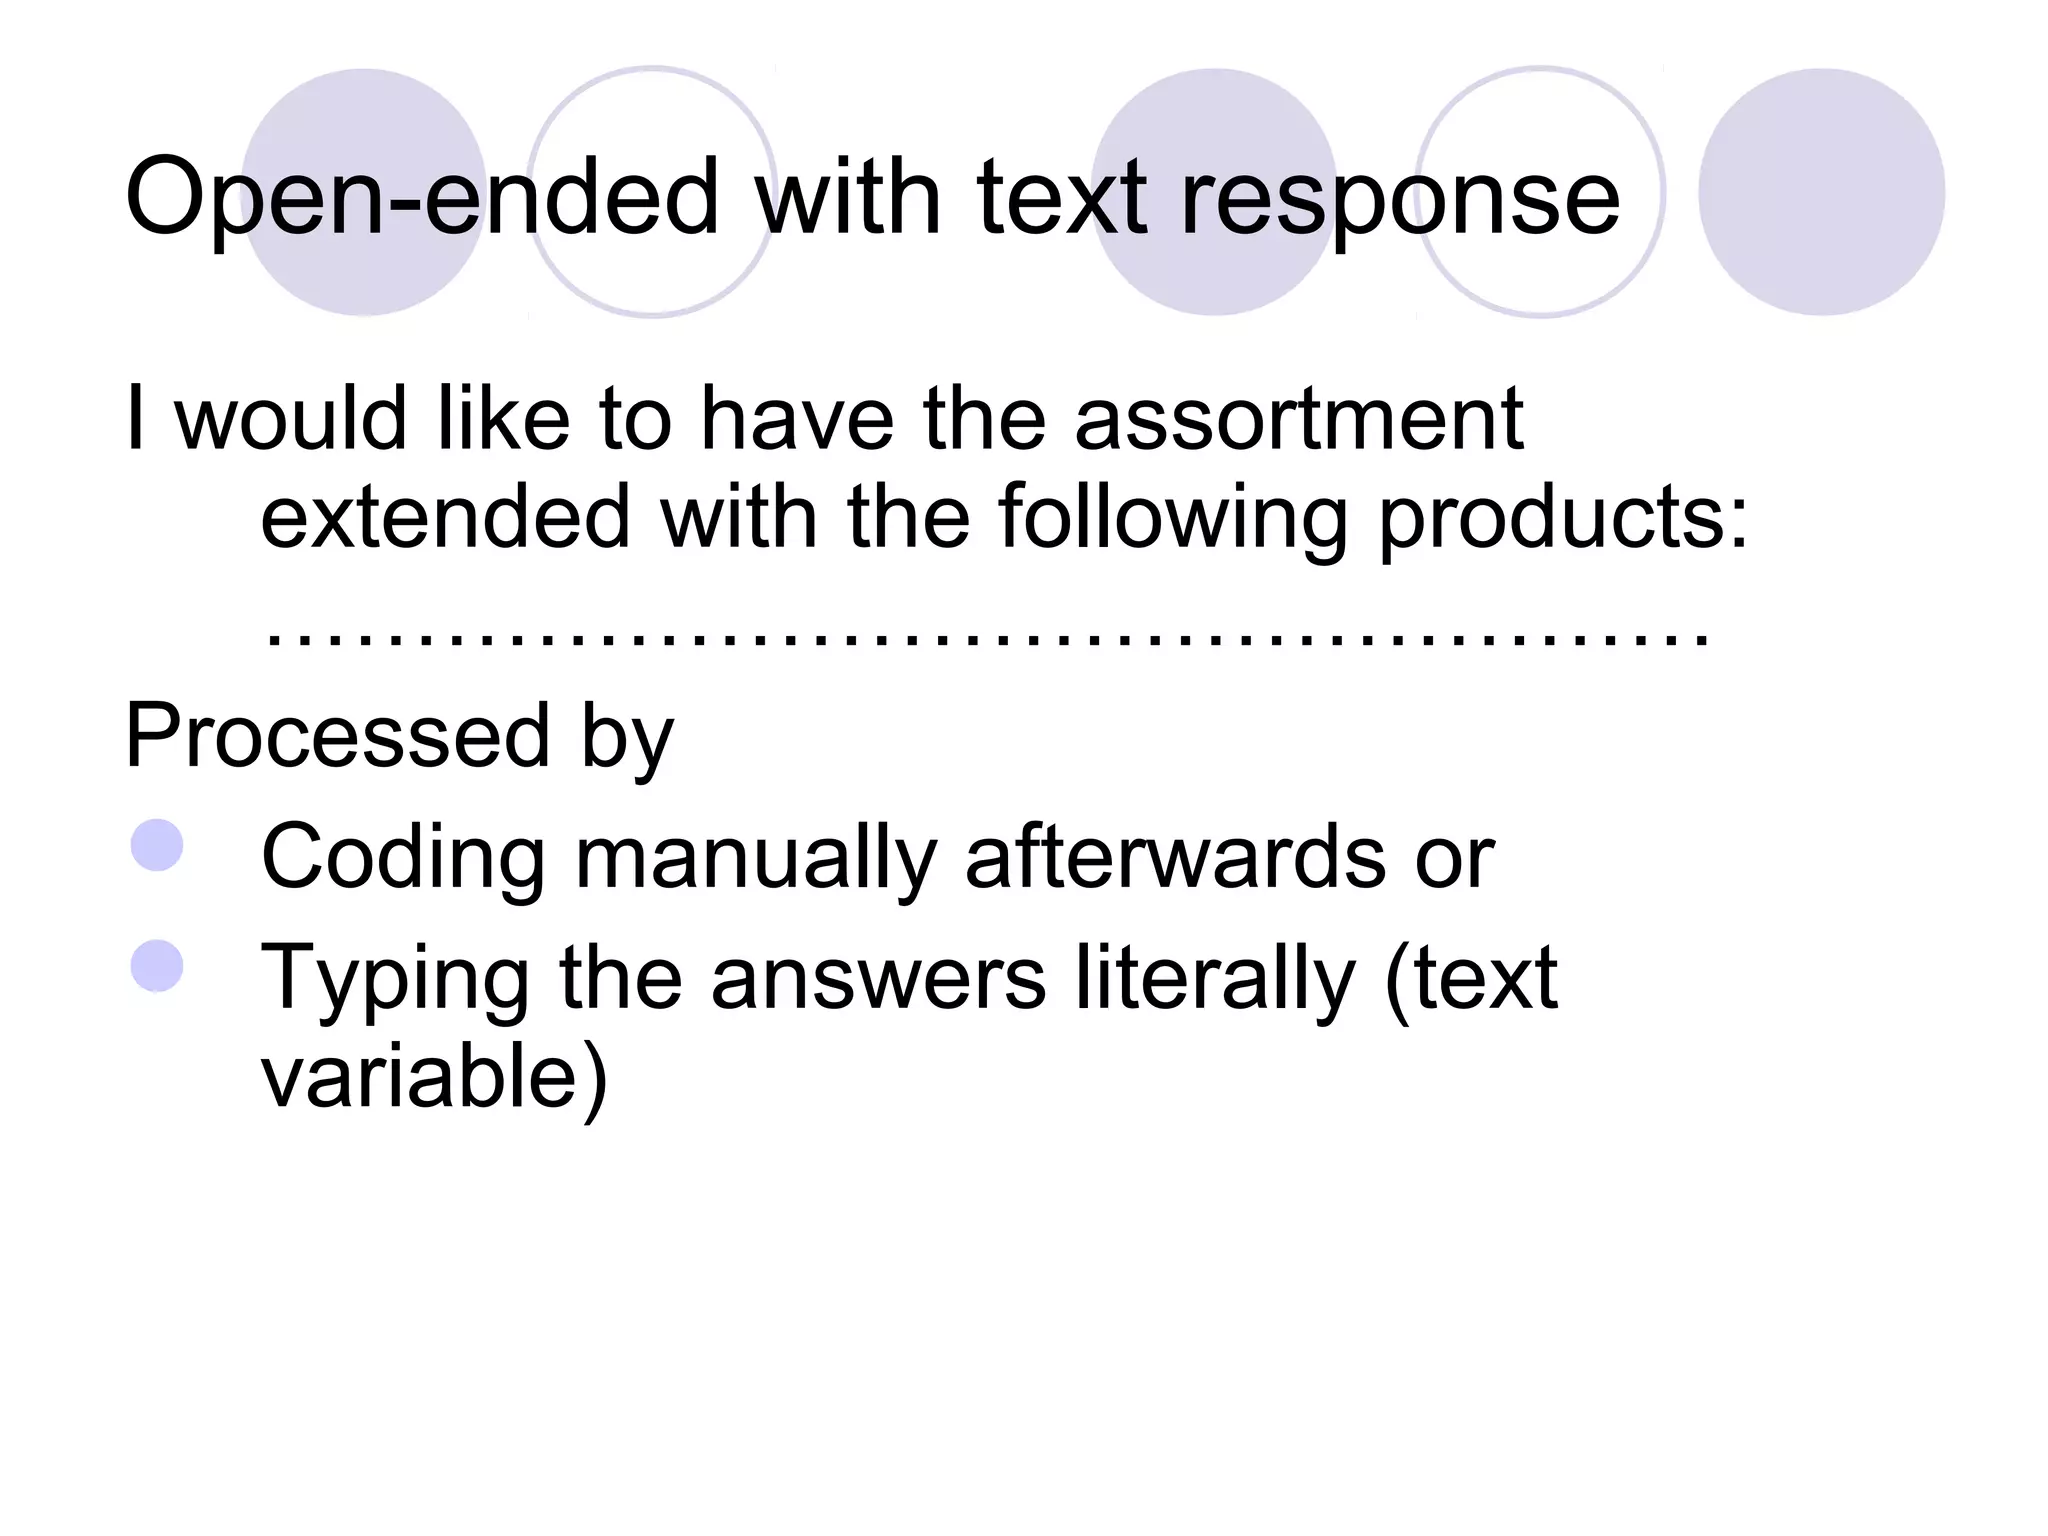
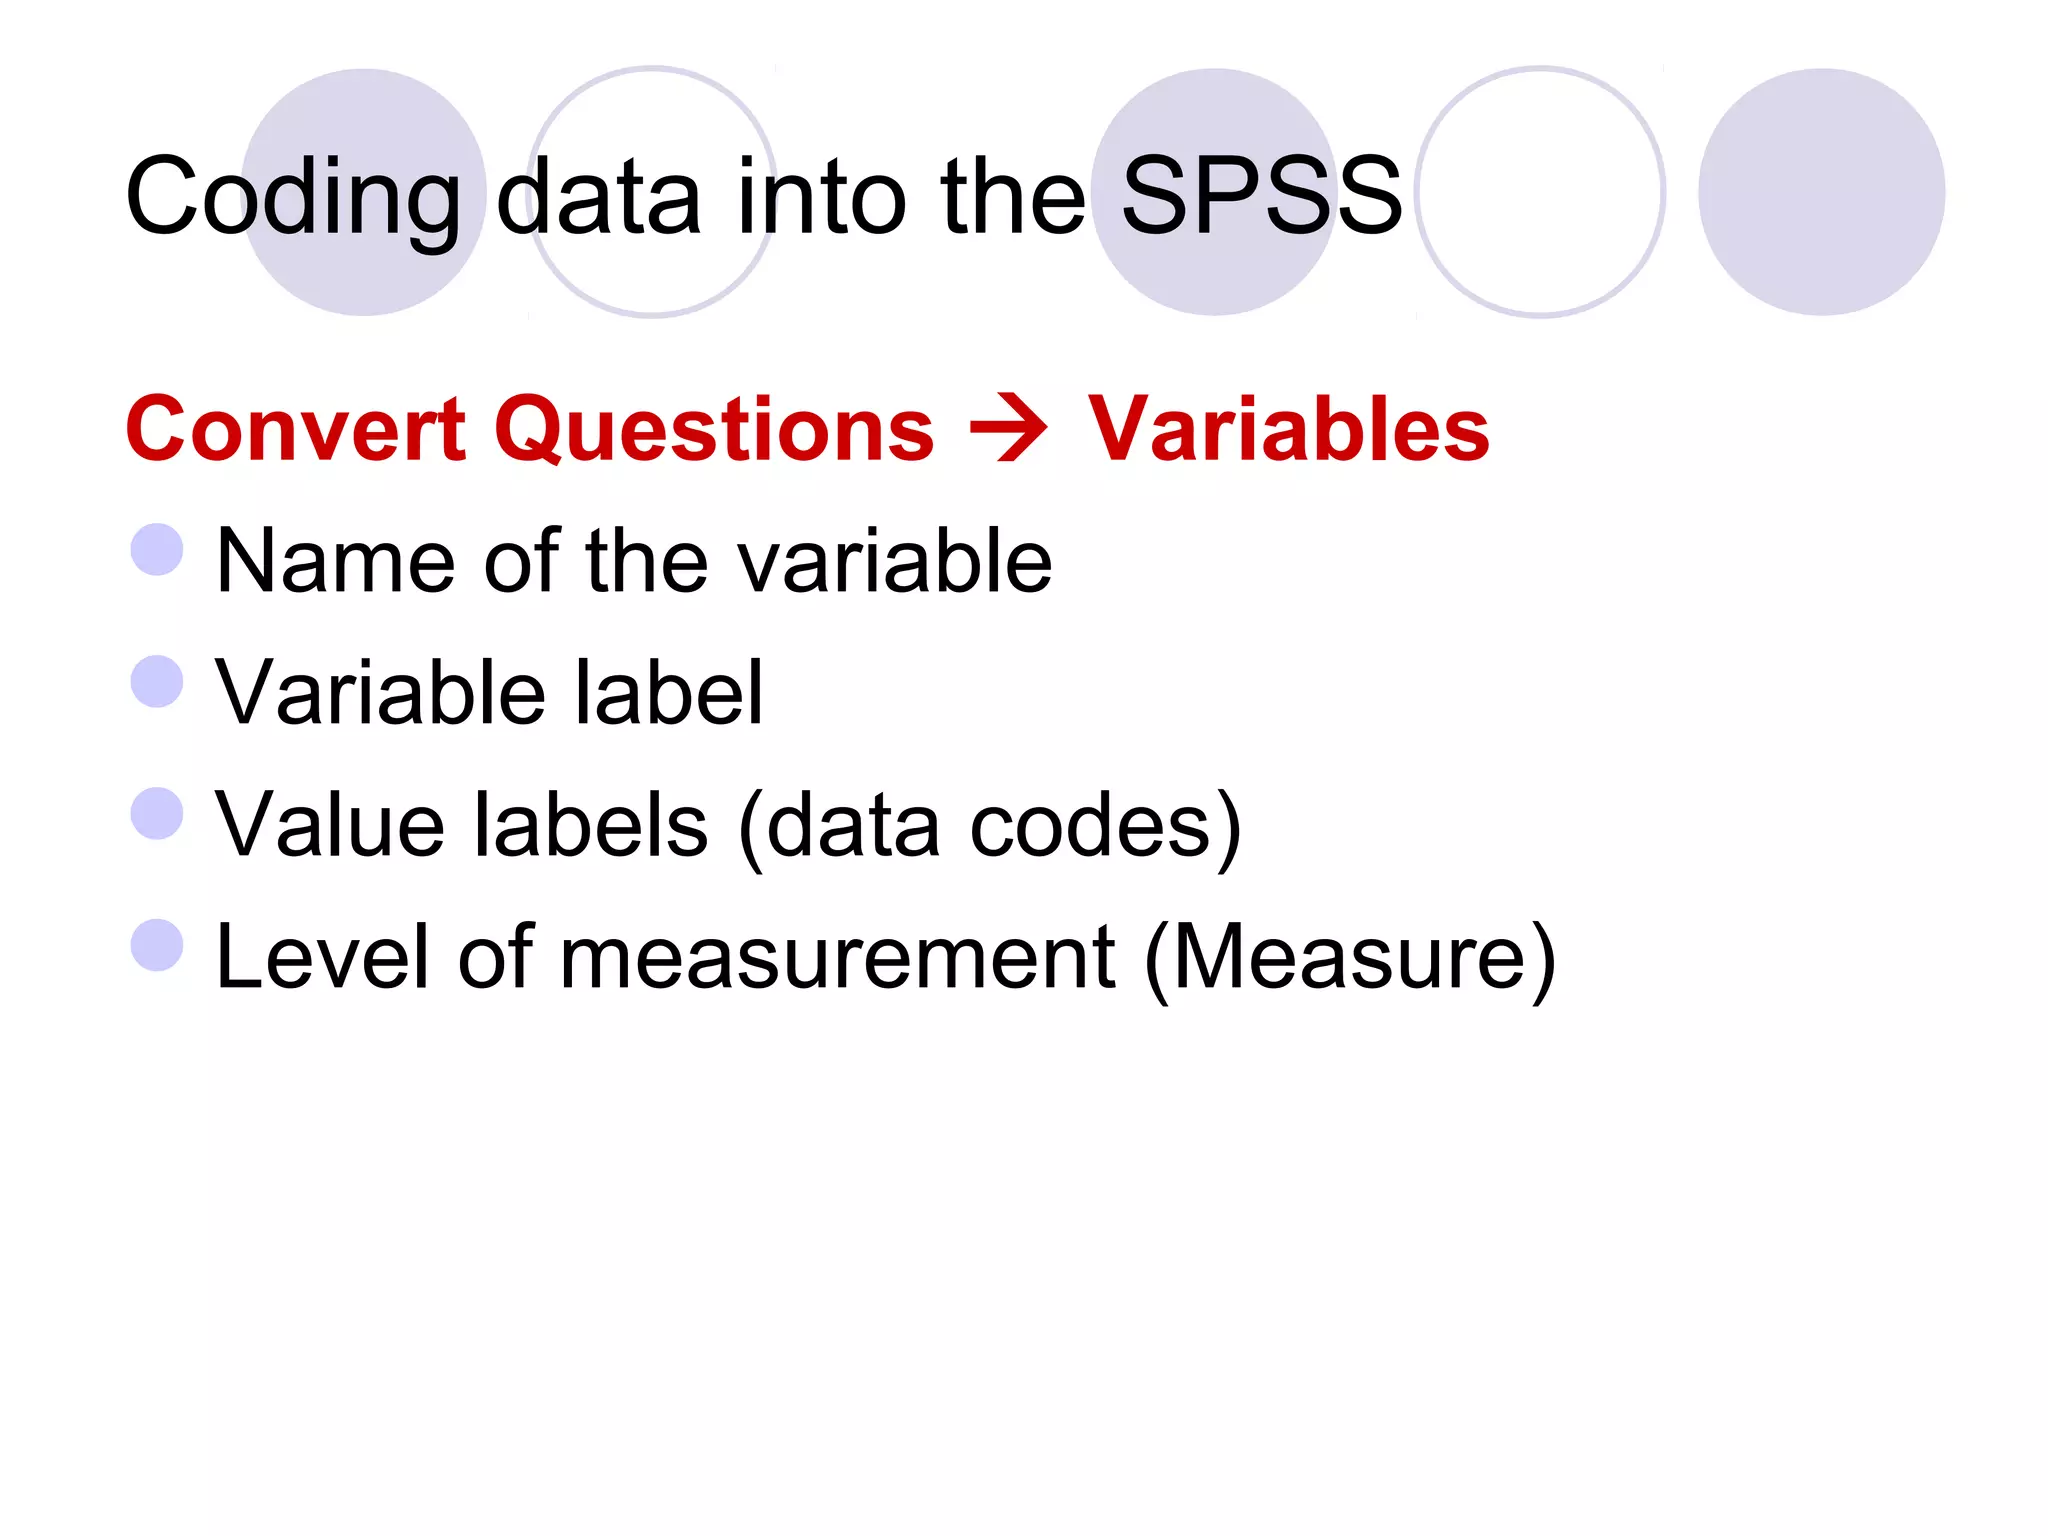
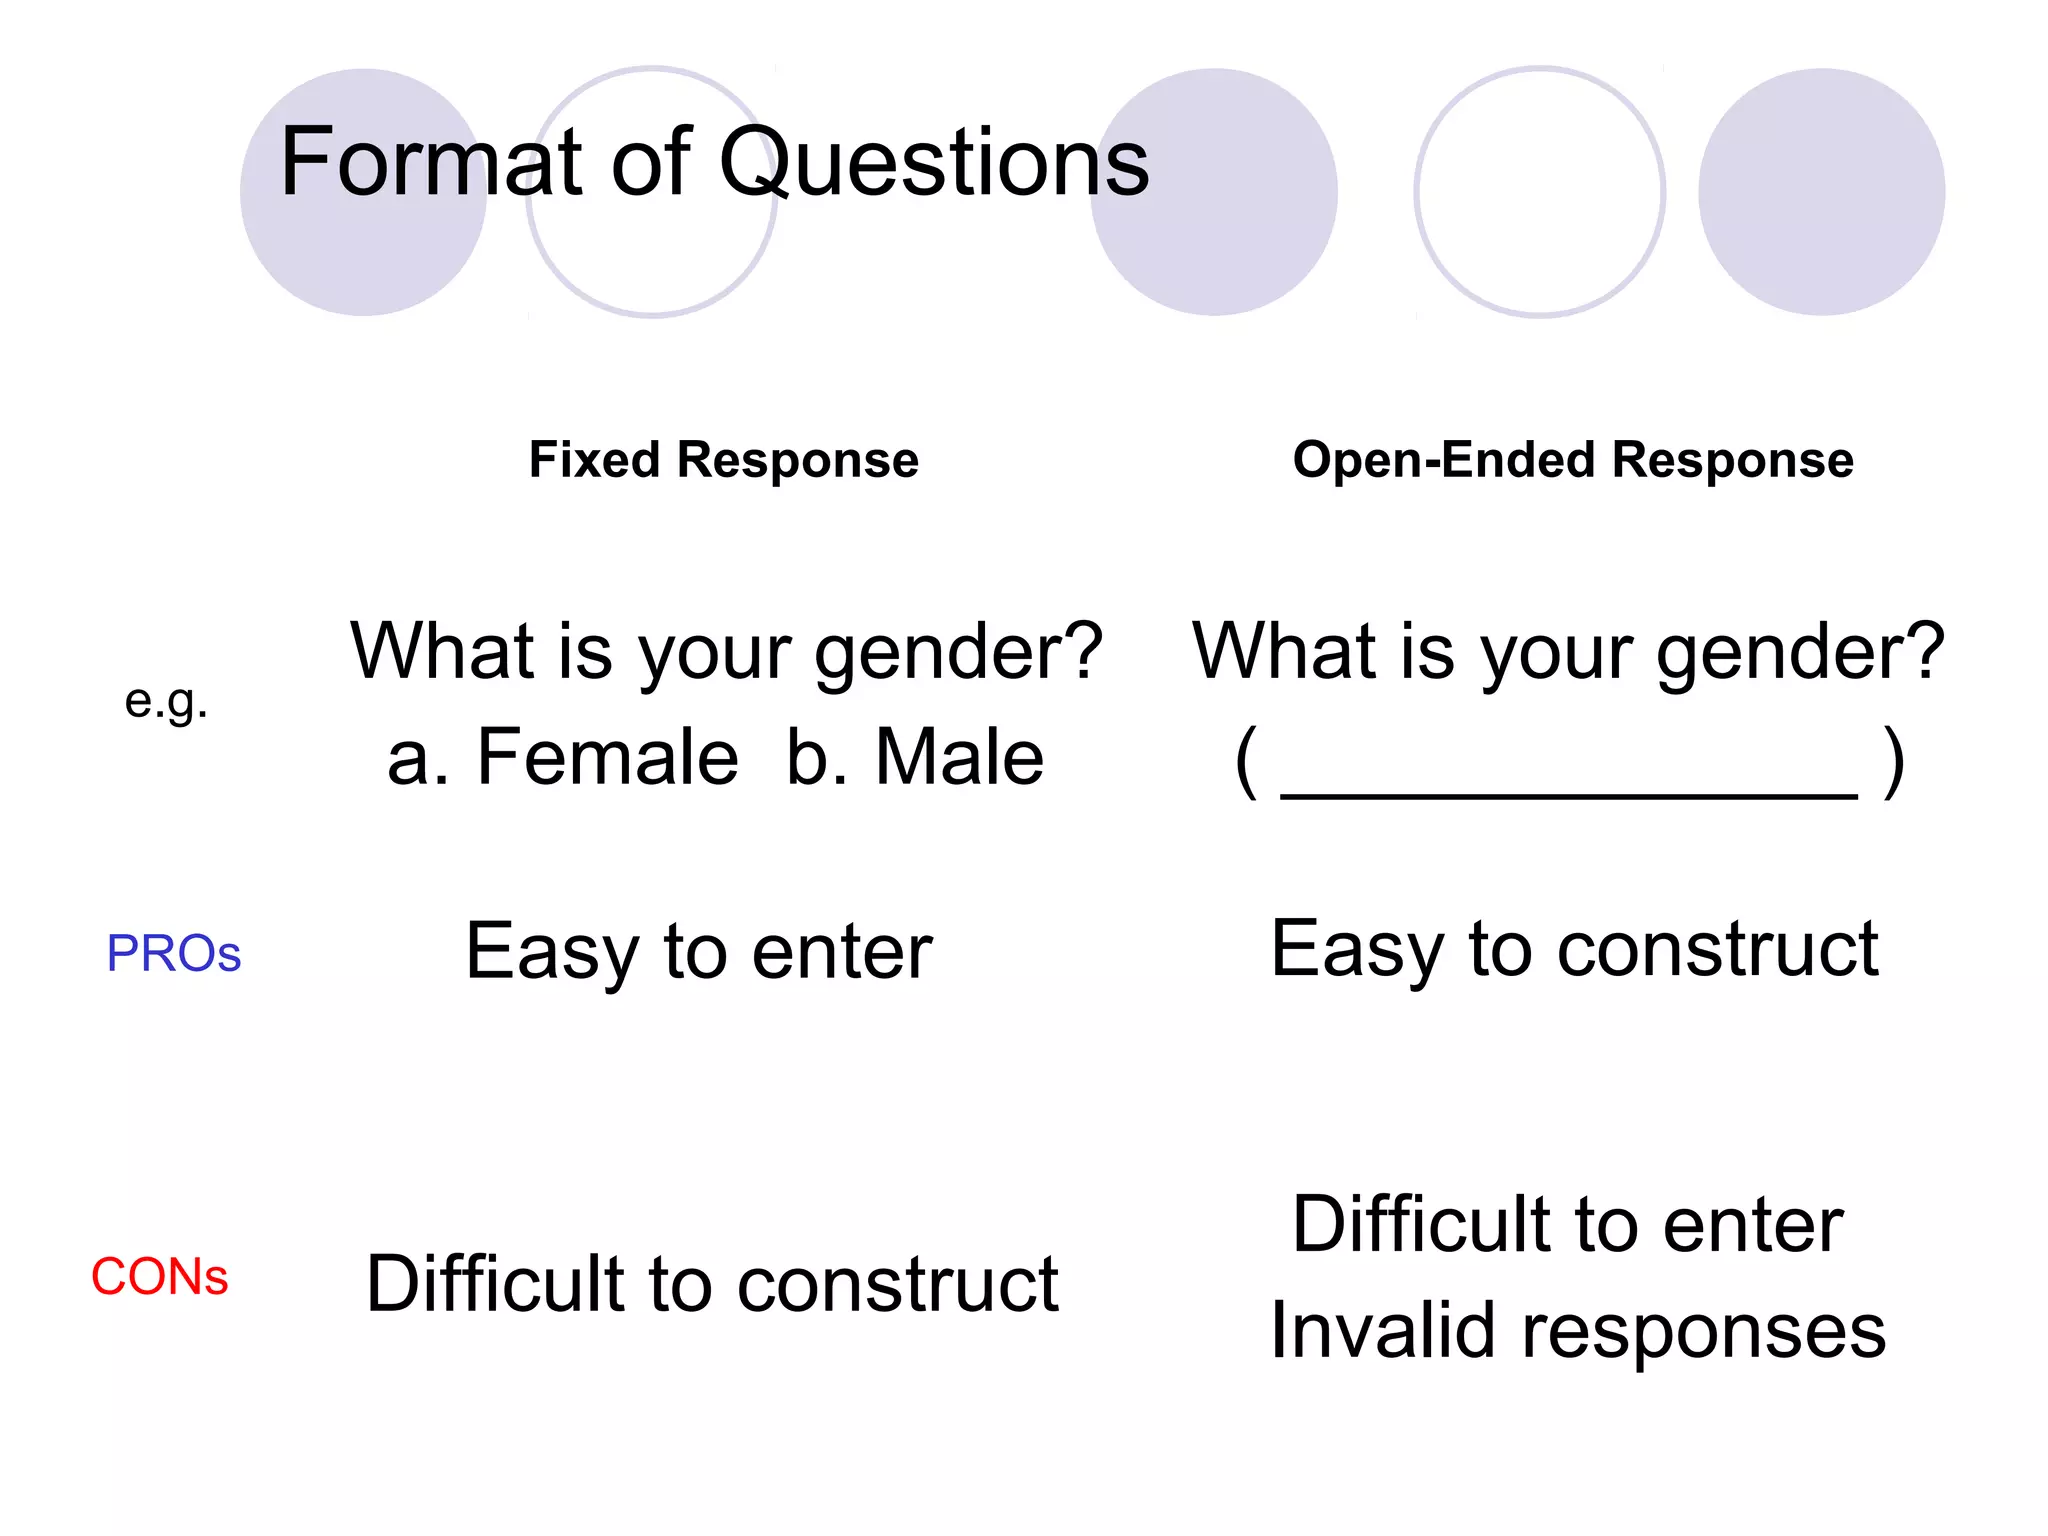
Different question-response formats for SPSS data entry, including coding closed-ended and open-ended responses.
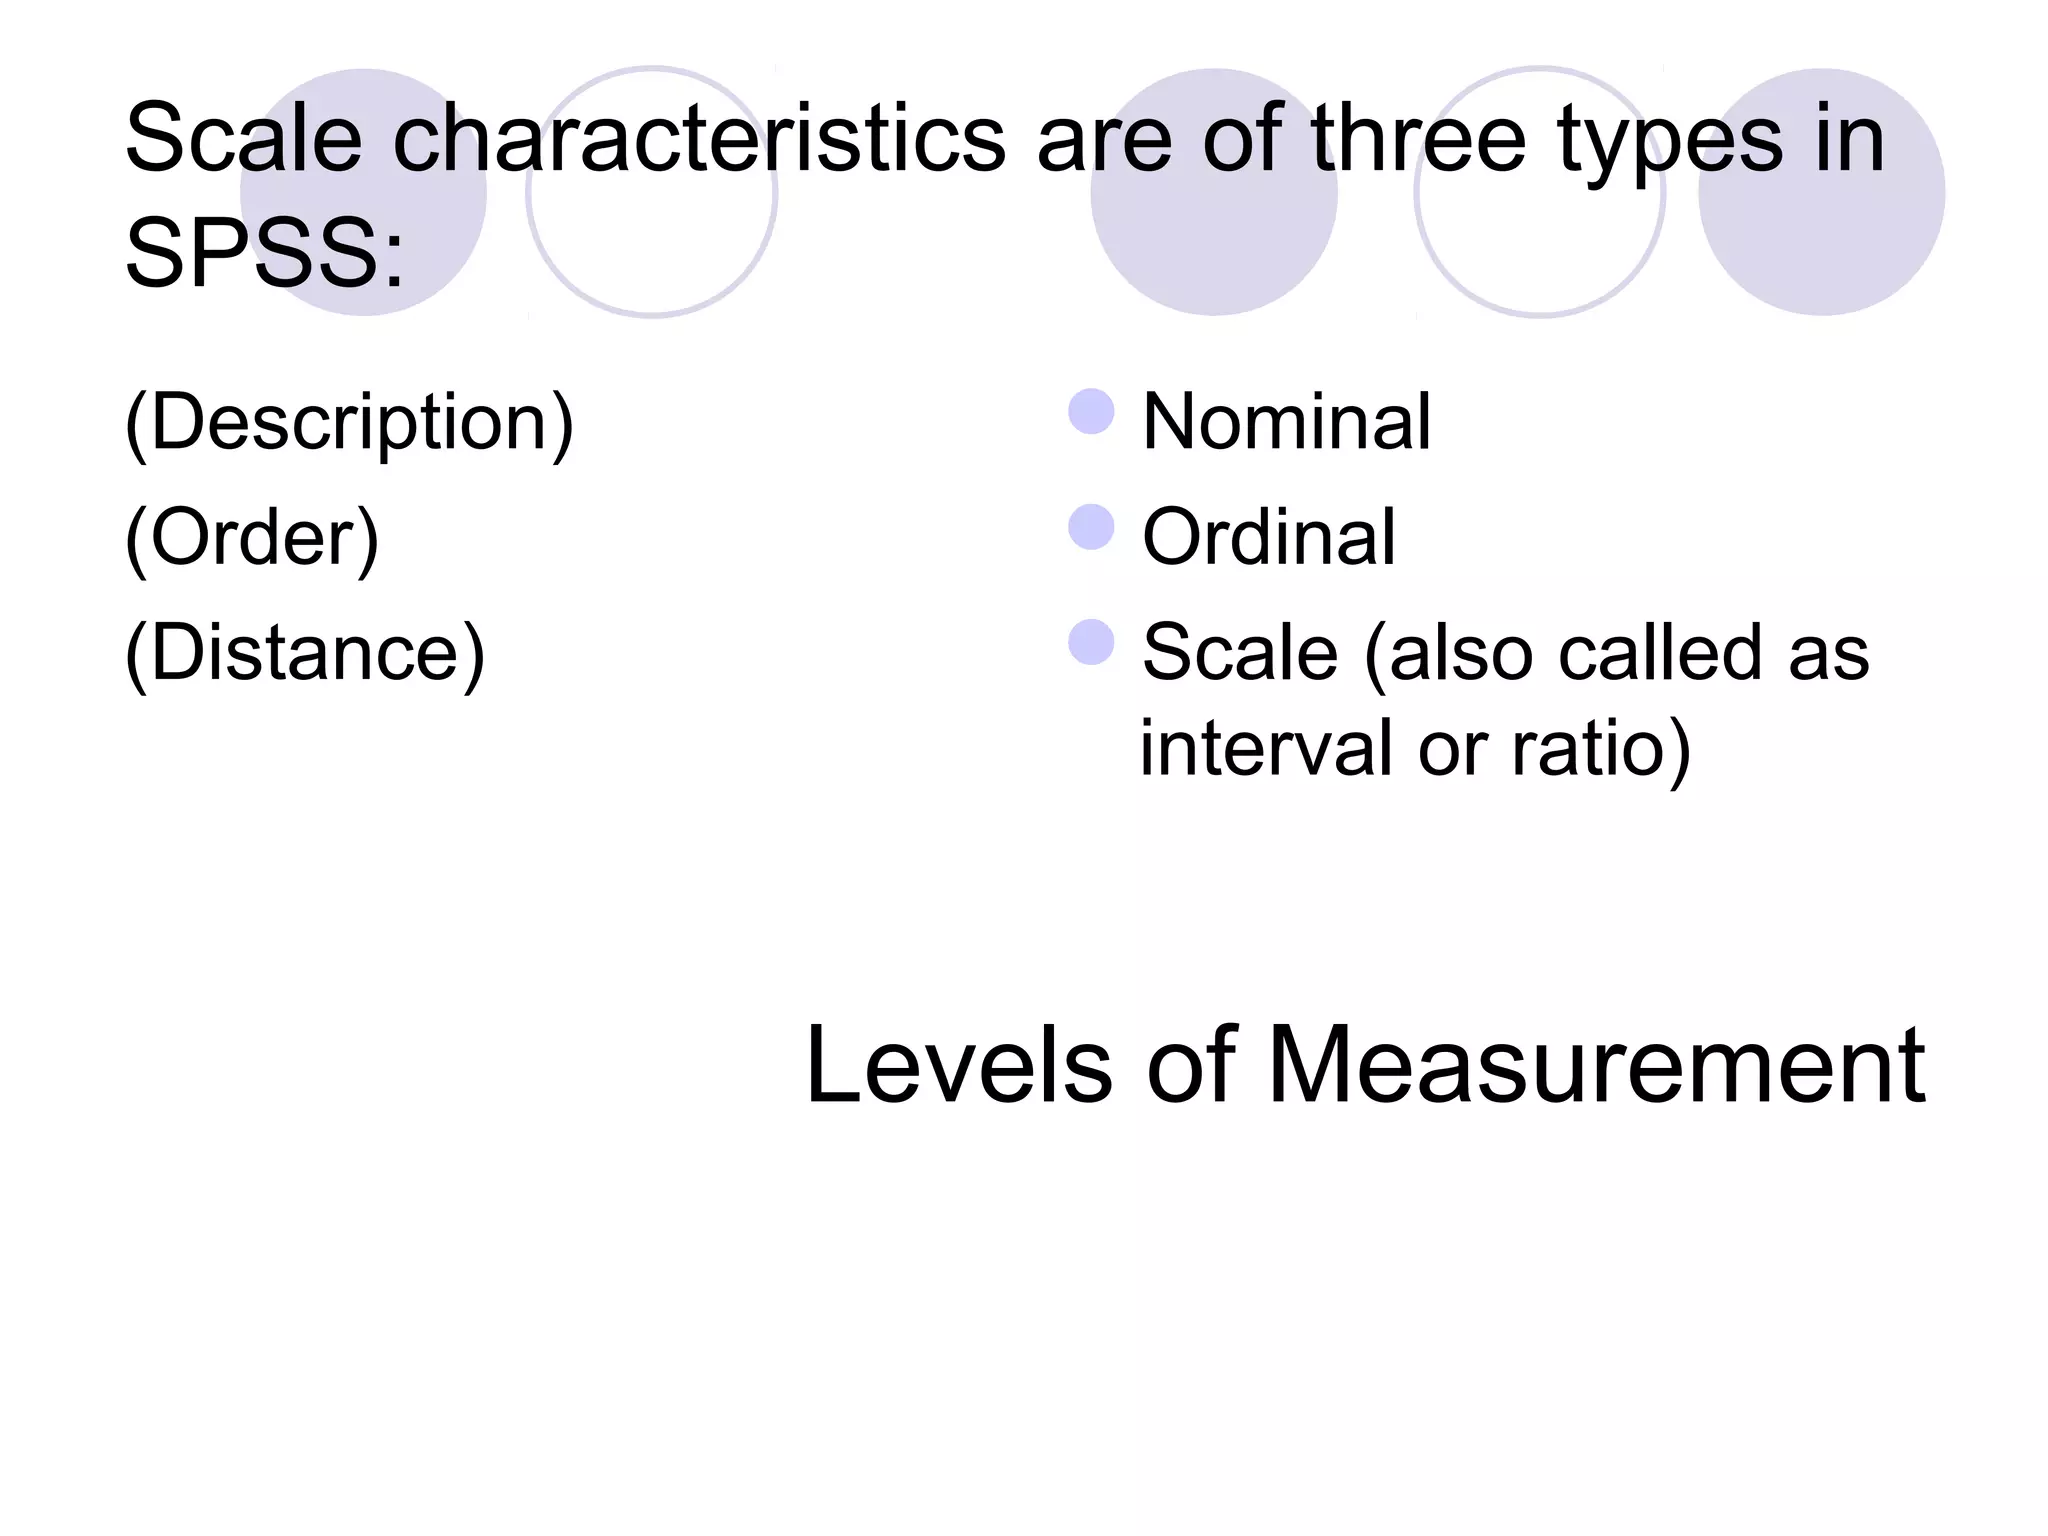
Levels of measurement in SPSS: nominal, ordinal, and scale, along with coding variables.
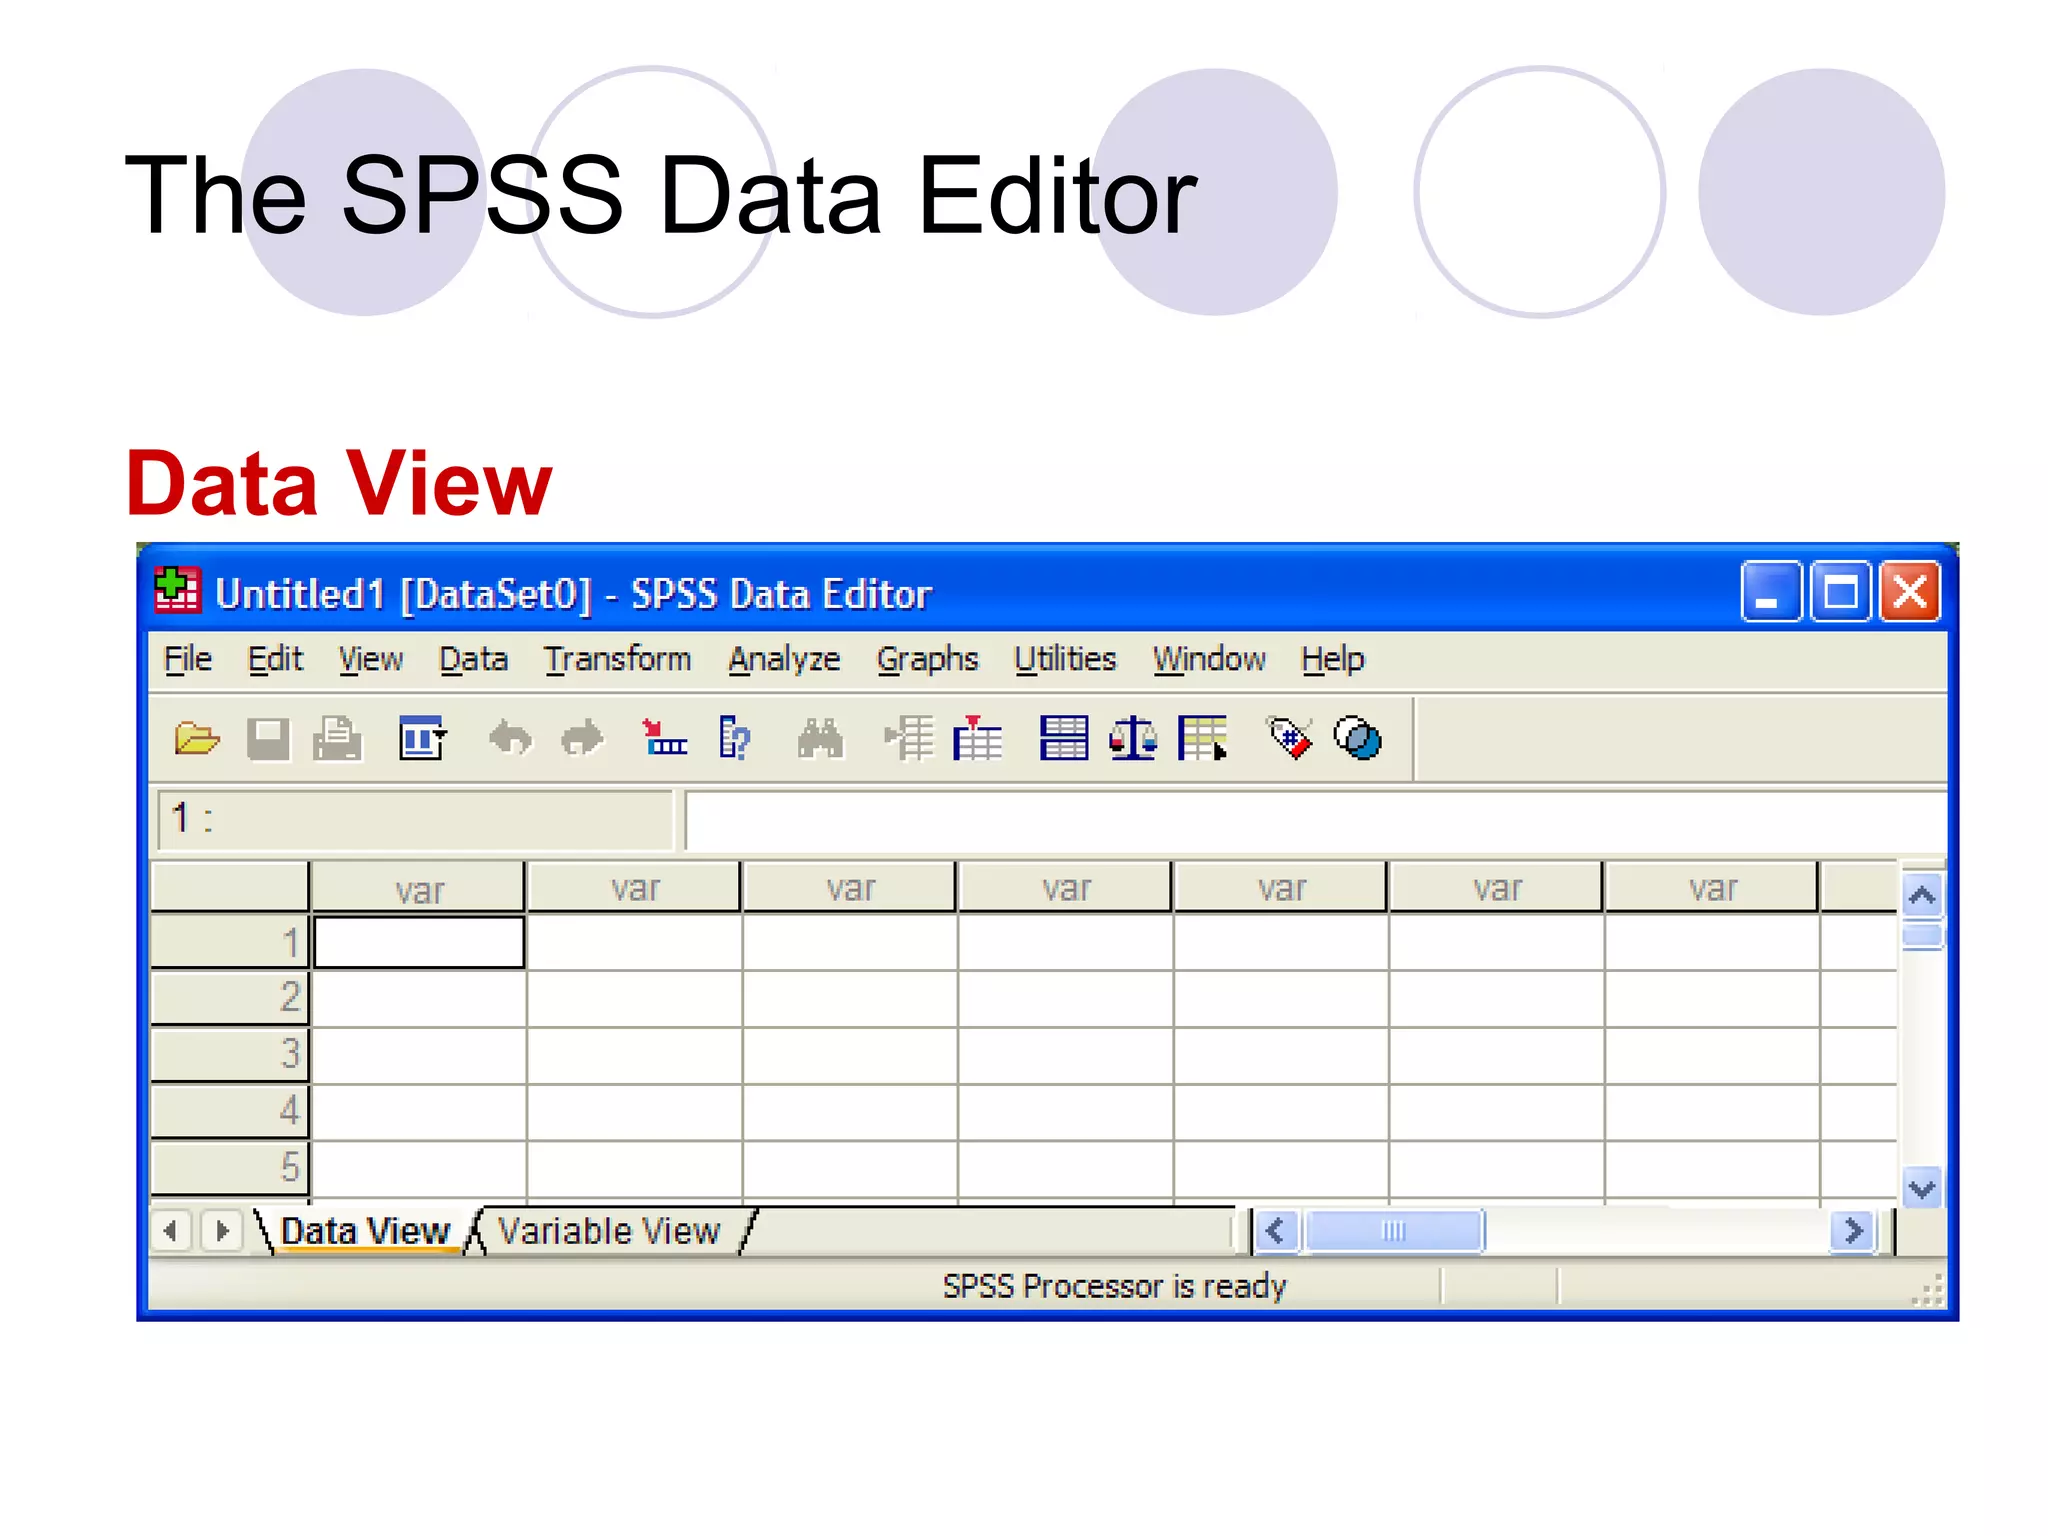
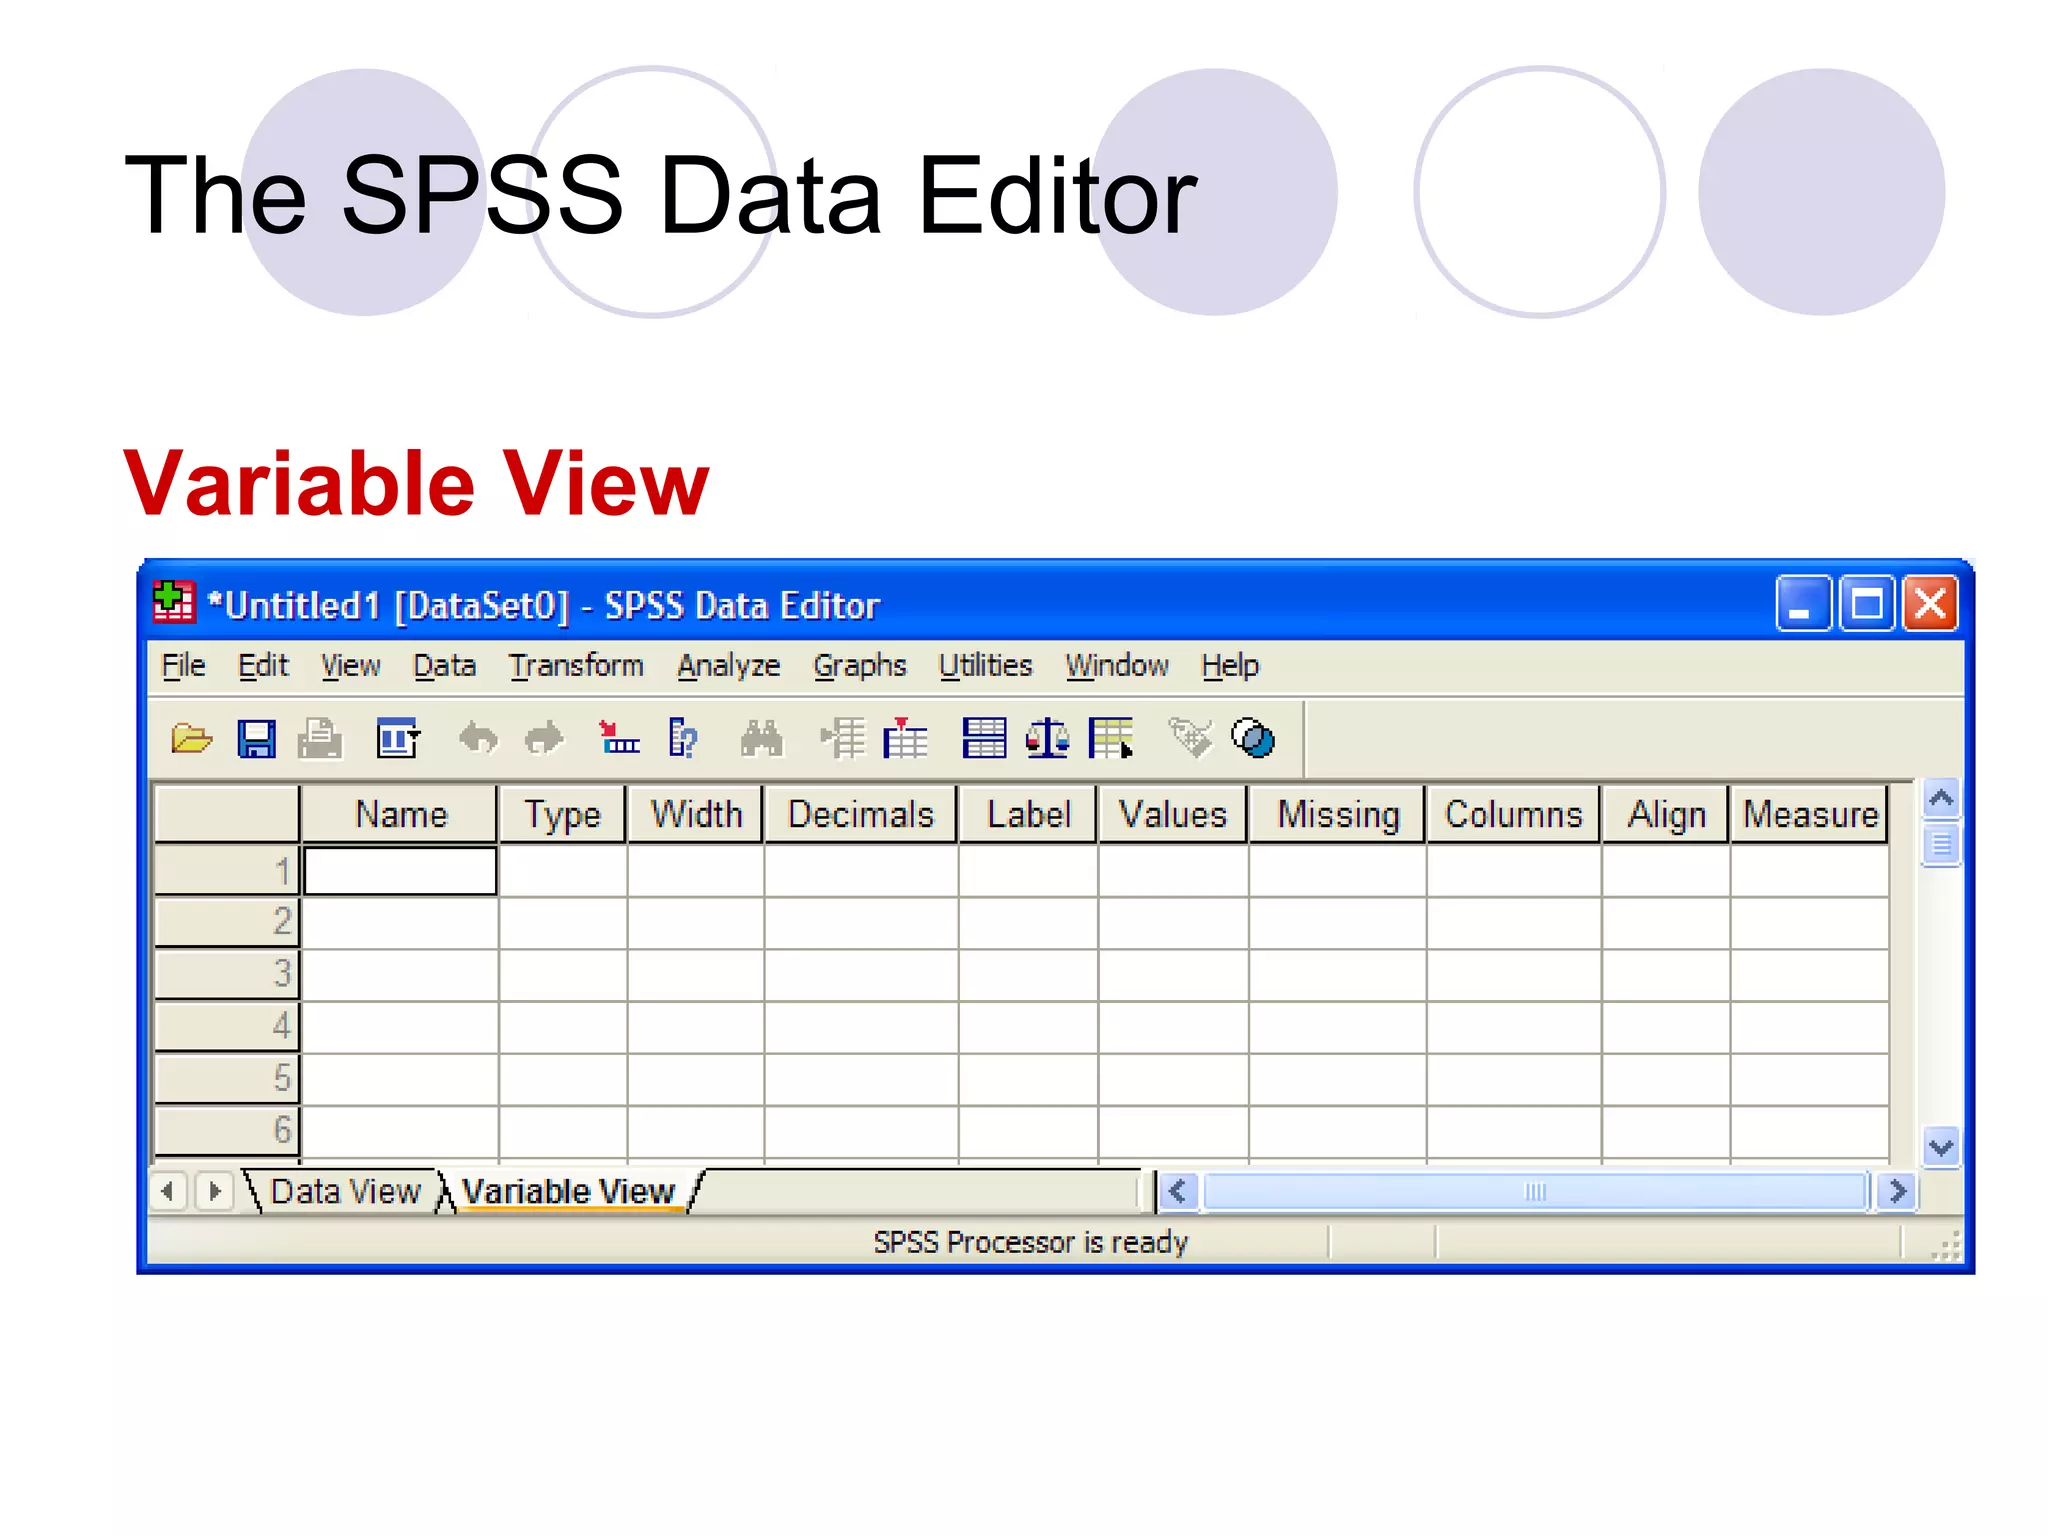
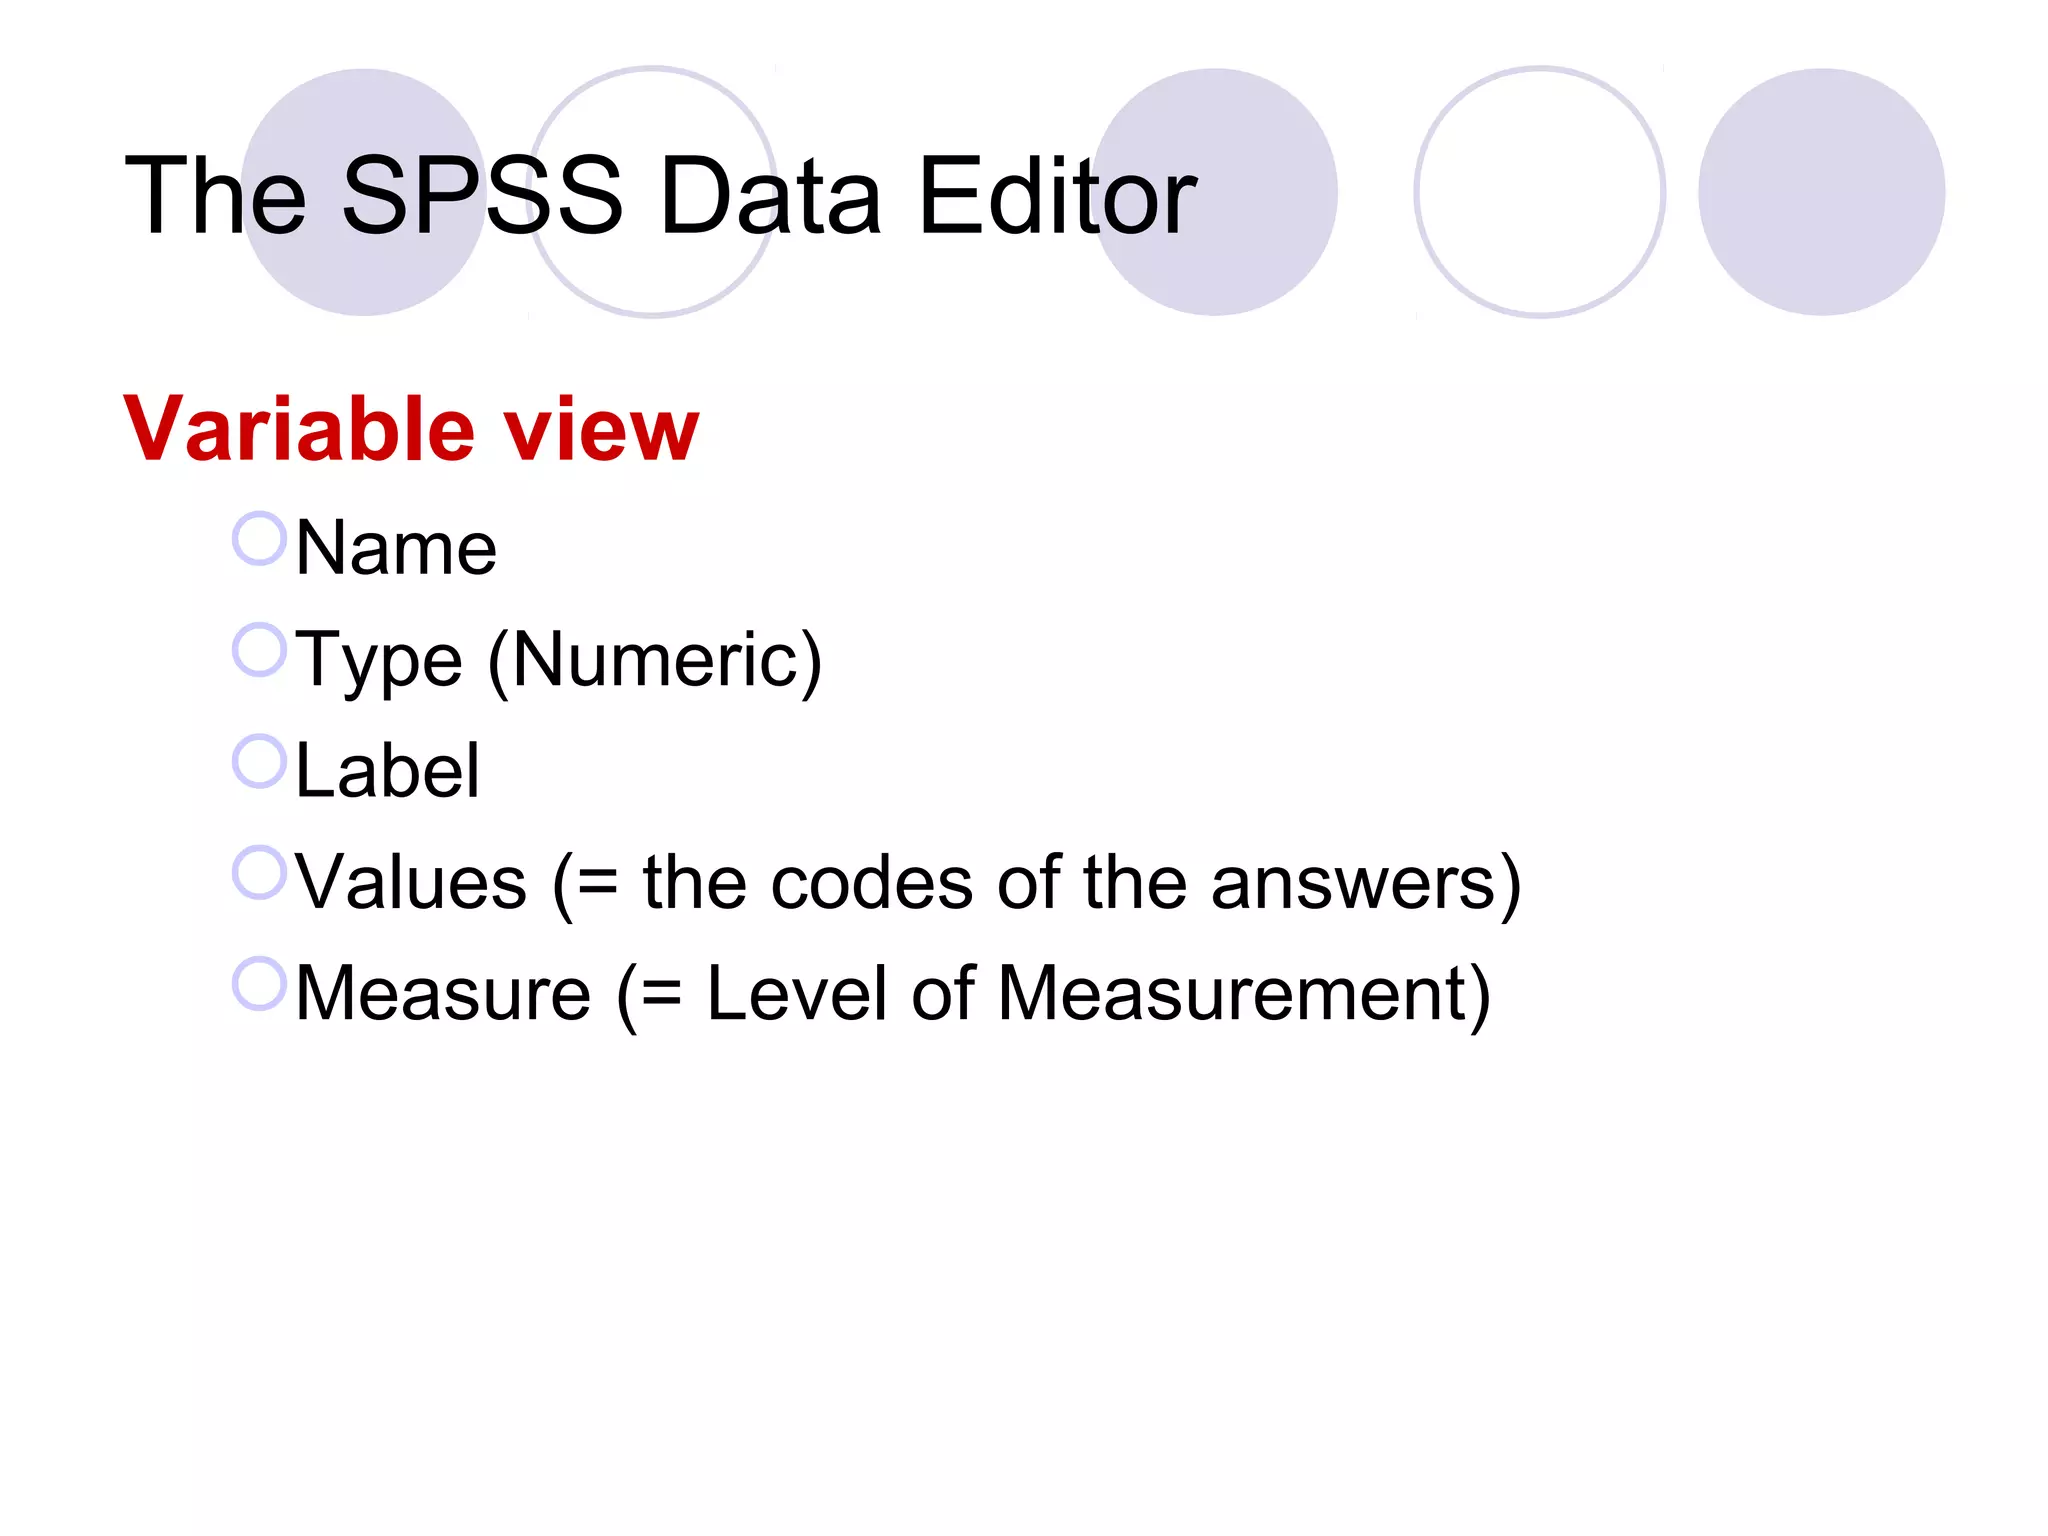
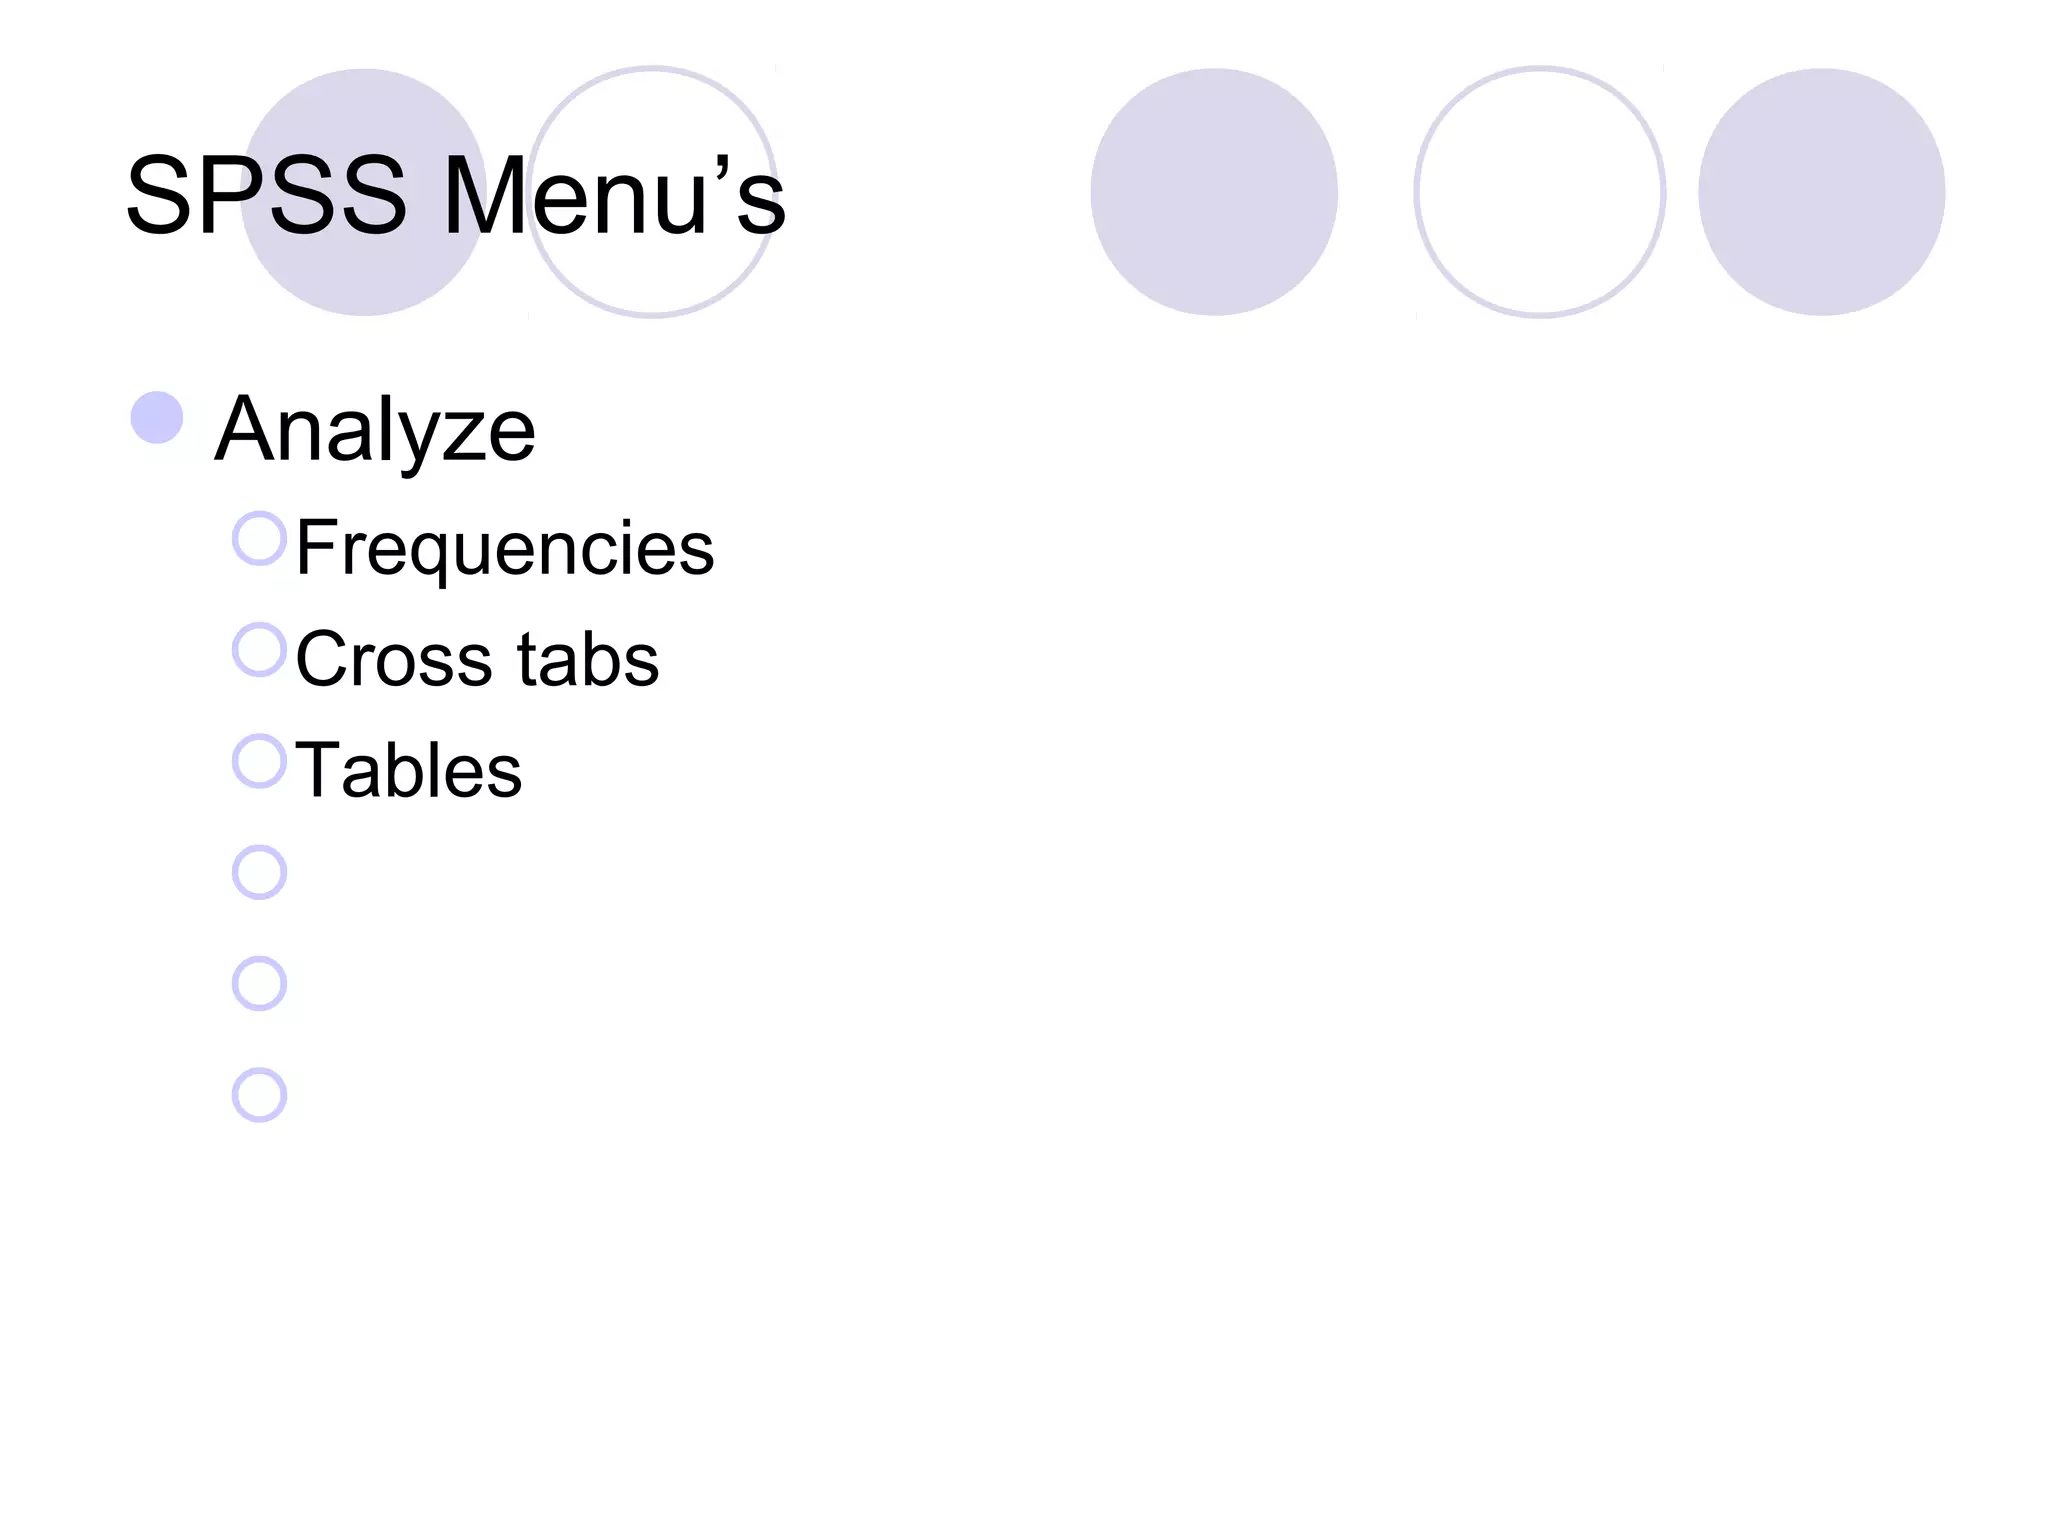
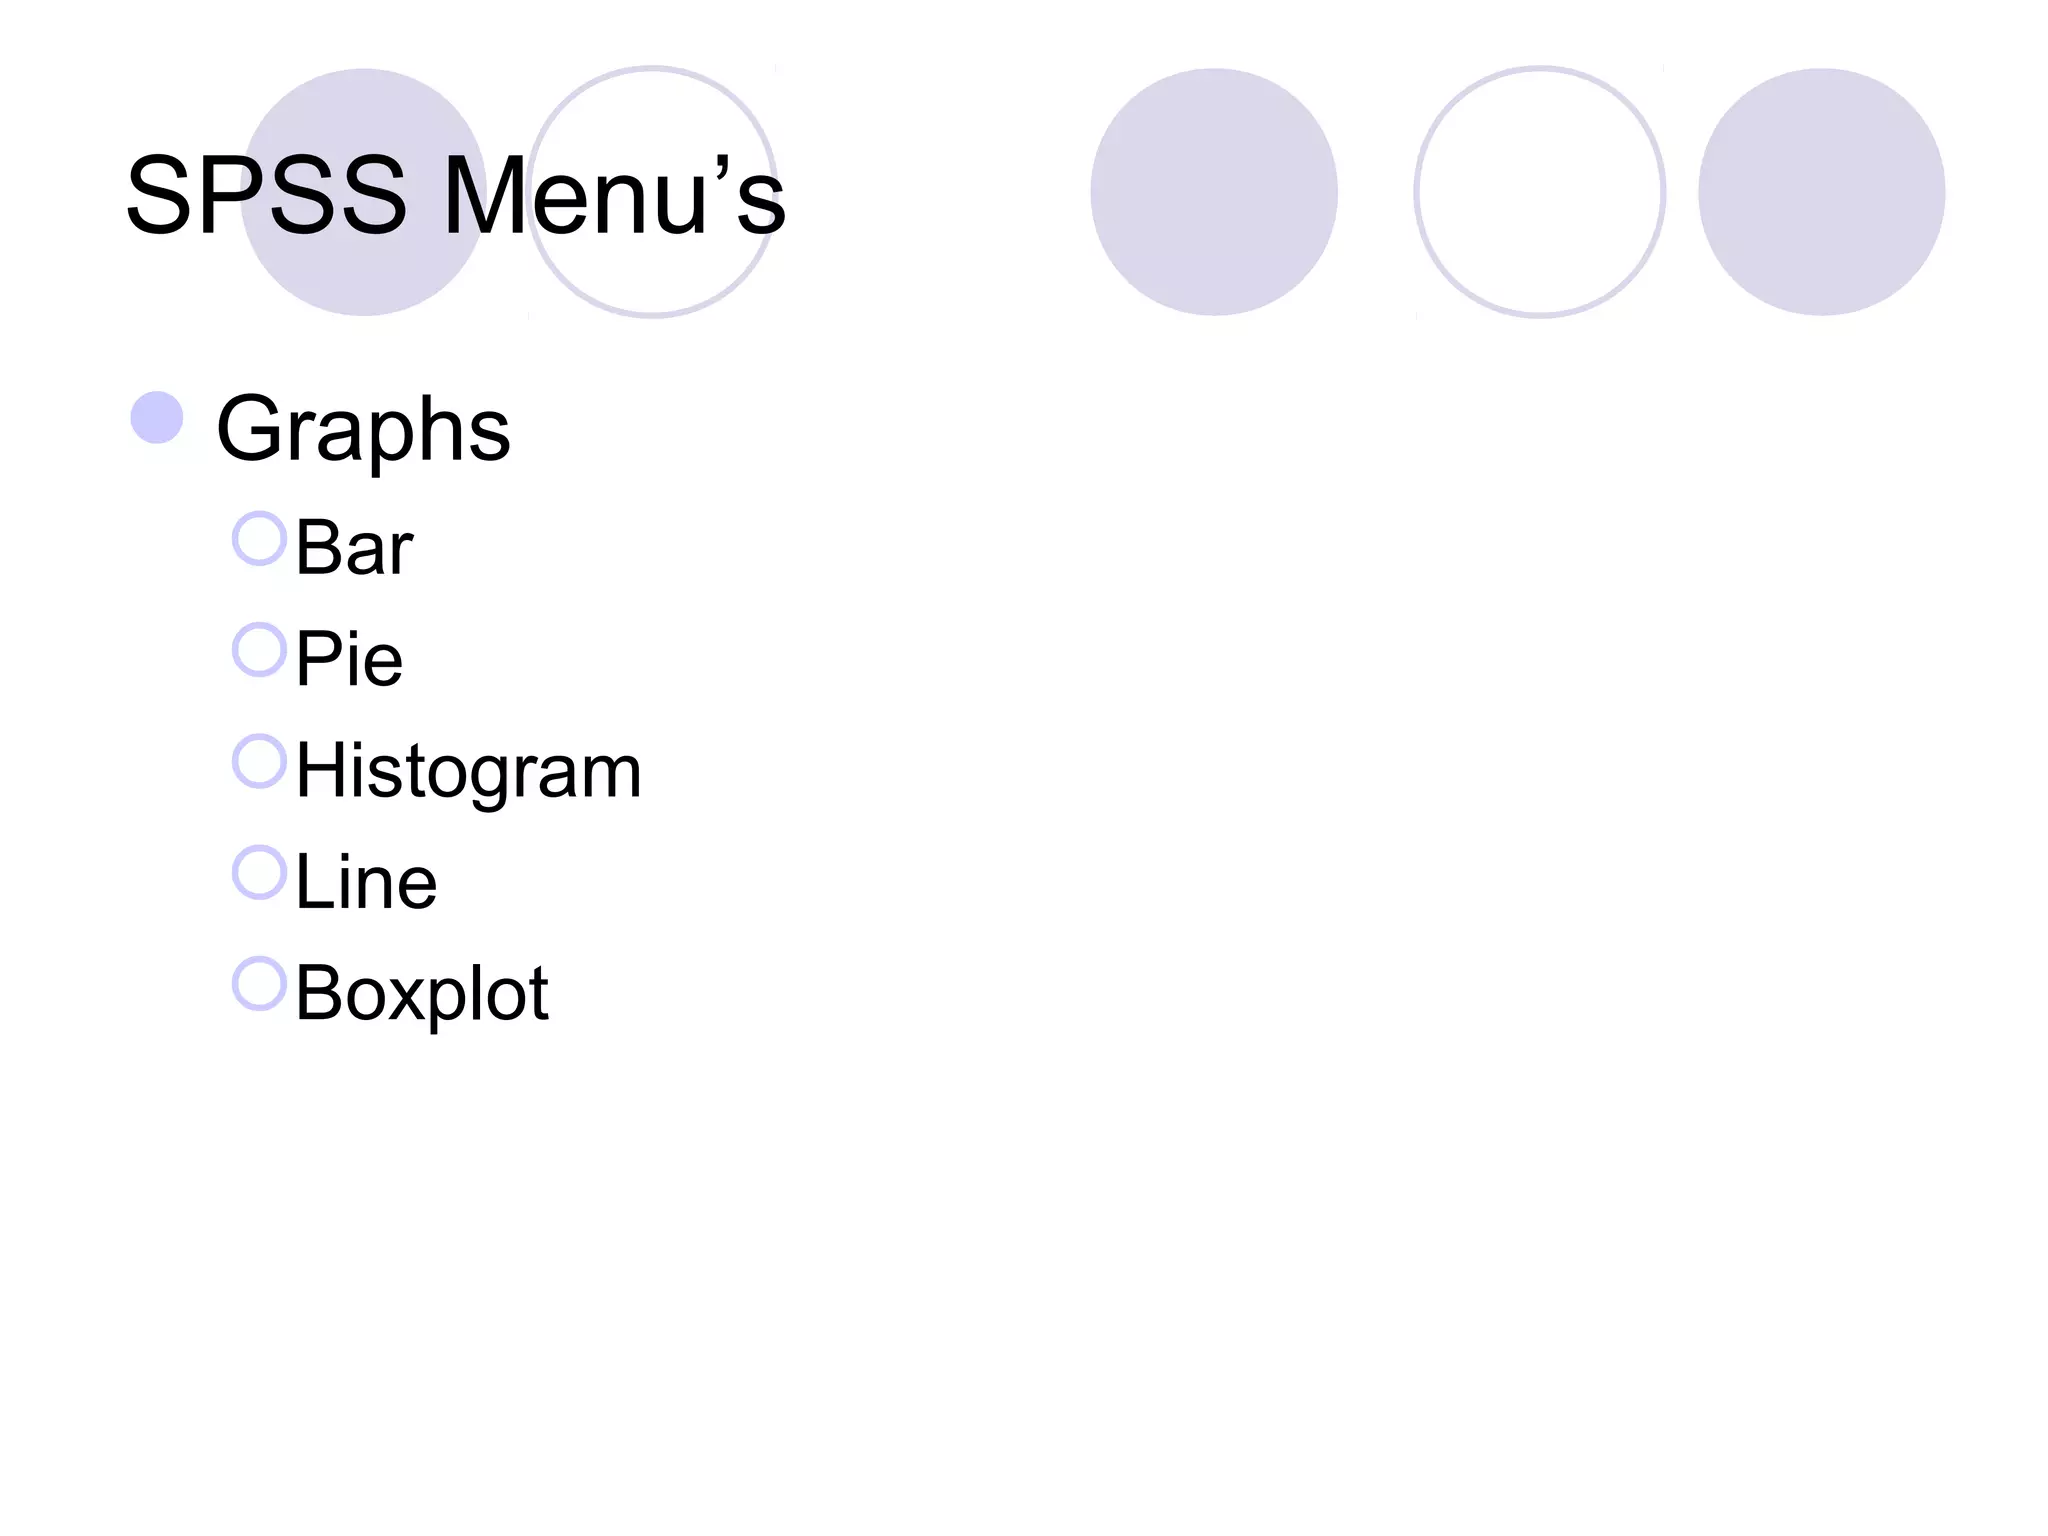
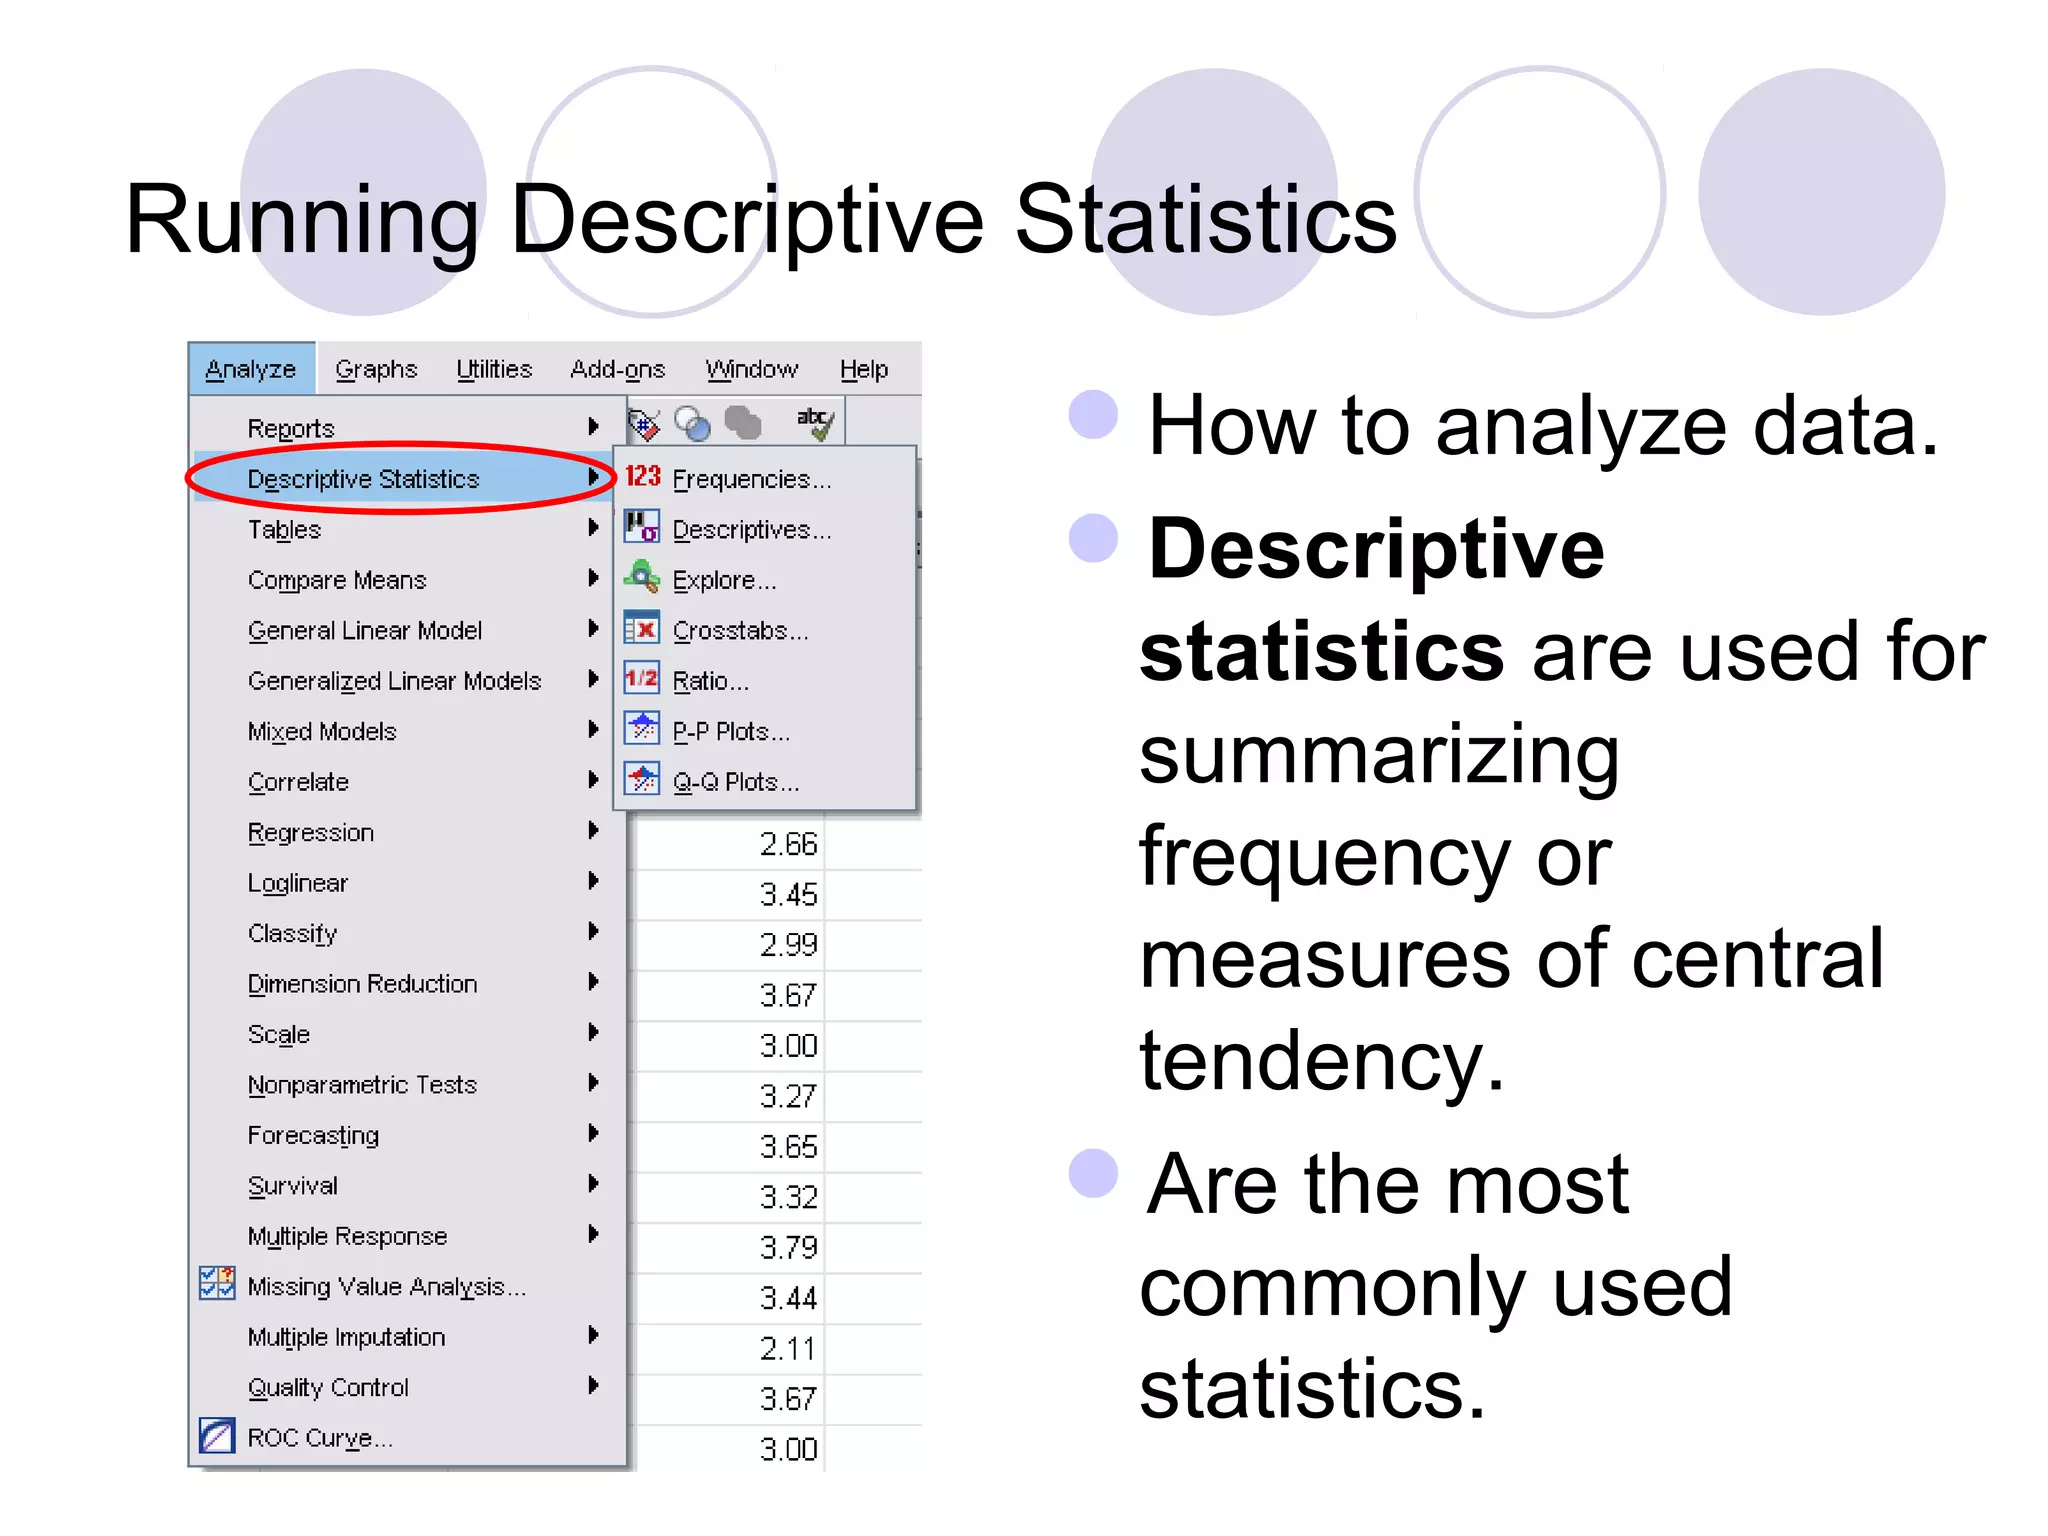
Overview of SPSS Data Editor's Data View and Variable View, and functionalities in the SPSS menus for analyzing and graphing data.
Descriptive statistics for summarizing data, identifying research stages, and formats of questions used in surveys.
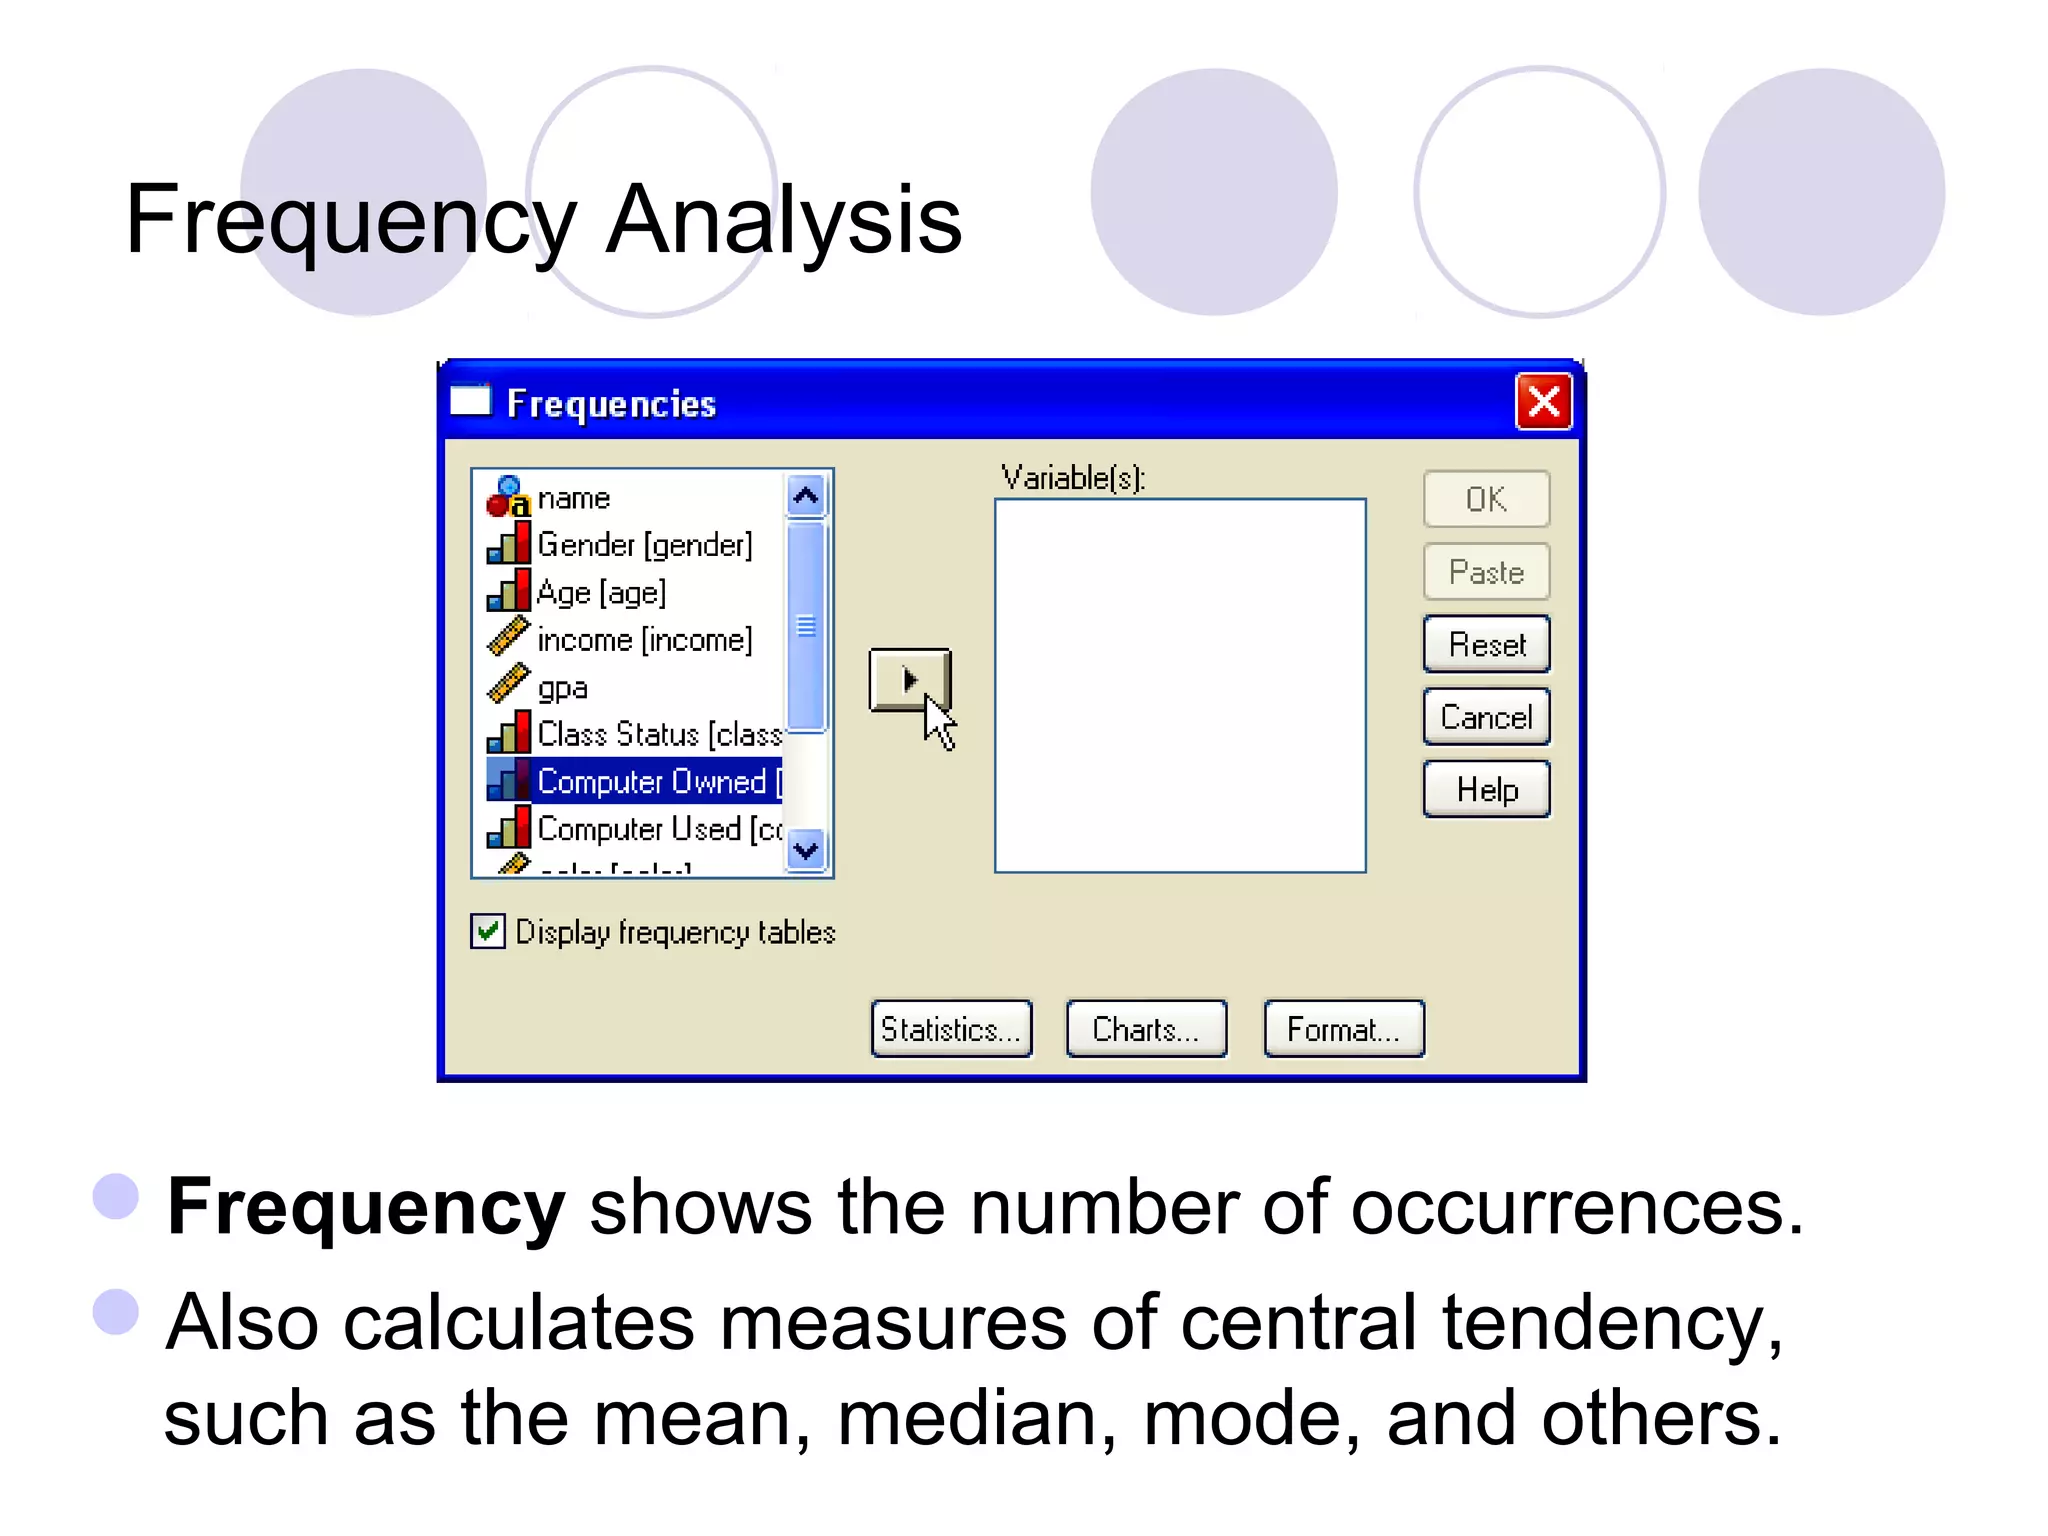
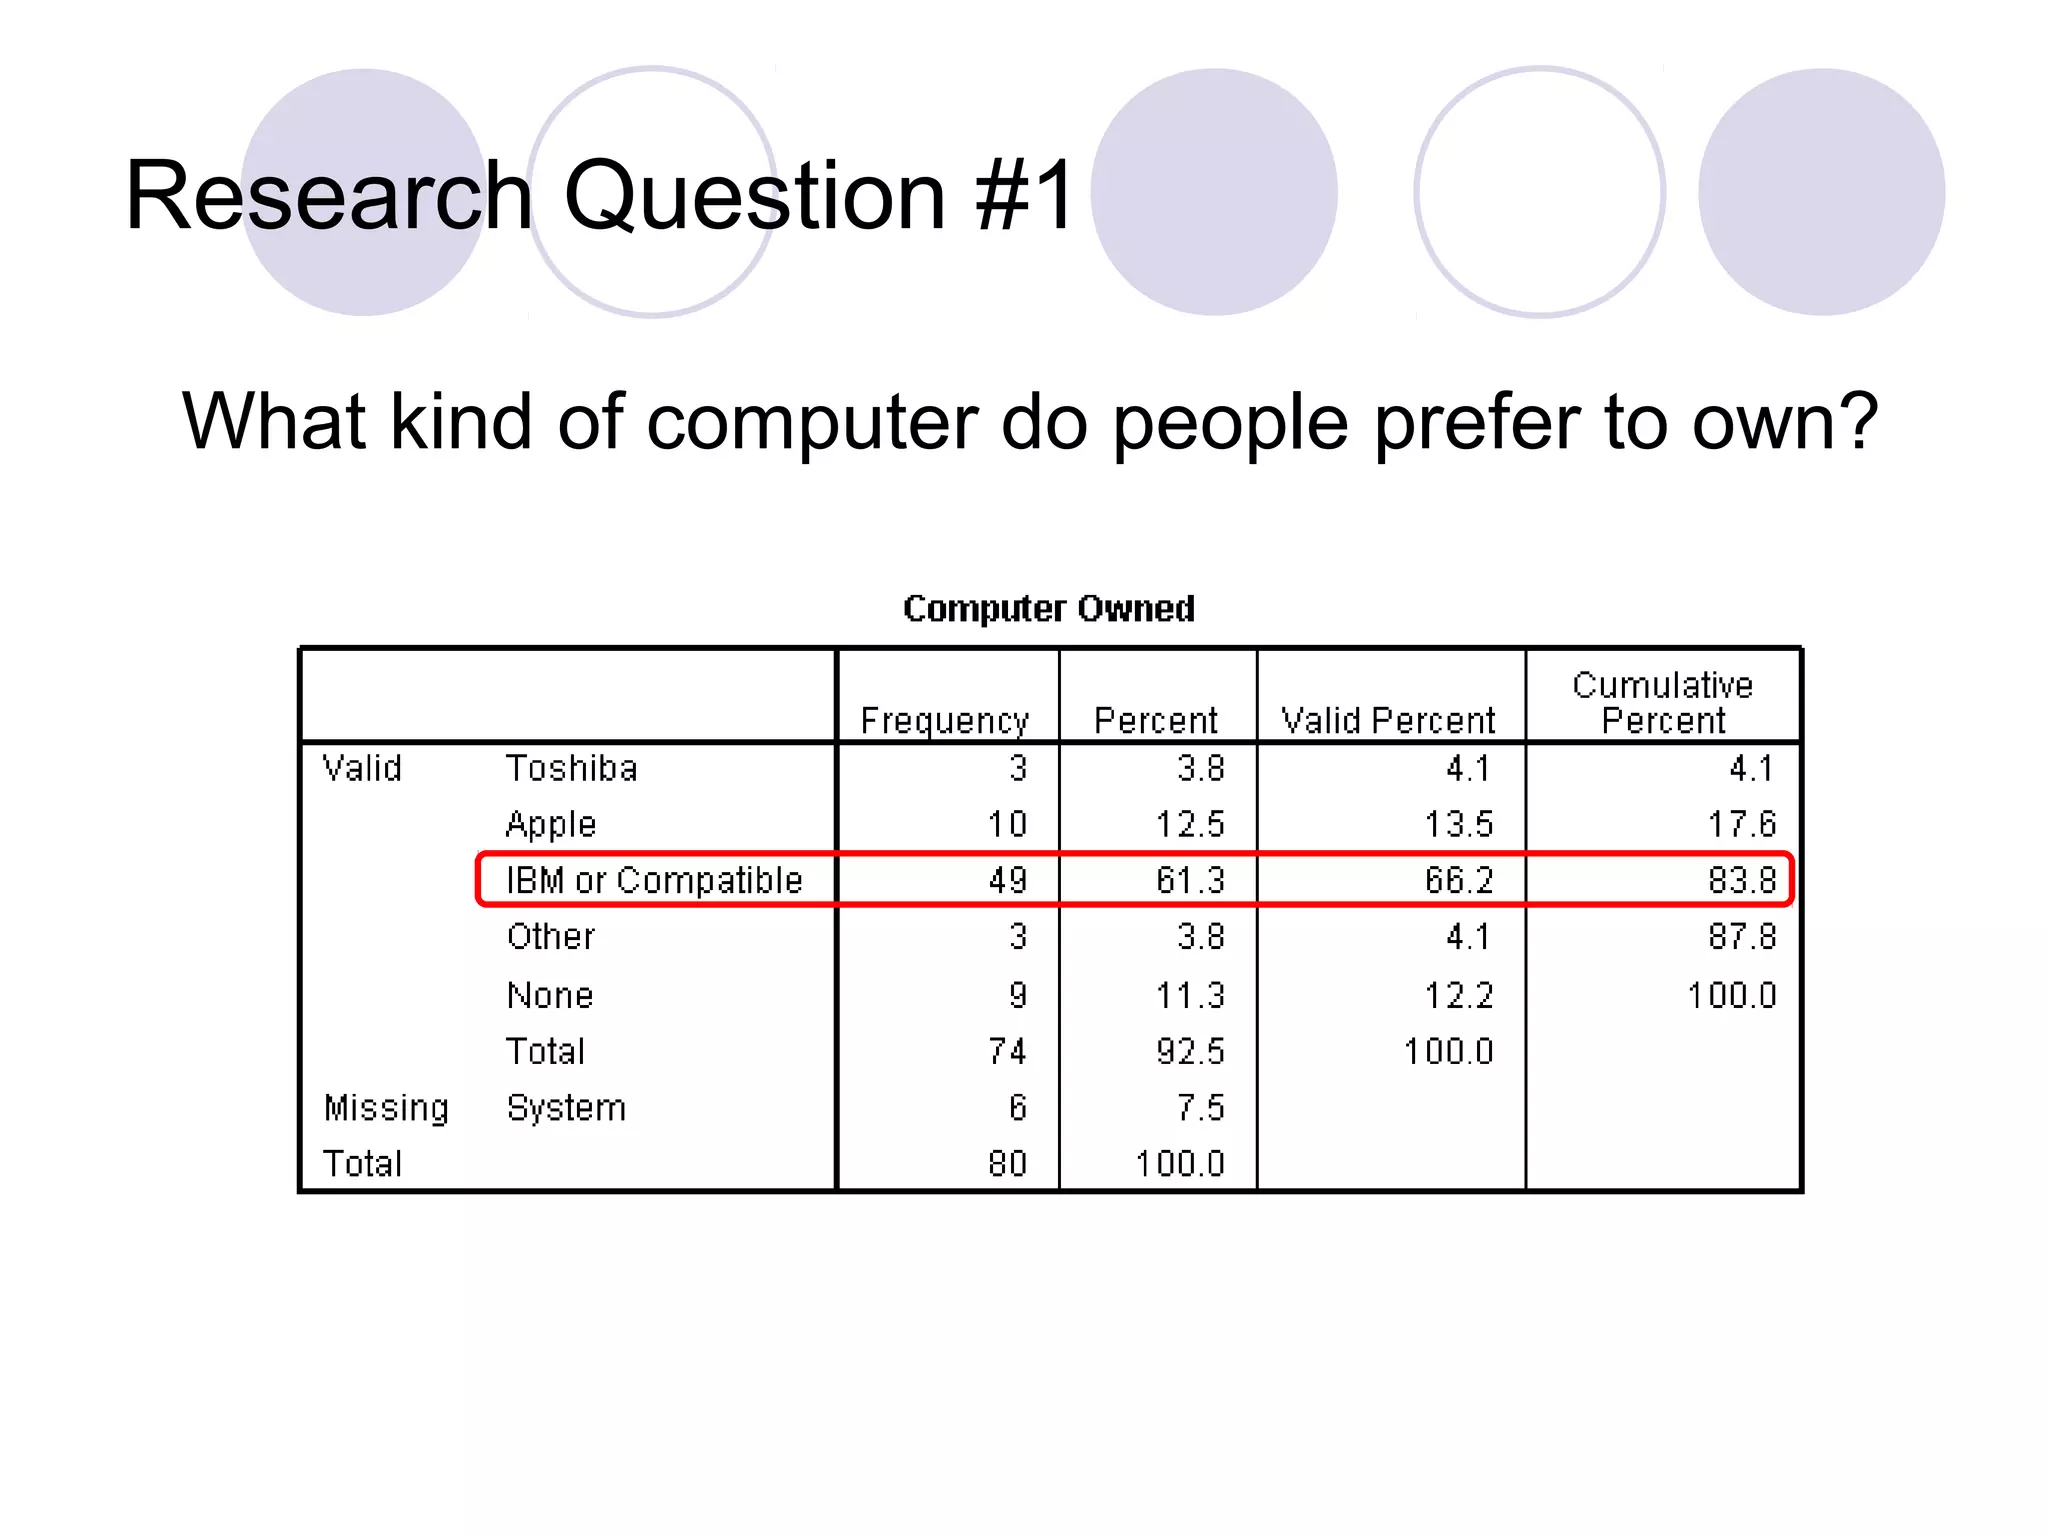
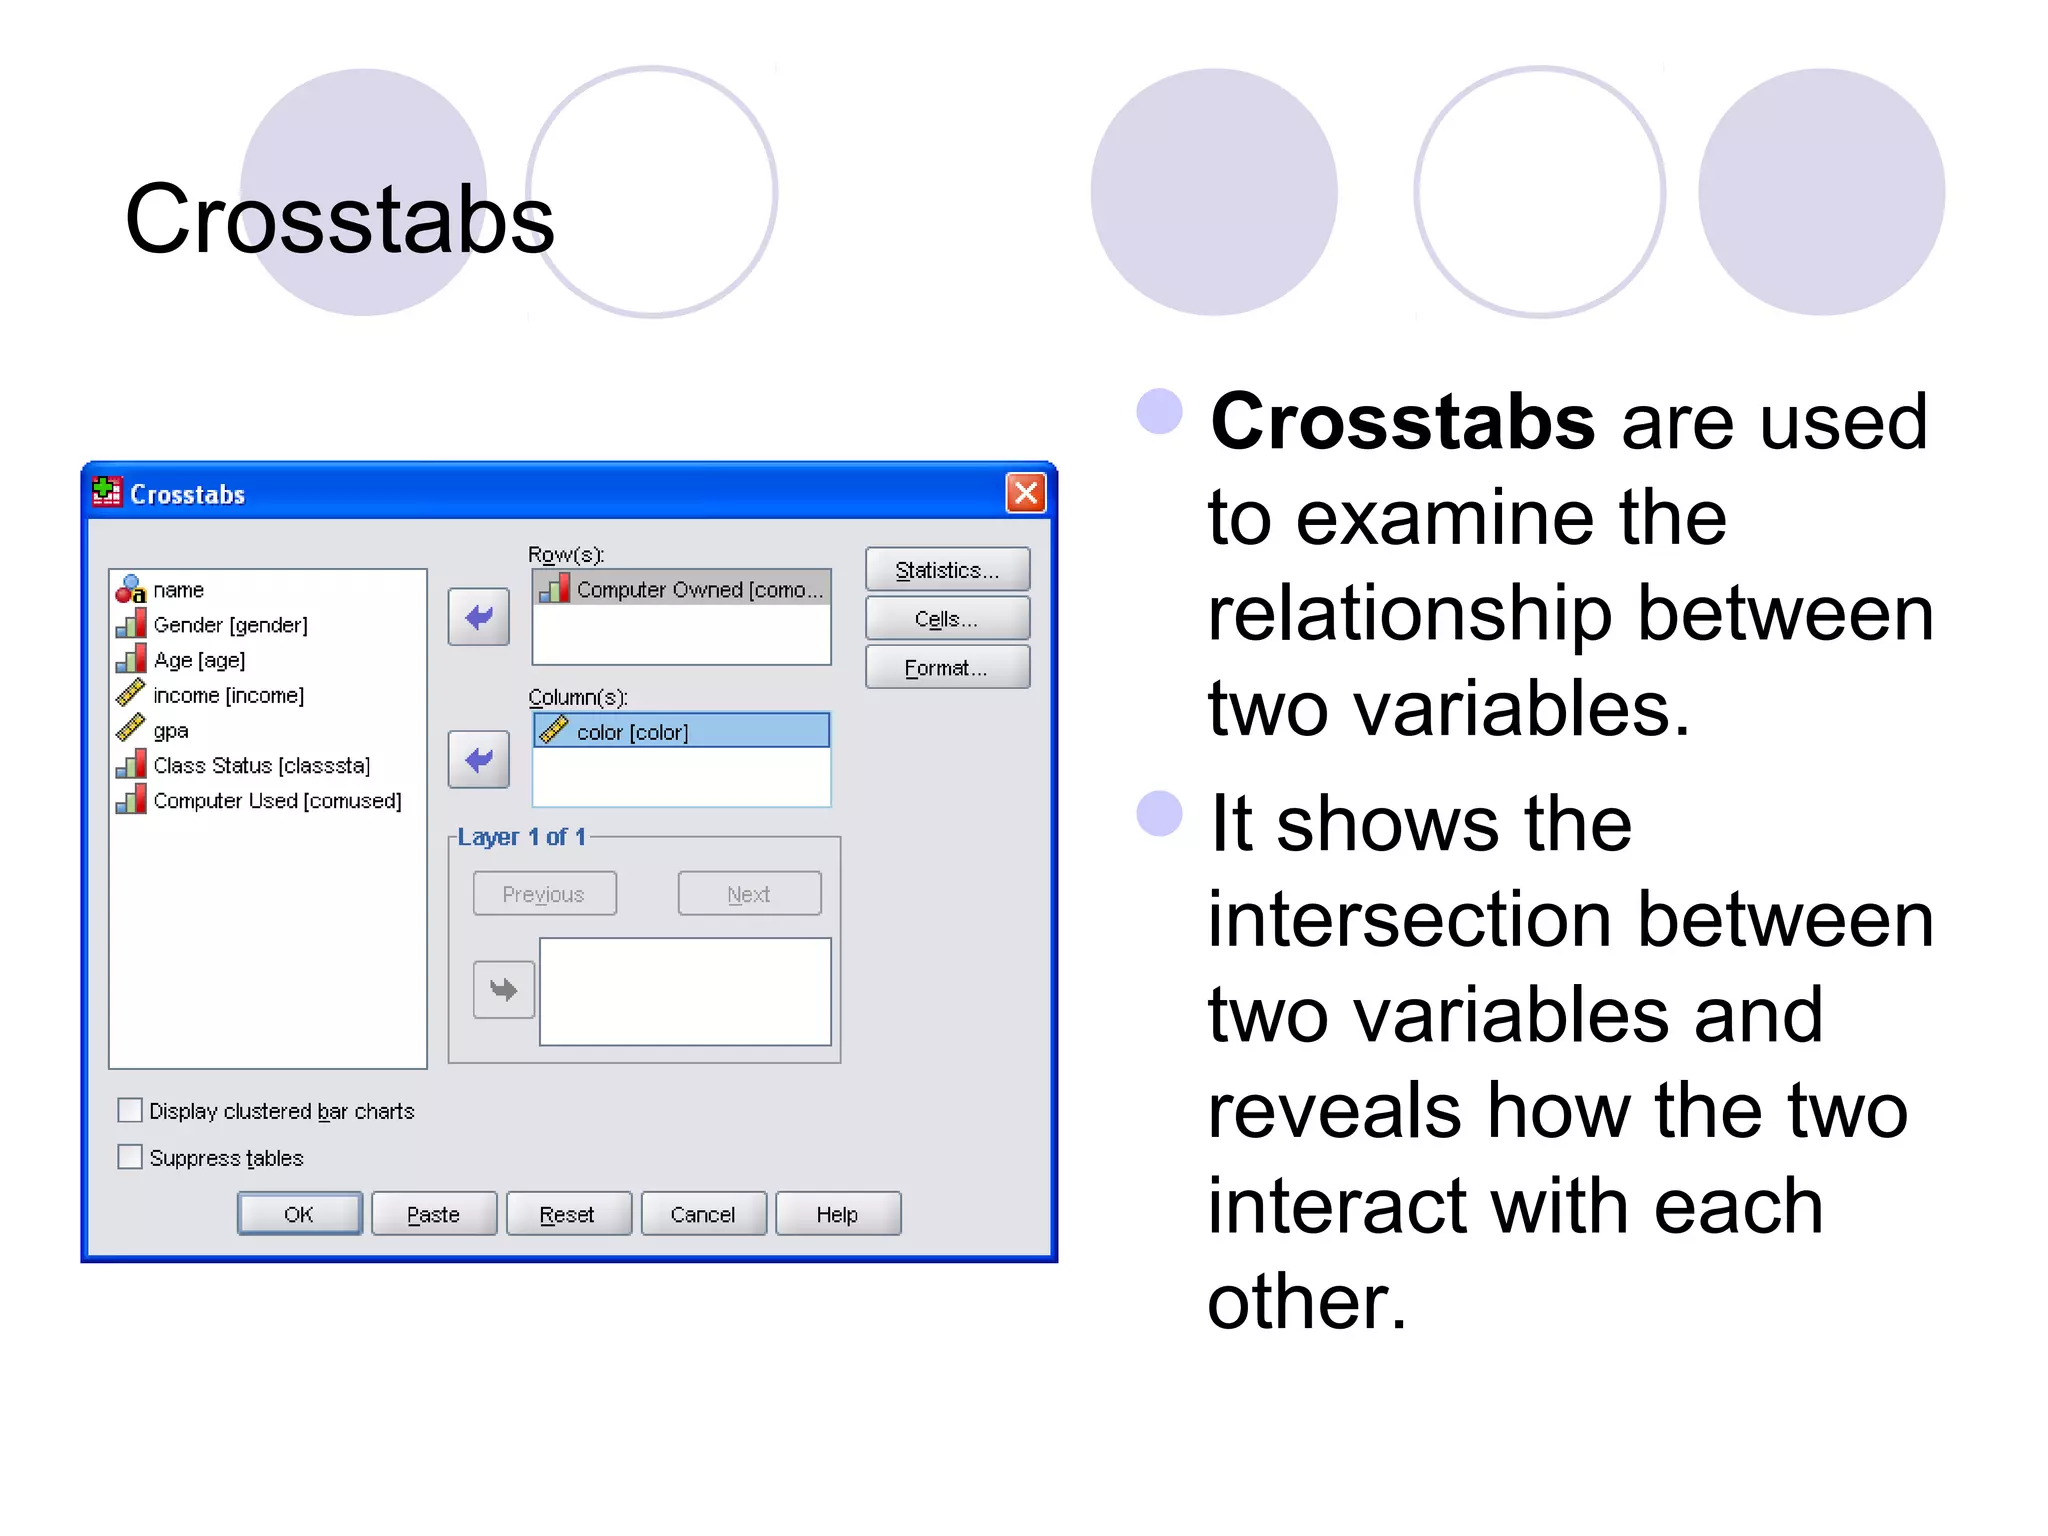
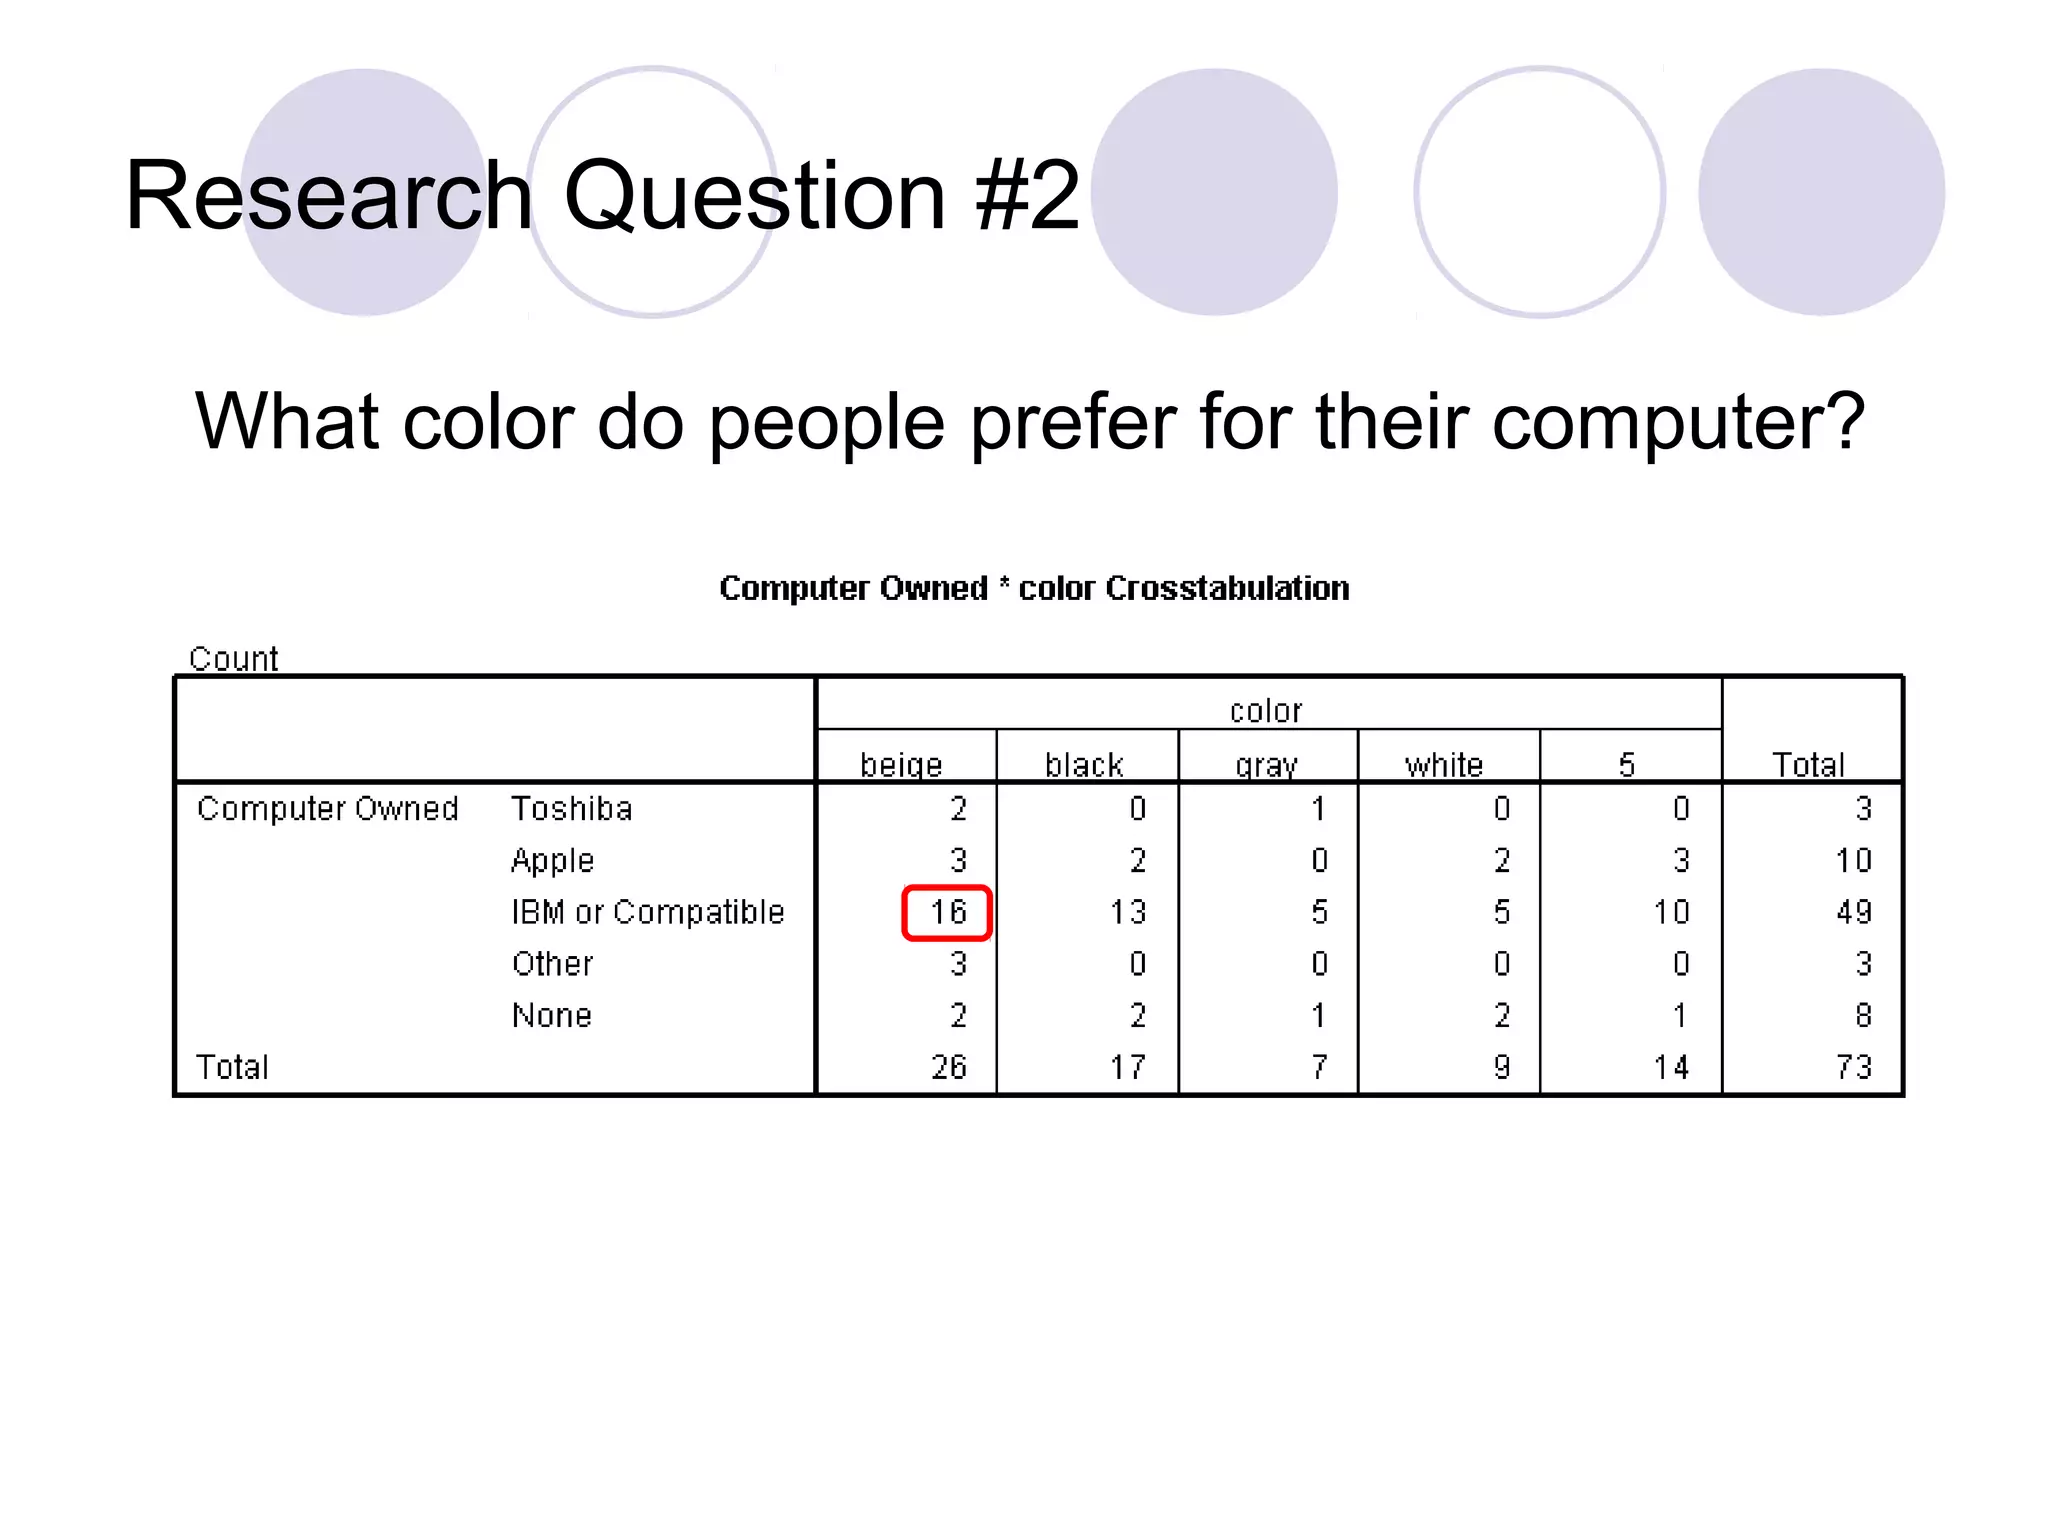
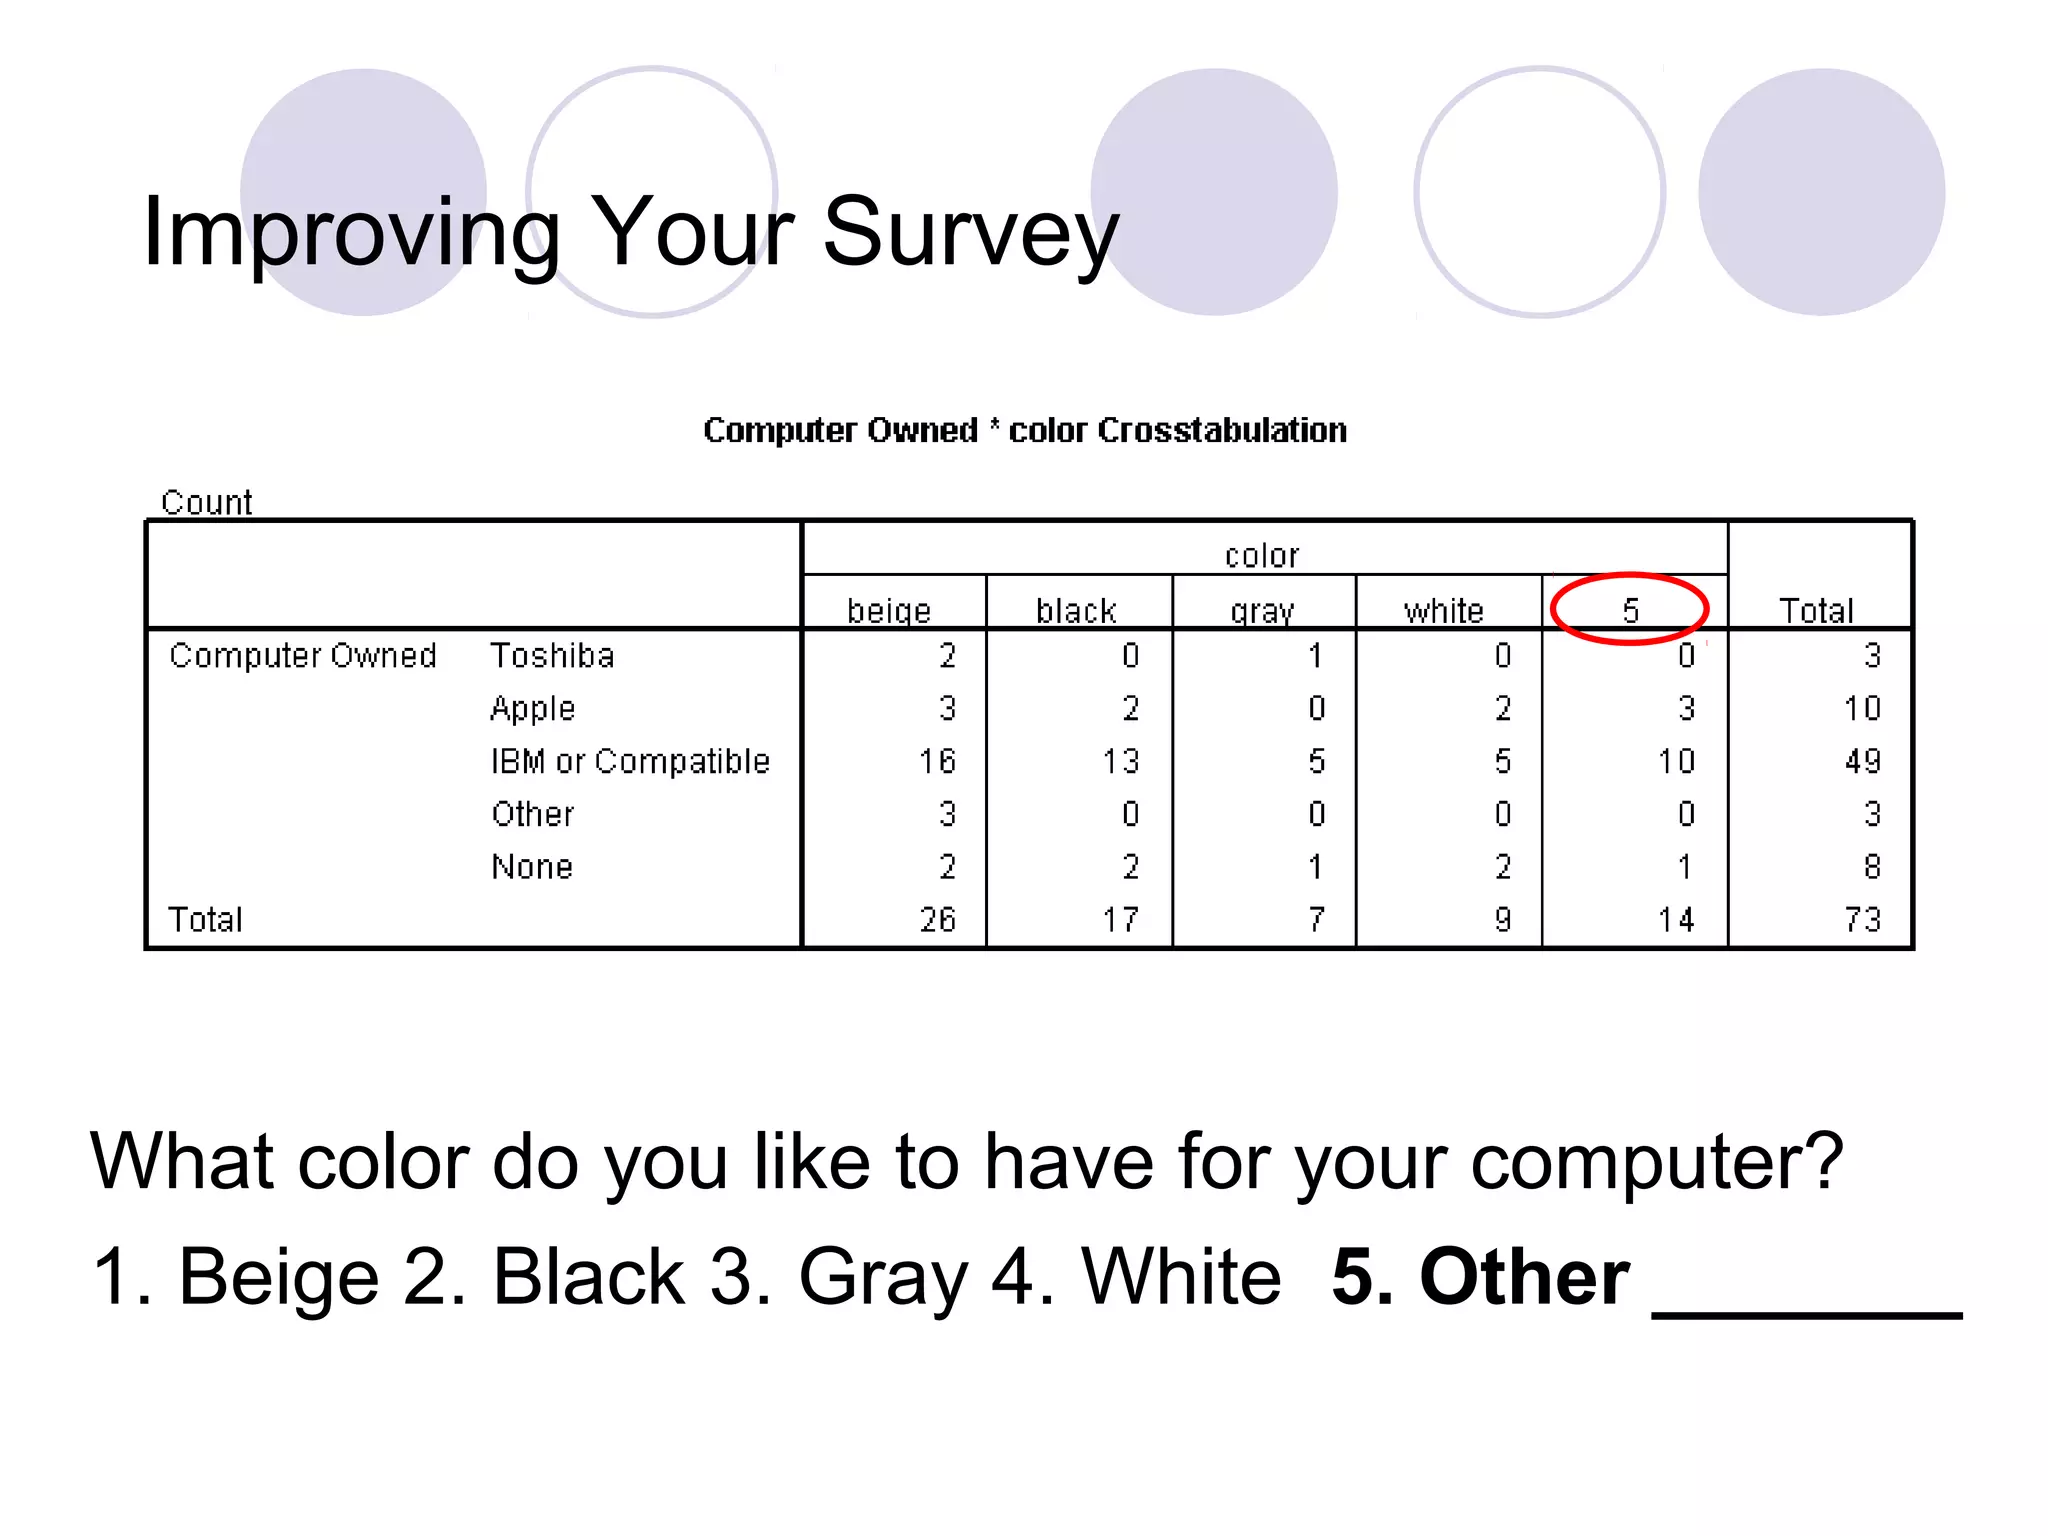
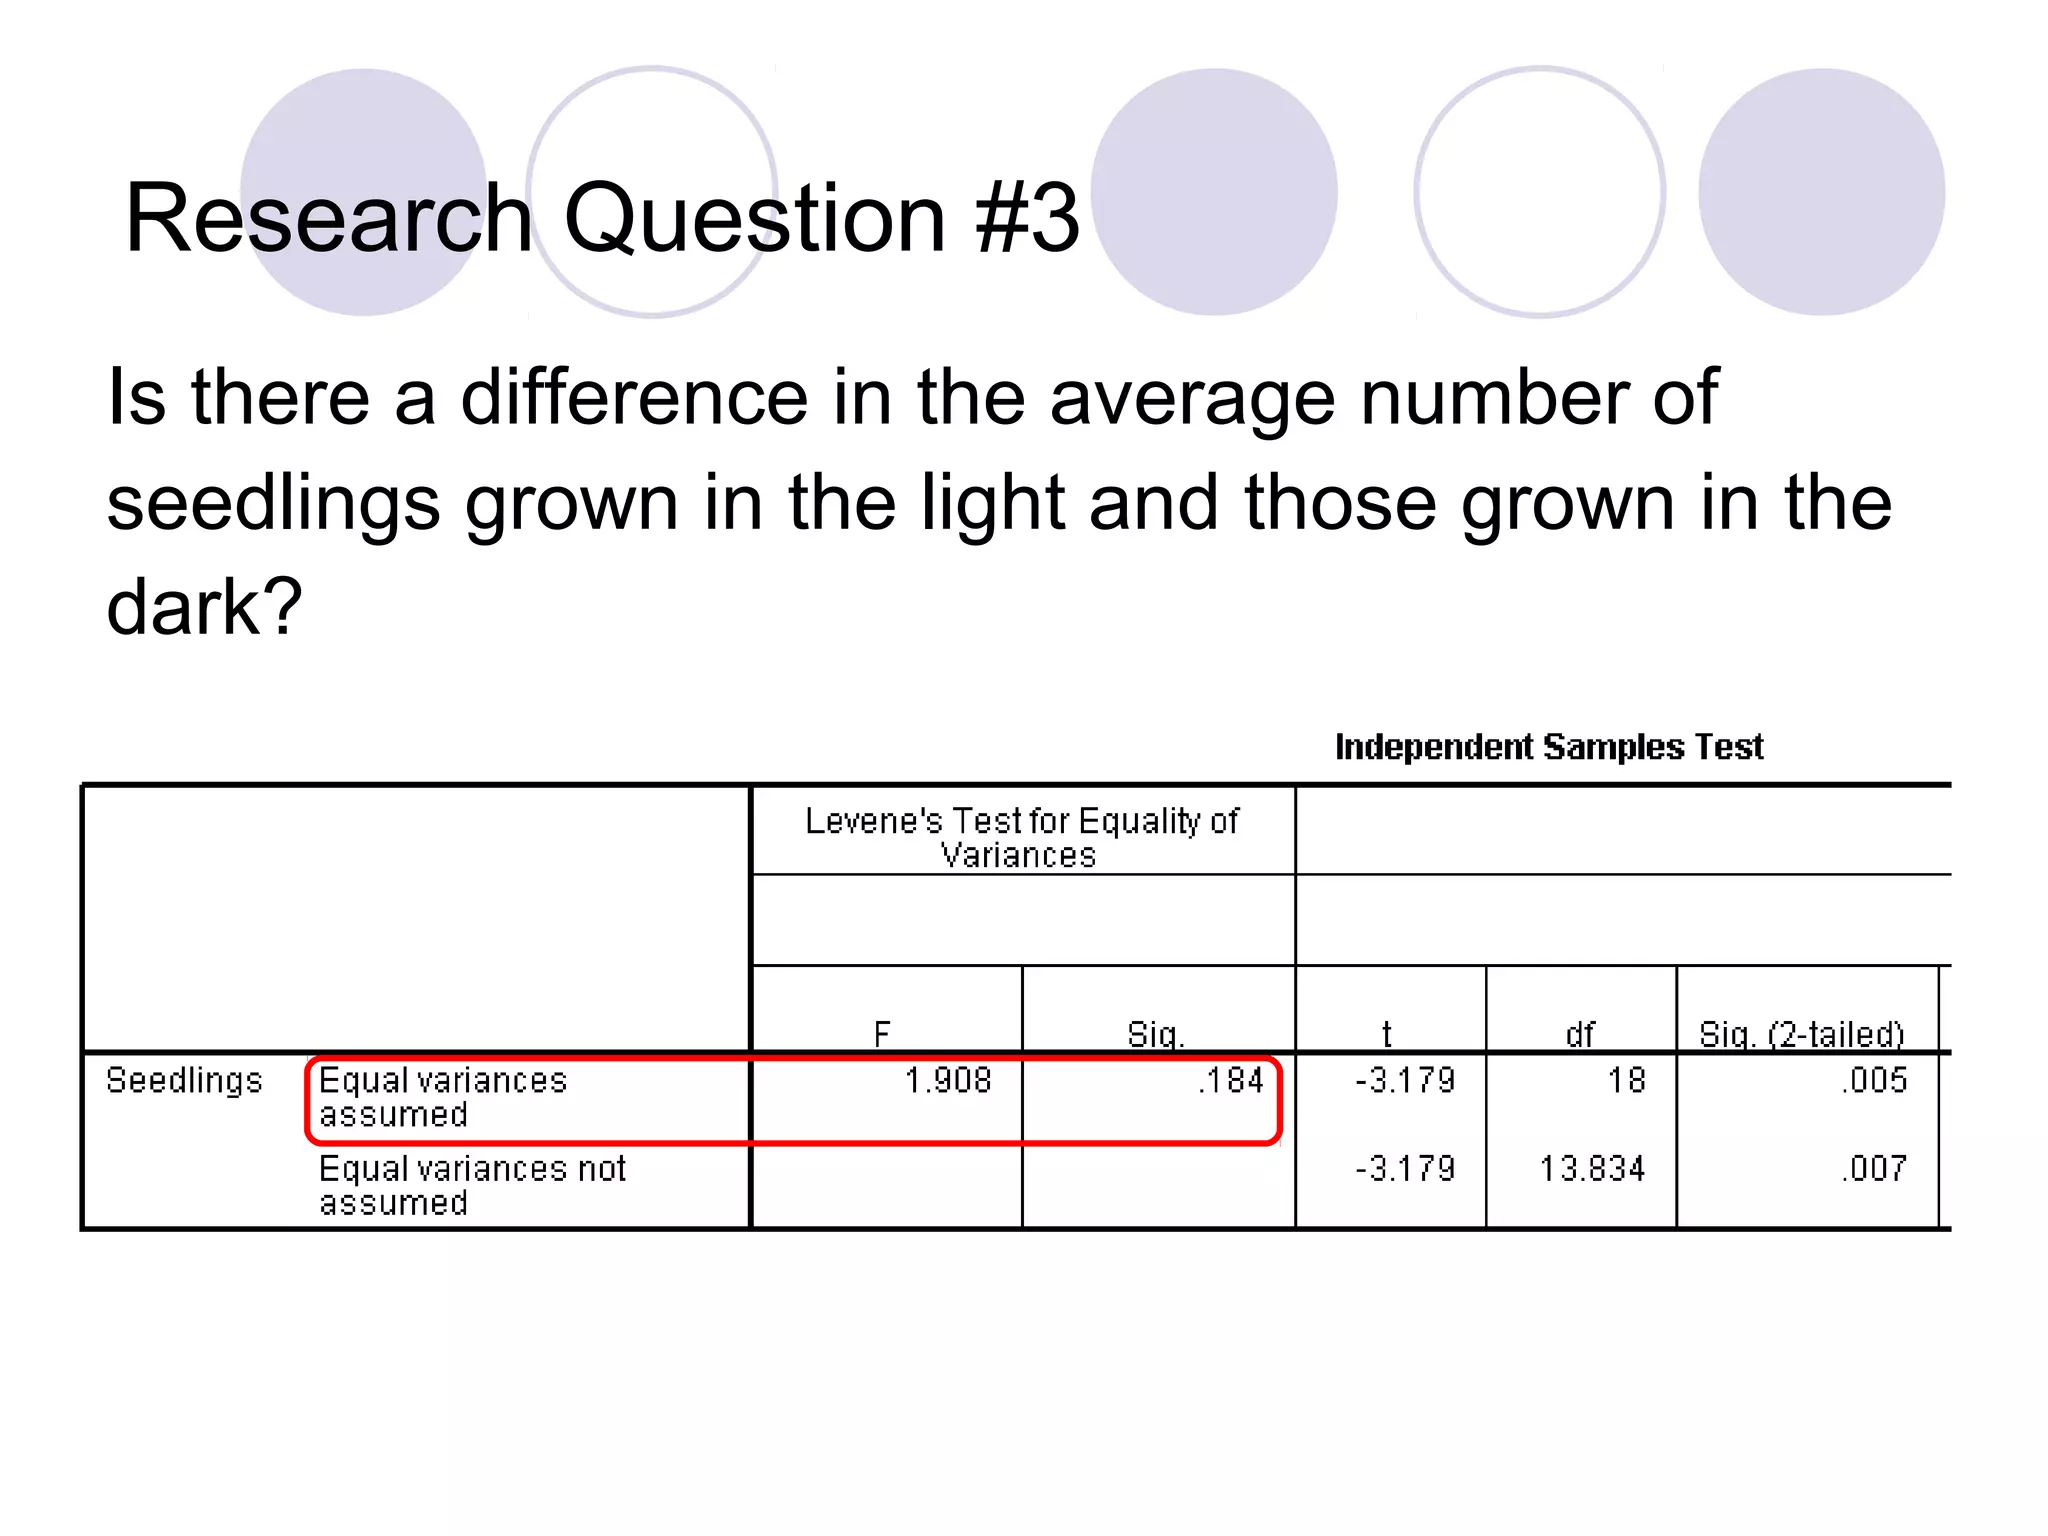
Frequency analysis and crosstabs for examining variable relationships and improving survey questions.
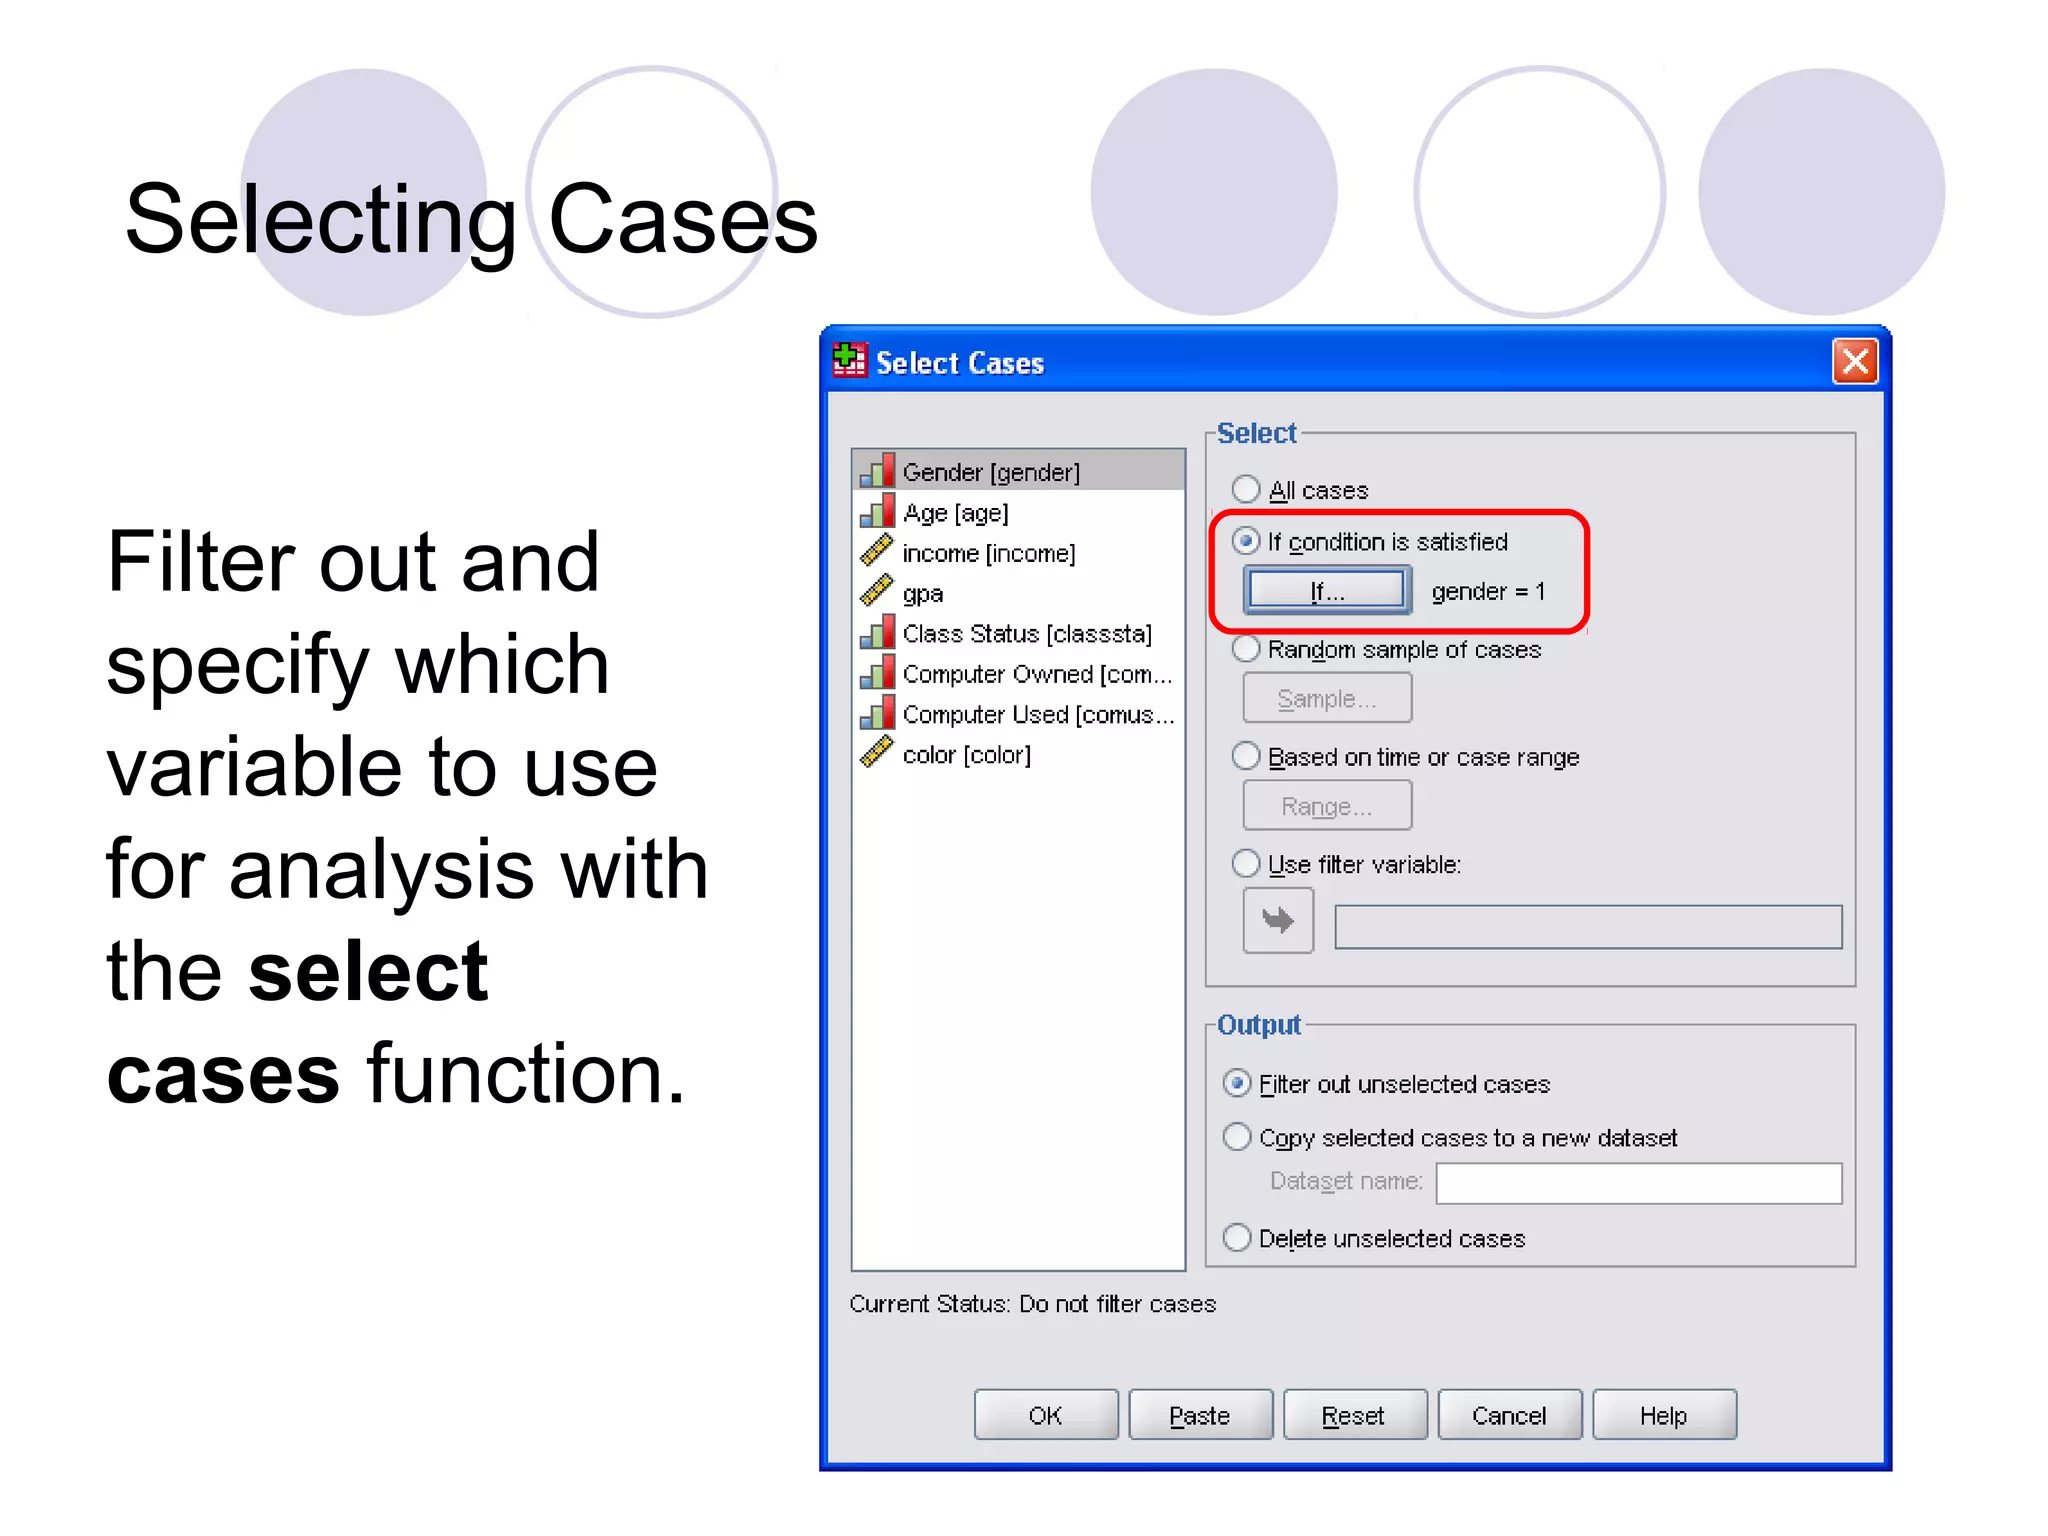
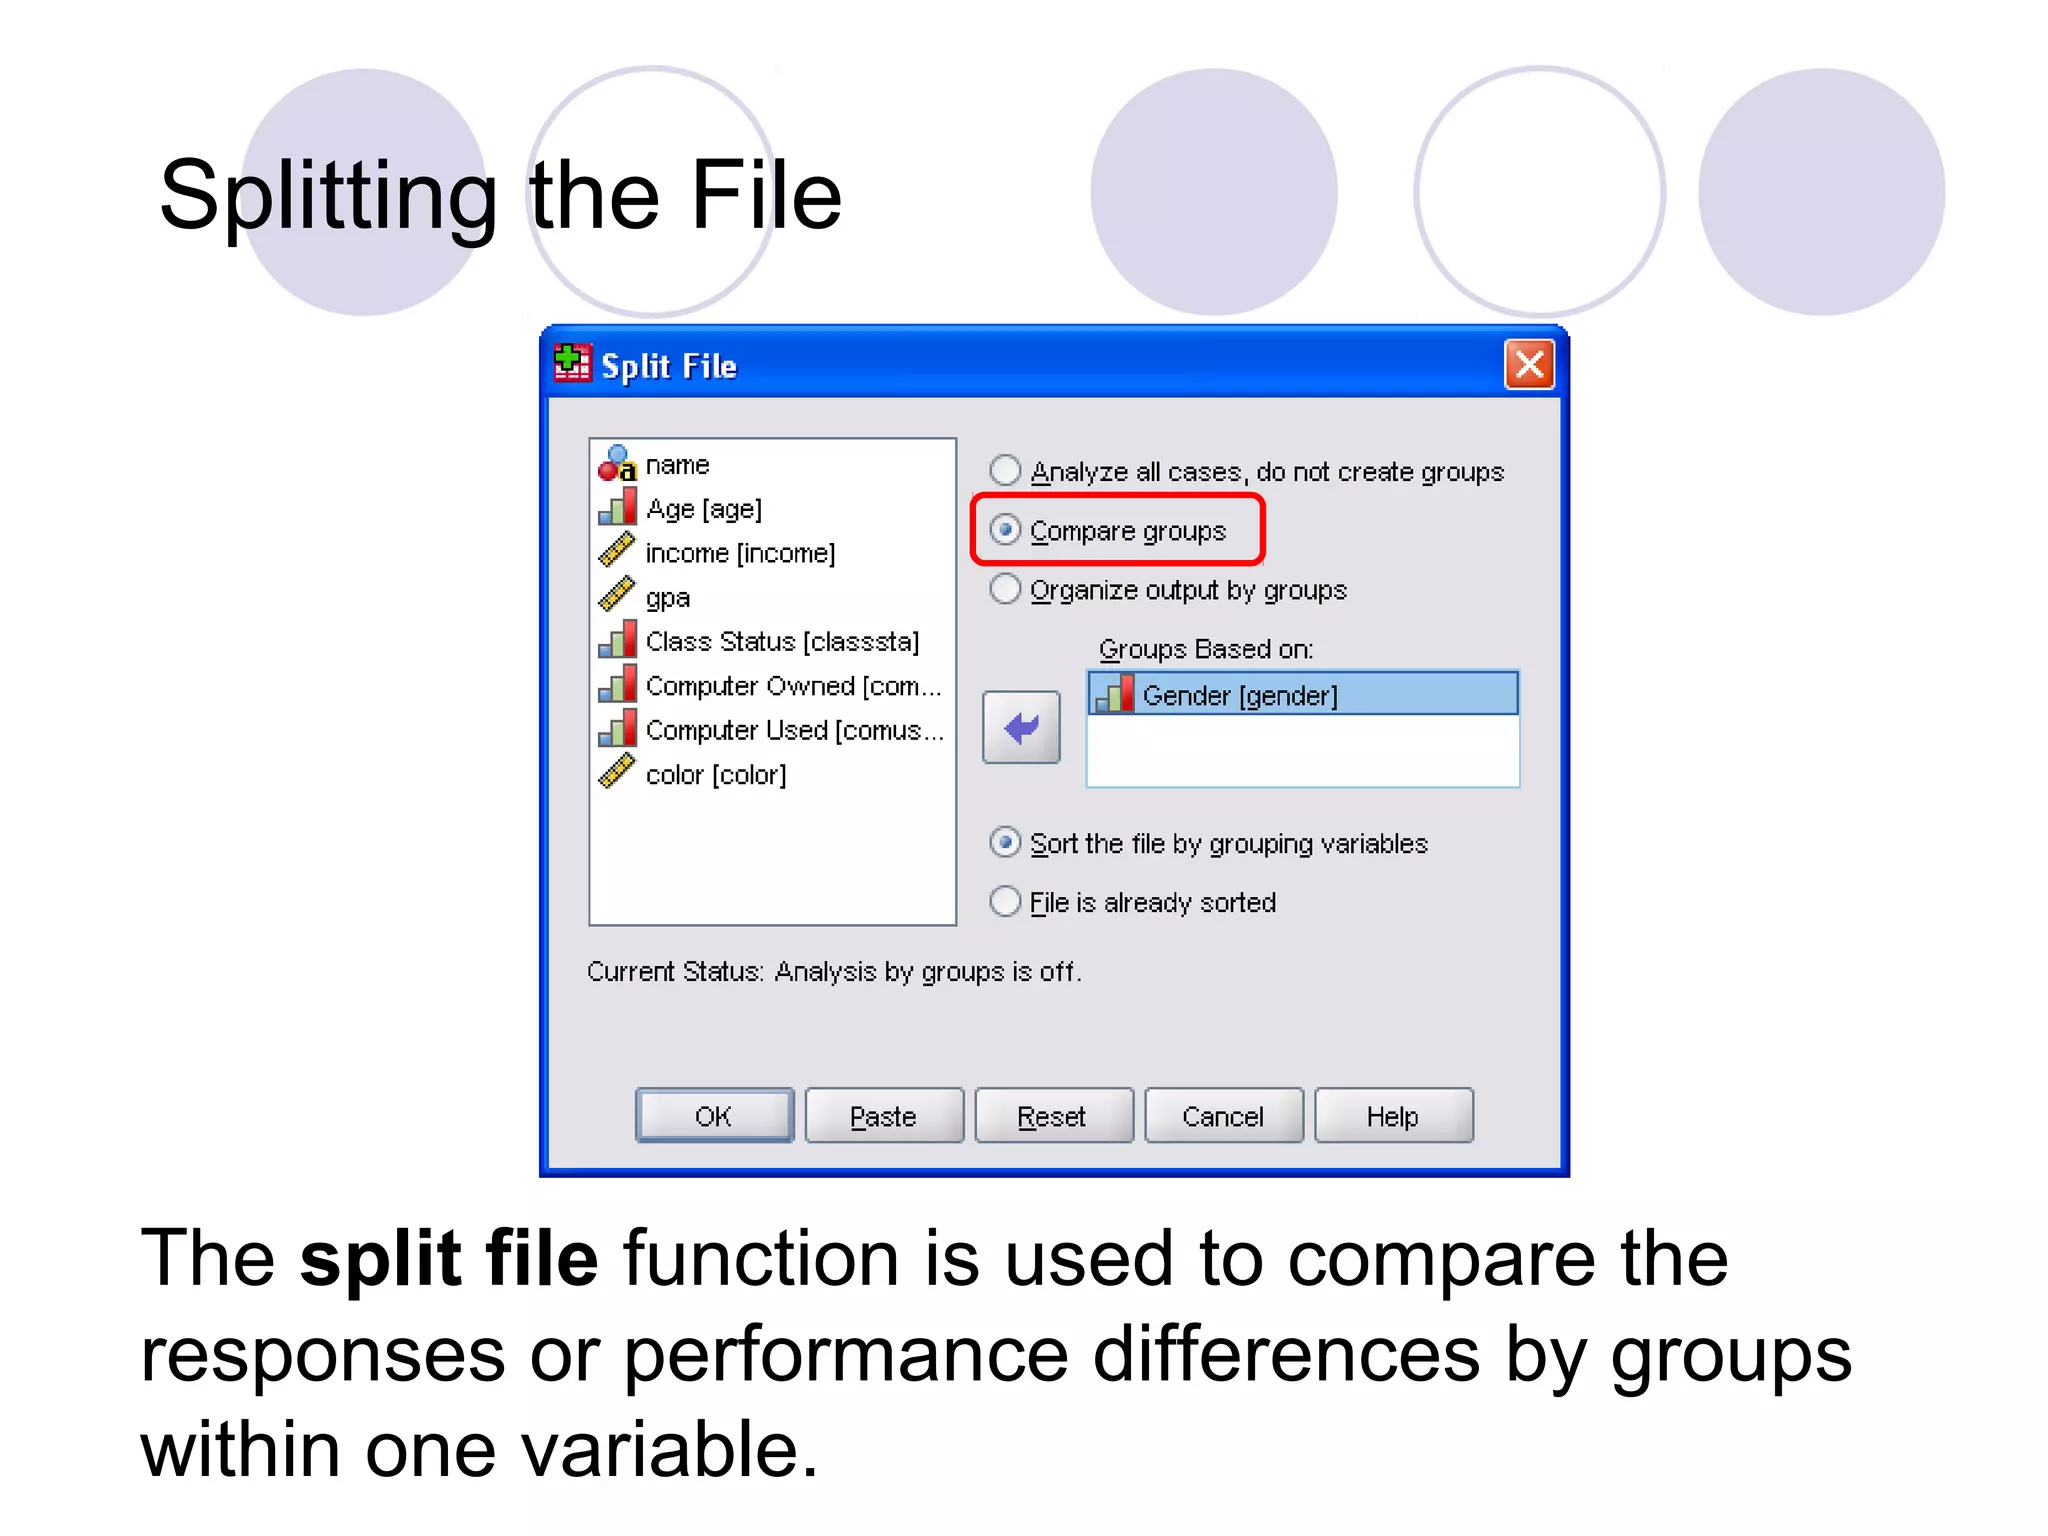
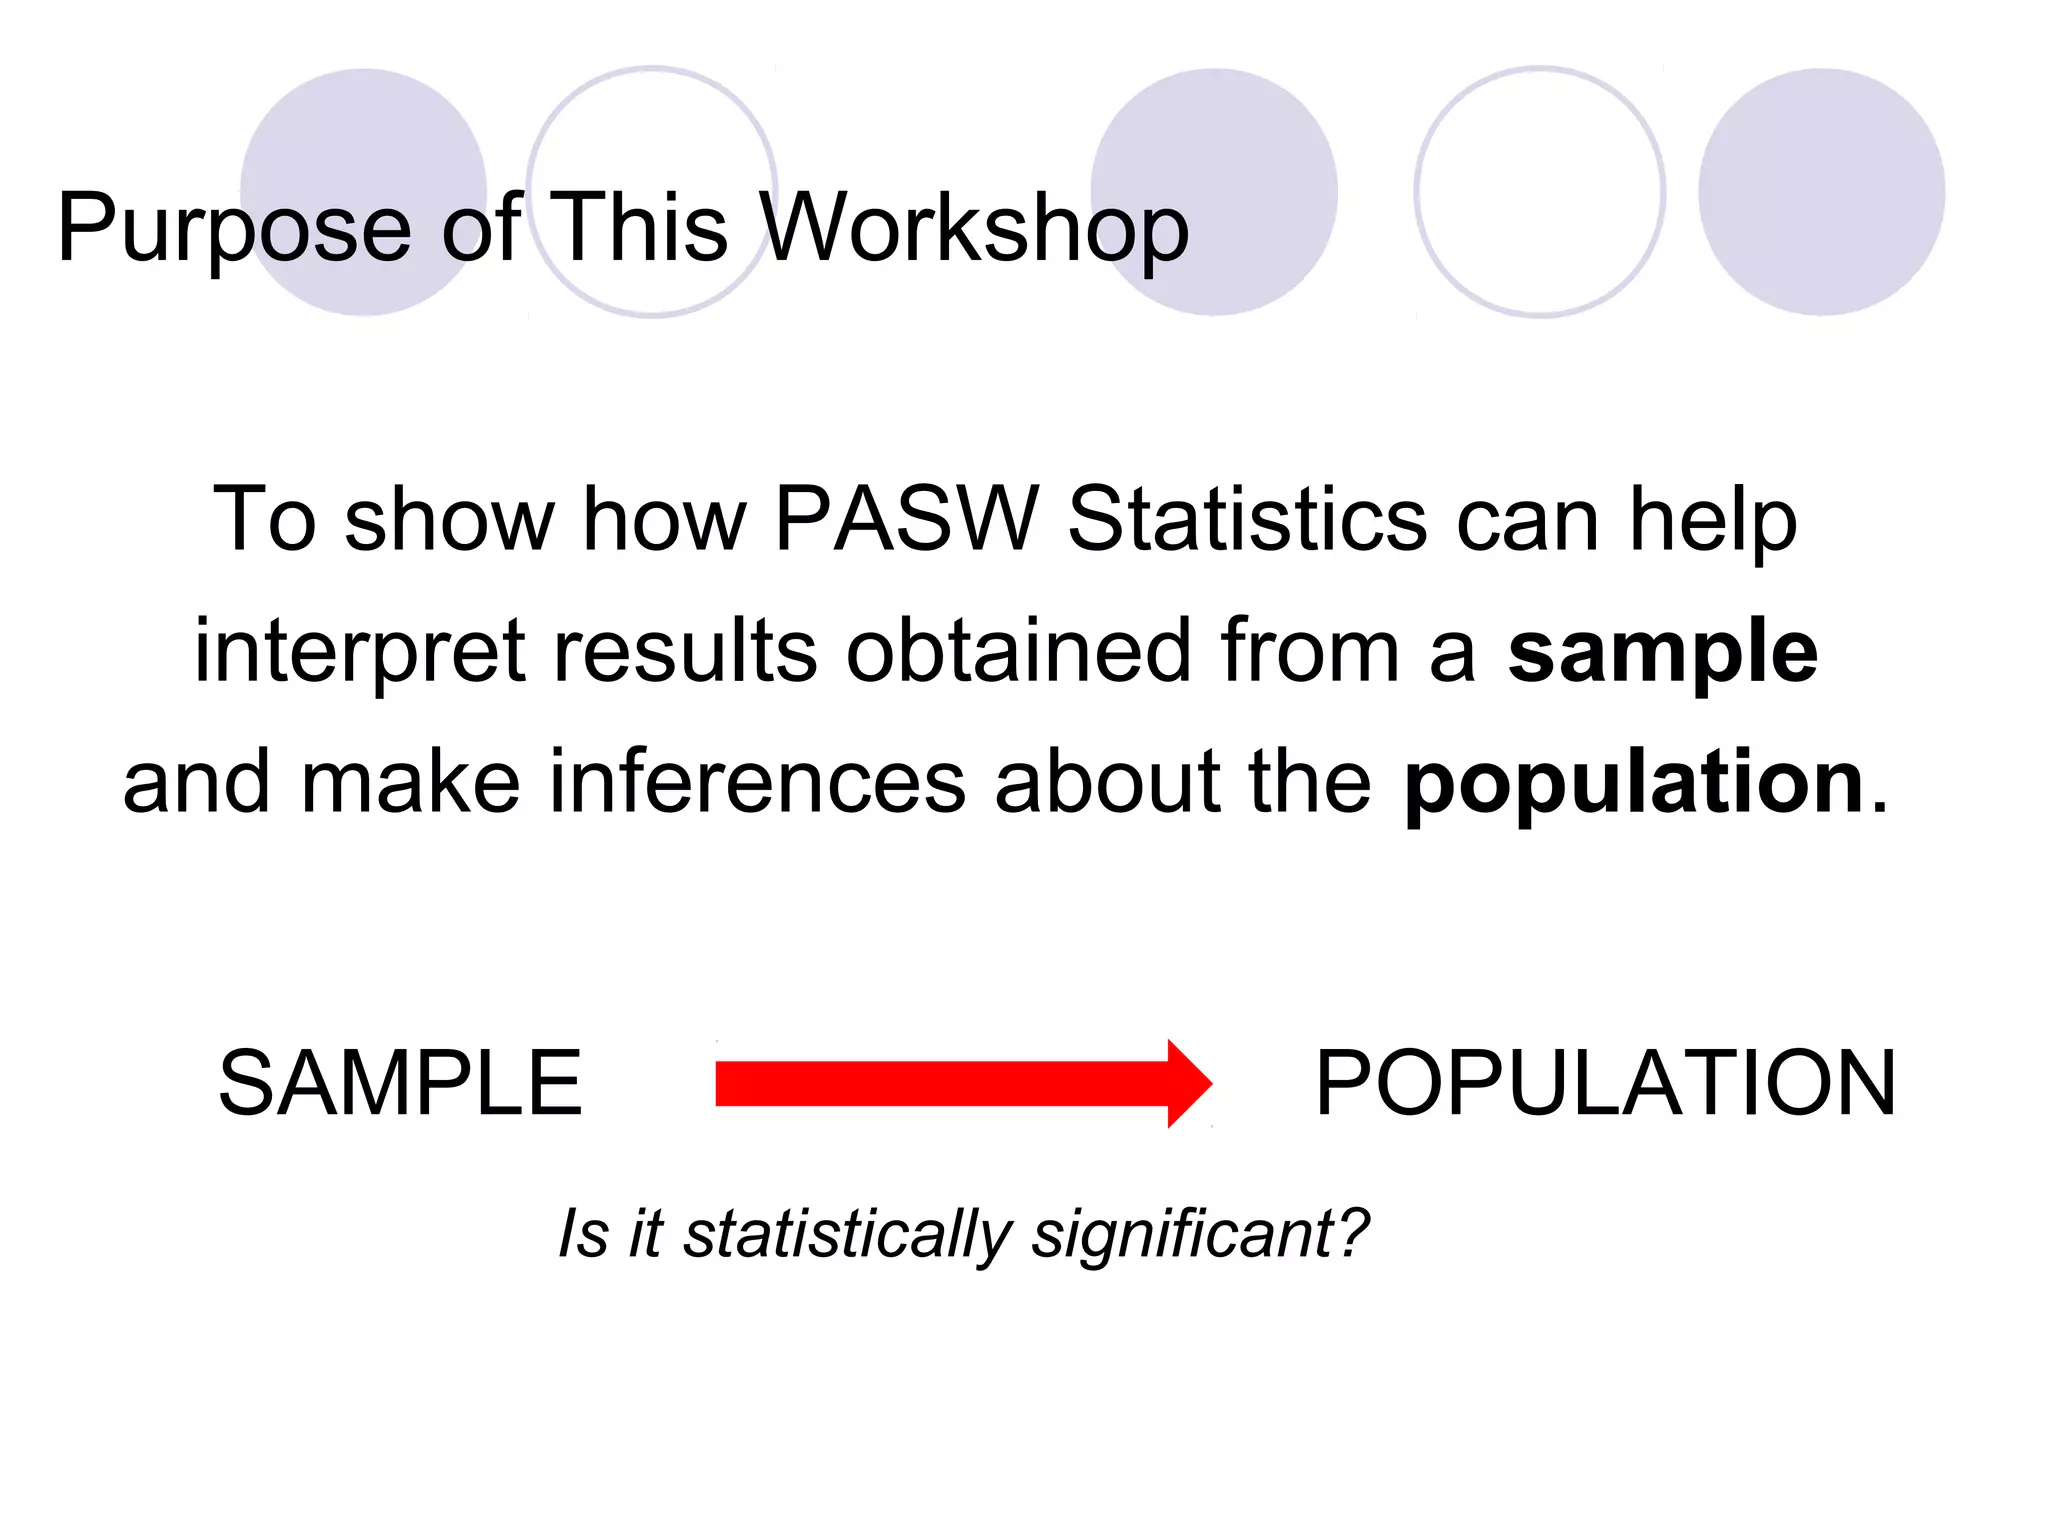
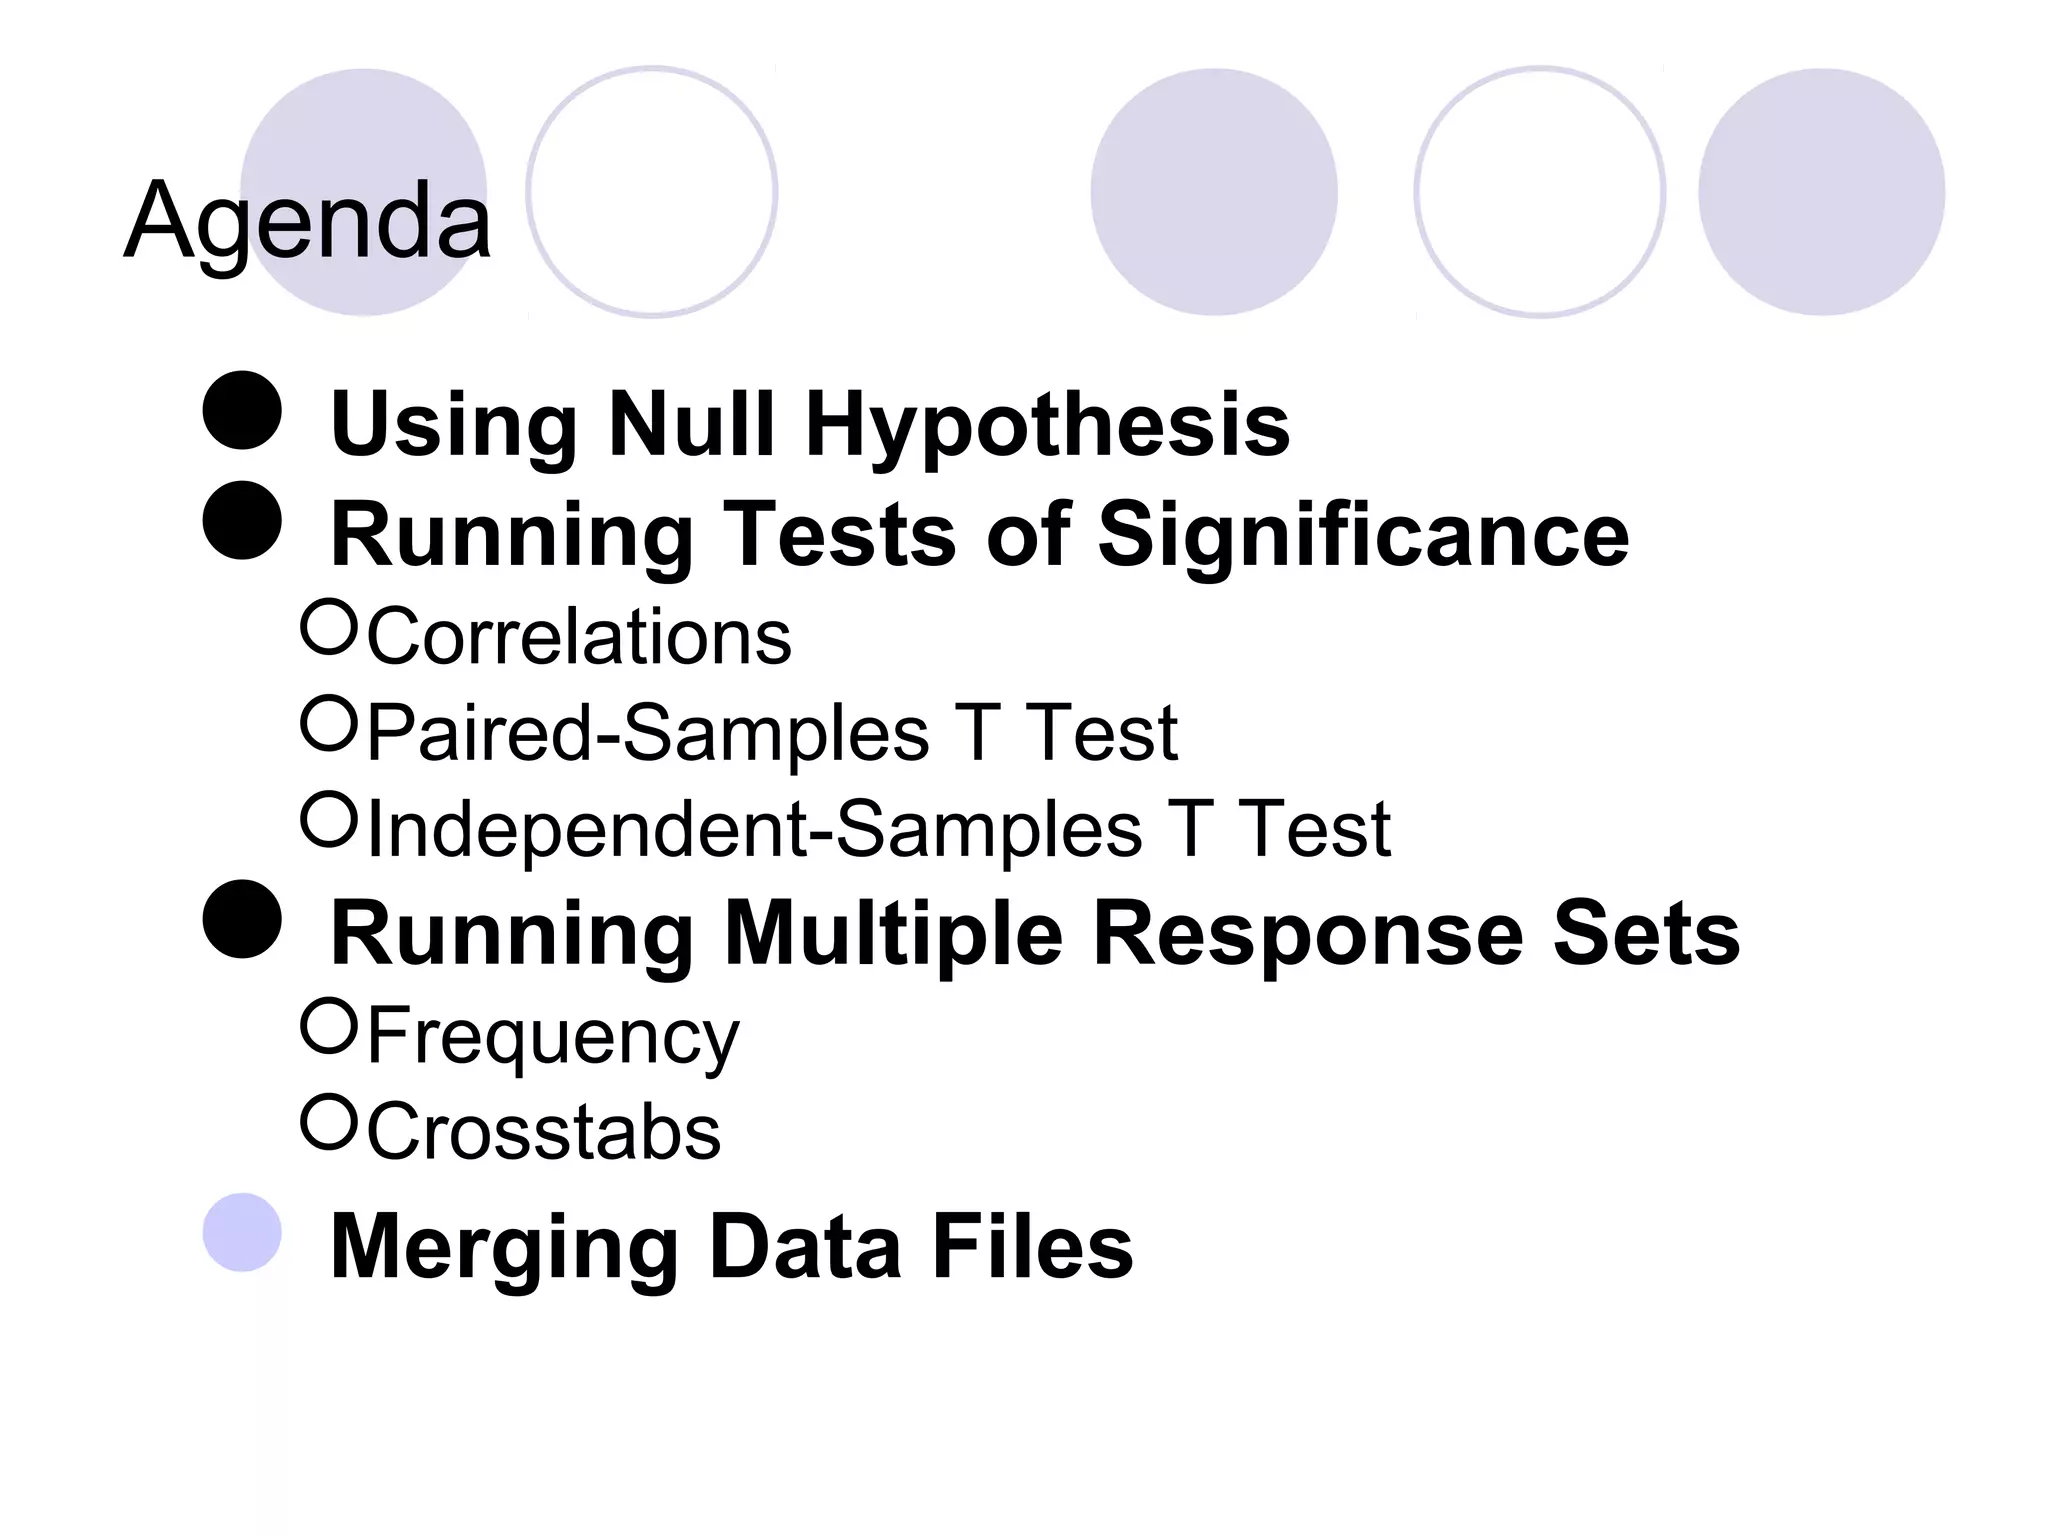
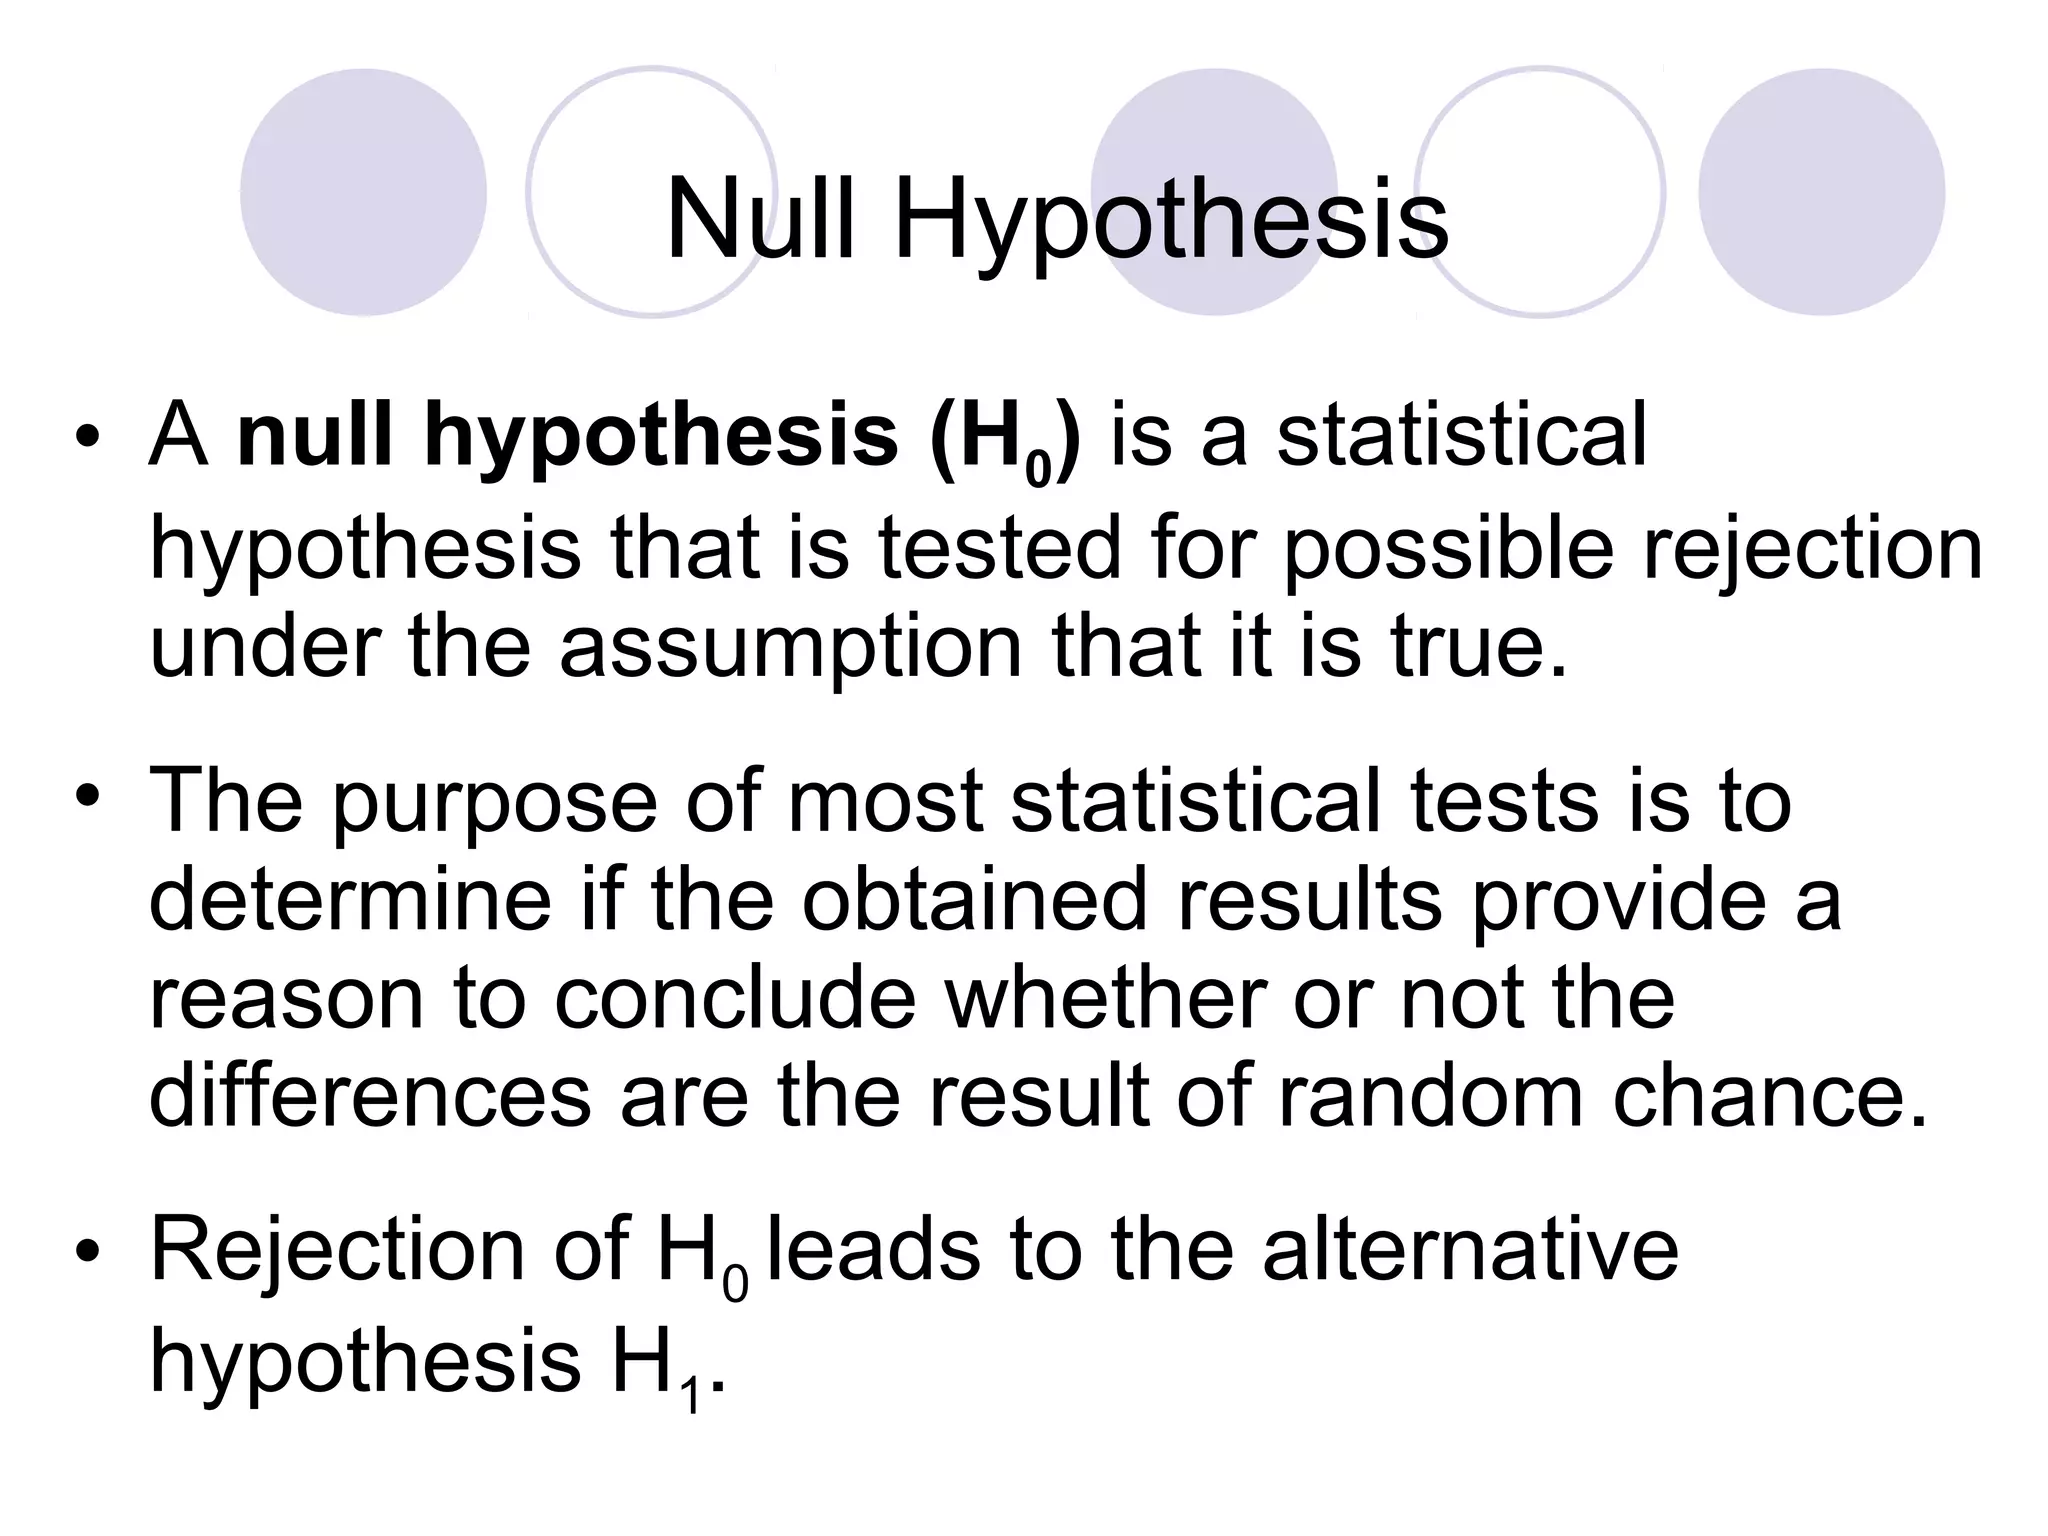
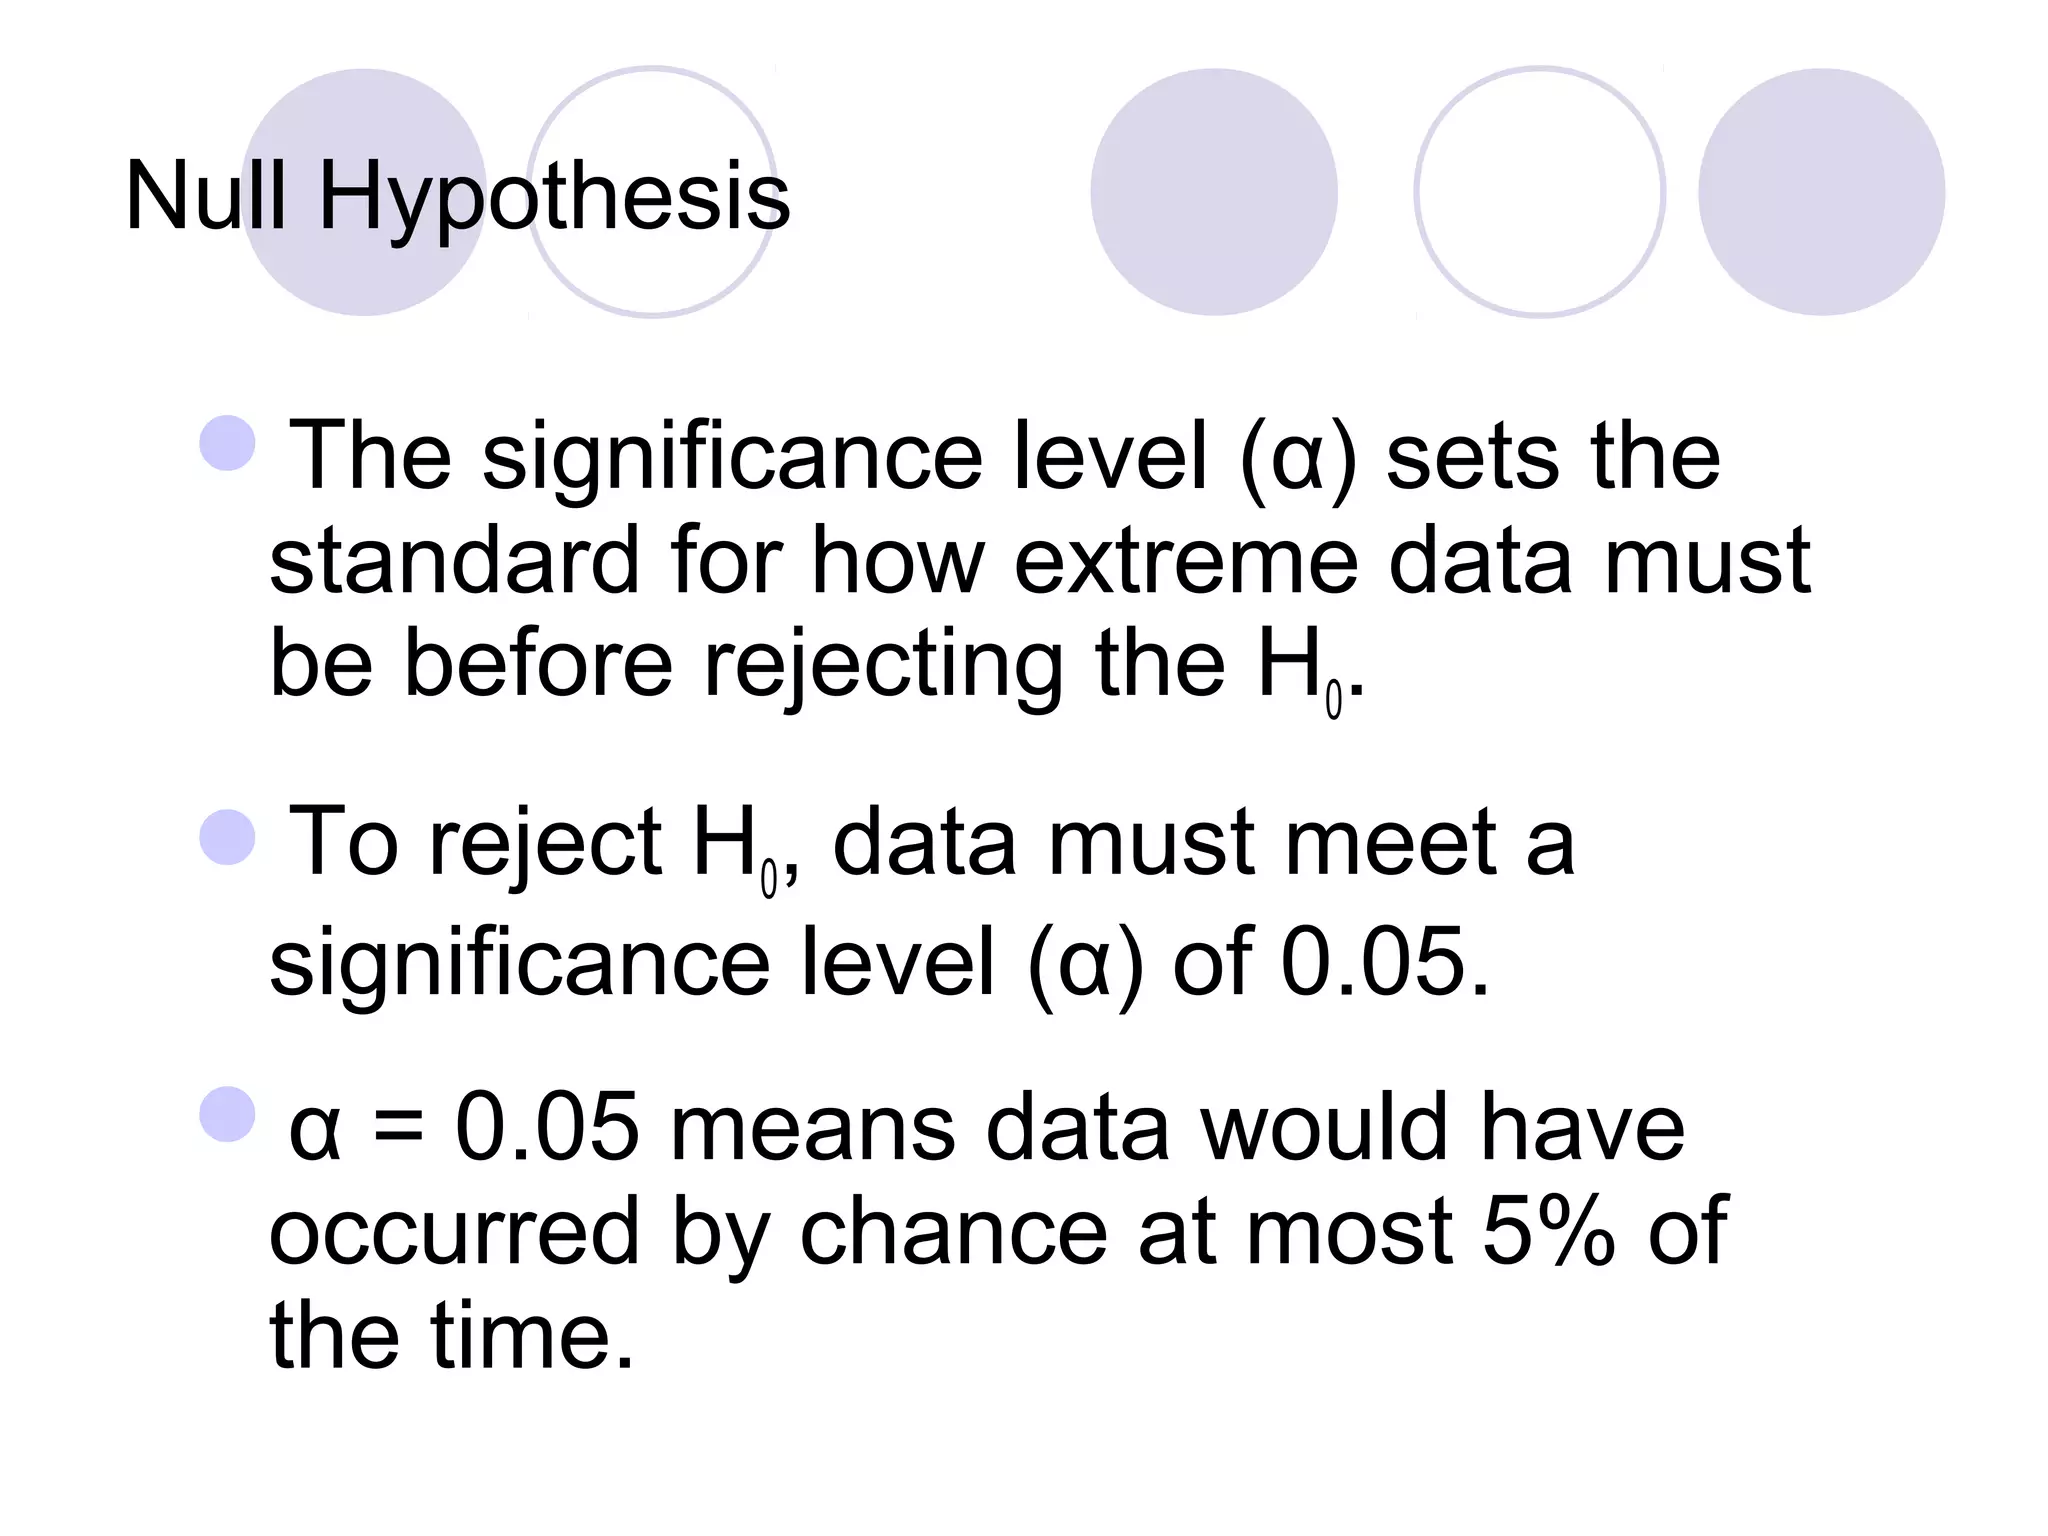
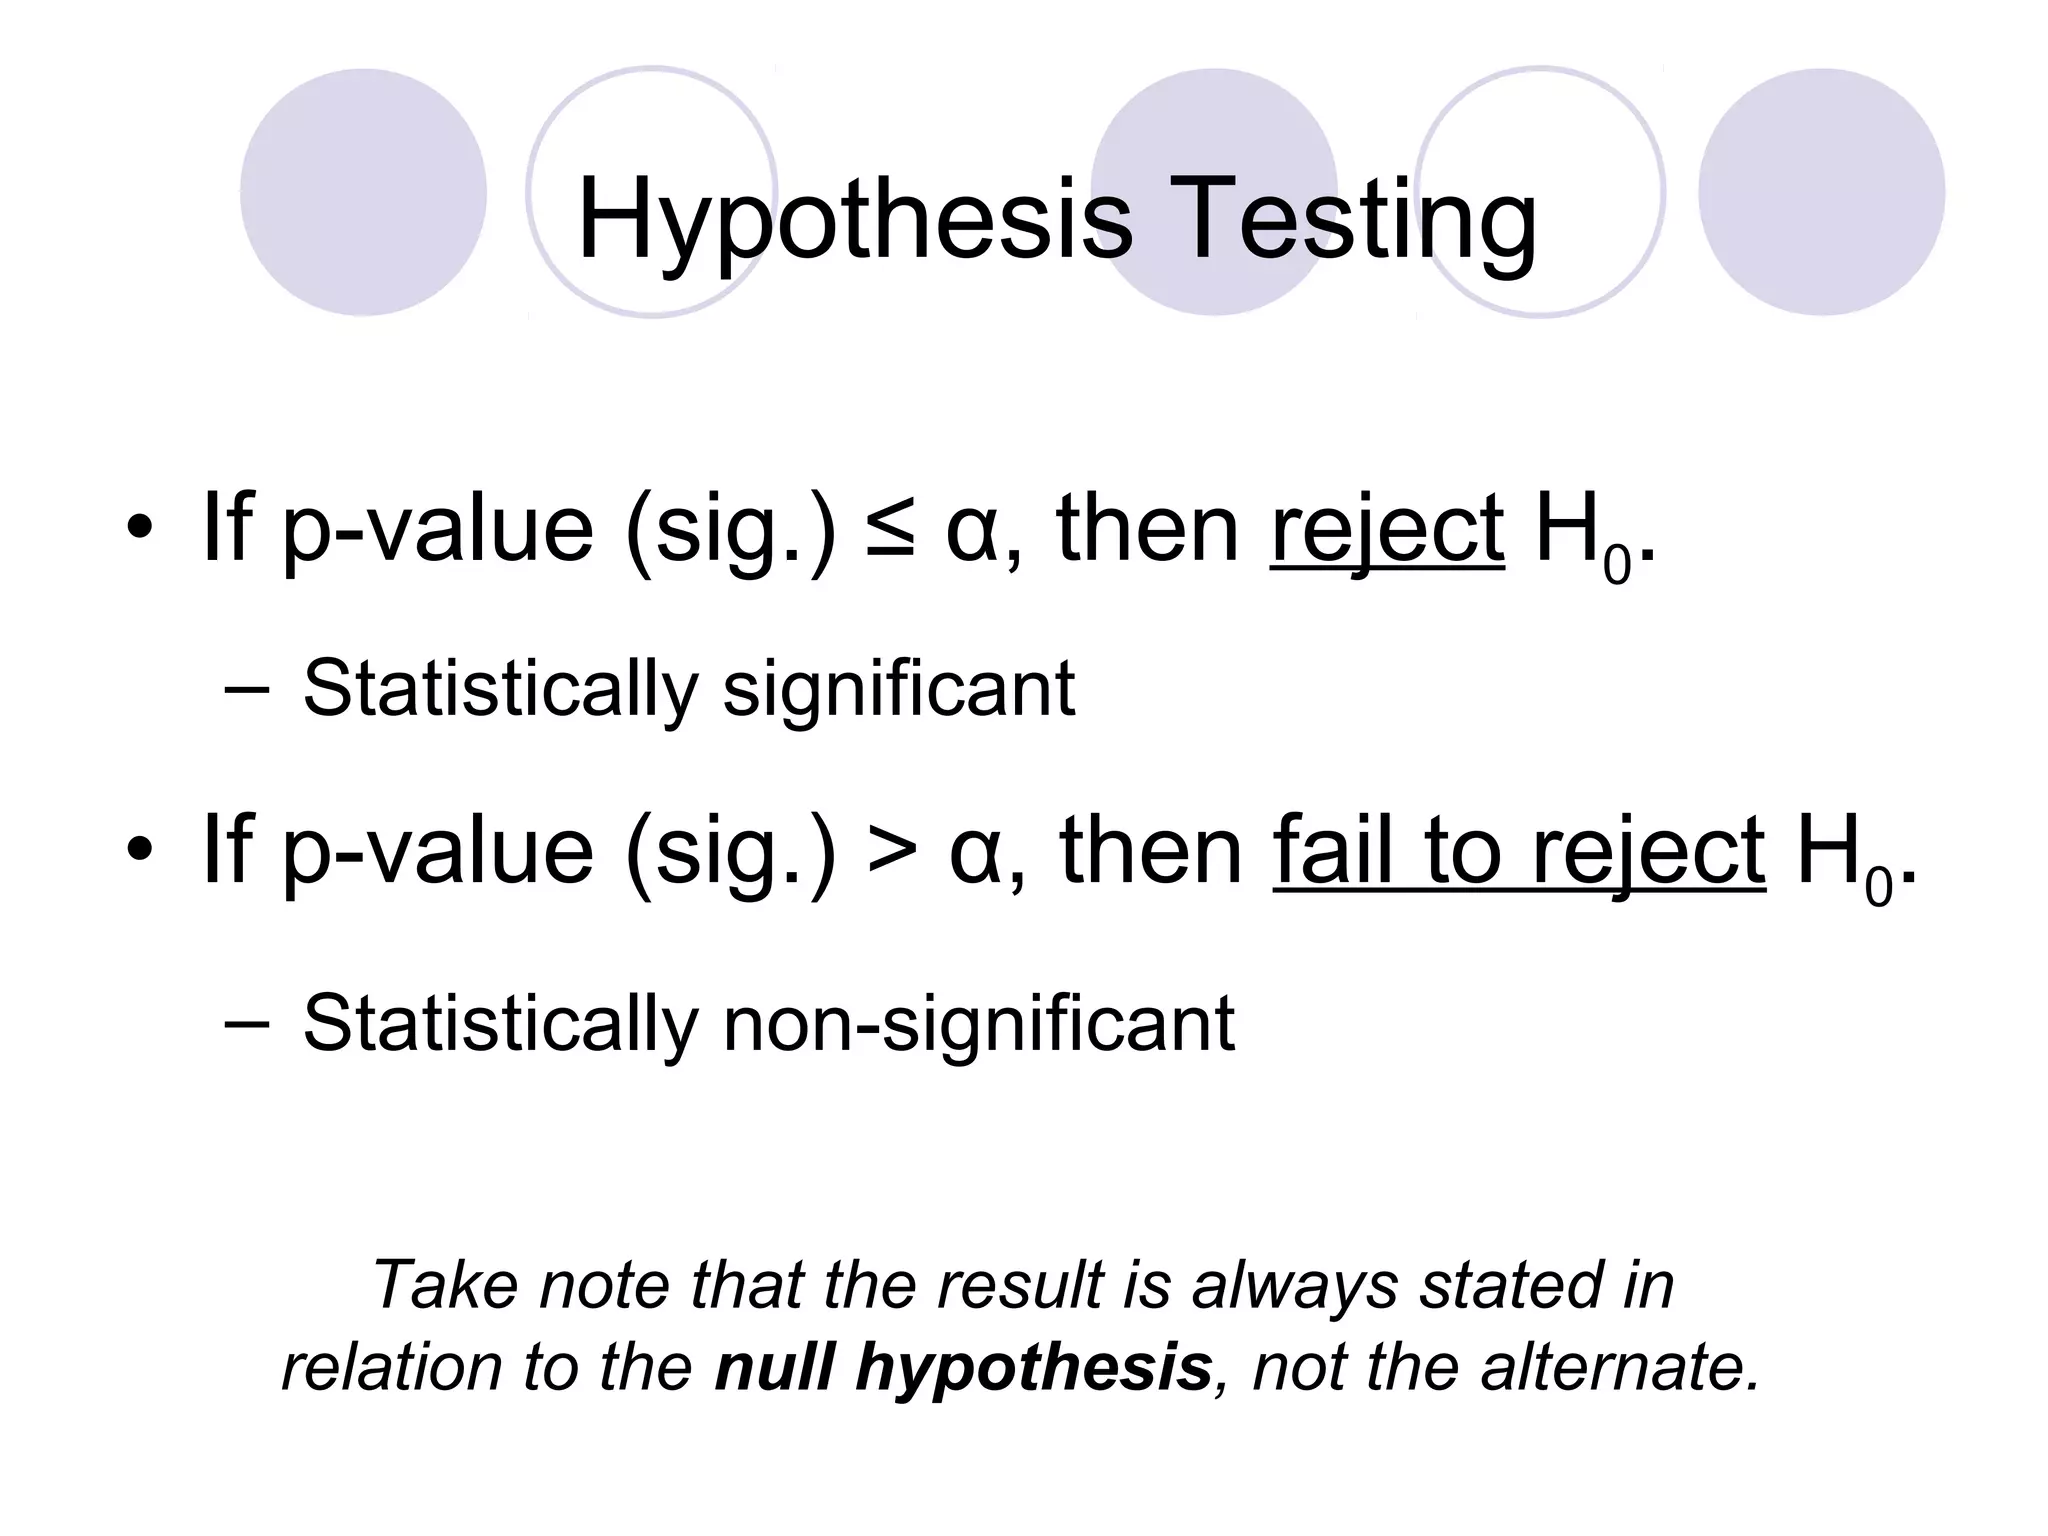
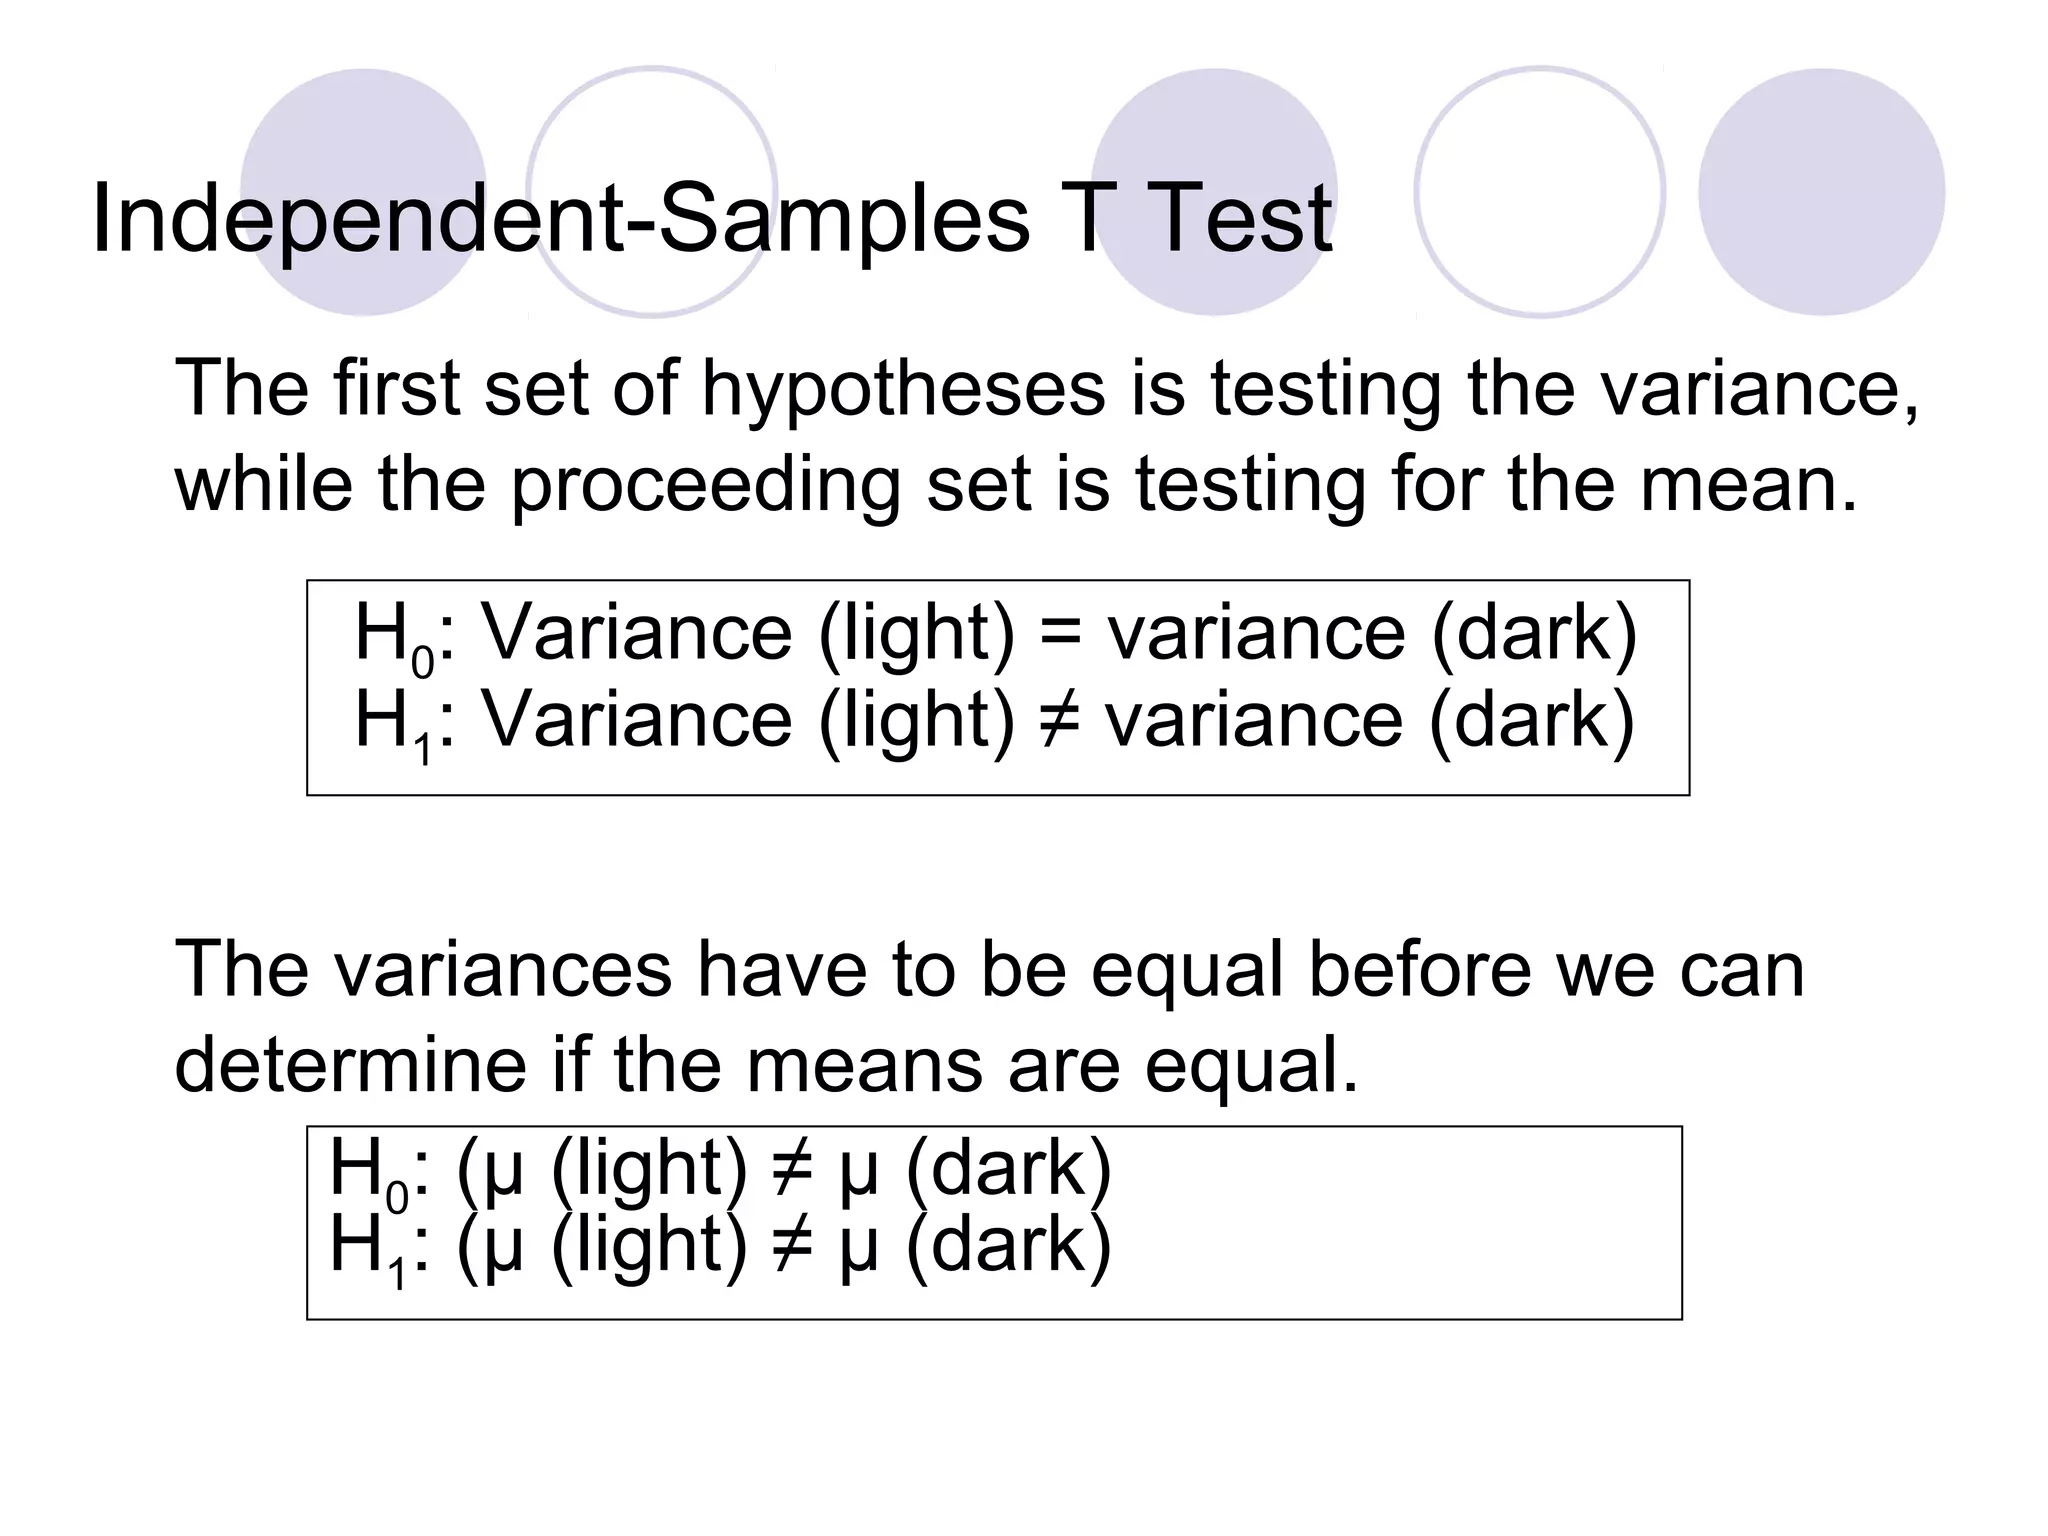
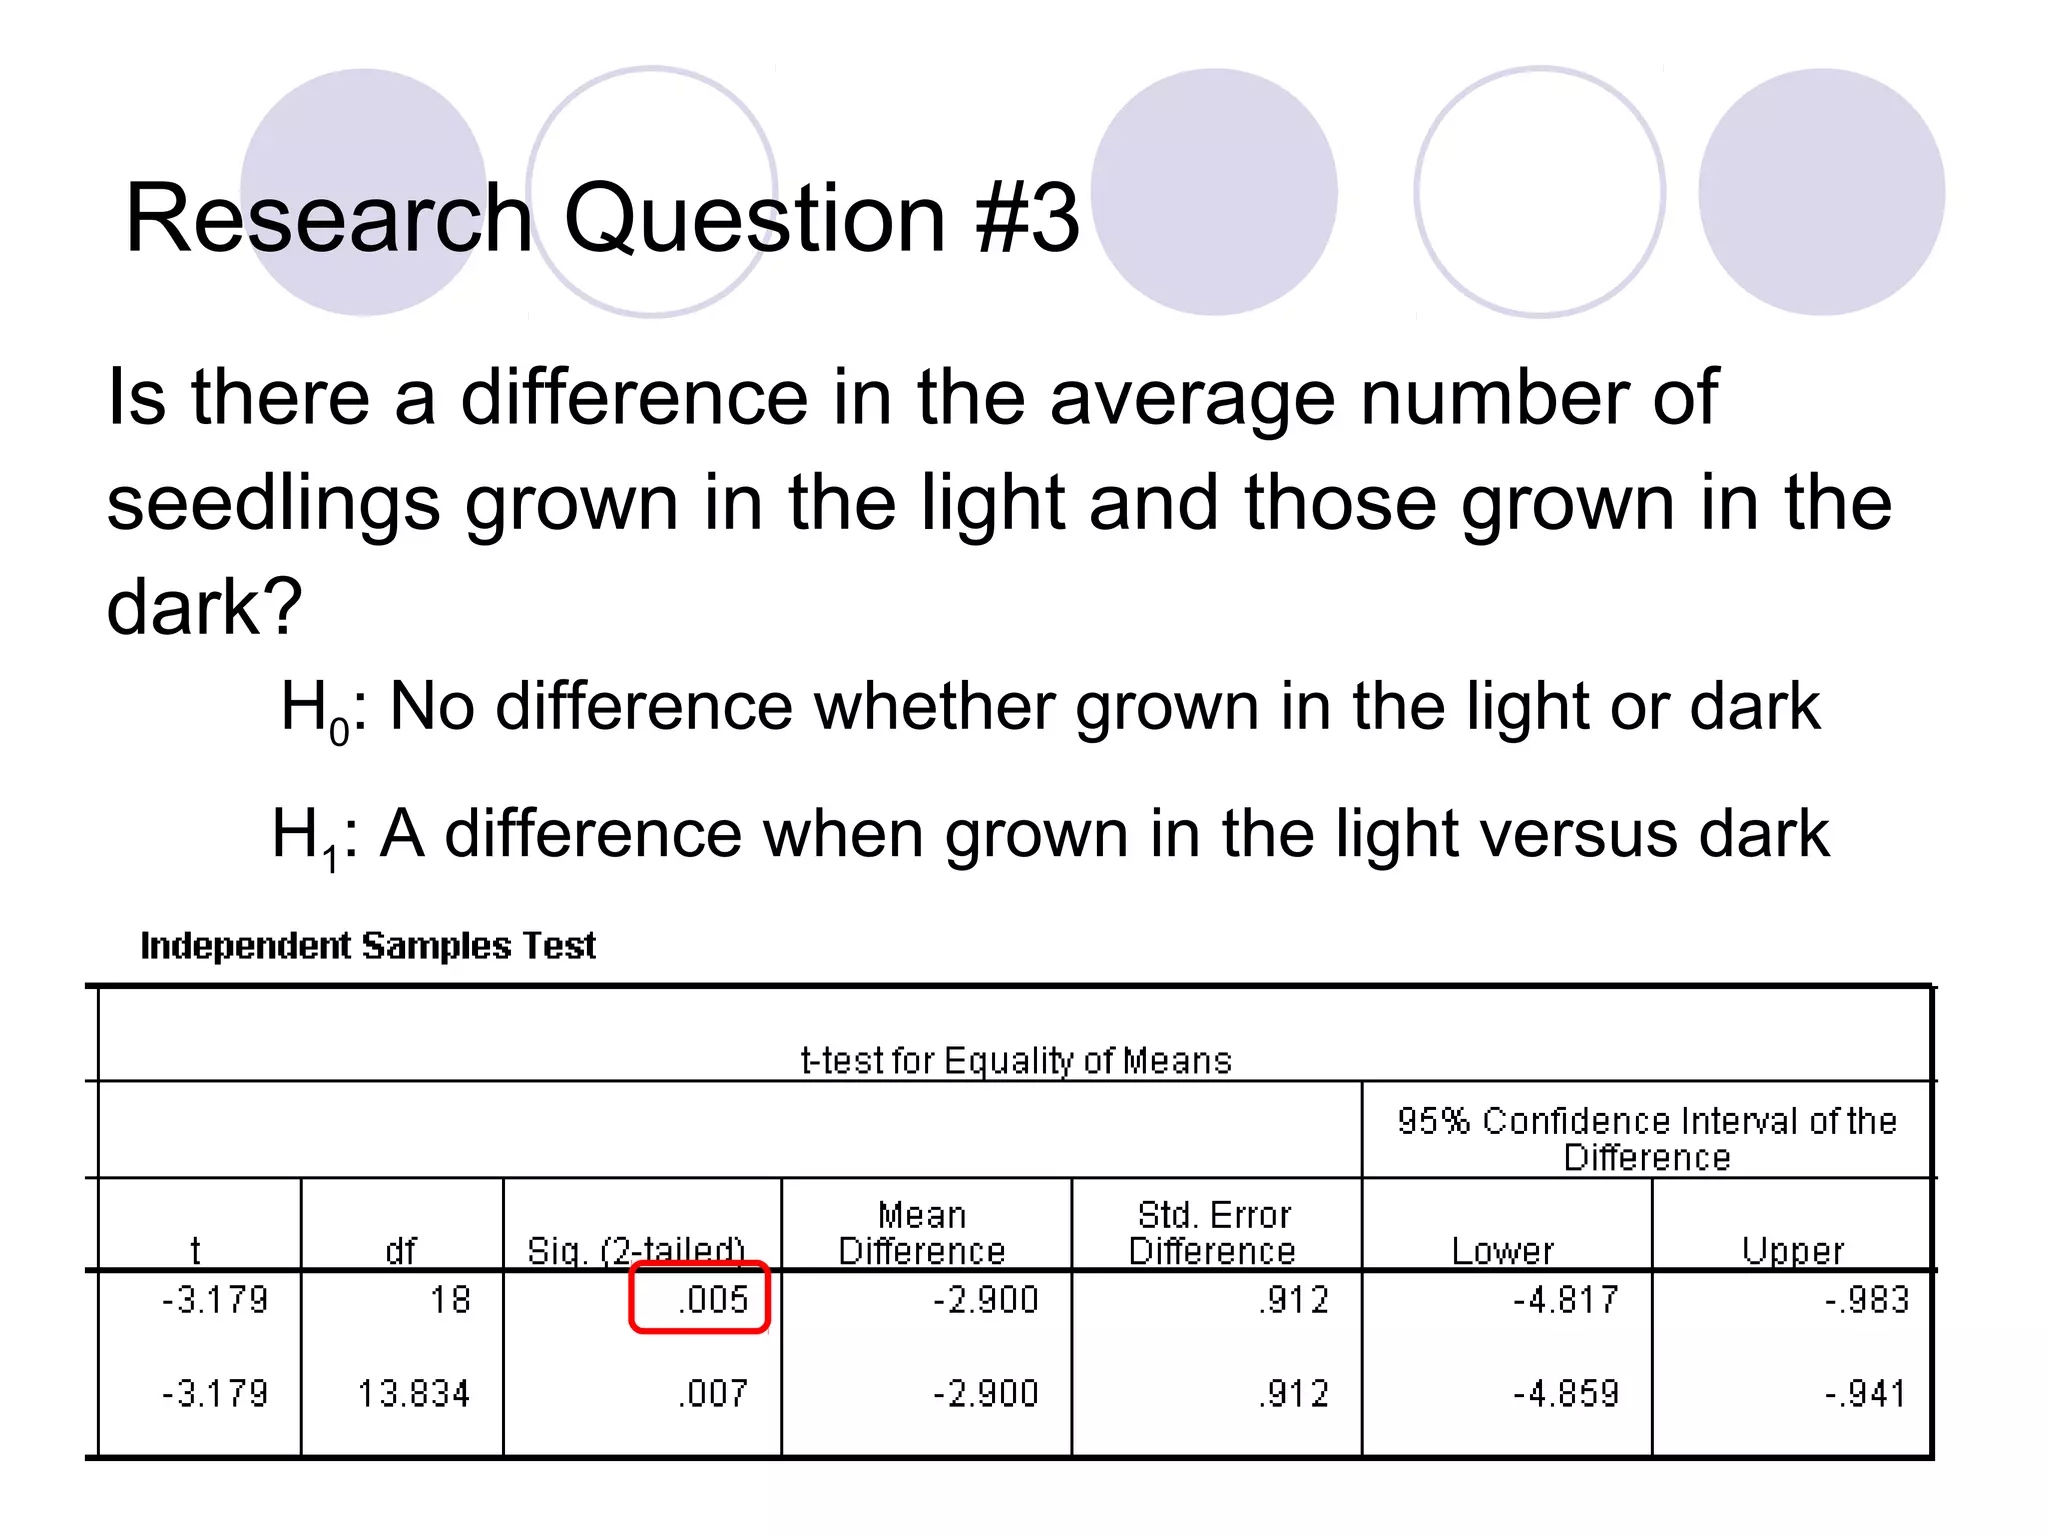
Techniques for selecting cases, performing significance tests, and hypothesis testing.
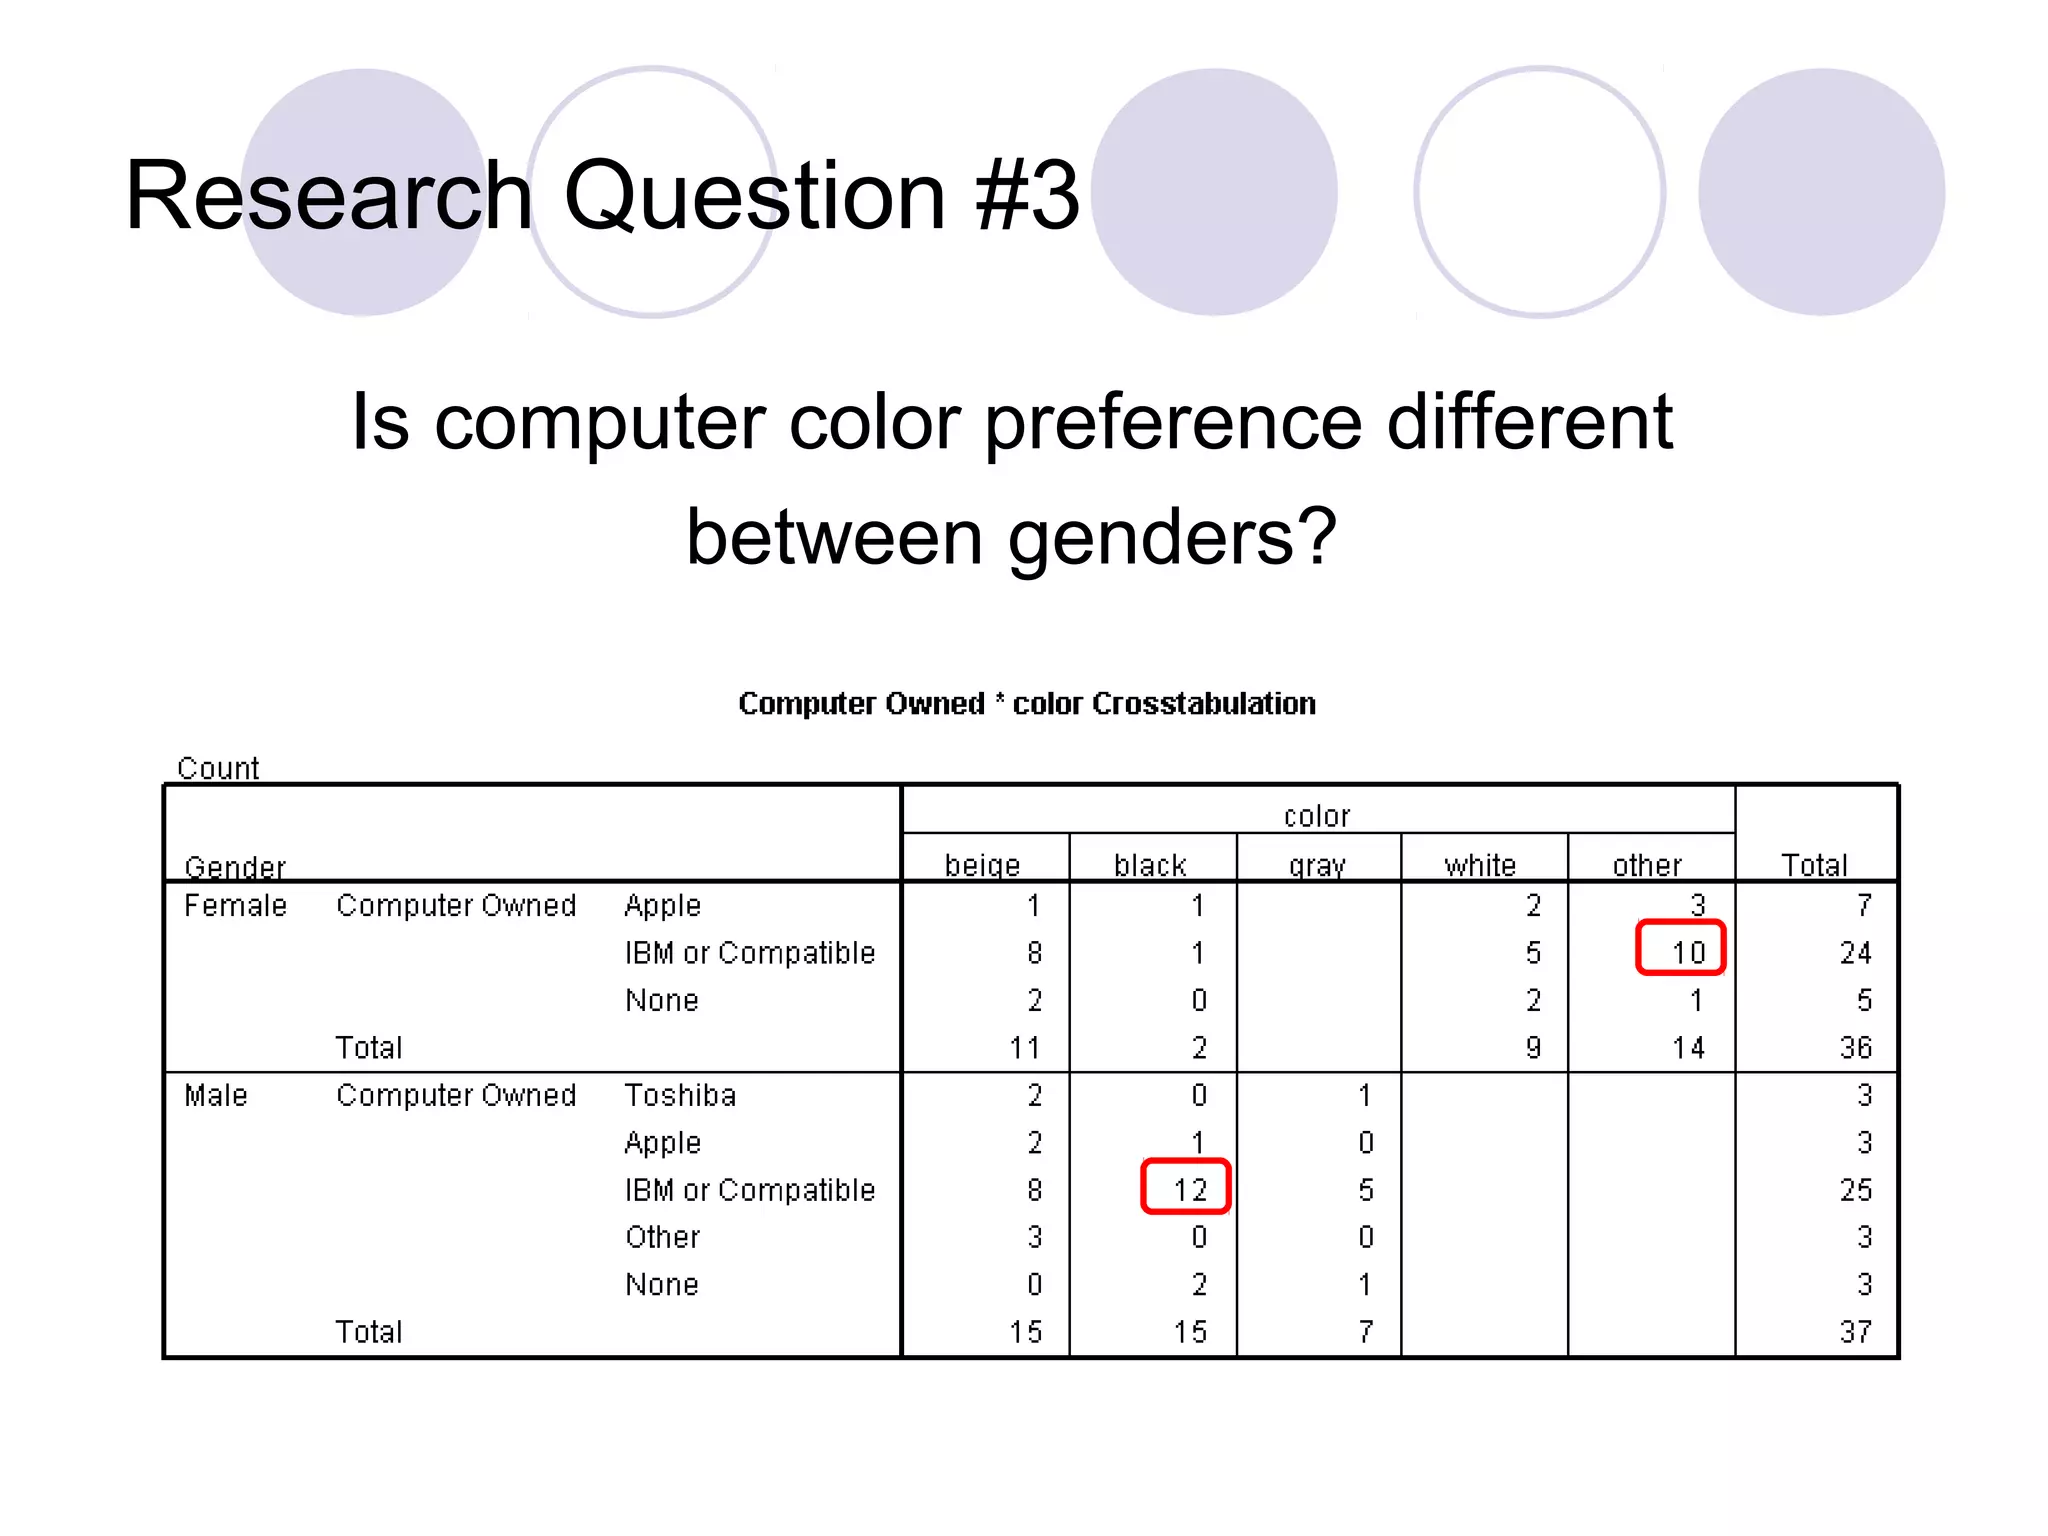
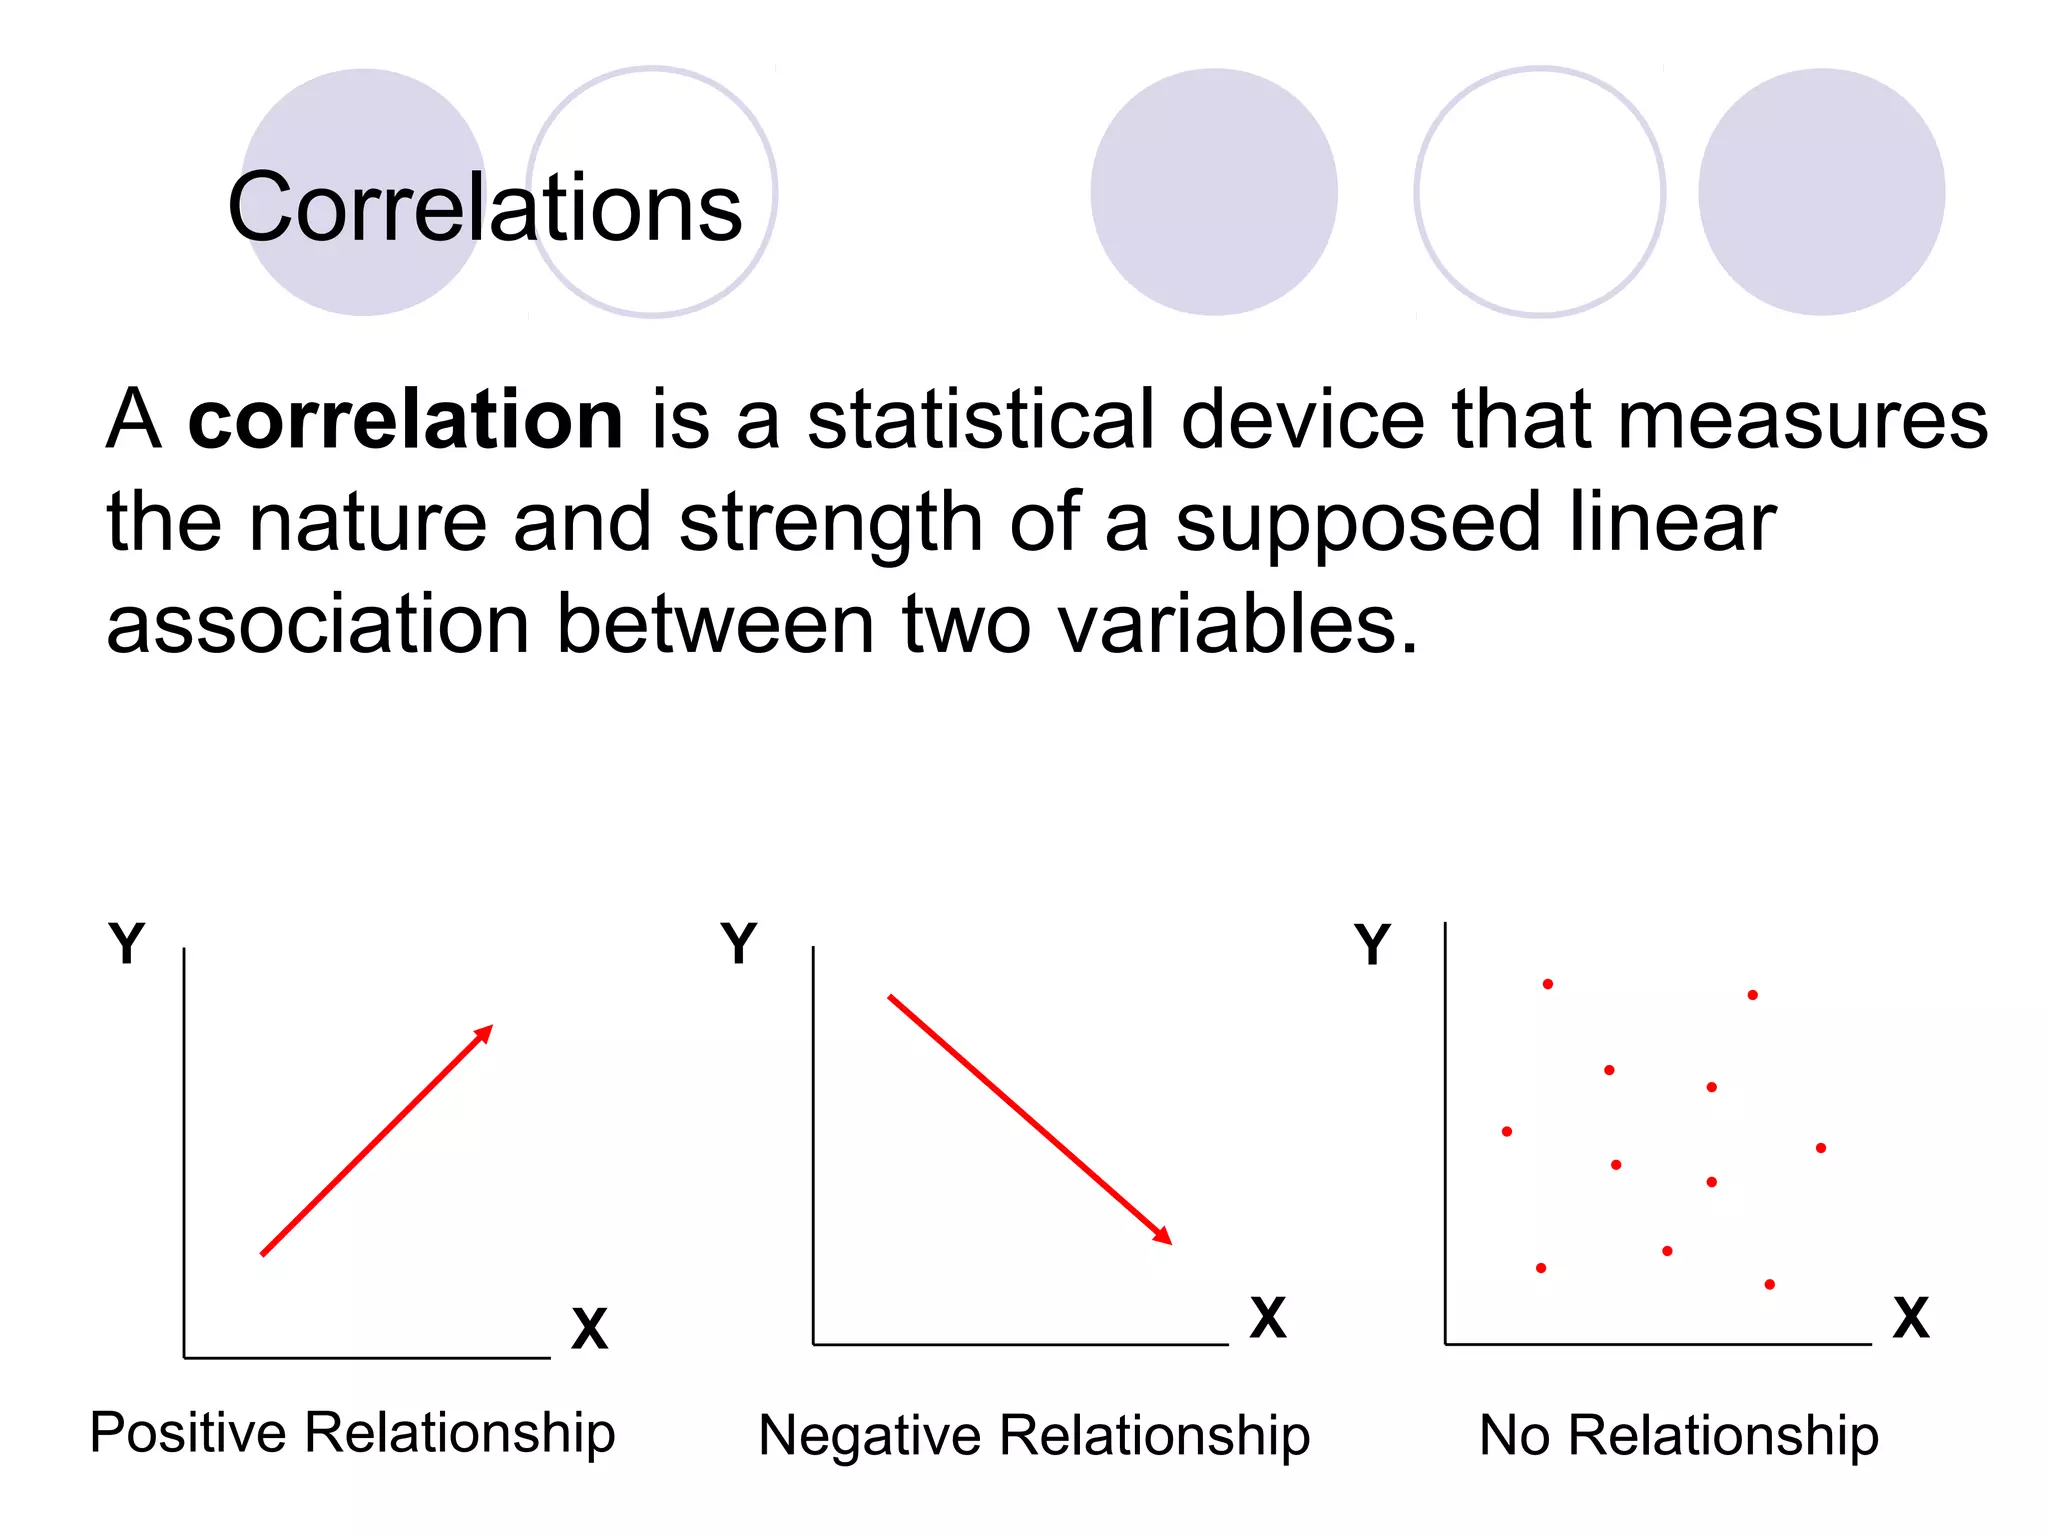
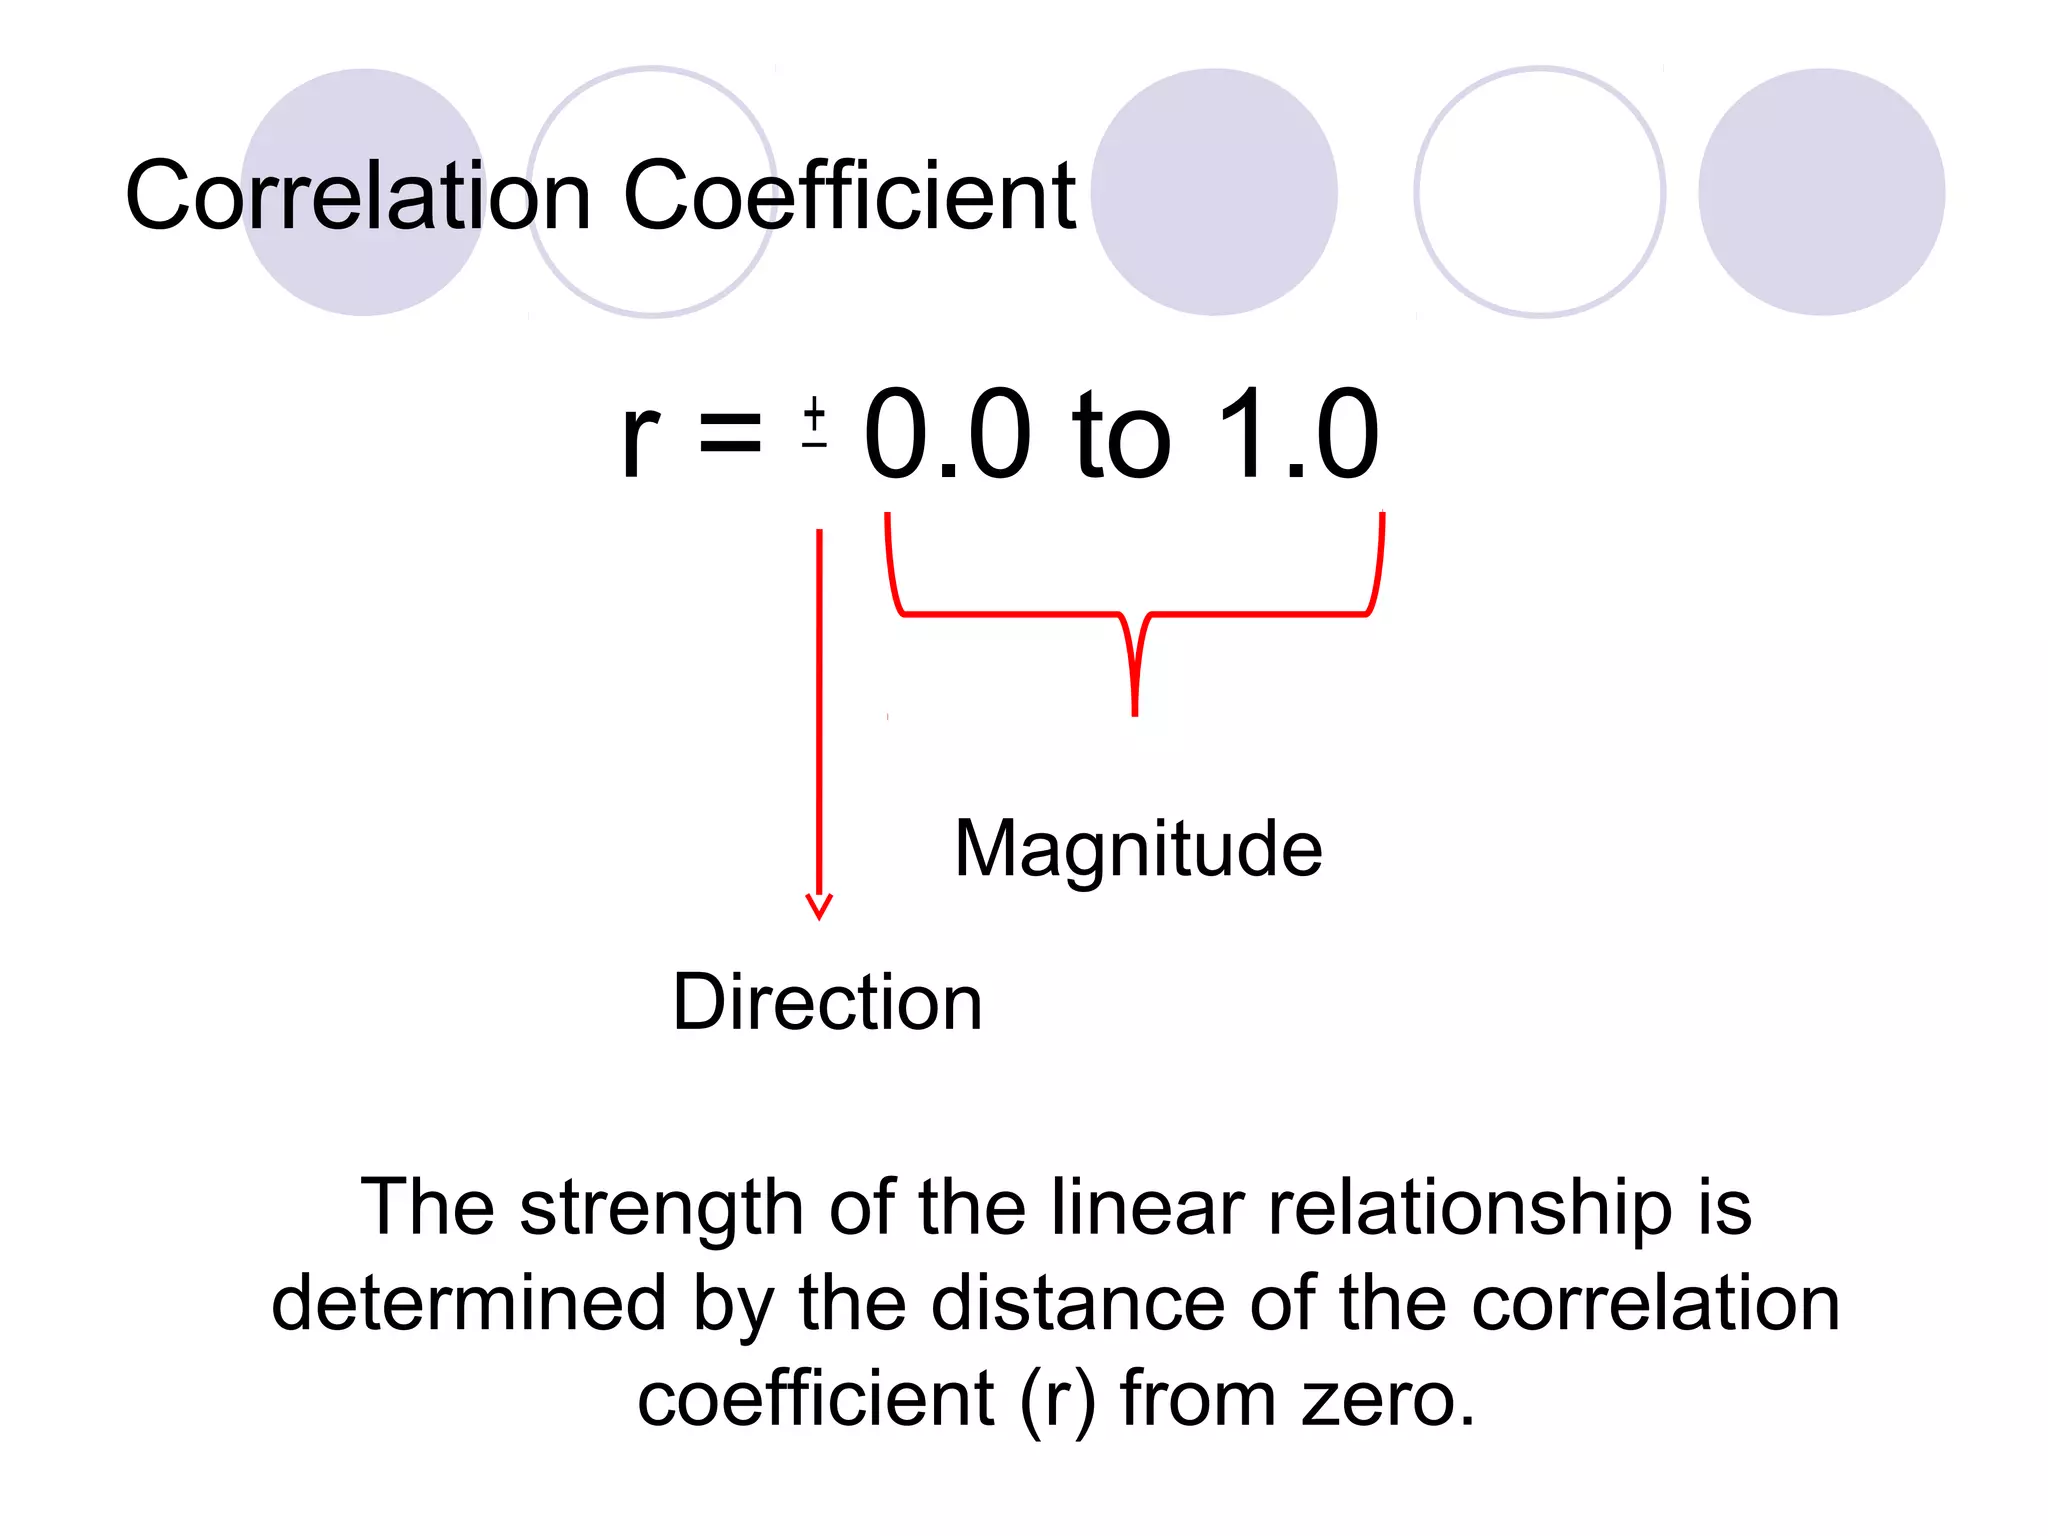
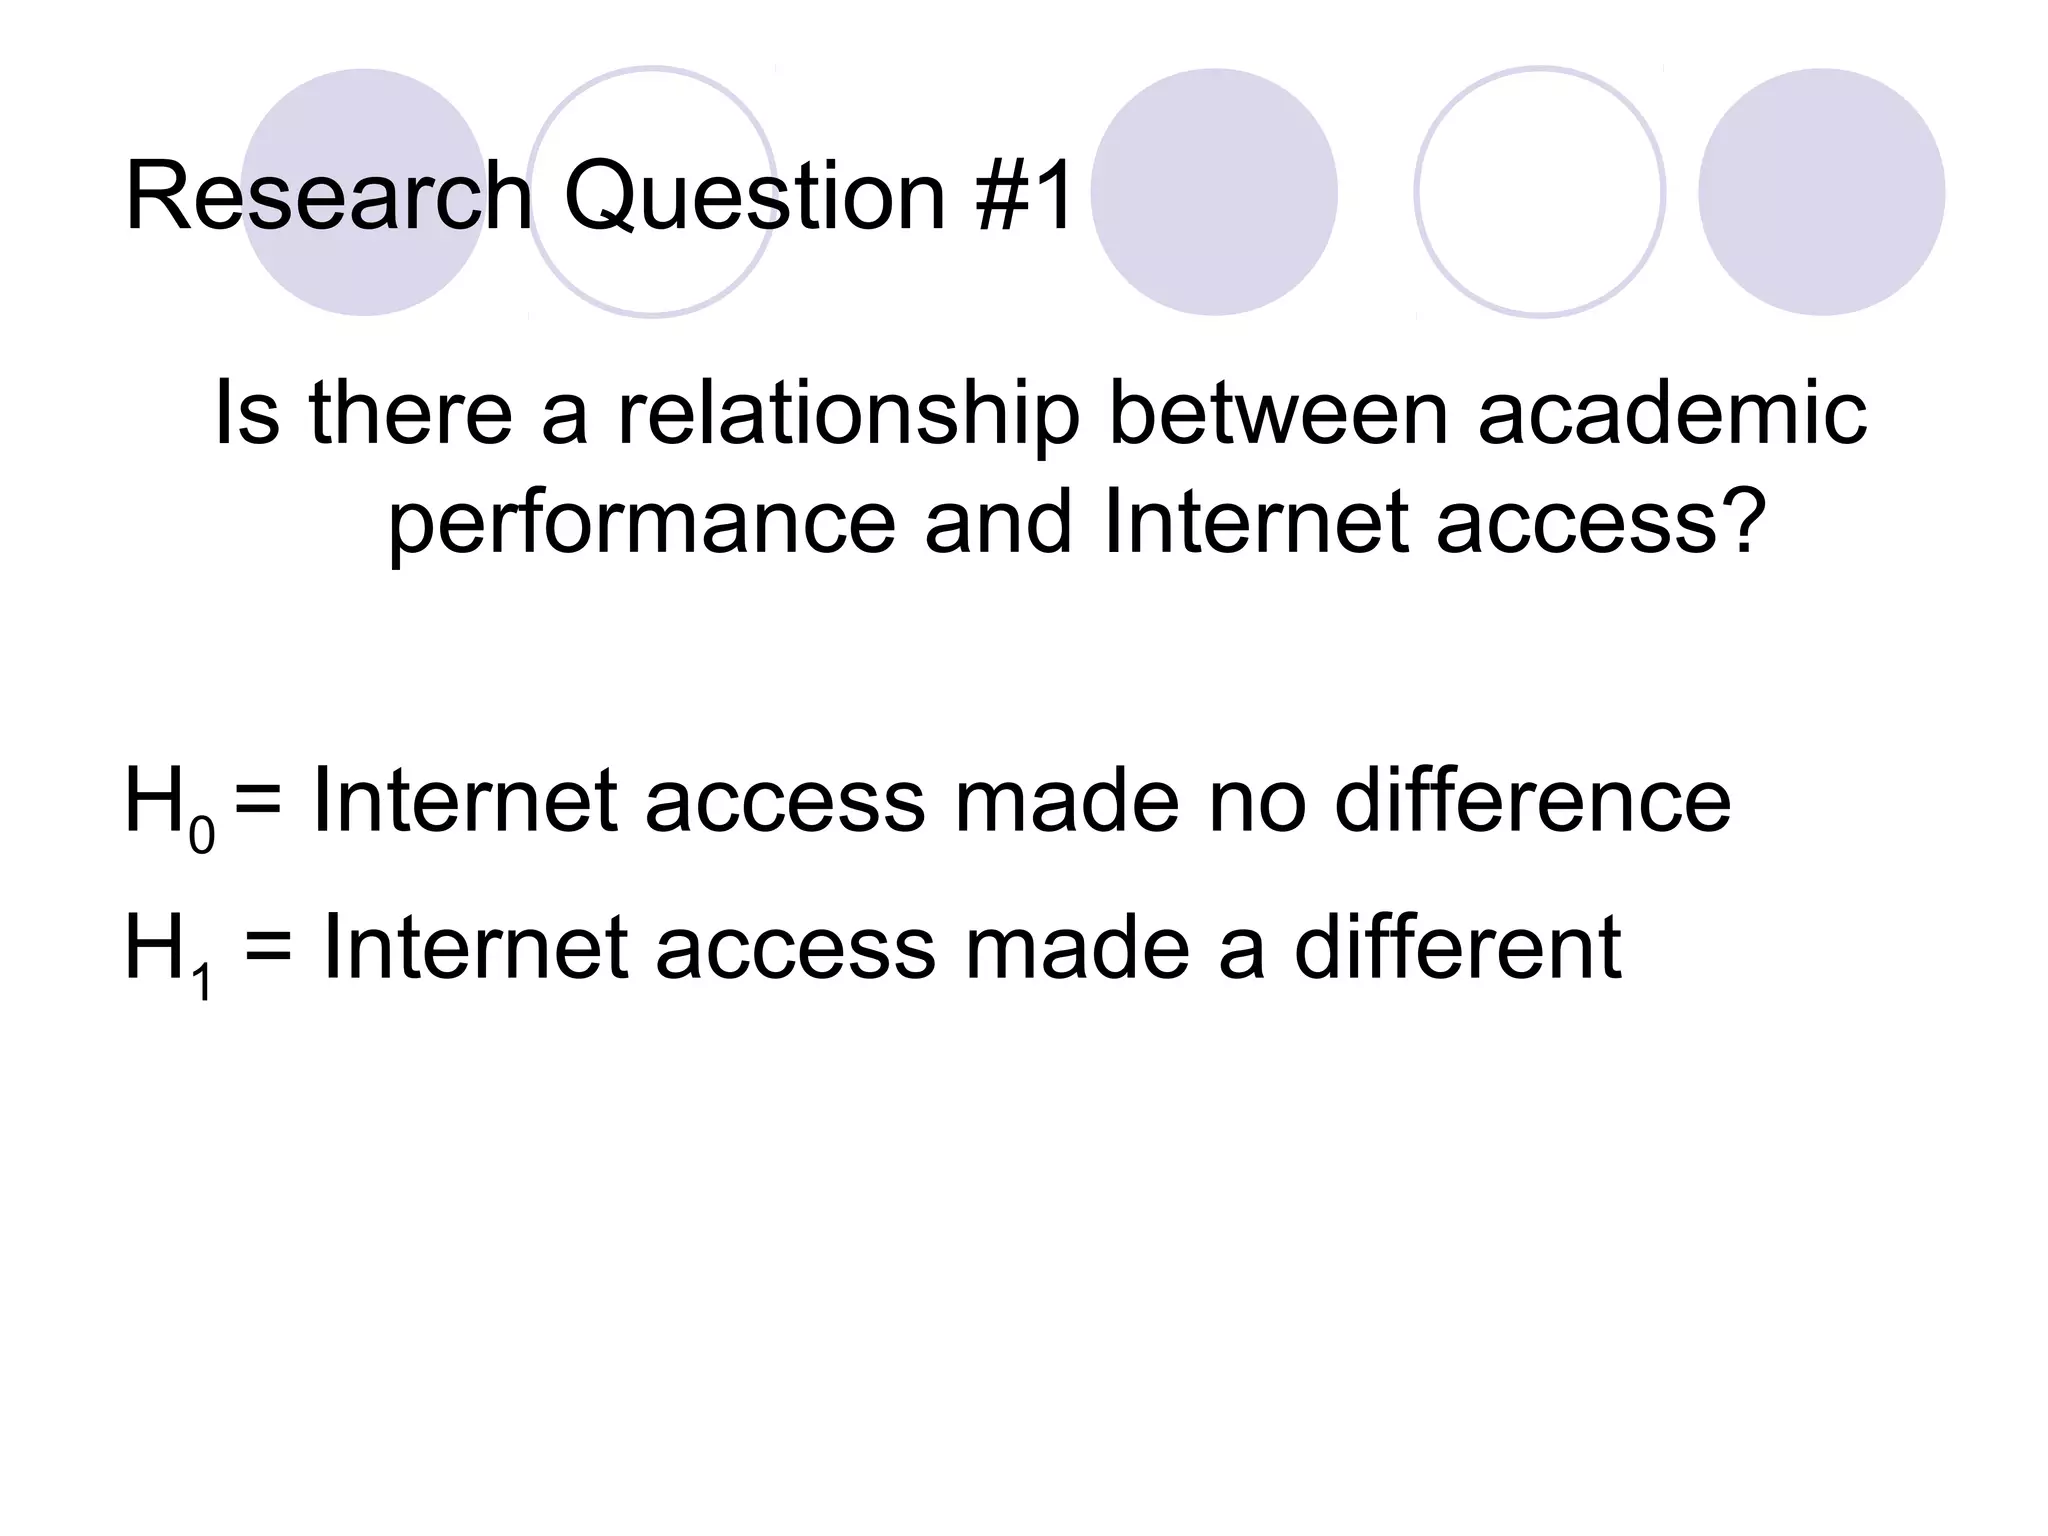
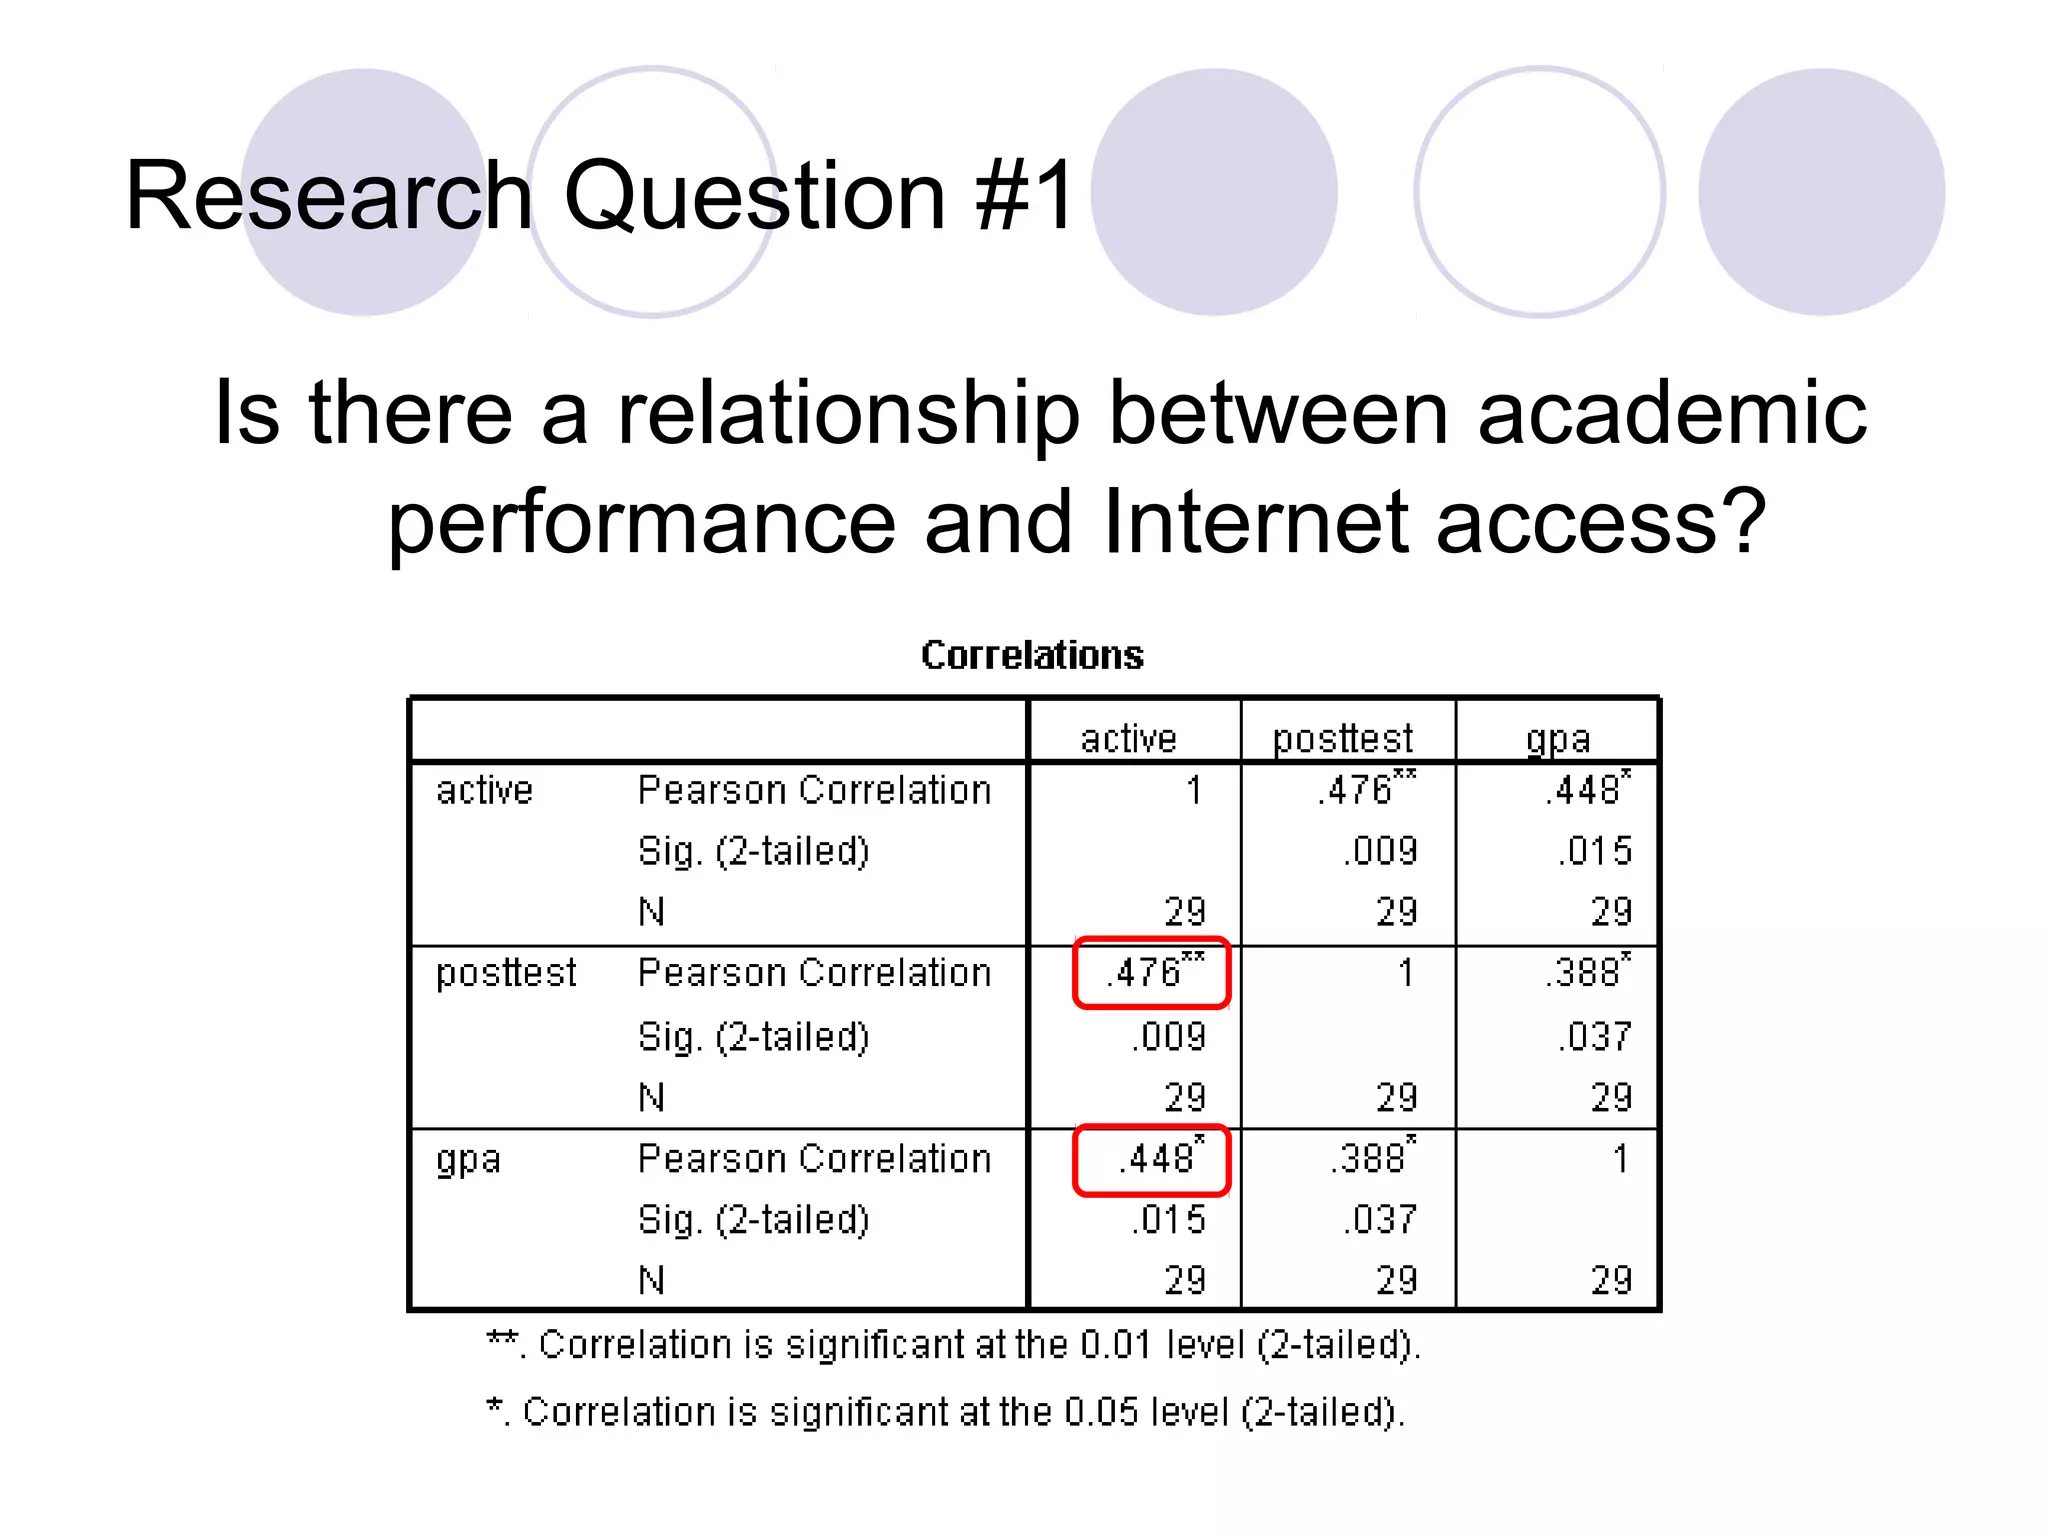
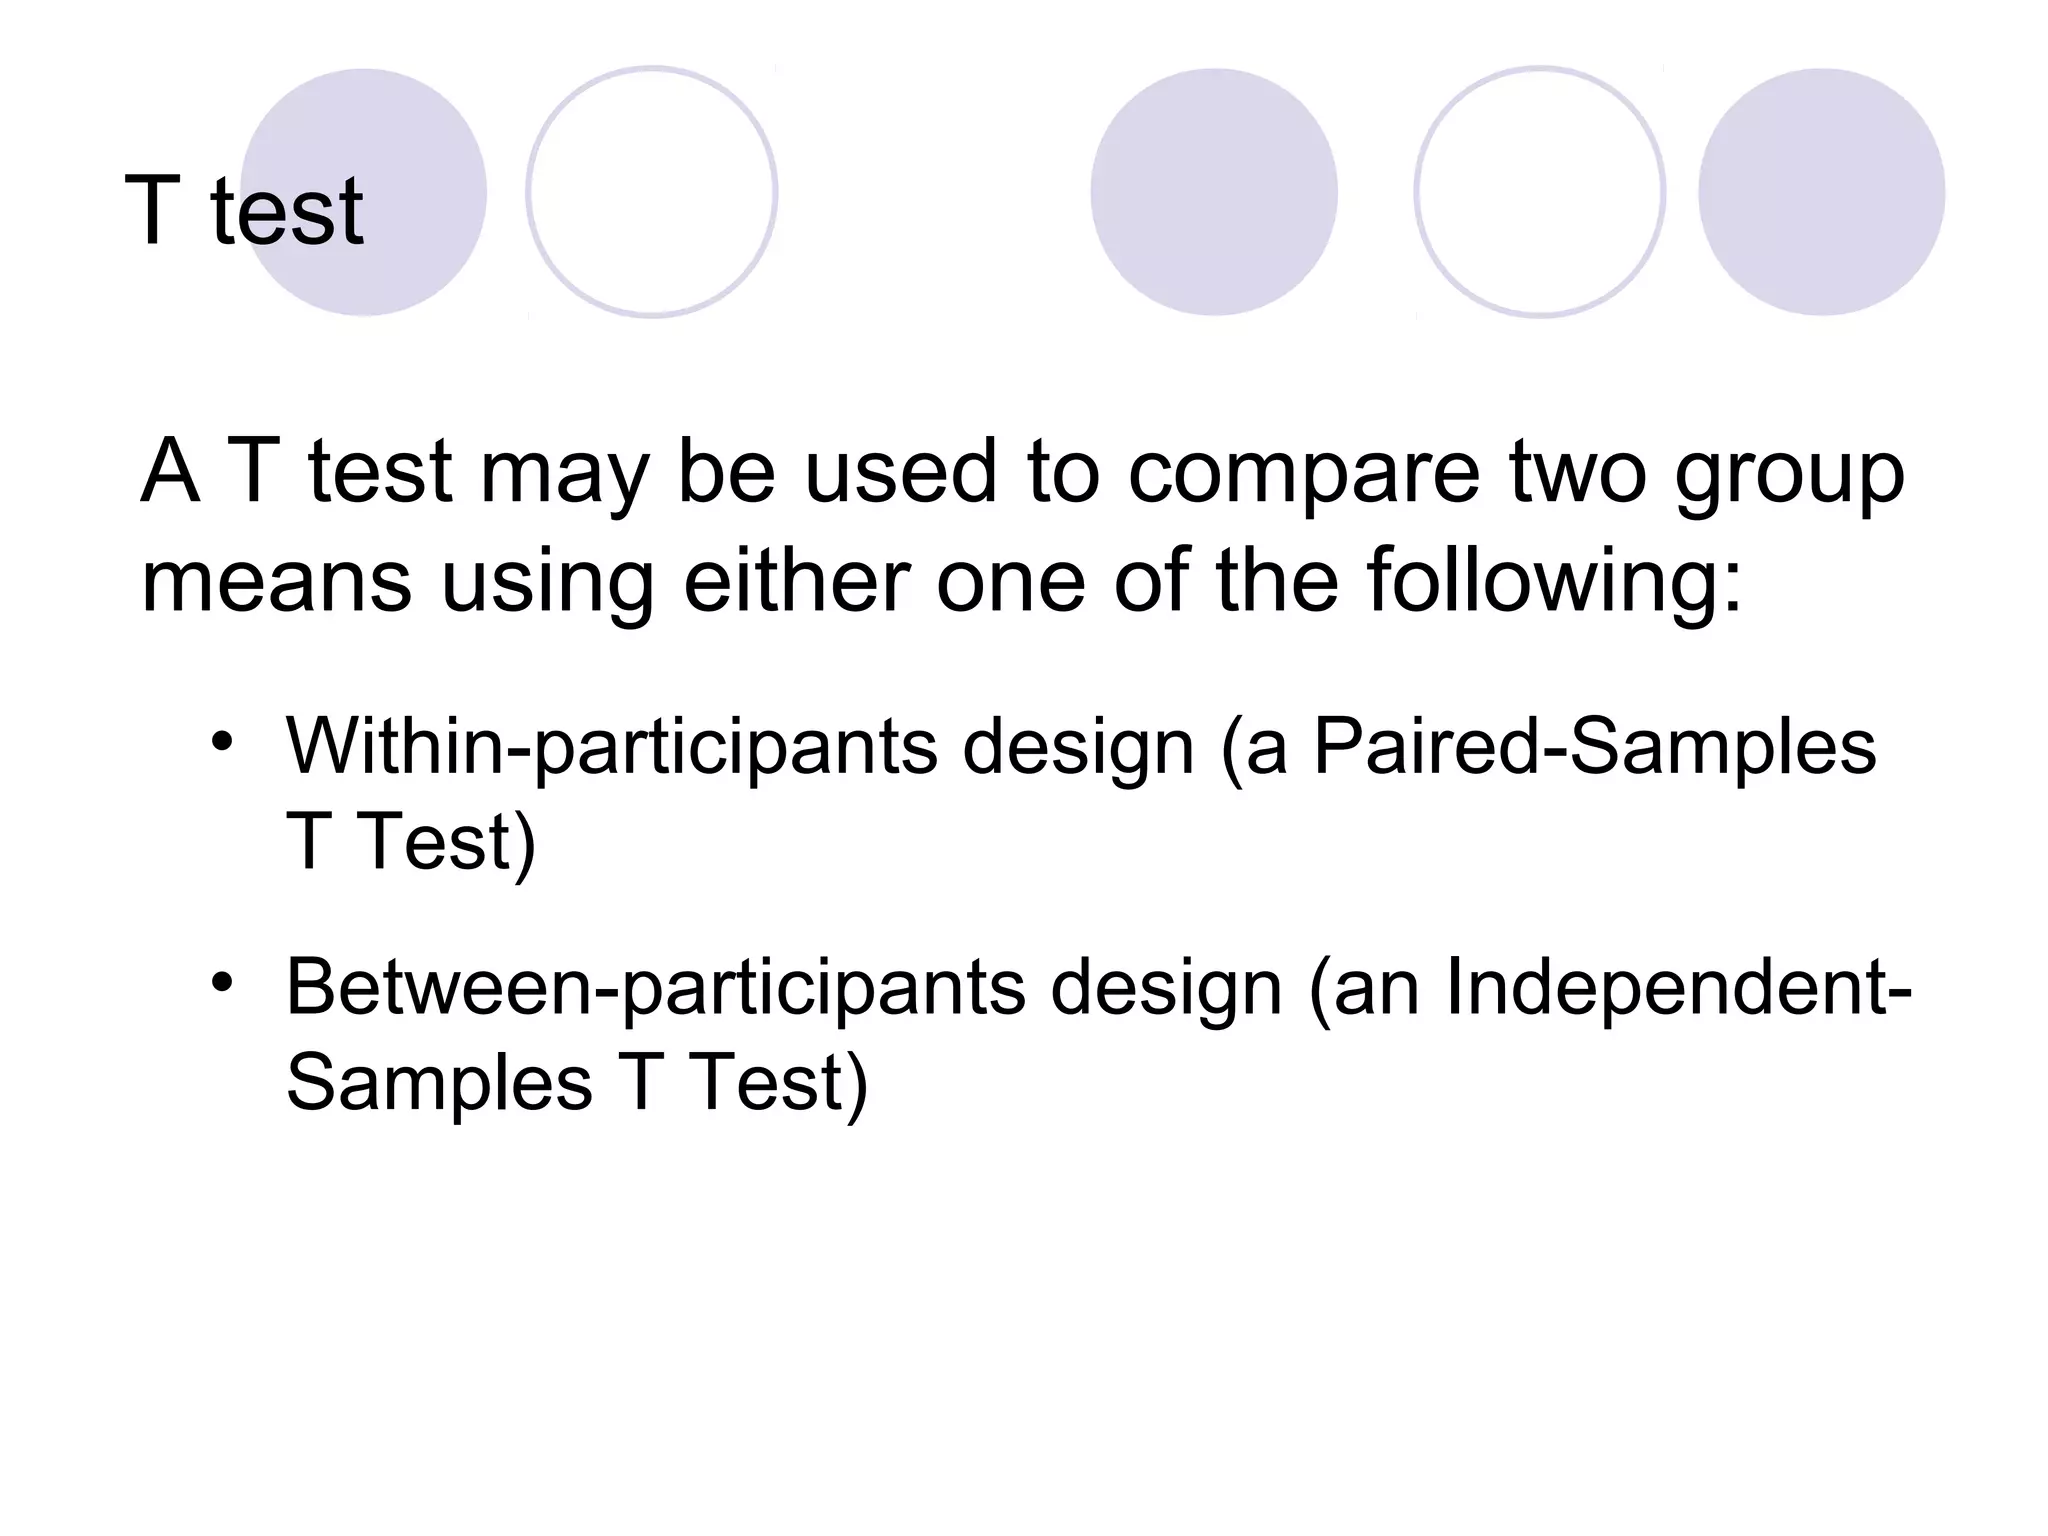
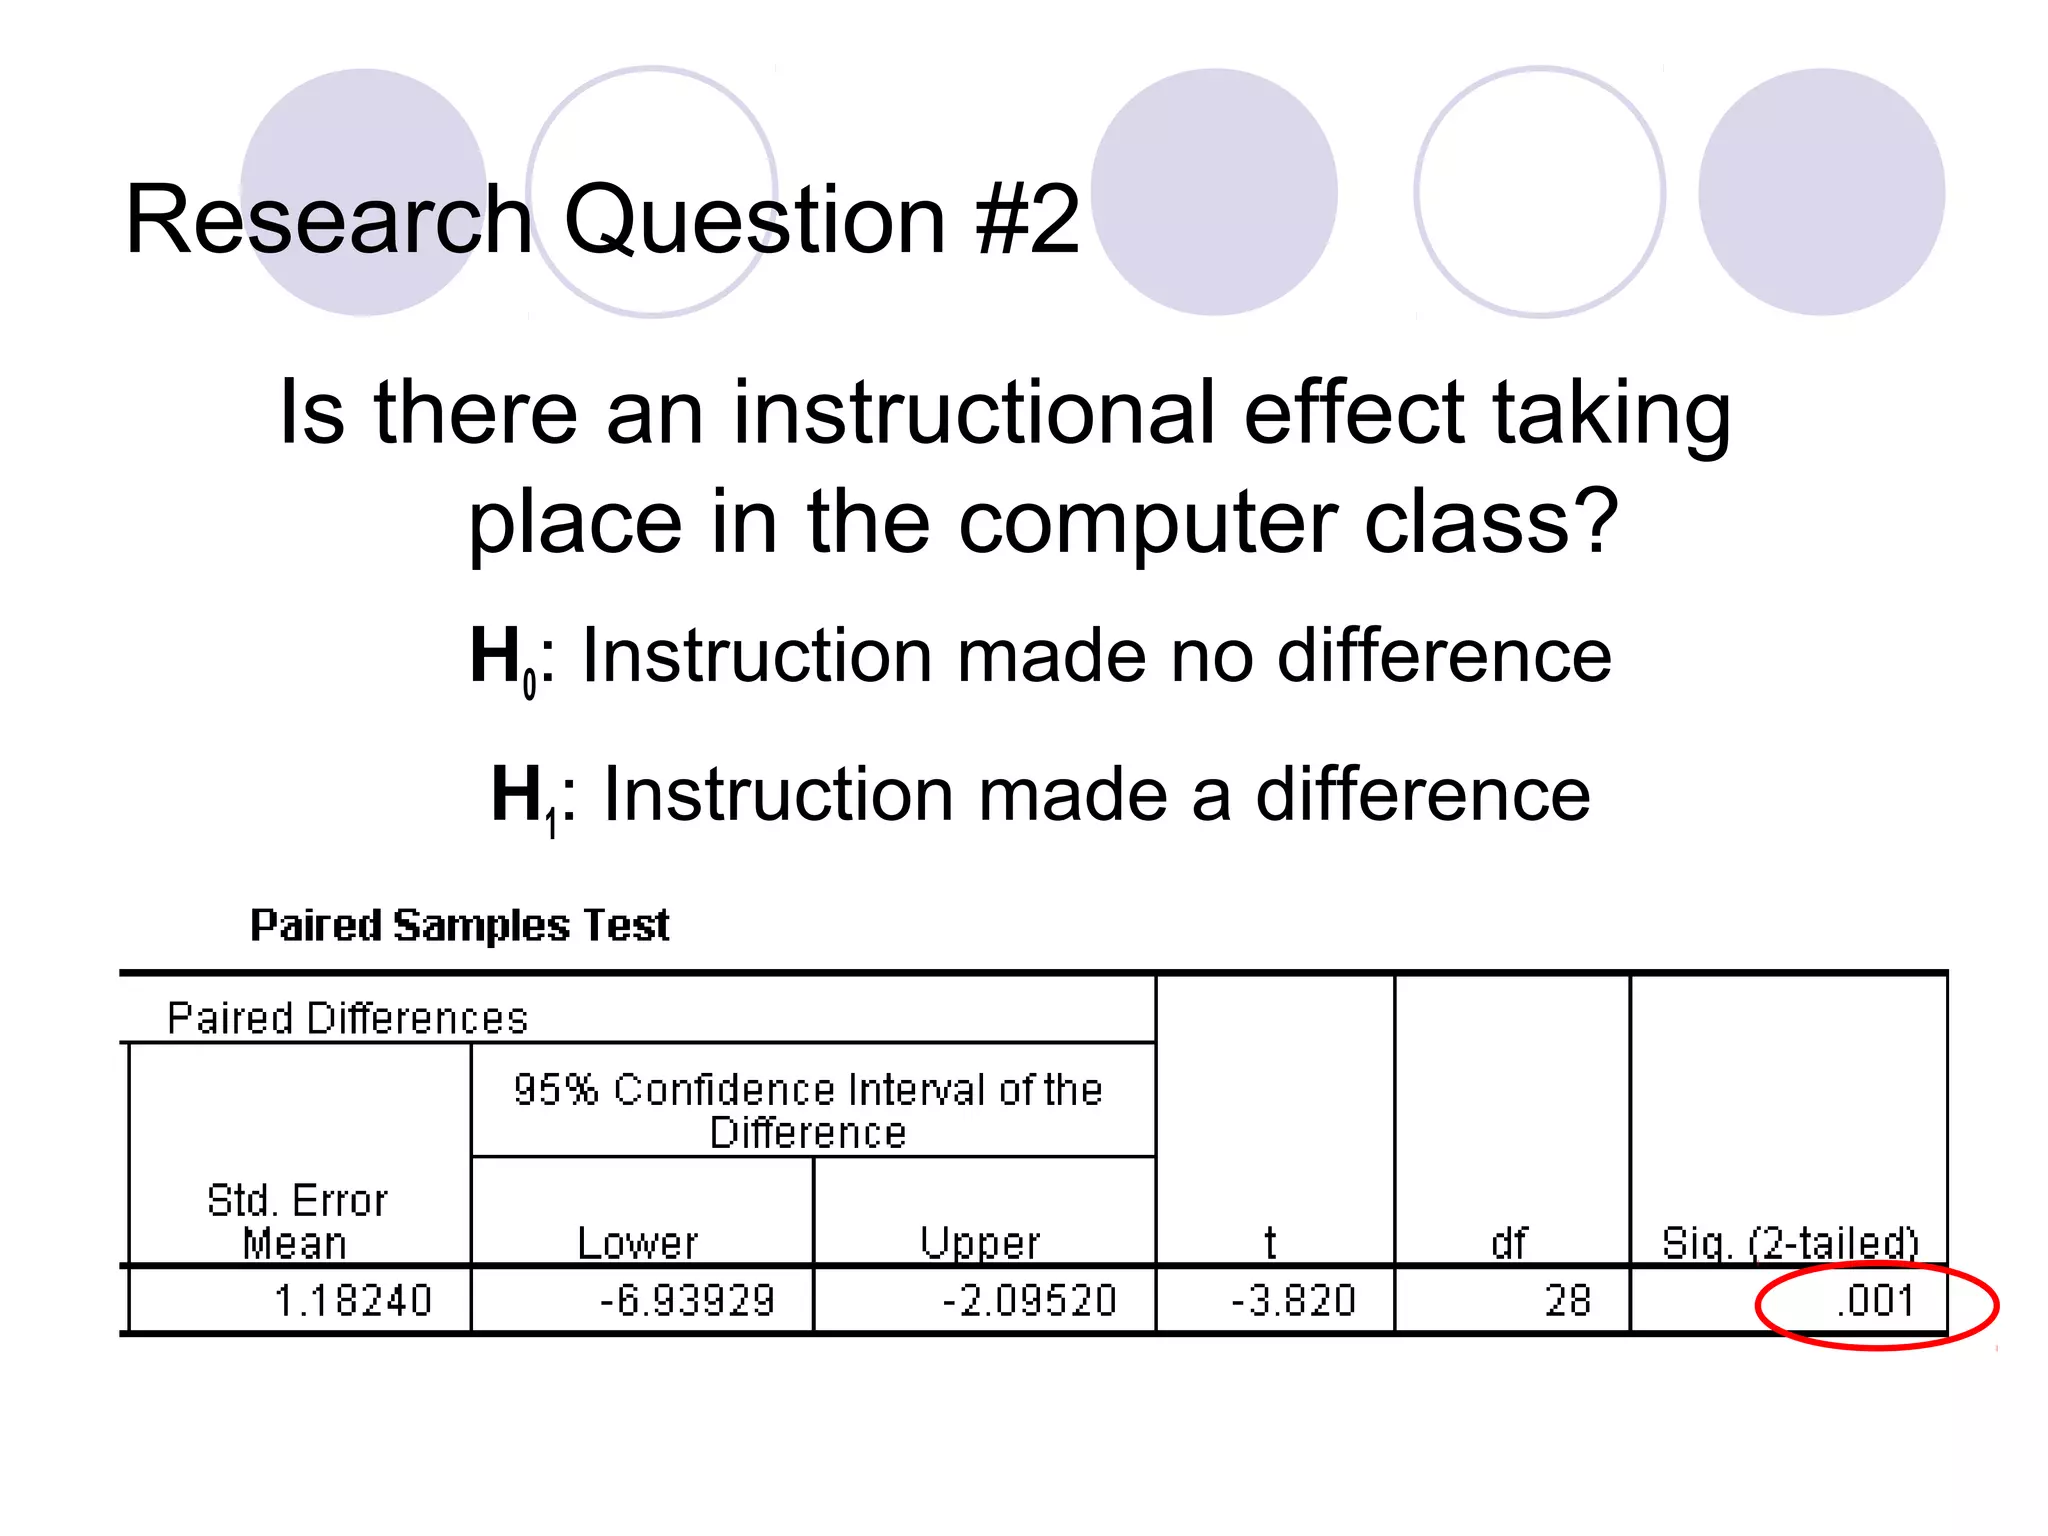
Understanding correlations, performing T-tests to compare means, and formulating research questions.
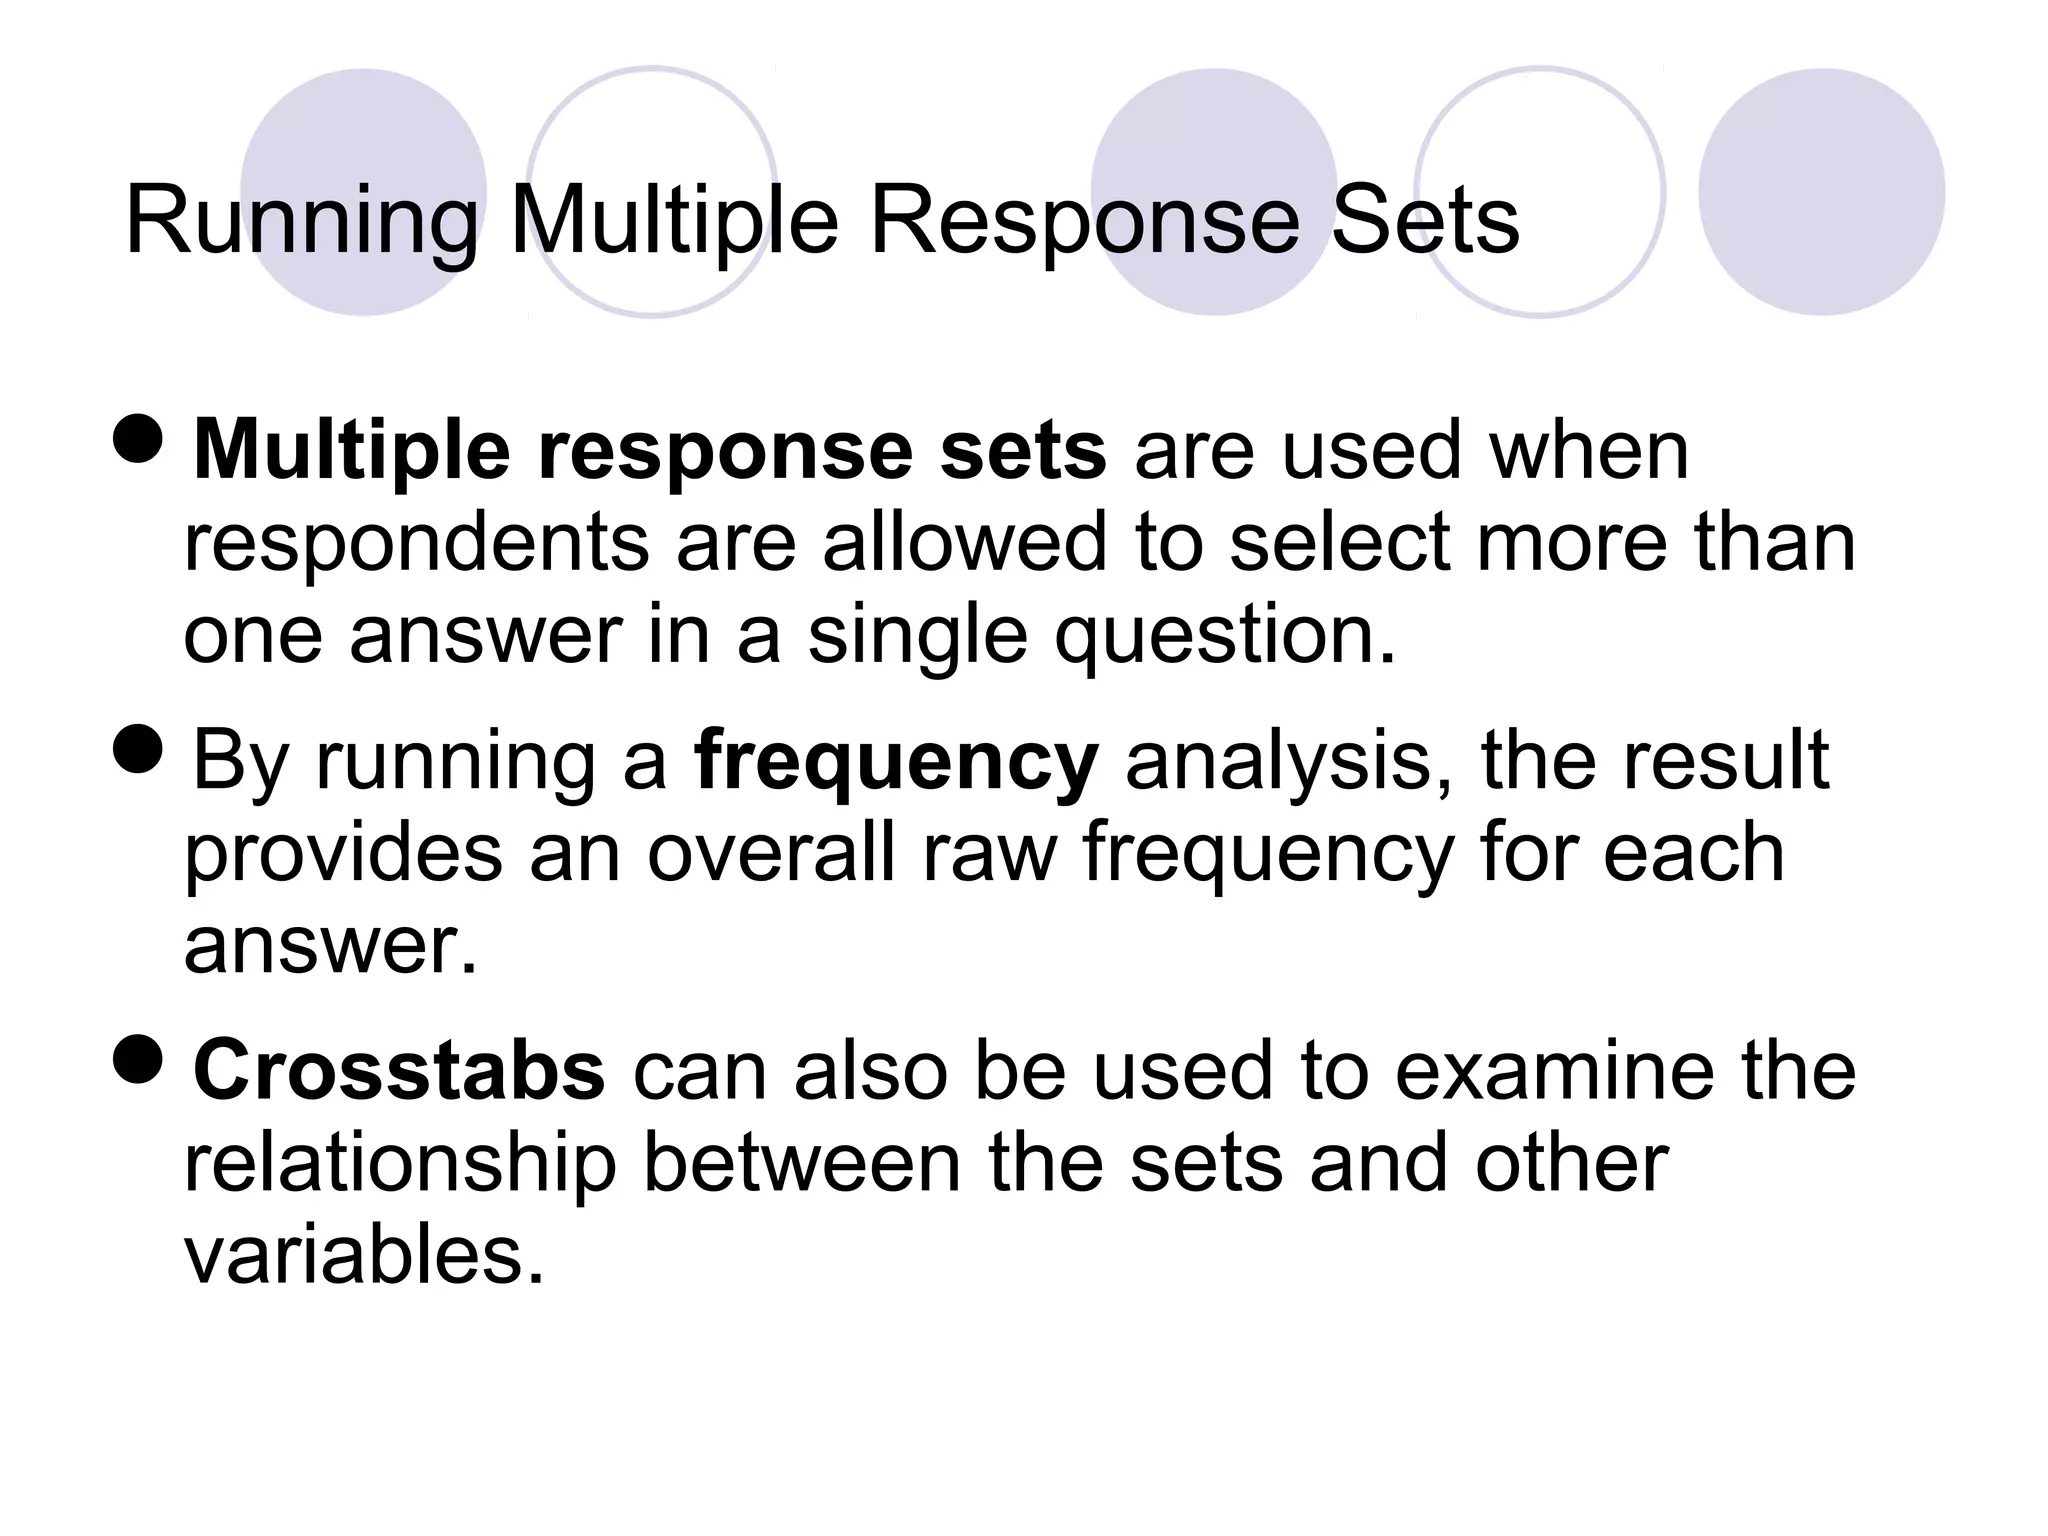
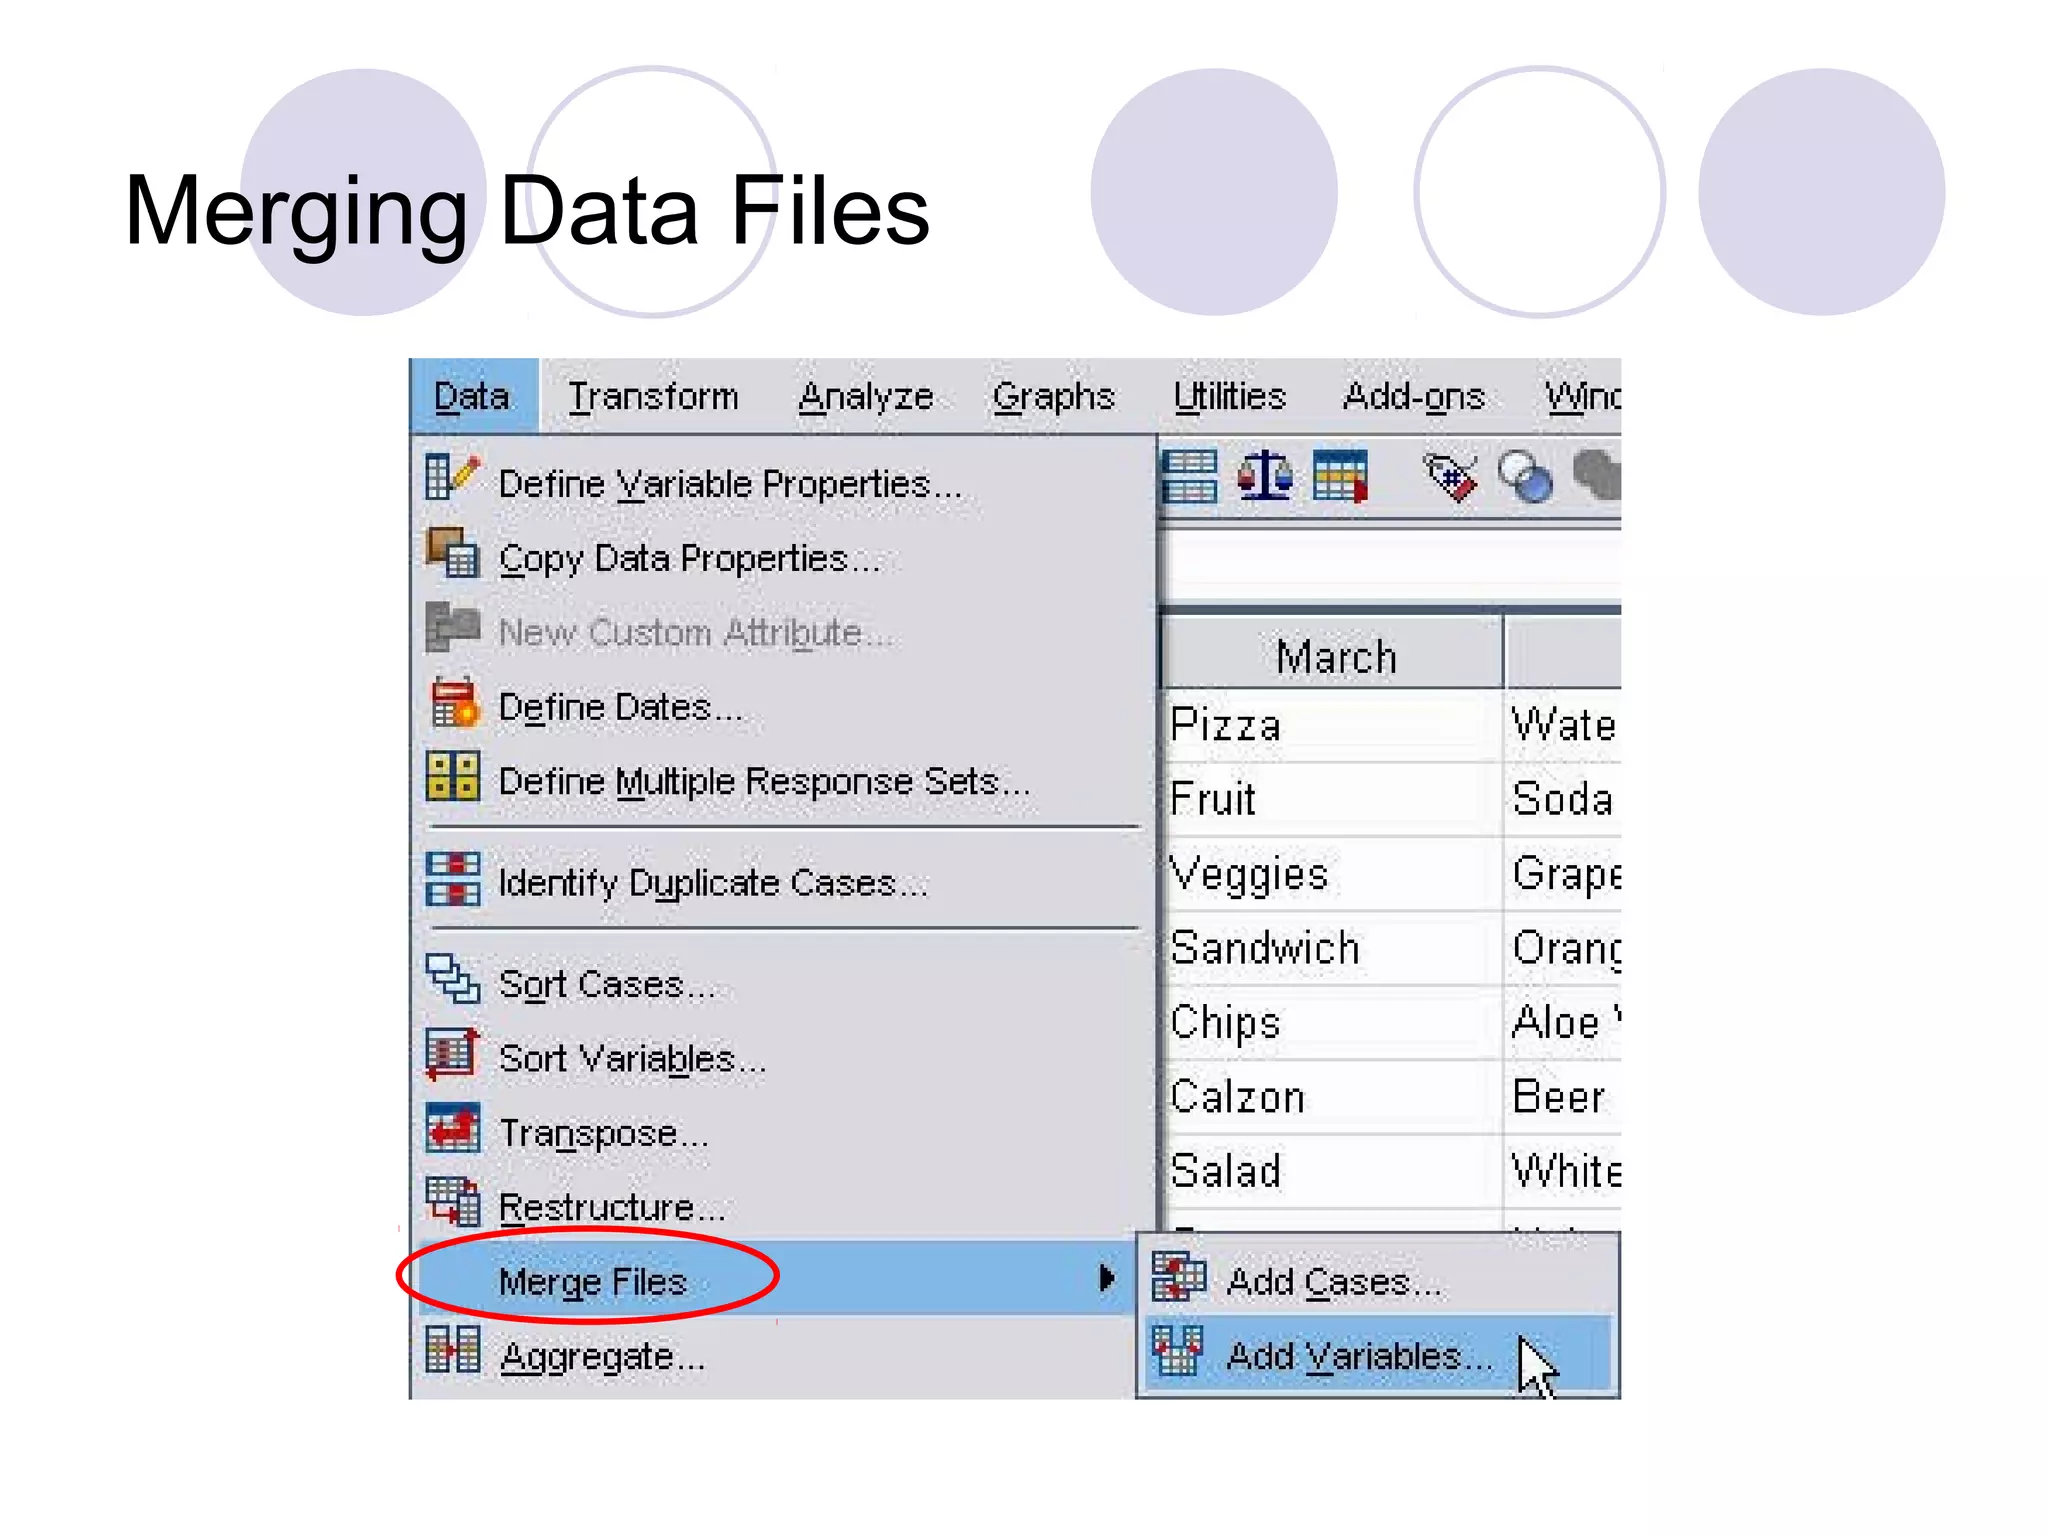
Handling multiple response sets and merging data files for comprehensive analysis.
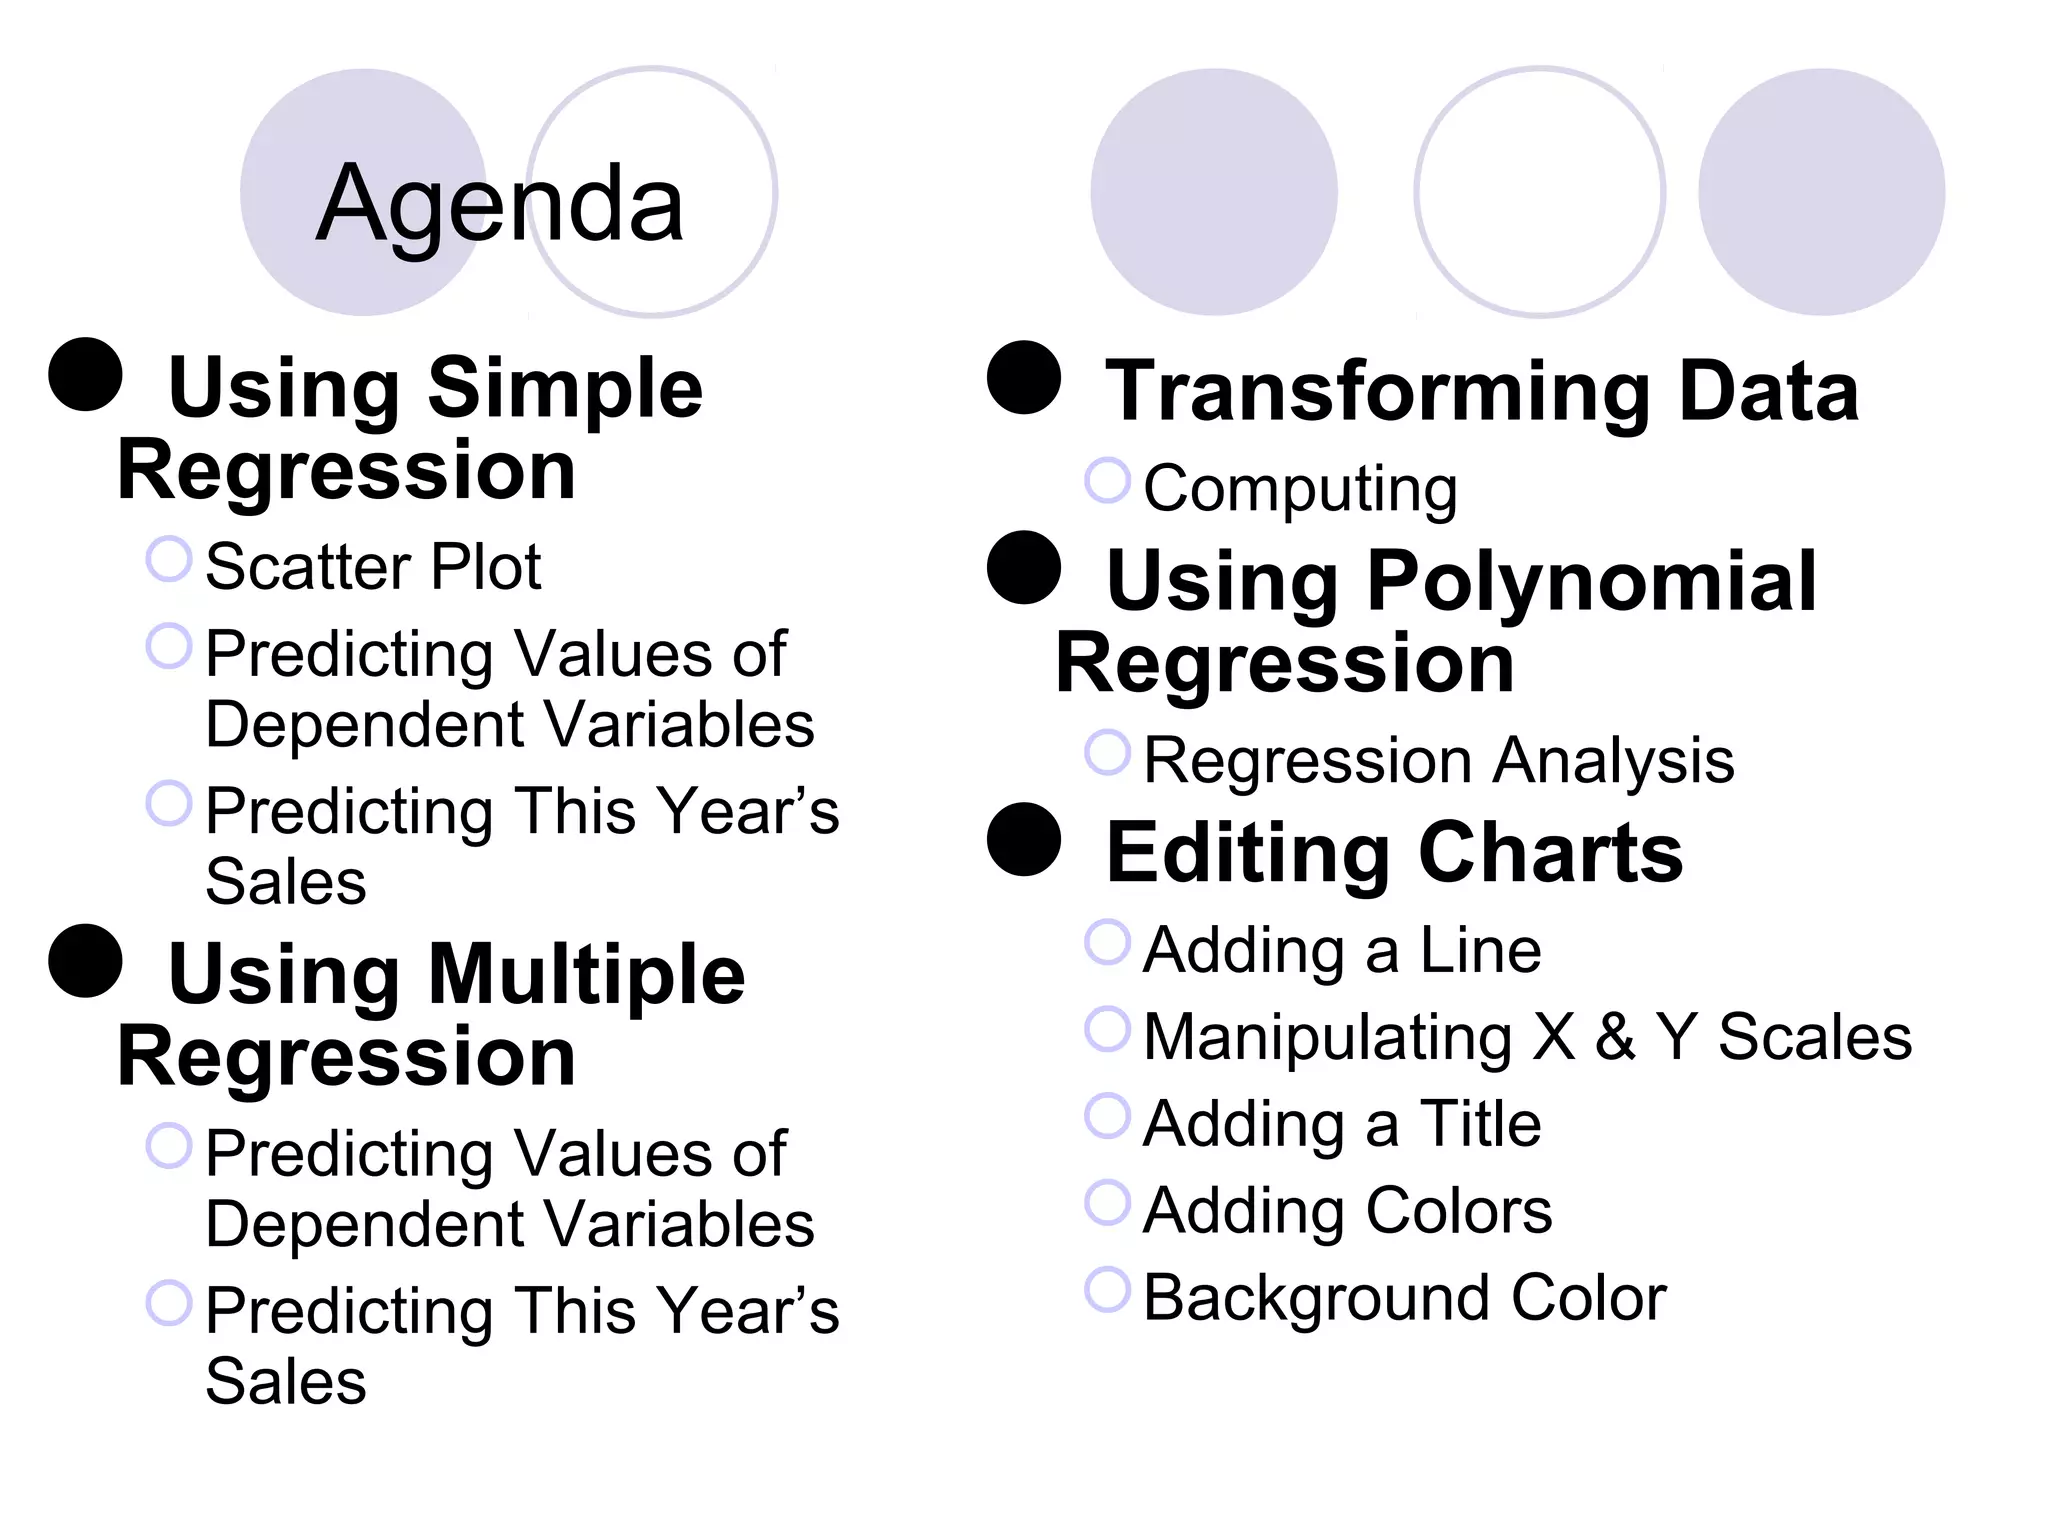
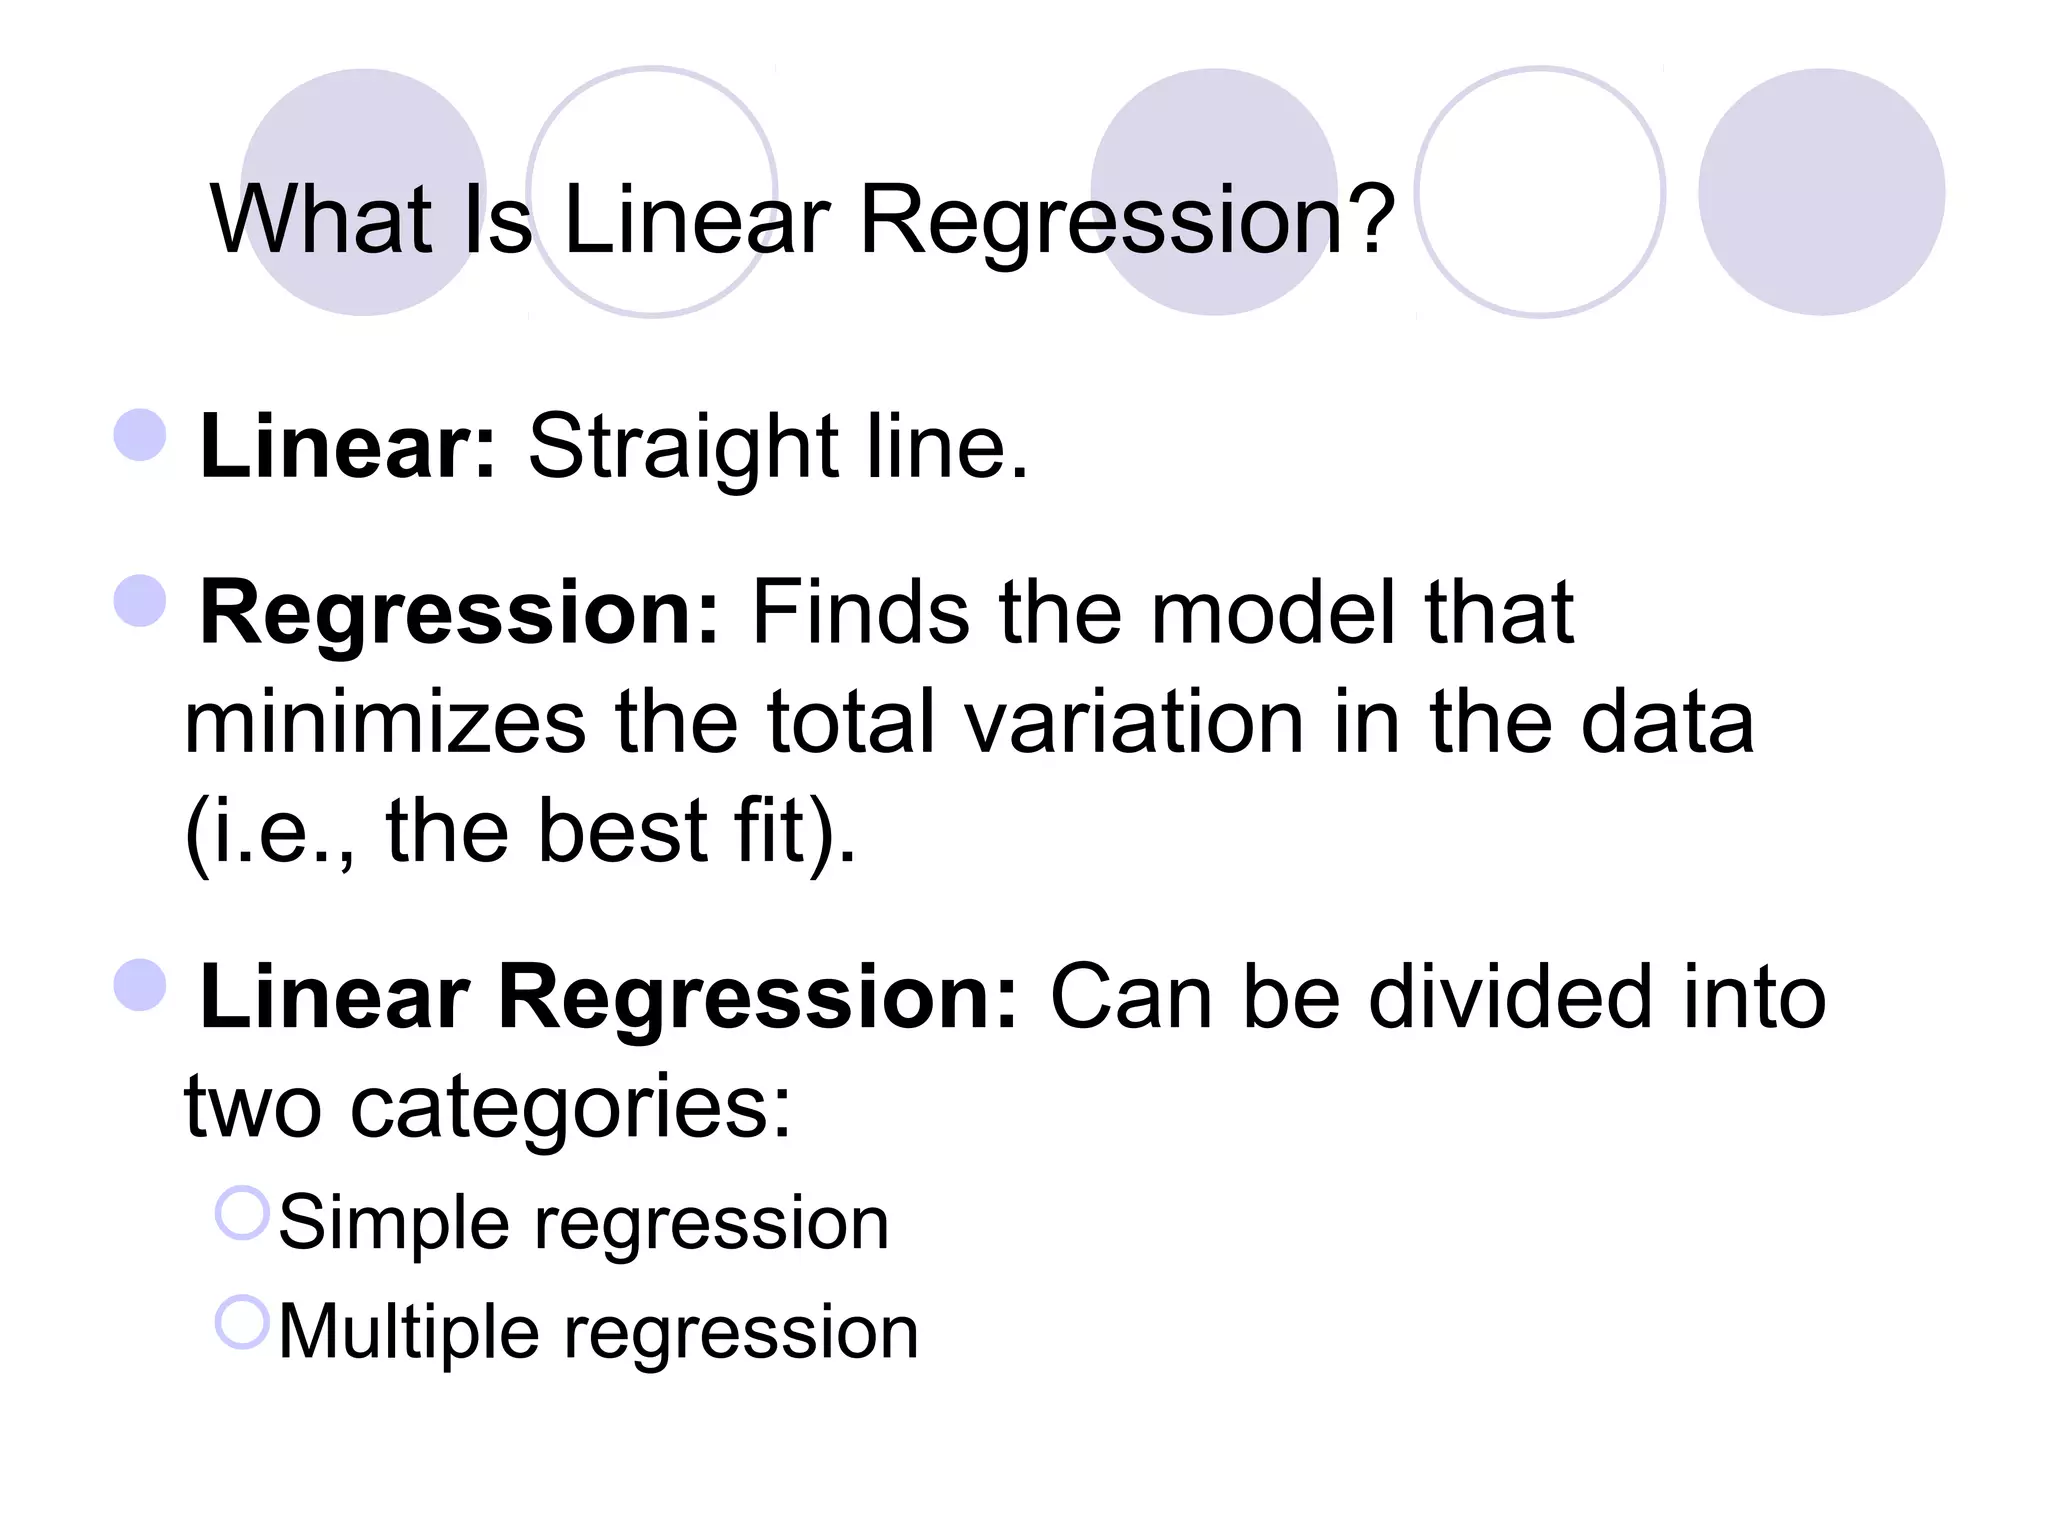
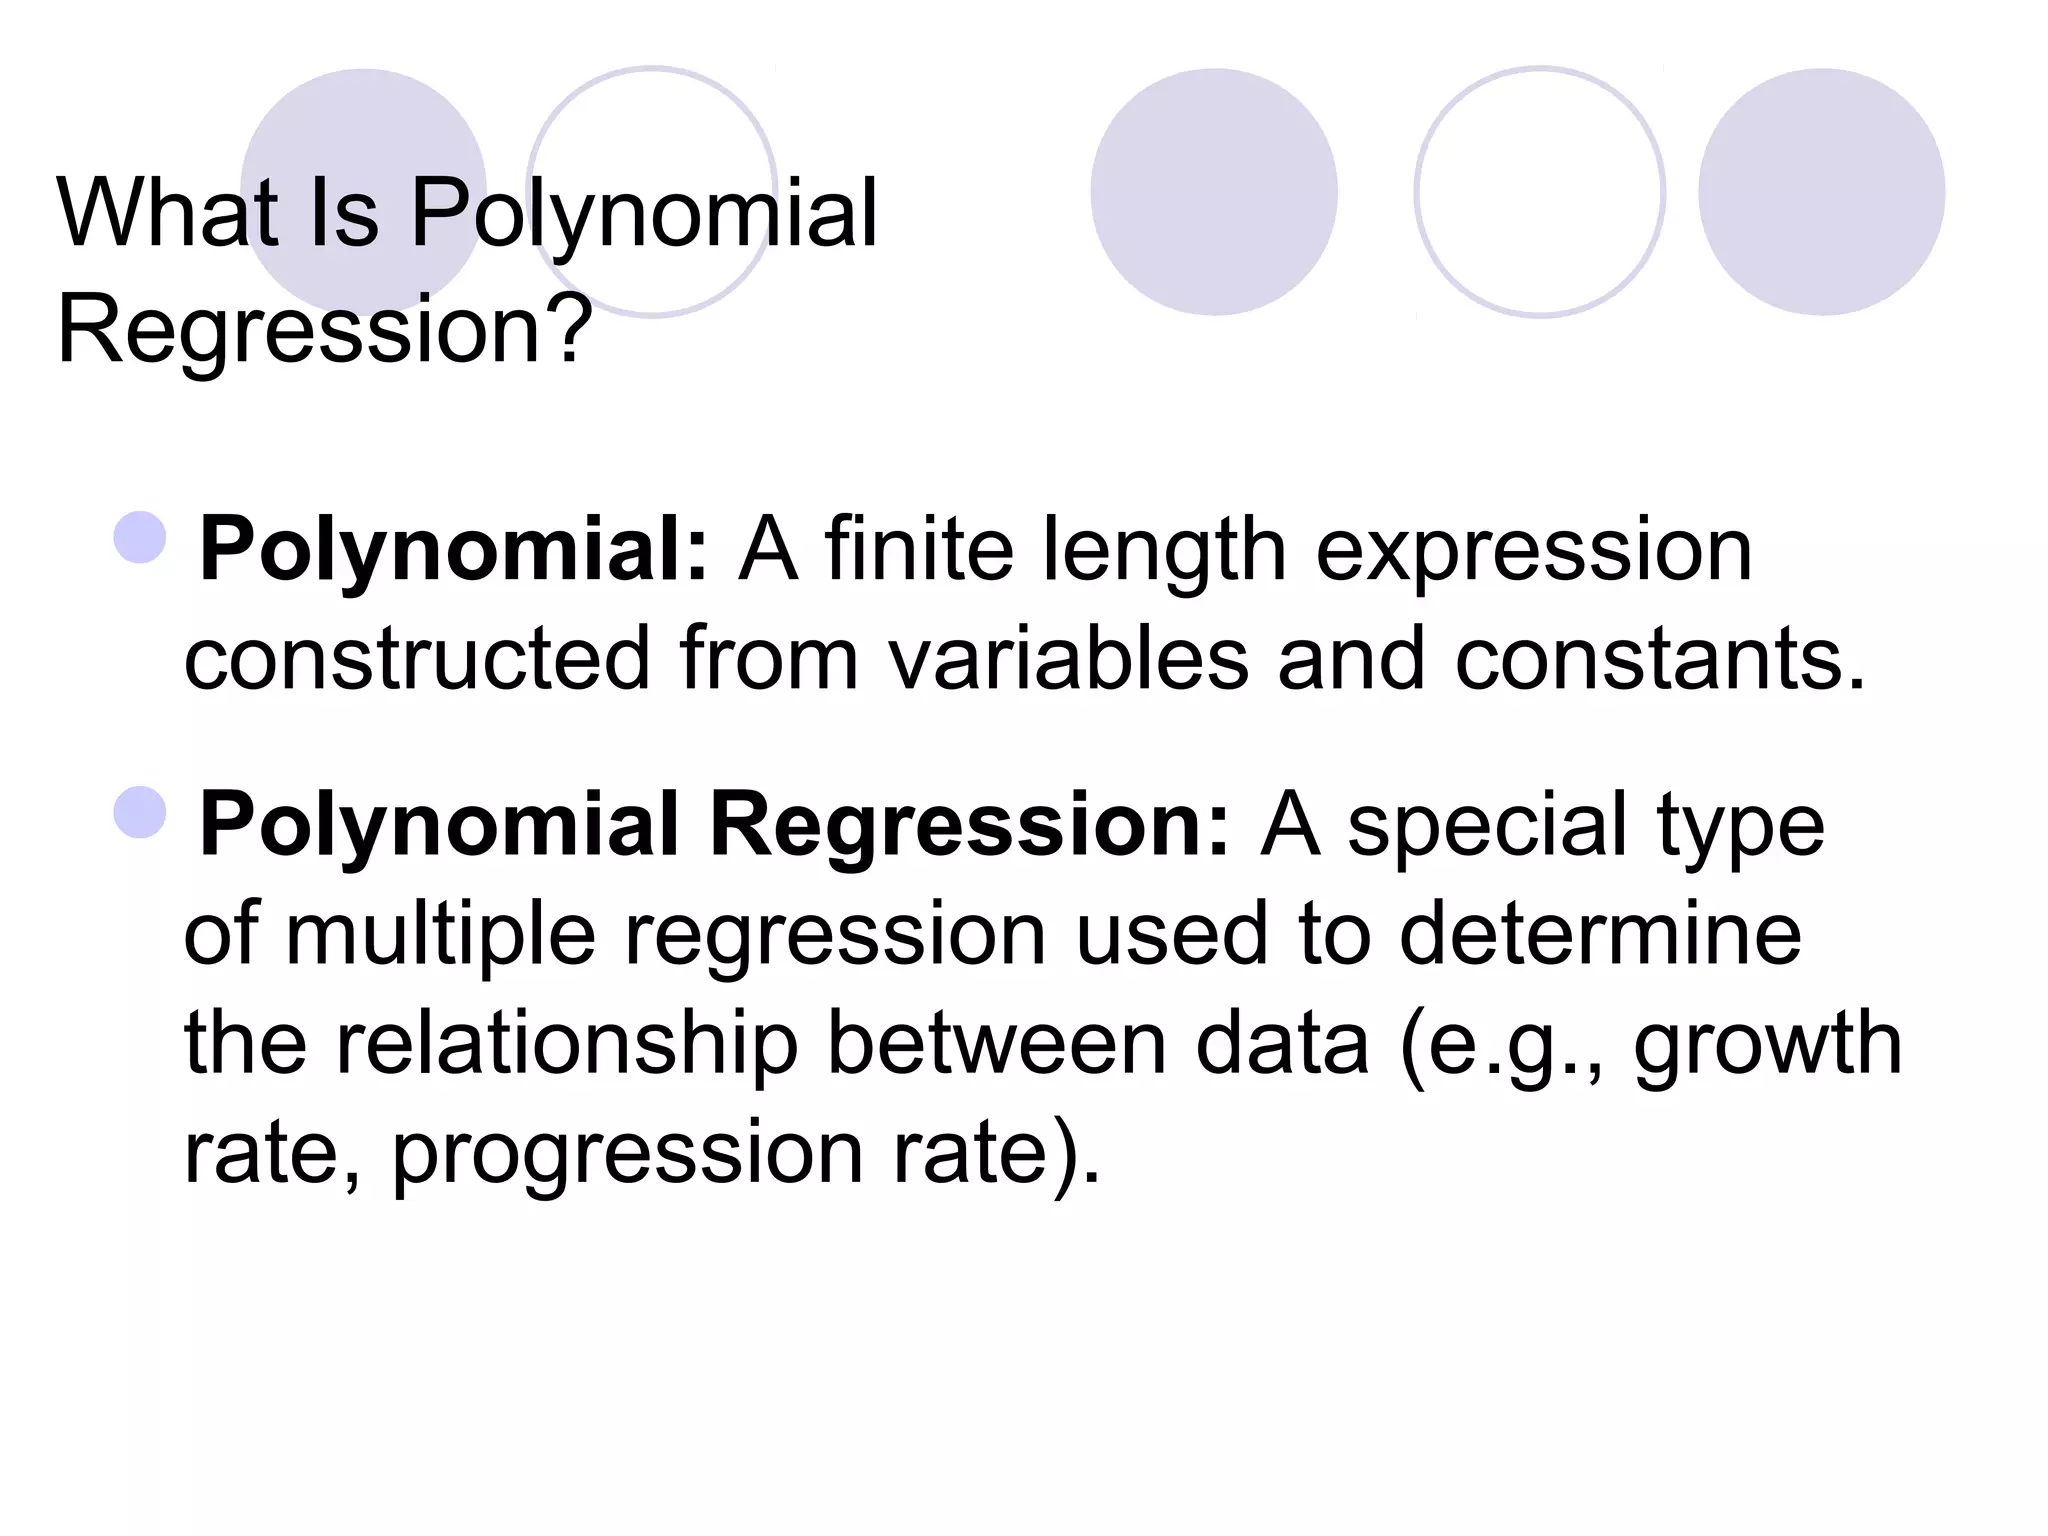
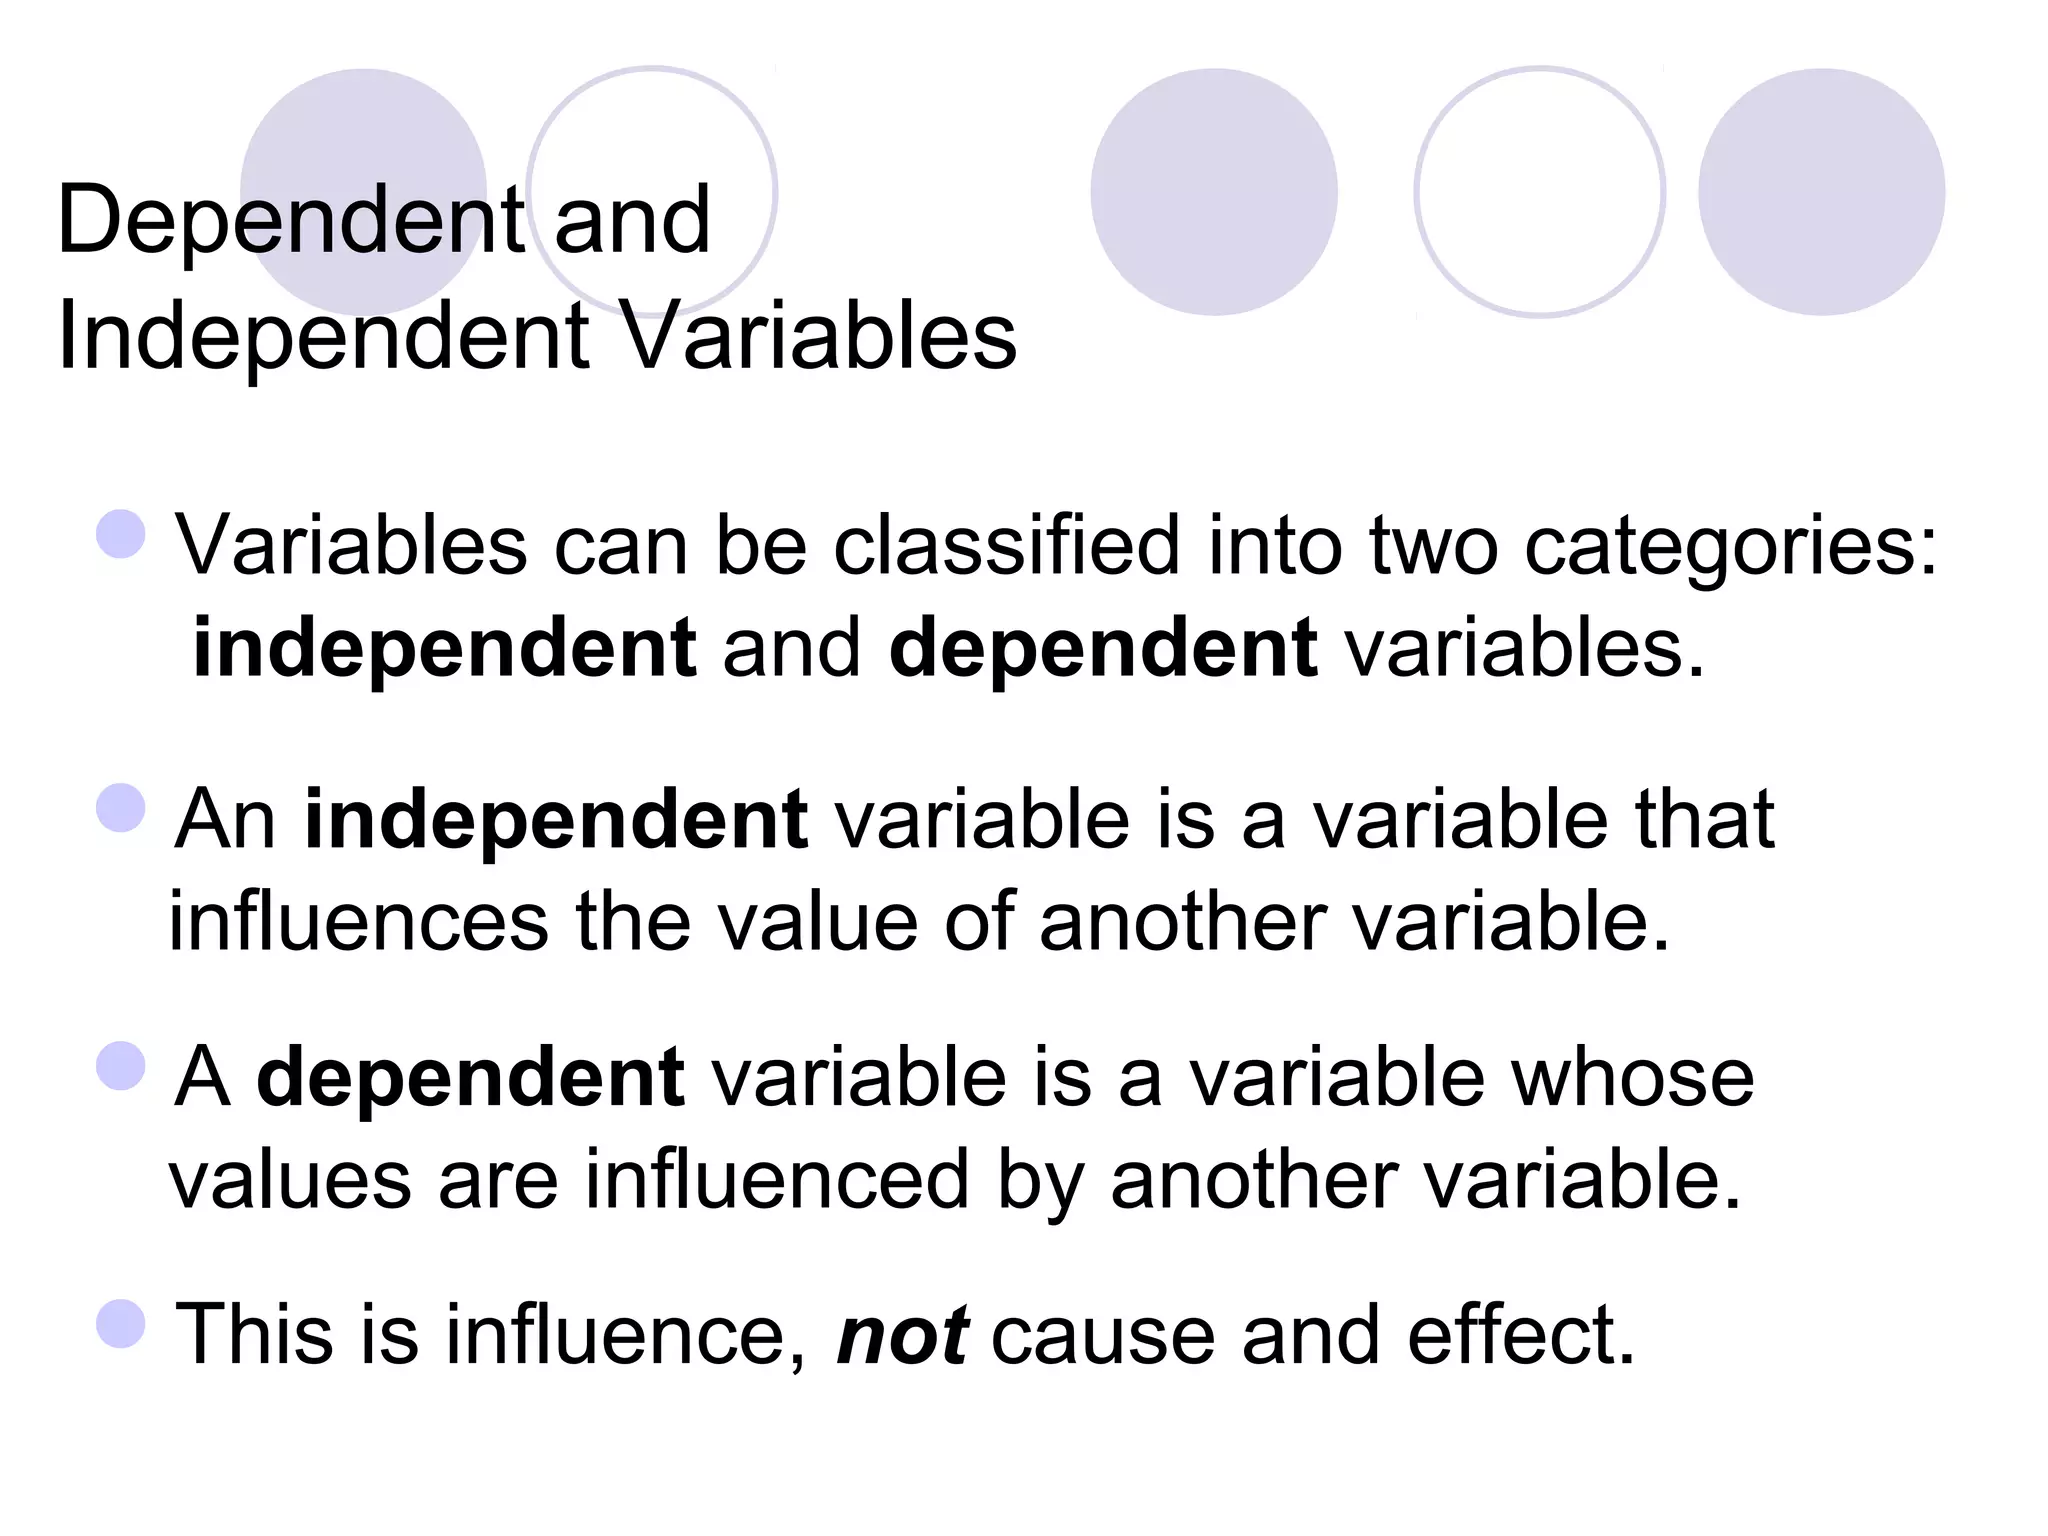
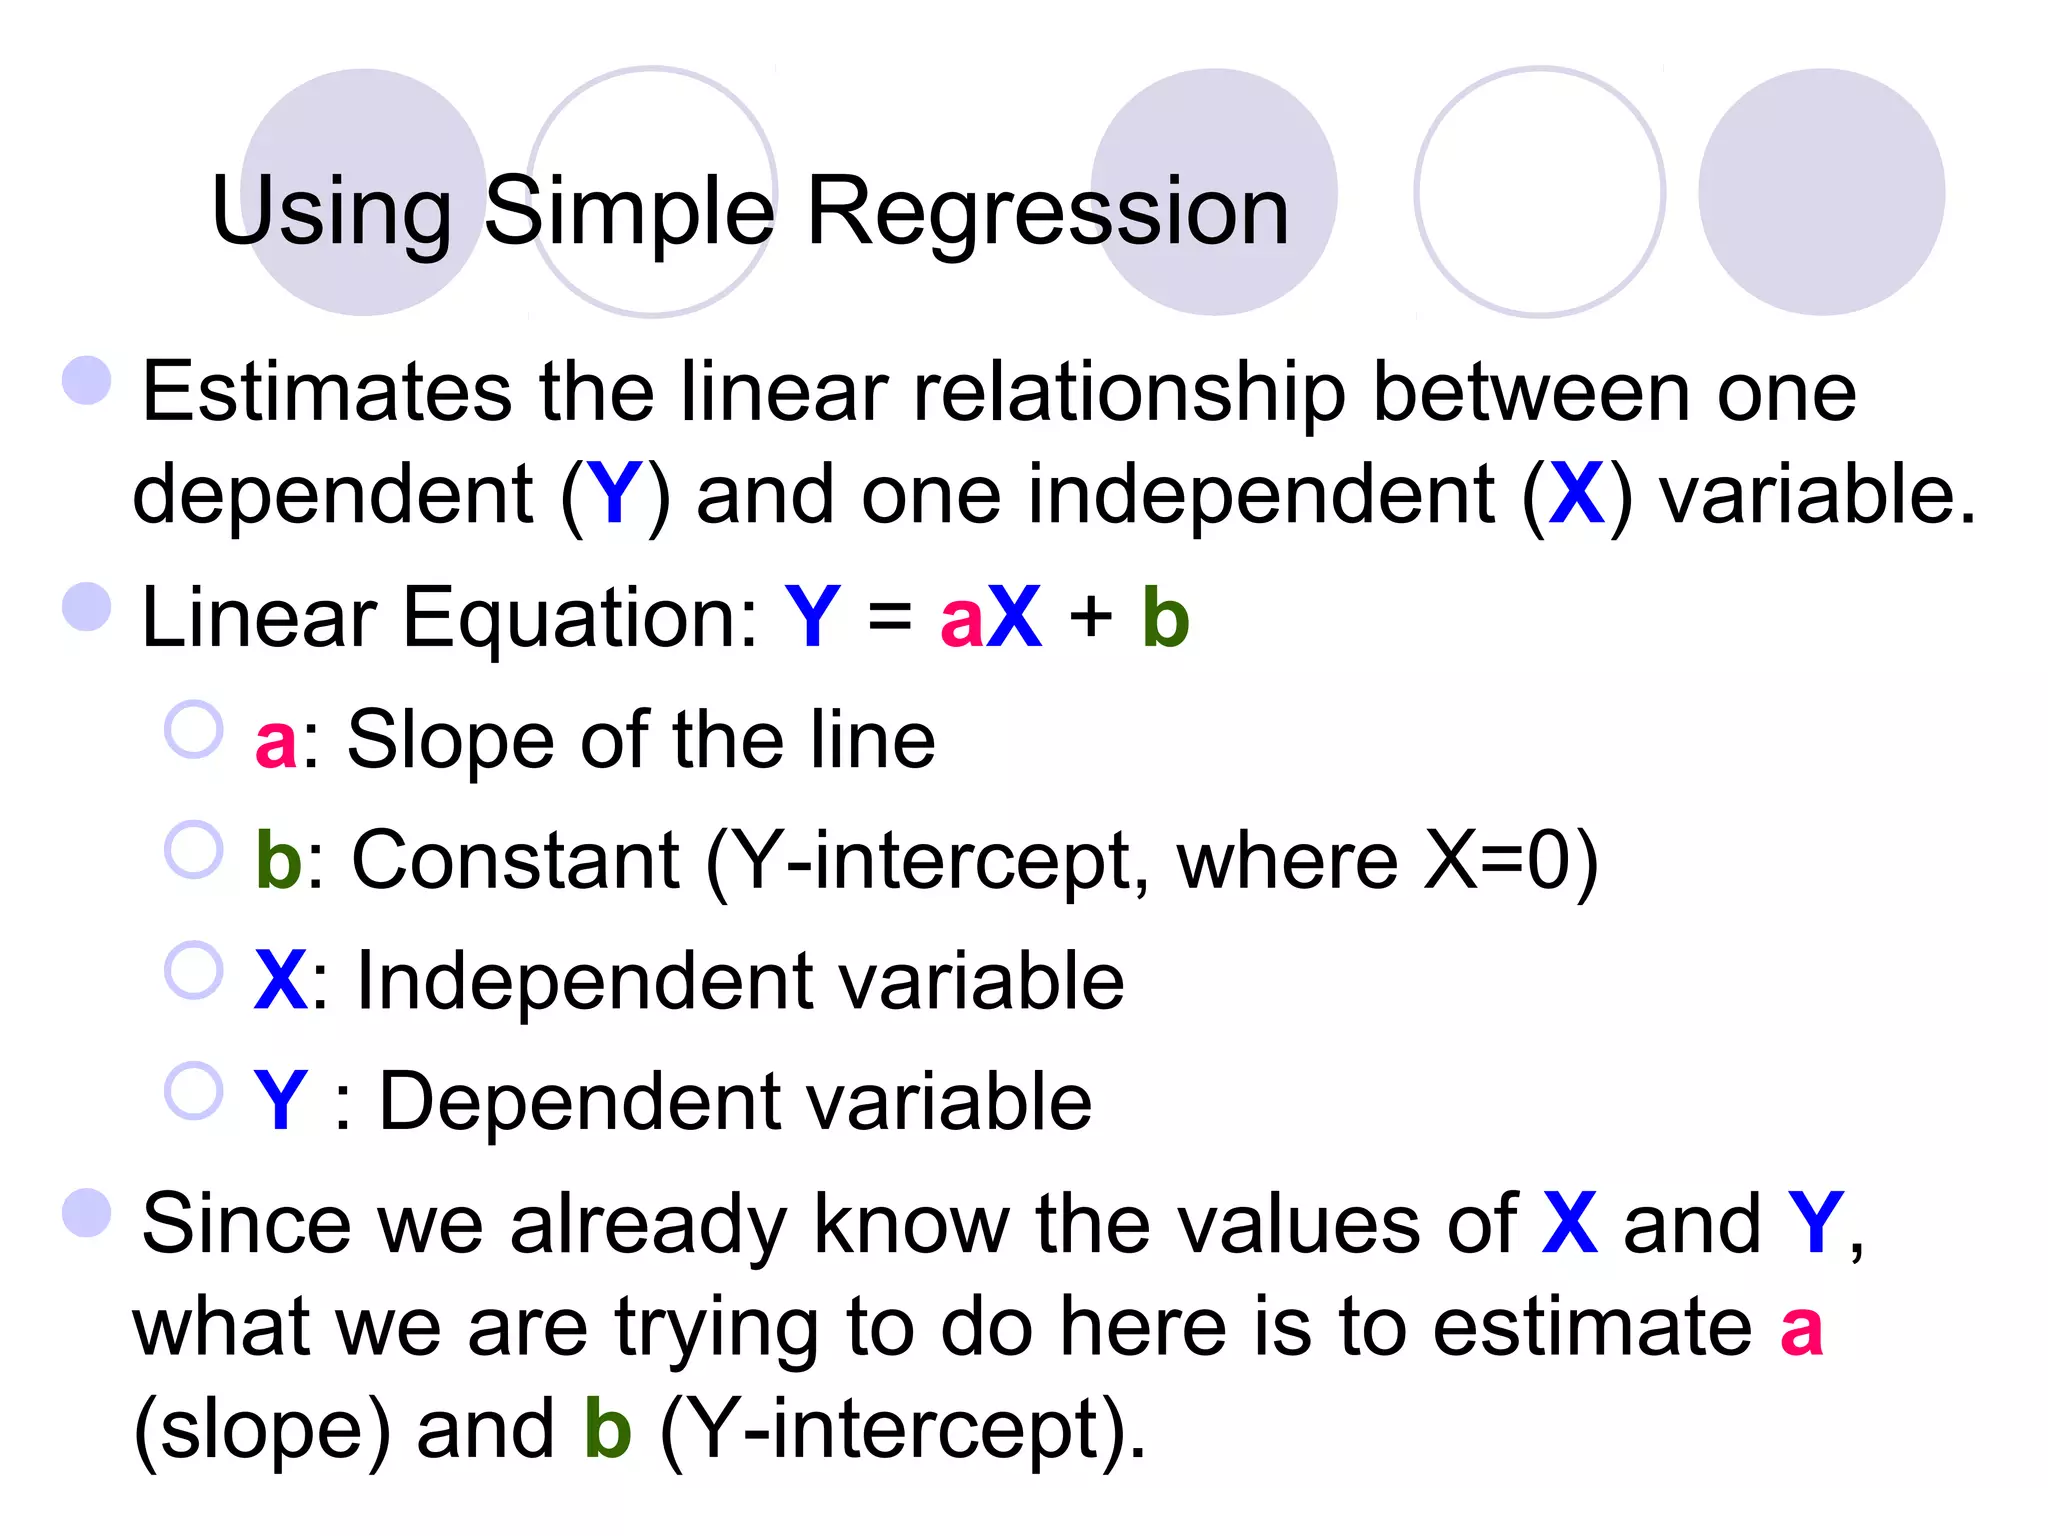
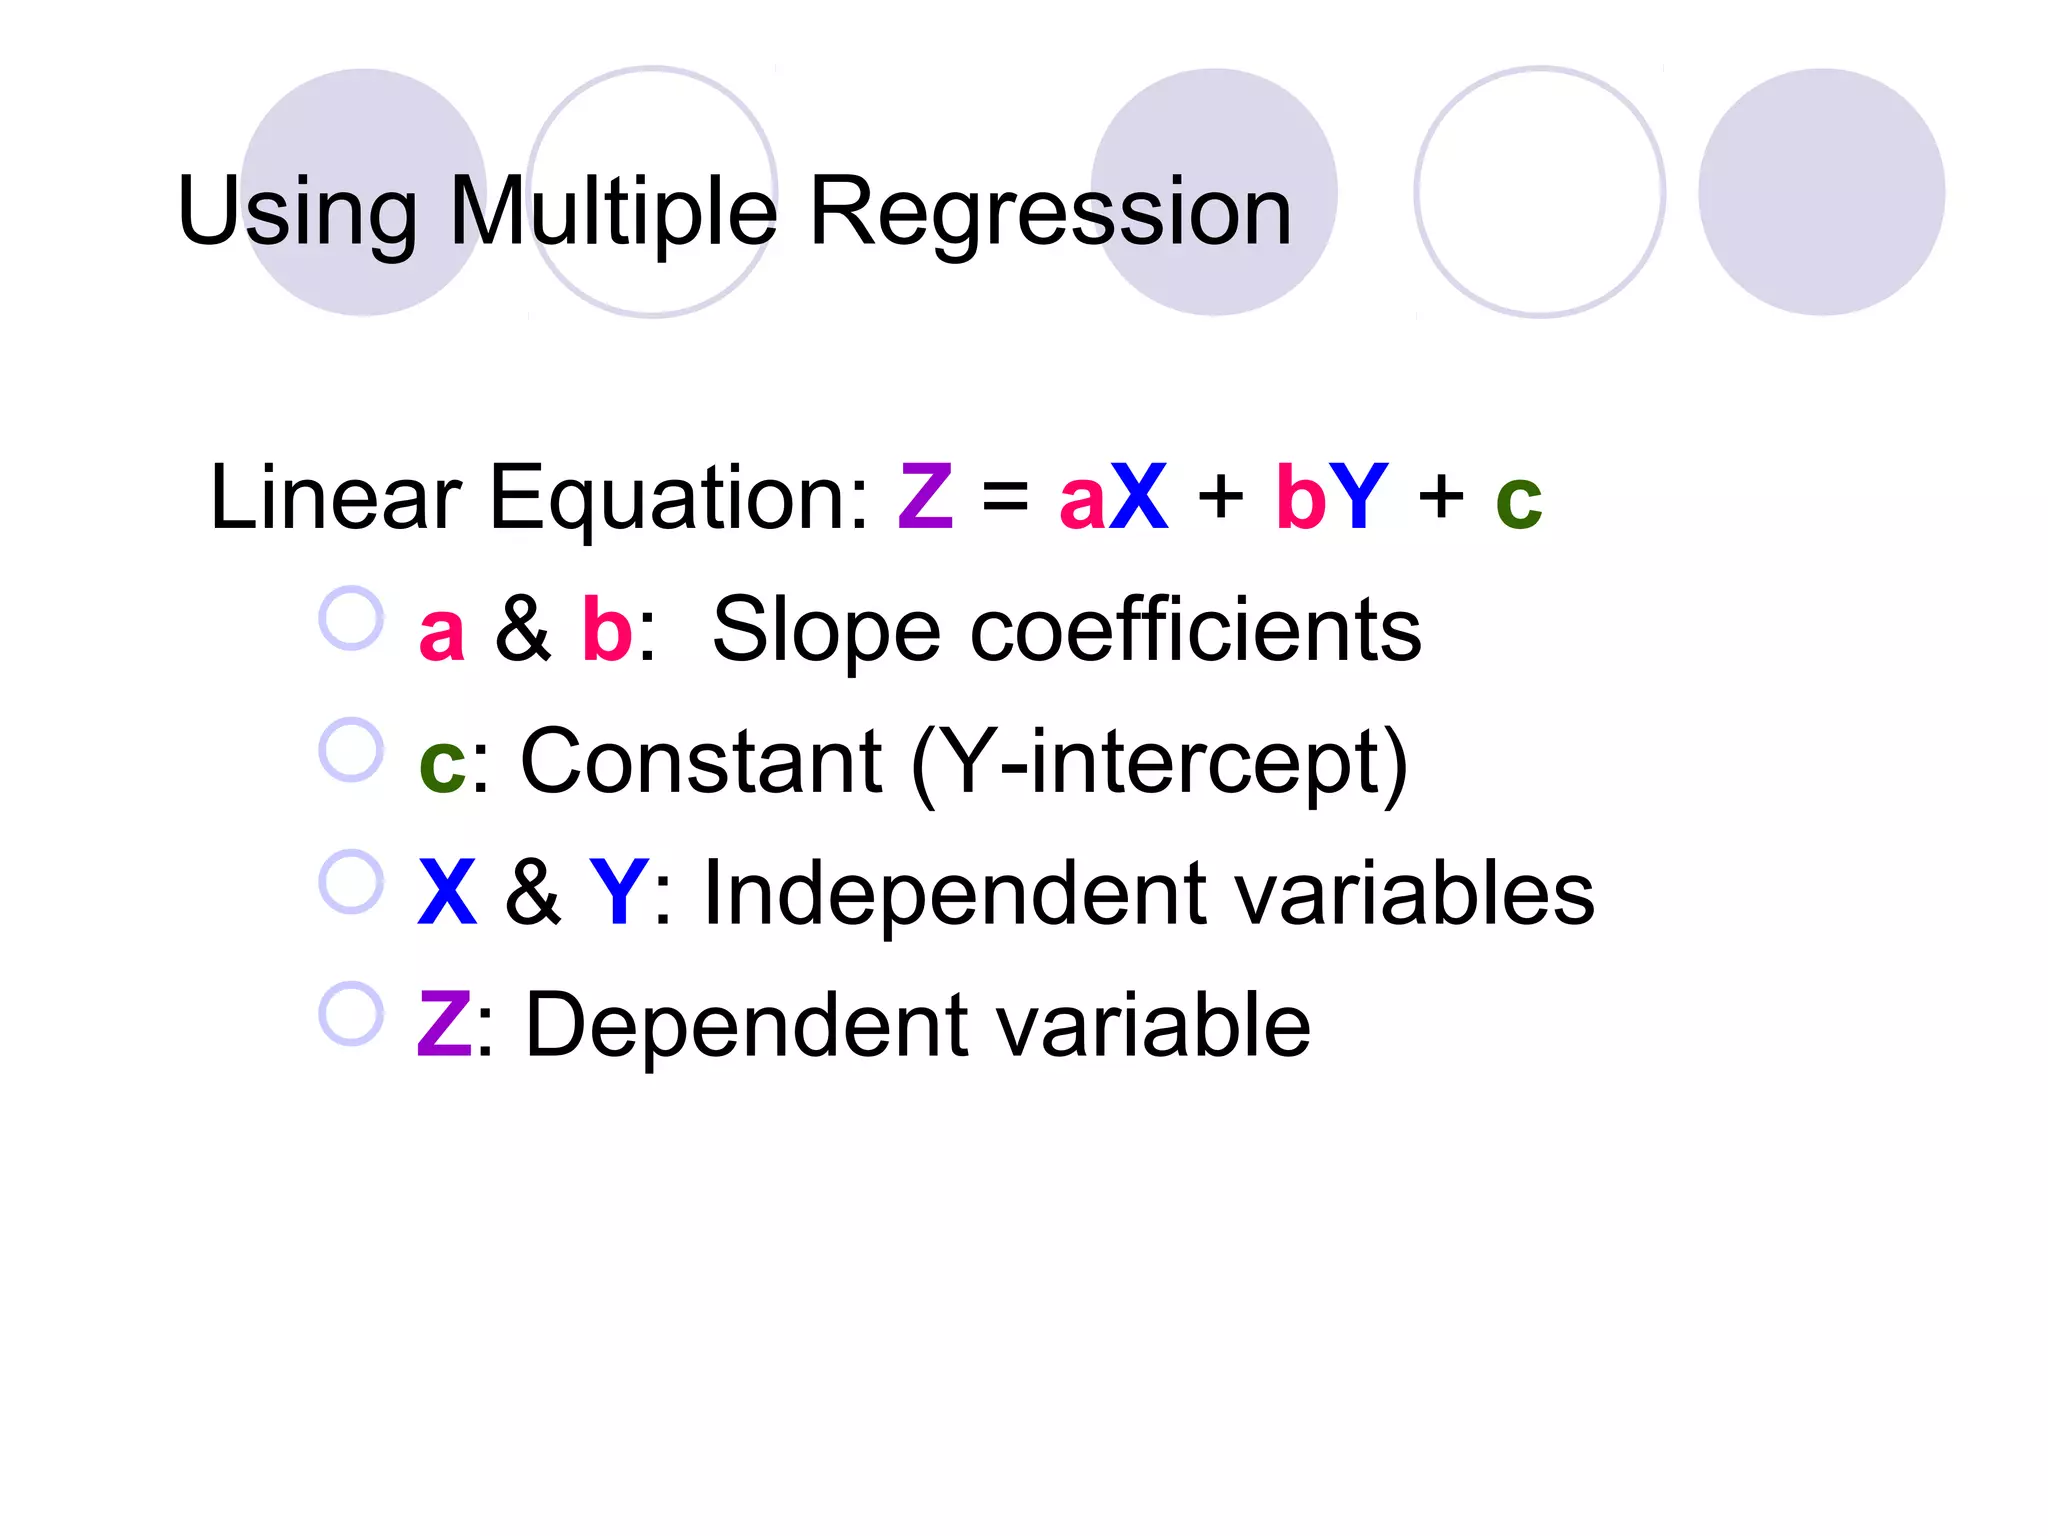
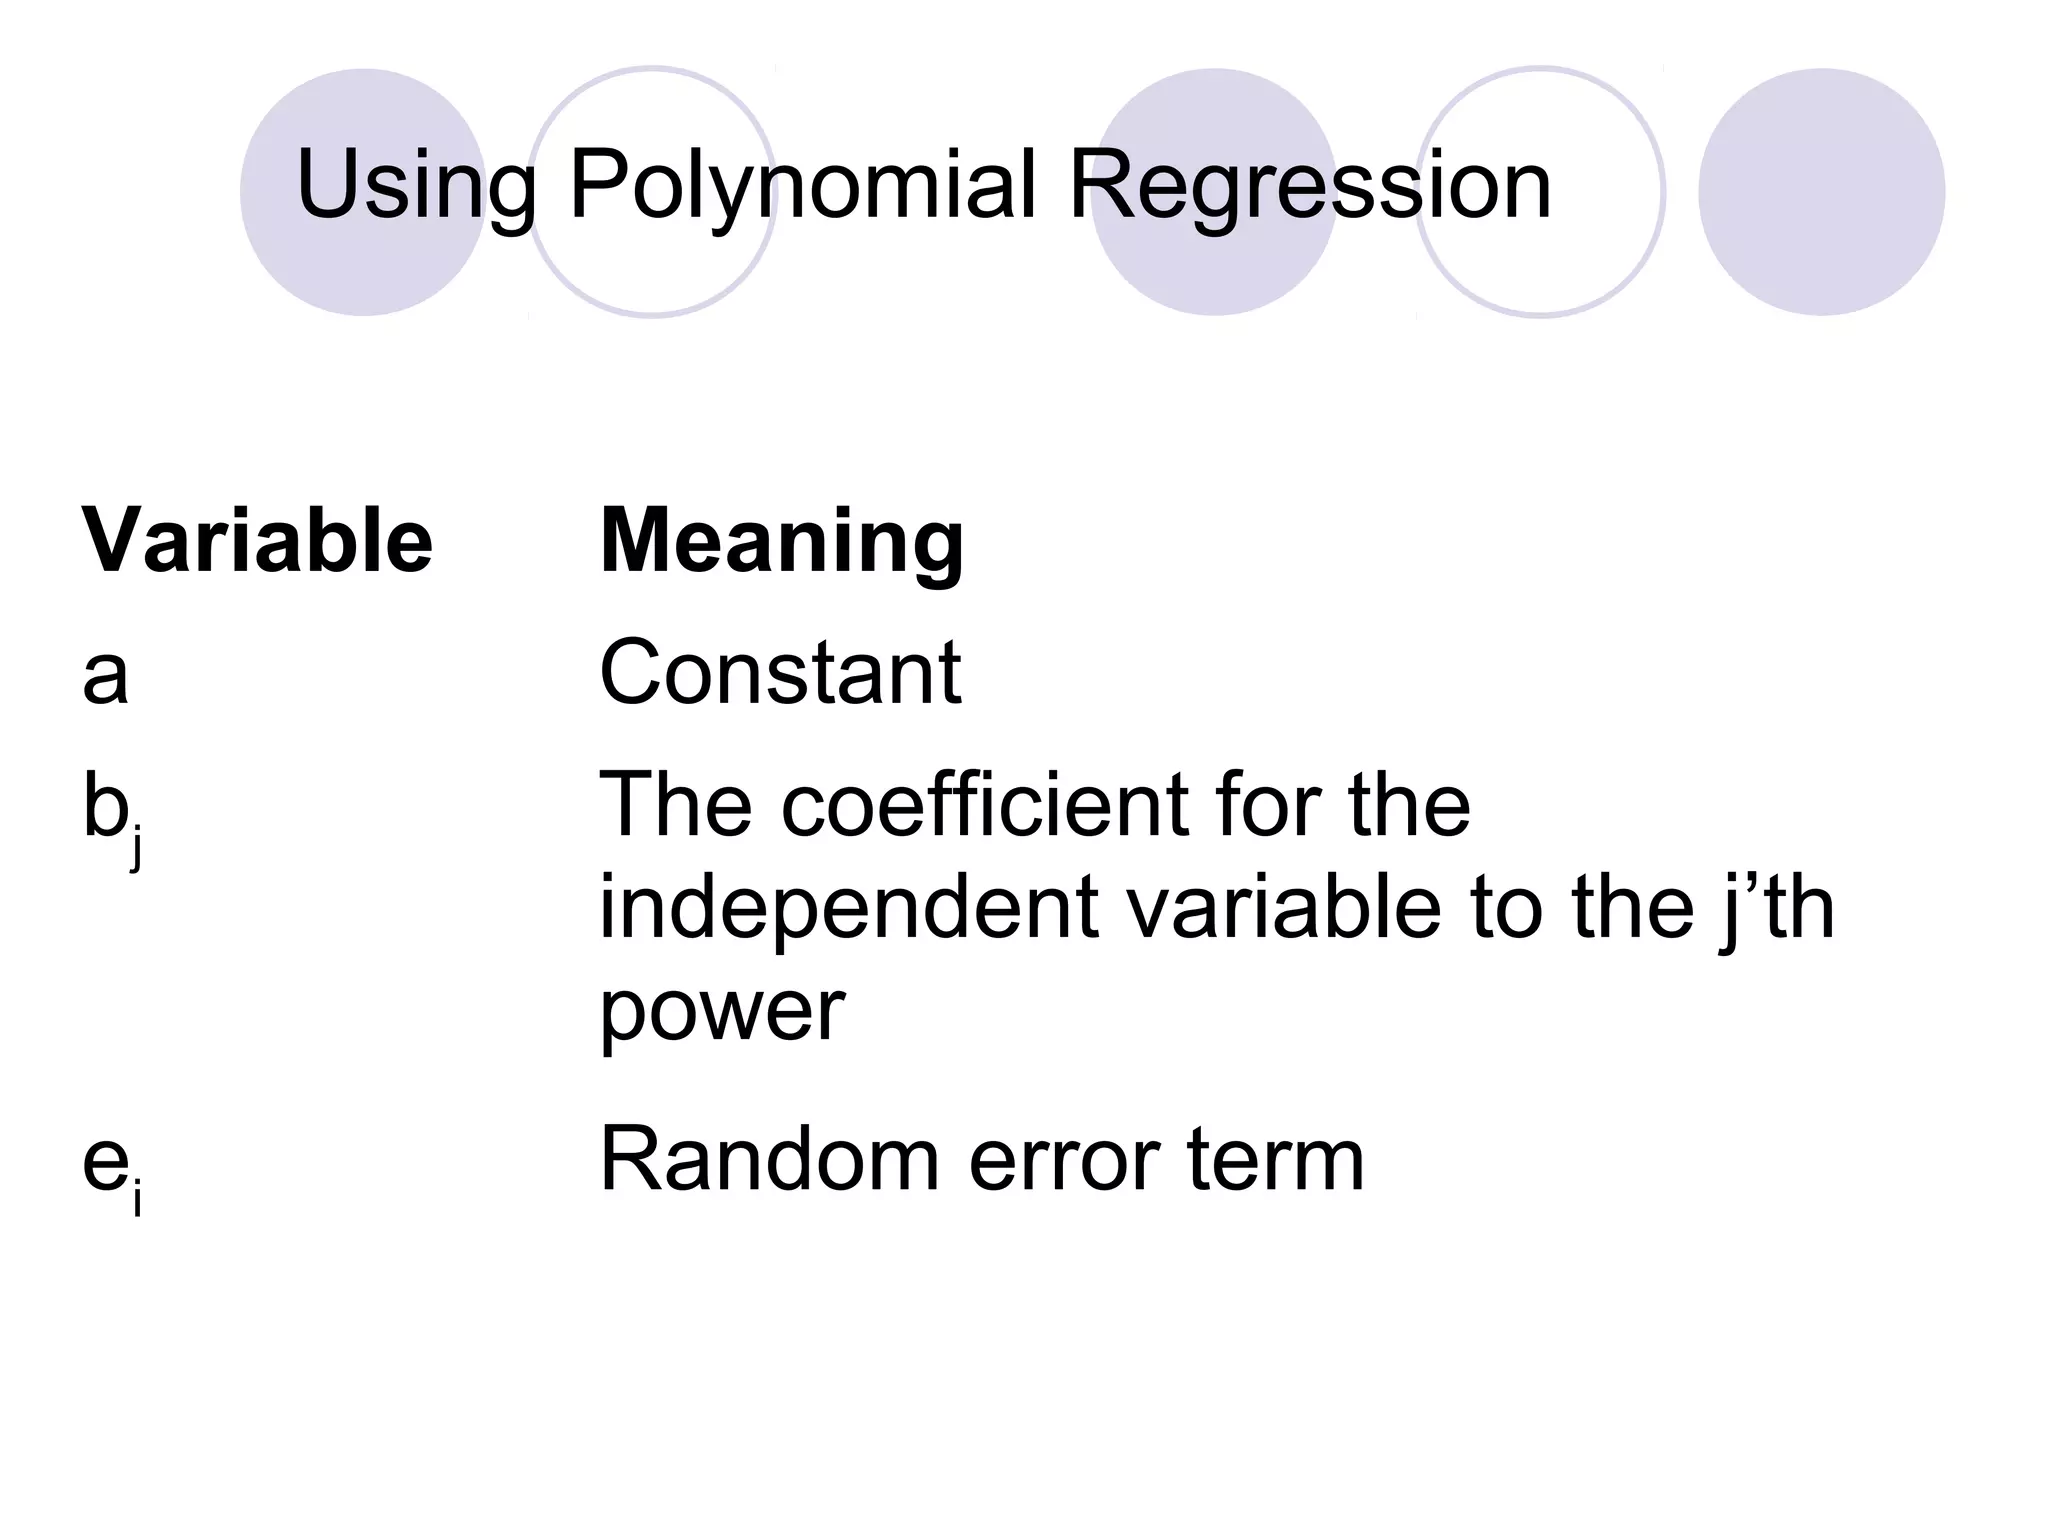
Introduction to linear regression, polynomial regression, and the classification of variables.
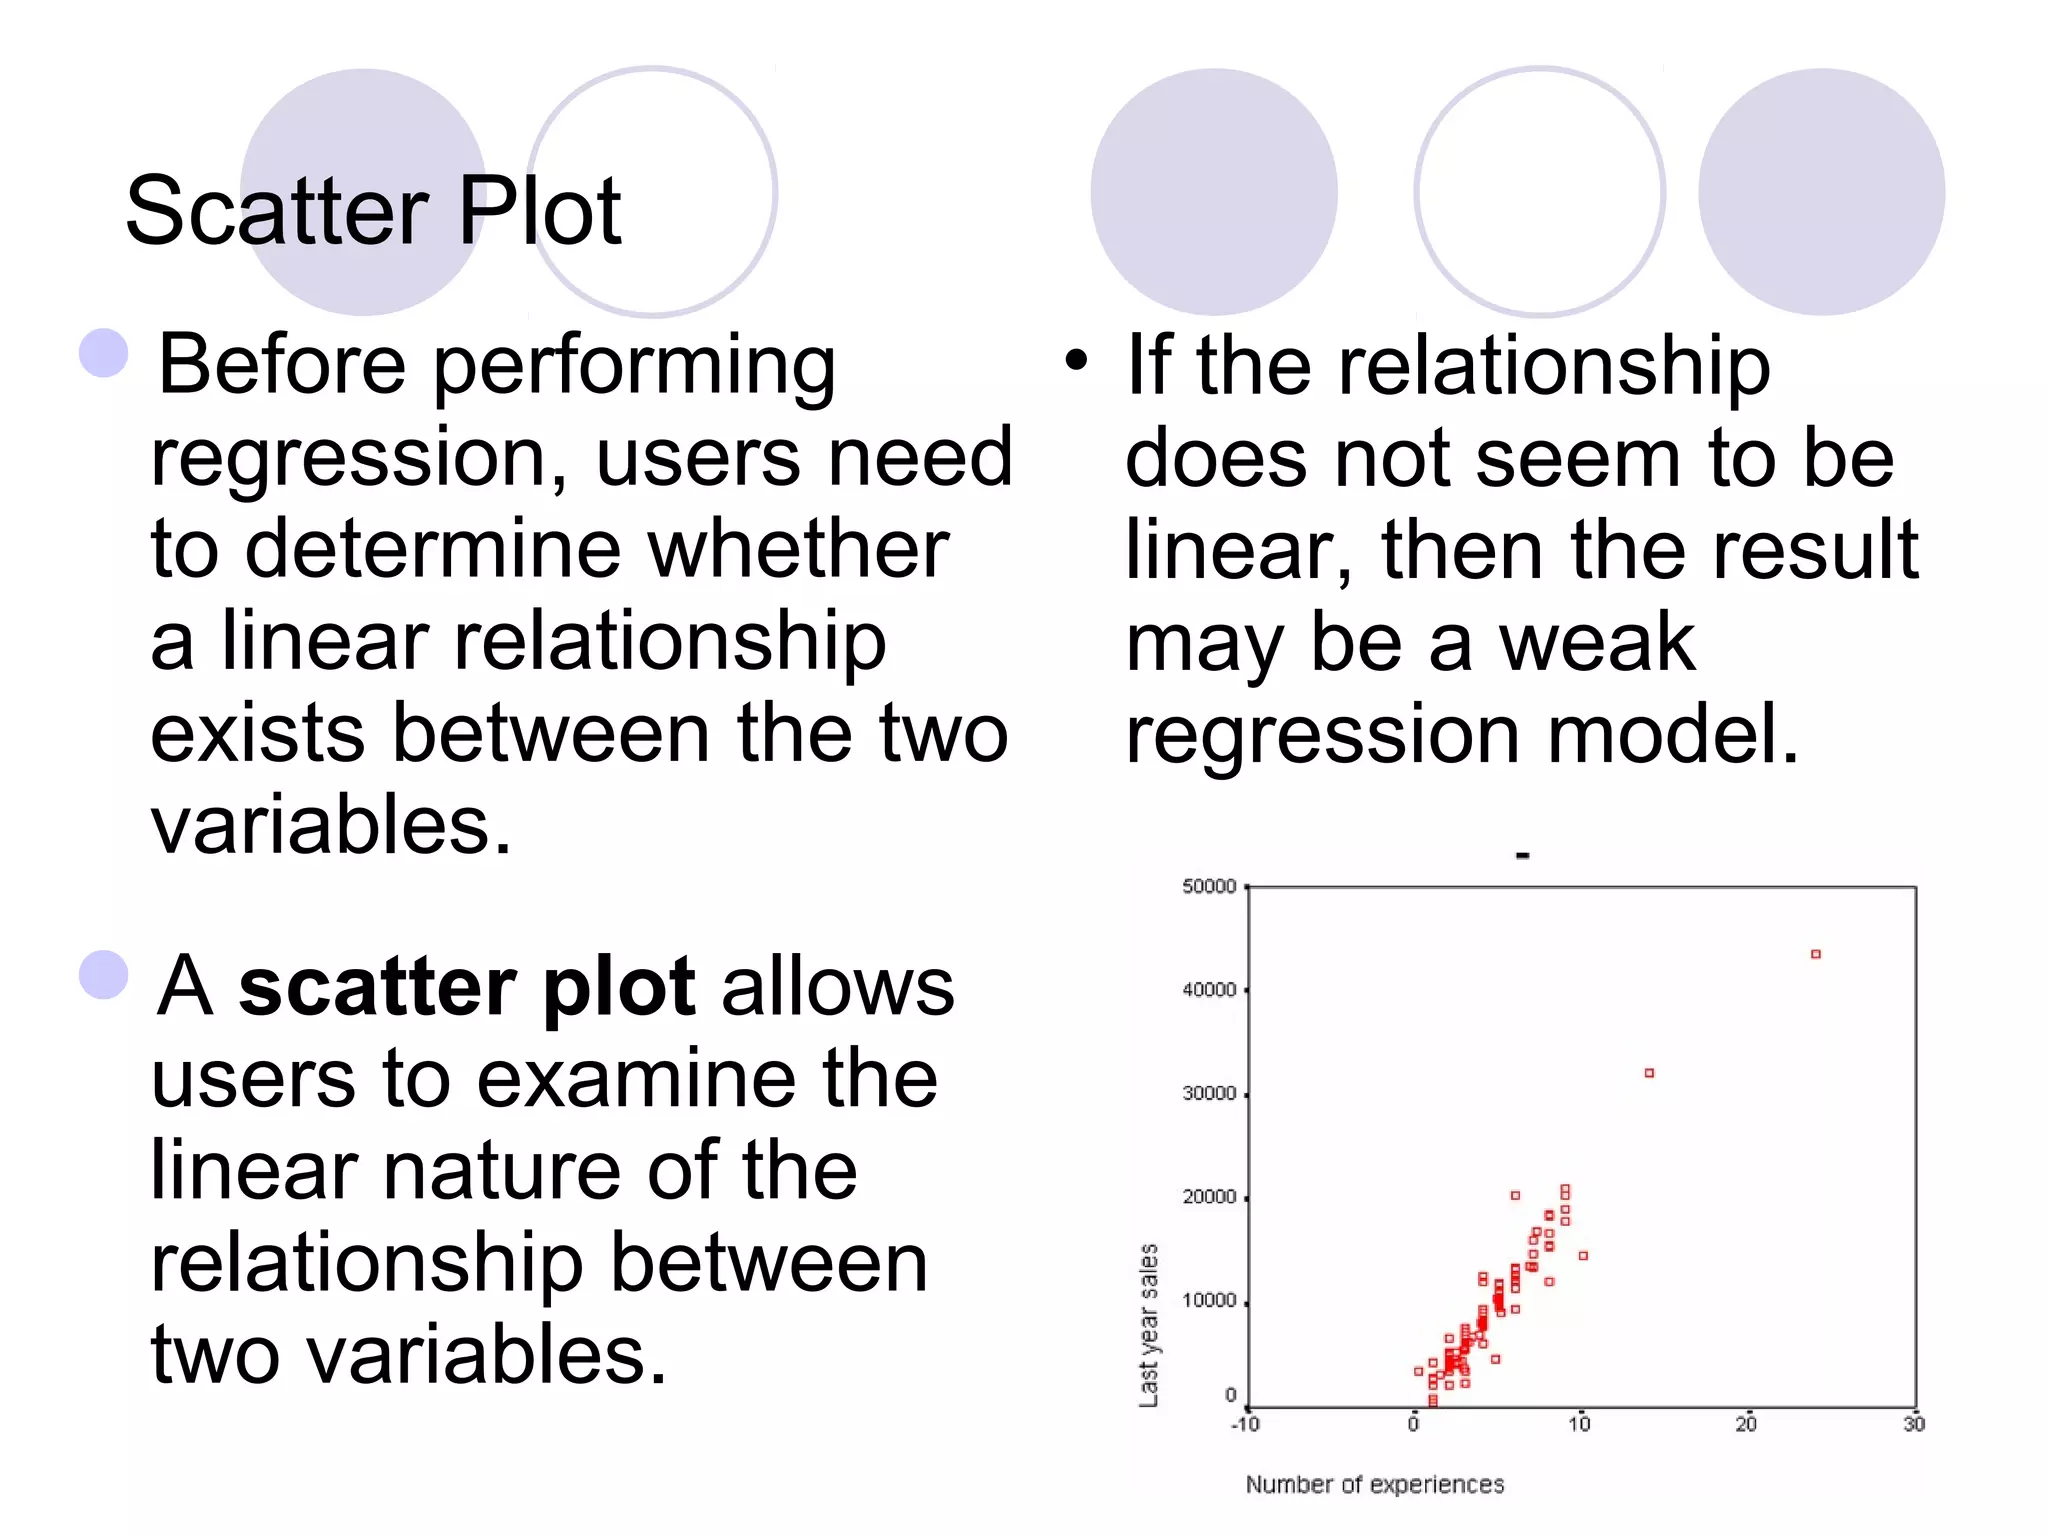
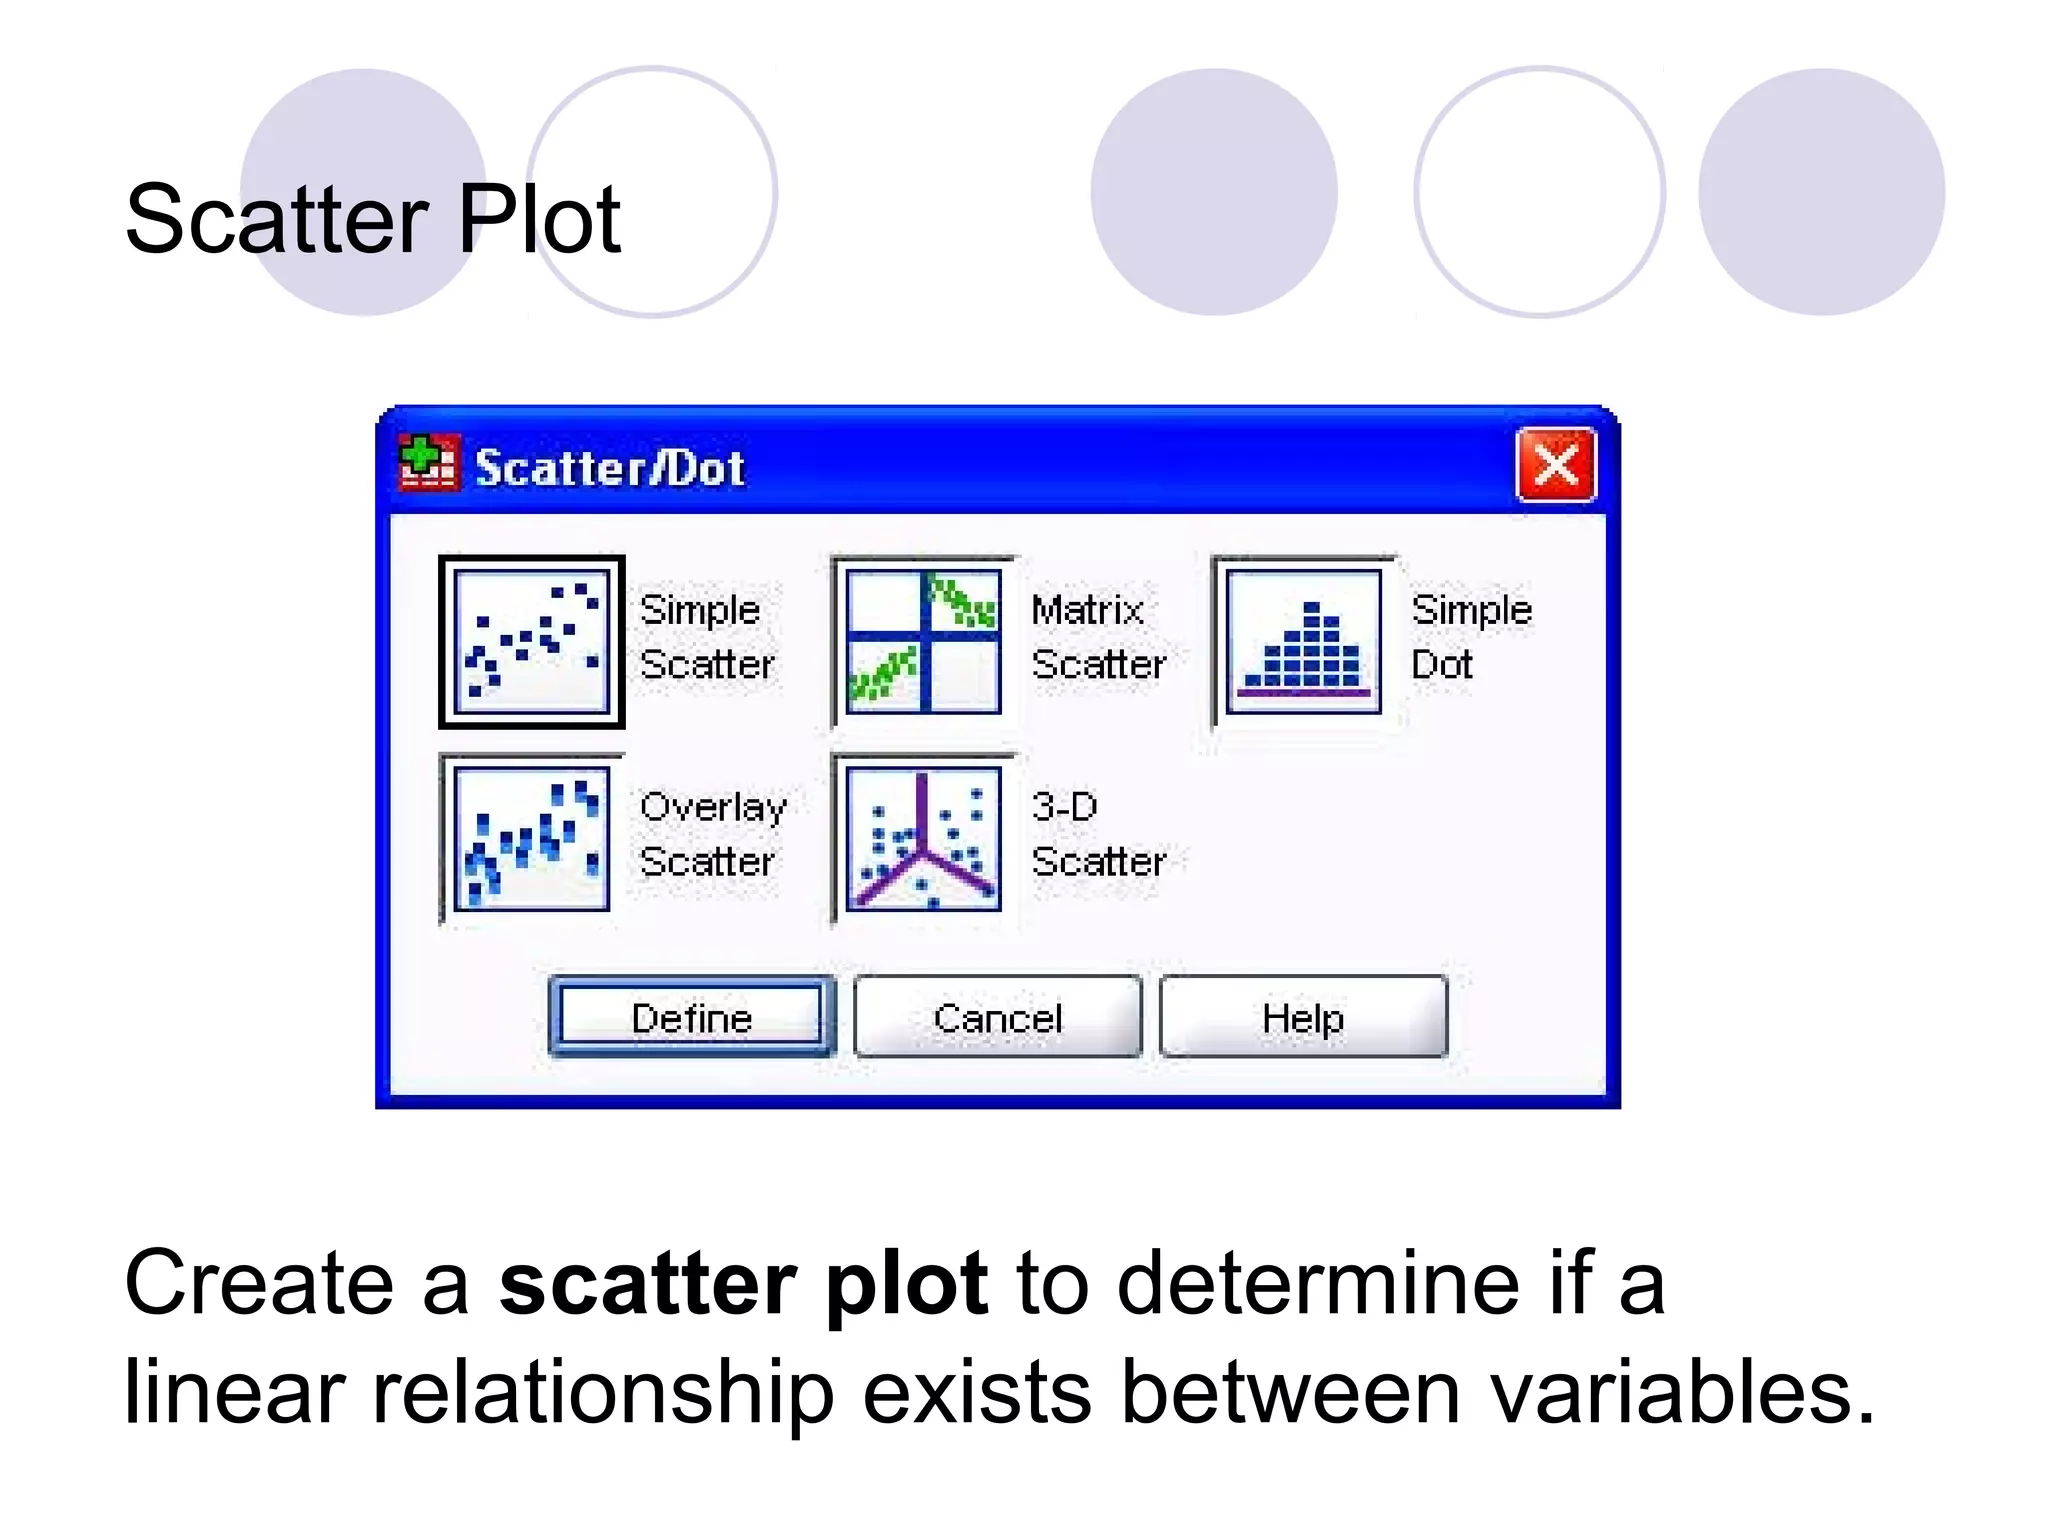
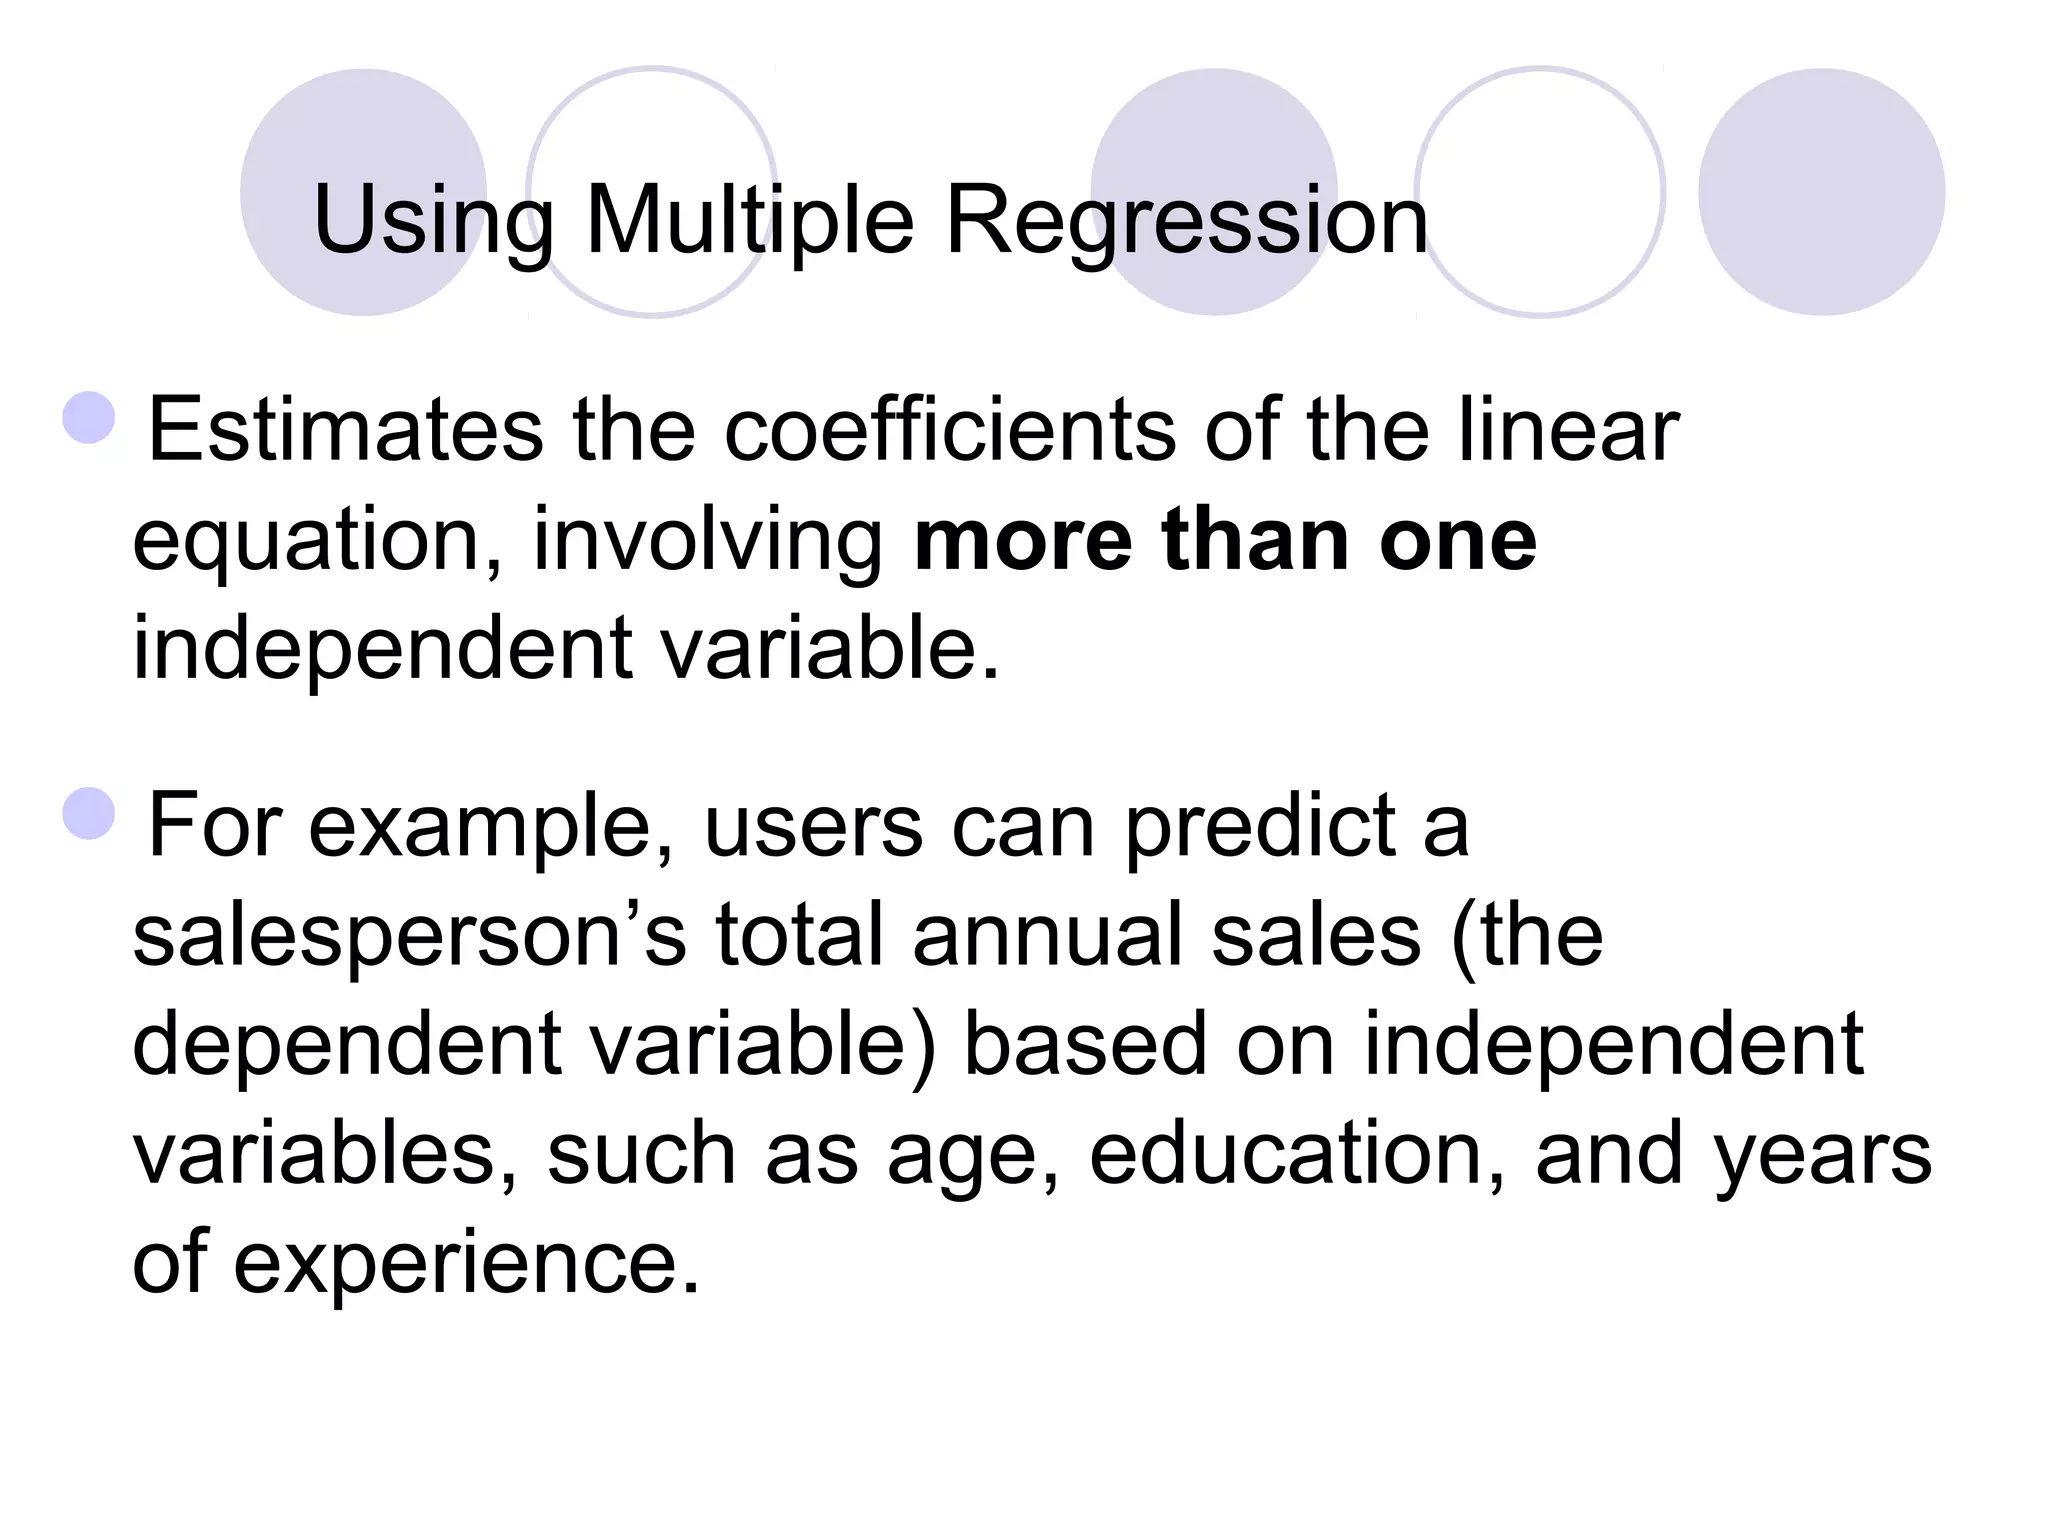
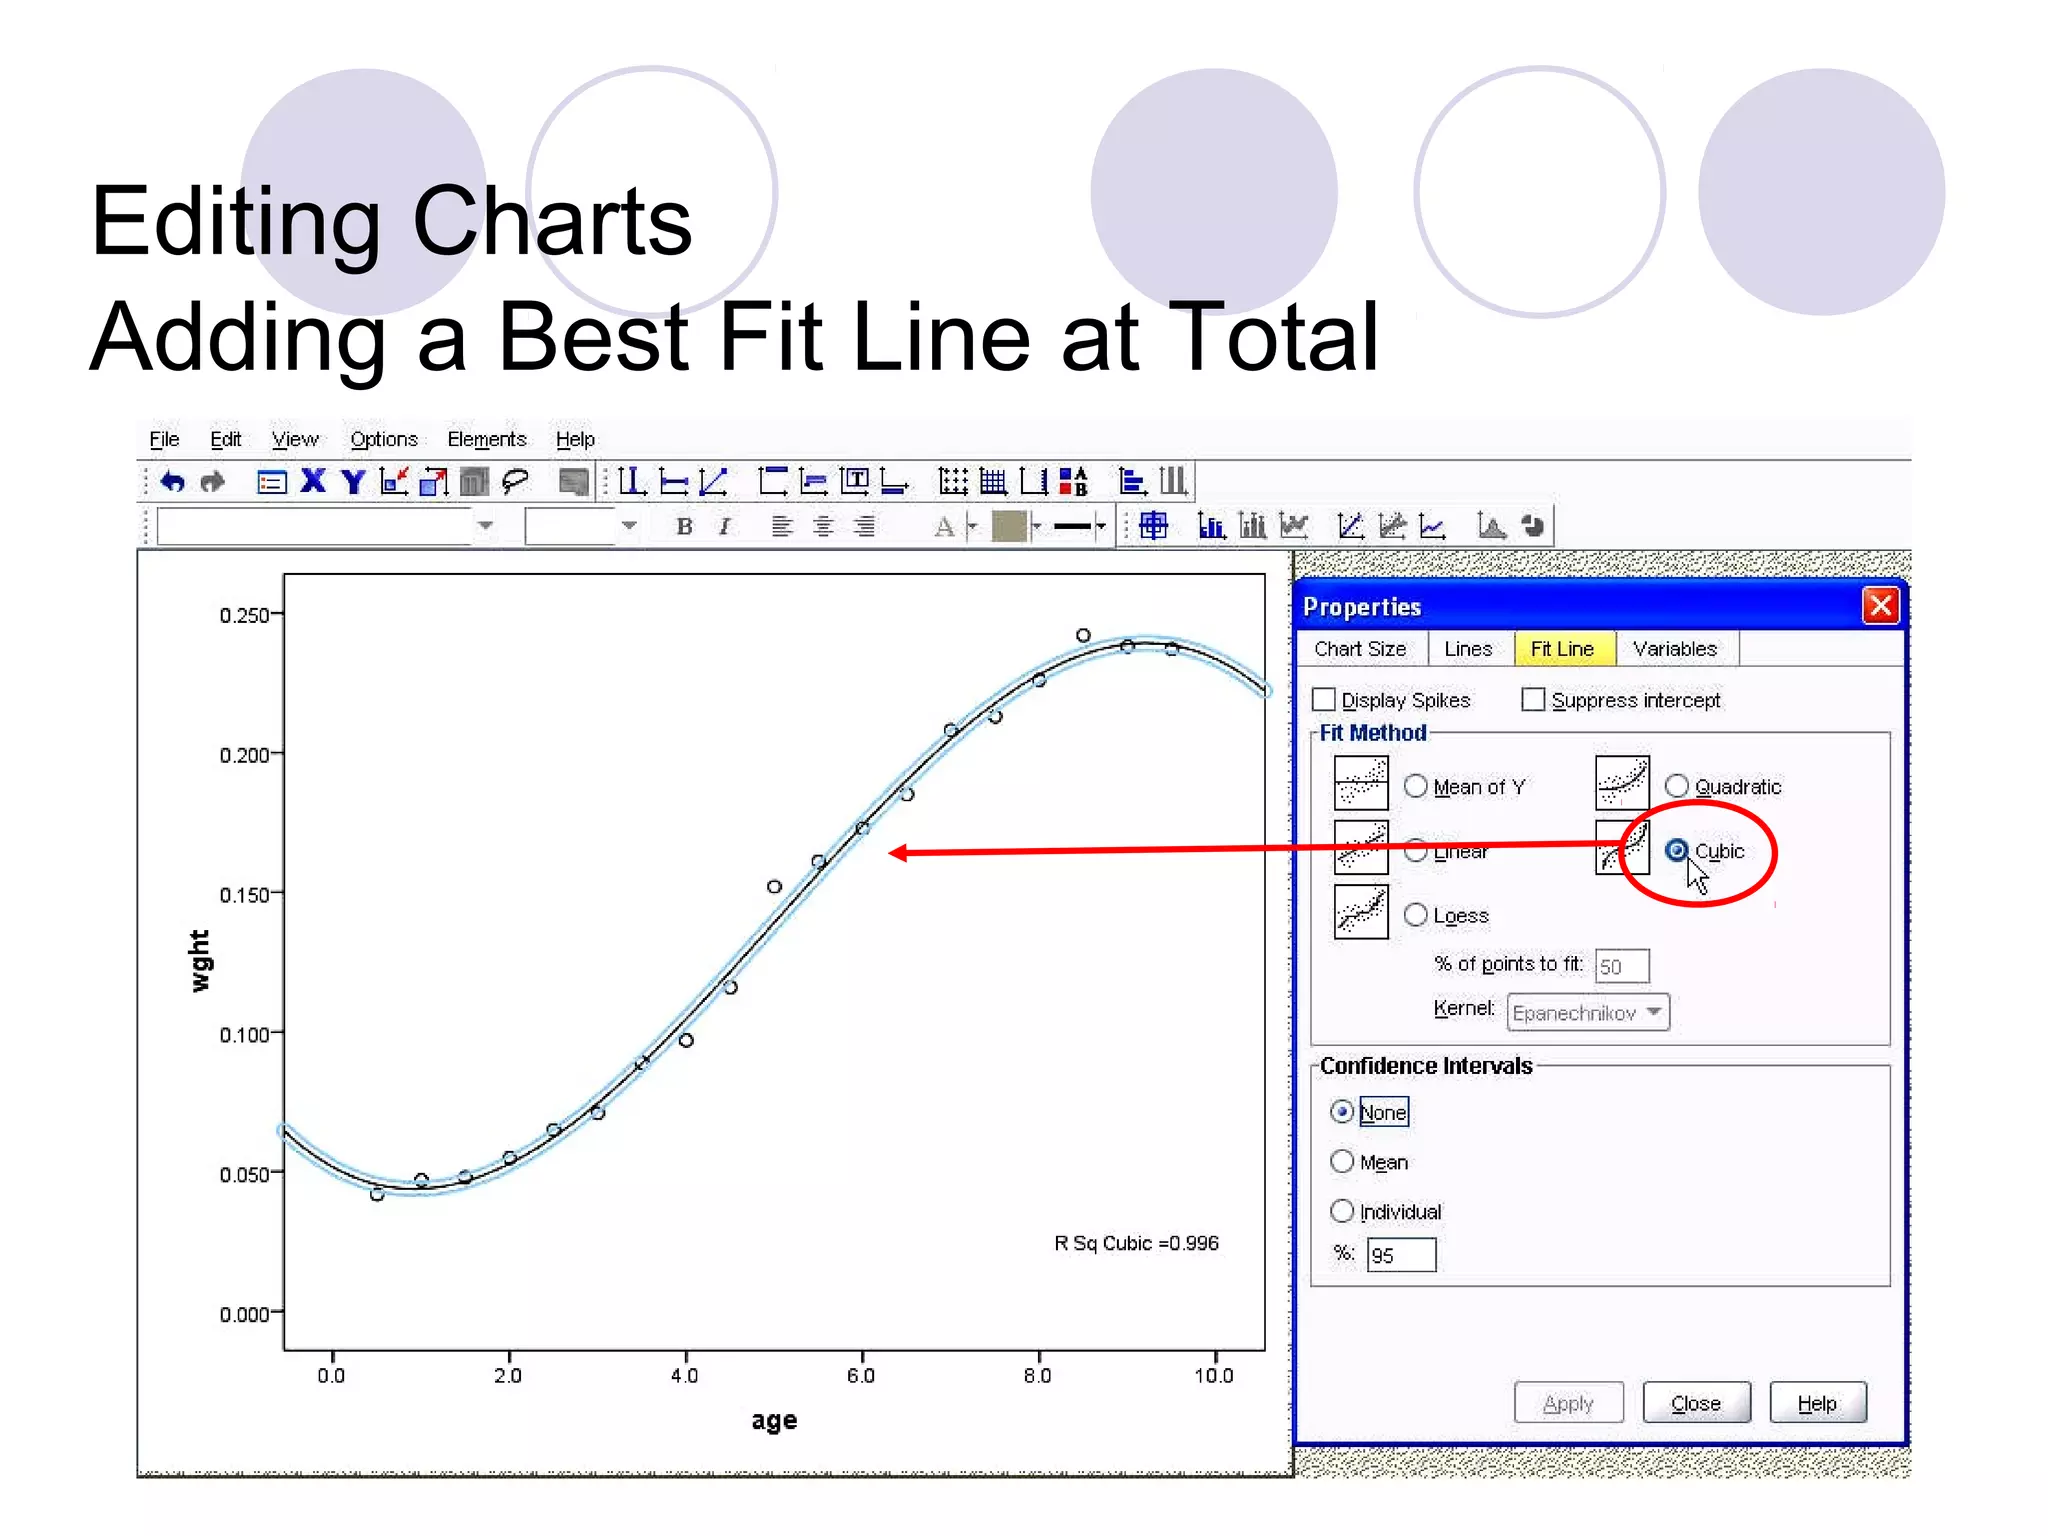
Utilizing scatter plots for linear relationships, performing simple and multiple regression analysis.
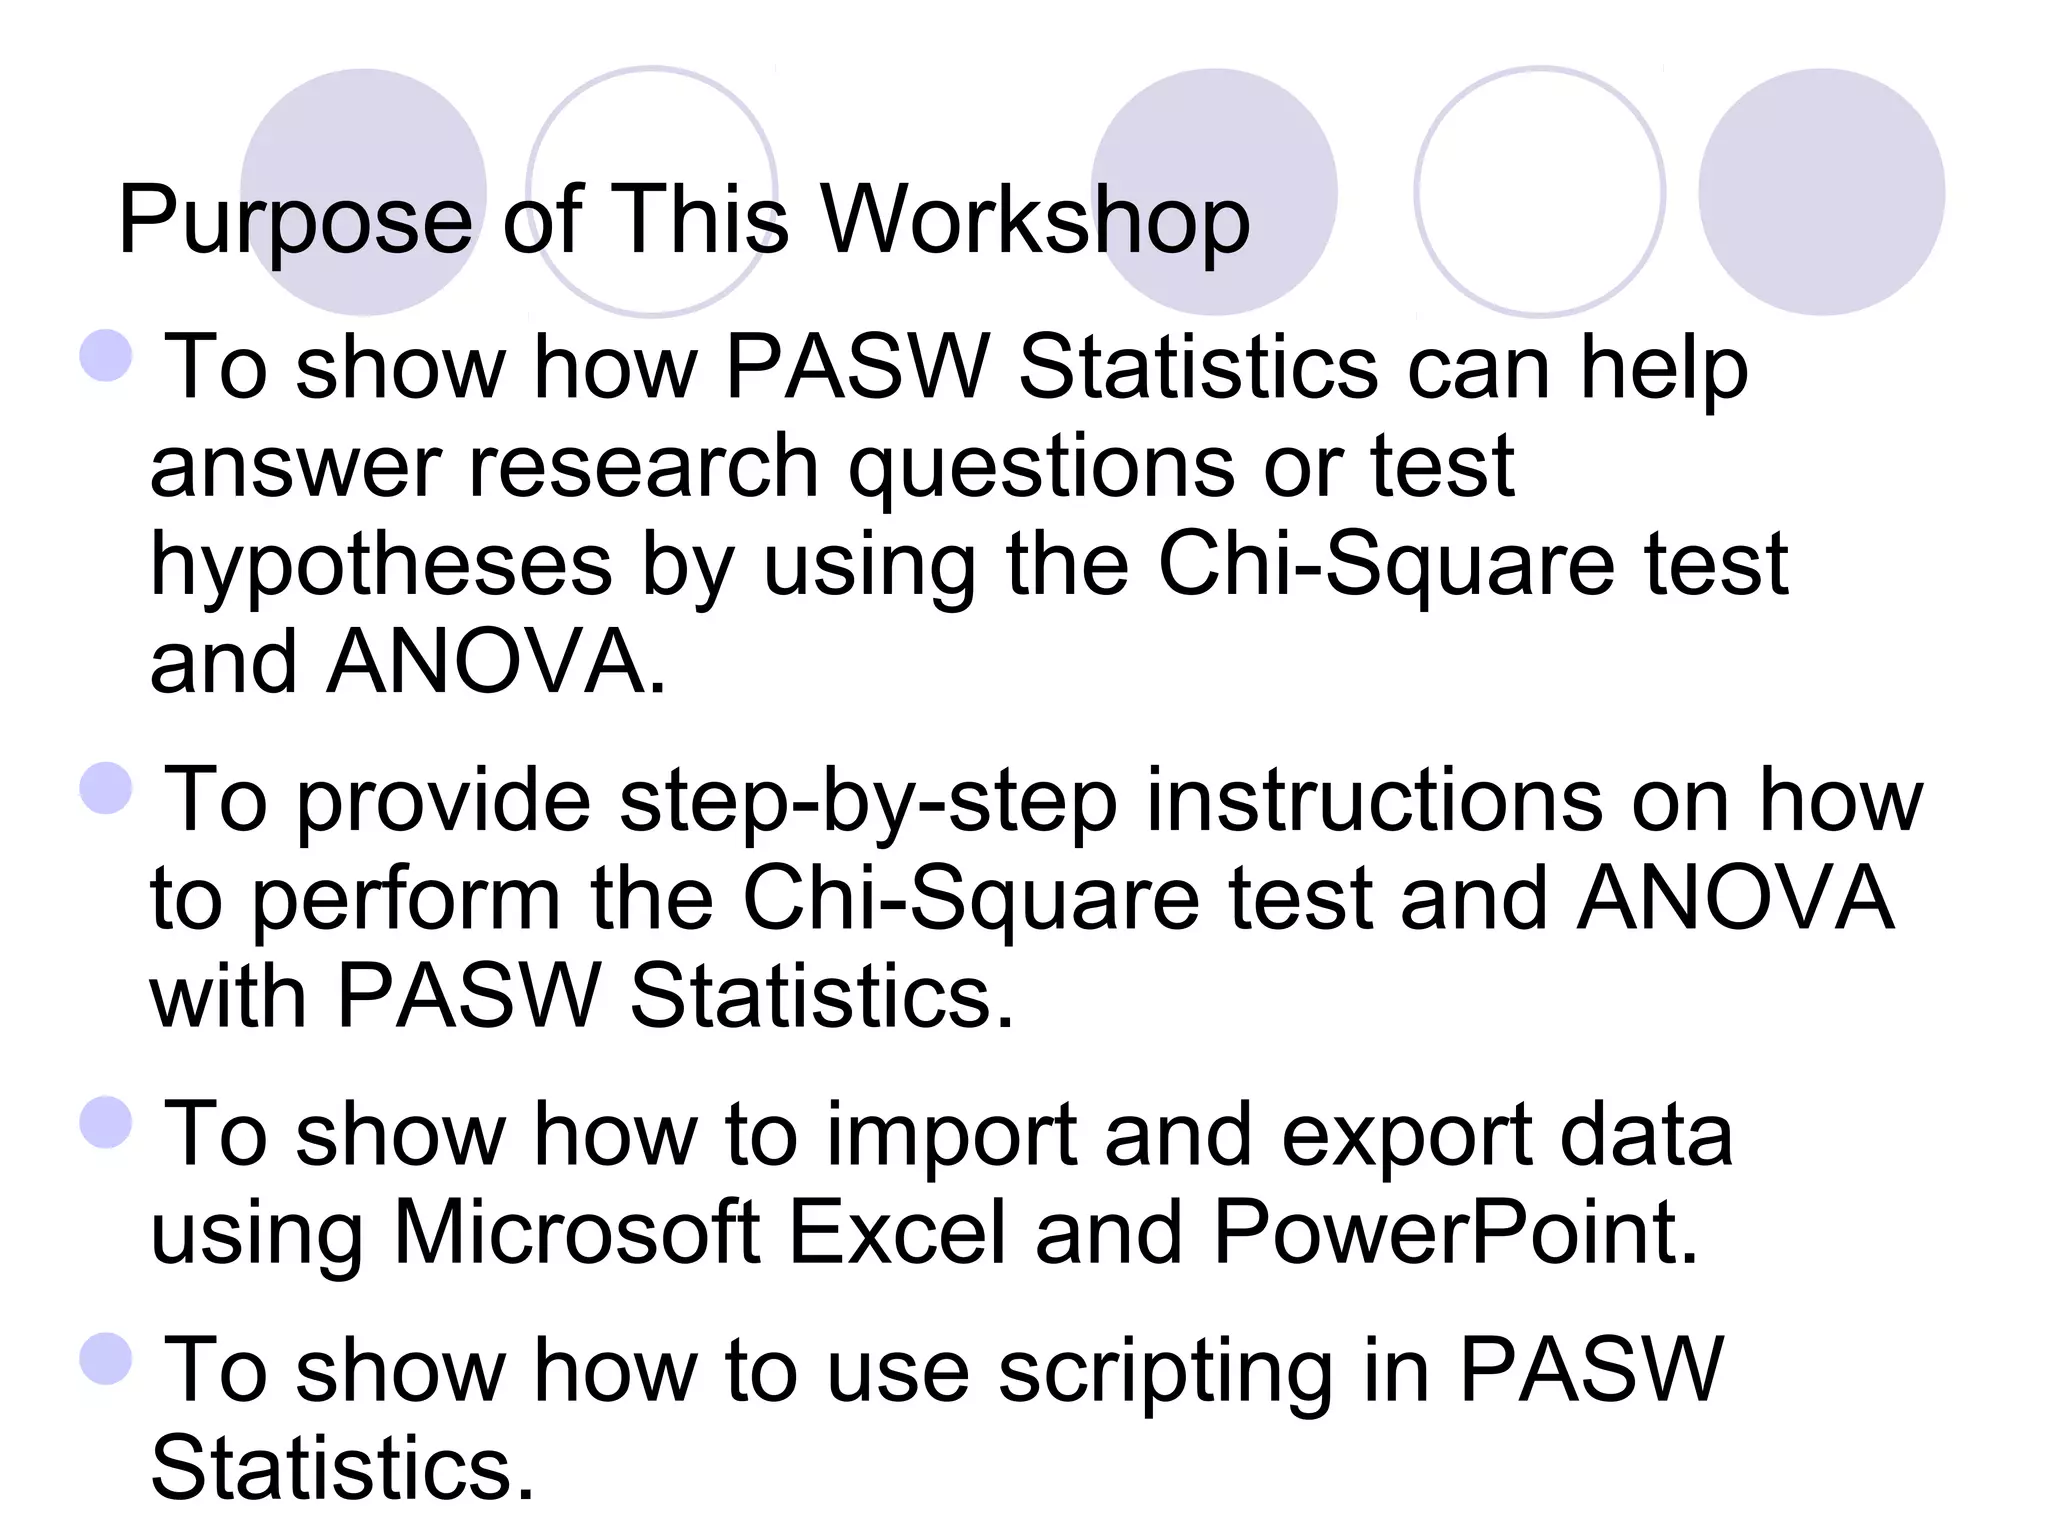
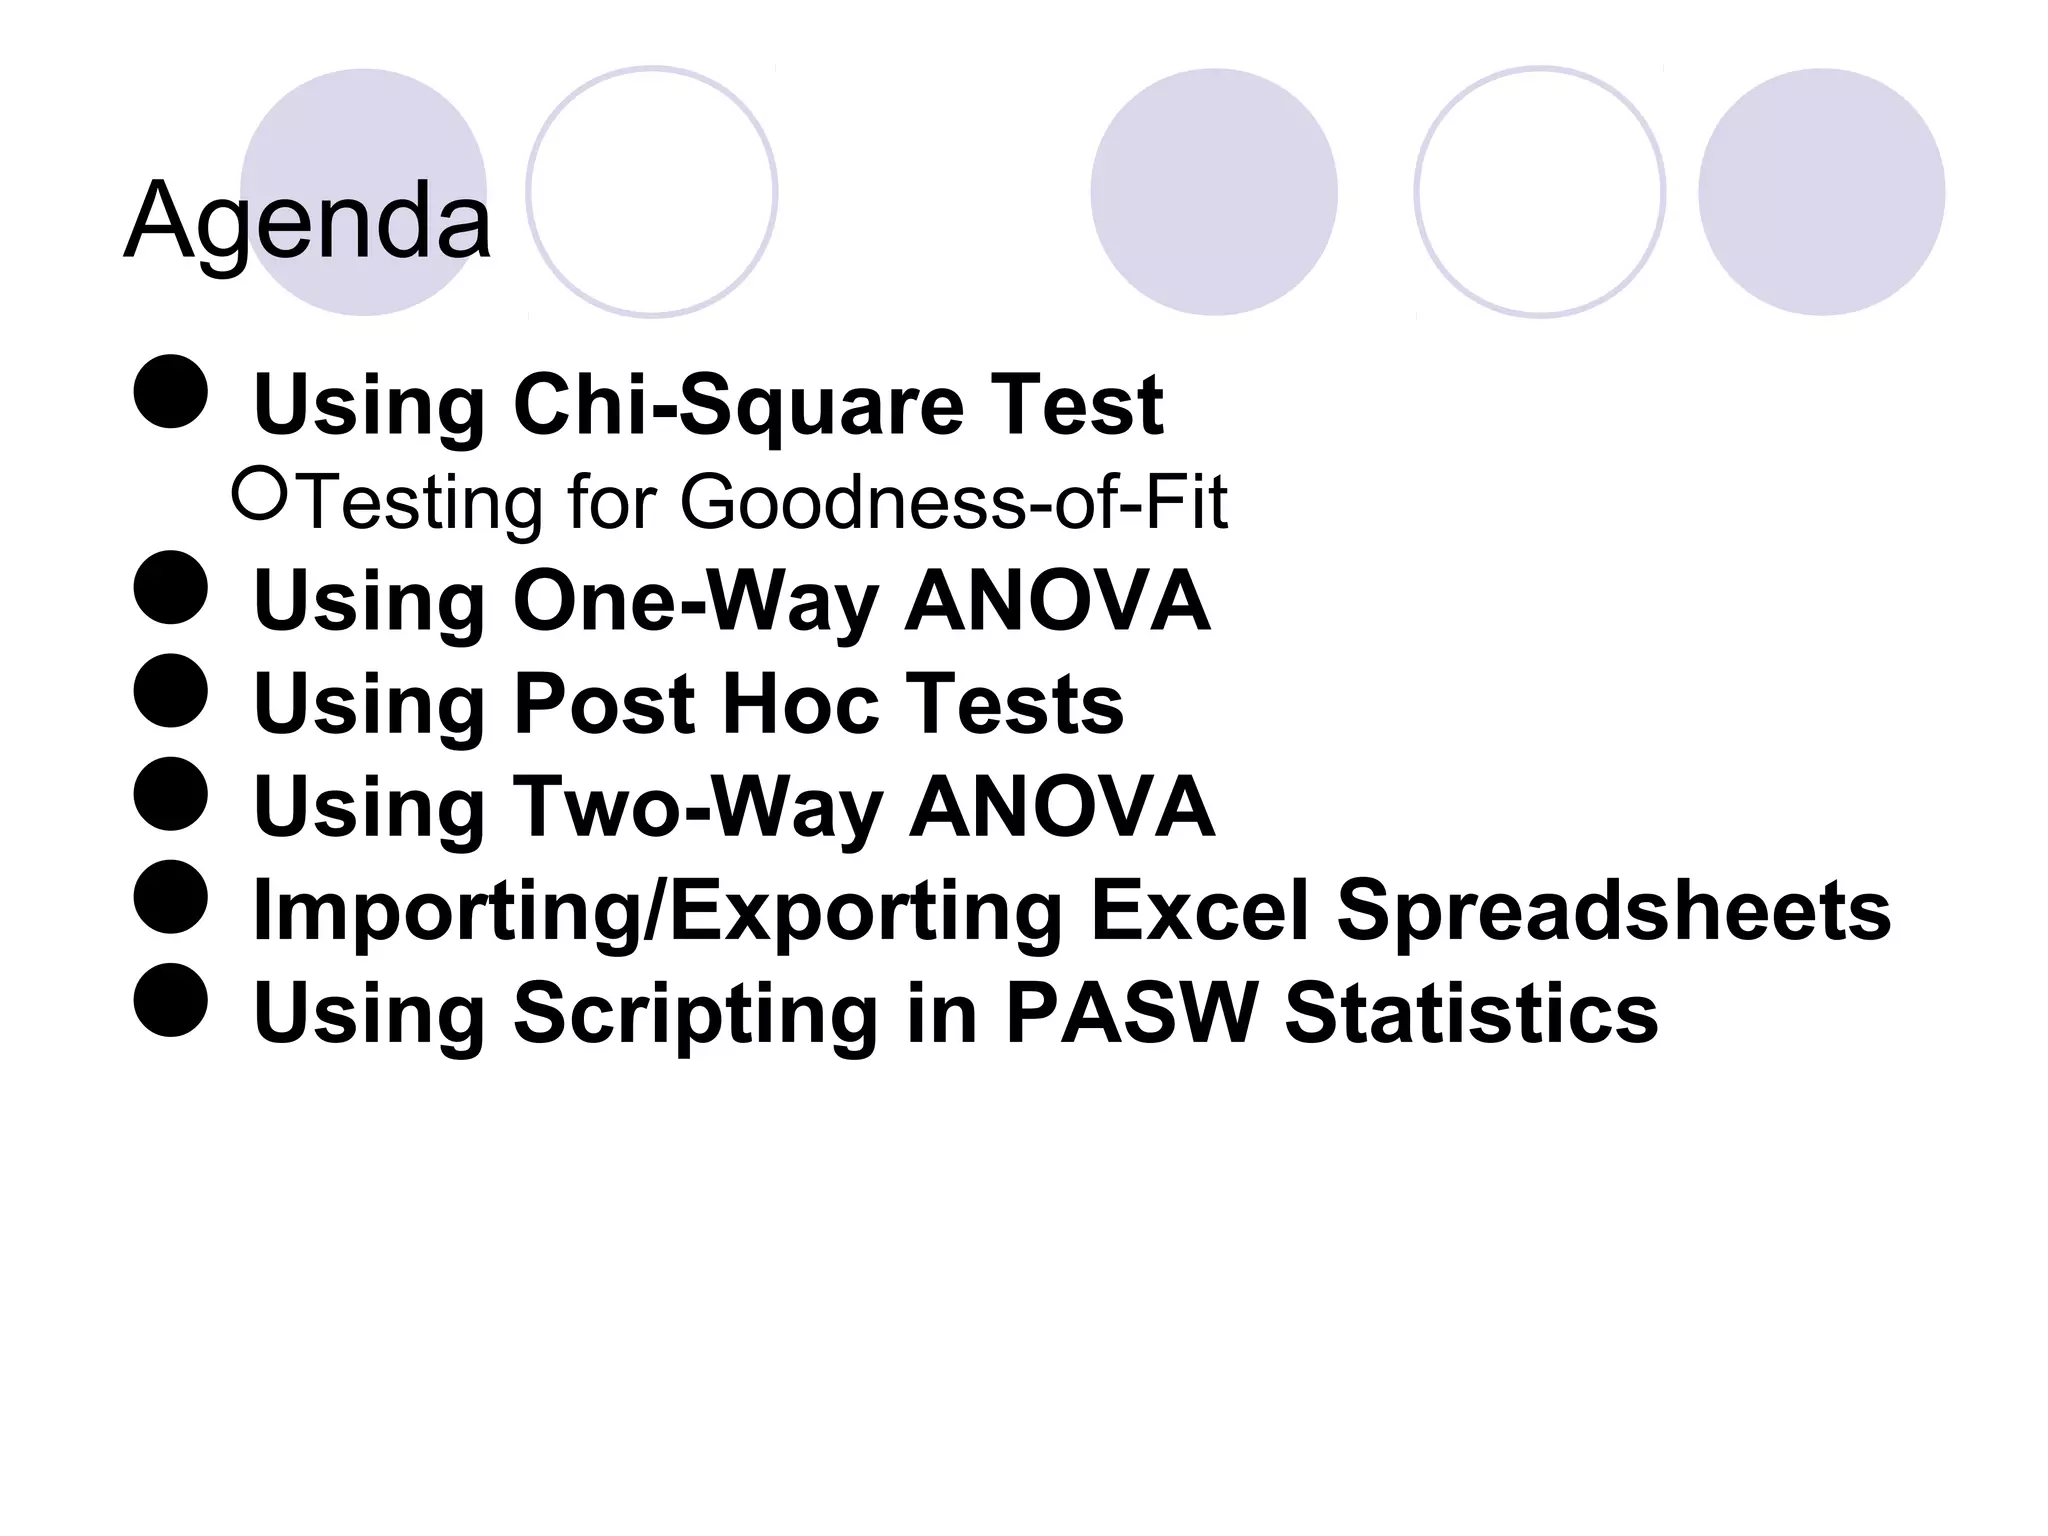
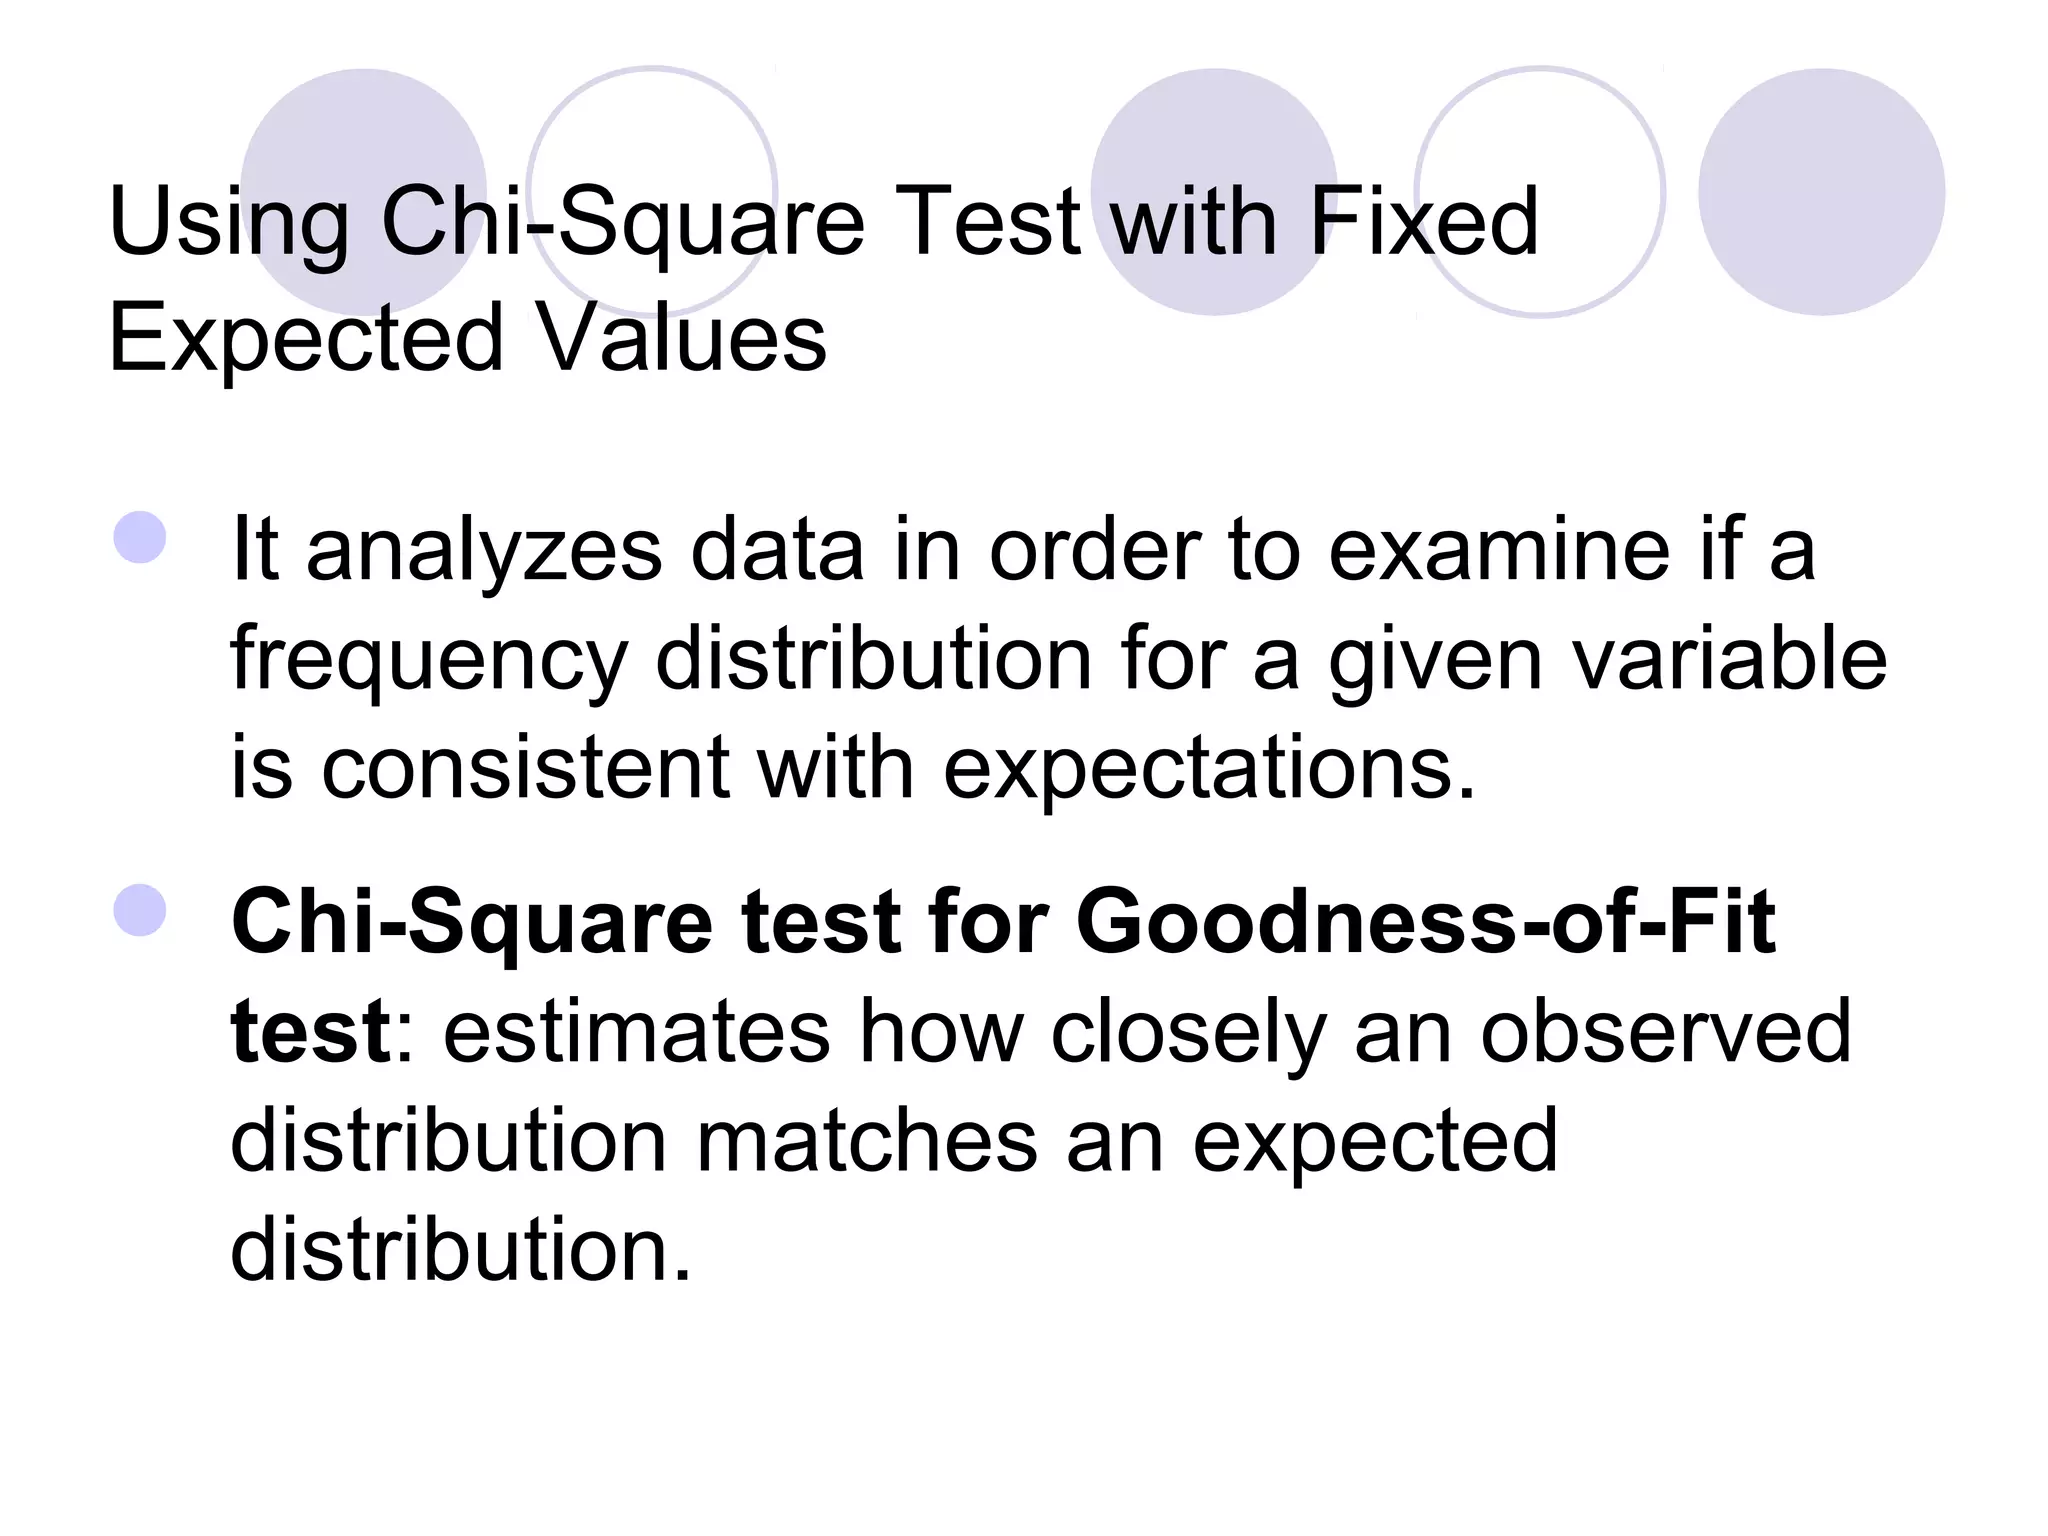
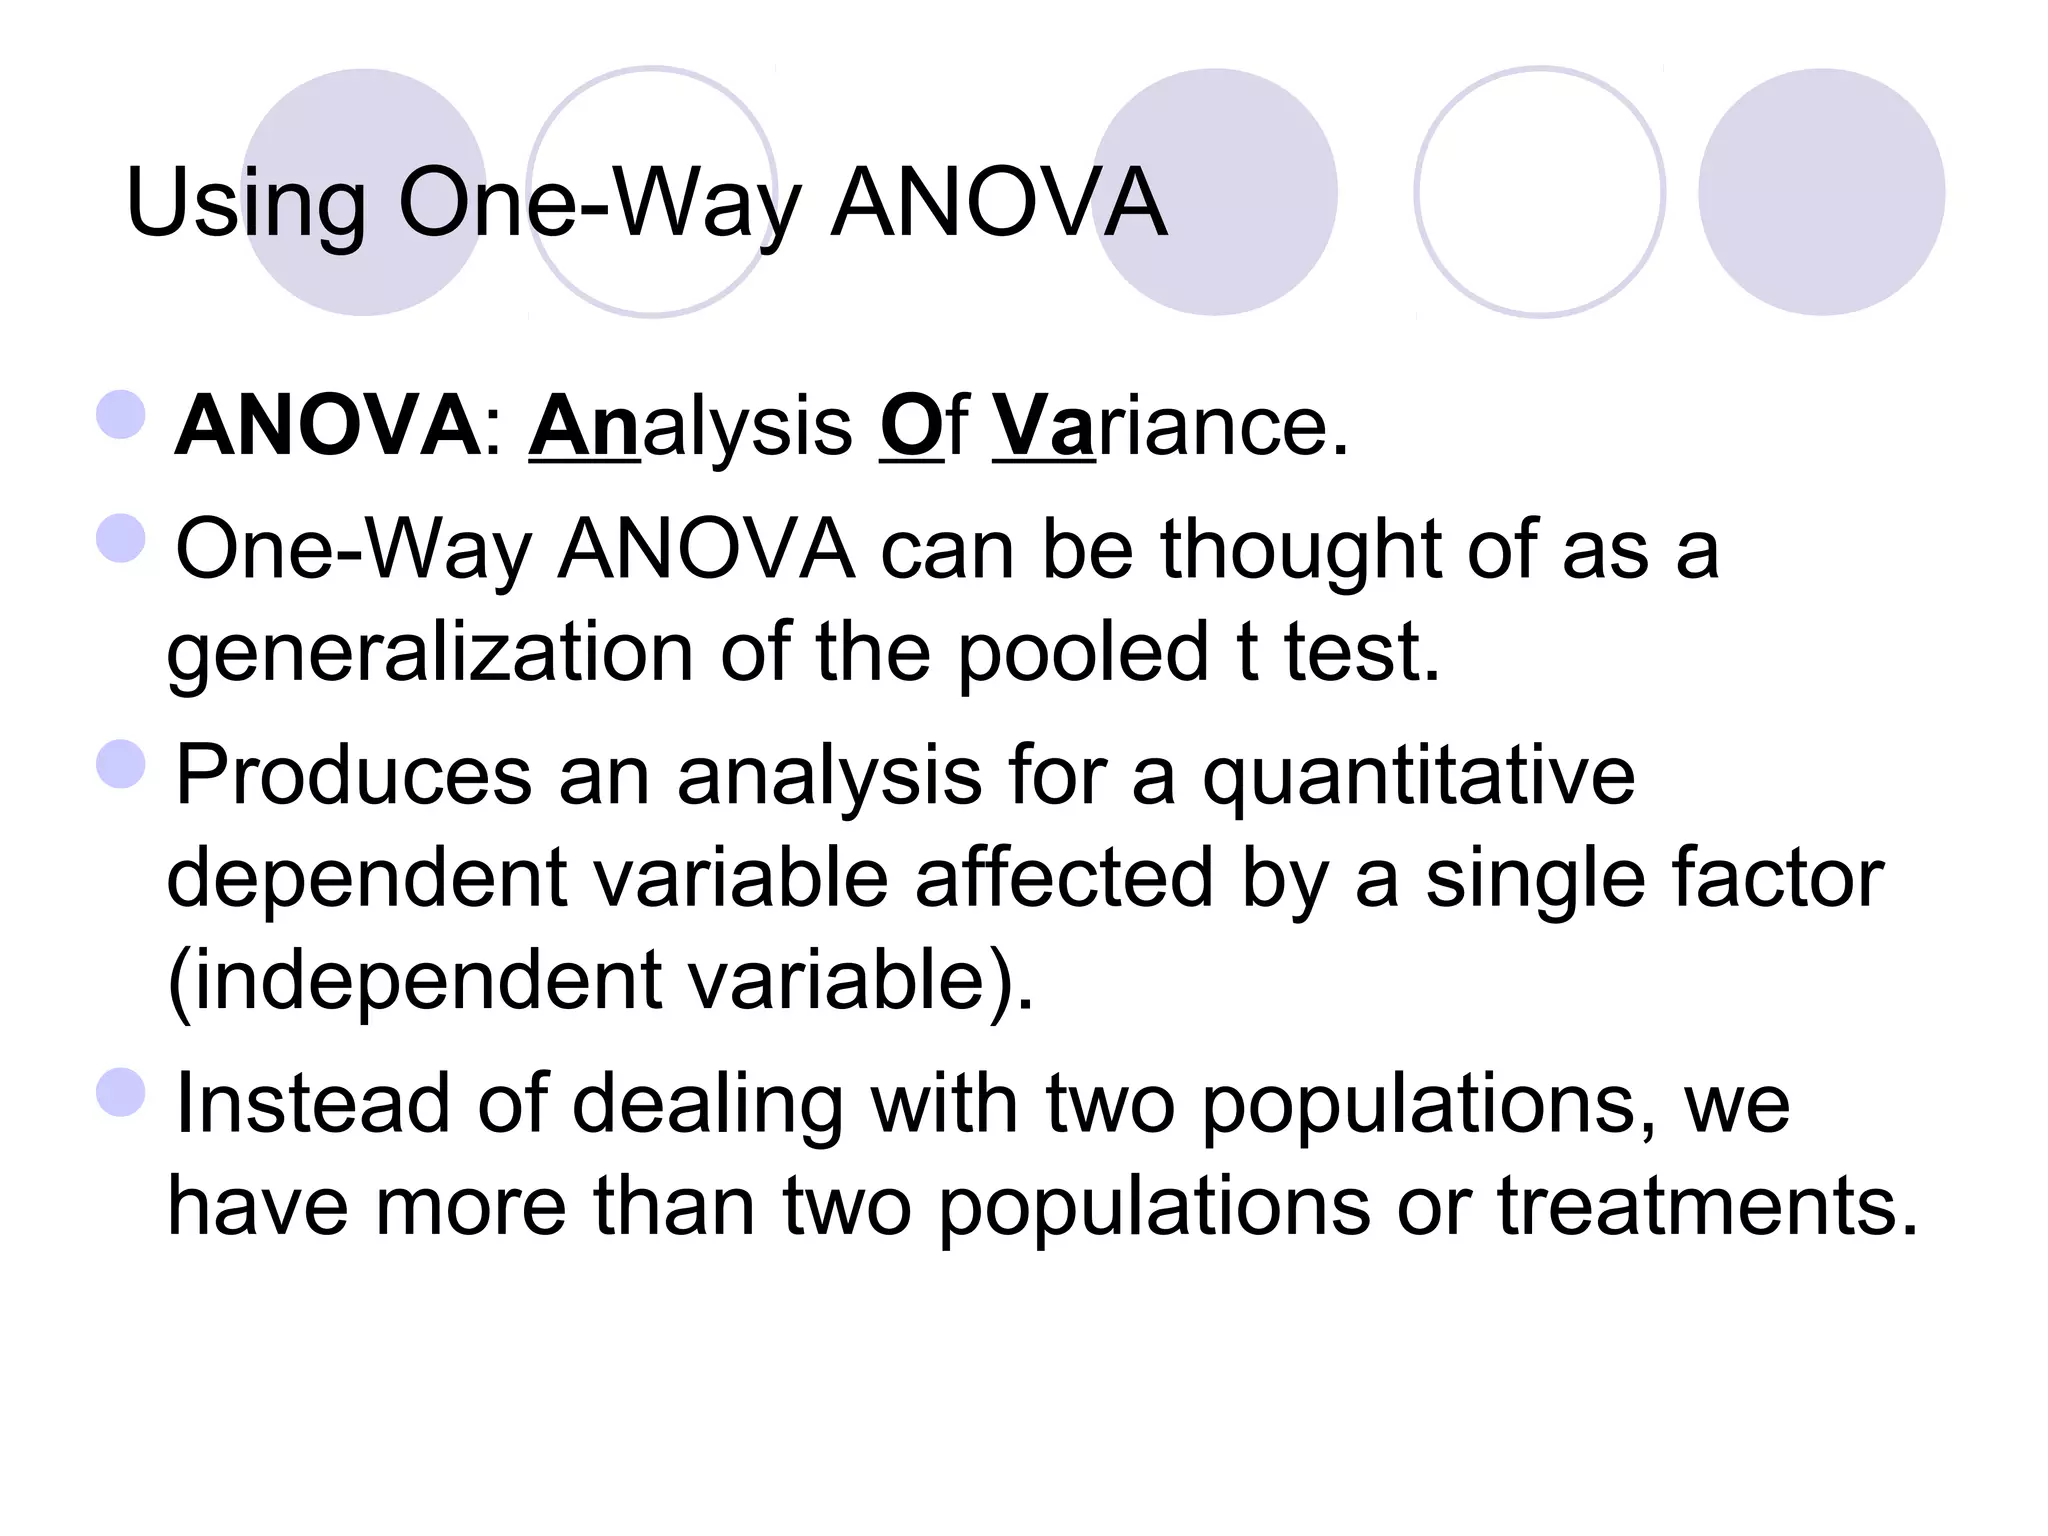
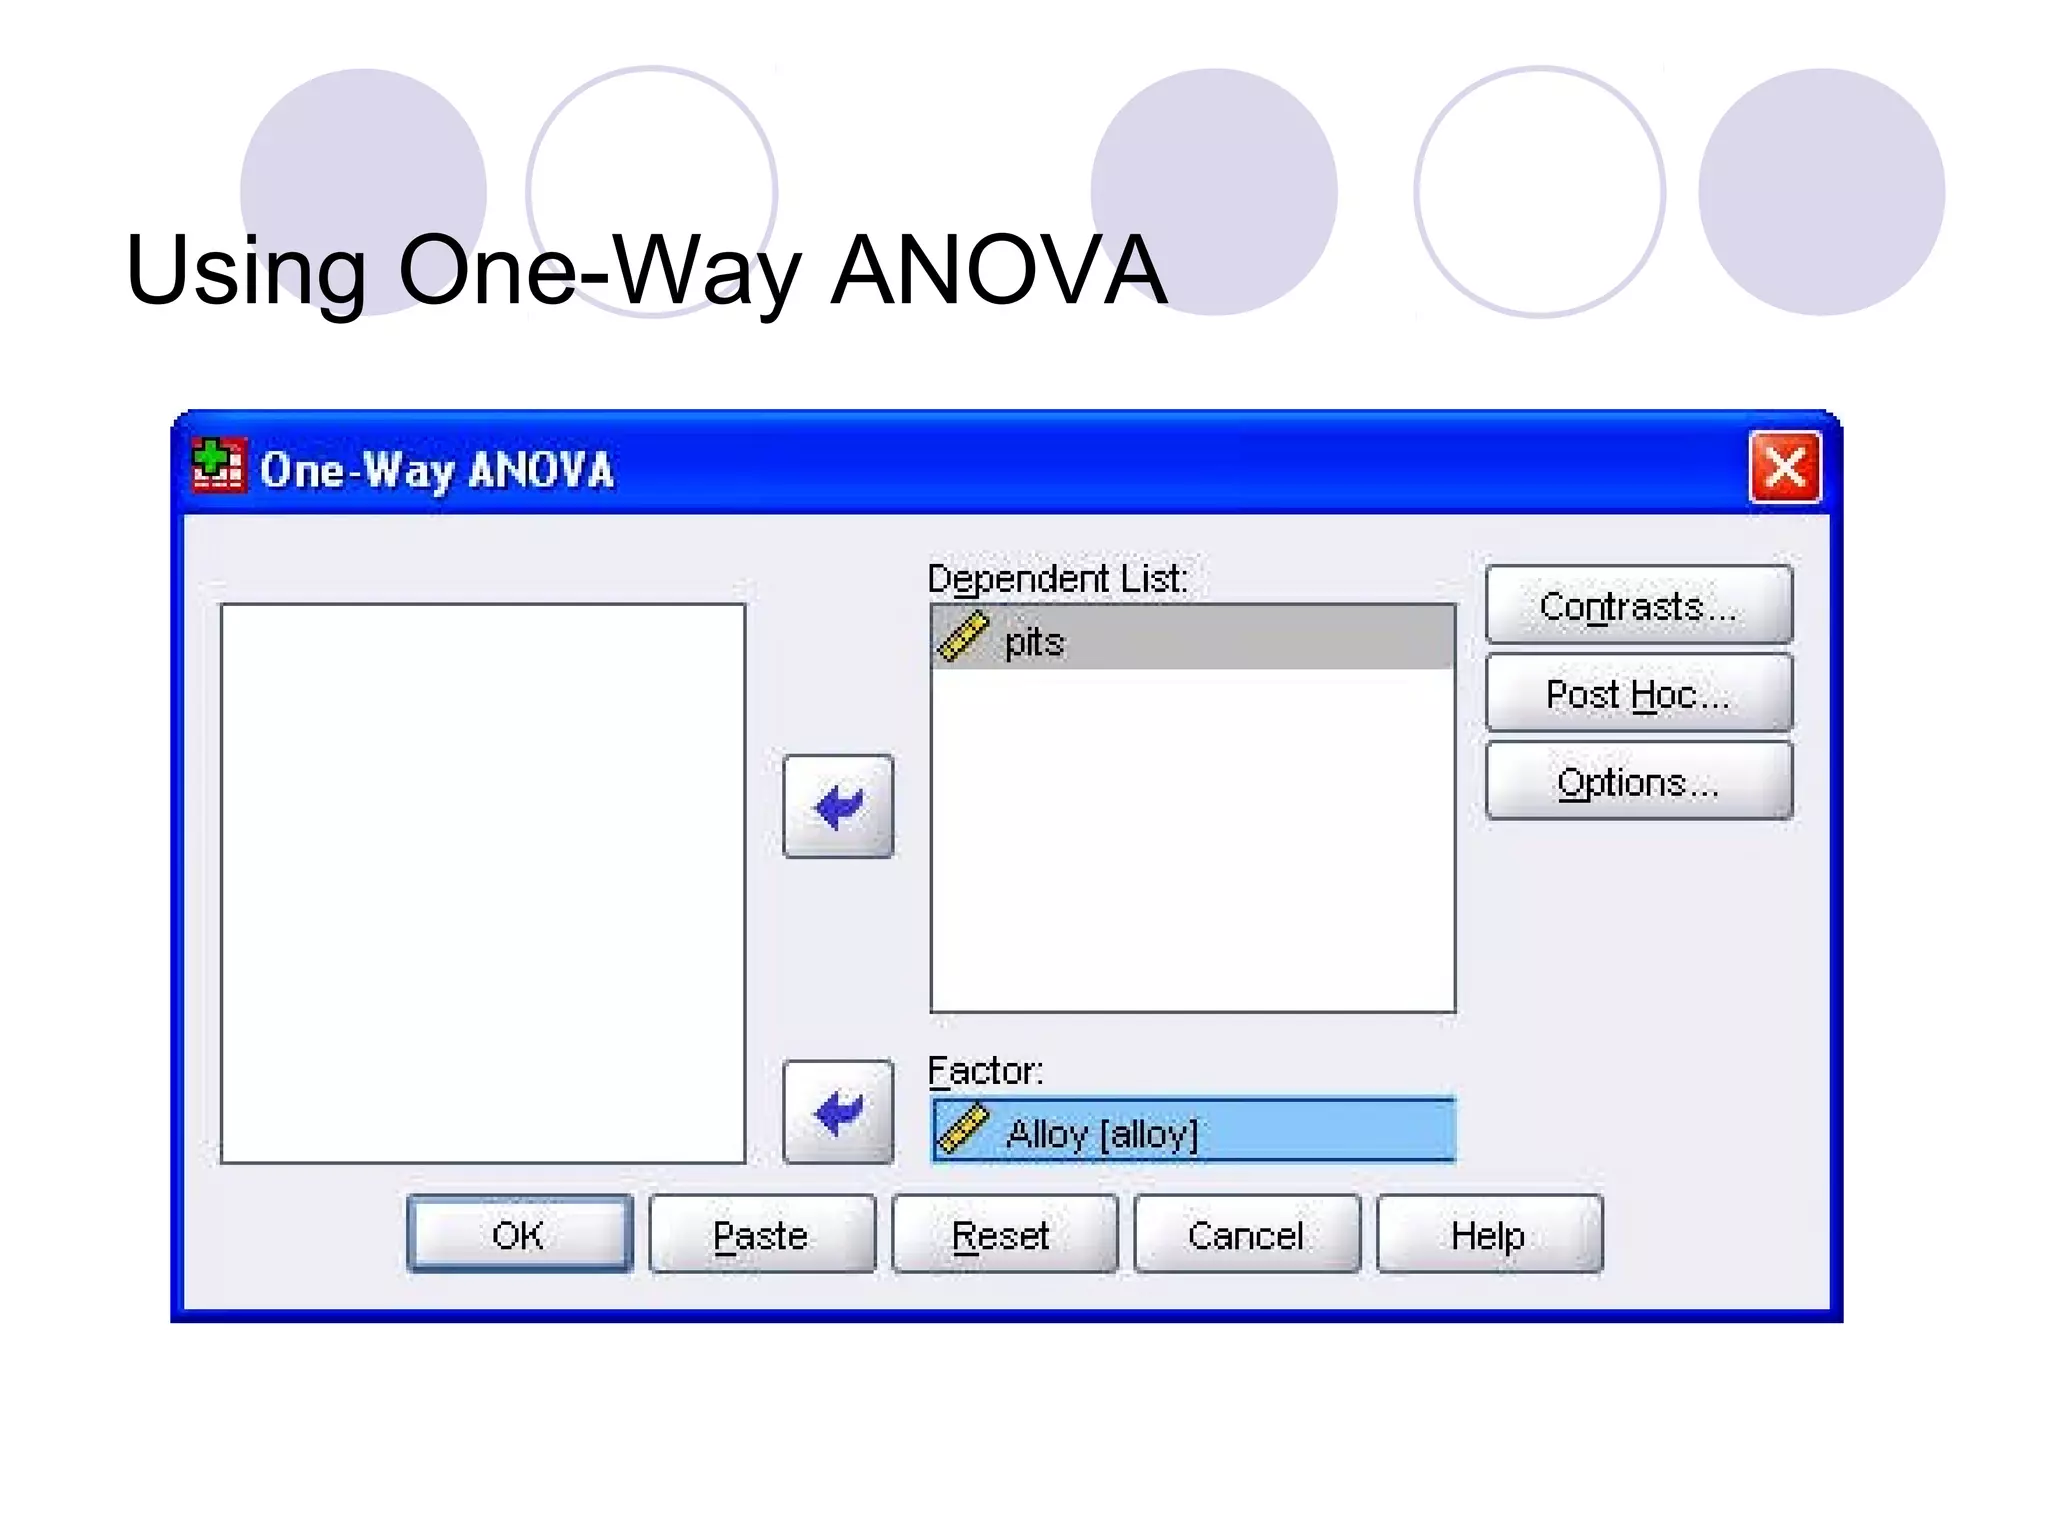
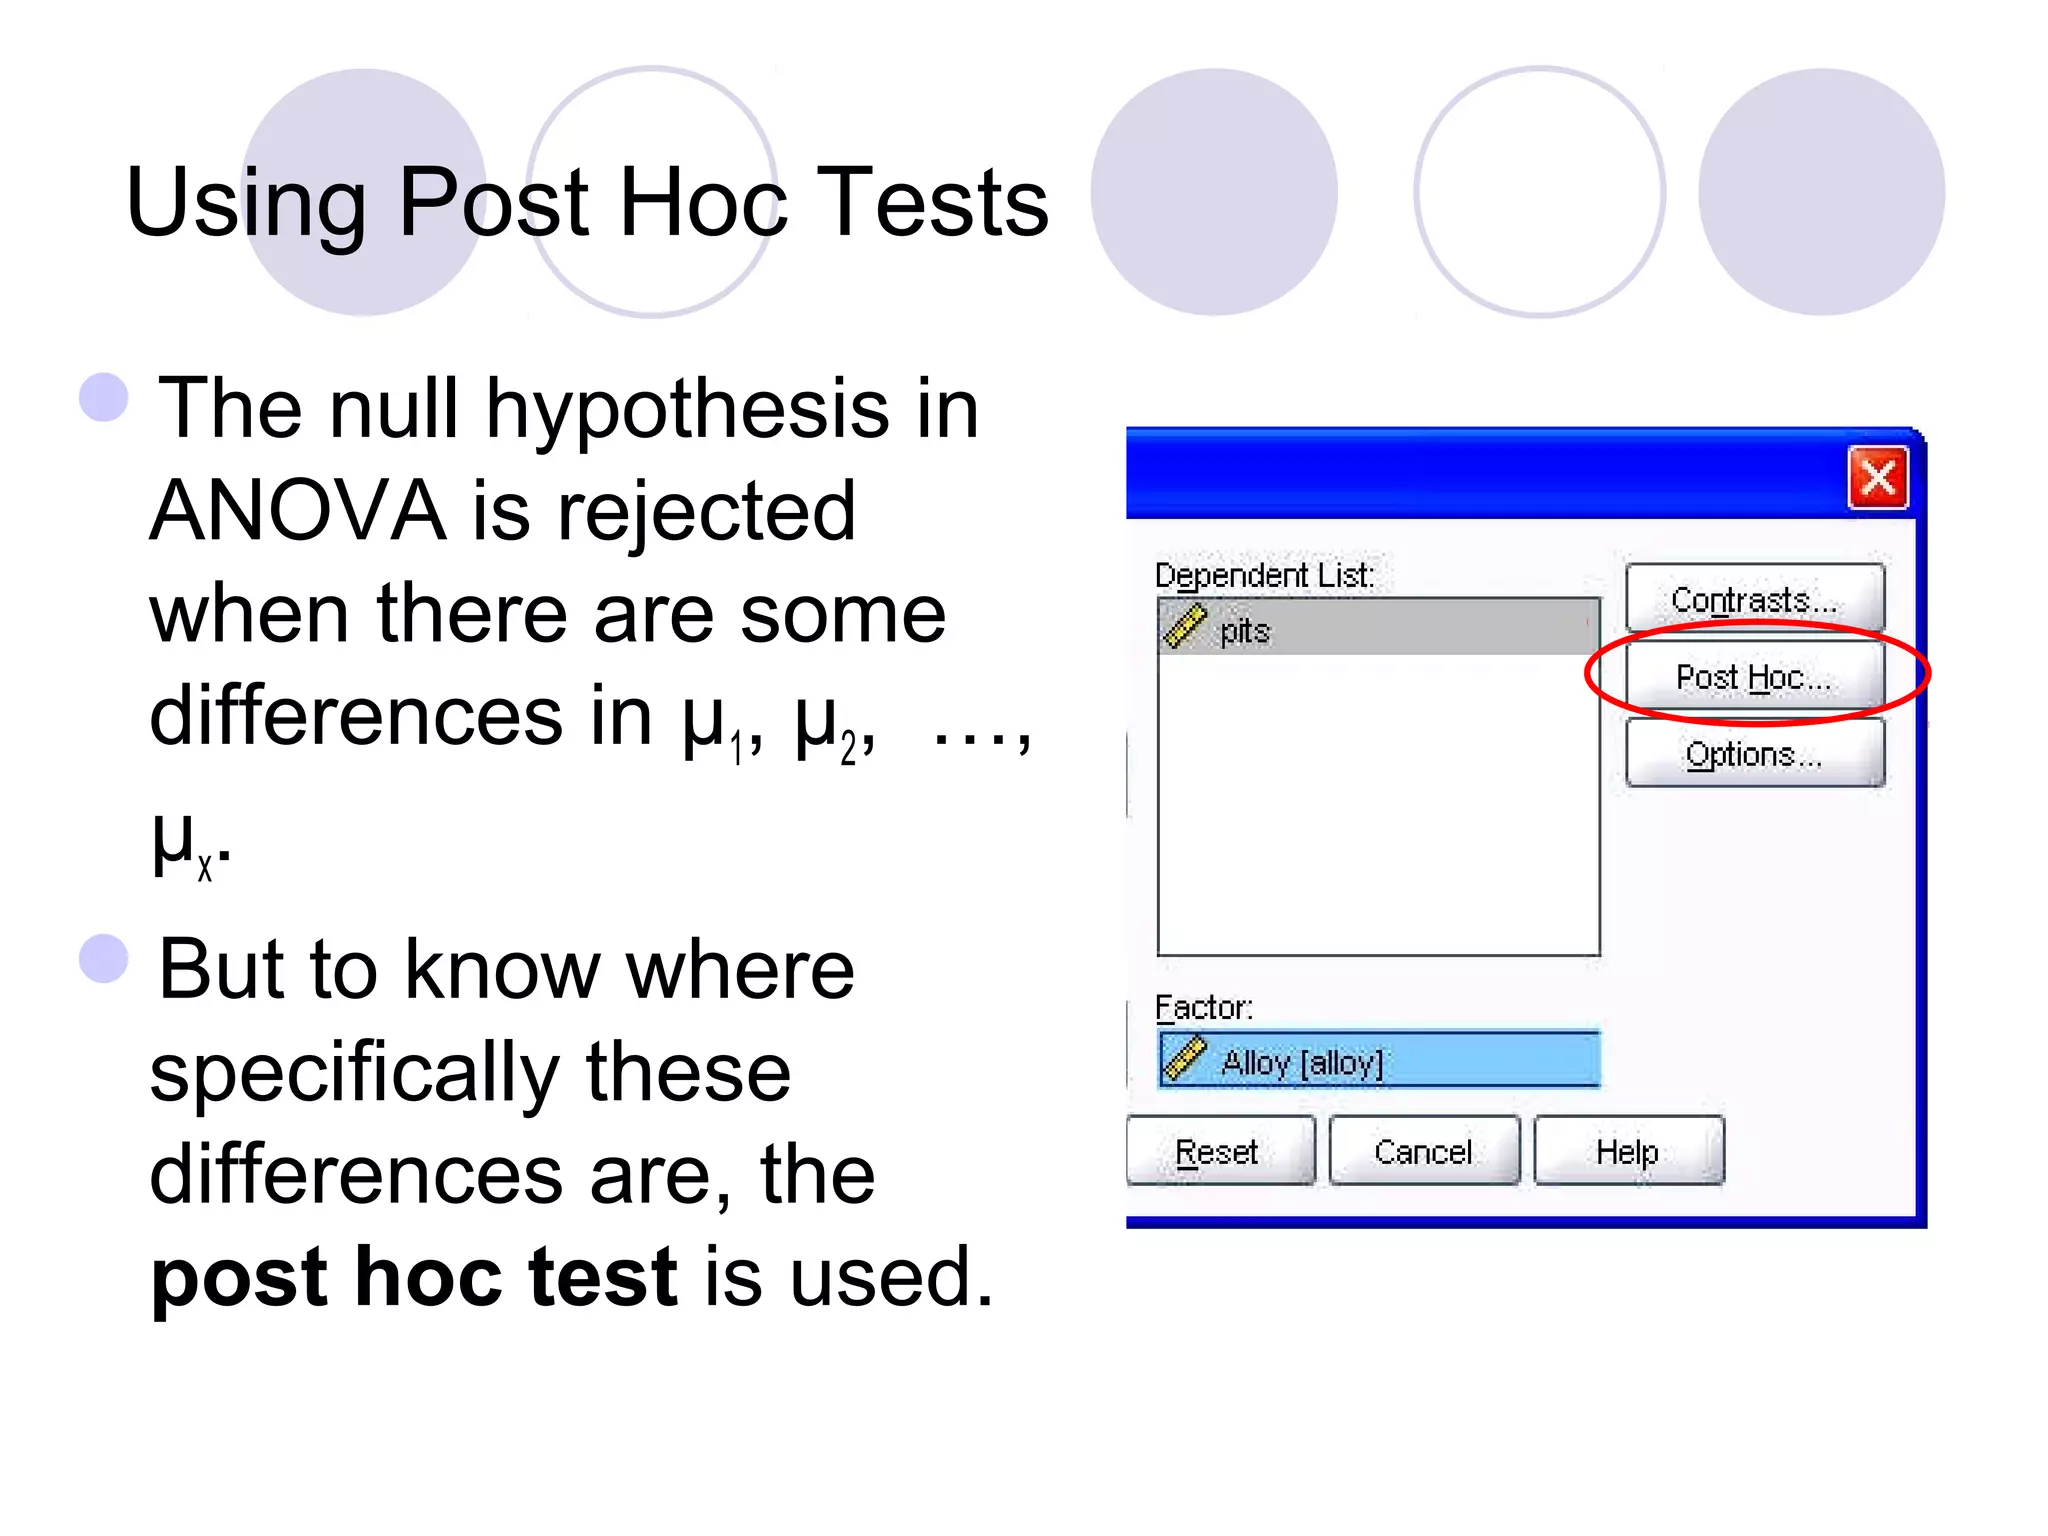
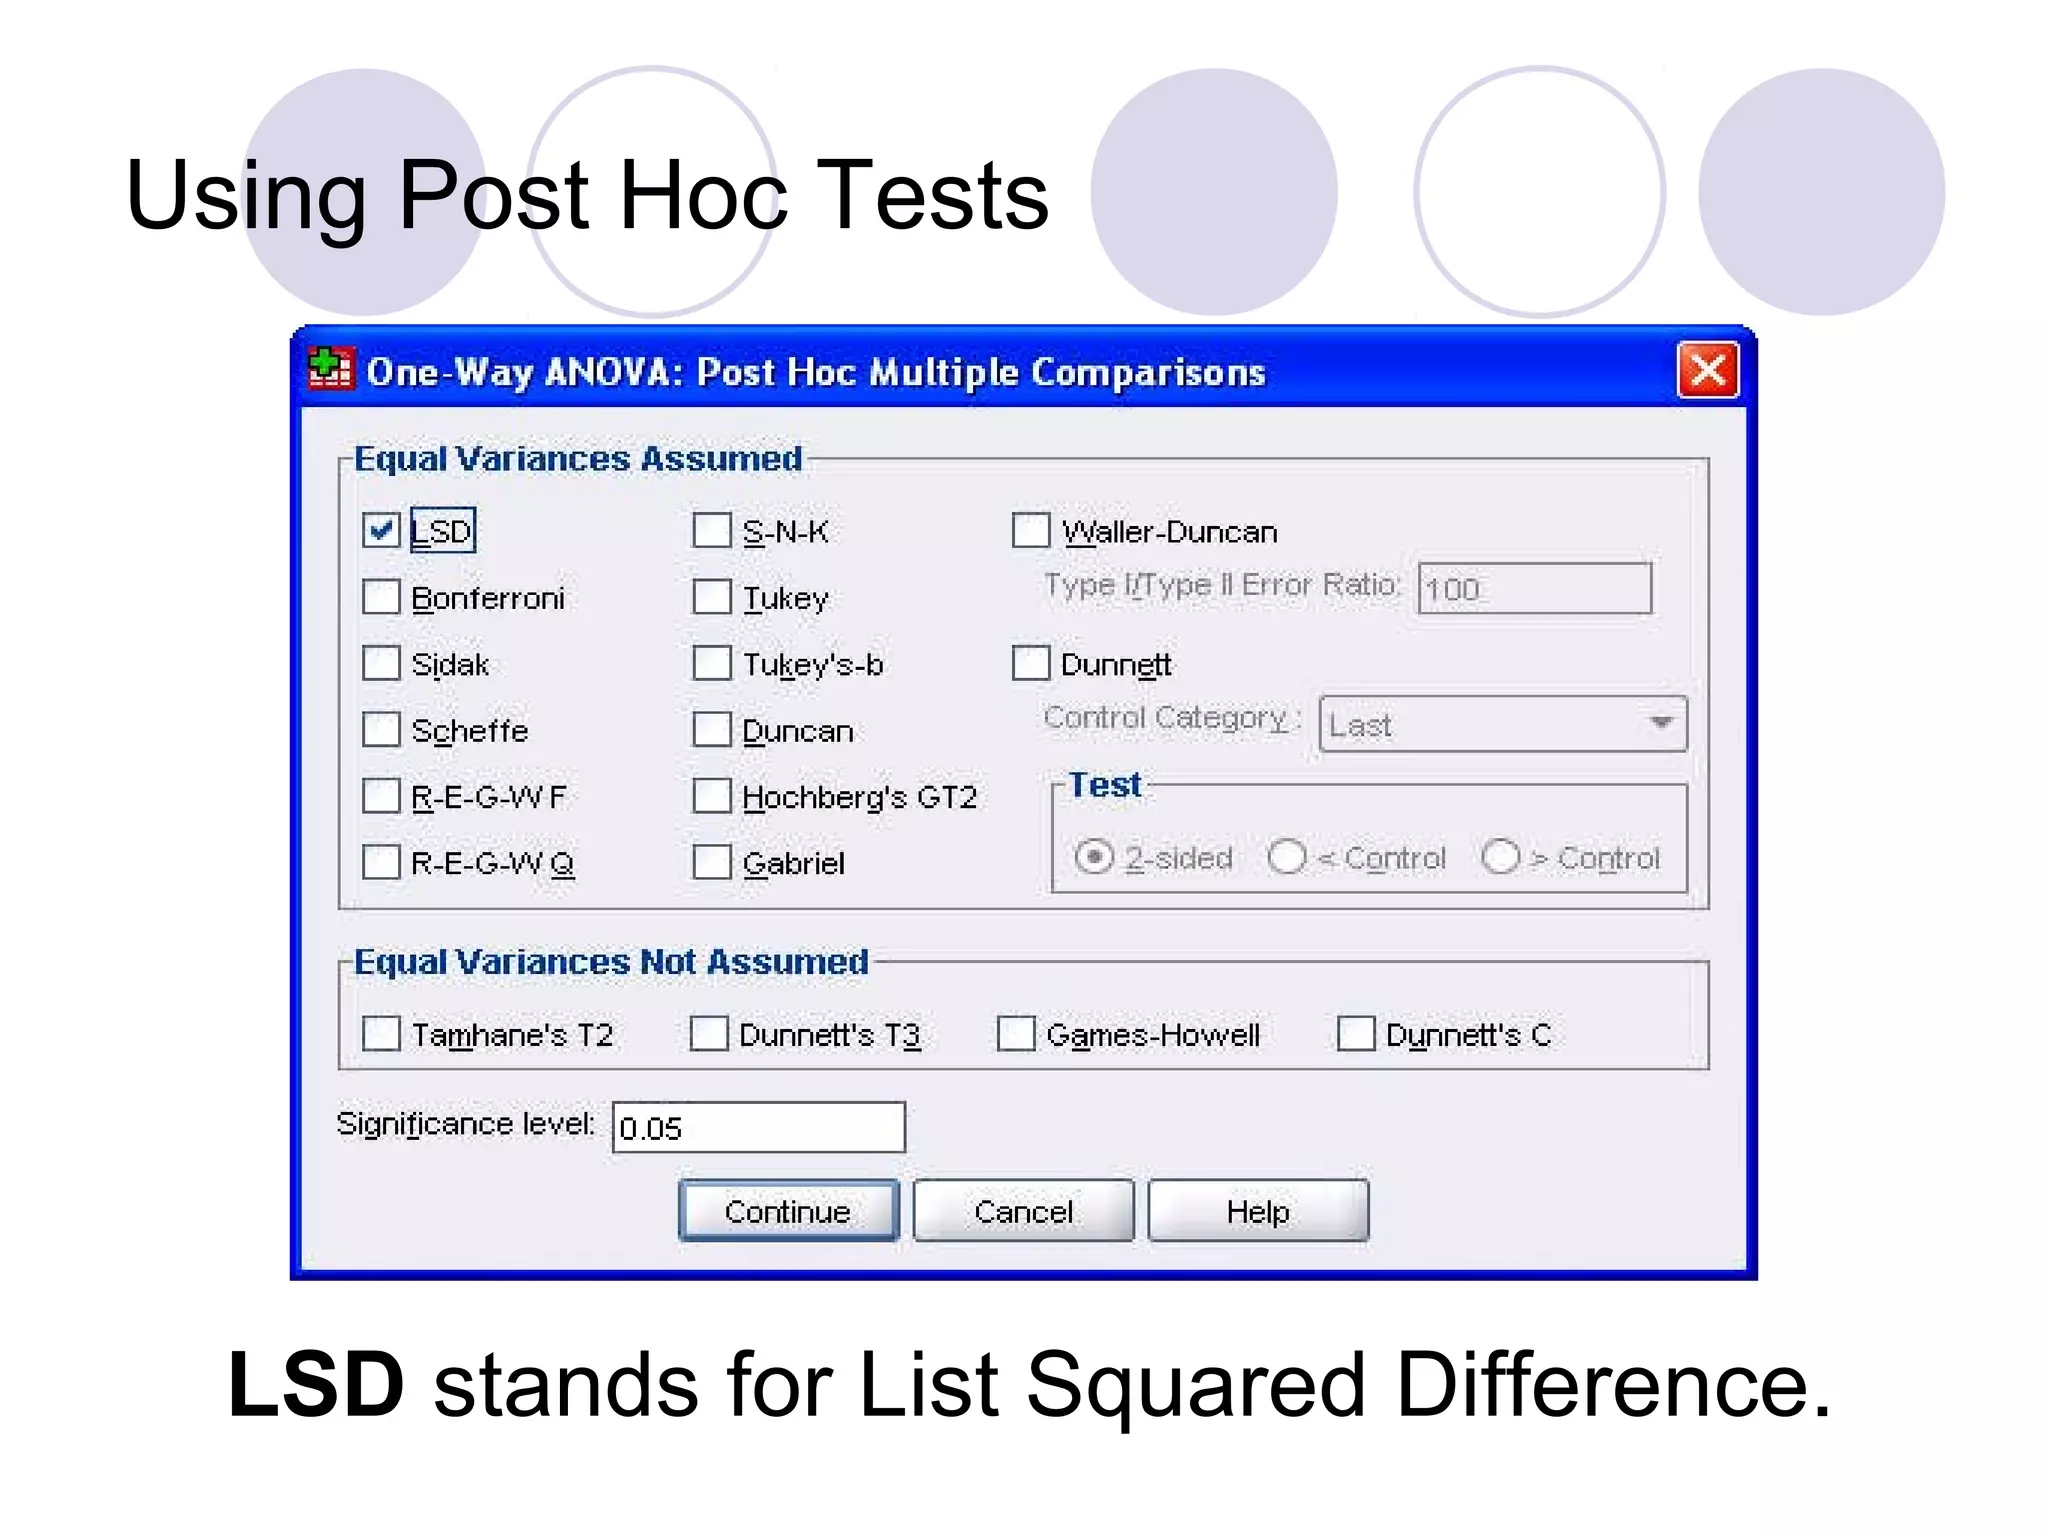
Using Chi-Square tests for goodness-of-fit, one-way and two-way ANOVA, as well as data importing/exporting.