Downloaded 21 times

![We are studying predictors of peoples’ voting behavior
during the 2018 General Election.
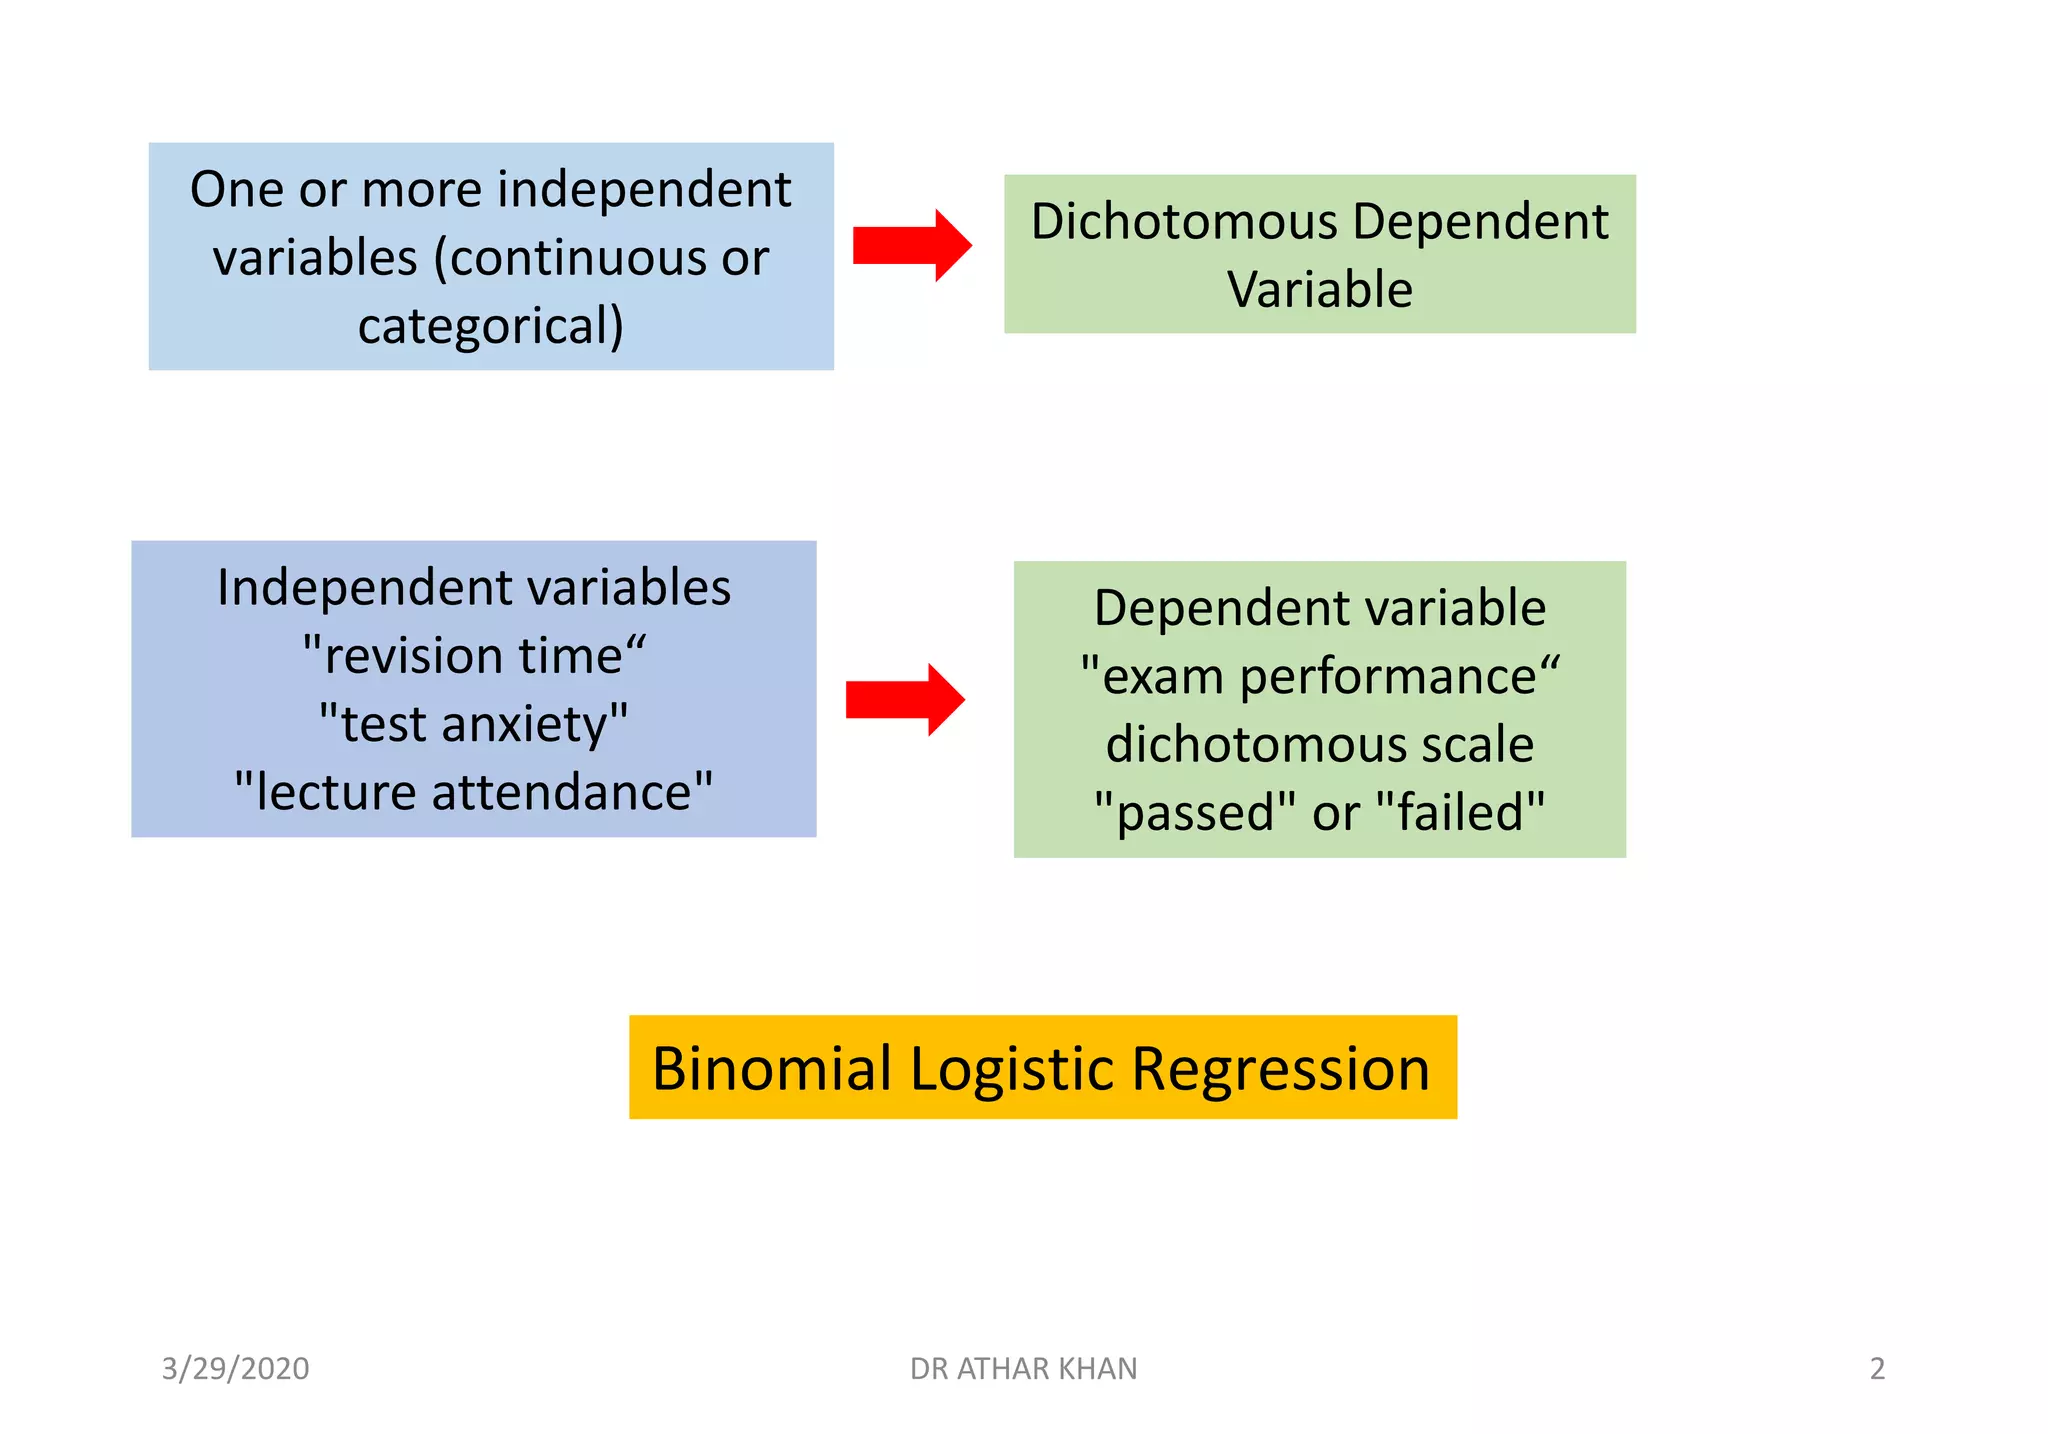
We hypothesize that age, gender identification, economic
beliefs, and religious beliefs will predict whether a person
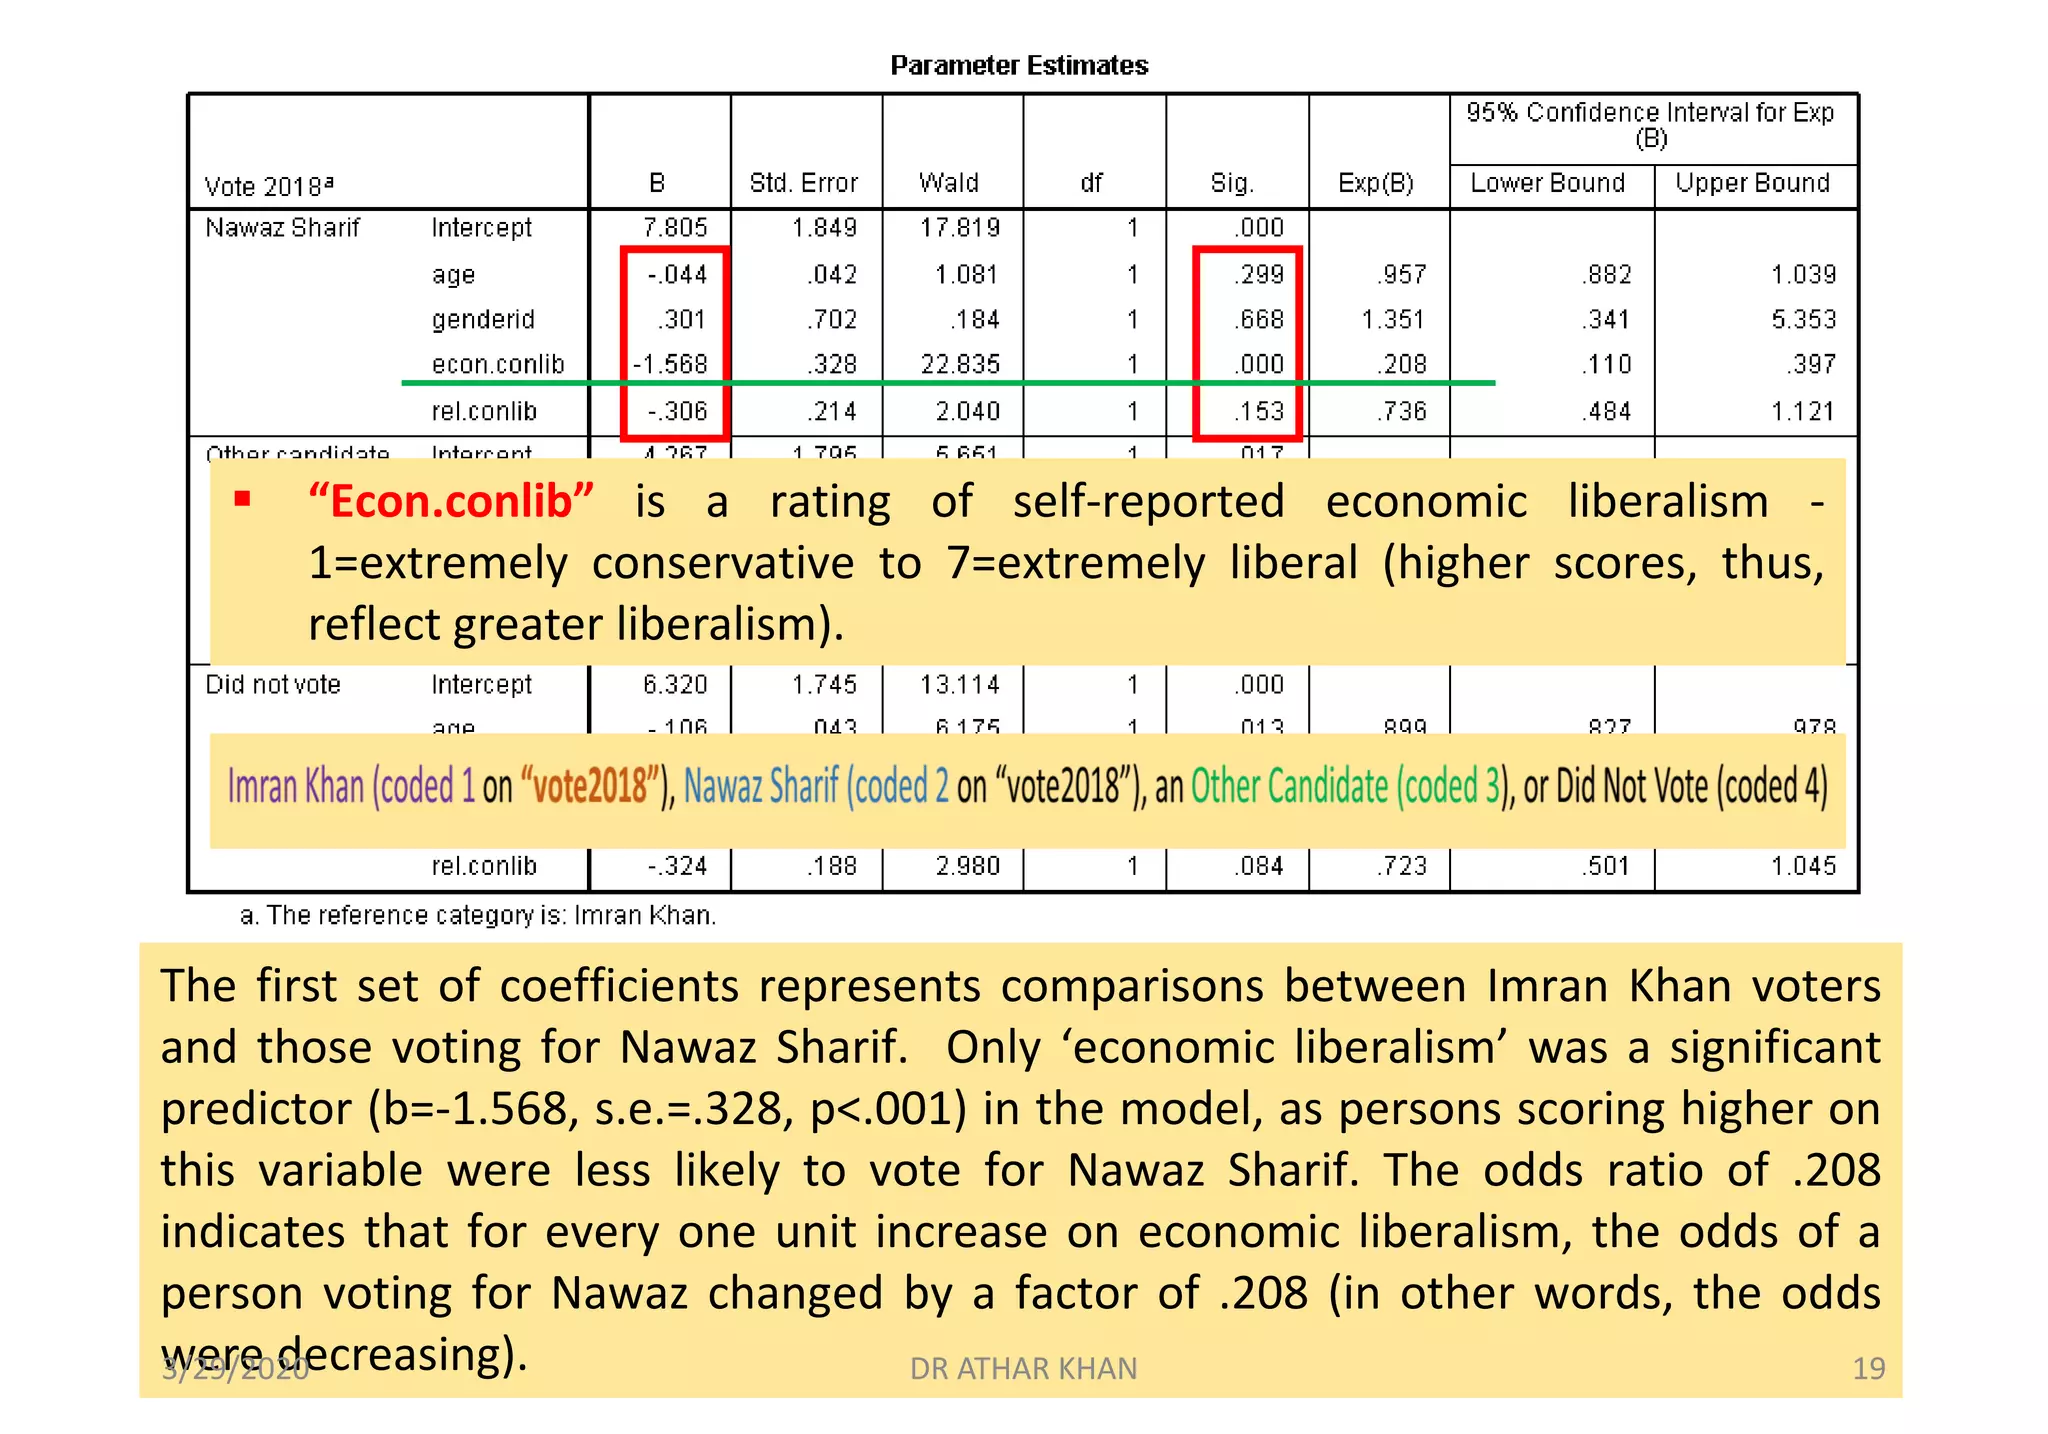
voted for Imran Khan (coded 1 on “vote2018”), Nawaz Sharif
(coded 2 on “vote2018”), an Other Candidate (coded 3), or
Did Not Vote (coded 4).
[Note: The “other” category on the dependent variable was
created because of the low frequencies and it is not a
informative category]
IV IV IV IV DV3/29/2020 DR ATHAR KHAN 4](https://image.slidesharecdn.com/multinomiallrdrathar-converted-200329155613/75/Multinomial-Logistic-Regression-4-2048.jpg)
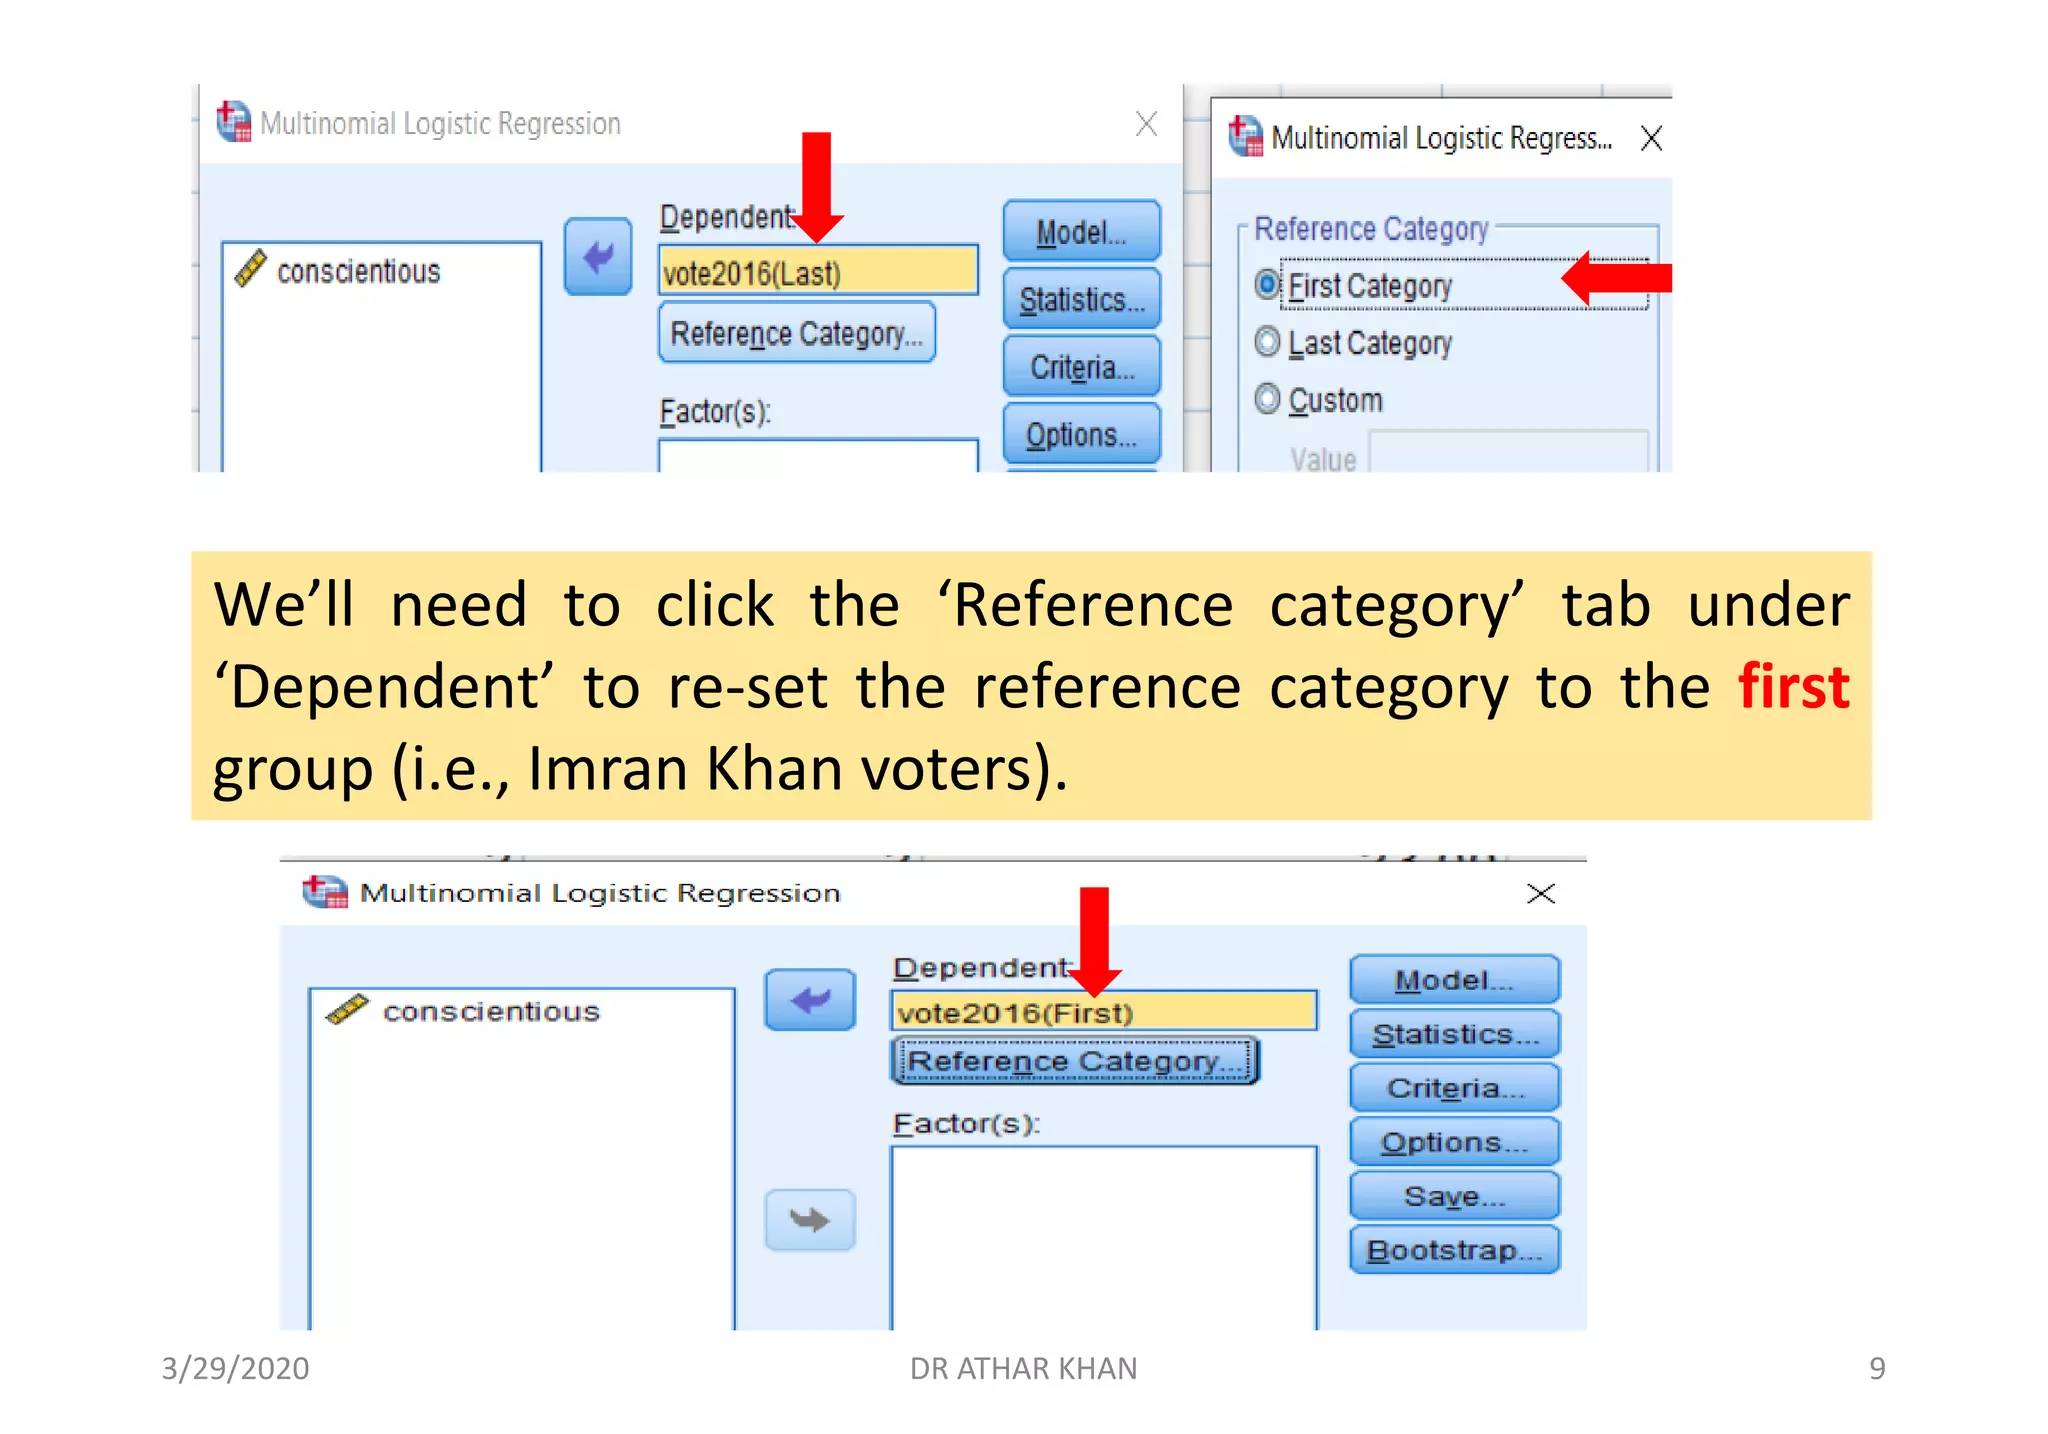
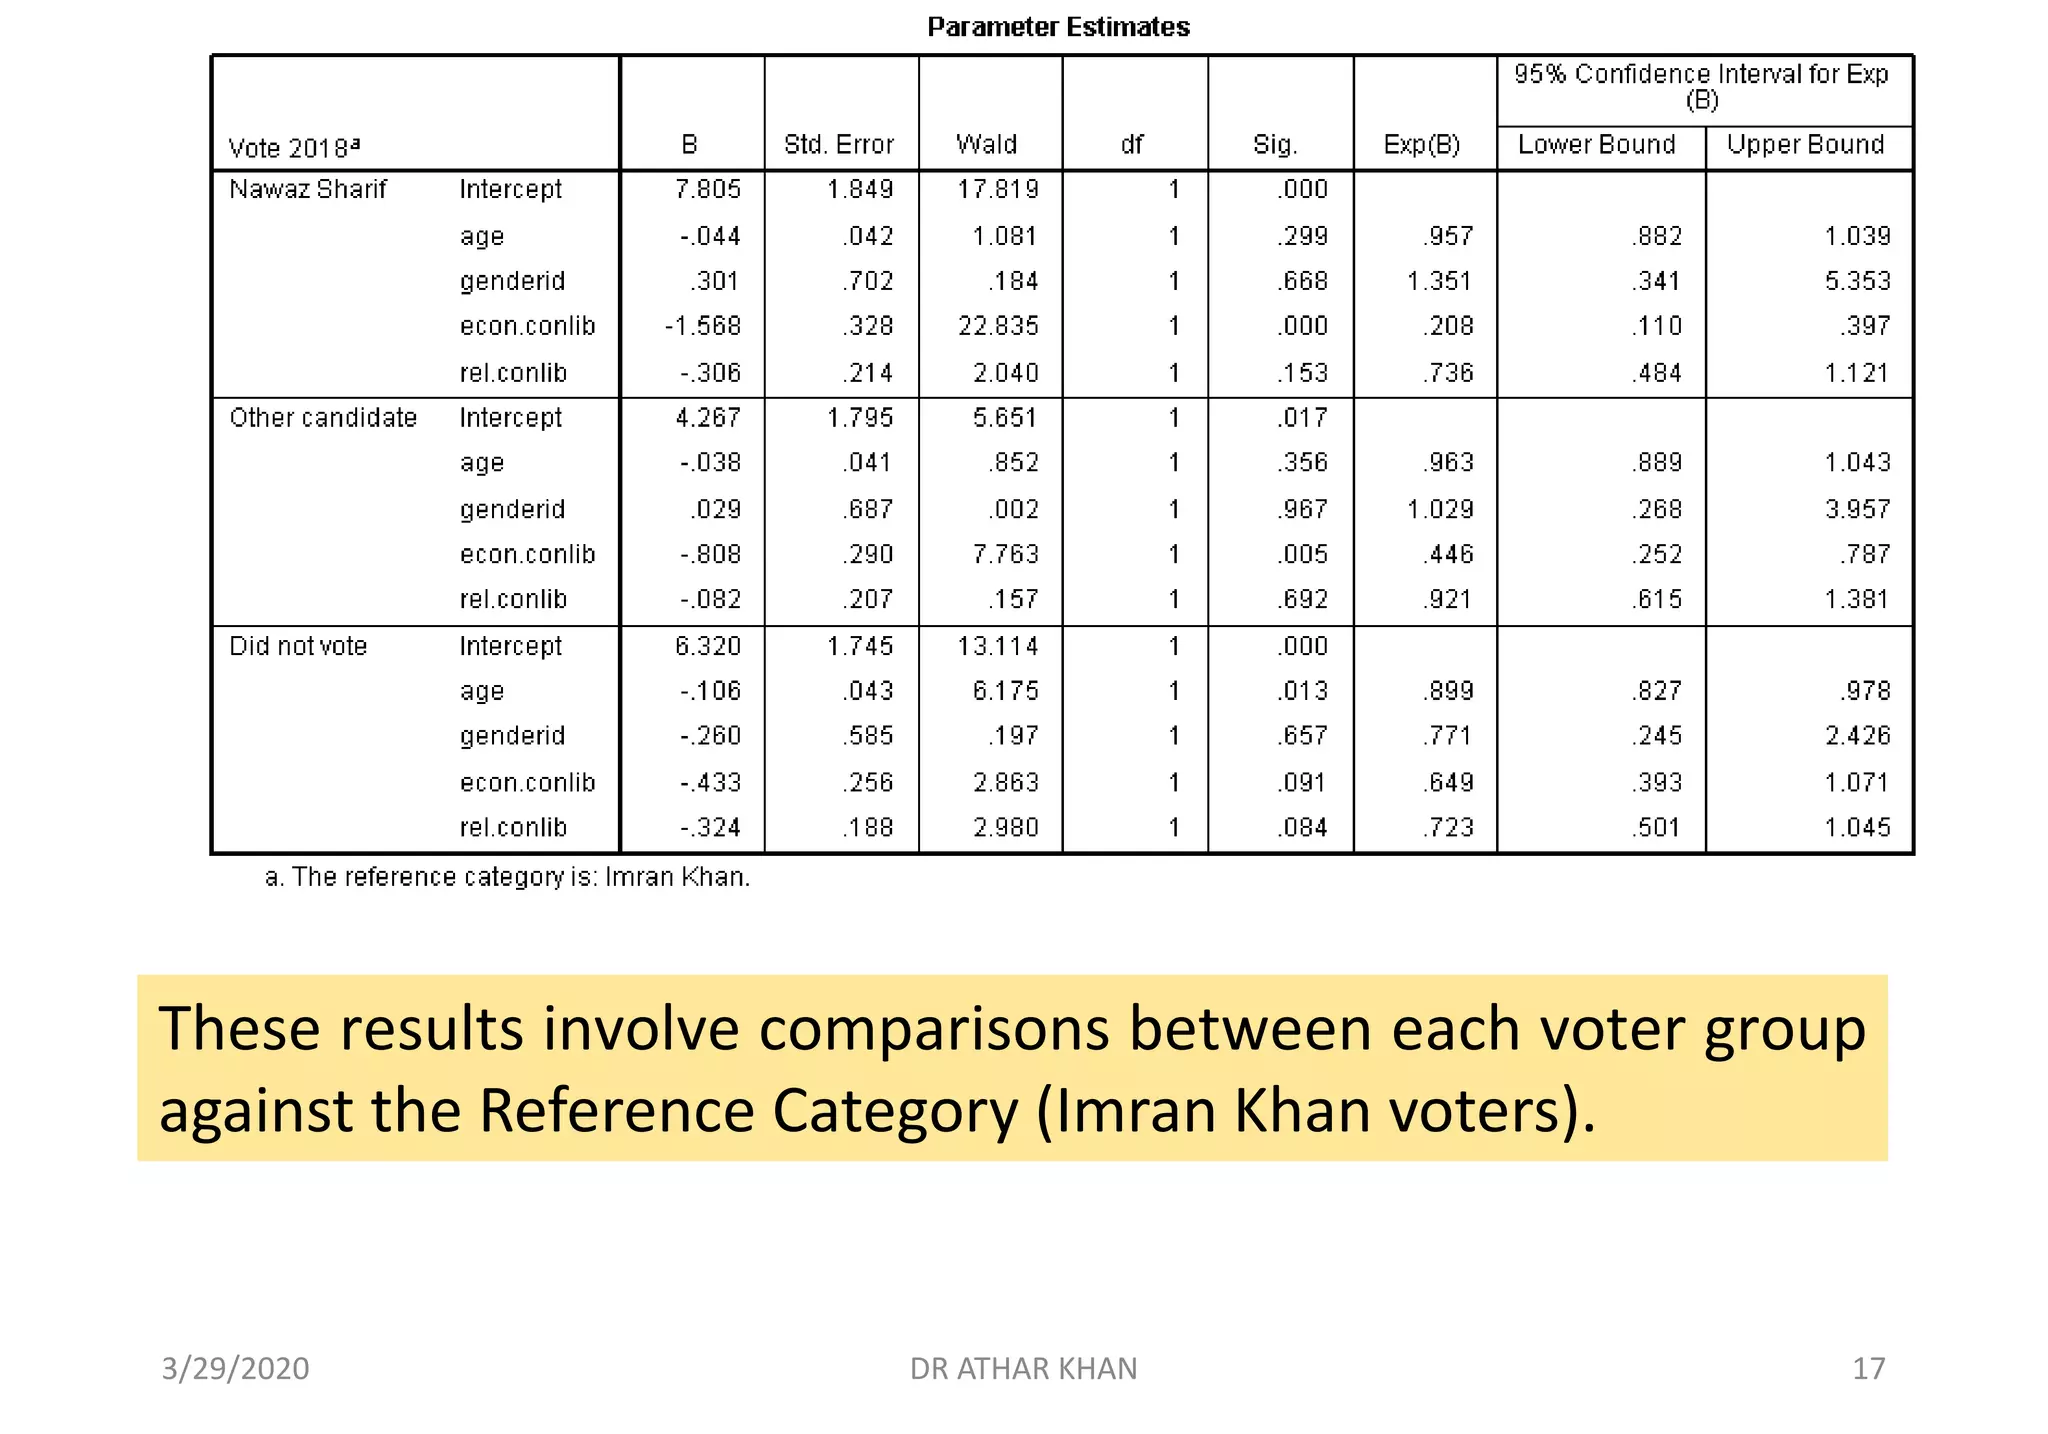
![When setting up our analysis, individuals indicating they
voted for Imran Khan (group 1) as the reference (or
baseline category) against which all other groups are
compared.
[We could also be using a different reference category if
we had interests in other comparisons between a different
baseline category and the remaining groups.]
3/29/2020 DR ATHAR KHAN 6](https://image.slidesharecdn.com/multinomiallrdrathar-converted-200329155613/75/Multinomial-Logistic-Regression-6-2048.jpg)
![The “Model Fitting Information” table contains a Likelihood Ratio, chi-
square test, comparing the full model (i.e., containing all the predictors)
against a null (or intercept only model).
In this example, we see that the full model is a significant improvement
in fit over a null model [χ²(12)=71.567, p<.001].
Statistical significance indicates that the full model represents a
significant improvement in fit over the null model.
Full model statistically significantly predicts the dependent variable better than
the intercept-only model alone.
3/29/2020 DR ATHAR KHAN 13](https://image.slidesharecdn.com/multinomiallrdrathar-converted-200329155613/75/Multinomial-Logistic-Regression-13-2048.jpg)
![Non-significant test results are indicators that the model fits the data
well. [Note: They do not always necessarily agree, as in the case we
see here. So the results are somewhat mixed.]
The “Goodness of Fit” table contains the Deviance and Pearson chi-
square tests, which are useful for determining whether a model
exhibits good fit to the data.
Pearson’s chi-square test indicates that the model does not fit the
data well [χ²(309)=370.099, p=.010], whereas the Deviance chi-square
does indicate good fit [χ²(309)=231.961, p=1.00].
deviance is a measure of goodness of fit: the smaller the deviance, the better the fit.
Model does not
fit the data well
Two measures of goodness-of-fit might not always give the same result.
3/29/2020 DR ATHAR KHAN 14](https://image.slidesharecdn.com/multinomiallrdrathar-converted-200329155613/75/Multinomial-Logistic-Regression-14-2048.jpg)
![▪ These are classification statistics used to determine which group
memberships were best predicted by the model.
▪ Imran Khan voters were correctly predicted by the model 75.8% of the
time [as 25 of the 33 people who actually voted for Imran were
predicted to do so by the model; 25/(25+2+0+6) = .758].
▪ Nawaz Sharif voters were correctly predicted by the model 82.4% of
the time. Persons expressing that they Did Not Vote were correctly
predicted by the model 55.9% of the time.
▪ The model did a particularly poor job of predicting (at a rate of 5.3%)
those who voted for Other candidate.
3/29/2020 DR ATHAR KHAN 22](https://image.slidesharecdn.com/multinomiallrdrathar-converted-200329155613/75/Multinomial-Logistic-Regression-22-2048.jpg)


![We are studying predictors of peoples’ voting behavior
during the 2018 General Election.
We hypothesize that age, gender identification, economic
beliefs, and religious beliefs will predict whether a person
voted for Imran Khan (coded 1 on “vote2018”), Nawaz Sharif
(coded 2 on “vote2018”), an Other Candidate (coded 3), or
Did Not Vote (coded 4).
[Note: The “other” category on the dependent variable was
created because of the low frequencies and it is not a
informative category]
IV IV IV IV DV3/29/2020 DR ATHAR KHAN 4](https://crownmelresort.com/image.slidesharecdn.com/multinomiallrdrathar-converted-200329155613/75/Multinomial-Logistic-Regression-4-2048.jpg)

![When setting up our analysis, individuals indicating they
voted for Imran Khan (group 1) as the reference (or
baseline category) against which all other groups are
compared.
[We could also be using a different reference category if
we had interests in other comparisons between a different
baseline category and the remaining groups.]
3/29/2020 DR ATHAR KHAN 6](https://crownmelresort.com/image.slidesharecdn.com/multinomiallrdrathar-converted-200329155613/75/Multinomial-Logistic-Regression-6-2048.jpg)


![The “Model Fitting Information” table contains a Likelihood Ratio, chi-
square test, comparing the full model (i.e., containing all the predictors)
against a null (or intercept only model).
In this example, we see that the full model is a significant improvement
in fit over a null model [χ²(12)=71.567, p<.001].
Statistical significance indicates that the full model represents a
significant improvement in fit over the null model.
Full model statistically significantly predicts the dependent variable better than
the intercept-only model alone.
3/29/2020 DR ATHAR KHAN 13](https://crownmelresort.com/image.slidesharecdn.com/multinomiallrdrathar-converted-200329155613/75/Multinomial-Logistic-Regression-13-2048.jpg)
![Non-significant test results are indicators that the model fits the data
well. [Note: They do not always necessarily agree, as in the case we
see here. So the results are somewhat mixed.]
The “Goodness of Fit” table contains the Deviance and Pearson chi-
square tests, which are useful for determining whether a model
exhibits good fit to the data.
Pearson’s chi-square test indicates that the model does not fit the
data well [χ²(309)=370.099, p=.010], whereas the Deviance chi-square
does indicate good fit [χ²(309)=231.961, p=1.00].
deviance is a measure of goodness of fit: the smaller the deviance, the better the fit.
Model does not
fit the data well
Two measures of goodness-of-fit might not always give the same result.
3/29/2020 DR ATHAR KHAN 14](https://crownmelresort.com/image.slidesharecdn.com/multinomiallrdrathar-converted-200329155613/75/Multinomial-Logistic-Regression-14-2048.jpg)


![▪ These are classification statistics used to determine which group
memberships were best predicted by the model.
▪ Imran Khan voters were correctly predicted by the model 75.8% of the
time [as 25 of the 33 people who actually voted for Imran were
predicted to do so by the model; 25/(25+2+0+6) = .758].
▪ Nawaz Sharif voters were correctly predicted by the model 82.4% of
the time. Persons expressing that they Did Not Vote were correctly
predicted by the model 55.9% of the time.
▪ The model did a particularly poor job of predicting (at a rate of 5.3%)
those who voted for Other candidate.
3/29/2020 DR ATHAR KHAN 22](https://crownmelresort.com/image.slidesharecdn.com/multinomiallrdrathar-converted-200329155613/75/Multinomial-Logistic-Regression-22-2048.jpg)


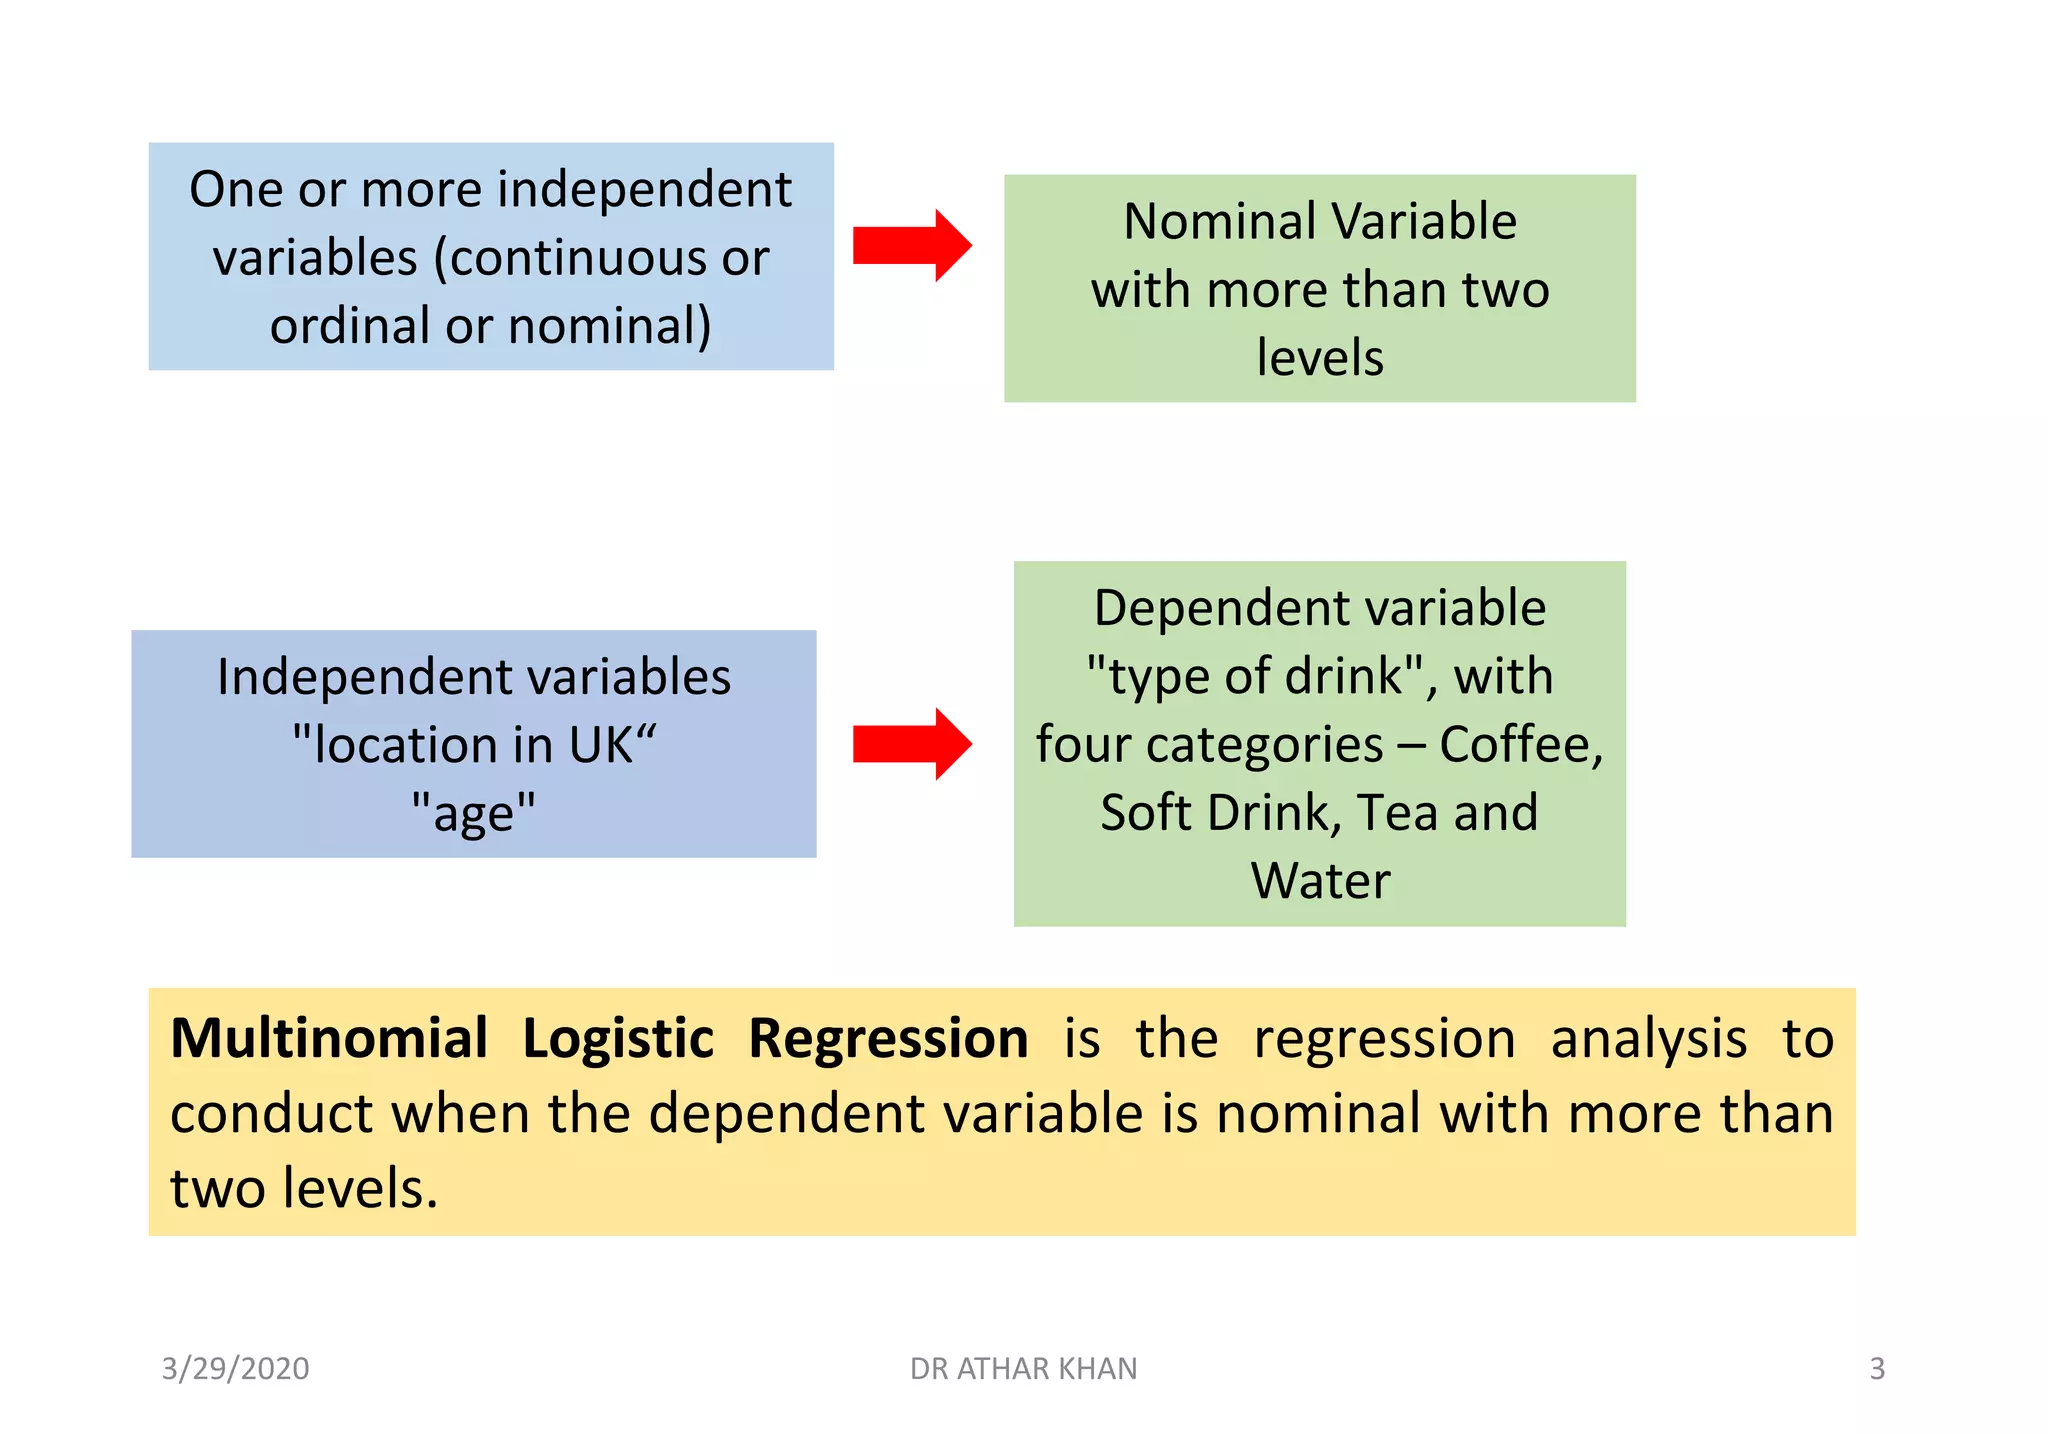
This document provides an overview of multinomial logistic regression. It discusses how multinomial logistic regression is used when the dependent variable has more than two nominal categories. An example is presented where voting behavior is predicted based on age, gender, economic beliefs, and religious beliefs, with the dependent variable having four categories for different candidates. The document walks through setting up and interpreting the results of a multinomial logistic regression analysis in SPSS for this example. Key results shown include the regression coefficients, odds ratios, goodness of fit statistics, and classification accuracy for each category of the dependent variable.