![Probability Distribution
© akhila prabhakaran
Experiment: Flip a coin two times.
All possible outcomes: HH, HT, TH, and TT.
Random variable X : Number of Heads that result from this experiment.
All possible values of X : 0, 1, or 2.
A probability distribution is a table or an equation that links each outcome of a statistical experiment
with its probability of occurrence.
Number of Heads
(X)
Probability [ P(X =x)]
0 0.25
1 0.50
2 0.25](https://image.slidesharecdn.com/statisticalanalysis-part3-180526103358/75/Statistical-Analysis-with-R-III-6-2048.jpg)

![Normal Distribution – Area under the
curve
© akhila prabhakaran
http://onlinestatbook.com/2/calculators/normal_dist.html
> pnorm(1, mean=0, sd=1)
[1] 0.8413447
> x=seq(-4,4,length=200)
> y=dnorm(x)
> plot(x,y,type="l", lwd=2, col="blue")
> x=seq(-4,1,length=200)
> y=dnorm(x)
> polygon(c(-4,x,1),c(0,y,0),col="gray")
Interpretation of area as a probability
This result indicates that if we draw a number at
random from the standard normal distribution, the
probability that we draw a number that is less than or
equal to 1 is 0.8413447.](https://image.slidesharecdn.com/statisticalanalysis-part3-180526103358/75/Statistical-Analysis-with-R-III-36-2048.jpg)
![Normal Distribution: Area under the curve
© akhila prabhakaran
The probability that a randomly selected number from the standard normal distribution occurs
within one standard deviation of the mean.
This probability is represented by the area under the standard normal curve between x = -1
and x = 1
> pnorm(1, mean=0, sd=1)-pnorm(-1,mean-0, sd = 1)
[1] 0.6826895
> x=seq(-4,4,length=200)
> y=dnorm(x)
> plot(x,y,type="l", lwd=2, col="blue")
> x=seq(-1,1,length=100)
> y=dnorm(x)
> polygon(c(-1,x,1),c(0,y,0),col="gray")](https://image.slidesharecdn.com/statisticalanalysis-part3-180526103358/75/Statistical-Analysis-with-R-III-37-2048.jpg)
![Normal Distribution: Quantiles
© akhila prabhakaran
Given the probability (or area under the curve) find the x value.
What is the 95th percentile of a standard normal distribution?
> qnorm(0.95,mean=0,sd=1)
[1] 1.644854
Find all quantiles of the standard normal distribution.
Display pdfs of normal distributions with mean of 50 and with
standard deviations of 10 and 5 respectively.
Display pdfs of normal distributions with mean of 50 and 70
& standard deviations of 10 and 15 respectively](https://image.slidesharecdn.com/statisticalanalysis-part3-180526103358/75/Statistical-Analysis-with-R-III-38-2048.jpg)
![Degrees
of
Freedom
© akhila prabhakaran
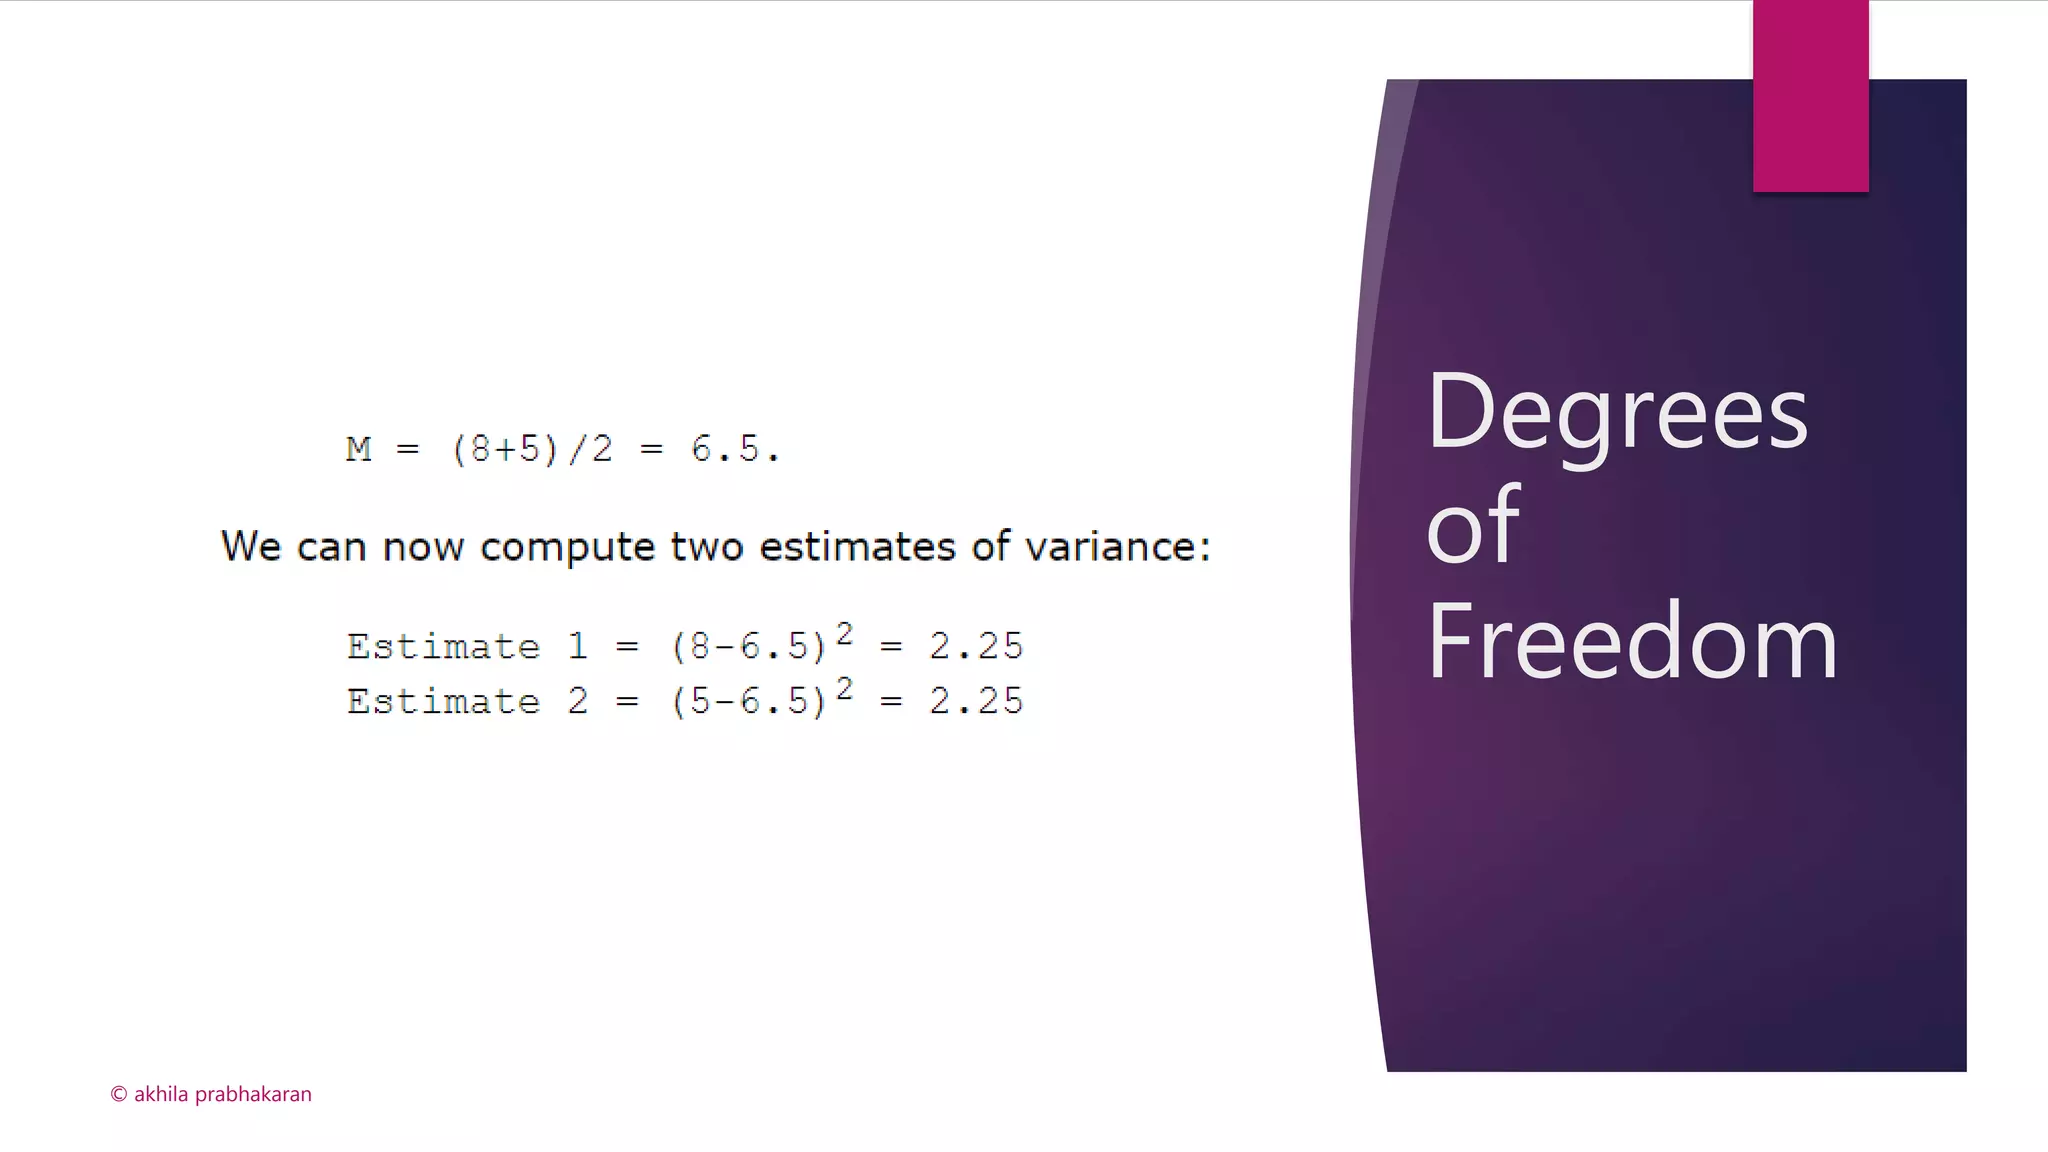
The degrees of freedom (df) of an estimate is the number of
independent pieces of information on which the estimate is
based.
For example, an estimate of the variance based on a sample
size of 100 is based on more information than an estimate of
the variance based on a sample size of 5.
If we know that the mean height of Martians is 6 and wish to
estimate the variance of their heights. We randomly sample
one Martian and find that its height is 8.
Variance = (8-6)2 Has 1 degree of freedom
If we have the height of another Martian, say 9, The new
variance would be [(8-6)2 + (9-6)2] x 1/2 With 2 degrees of
freedom
Now, if we do not know the mean, the degrees of freedom
reduces by 1](https://image.slidesharecdn.com/statisticalanalysis-part3-180526103358/75/Statistical-Analysis-with-R-III-41-2048.jpg)
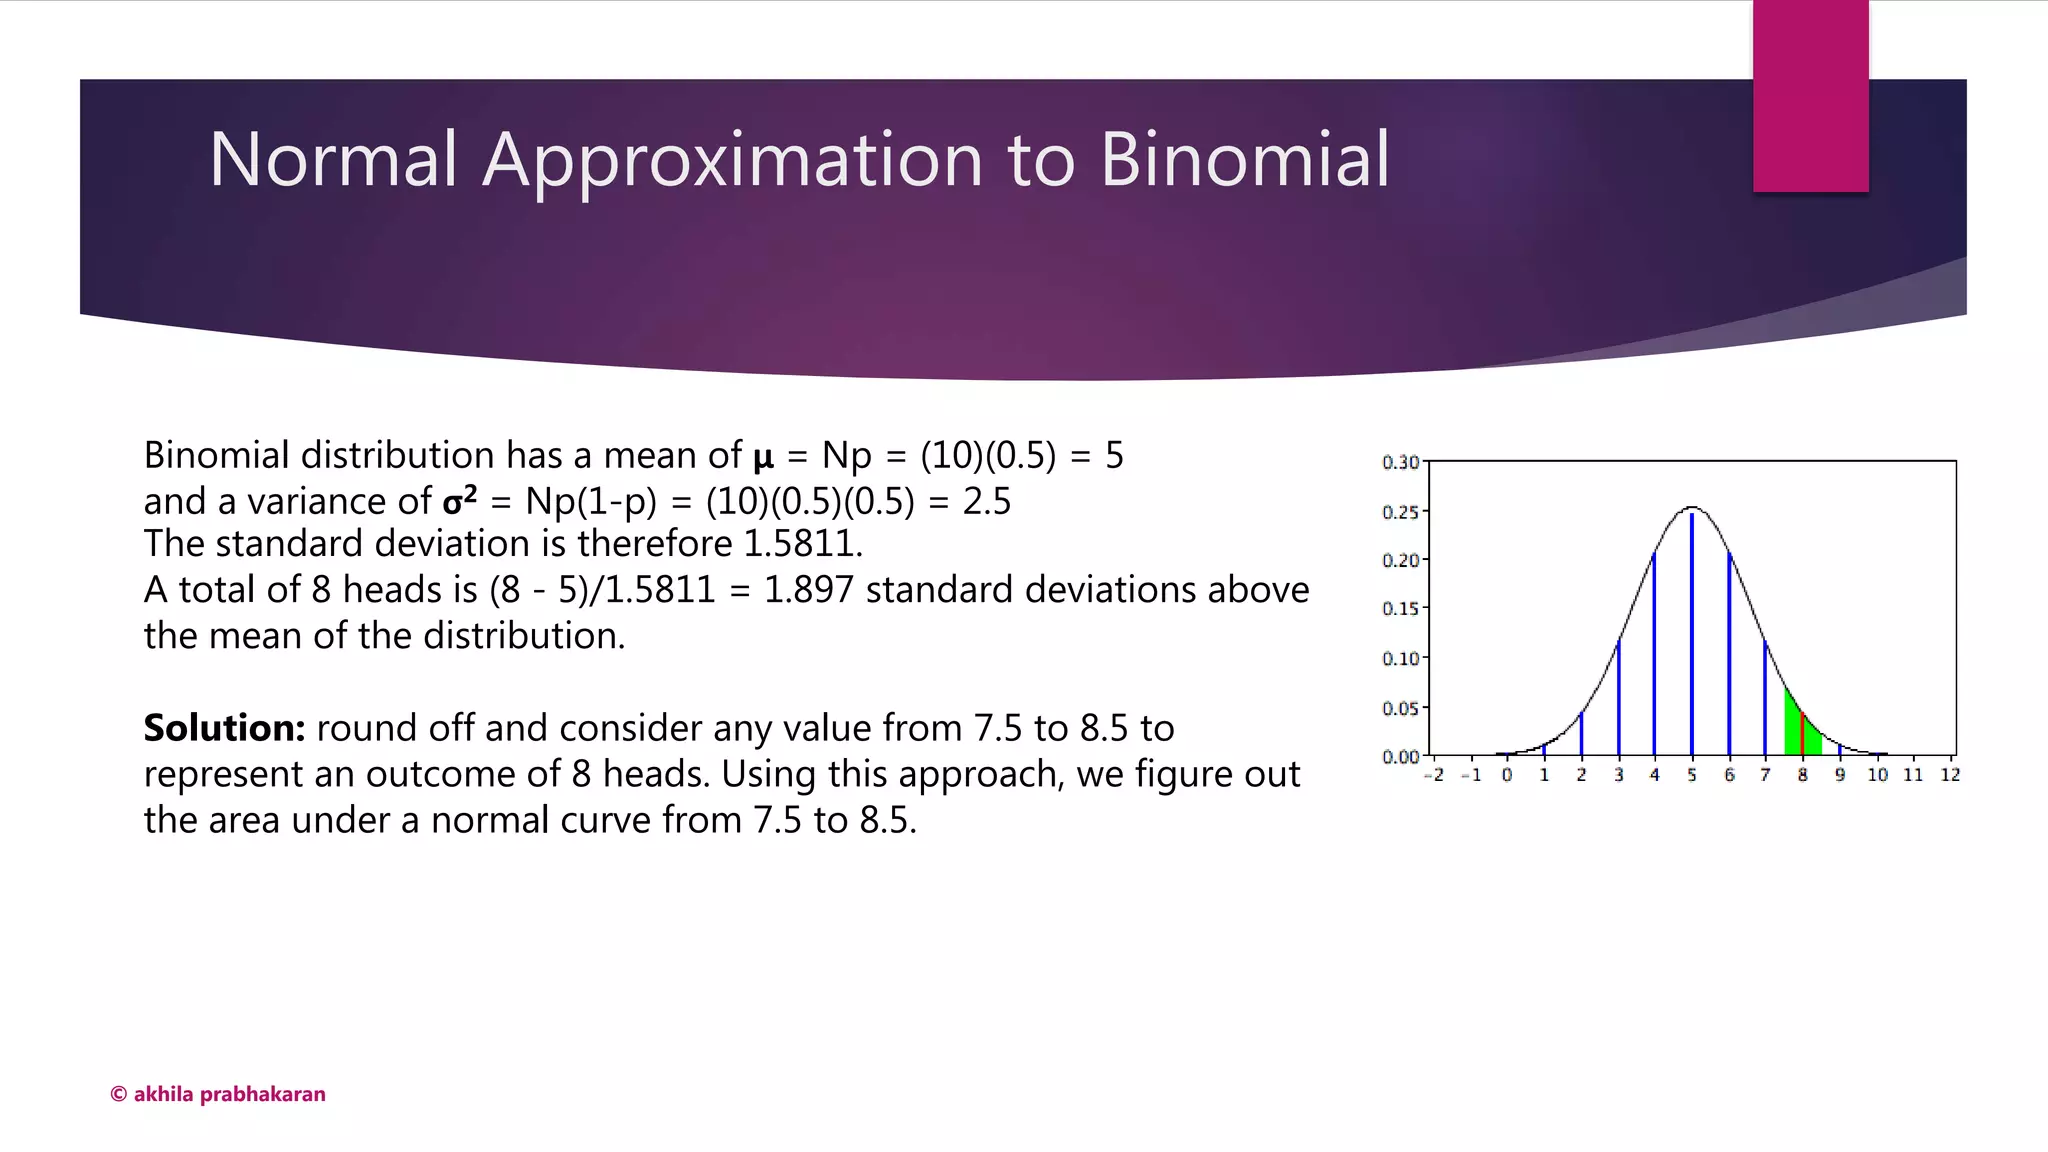
![Normal Approximation to Binomial
© akhila prabhakaran
Assume you have a fair coin and
wish to know the probability that
you would get 8 heads out of 10
flips.
Using dbinom
dbinom(8,10,0.5)
#[1] 0.04394531
plot(dbinom(seq(1:100), 100,
0.5), col="red", pch=19)](https://image.slidesharecdn.com/statisticalanalysis-part3-180526103358/75/Statistical-Analysis-with-R-III-50-2048.jpg)
![Central limit theorem - Usage
© akhila prabhakaran
Problem: A certain group of welfare recipients receives SNAP benefits of $110
per week with a standard deviation of $20. If a random sample of 25 people is
taken, what is the probability their mean benefit will be greater than $120 per
week?
X ~ mean of the random sample
To find P(X > $120)
X ~ N(110, 20/sqrt(25))
(X – 110)/4 ~ N(0,1)
Problem translates to P[(X-110)/4 > (120-110)/4] or P( Y > 2.5) where
Y~N(0,1)
1 - pnorm(2.5)](https://image.slidesharecdn.com/statisticalanalysis-part3-180526103358/75/Statistical-Analysis-with-R-III-59-2048.jpg)
![Central limit theorem - Usage
© akhila prabhakaran
Problem: A population of 29 year-old males has a mean salary of $29,321 with
a standard deviation of $2,120. If a sample of 100 men is taken, what is the
probability their mean salaries will be less than $29,000?
The mean (average or μ) = 29321
The standard deviation (σ) = 2120
Sample size (n) = 100
In other words, the problem is asking you “What is the probability that a
sample mean of 100 items will be less than a given number?
X ~ sample mean
Y = [(X – μ)/(σ/sqrt(n))] ~ N(0.1)
P (Y < [(29000 – μ)/(σ/sqrt(n))])= pnorm(-1.51)](https://image.slidesharecdn.com/statisticalanalysis-part3-180526103358/75/Statistical-Analysis-with-R-III-60-2048.jpg)
![Central limit theorem - Usage
© akhila prabhakaran
Problem: There are 250 dogs at a dog show who weigh an average of 12
pounds, with a standard deviation of 8 pounds. If 4 dogs are chosen at
random, what is the probability they have an average weight of greater than 8
pounds and less than 25 pounds?
The mean (average or μ) = 12
The standard deviation (σ) = 8
Sample size (n) = 4
In other words, the problem is asking you “What is the probability that a
sample mean of 4 items will be less than 25 and more than 8?
X ~ sample mean
Y = [(X – μ)/(σ/sqrt(n))] ~ N(0.1)
P ([(8 – μ)/(σ/sqrt(n))] < Y < [(25 – μ)/(σ/sqrt(n))])](https://image.slidesharecdn.com/statisticalanalysis-part3-180526103358/75/Statistical-Analysis-with-R-III-61-2048.jpg)
![Central limit theorem - Usage
© akhila prabhakaran
The mean (average or μ) = 12
The standard deviation (σ) = 8
Sample size (n) = 4
X ~ sample mean
Y = [(X – μ)/(σ/sqrt(n))] ~ N(0.1)
P ([(8 – μ)/(σ/sqrt(n))] < Y < [(25 – μ)/(σ/sqrt(n))])
P(-4/4 < Y < 13/4 )
= pnorm(3.5) + 1 – pnorm(-1)](https://image.slidesharecdn.com/statisticalanalysis-part3-180526103358/75/Statistical-Analysis-with-R-III-62-2048.jpg)
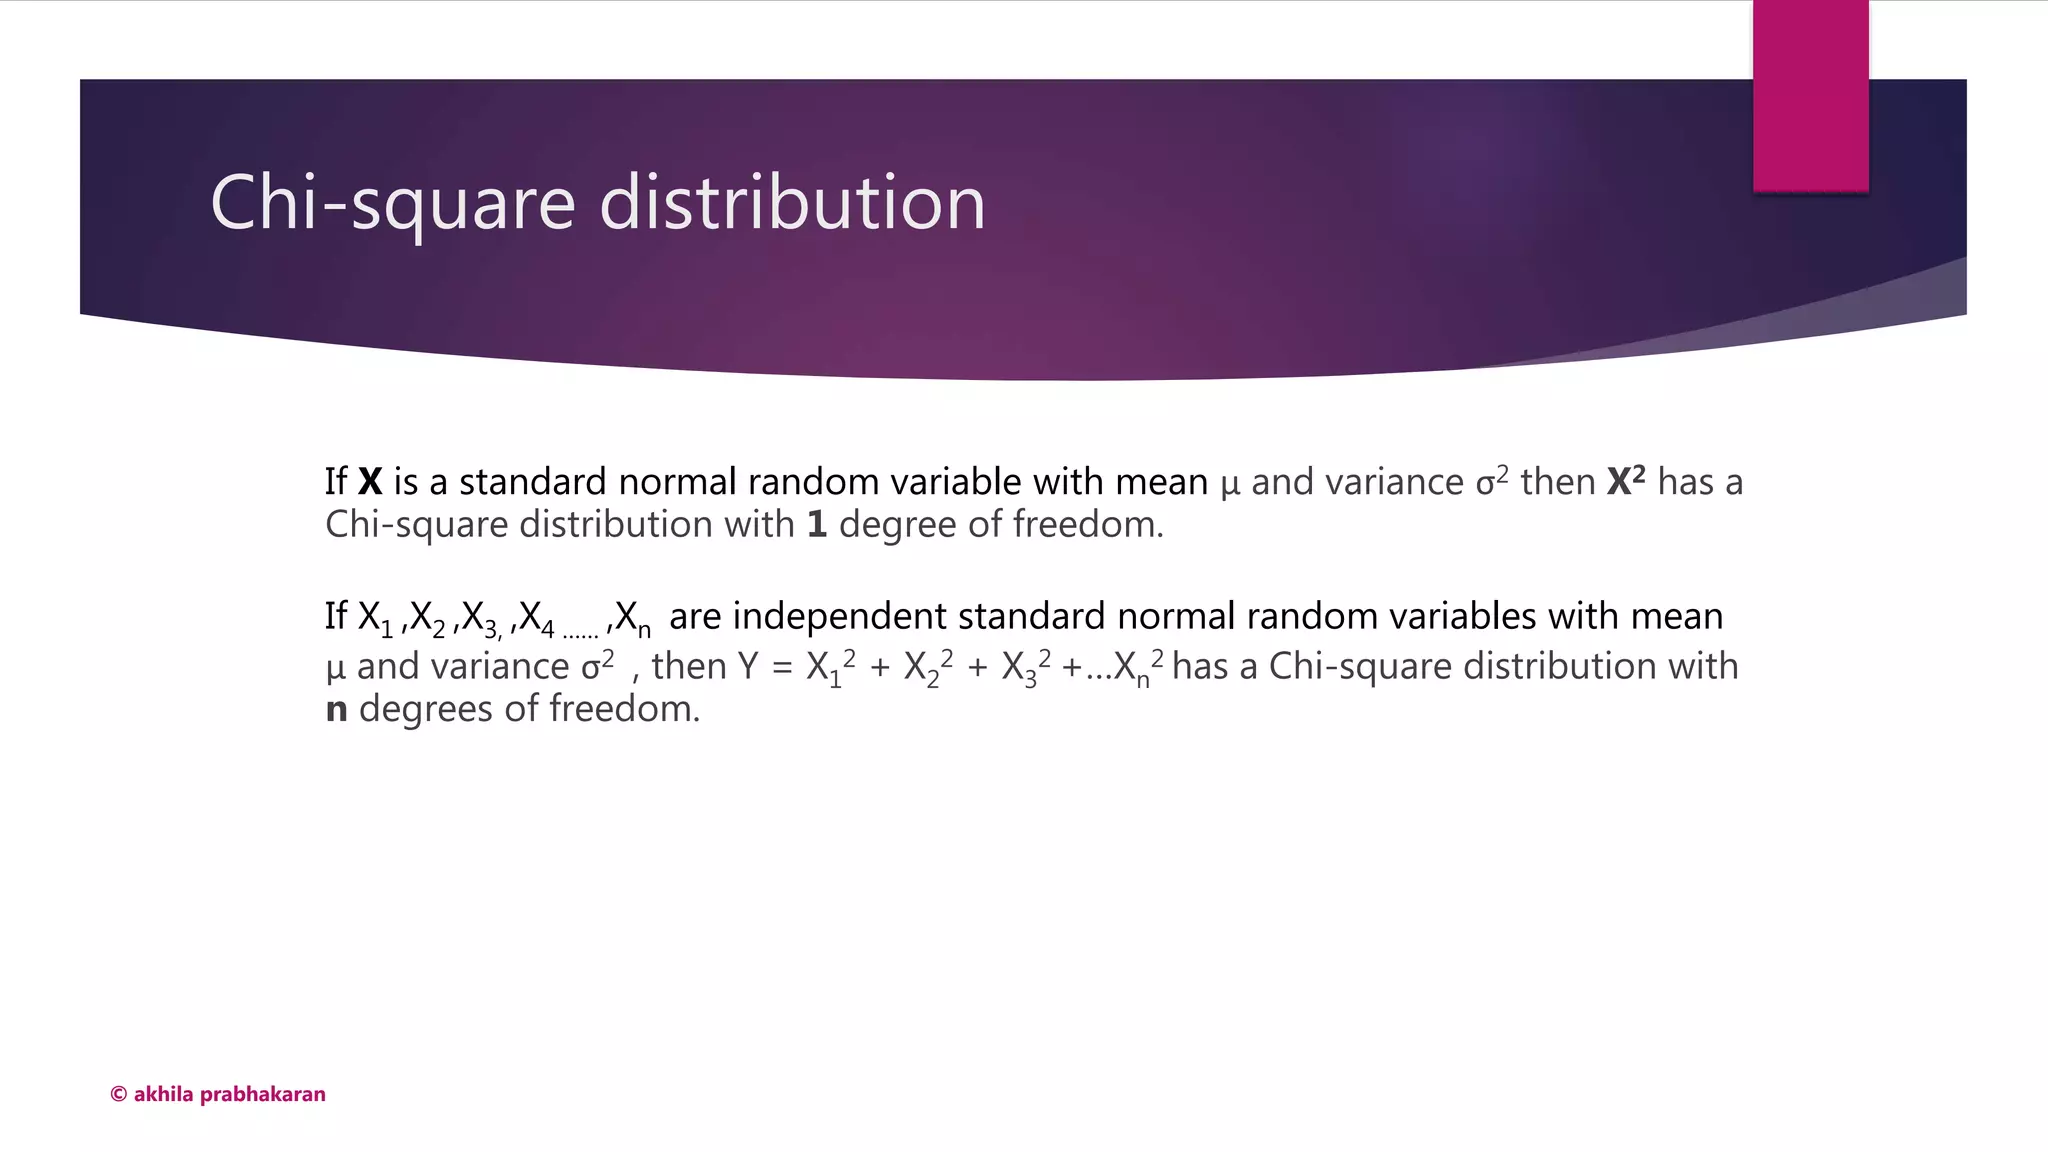
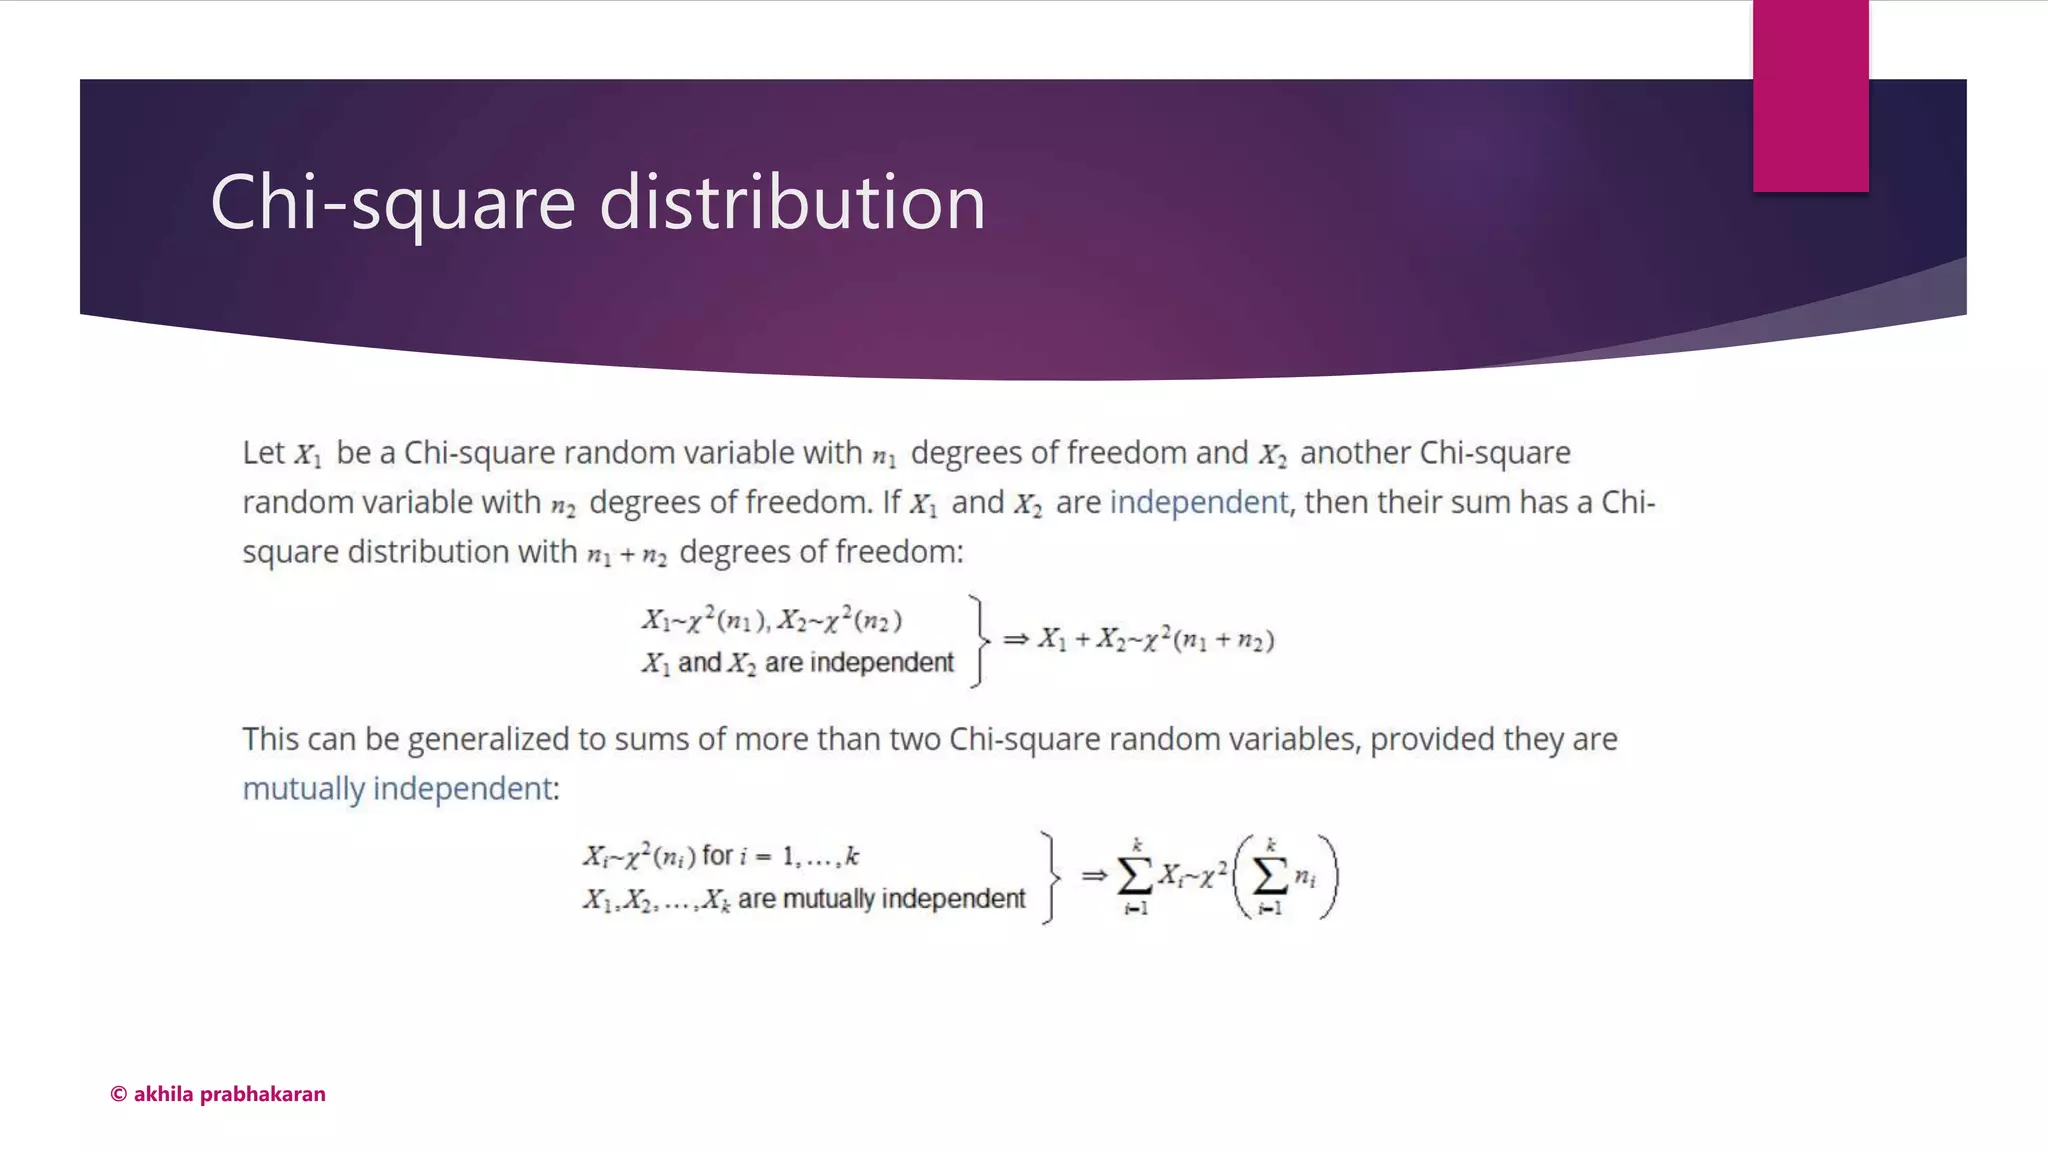
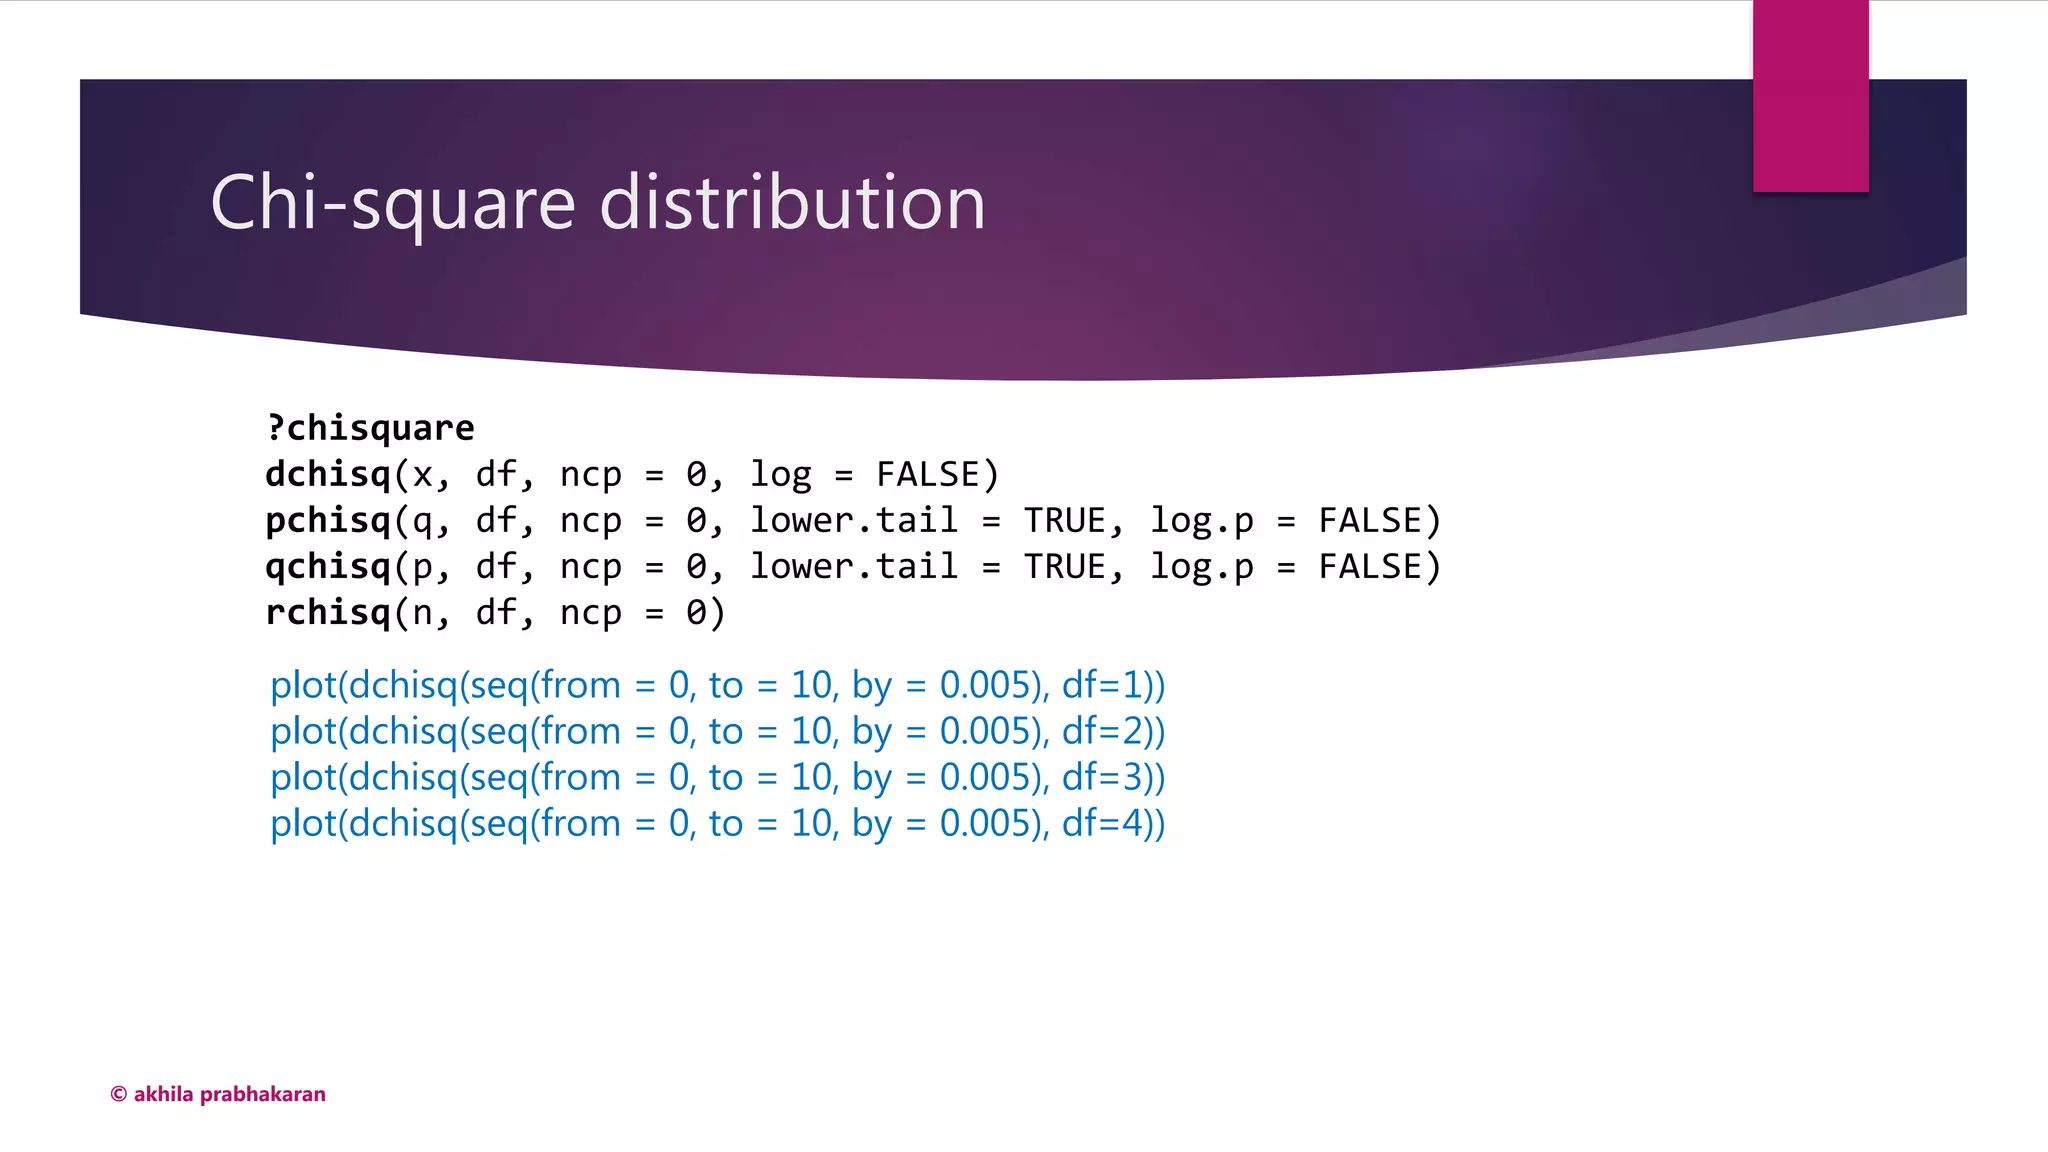
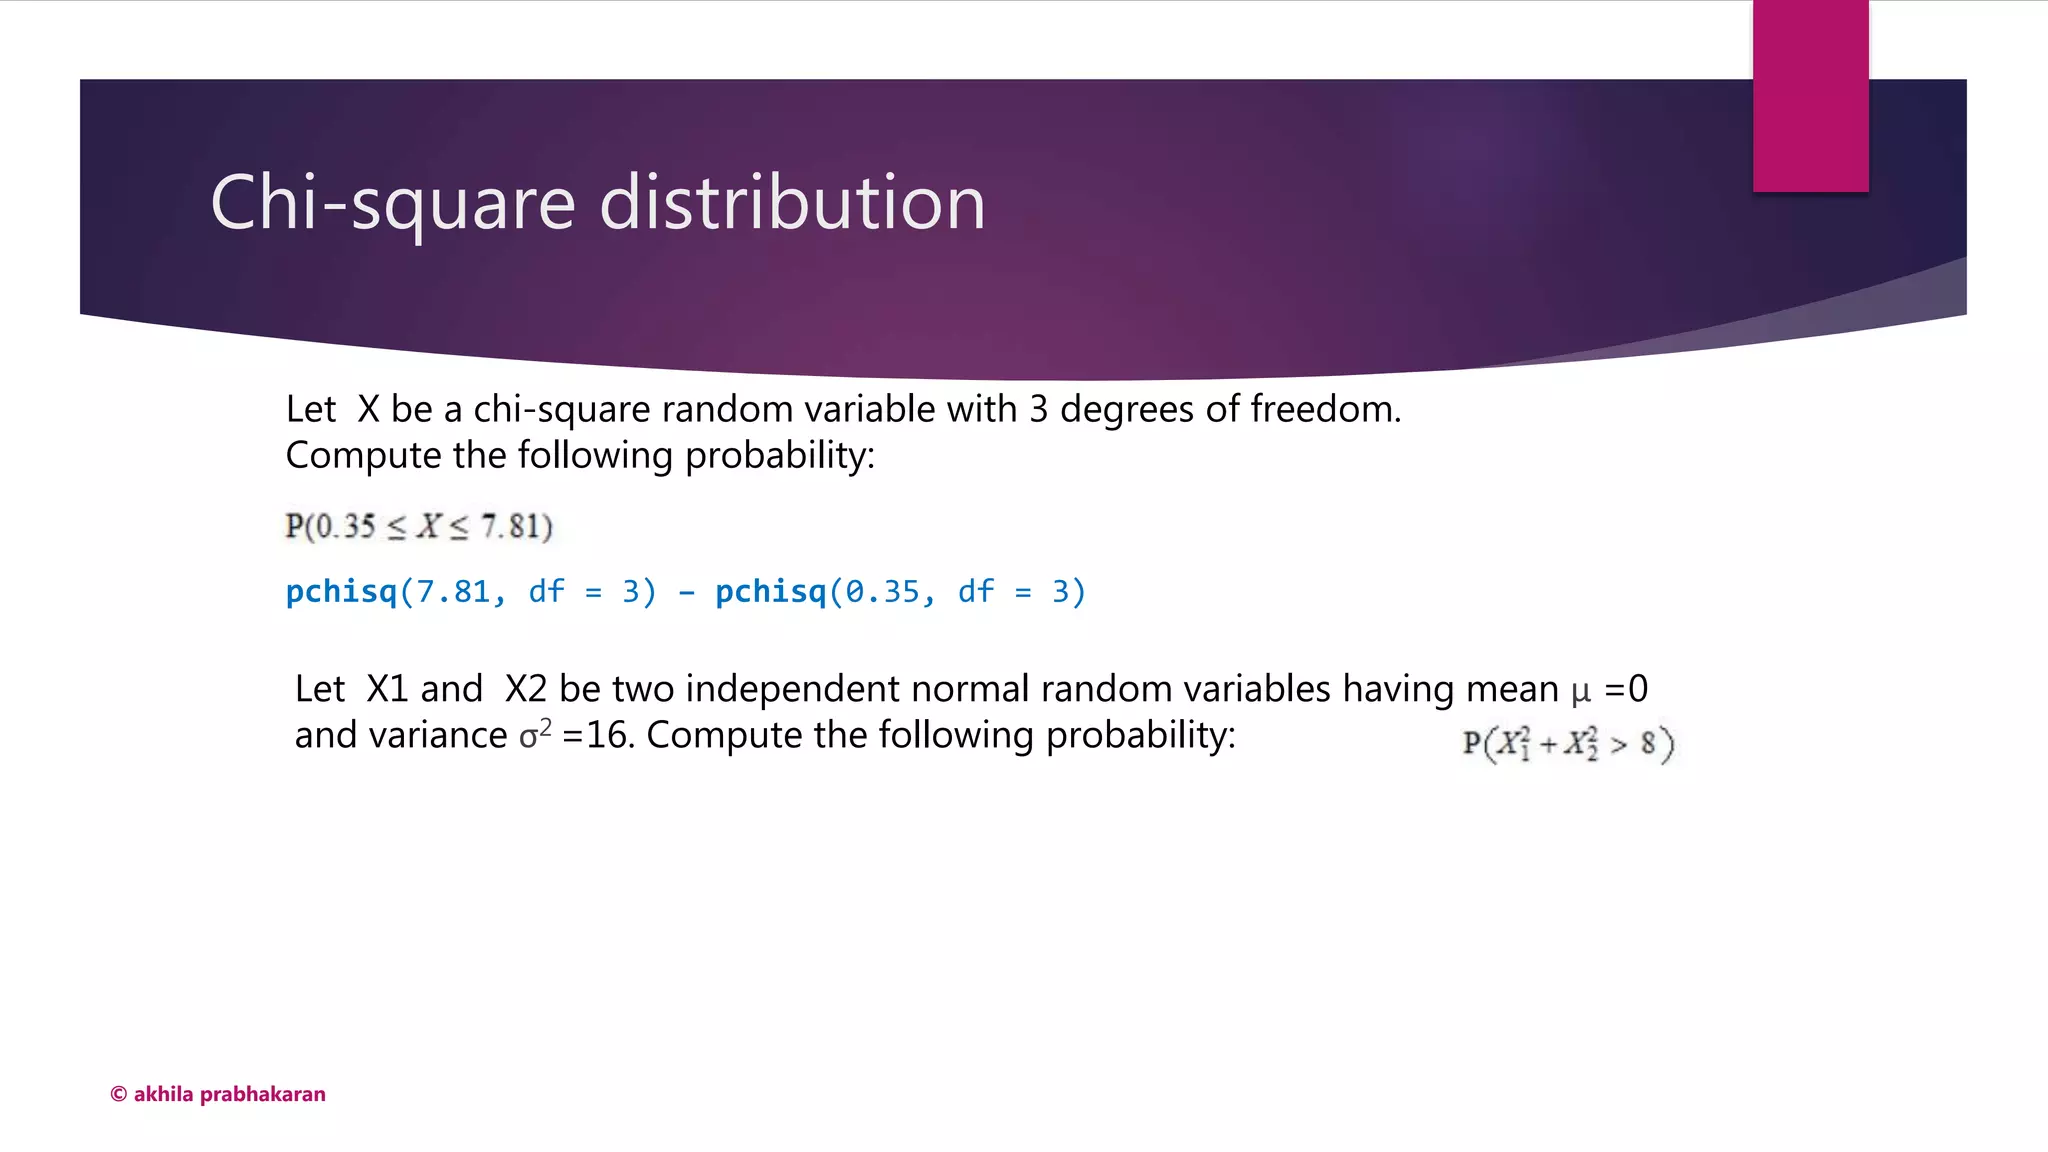
![Chi-square distribution
© akhila prabhakaran
X ~ Chi-square with n degrees of freedom
Prob. Density function
c is a constant
E[X] = n
Var[X] = 2n](https://image.slidesharecdn.com/statisticalanalysis-part3-180526103358/75/Statistical-Analysis-with-R-III-64-2048.jpg)


![Probability Distribution
© akhila prabhakaran
Experiment: Flip a coin two times.
All possible outcomes: HH, HT, TH, and TT.
Random variable X : Number of Heads that result from this experiment.
All possible values of X : 0, 1, or 2.
A probability distribution is a table or an equation that links each outcome of a statistical experiment
with its probability of occurrence.
Number of Heads
(X)
Probability [ P(X =x)]
0 0.25
1 0.50
2 0.25](https://crownmelresort.com/image.slidesharecdn.com/statisticalanalysis-part3-180526103358/75/Statistical-Analysis-with-R-III-6-2048.jpg)


![Normal Distribution – Area under the
curve
© akhila prabhakaran
http://onlinestatbook.com/2/calculators/normal_dist.html
> pnorm(1, mean=0, sd=1)
[1] 0.8413447
> x=seq(-4,4,length=200)
> y=dnorm(x)
> plot(x,y,type="l", lwd=2, col="blue")
> x=seq(-4,1,length=200)
> y=dnorm(x)
> polygon(c(-4,x,1),c(0,y,0),col="gray")
Interpretation of area as a probability
This result indicates that if we draw a number at
random from the standard normal distribution, the
probability that we draw a number that is less than or
equal to 1 is 0.8413447.](https://crownmelresort.com/image.slidesharecdn.com/statisticalanalysis-part3-180526103358/75/Statistical-Analysis-with-R-III-36-2048.jpg)
![Normal Distribution: Area under the curve
© akhila prabhakaran
The probability that a randomly selected number from the standard normal distribution occurs
within one standard deviation of the mean.
This probability is represented by the area under the standard normal curve between x = -1
and x = 1
> pnorm(1, mean=0, sd=1)-pnorm(-1,mean-0, sd = 1)
[1] 0.6826895
> x=seq(-4,4,length=200)
> y=dnorm(x)
> plot(x,y,type="l", lwd=2, col="blue")
> x=seq(-1,1,length=100)
> y=dnorm(x)
> polygon(c(-1,x,1),c(0,y,0),col="gray")](https://crownmelresort.com/image.slidesharecdn.com/statisticalanalysis-part3-180526103358/75/Statistical-Analysis-with-R-III-37-2048.jpg)
![Normal Distribution: Quantiles
© akhila prabhakaran
Given the probability (or area under the curve) find the x value.
What is the 95th percentile of a standard normal distribution?
> qnorm(0.95,mean=0,sd=1)
[1] 1.644854
Find all quantiles of the standard normal distribution.
Display pdfs of normal distributions with mean of 50 and with
standard deviations of 10 and 5 respectively.
Display pdfs of normal distributions with mean of 50 and 70
& standard deviations of 10 and 15 respectively](https://crownmelresort.com/image.slidesharecdn.com/statisticalanalysis-part3-180526103358/75/Statistical-Analysis-with-R-III-38-2048.jpg)


![Degrees
of
Freedom
© akhila prabhakaran
The degrees of freedom (df) of an estimate is the number of
independent pieces of information on which the estimate is
based.
For example, an estimate of the variance based on a sample
size of 100 is based on more information than an estimate of
the variance based on a sample size of 5.
If we know that the mean height of Martians is 6 and wish to
estimate the variance of their heights. We randomly sample
one Martian and find that its height is 8.
Variance = (8-6)2 Has 1 degree of freedom
If we have the height of another Martian, say 9, The new
variance would be [(8-6)2 + (9-6)2] x 1/2 With 2 degrees of
freedom
Now, if we do not know the mean, the degrees of freedom
reduces by 1](https://crownmelresort.com/image.slidesharecdn.com/statisticalanalysis-part3-180526103358/75/Statistical-Analysis-with-R-III-41-2048.jpg)


![Normal Approximation to Binomial
© akhila prabhakaran
Assume you have a fair coin and
wish to know the probability that
you would get 8 heads out of 10
flips.
Using dbinom
dbinom(8,10,0.5)
#[1] 0.04394531
plot(dbinom(seq(1:100), 100,
0.5), col="red", pch=19)](https://crownmelresort.com/image.slidesharecdn.com/statisticalanalysis-part3-180526103358/75/Statistical-Analysis-with-R-III-50-2048.jpg)


![Central limit theorem - Usage
© akhila prabhakaran
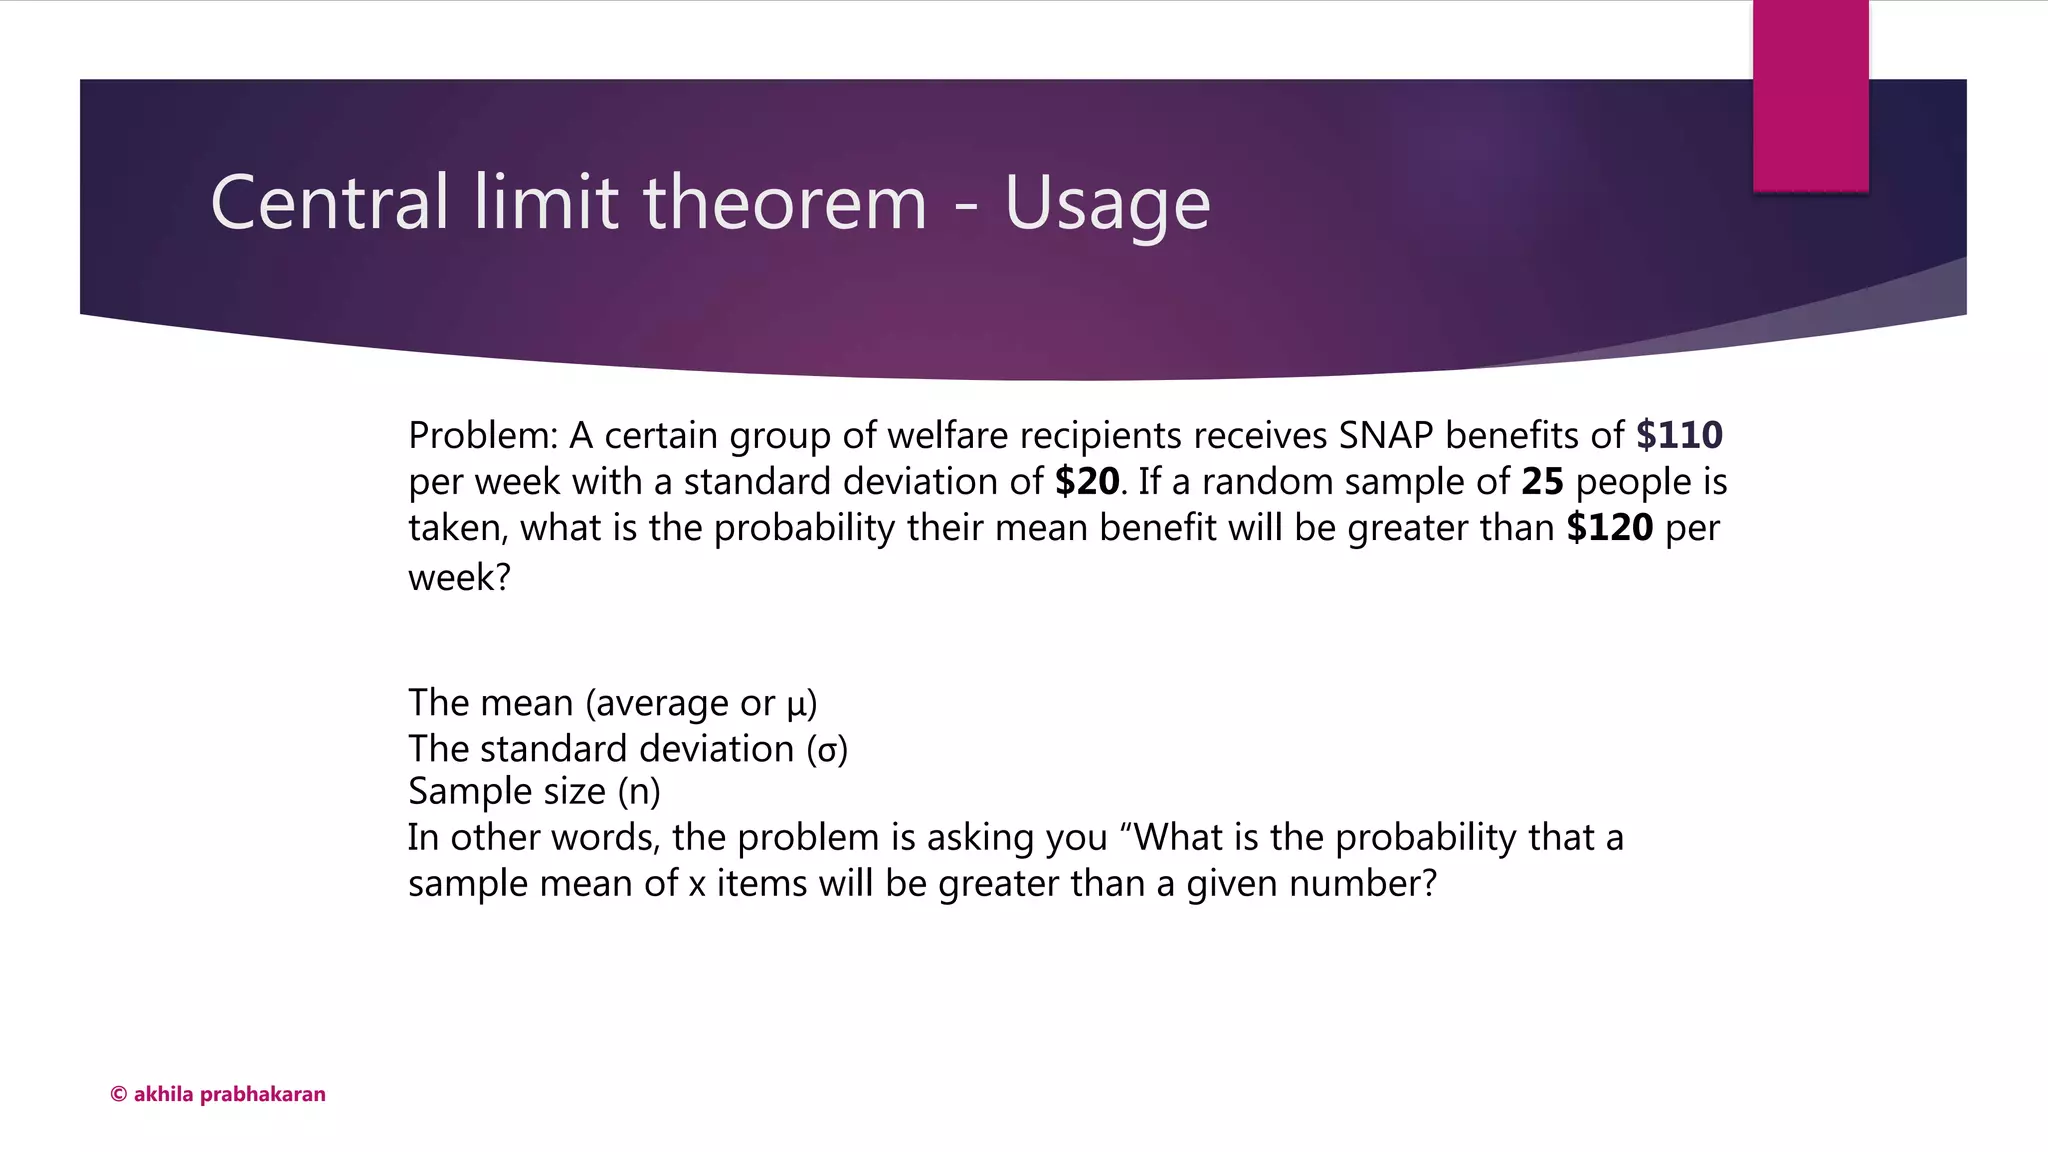
Problem: A certain group of welfare recipients receives SNAP benefits of $110
per week with a standard deviation of $20. If a random sample of 25 people is
taken, what is the probability their mean benefit will be greater than $120 per
week?
X ~ mean of the random sample
To find P(X > $120)
X ~ N(110, 20/sqrt(25))
(X – 110)/4 ~ N(0,1)
Problem translates to P[(X-110)/4 > (120-110)/4] or P( Y > 2.5) where
Y~N(0,1)
1 - pnorm(2.5)](https://crownmelresort.com/image.slidesharecdn.com/statisticalanalysis-part3-180526103358/75/Statistical-Analysis-with-R-III-59-2048.jpg)
![Central limit theorem - Usage
© akhila prabhakaran
Problem: A population of 29 year-old males has a mean salary of $29,321 with
a standard deviation of $2,120. If a sample of 100 men is taken, what is the
probability their mean salaries will be less than $29,000?
The mean (average or μ) = 29321
The standard deviation (σ) = 2120
Sample size (n) = 100
In other words, the problem is asking you “What is the probability that a
sample mean of 100 items will be less than a given number?
X ~ sample mean
Y = [(X – μ)/(σ/sqrt(n))] ~ N(0.1)
P (Y < [(29000 – μ)/(σ/sqrt(n))])= pnorm(-1.51)](https://crownmelresort.com/image.slidesharecdn.com/statisticalanalysis-part3-180526103358/75/Statistical-Analysis-with-R-III-60-2048.jpg)
![Central limit theorem - Usage
© akhila prabhakaran
Problem: There are 250 dogs at a dog show who weigh an average of 12
pounds, with a standard deviation of 8 pounds. If 4 dogs are chosen at
random, what is the probability they have an average weight of greater than 8
pounds and less than 25 pounds?
The mean (average or μ) = 12
The standard deviation (σ) = 8
Sample size (n) = 4
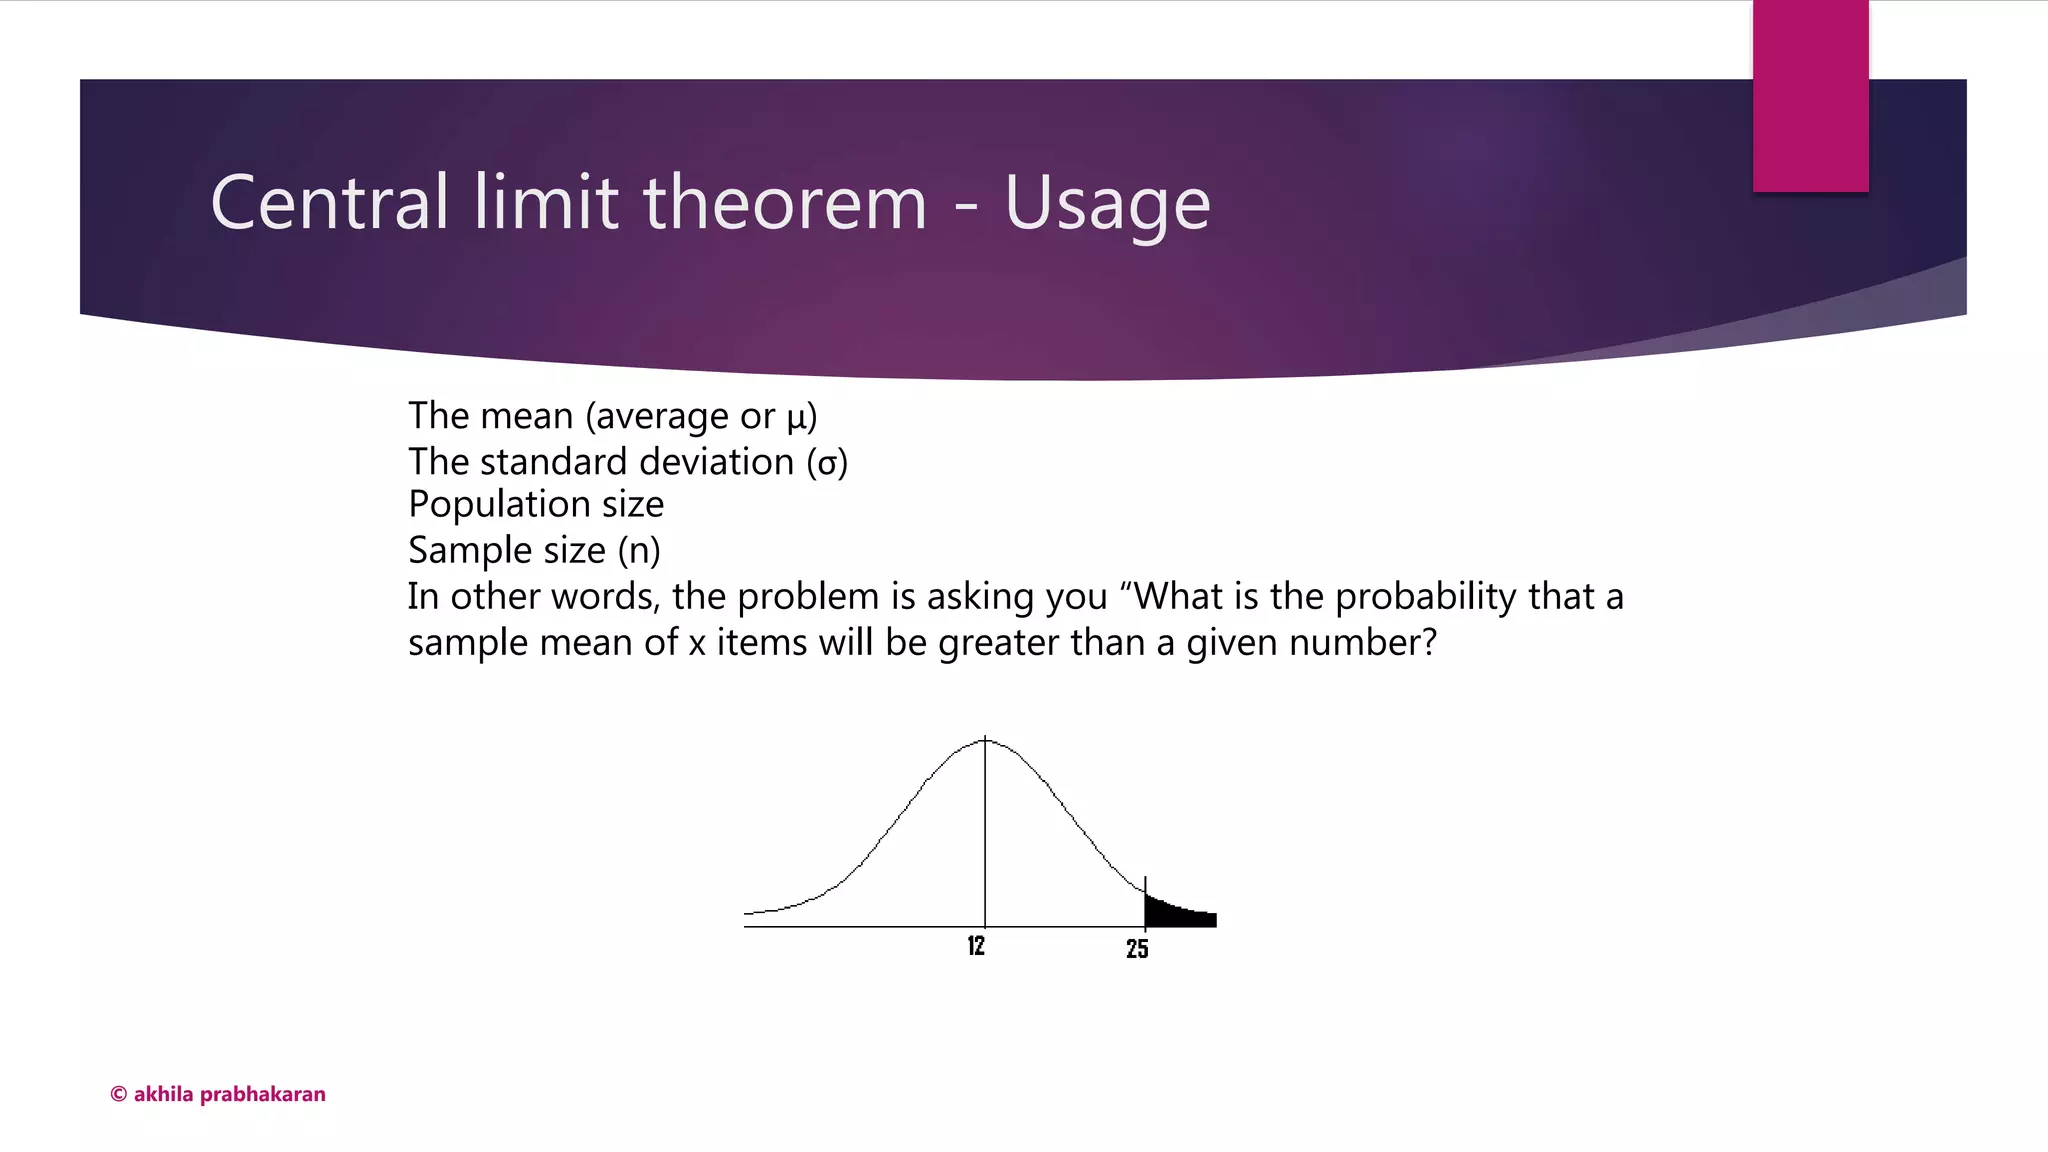
In other words, the problem is asking you “What is the probability that a
sample mean of 4 items will be less than 25 and more than 8?
X ~ sample mean
Y = [(X – μ)/(σ/sqrt(n))] ~ N(0.1)
P ([(8 – μ)/(σ/sqrt(n))] < Y < [(25 – μ)/(σ/sqrt(n))])](https://crownmelresort.com/image.slidesharecdn.com/statisticalanalysis-part3-180526103358/75/Statistical-Analysis-with-R-III-61-2048.jpg)
![Central limit theorem - Usage
© akhila prabhakaran
The mean (average or μ) = 12
The standard deviation (σ) = 8
Sample size (n) = 4
X ~ sample mean
Y = [(X – μ)/(σ/sqrt(n))] ~ N(0.1)
P ([(8 – μ)/(σ/sqrt(n))] < Y < [(25 – μ)/(σ/sqrt(n))])
P(-4/4 < Y < 13/4 )
= pnorm(3.5) + 1 – pnorm(-1)](https://crownmelresort.com/image.slidesharecdn.com/statisticalanalysis-part3-180526103358/75/Statistical-Analysis-with-R-III-62-2048.jpg)

![Chi-square distribution
© akhila prabhakaran
X ~ Chi-square with n degrees of freedom
Prob. Density function
c is a constant
E[X] = n
Var[X] = 2n](https://crownmelresort.com/image.slidesharecdn.com/statisticalanalysis-part3-180526103358/75/Statistical-Analysis-with-R-III-64-2048.jpg)


The document discusses various probability distributions including the normal, binomial, Poisson, uniform, and chi-square distributions. It provides examples of when each distribution would be used and explains key properties such as mean, variance, and standard deviation. It also covers topics like the central limit theorem, sampling distributions, and how inferential statistics is used to generalize from samples to populations.
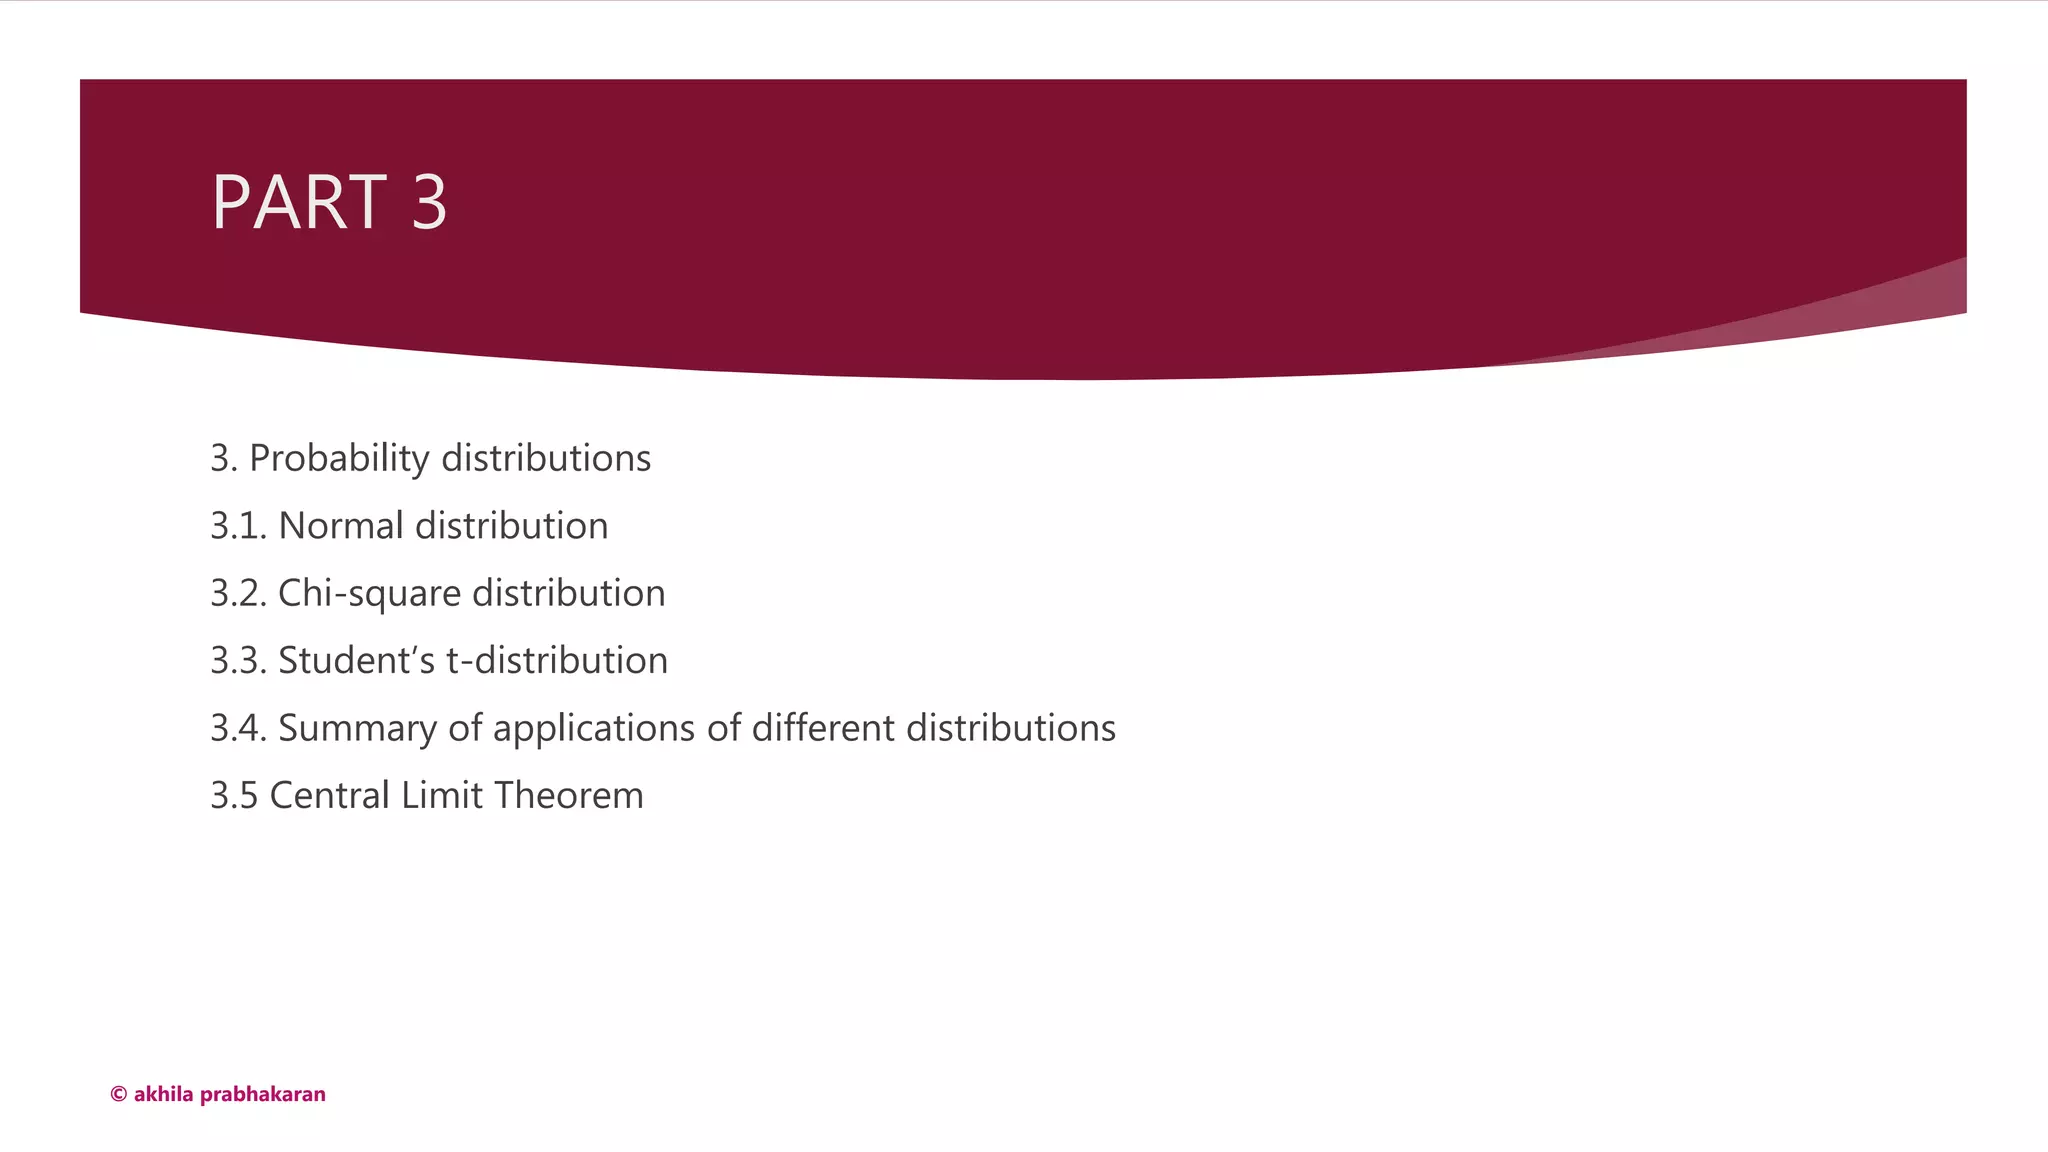
Overview of probability distributions and introduction to key types including Normal, Chi-square, and Student’s t-distributions.
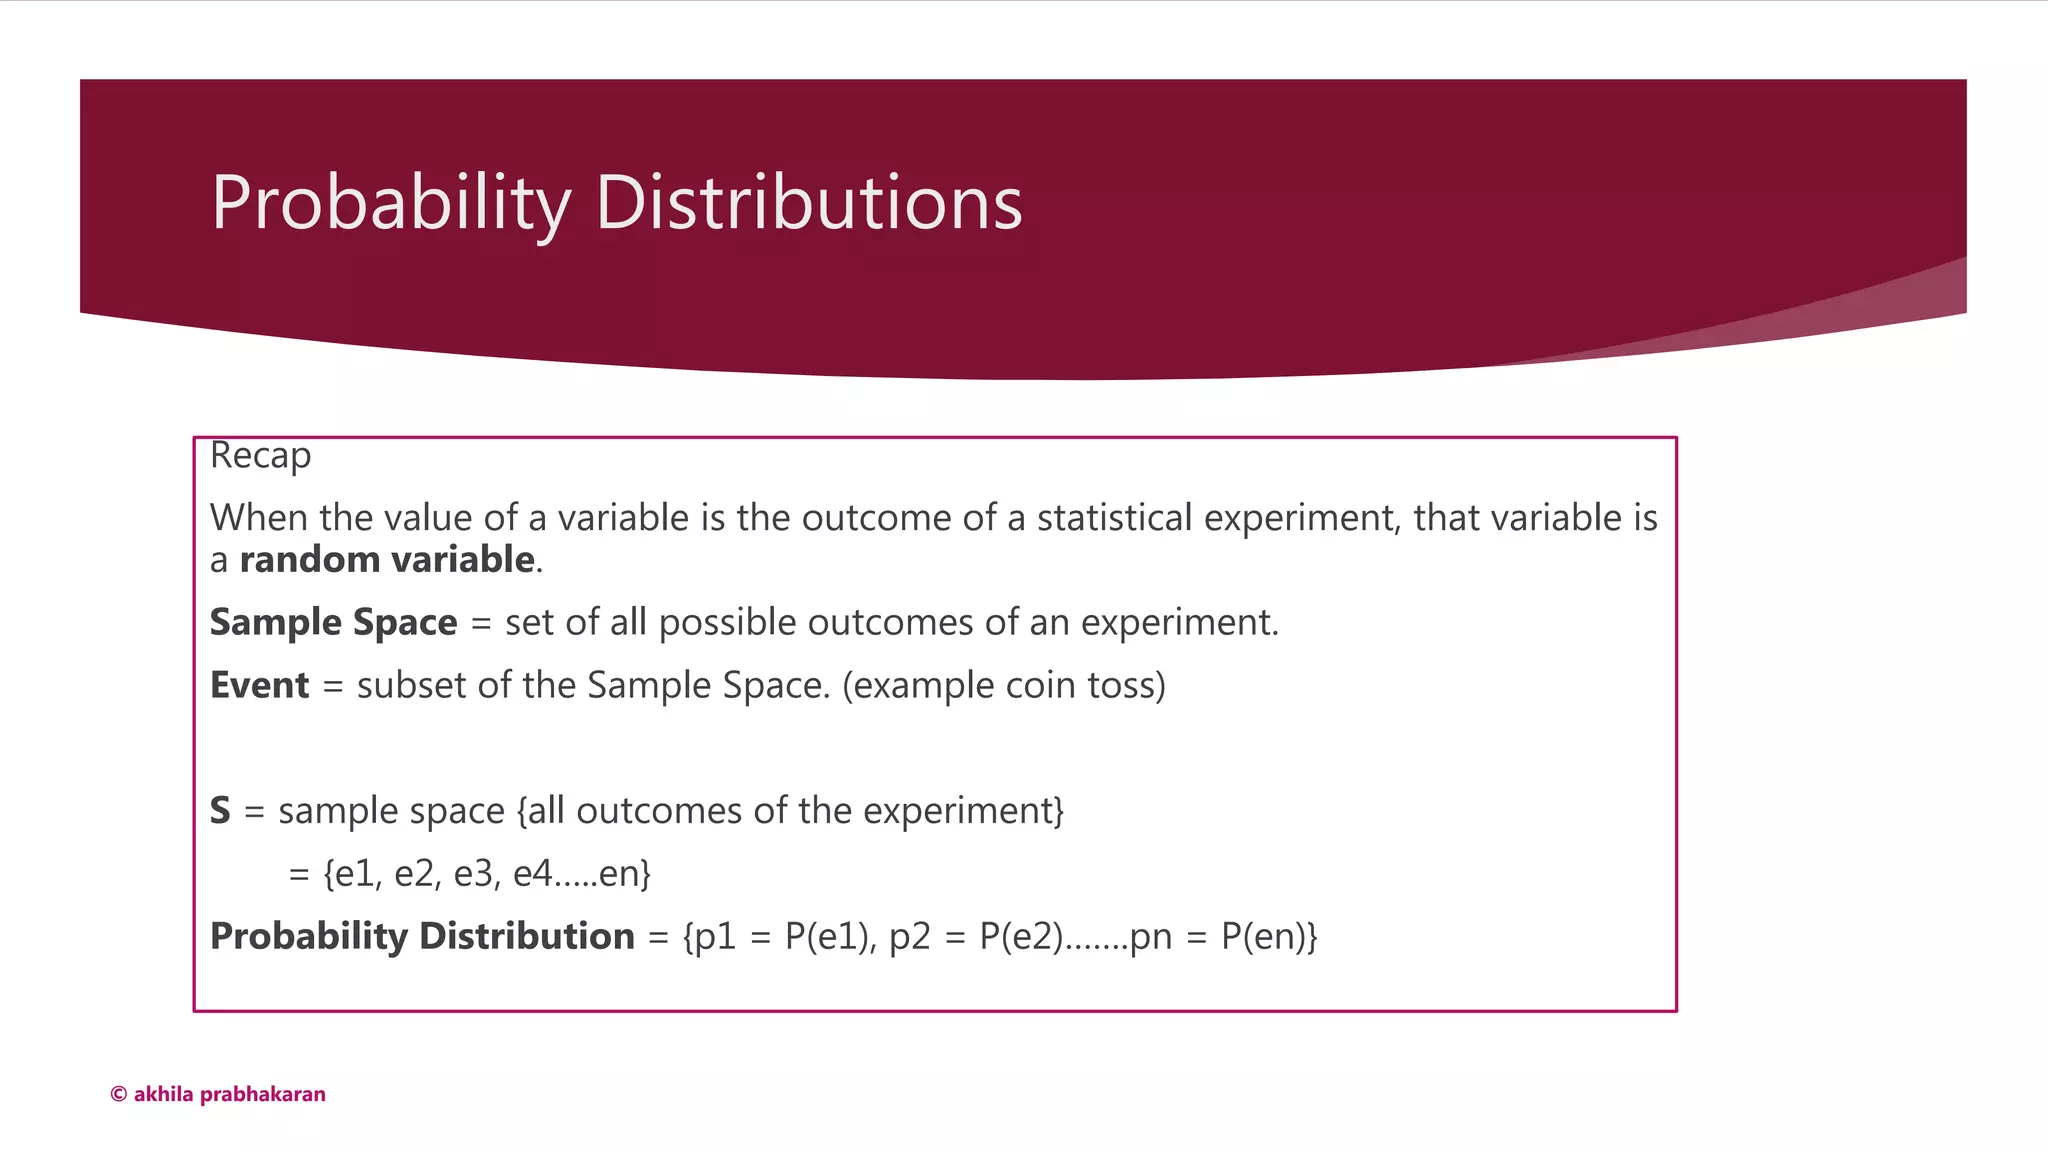
Definition of random variables, sample space, events, and probability distributions.
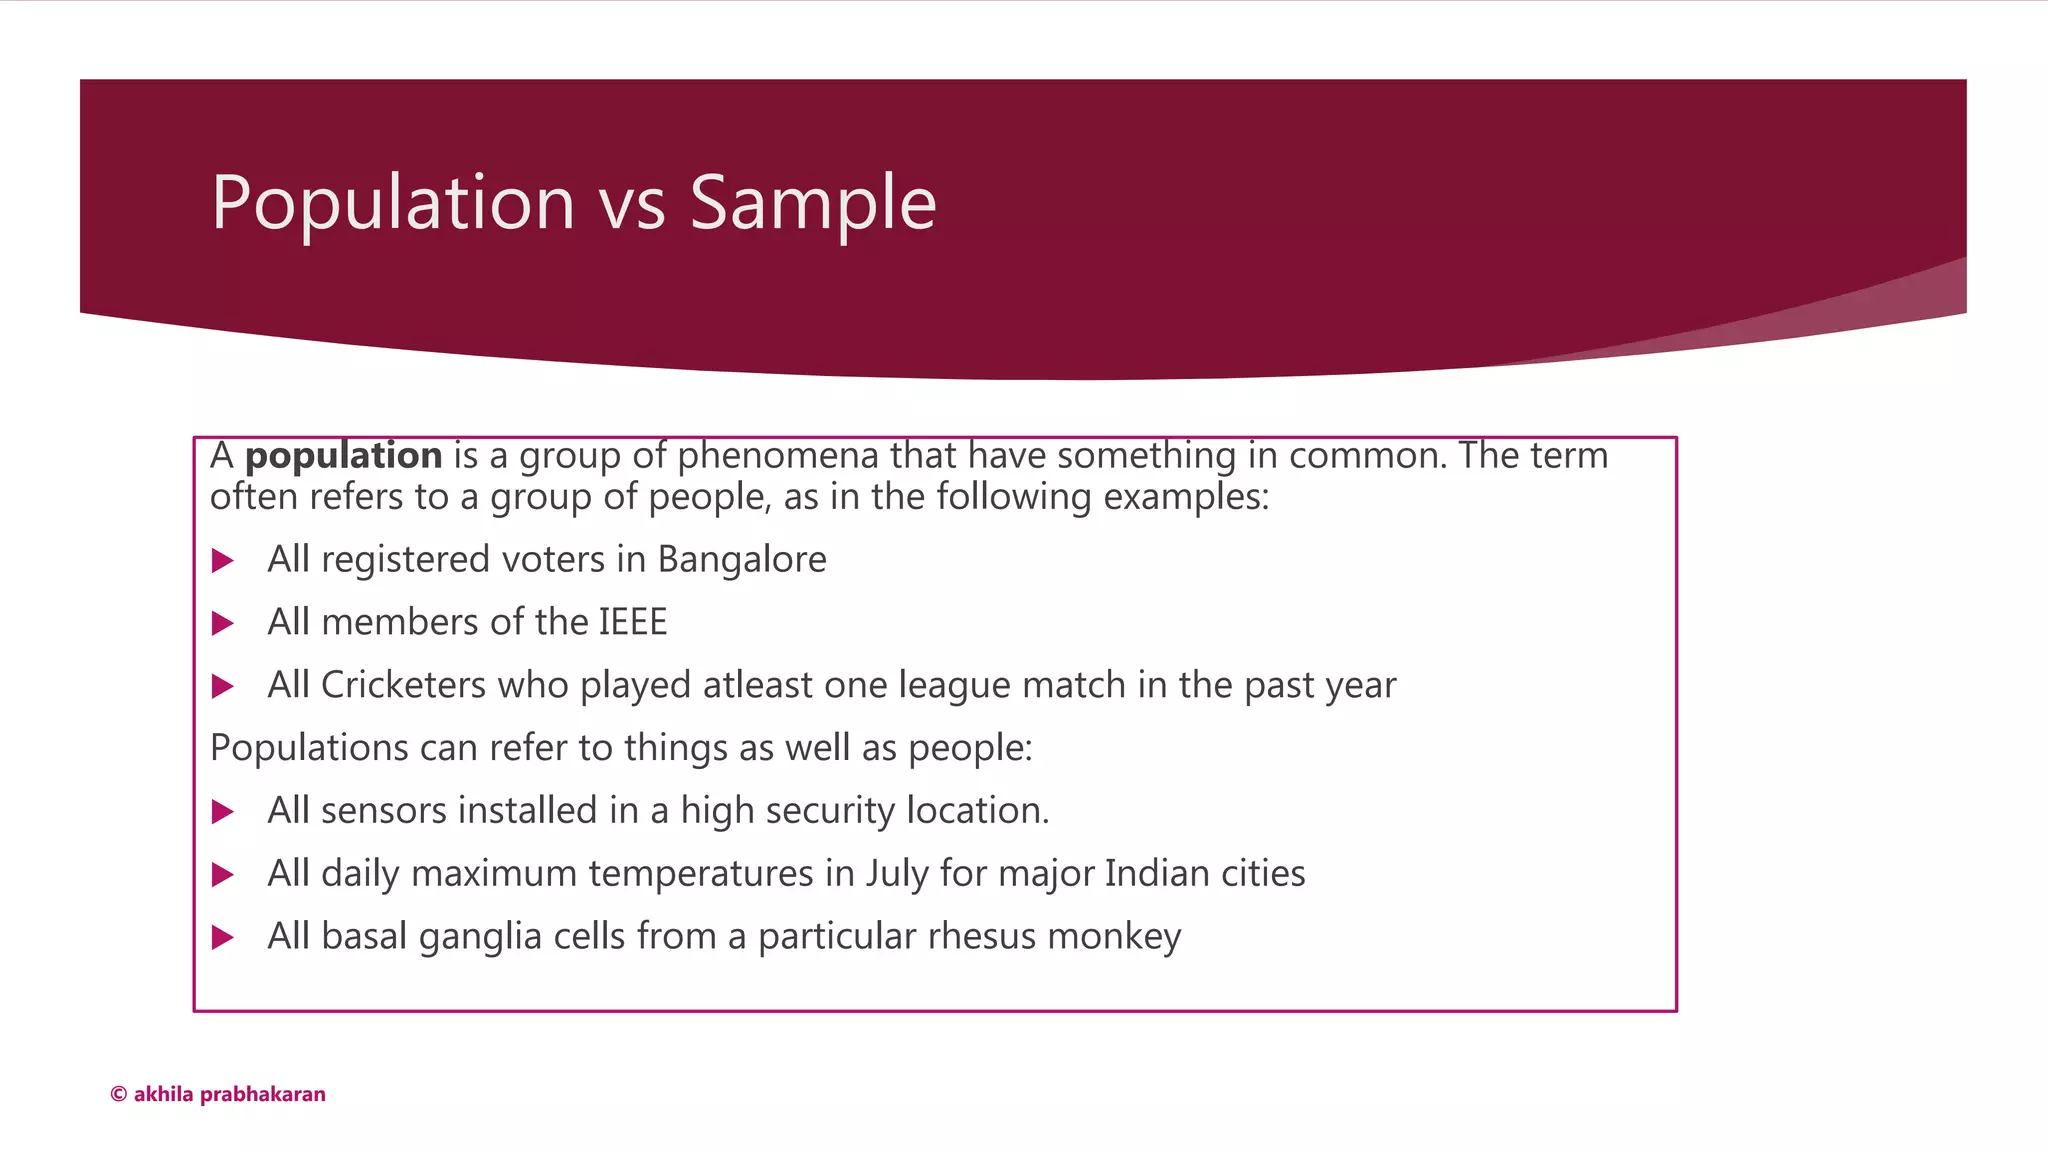
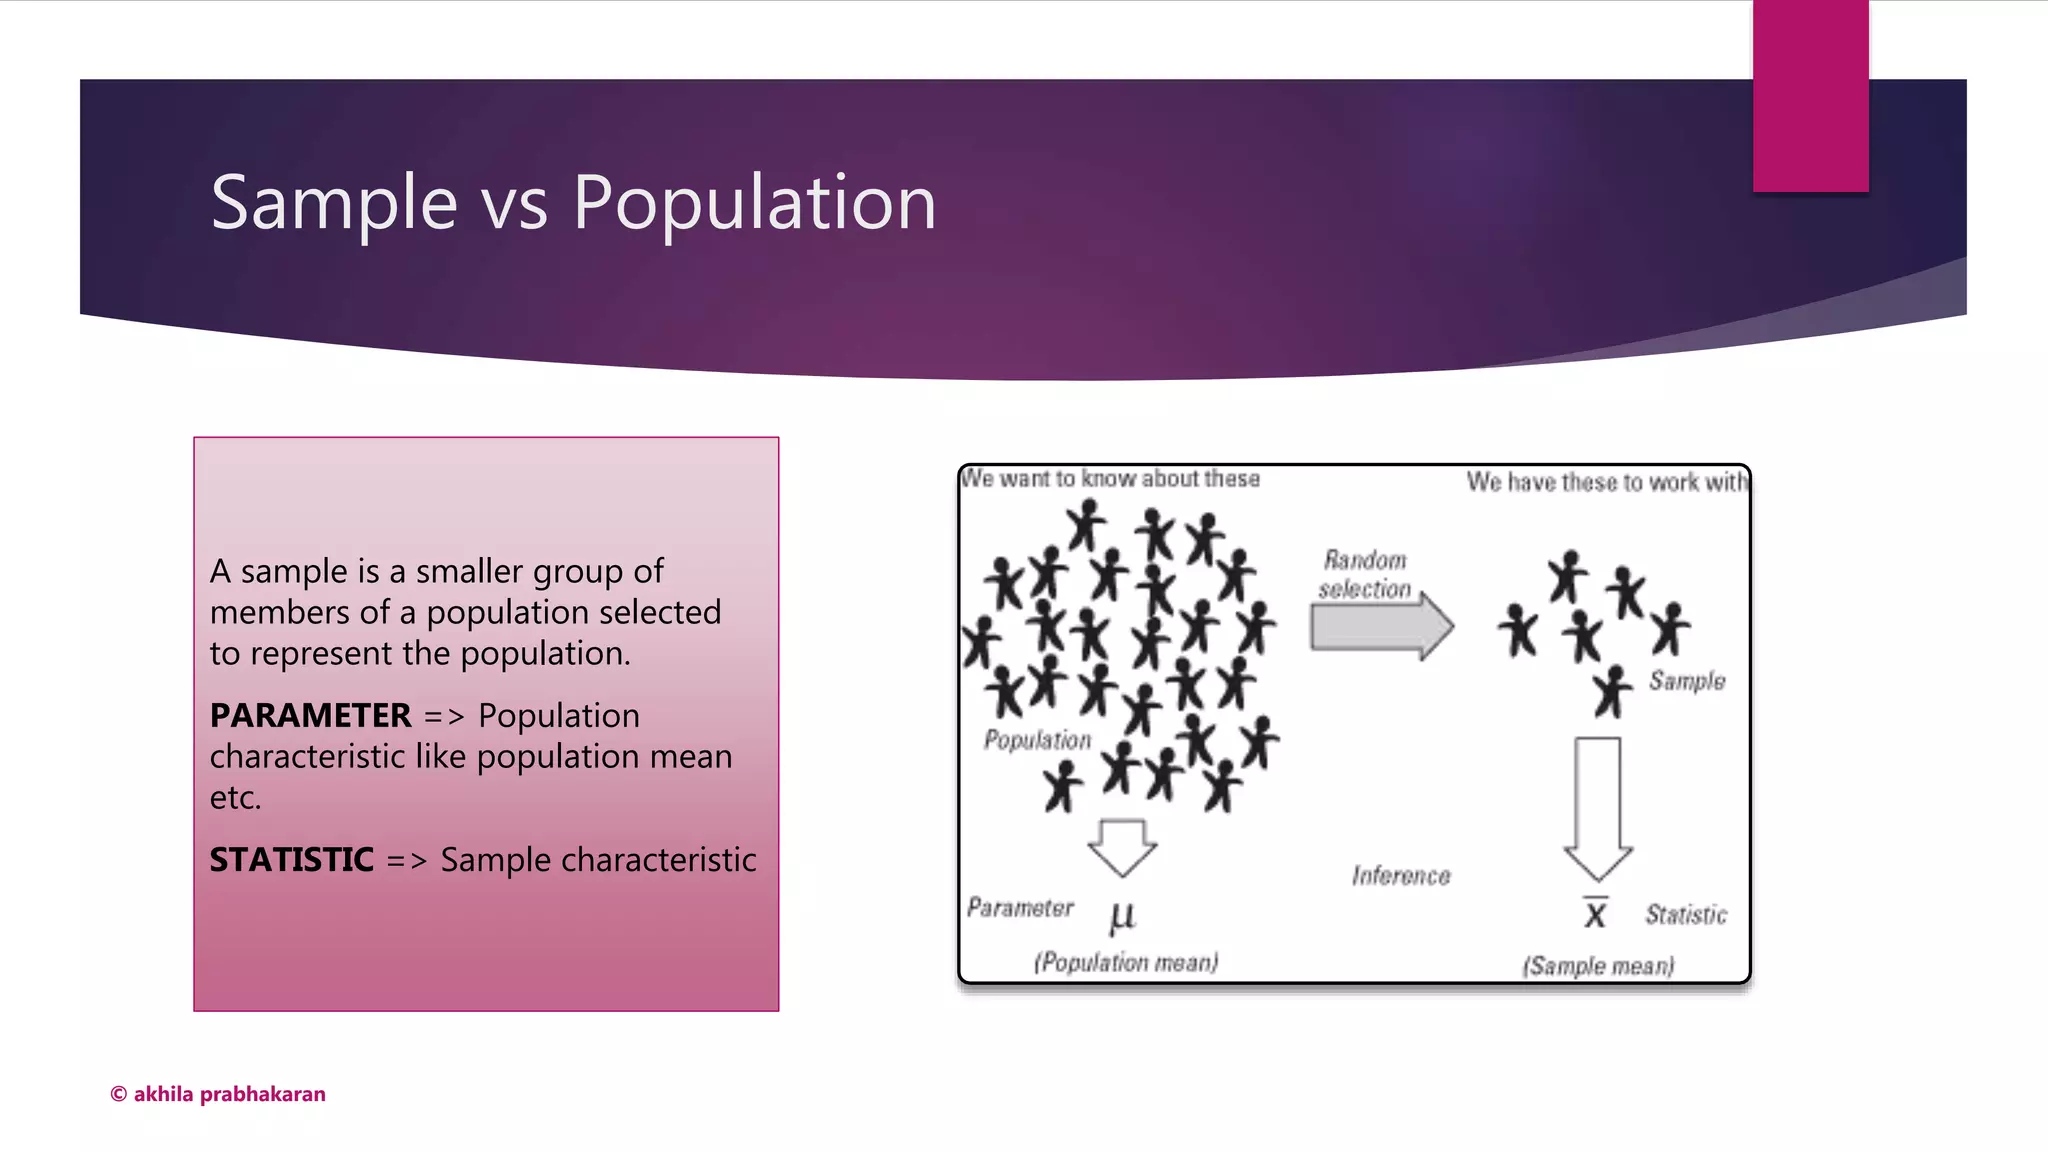
Differences between population and sample, defining parameters and statistics.
Example: Probability distribution of coin flips illustrating discrete outcomes and their probabilities.
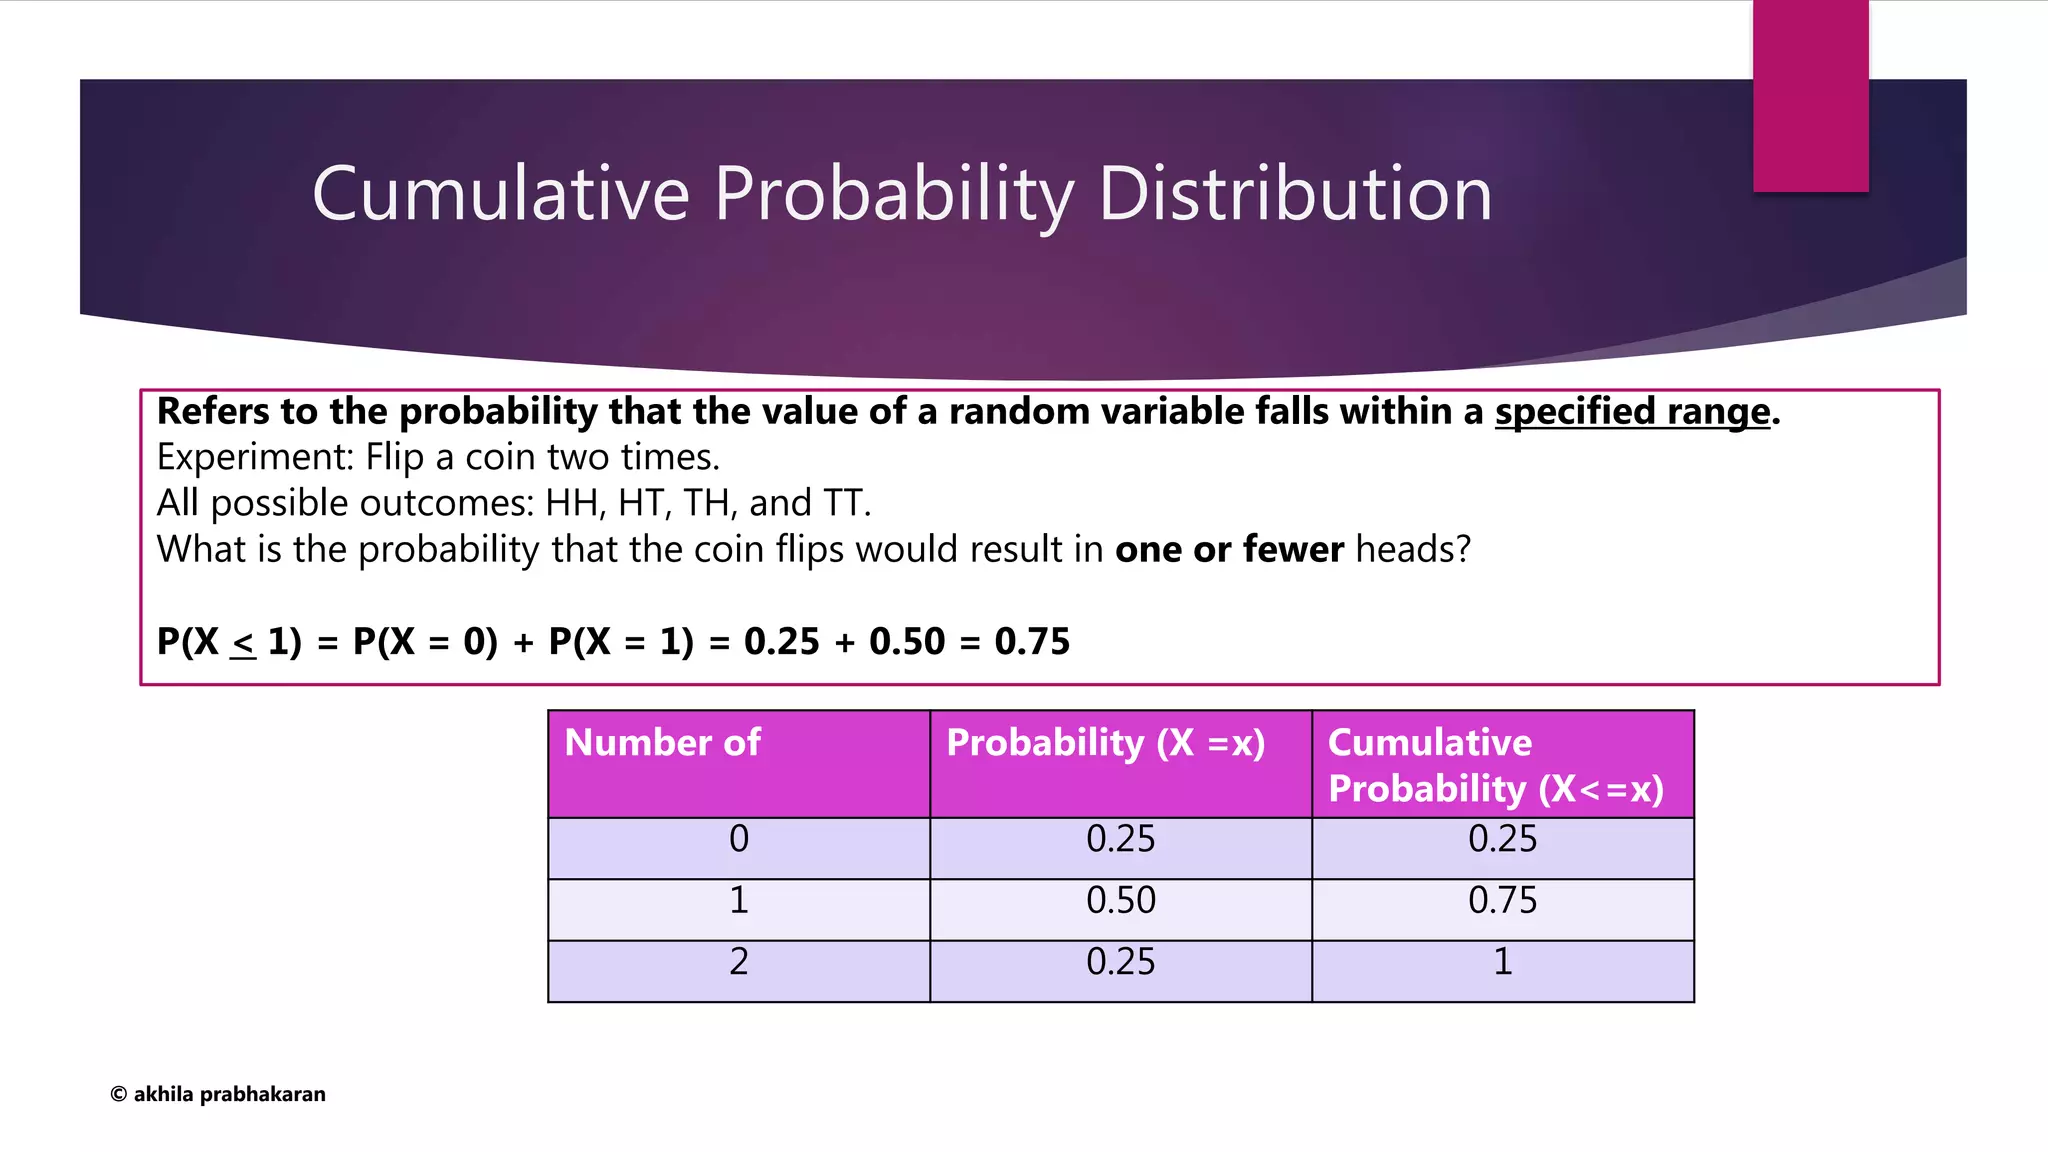
Definition and example of cumulative probability distribution with coin toss outcomes.
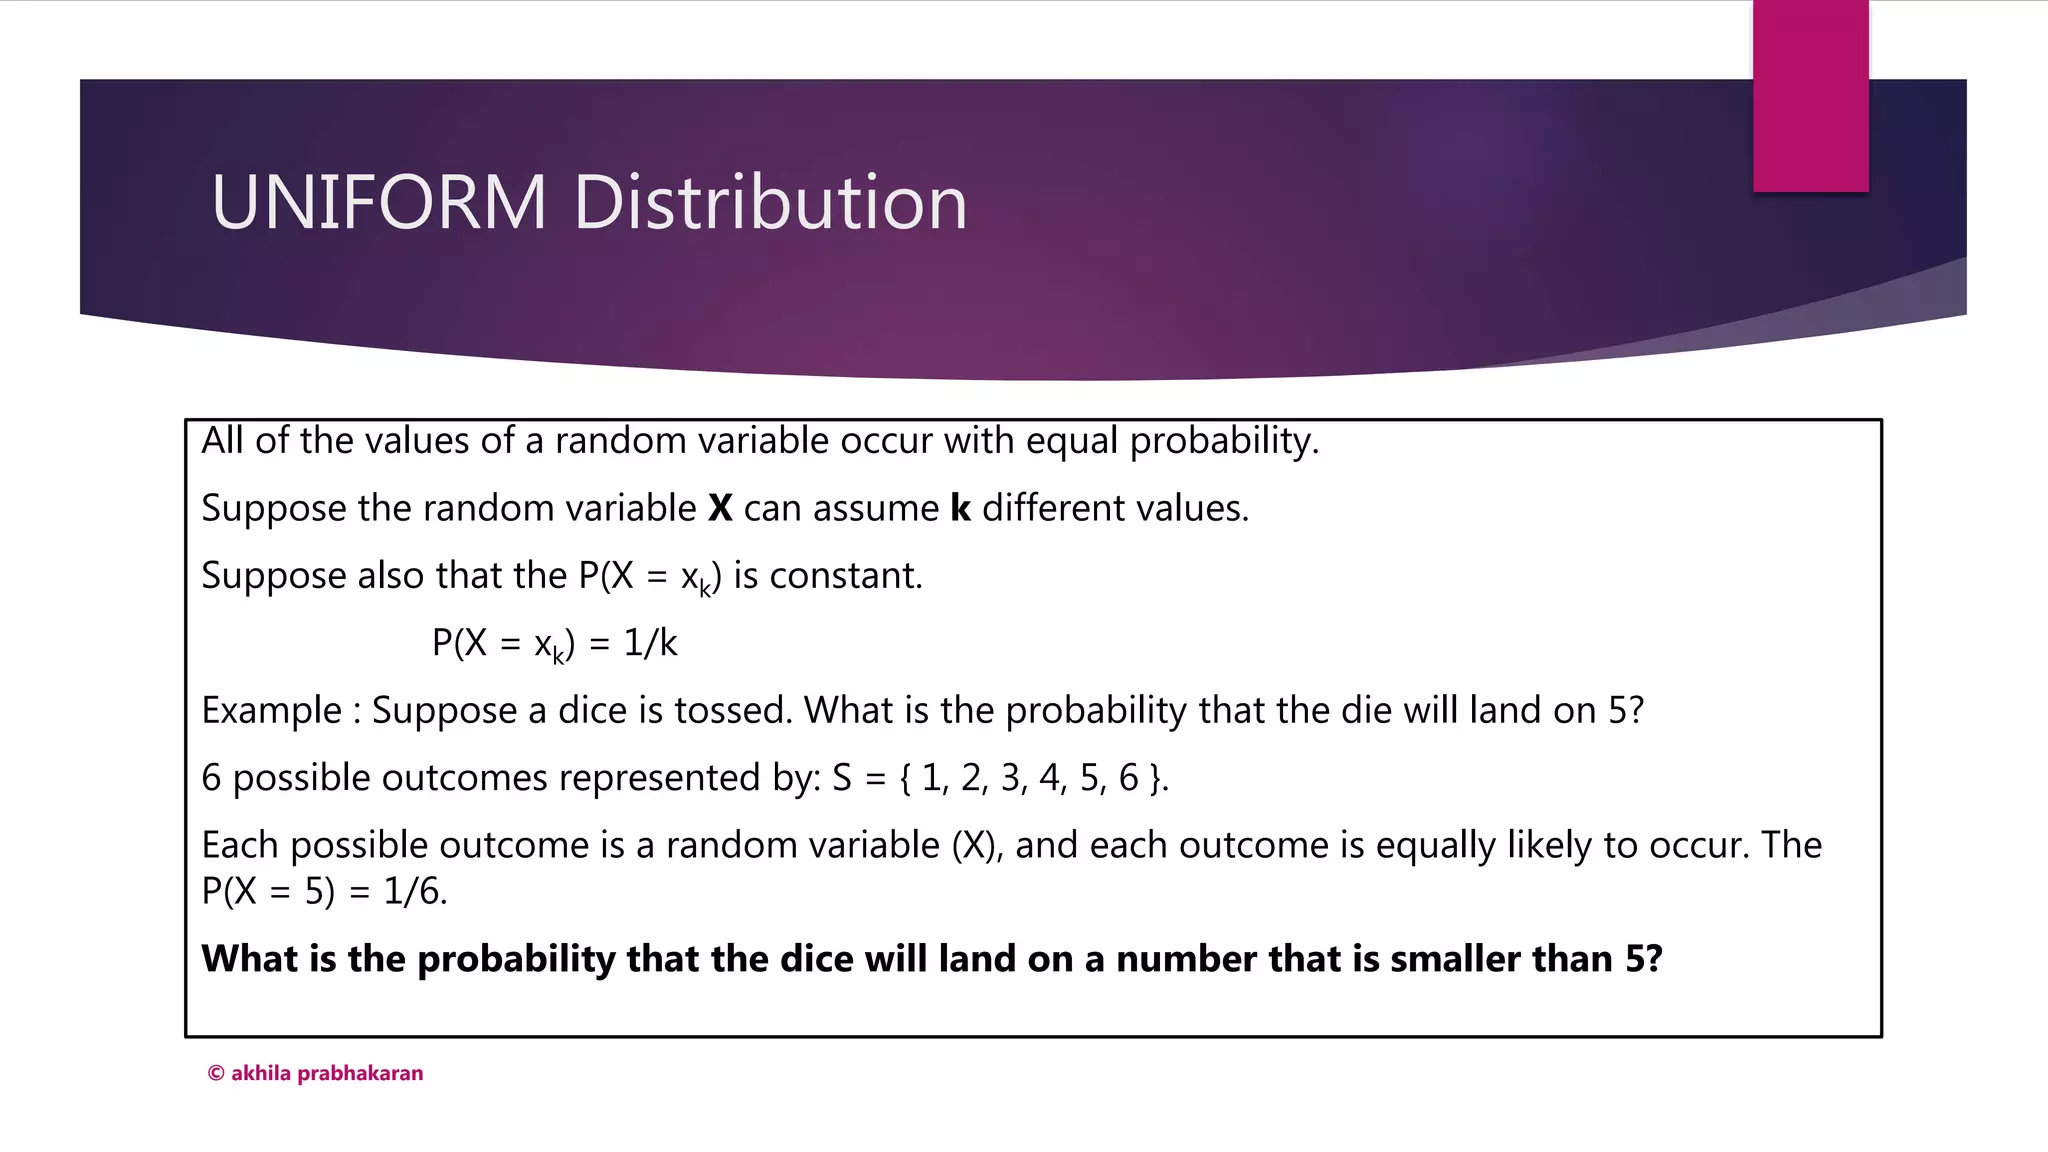
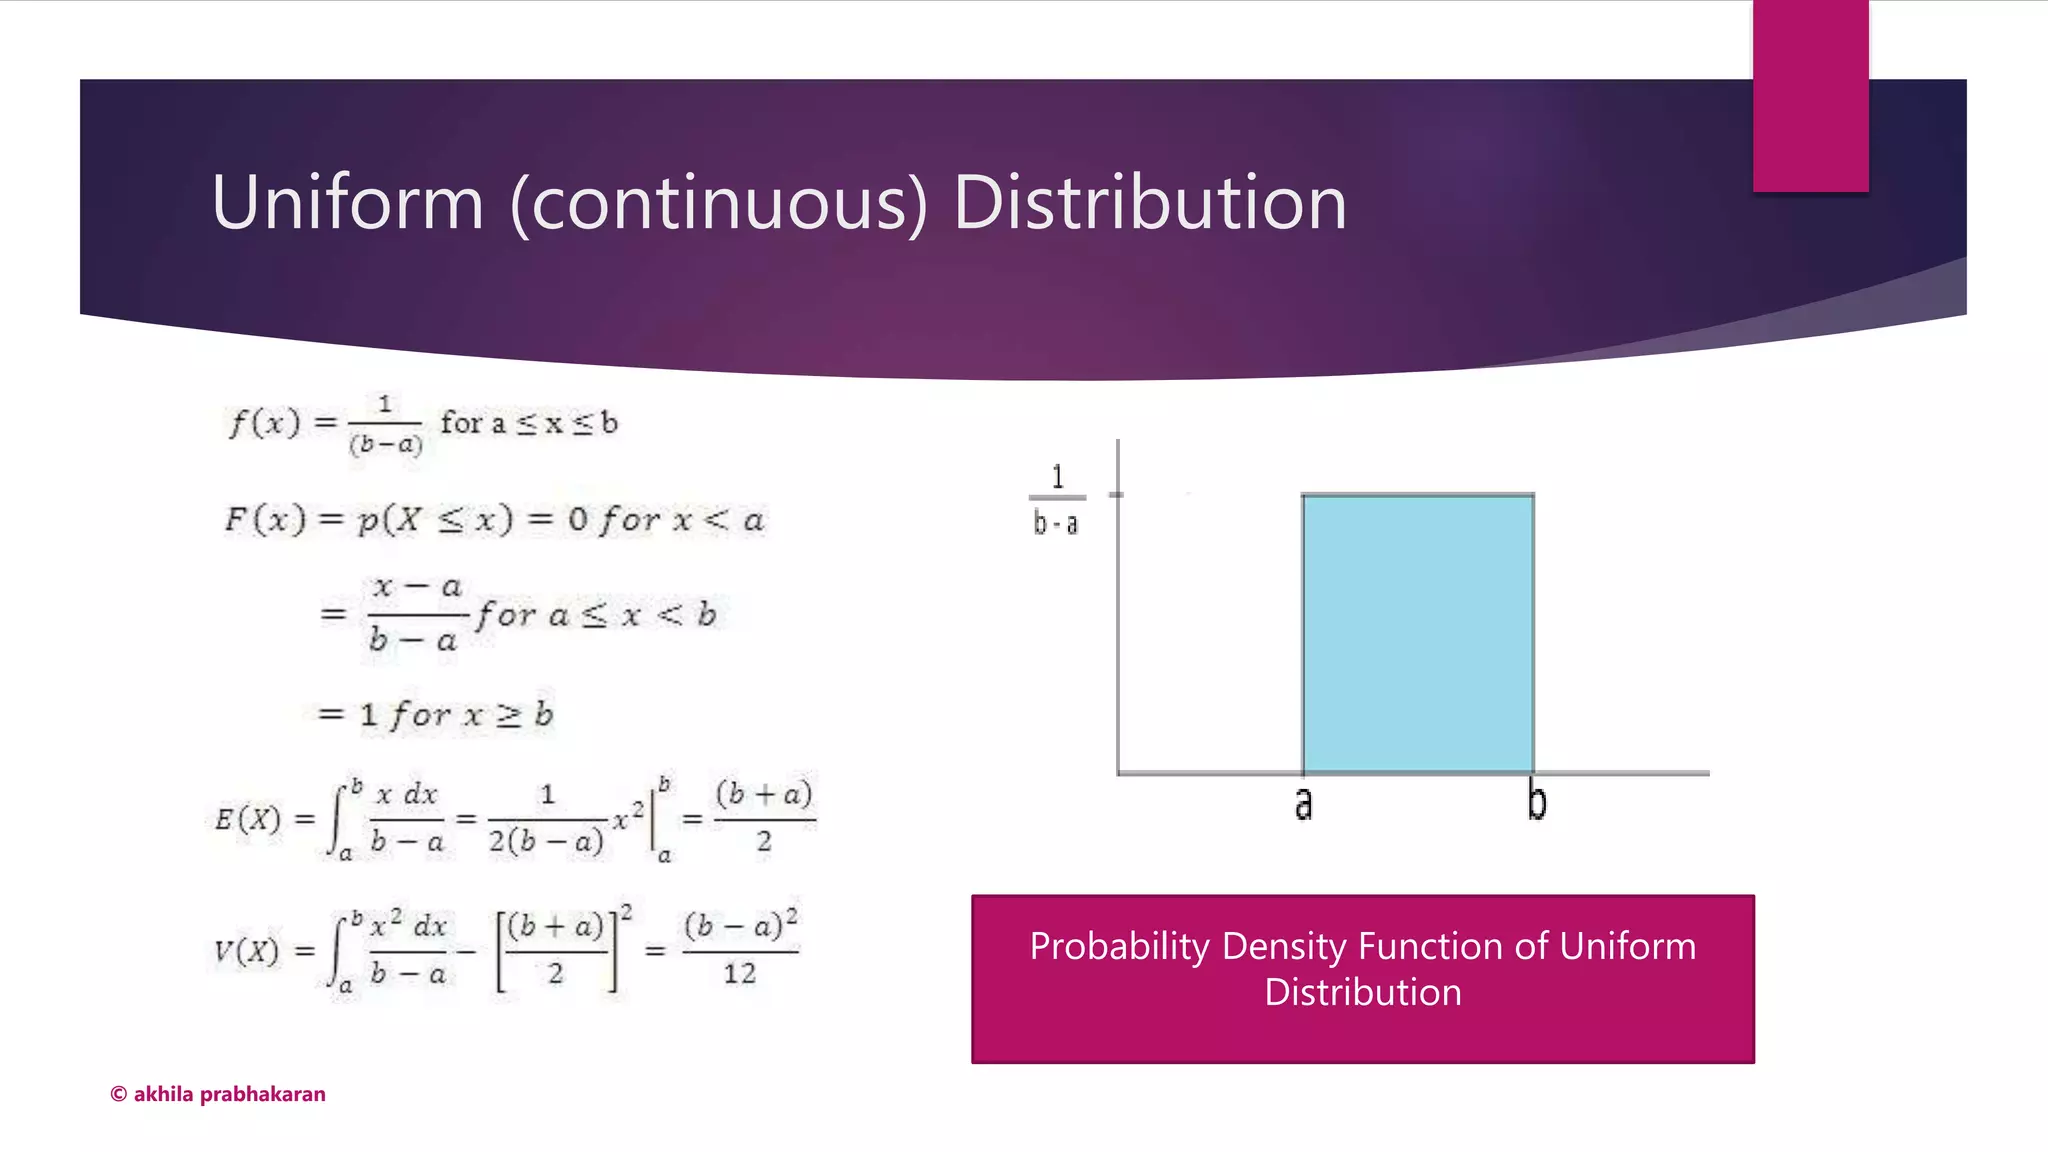
Uniform probability distributions where outcomes have equal chances; example with dice.
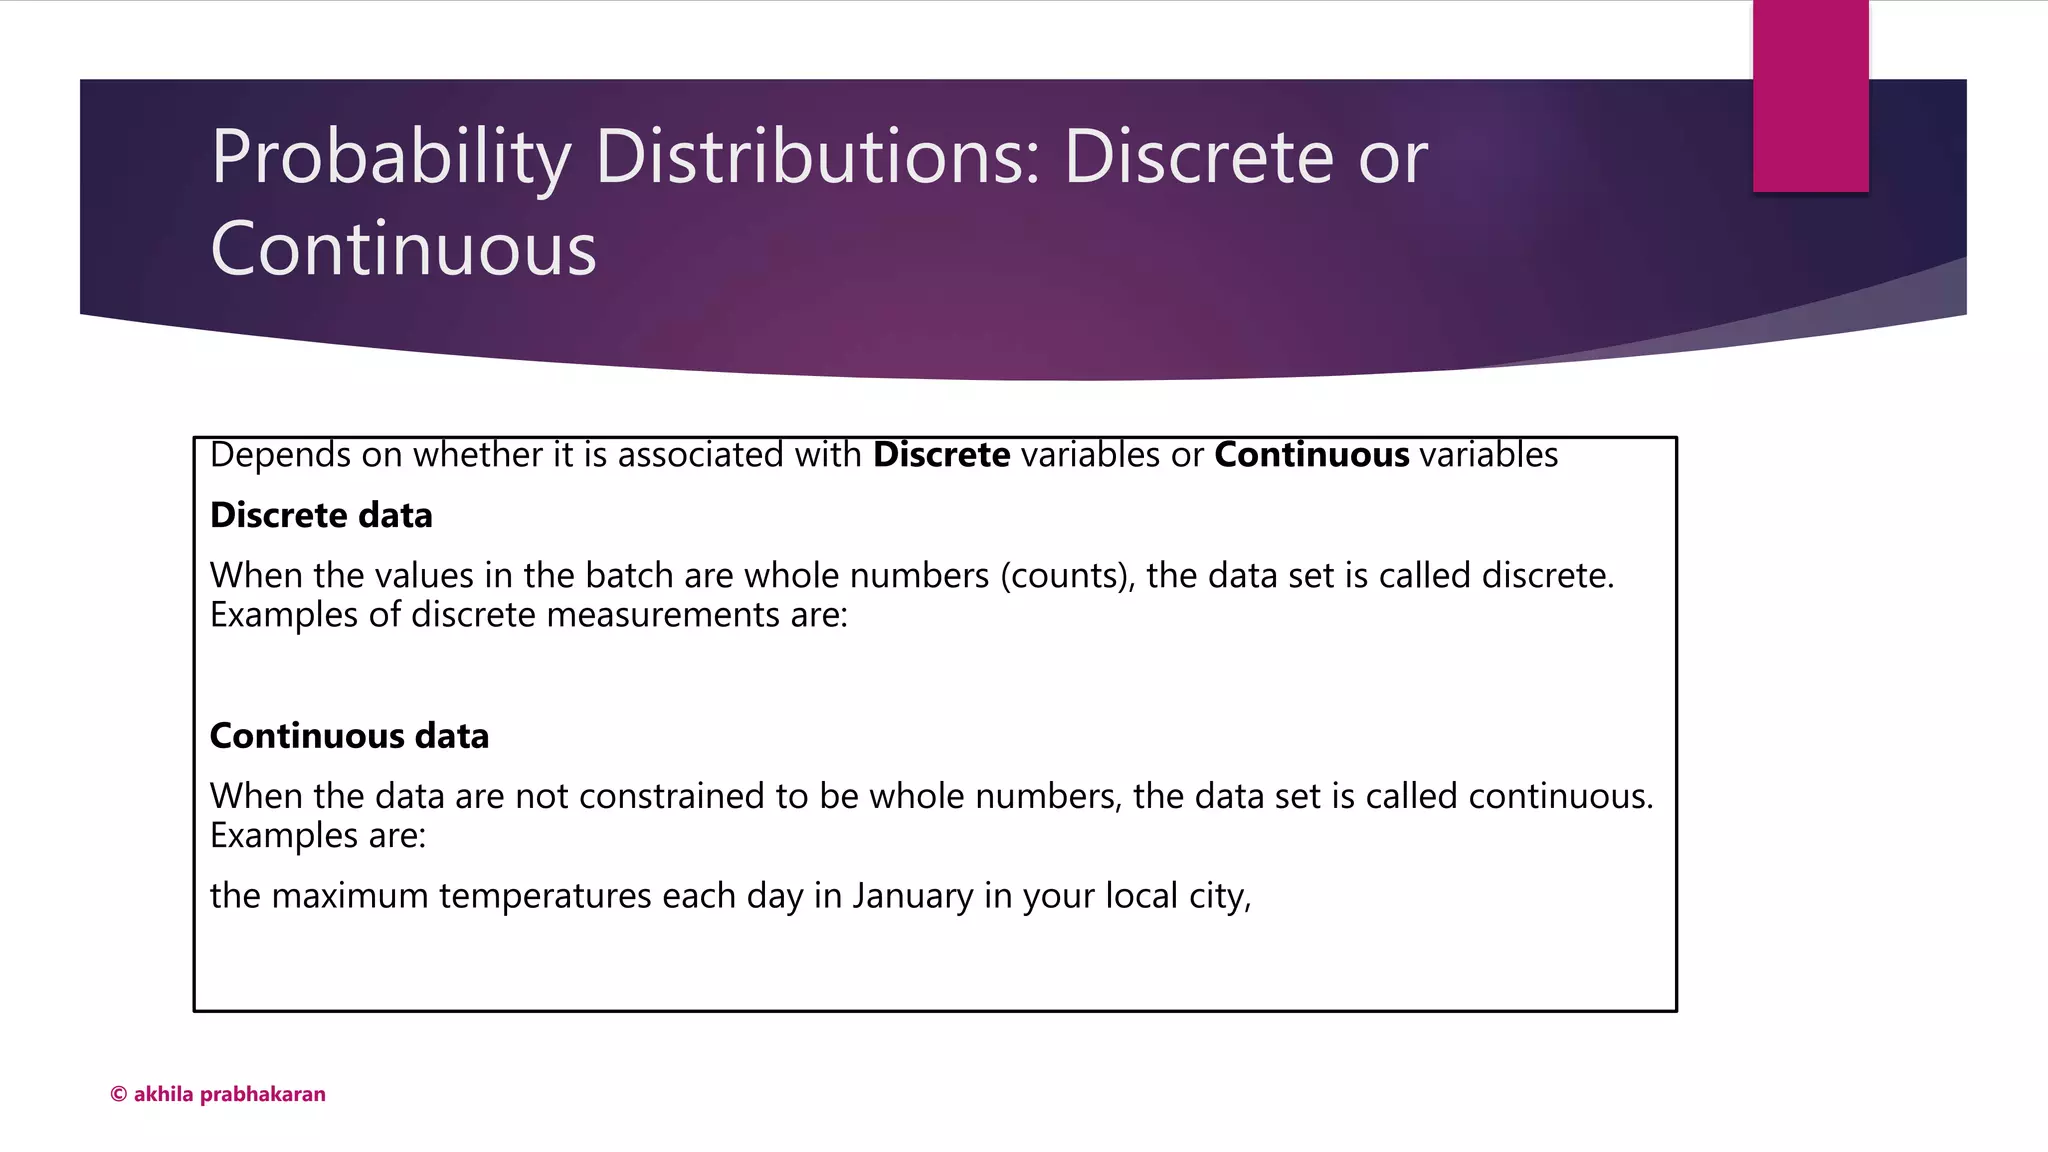
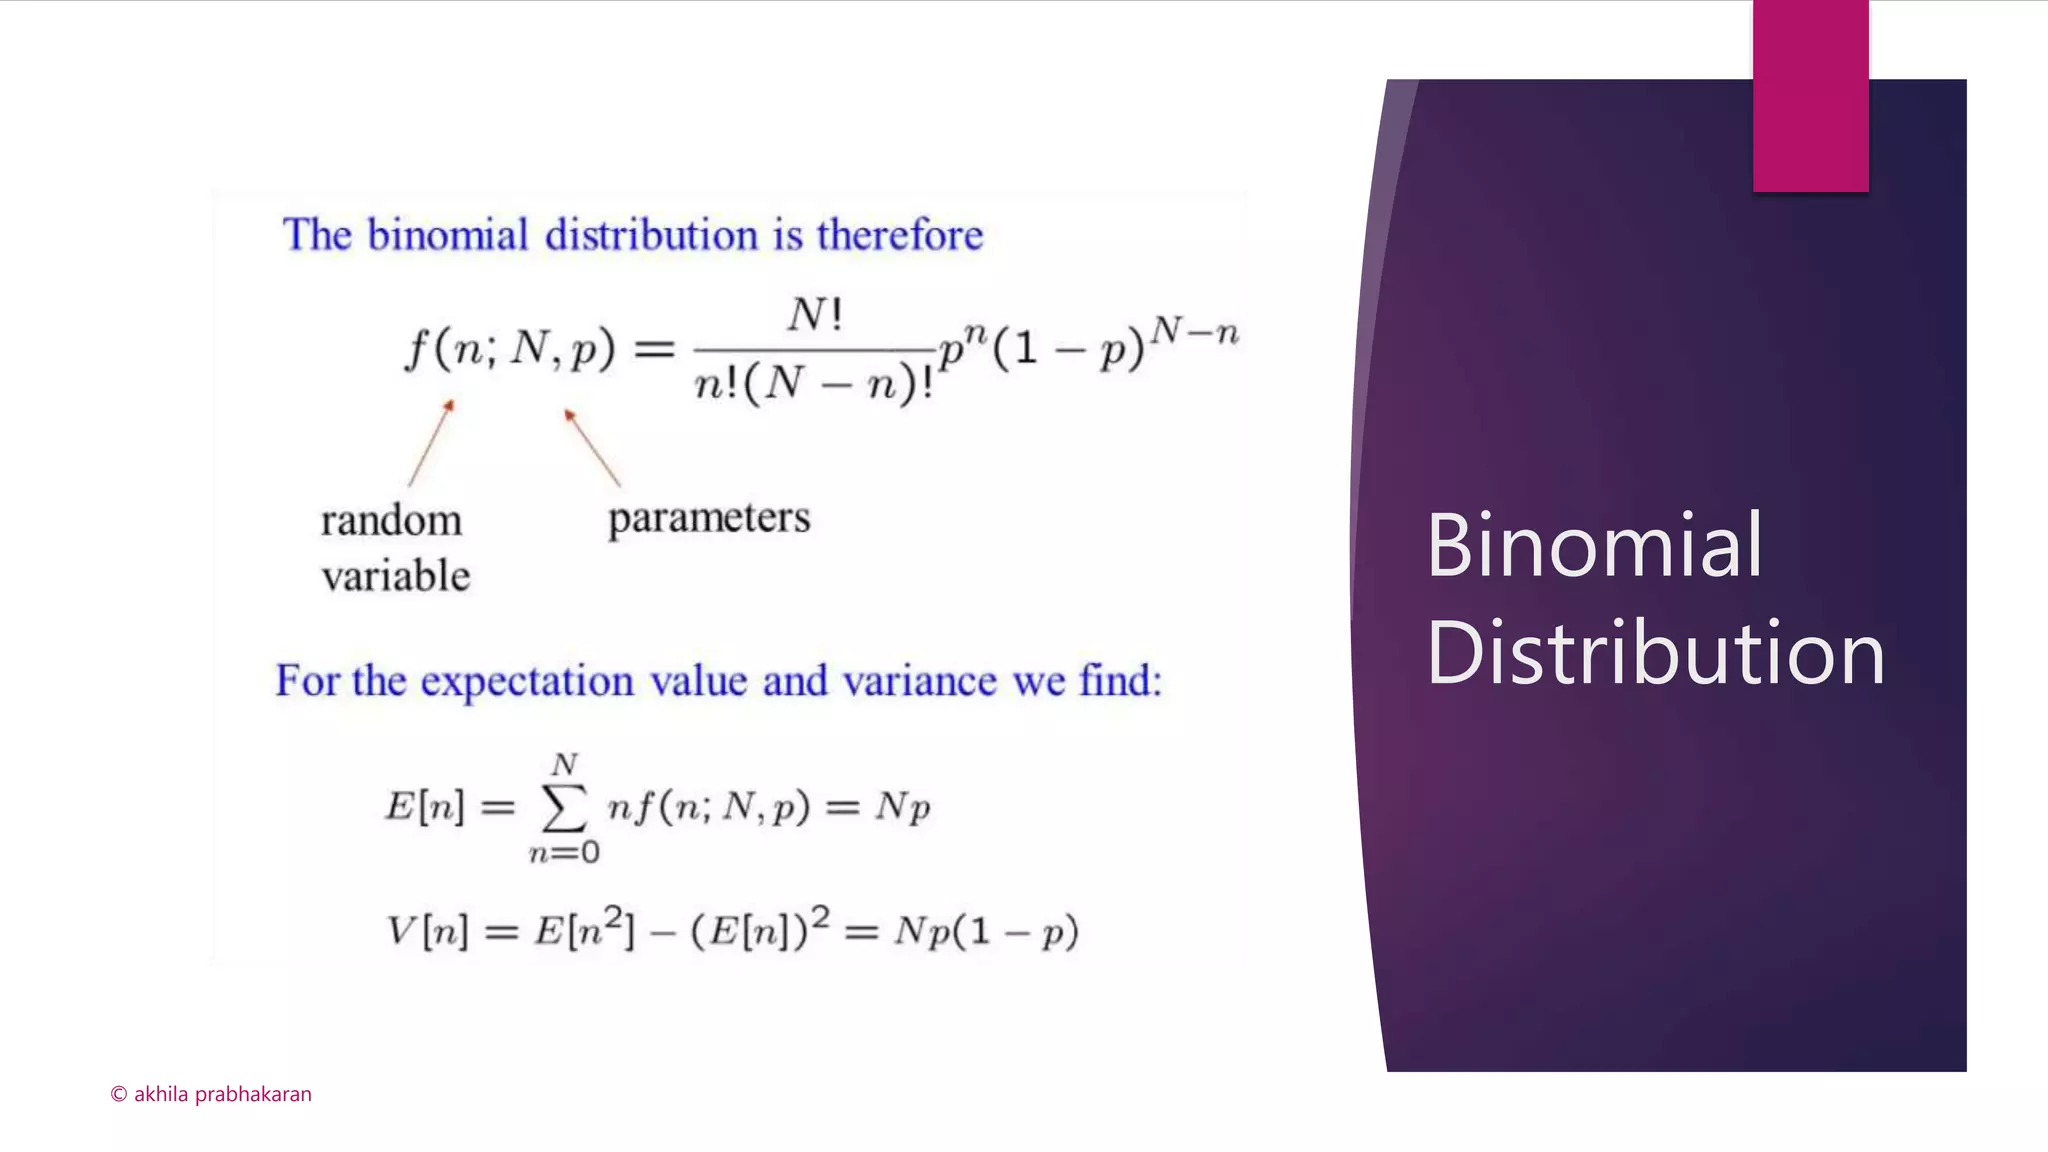
Classification of data into discrete and continuous; example of binomial distribution with coin flips.
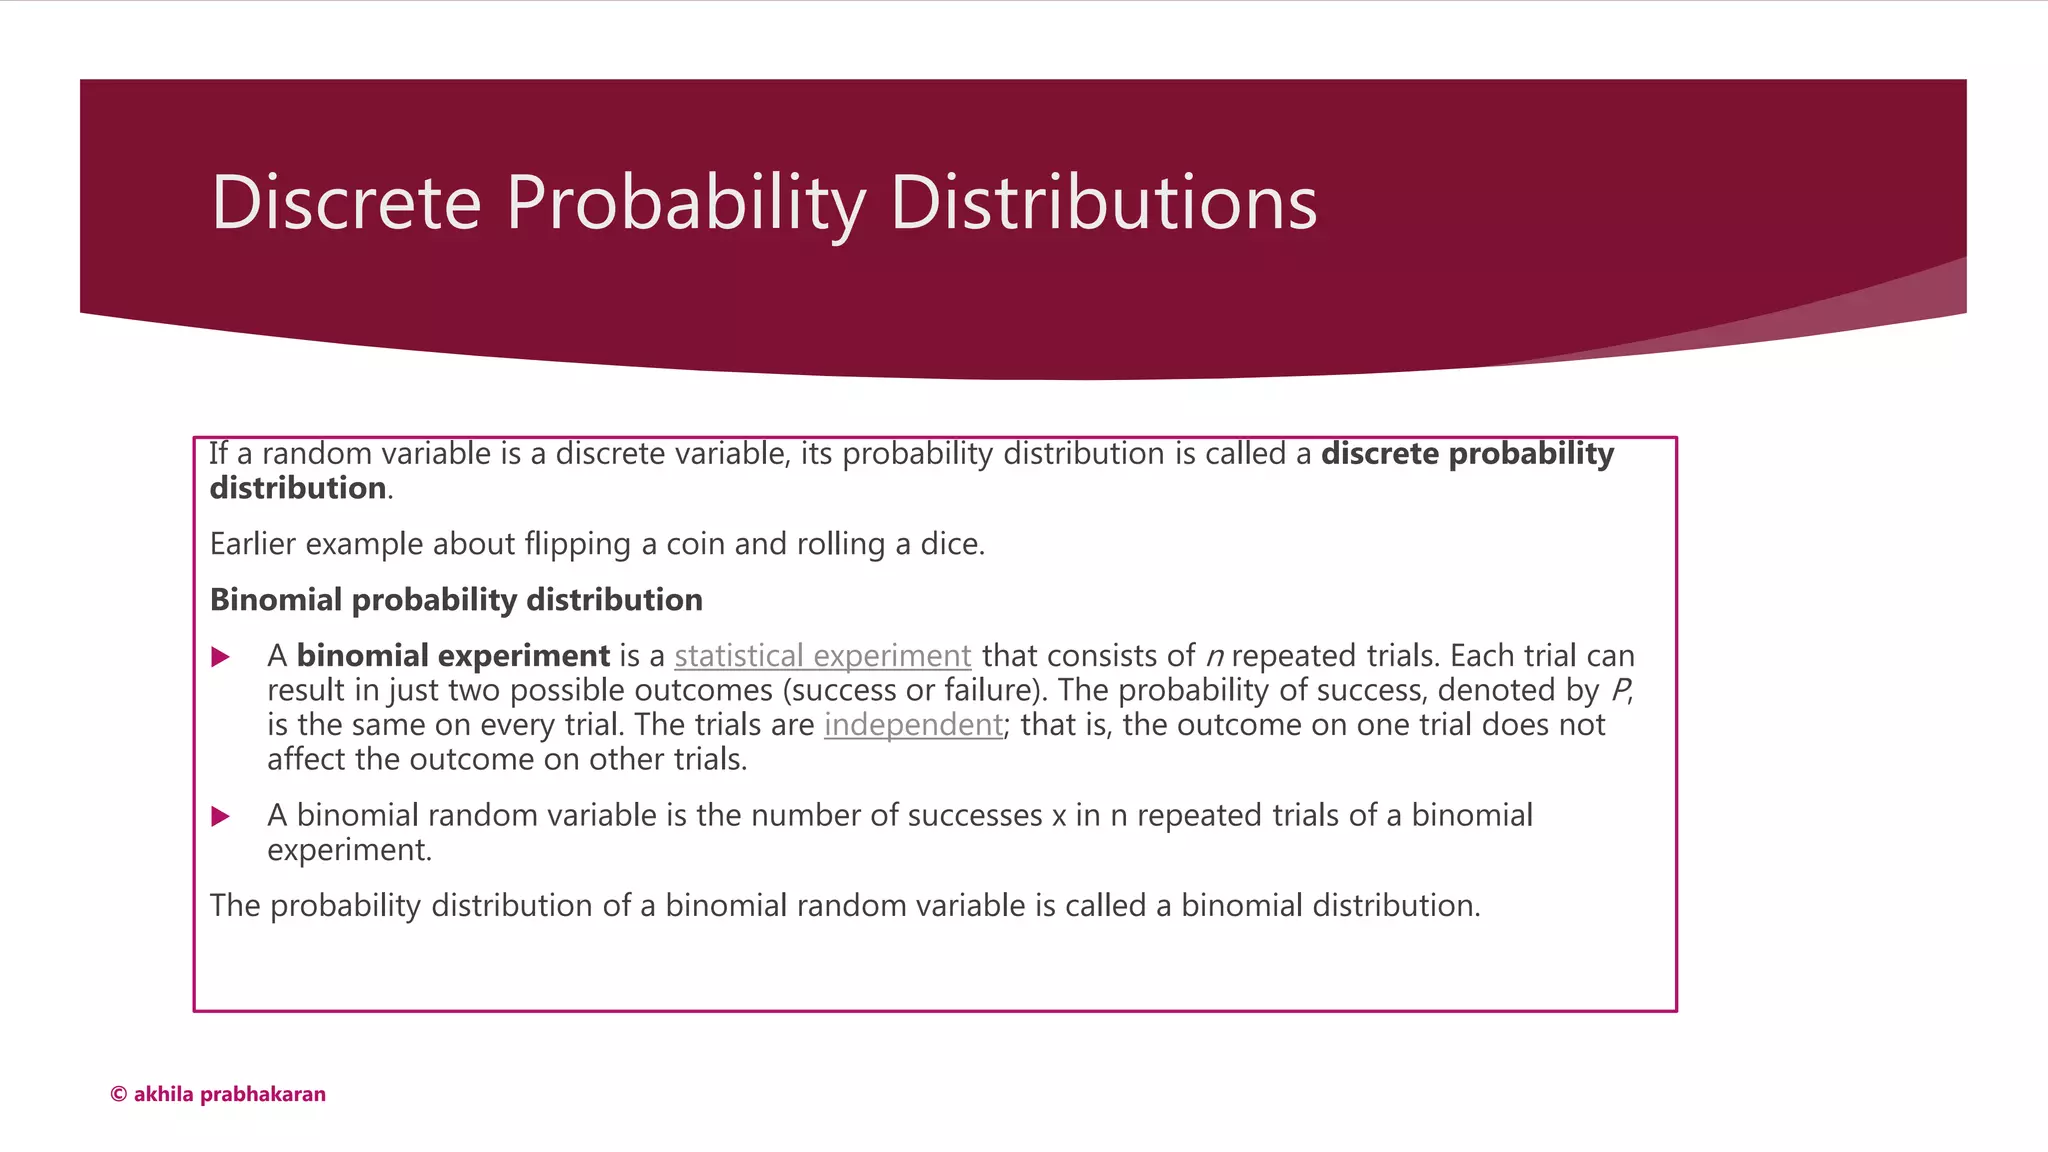
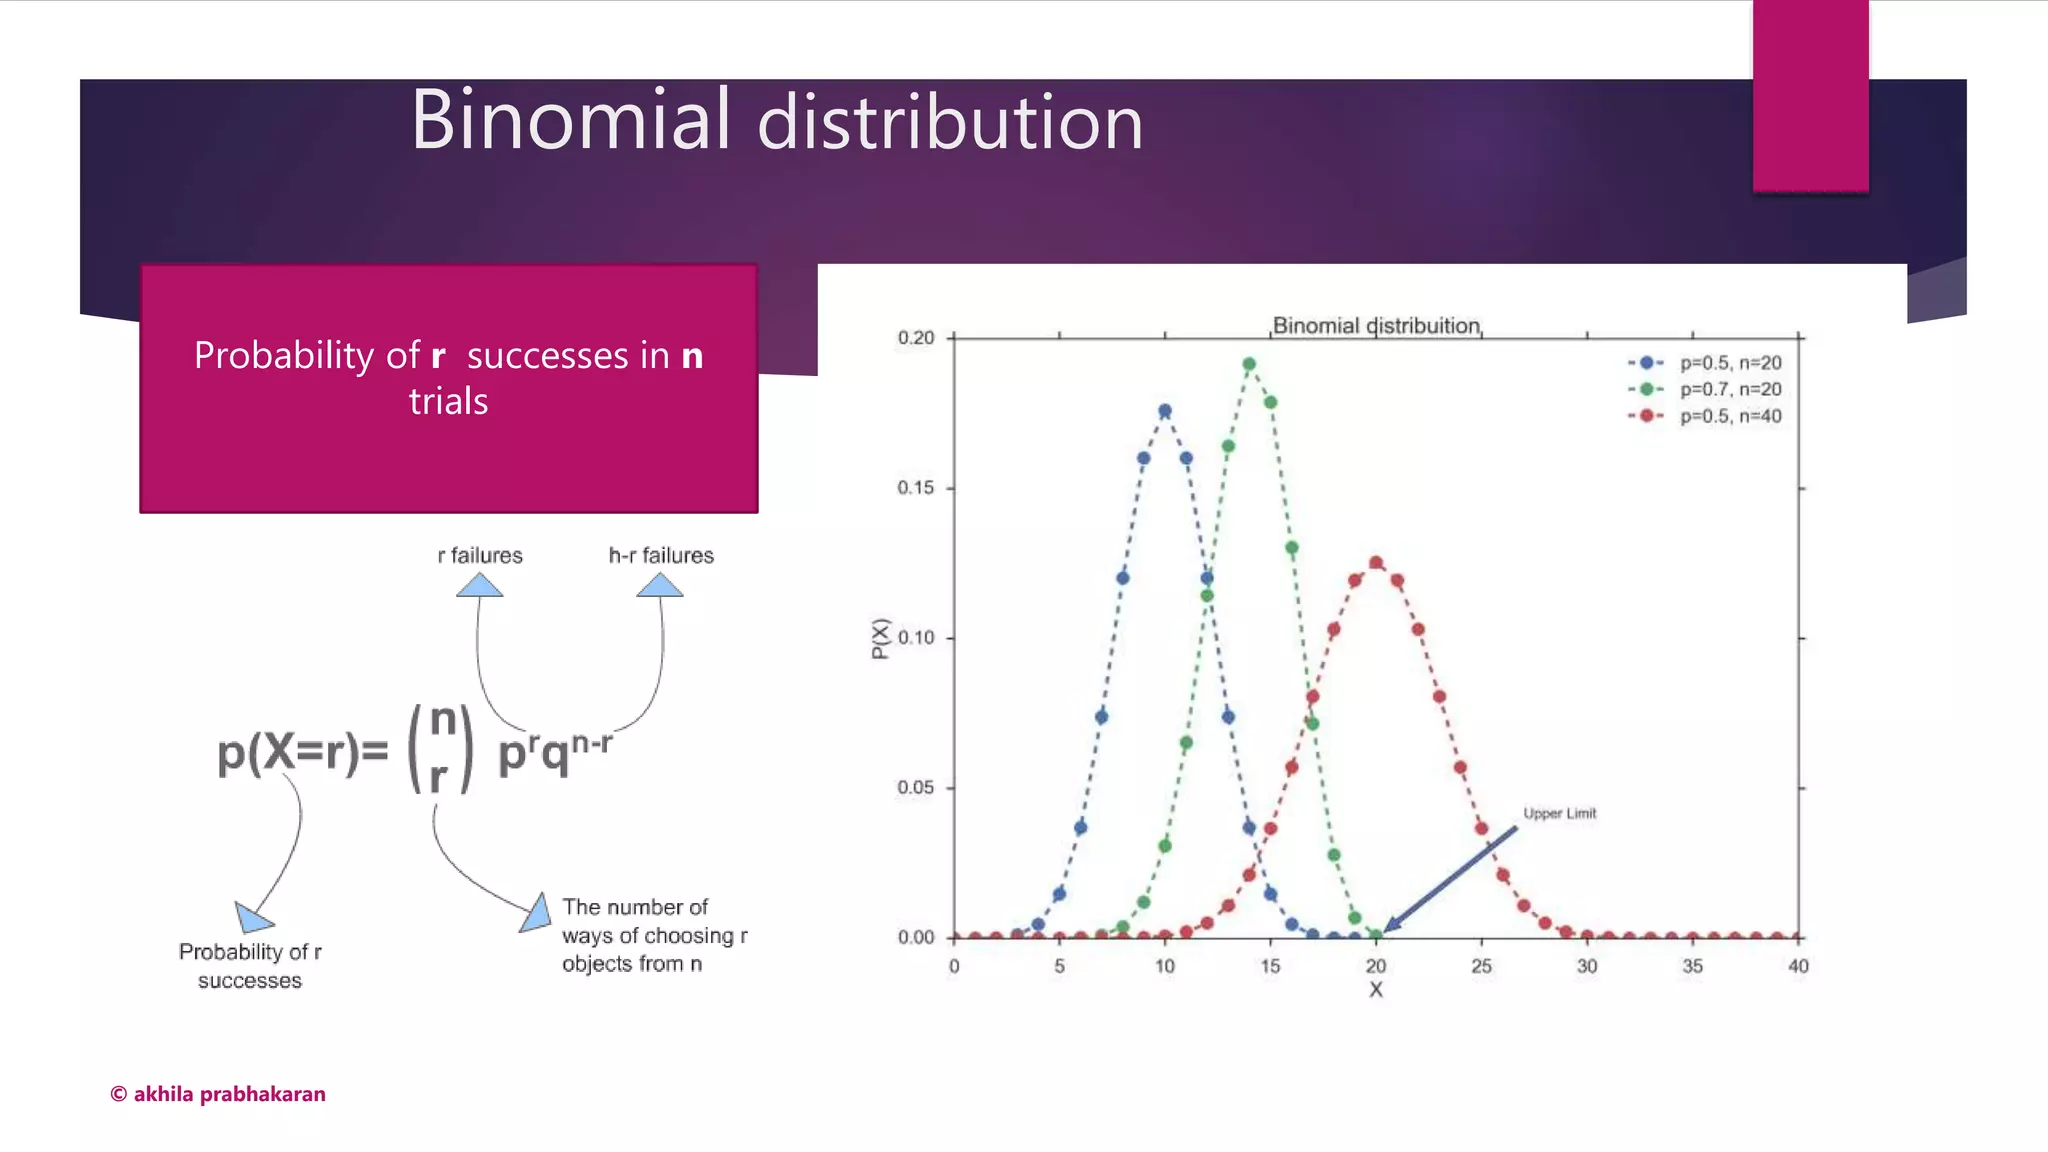
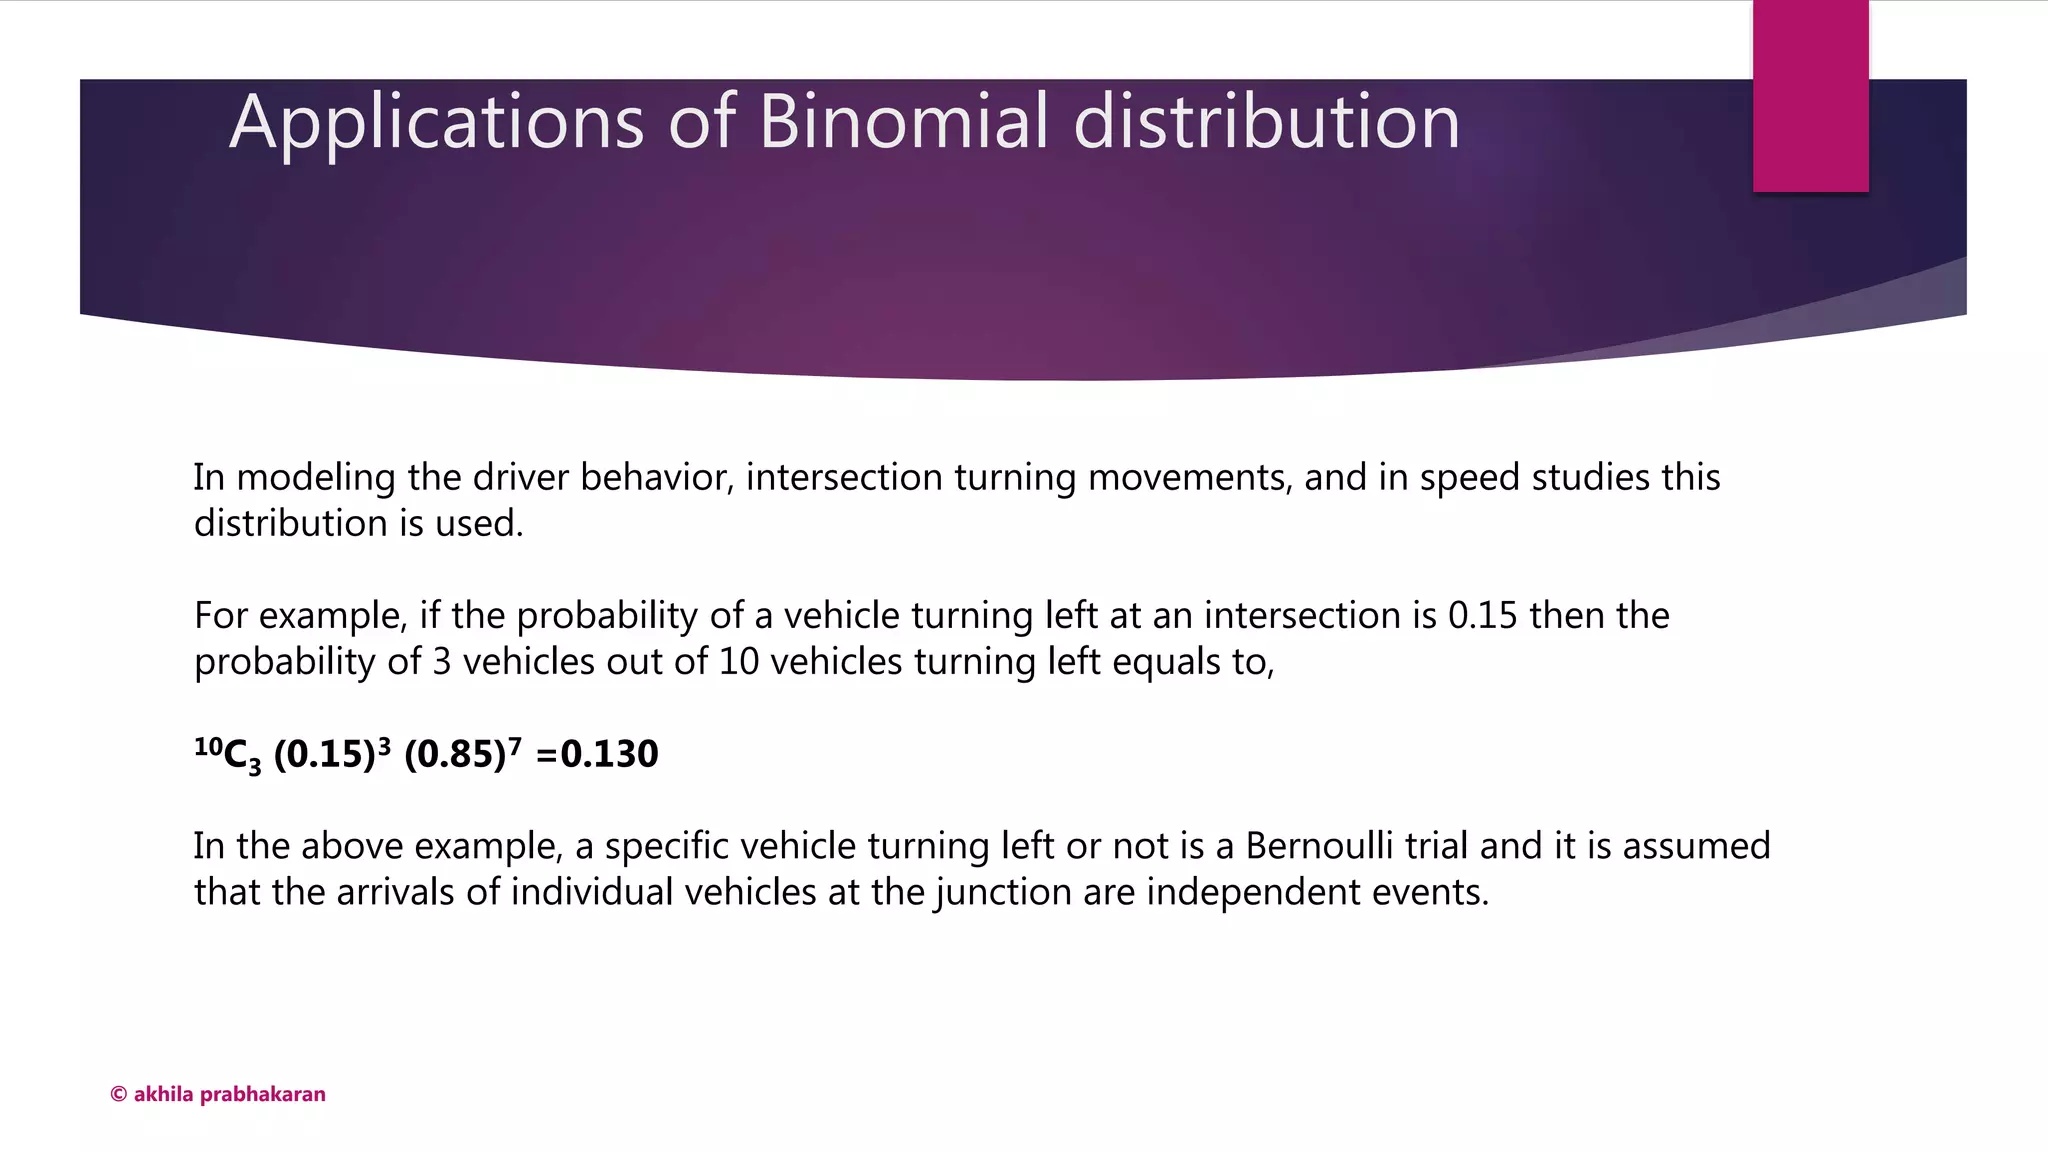
Understanding binomial distributions, including calculating probabilities of successes over trials.
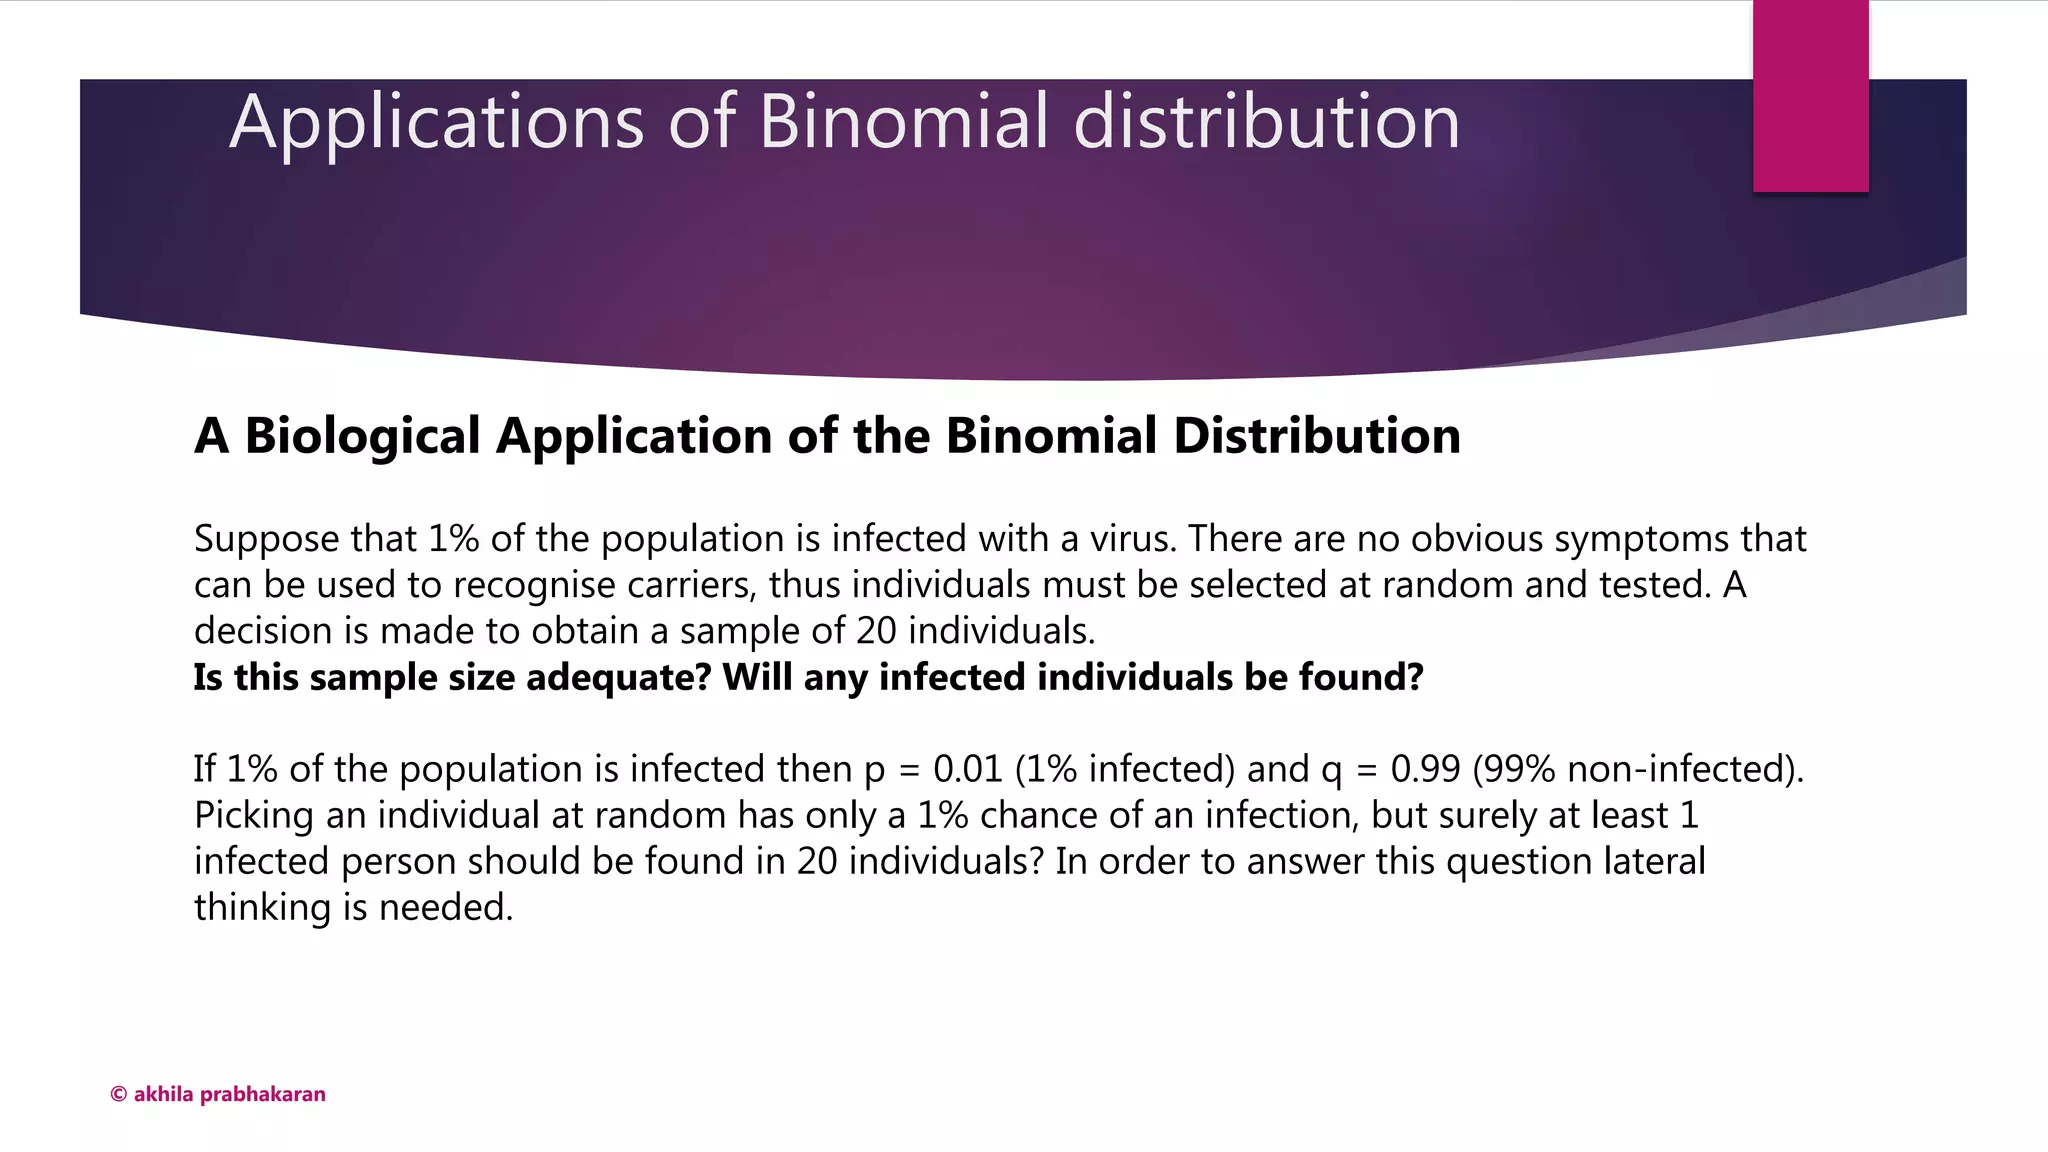
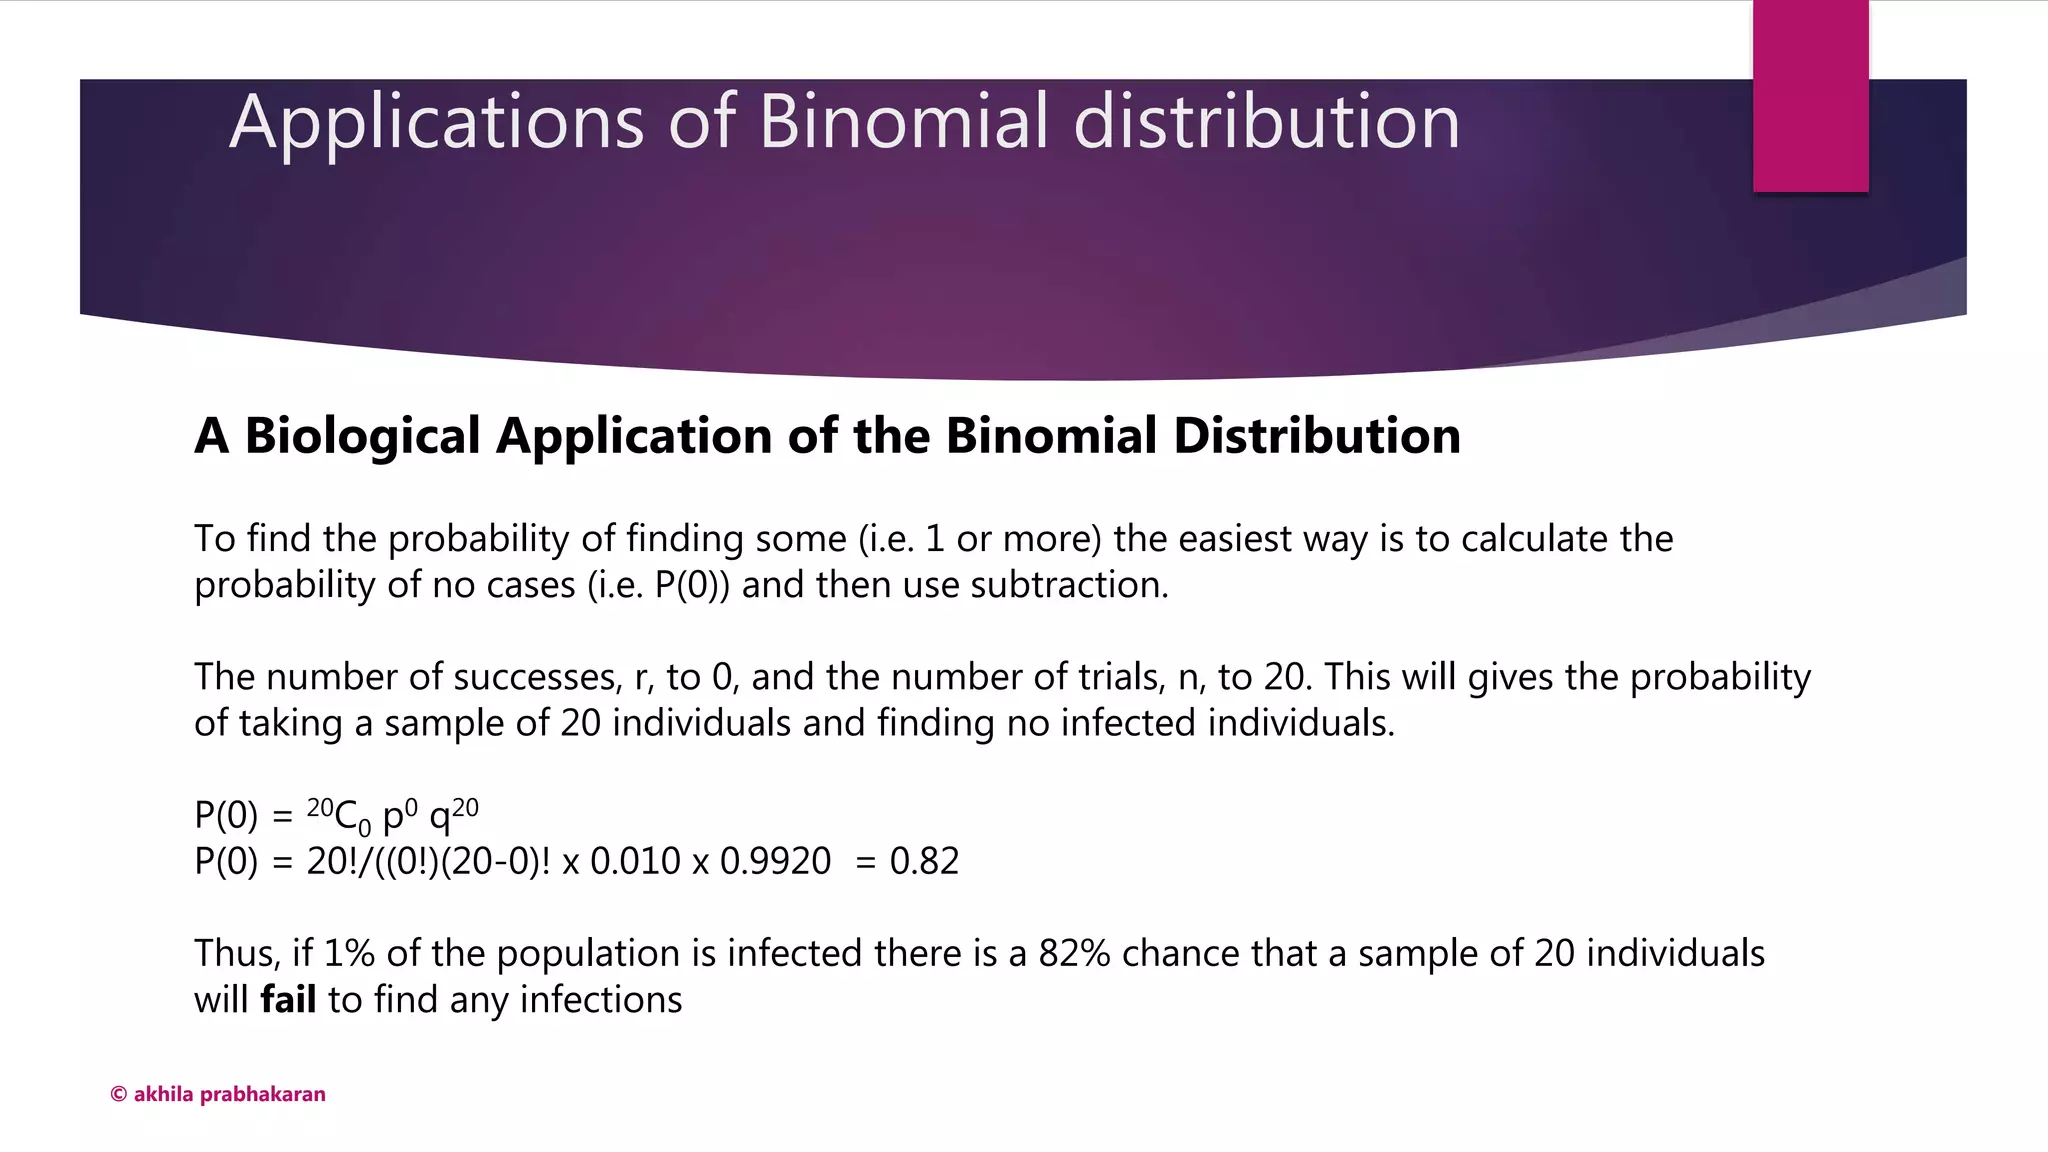
Practical applications in traffic studies and medical testing, including probabilities of finding infected individuals.
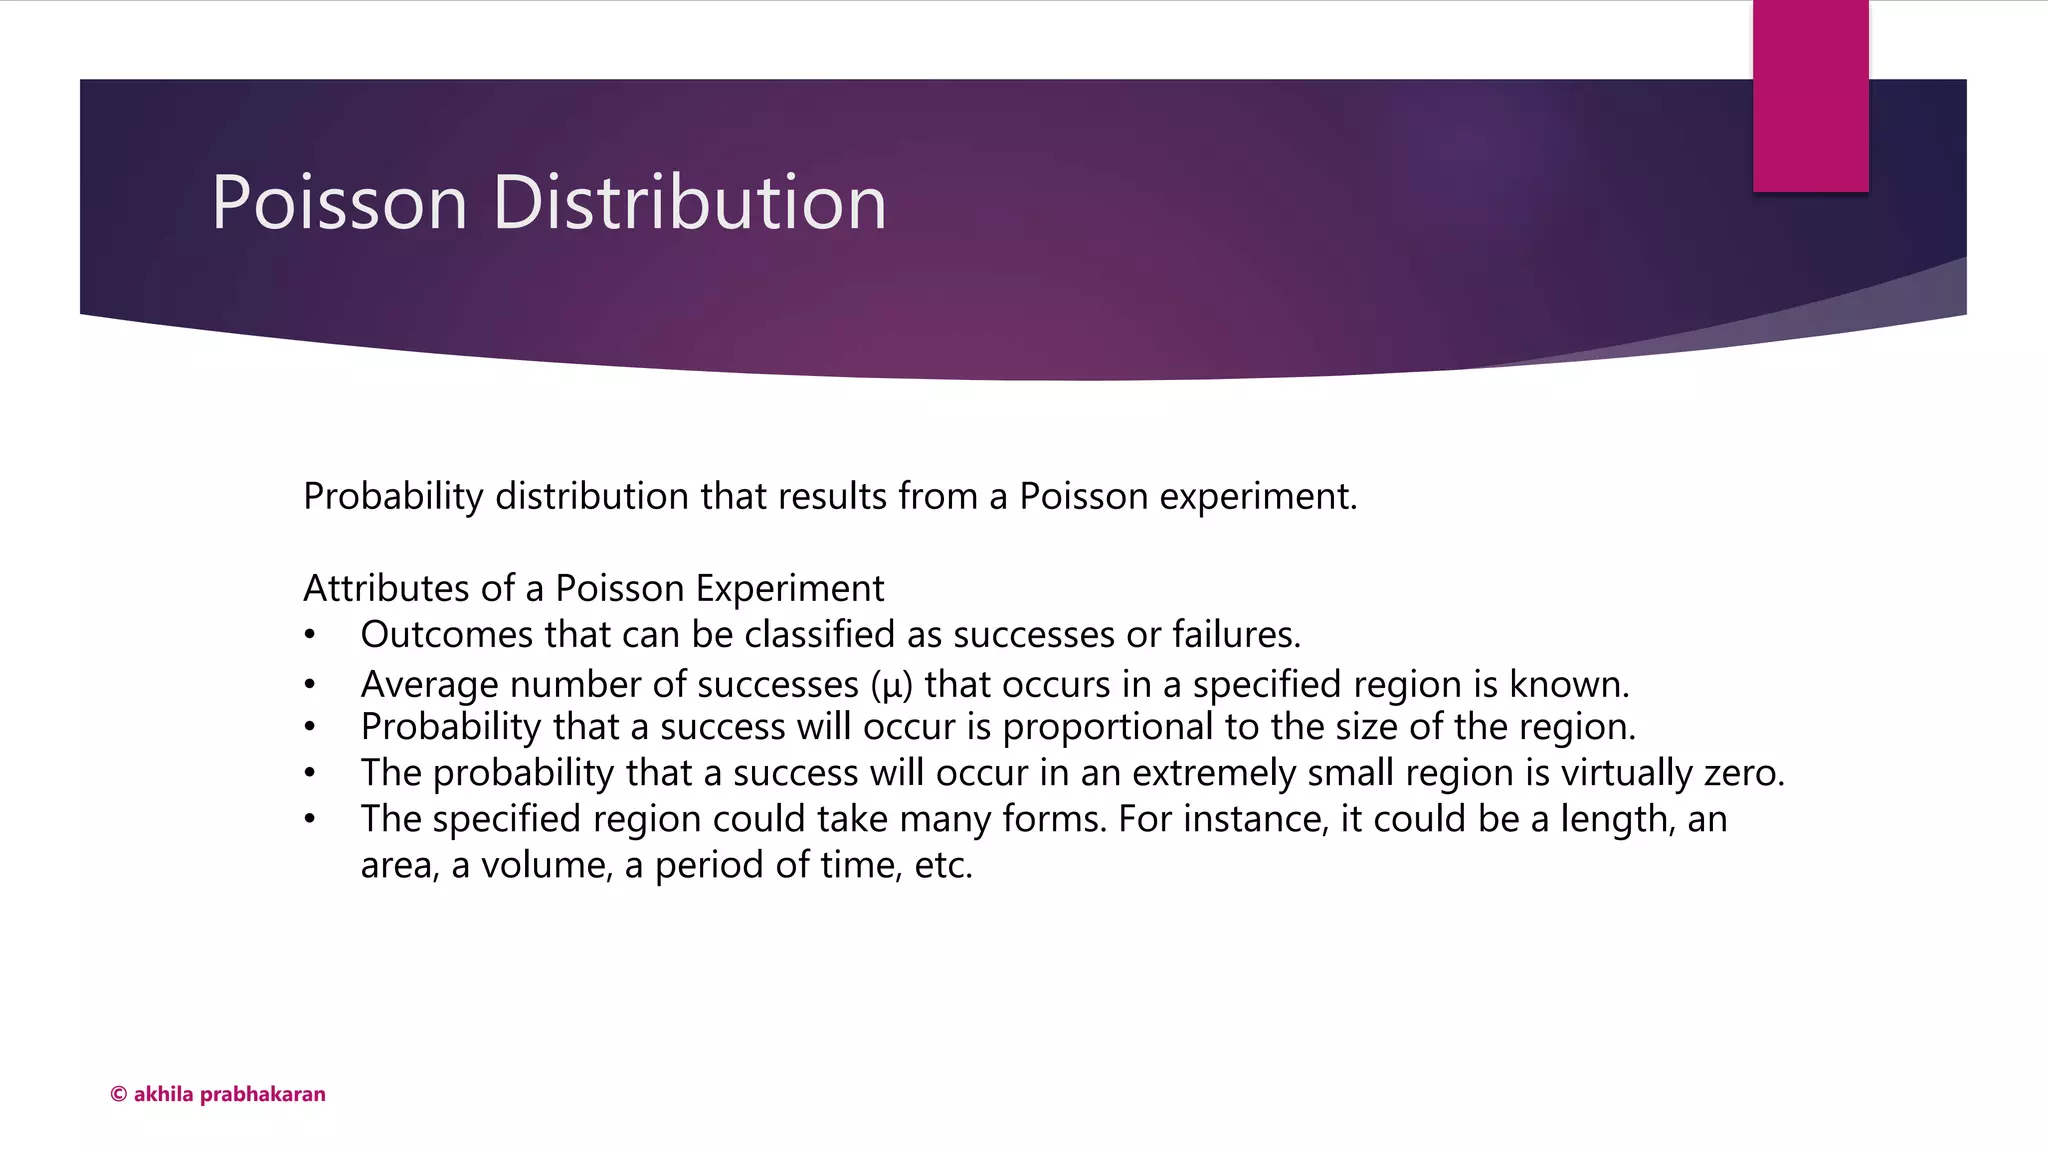
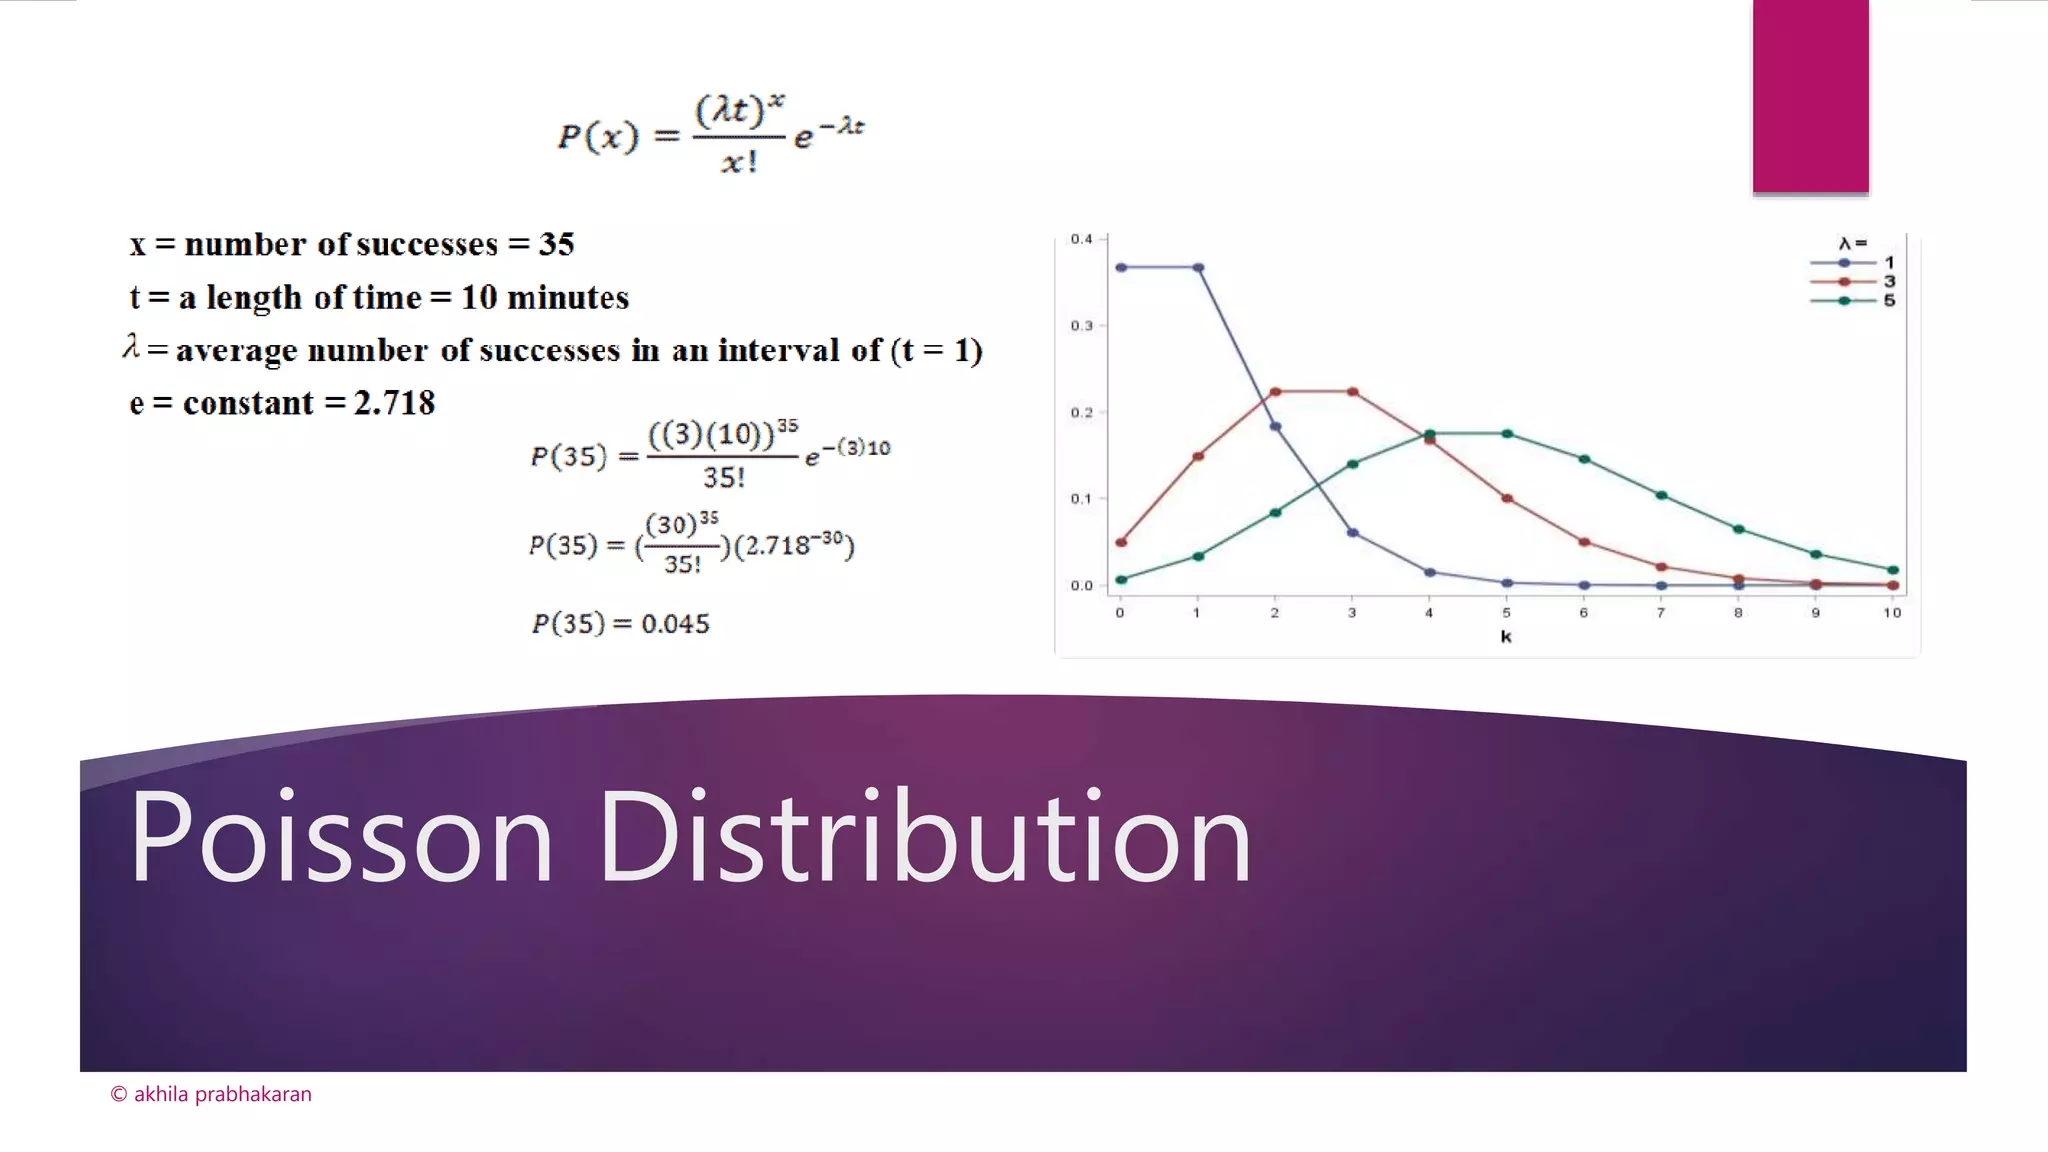
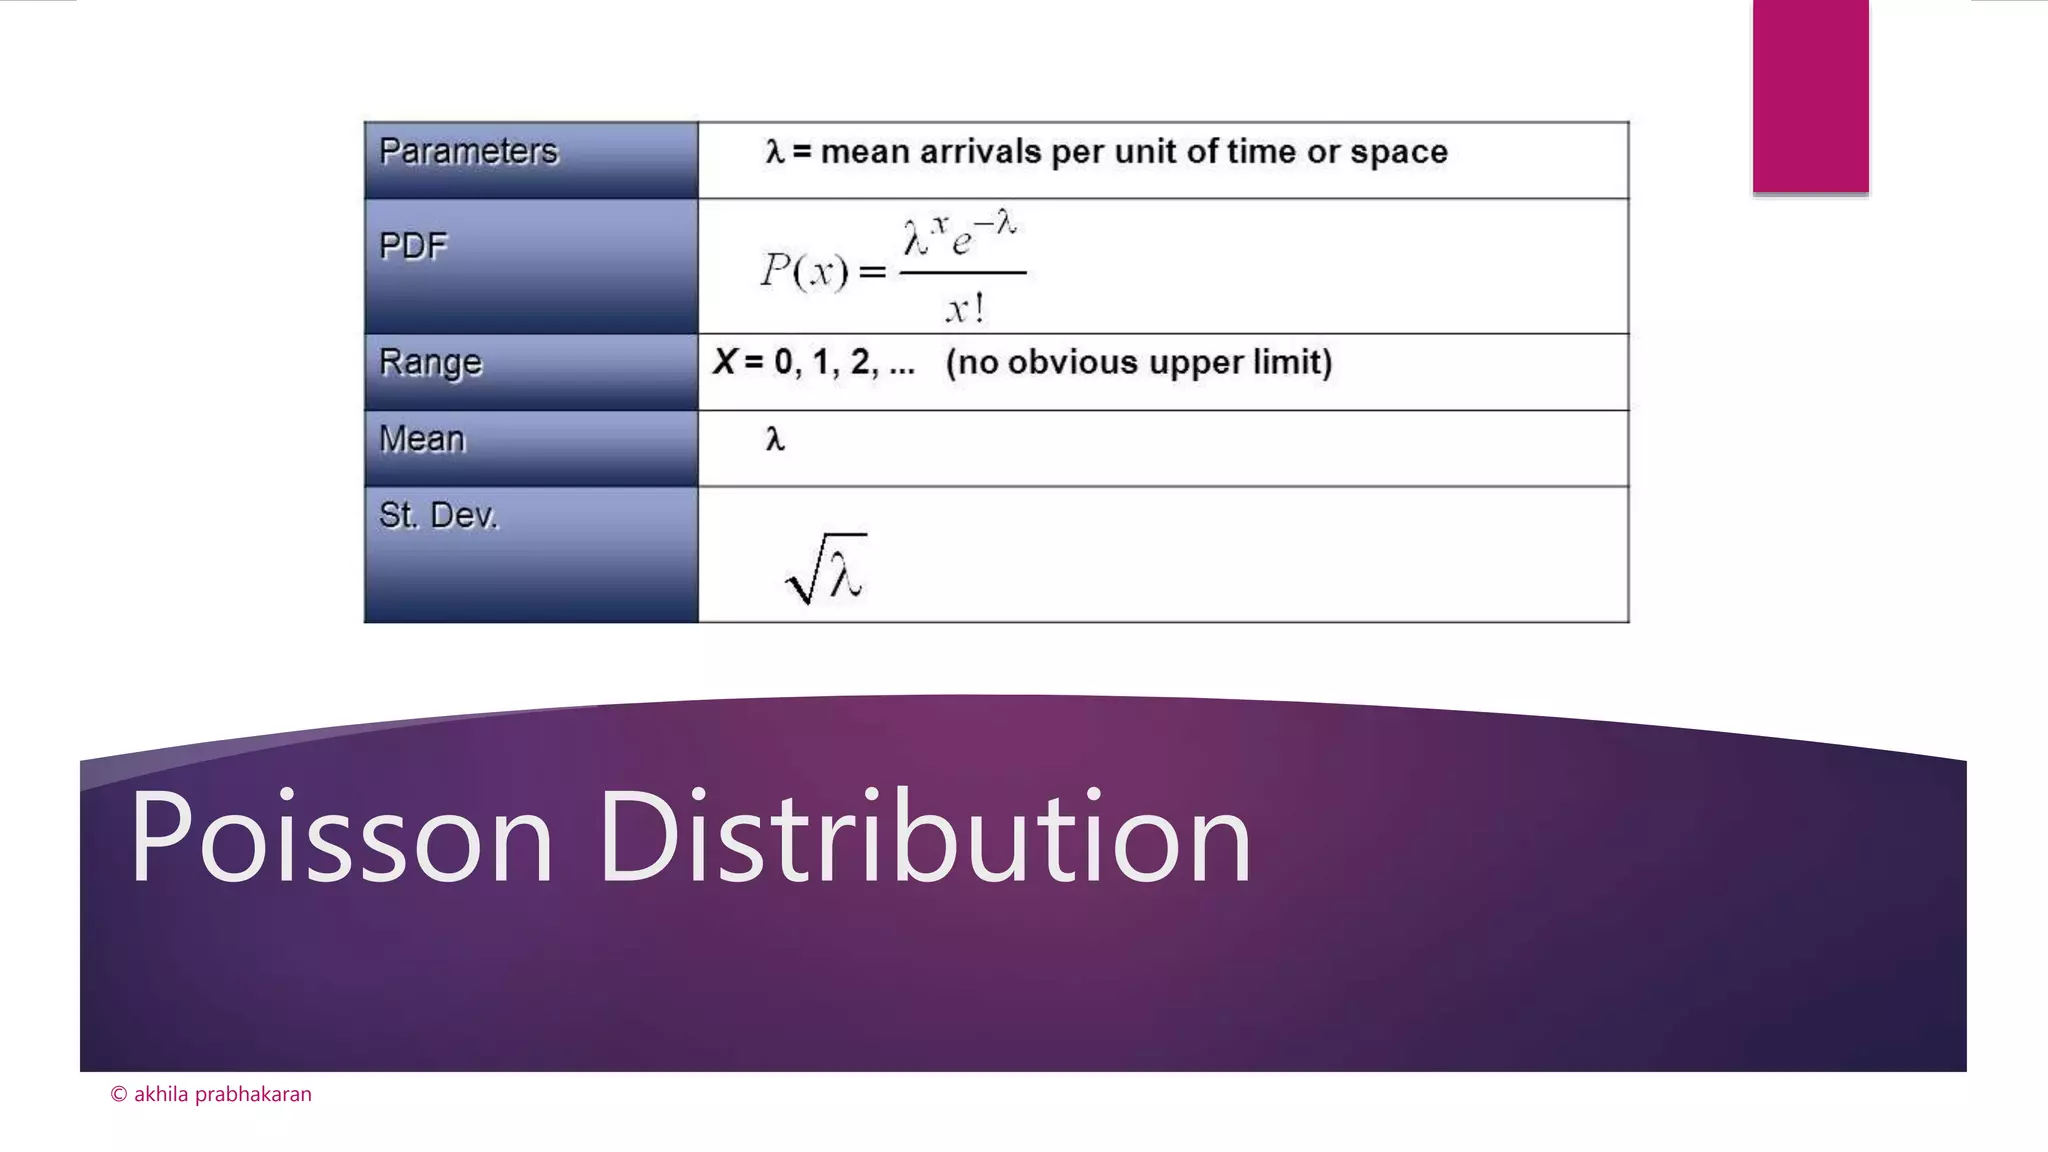
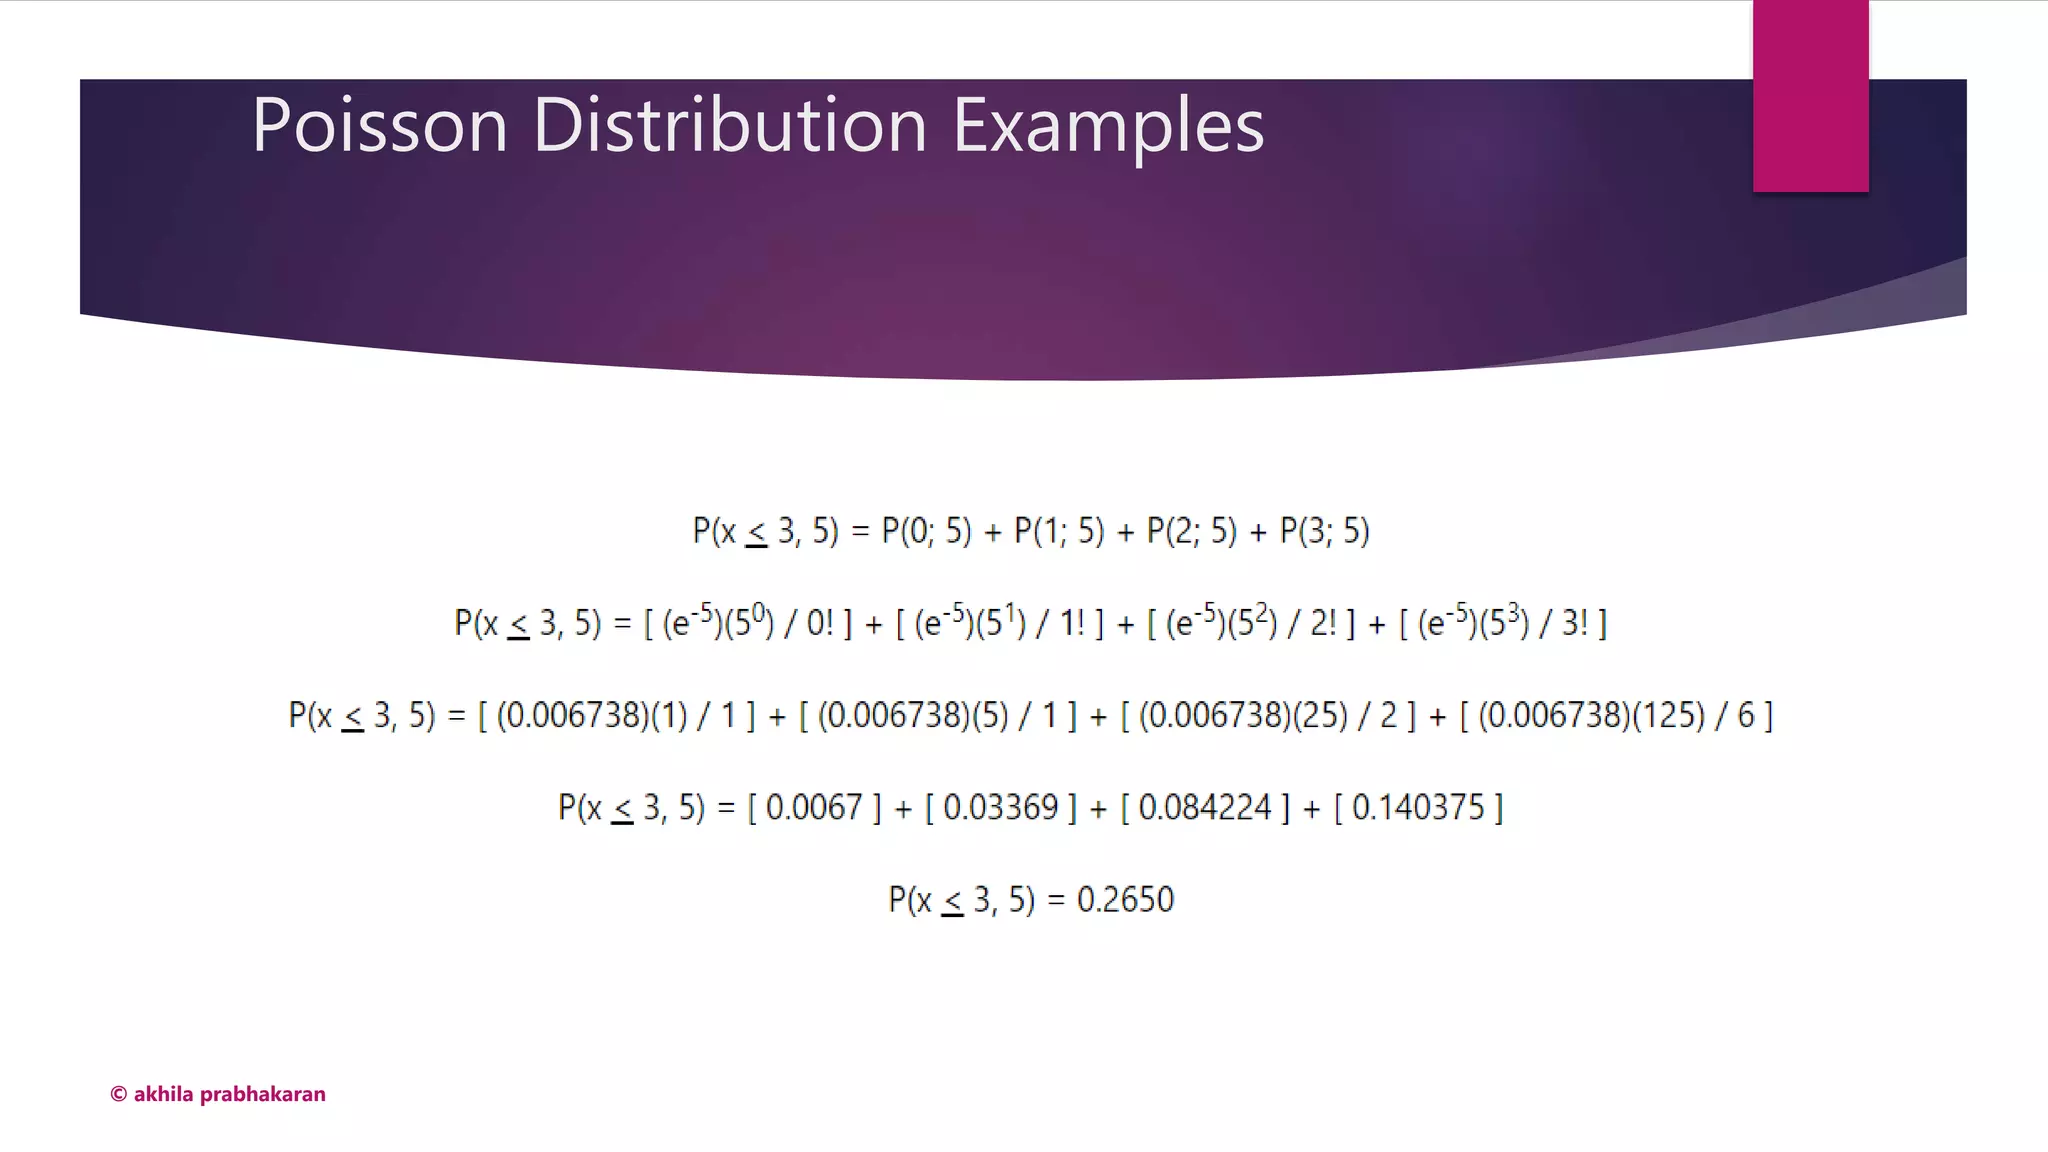
Characteristics and applications of Poisson distribution, describing events across specified intervals.
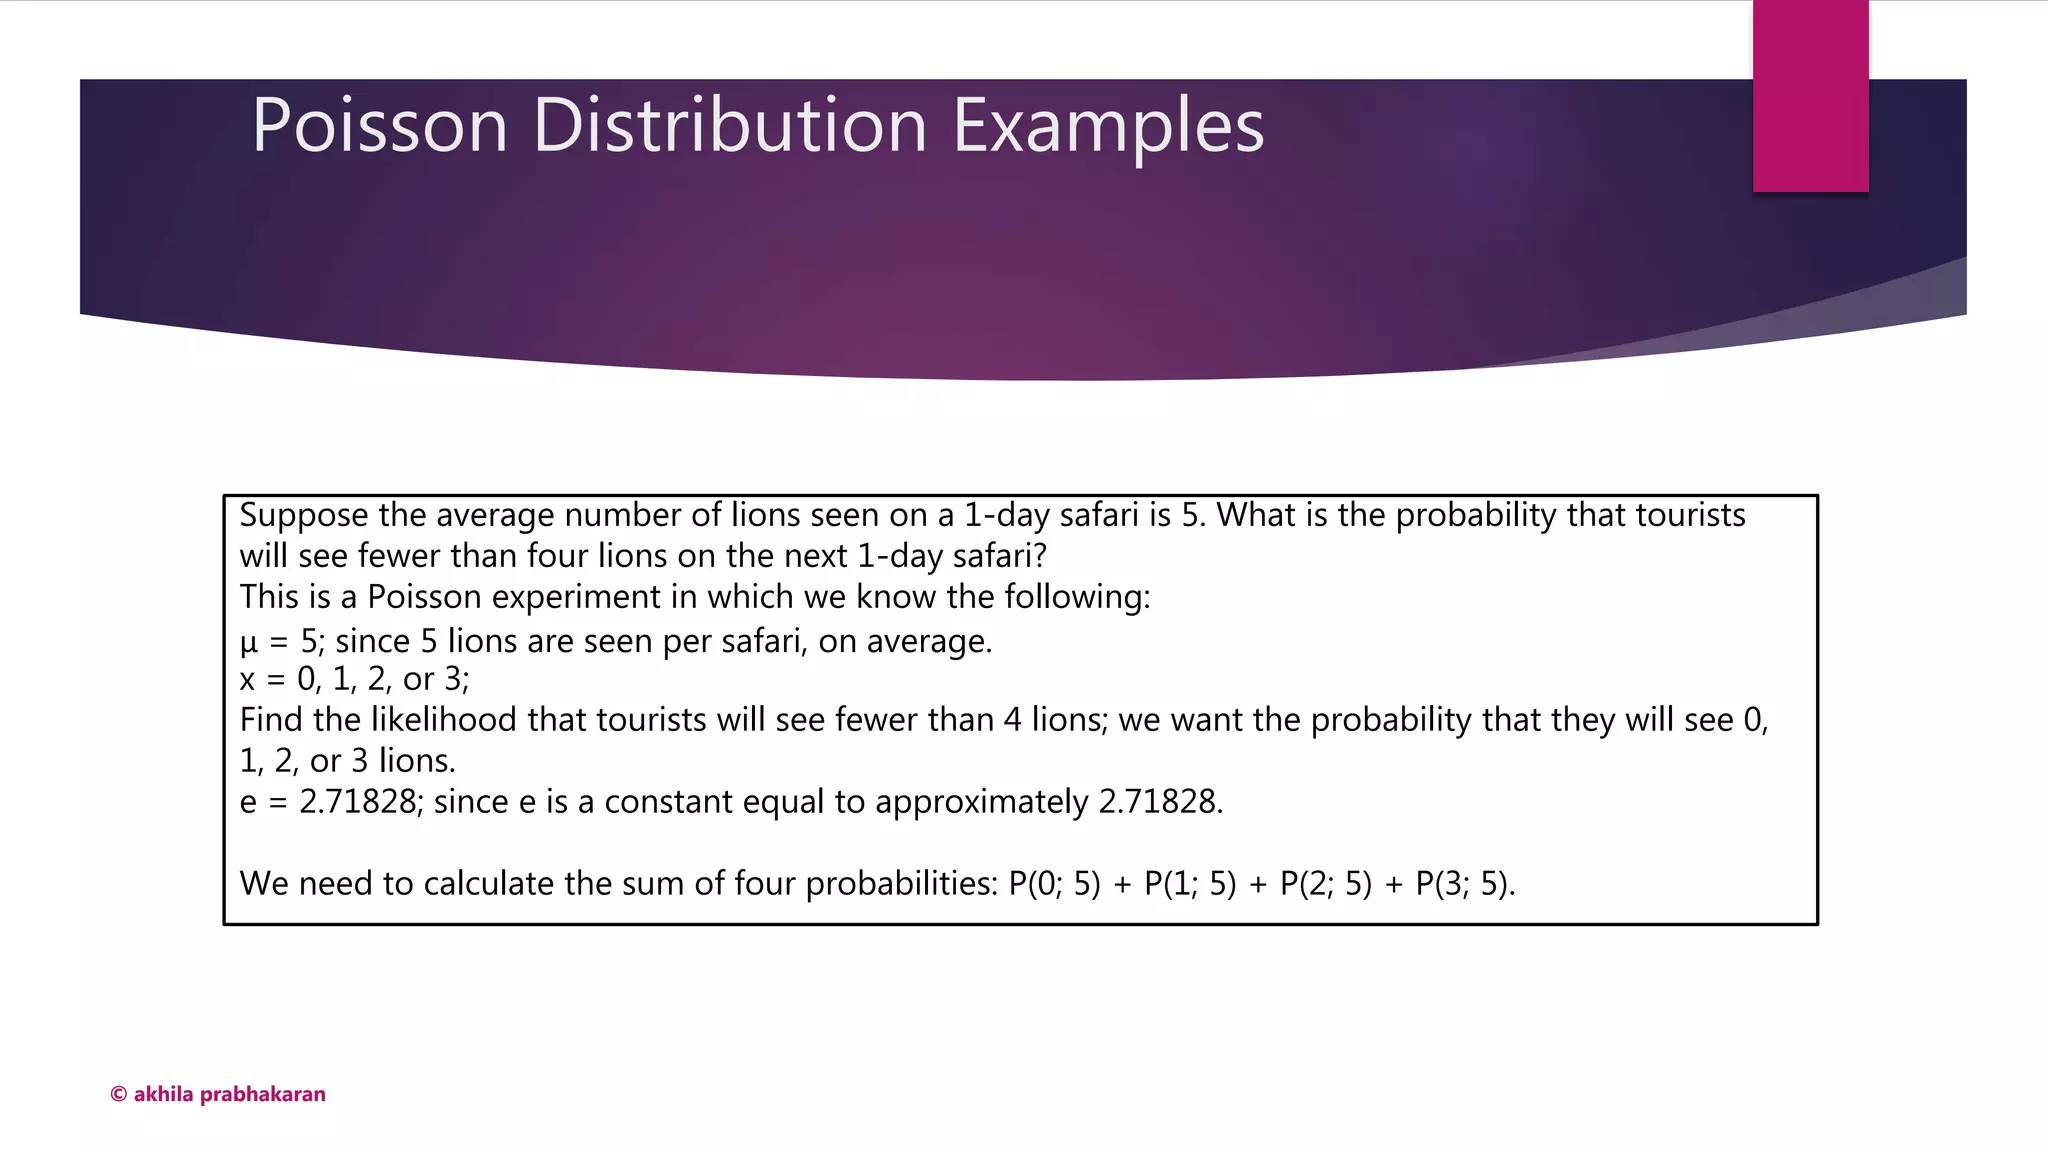
Application examples including sightings of lions and historical cyclone data in India.
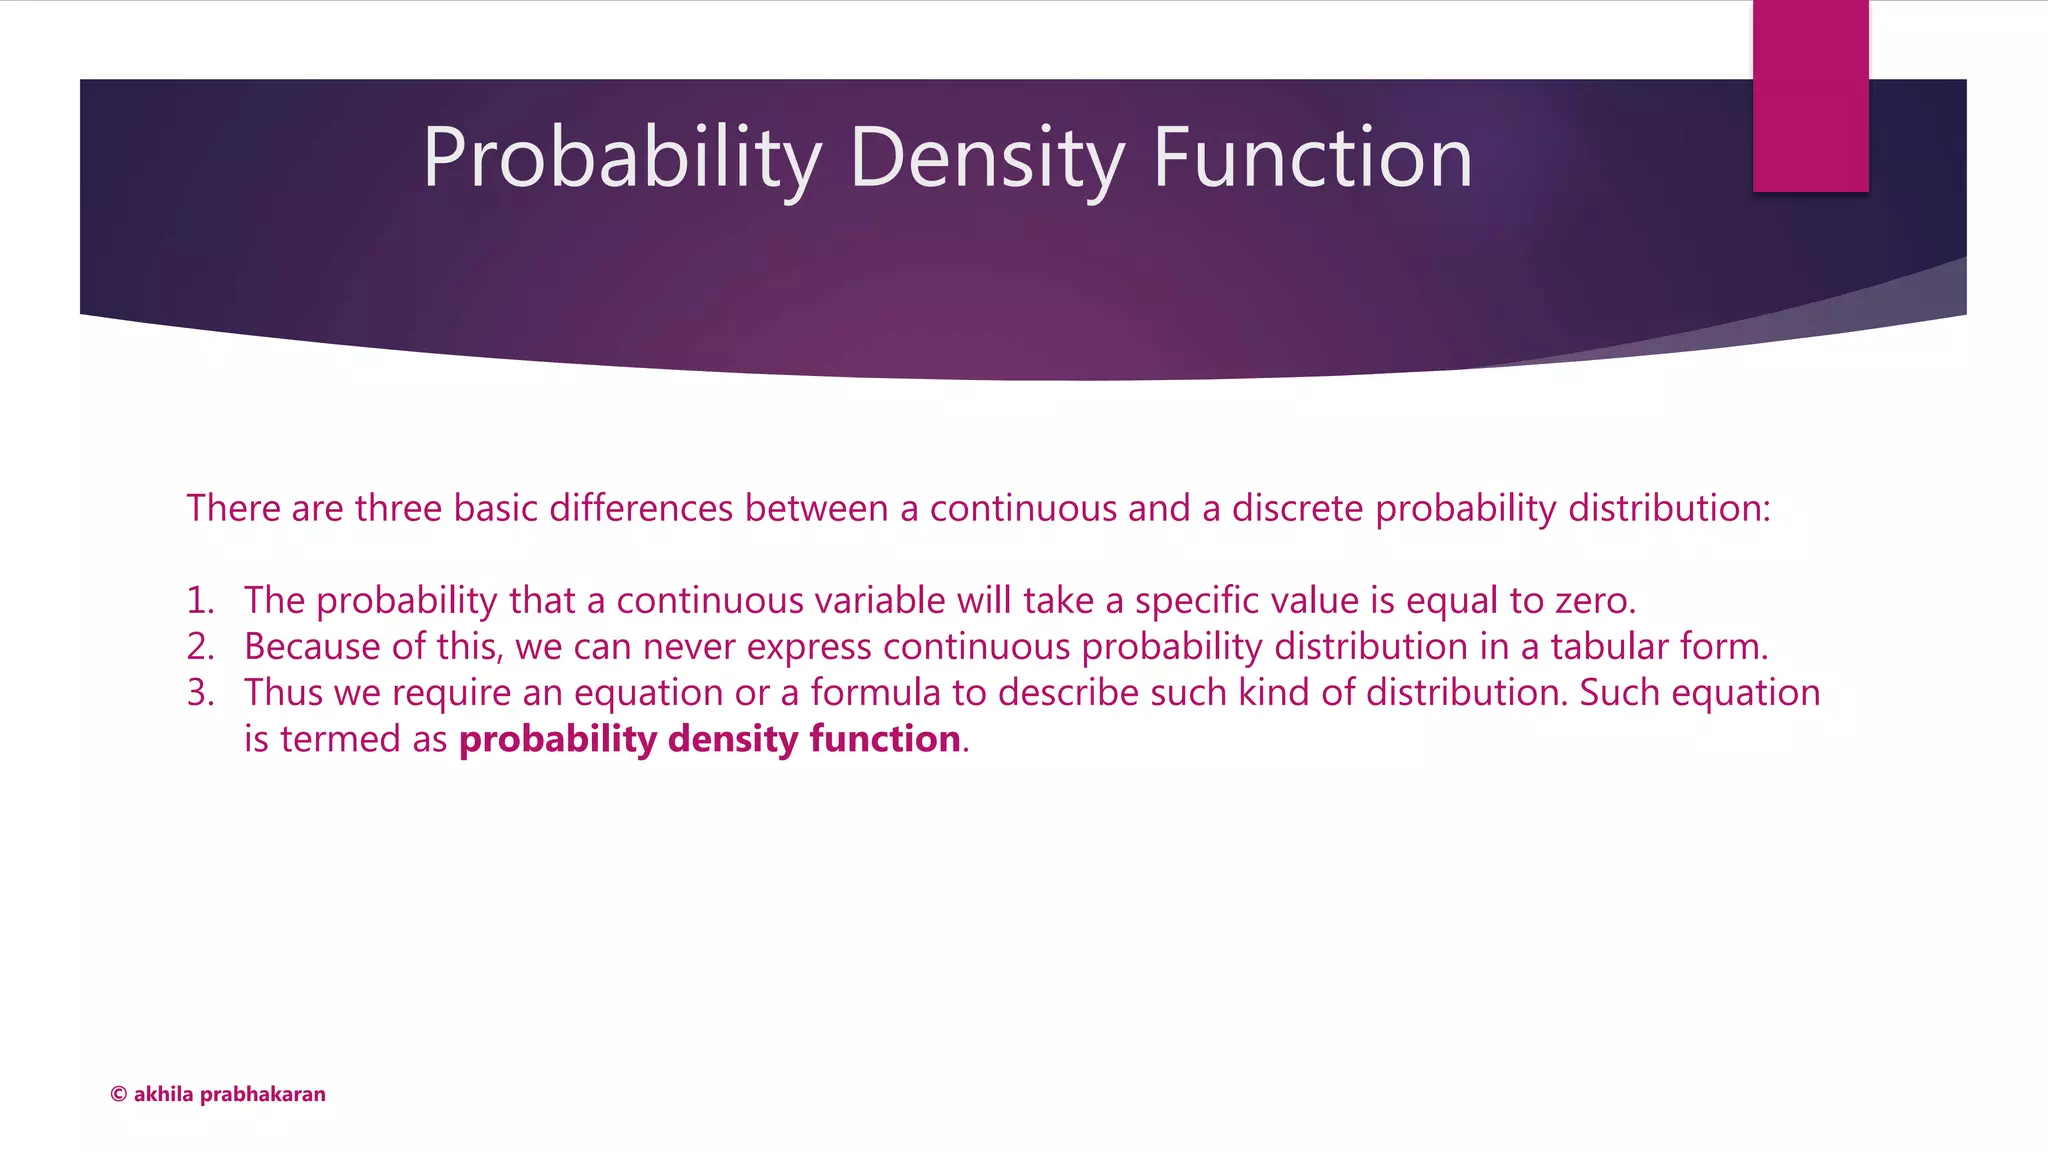
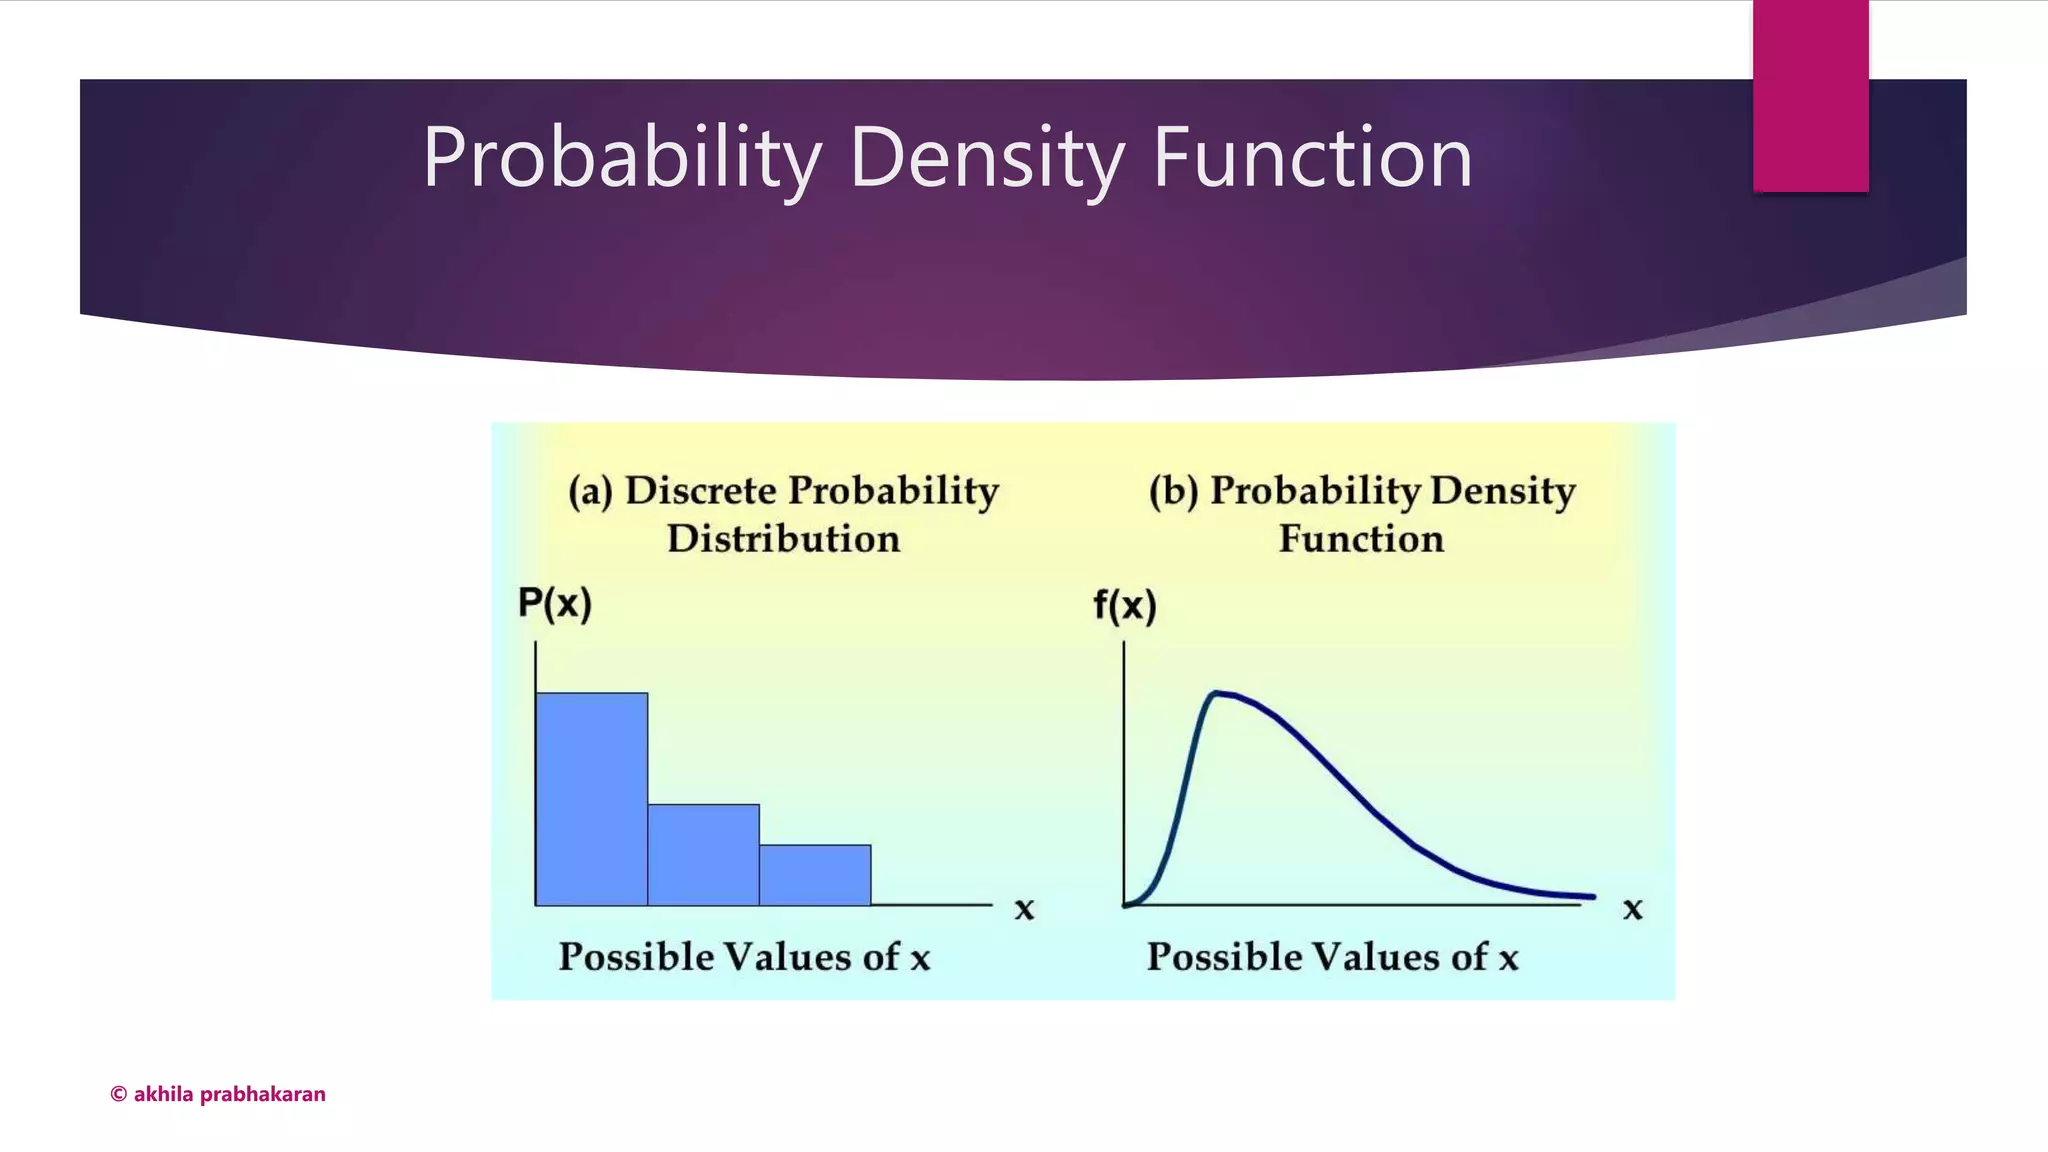
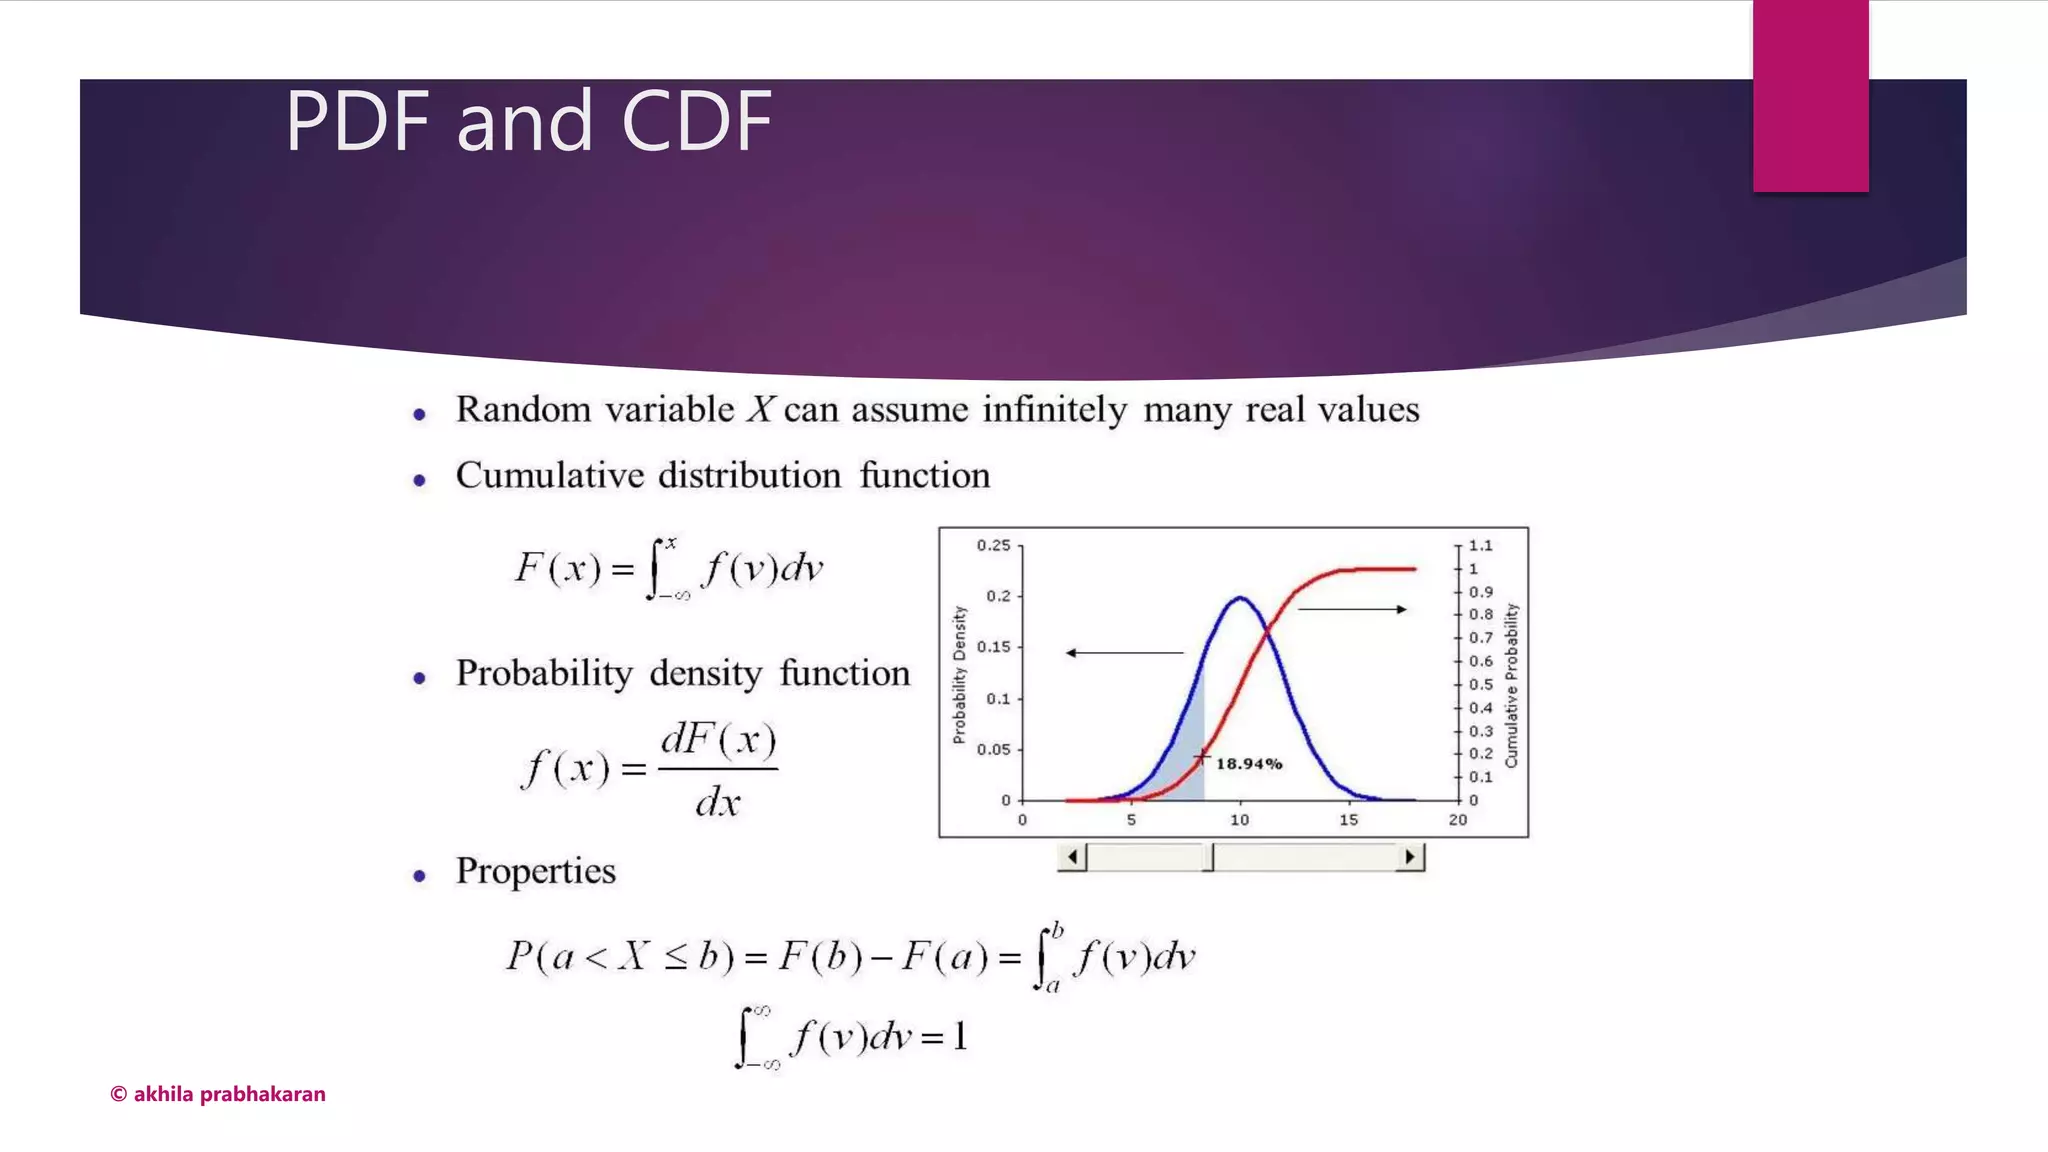
Differences between probability density functions for continuous and discrete distributions.
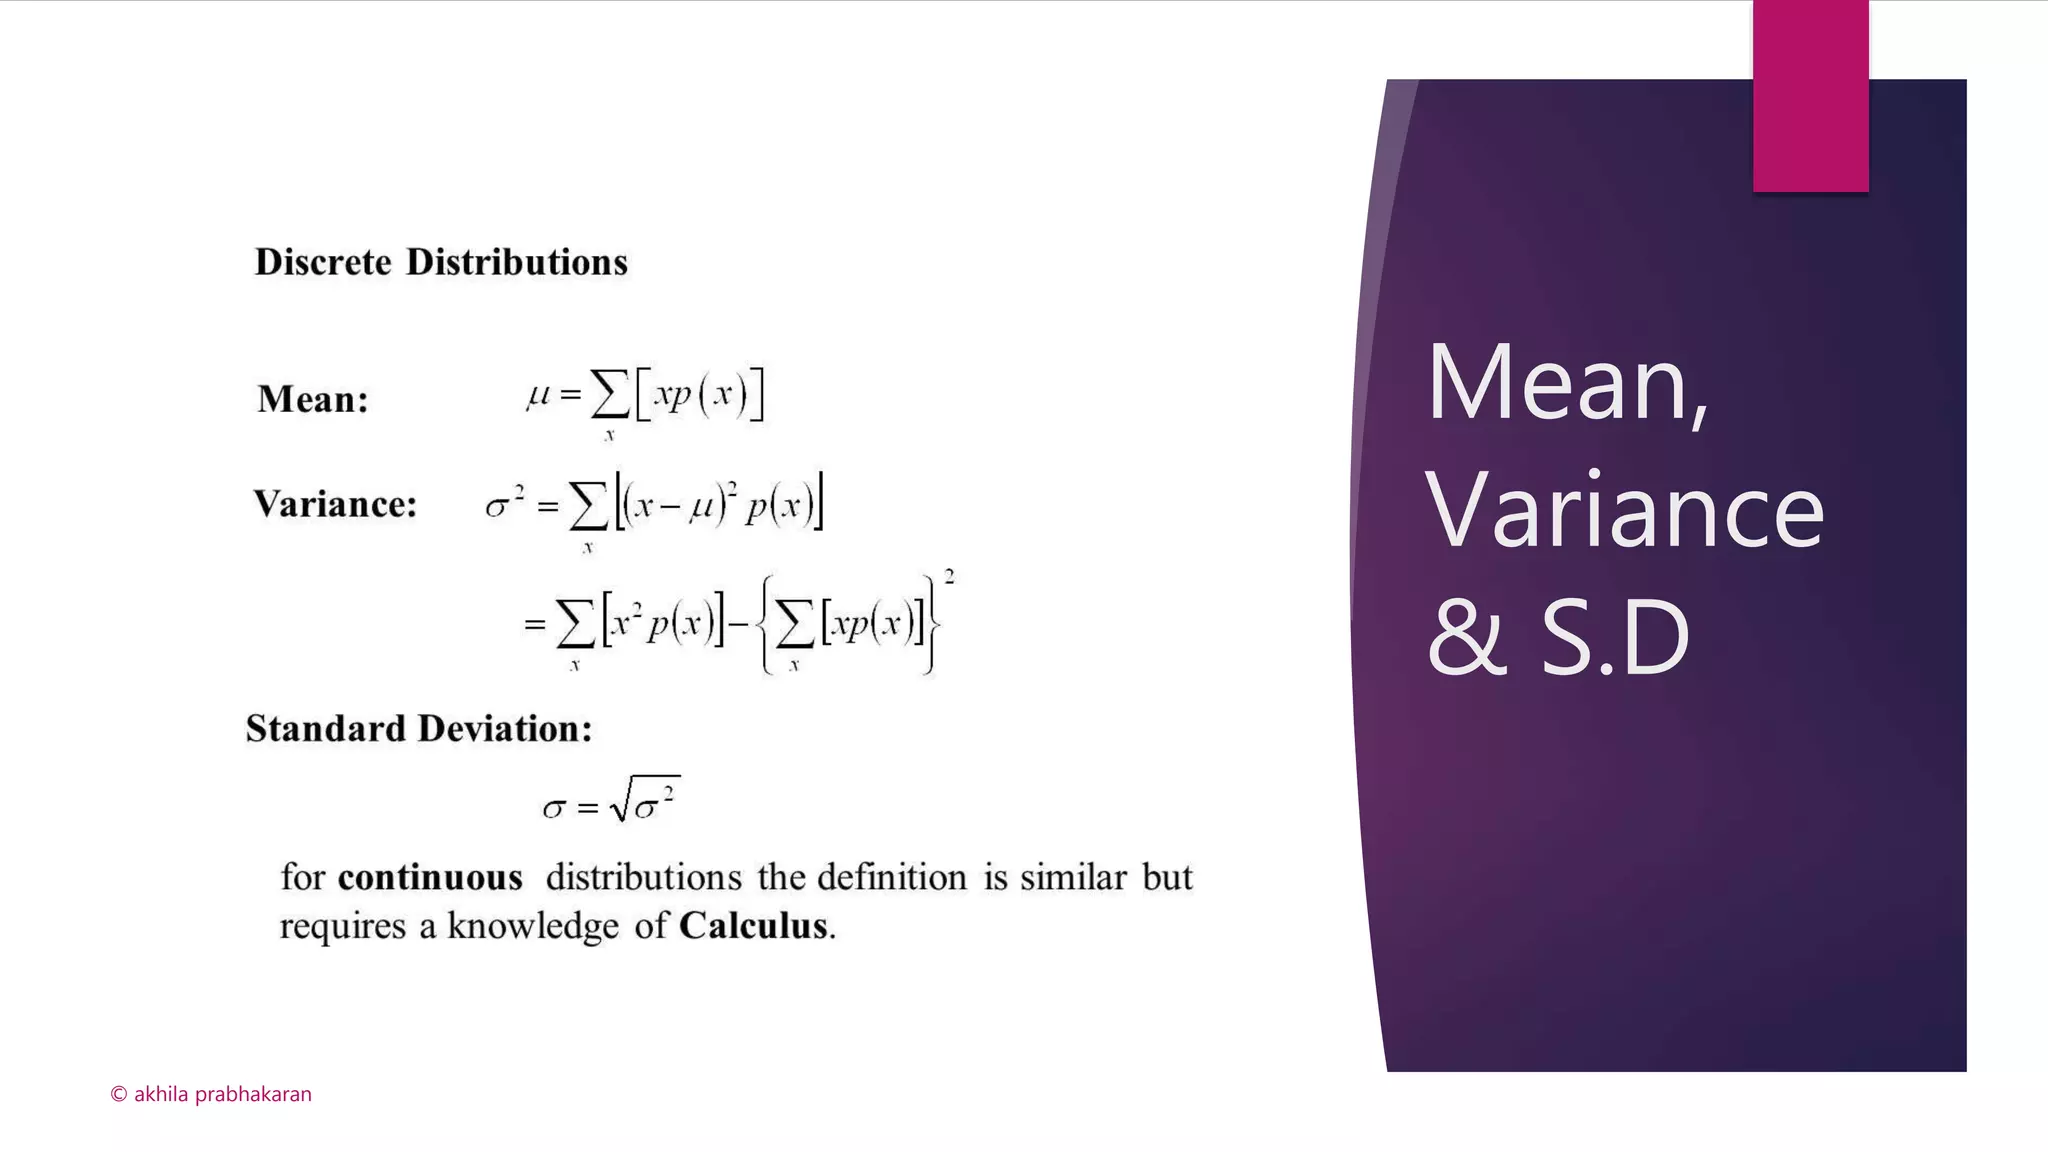
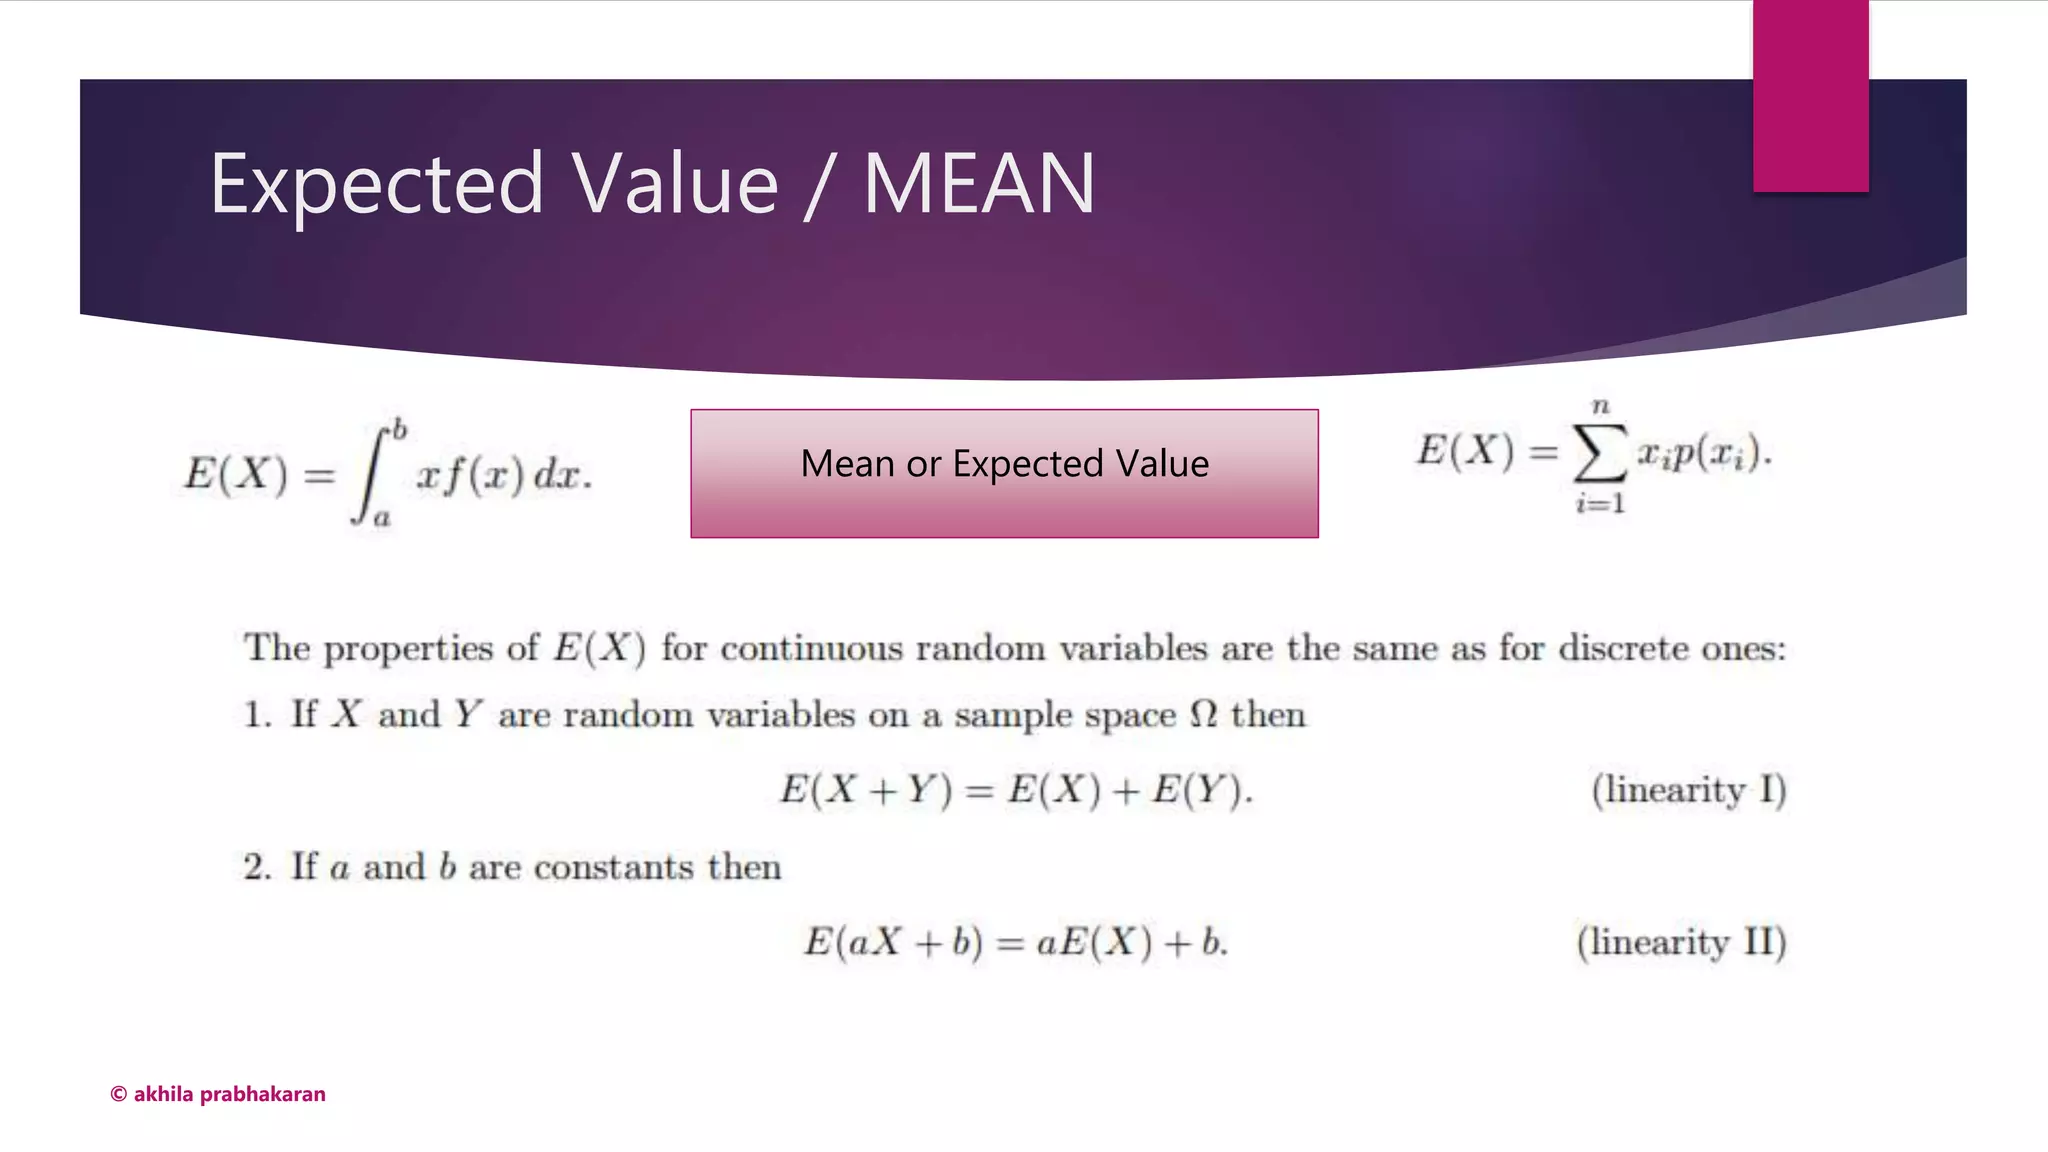
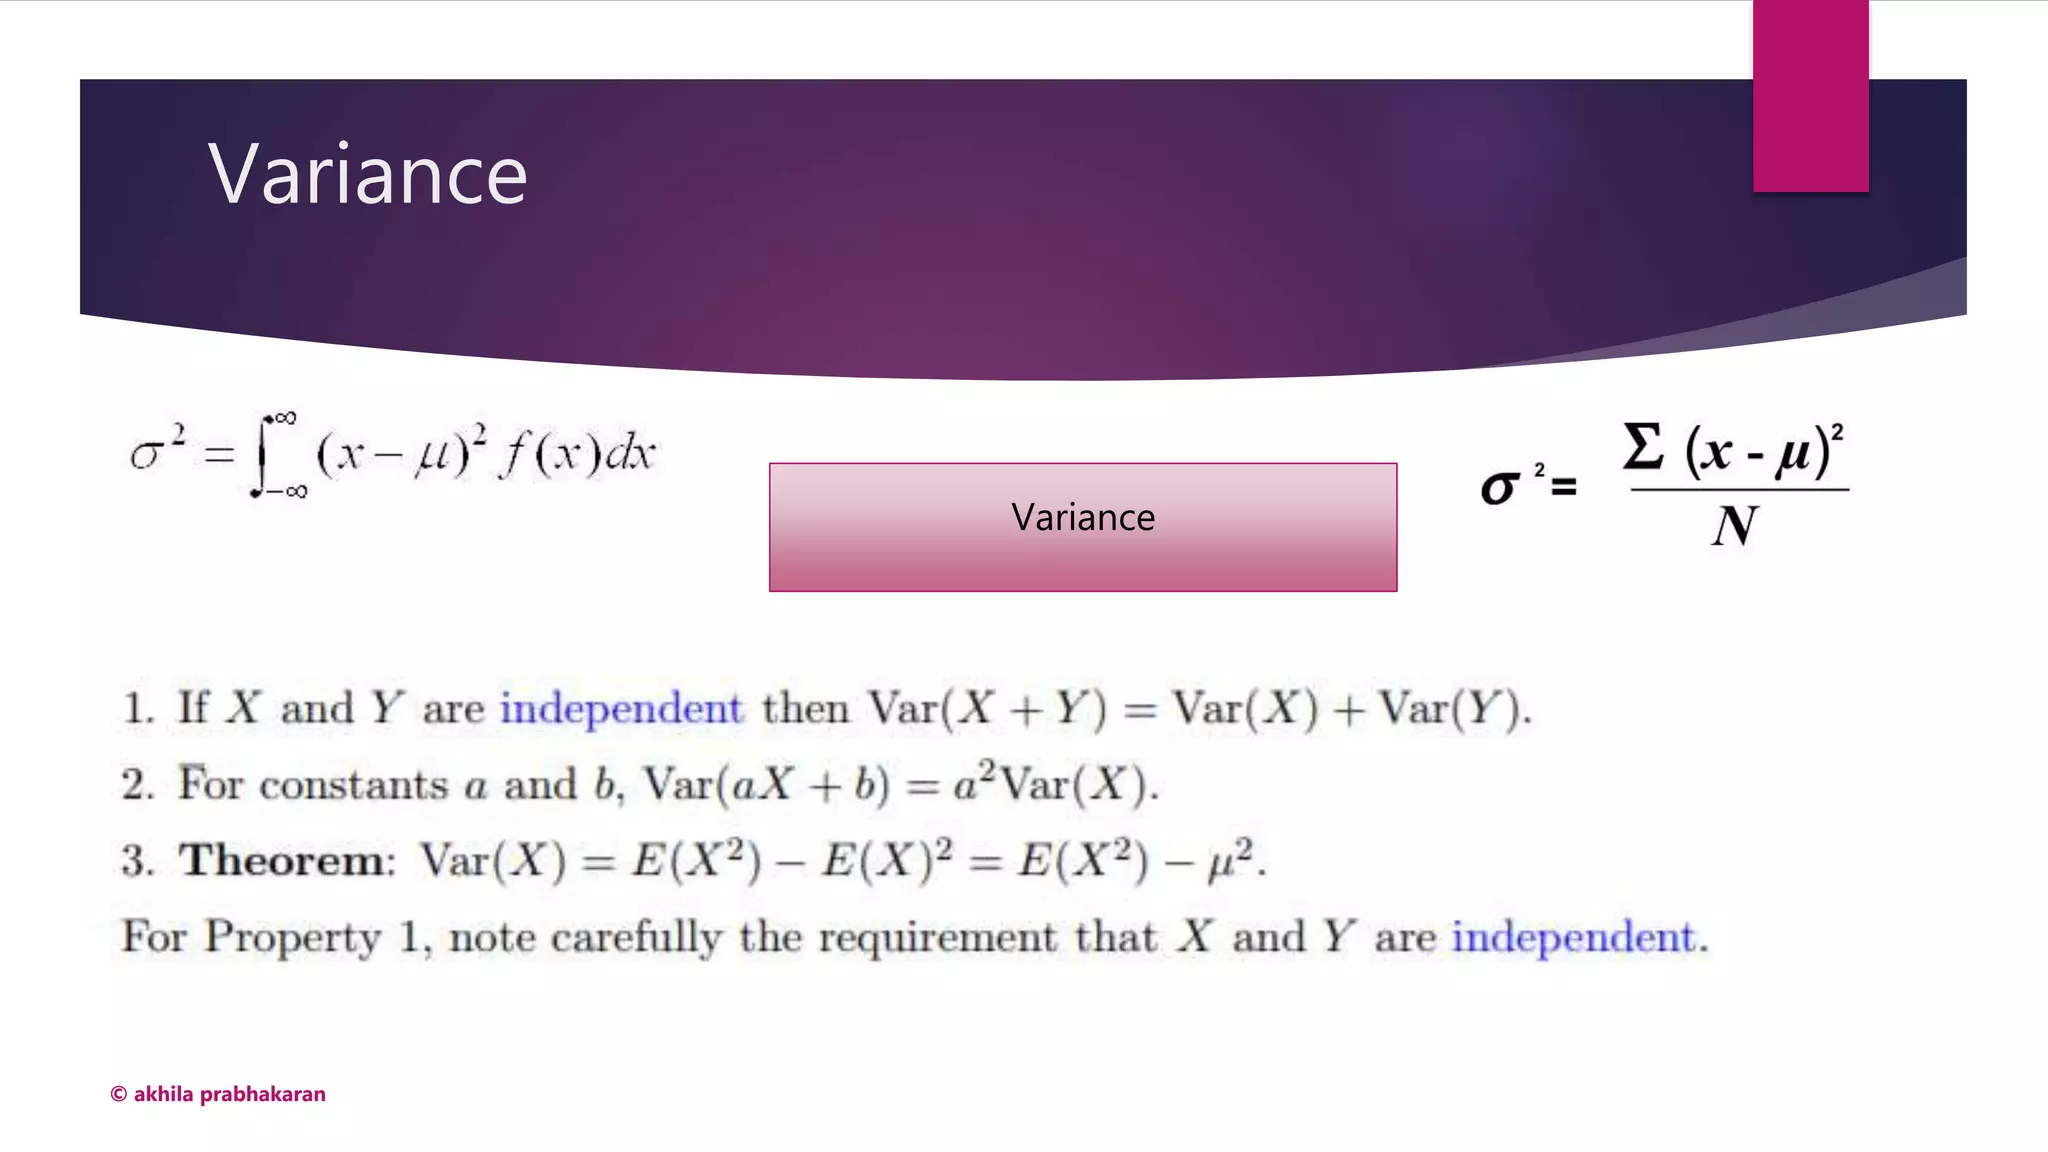
Definitions of mean, variance, and standard deviation and their significance.
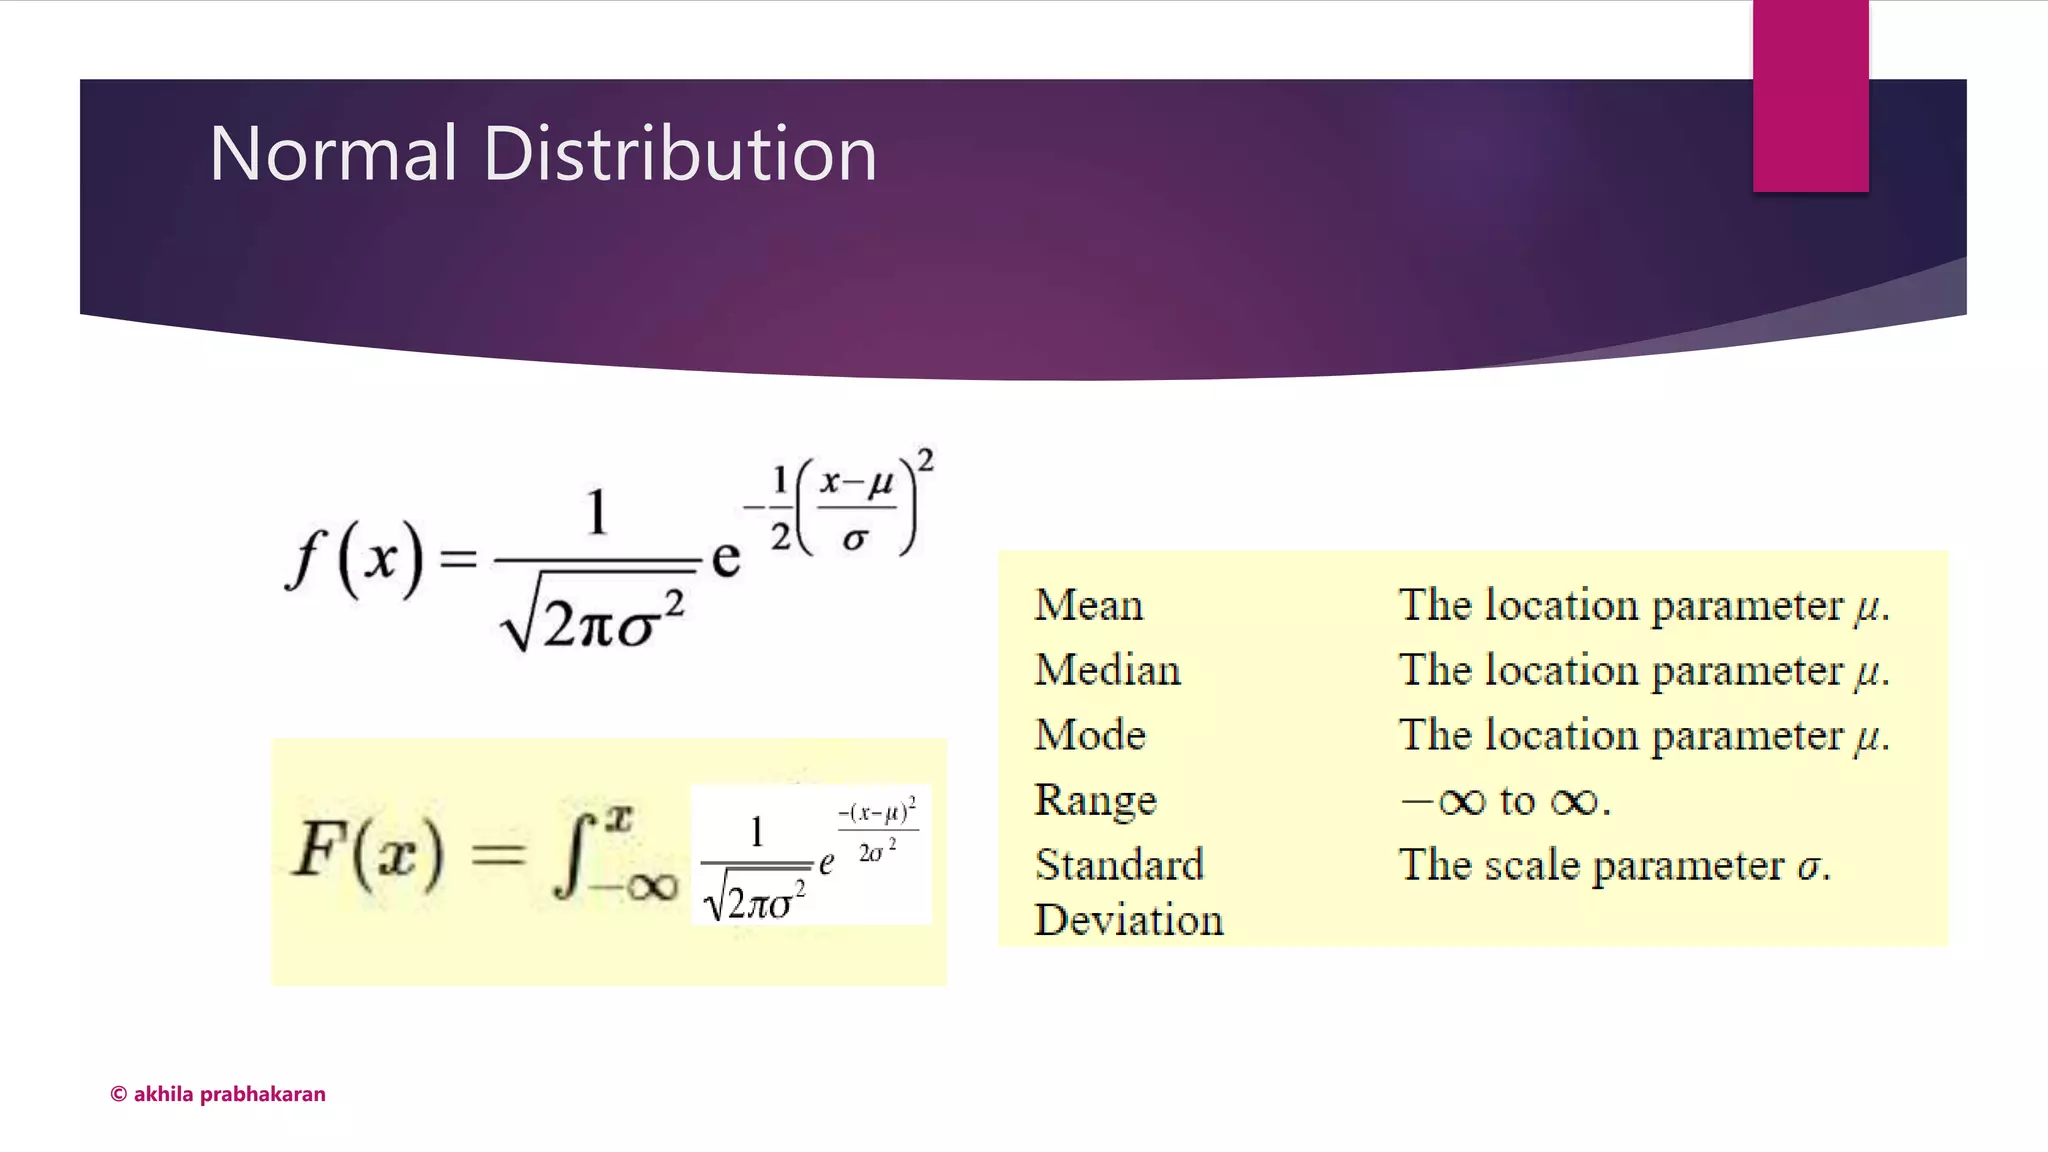
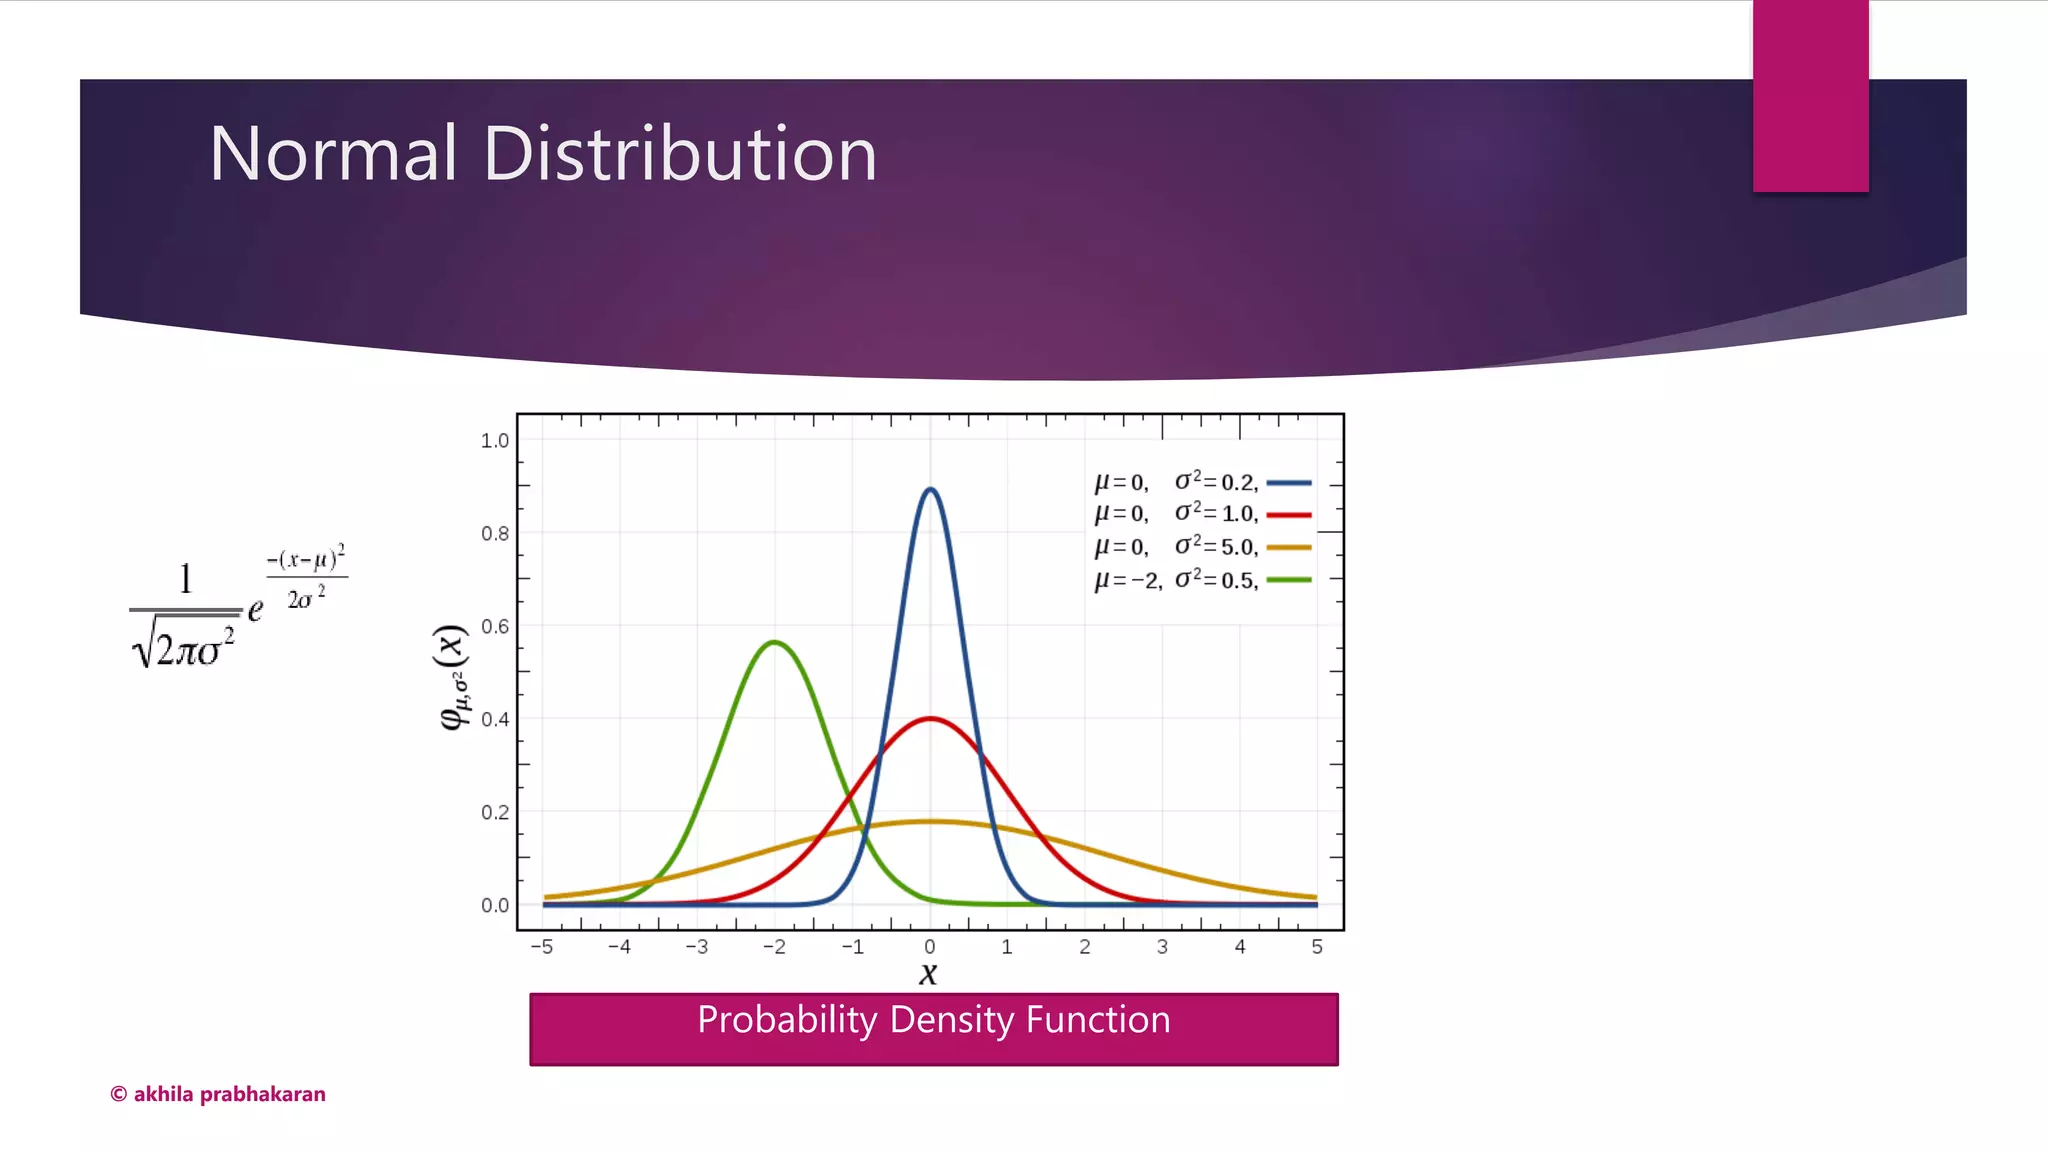
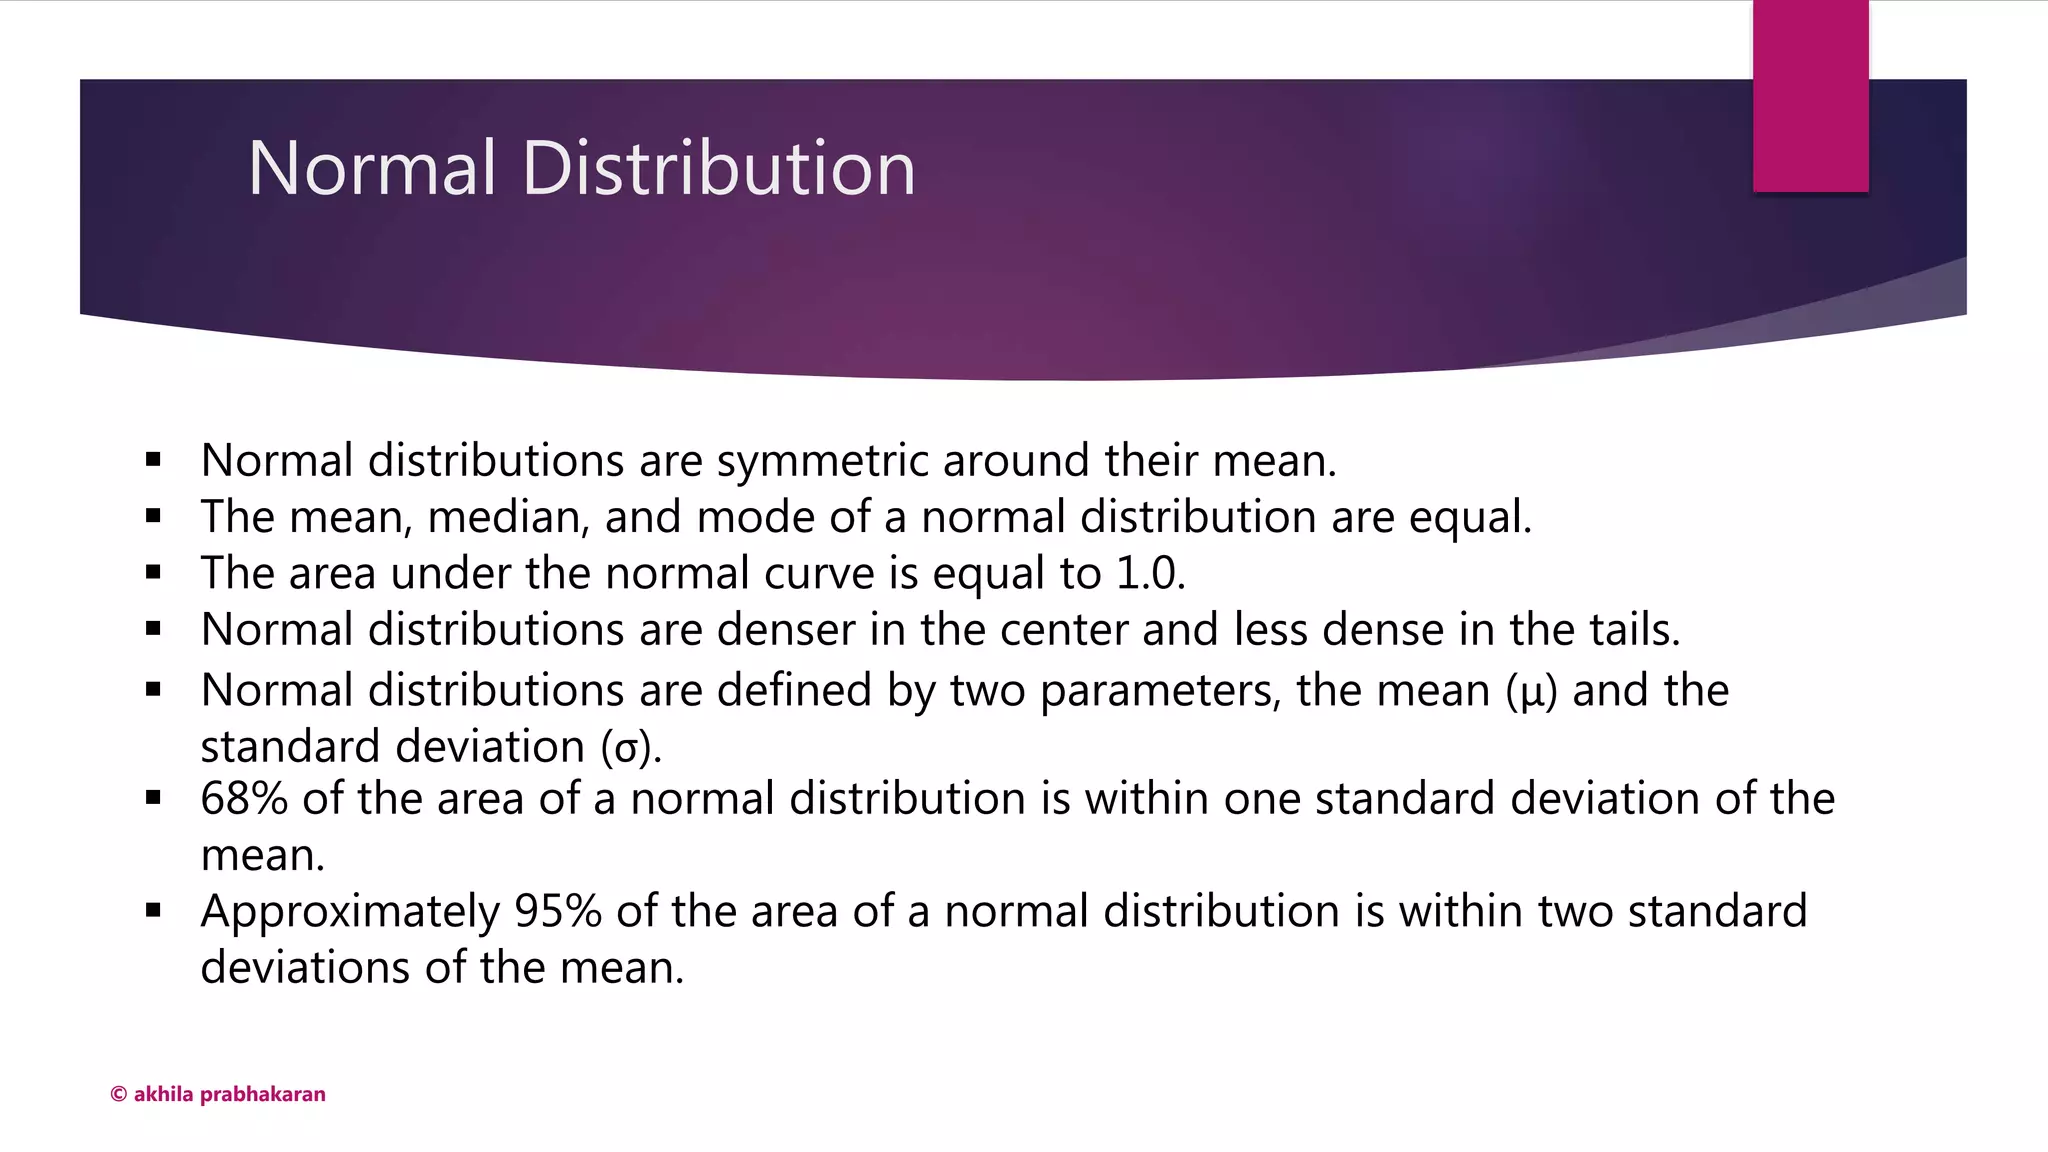
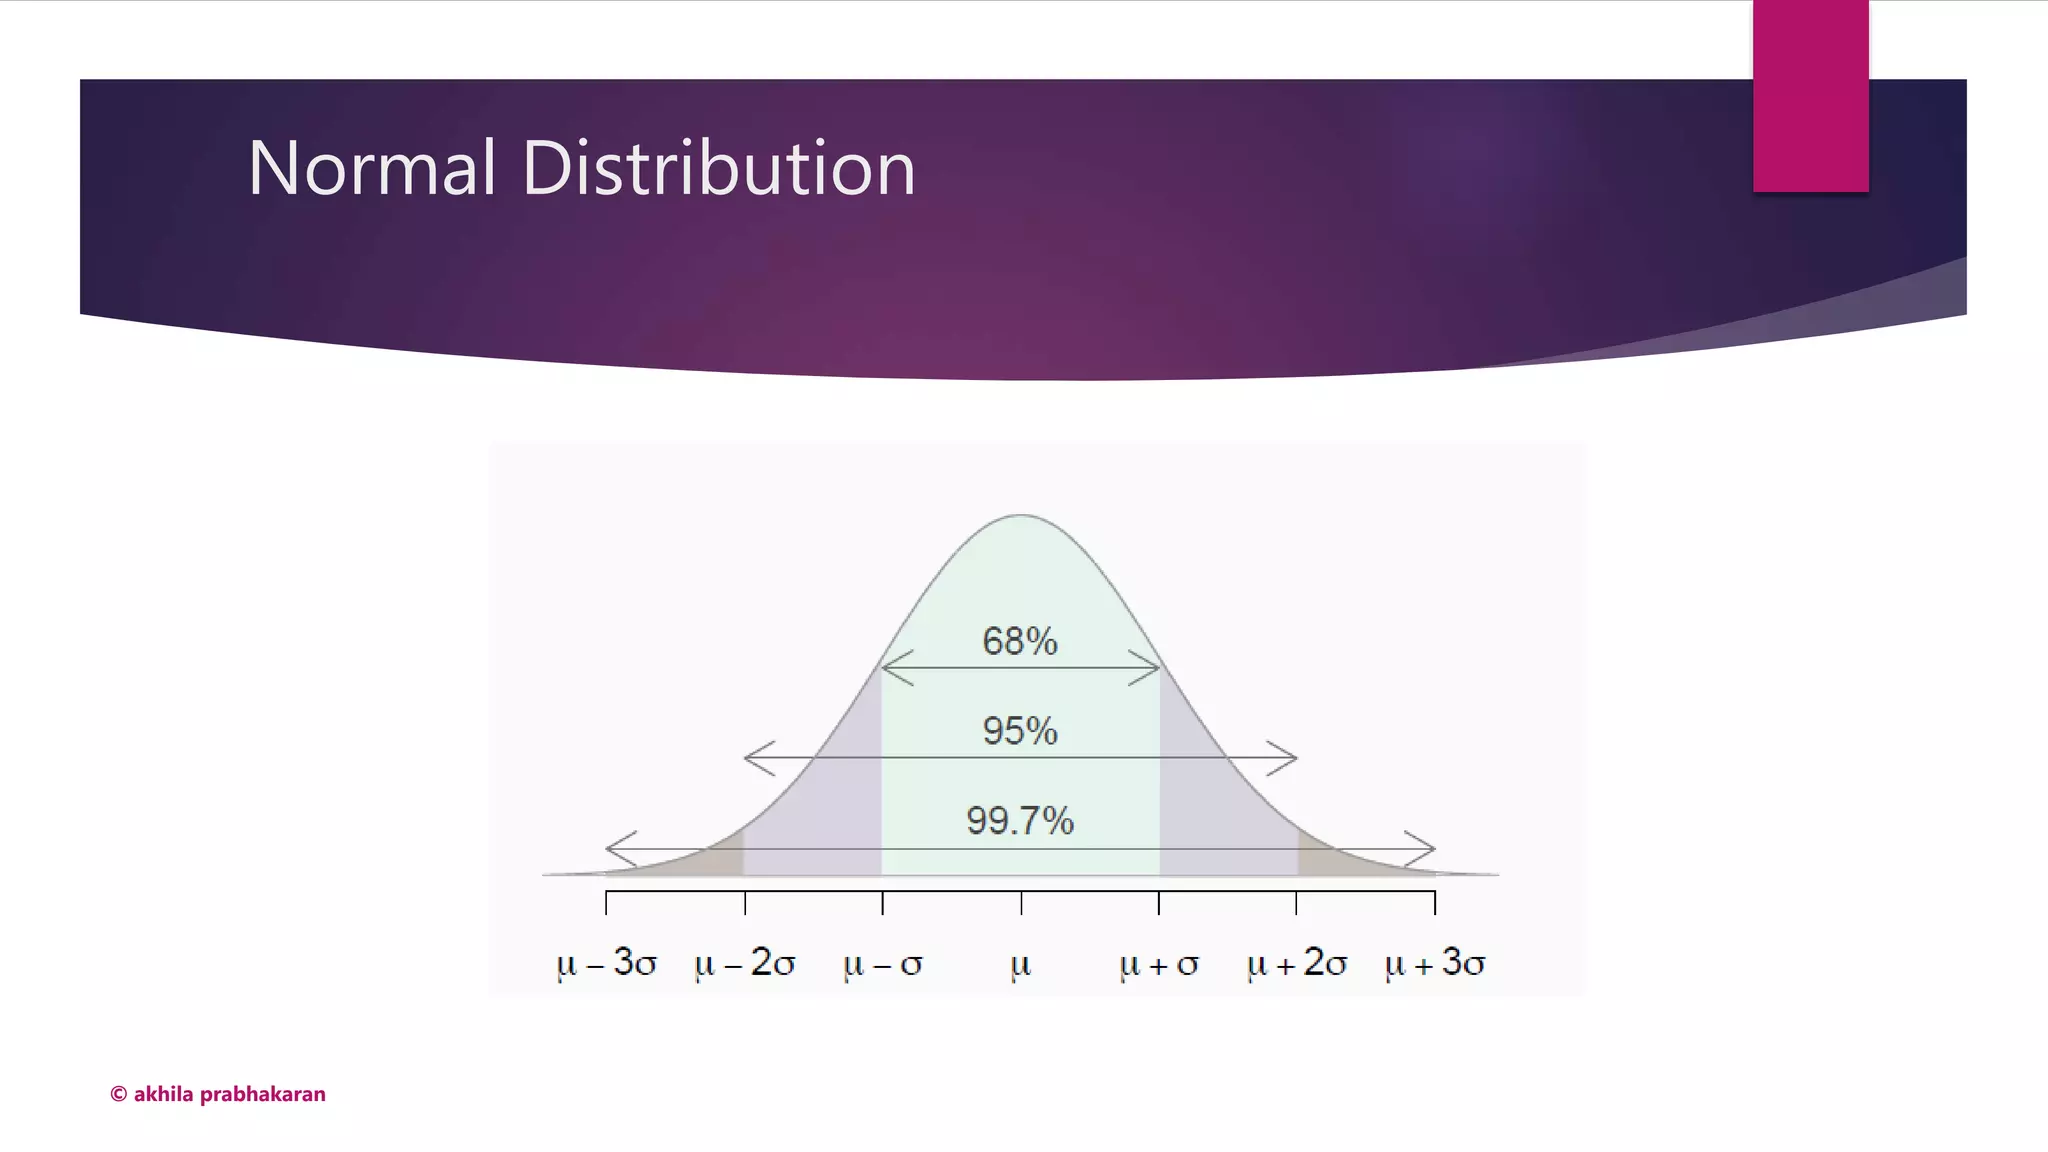
Characteristics of normal distributions including density functions and properties.
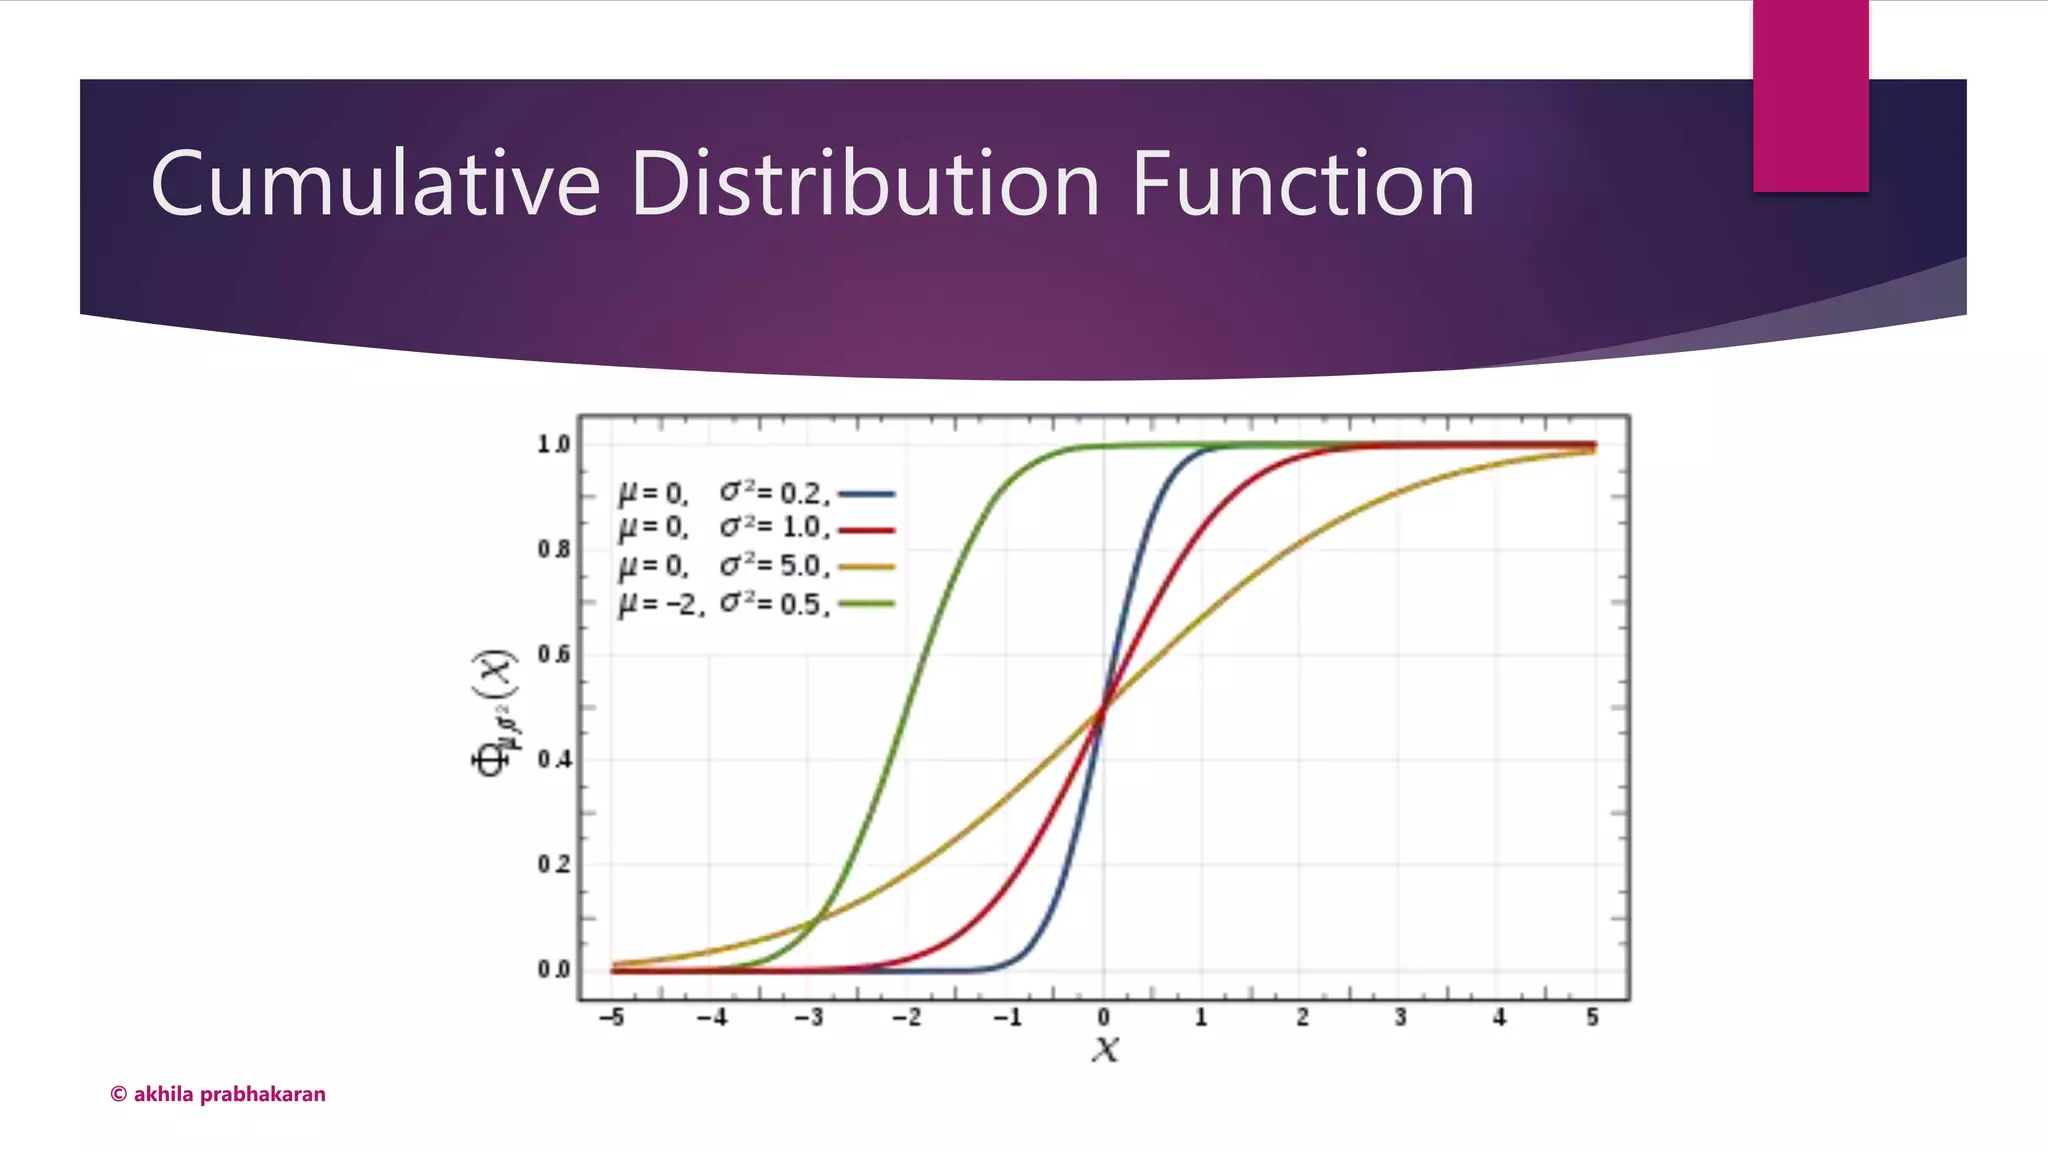
Understanding cumulative distribution function and details on properties of normal distribution.
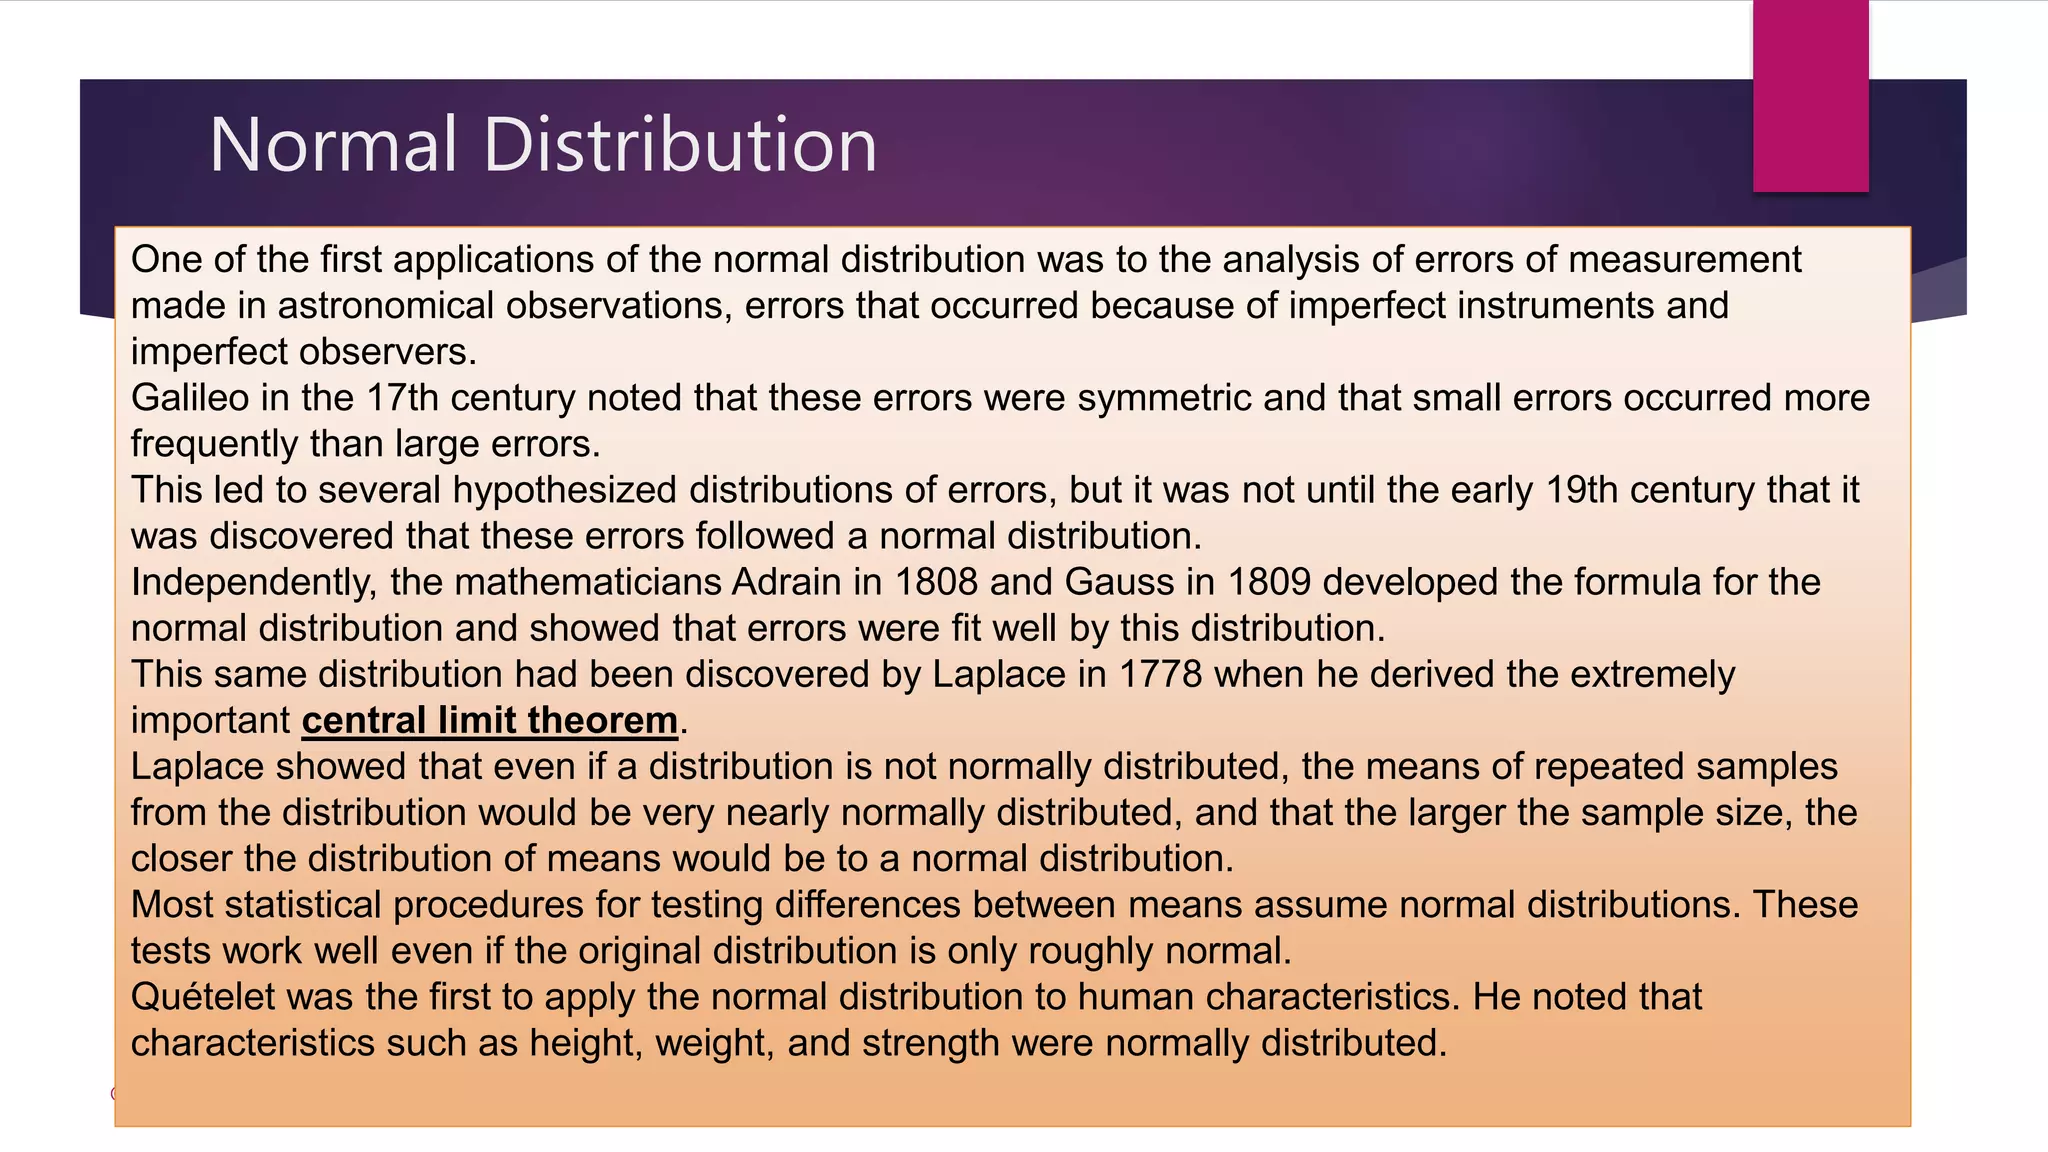
Historical context of normal distribution's use in statistical analysis and error measurement.
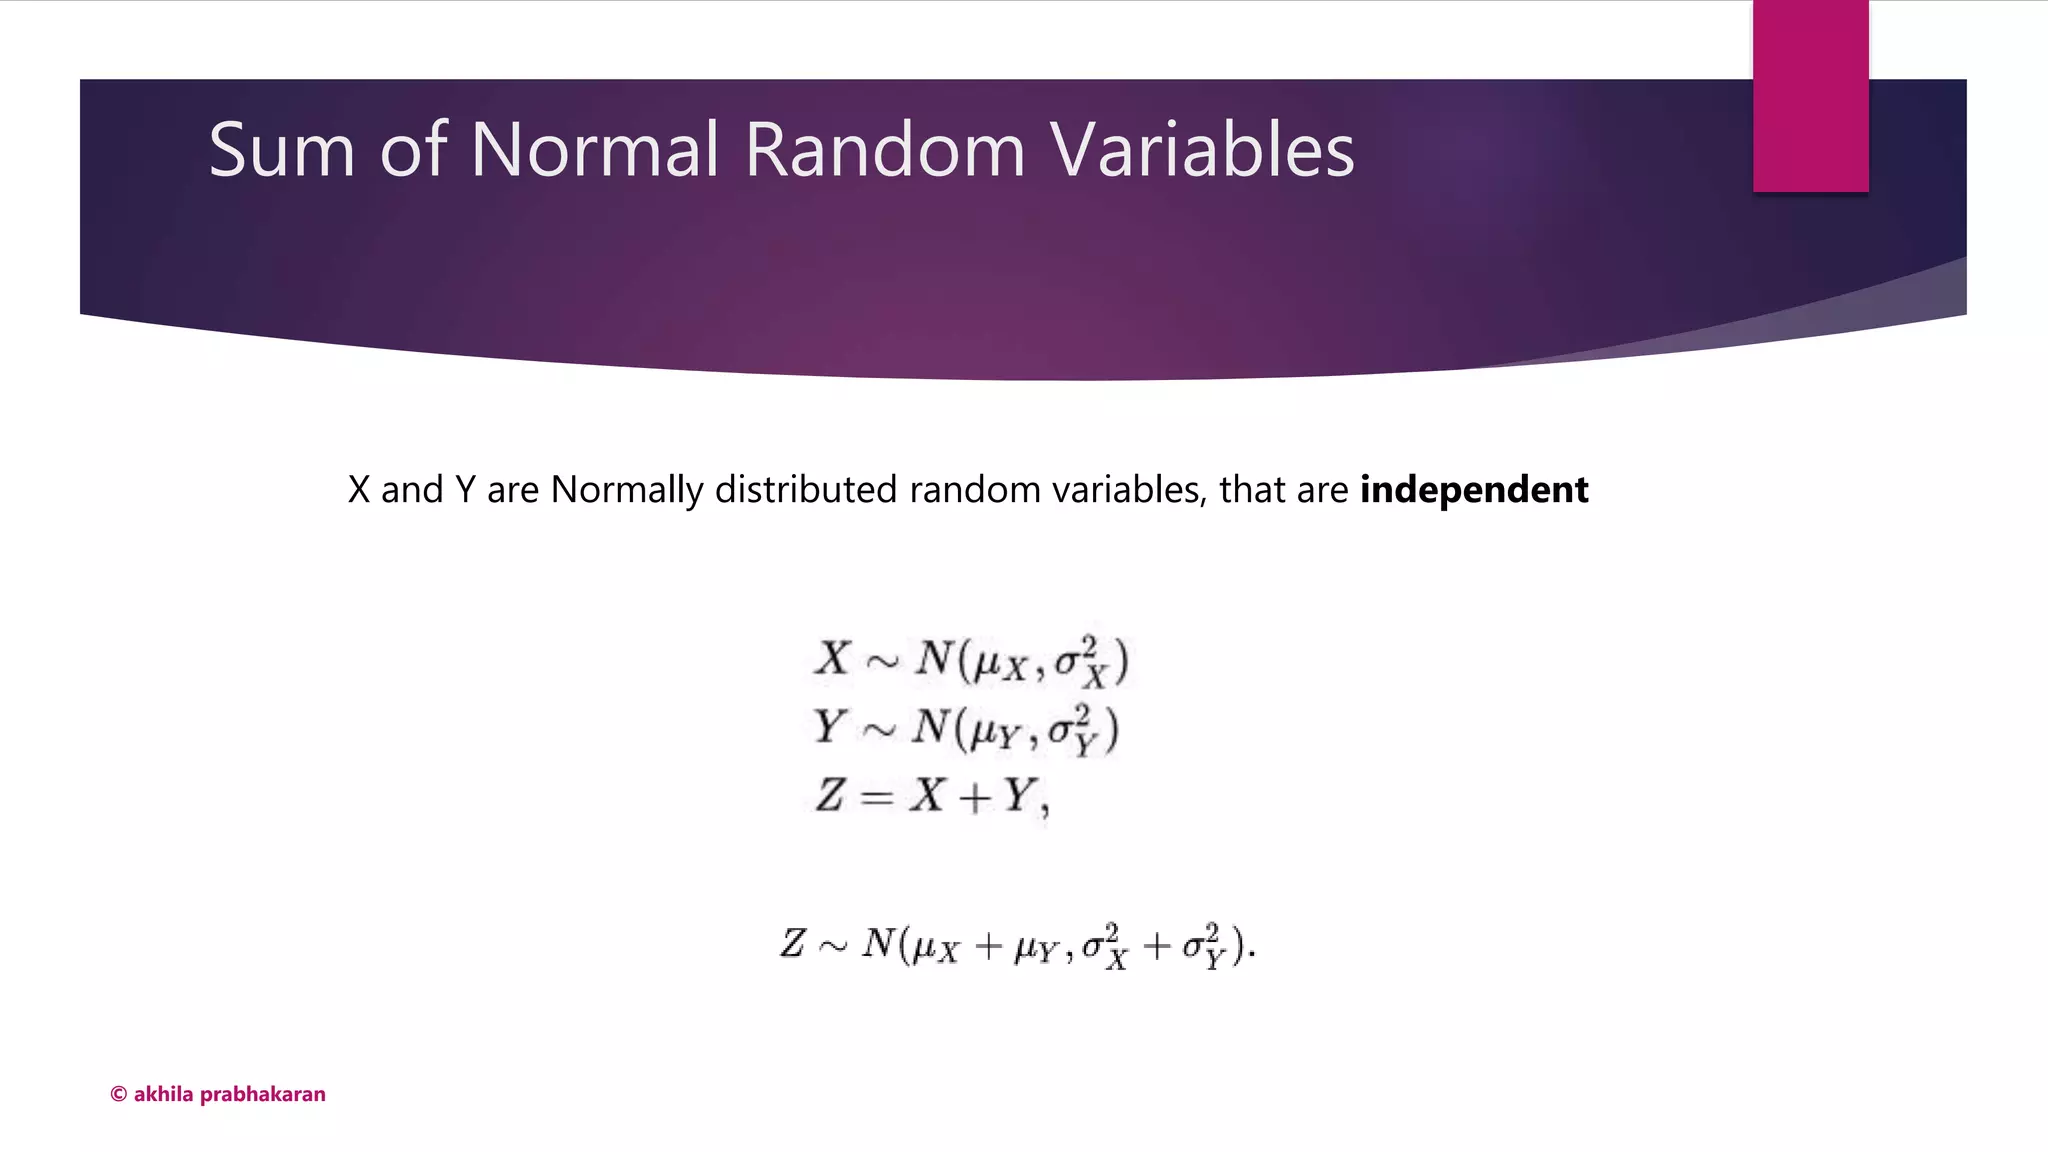
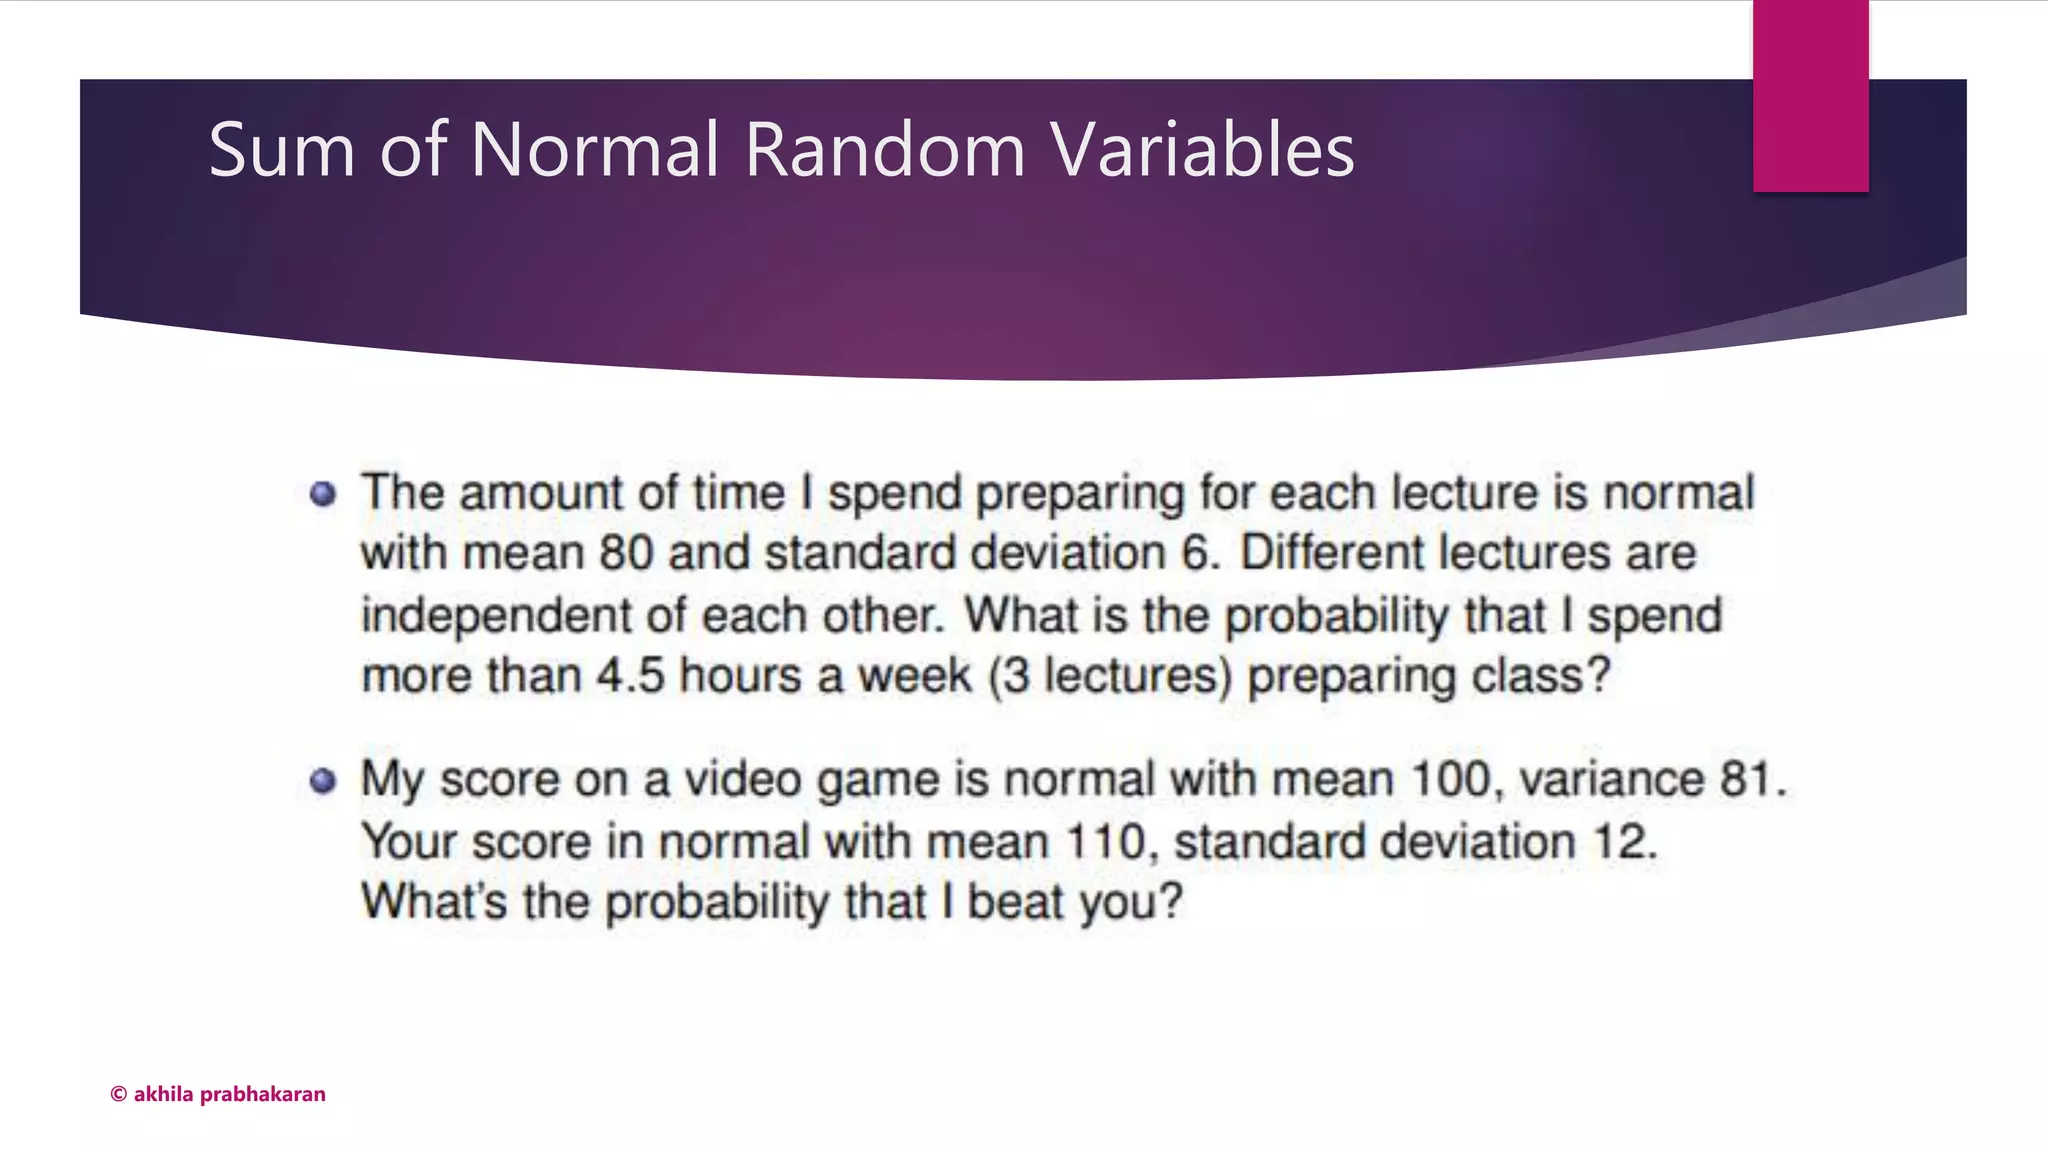
Probability calculations involving area under the normal curve, quantiles, and sums of normal random variables.
Definition and significance of degrees of freedom in statistical analysis.
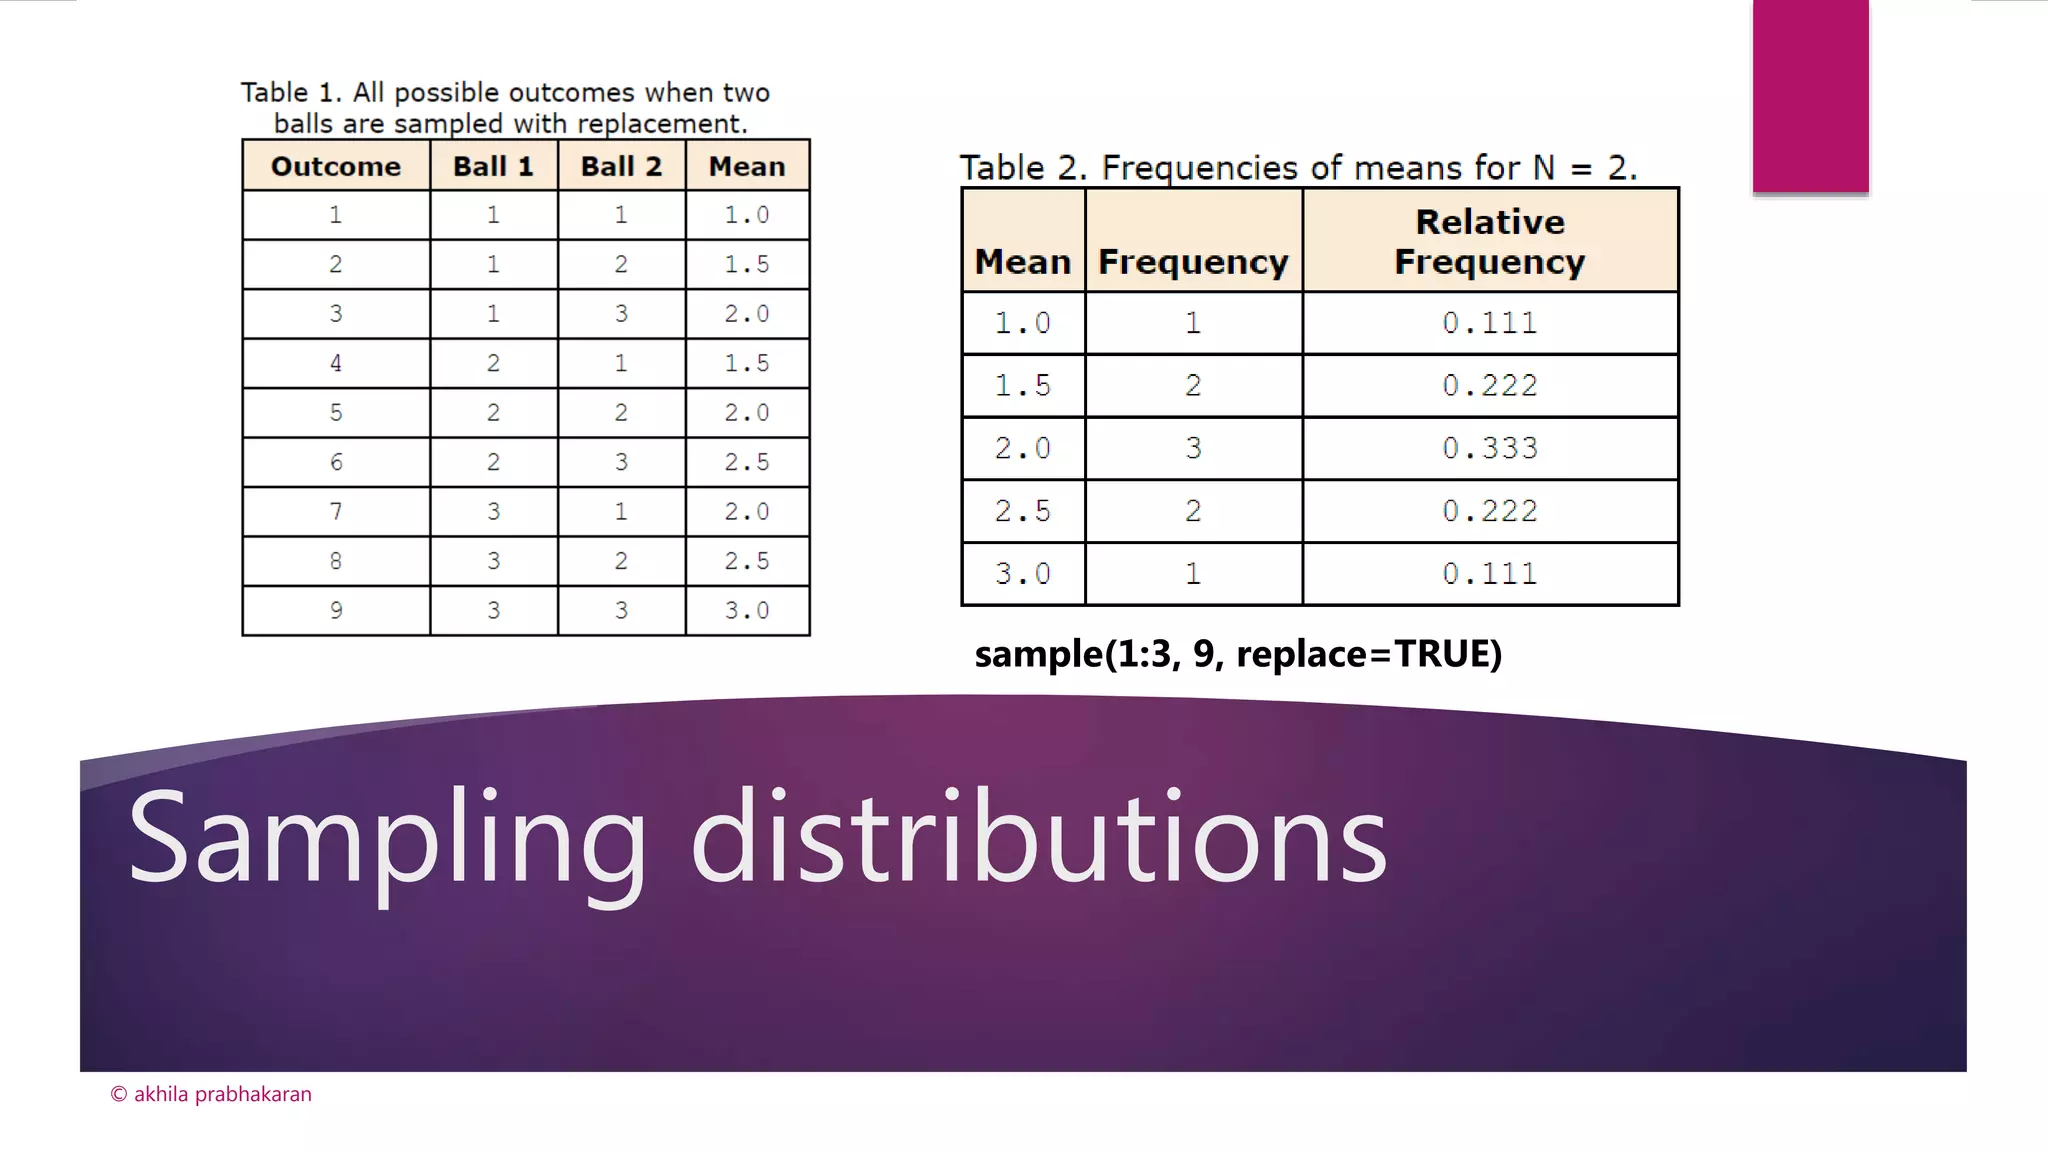
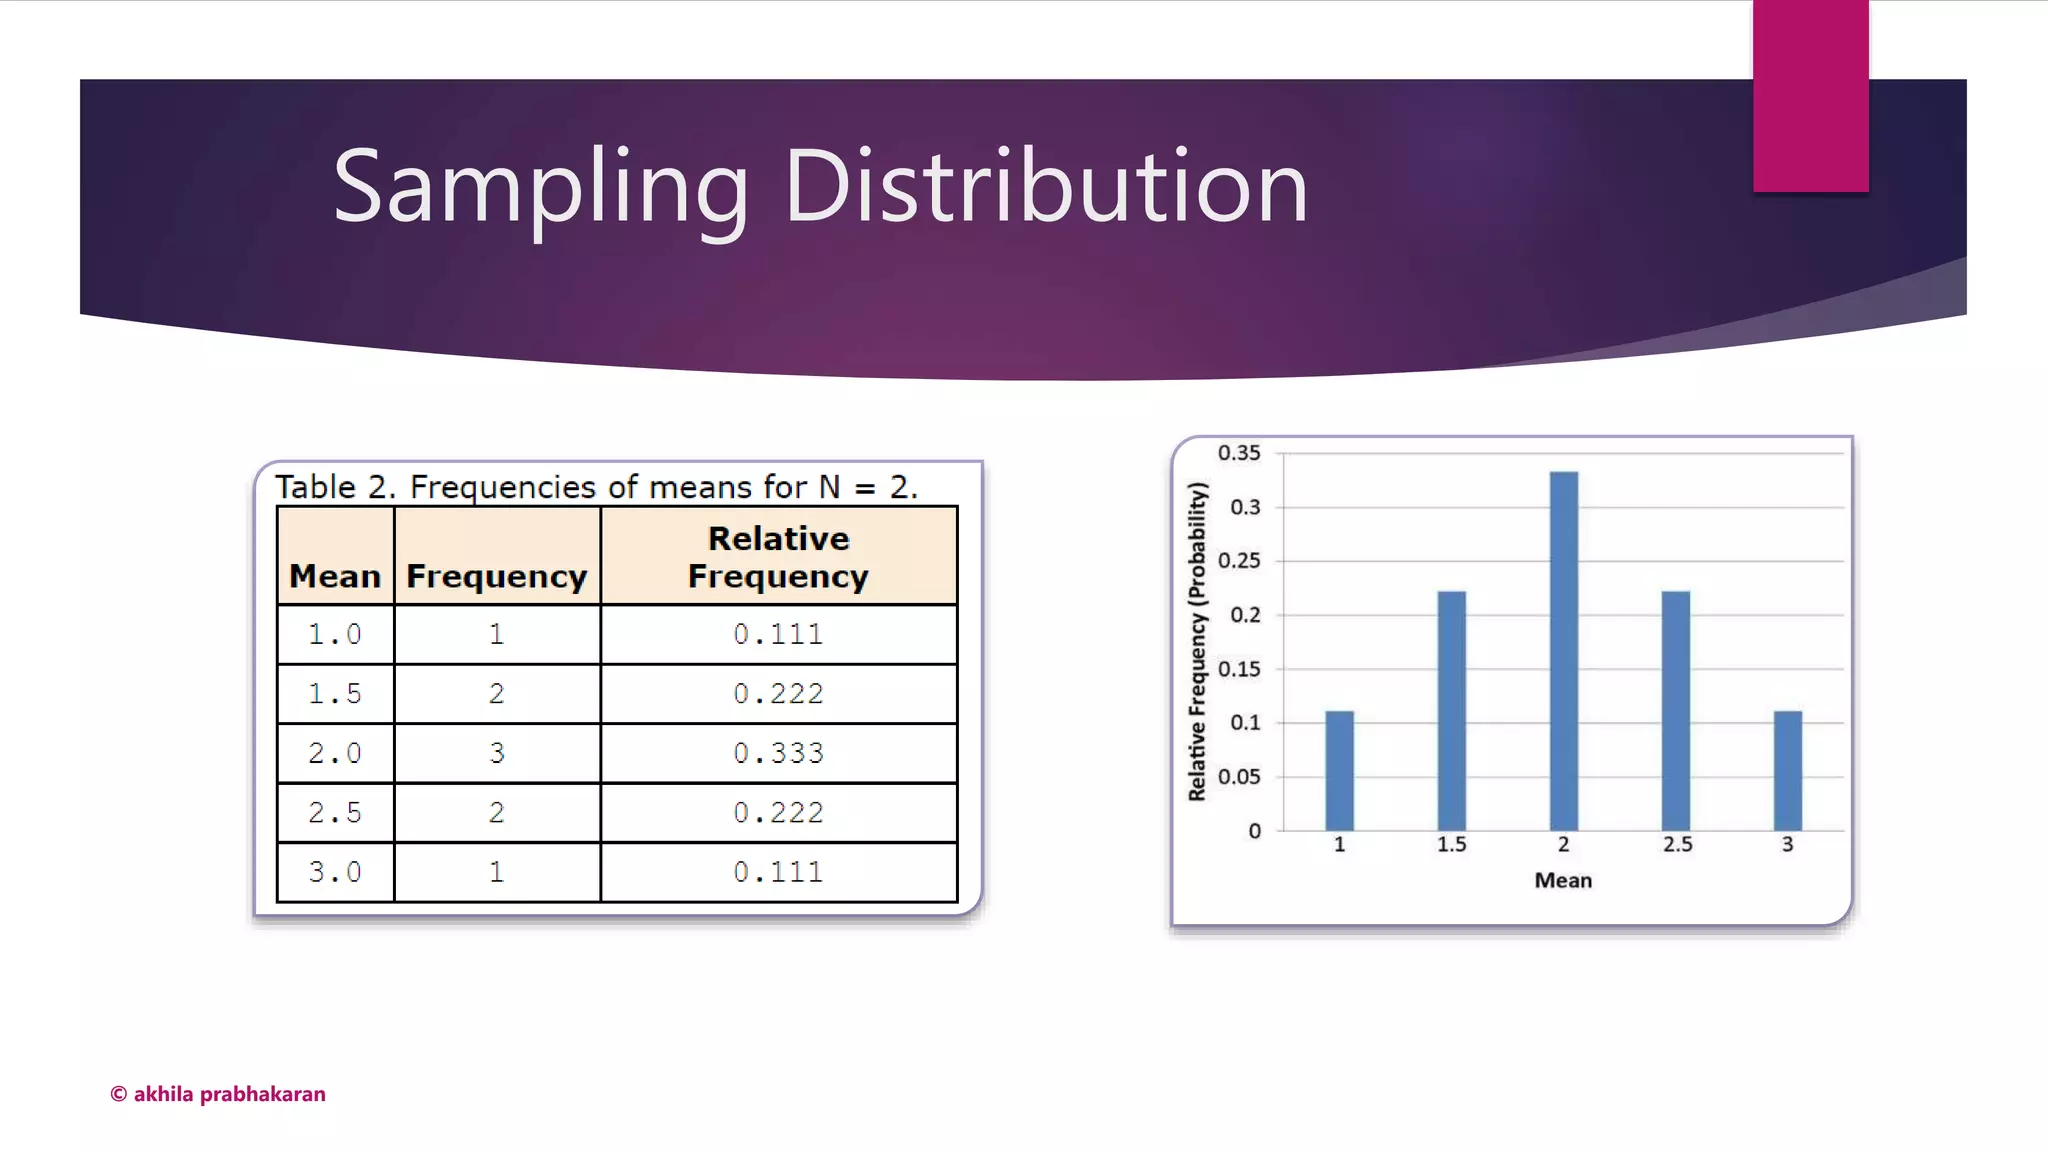
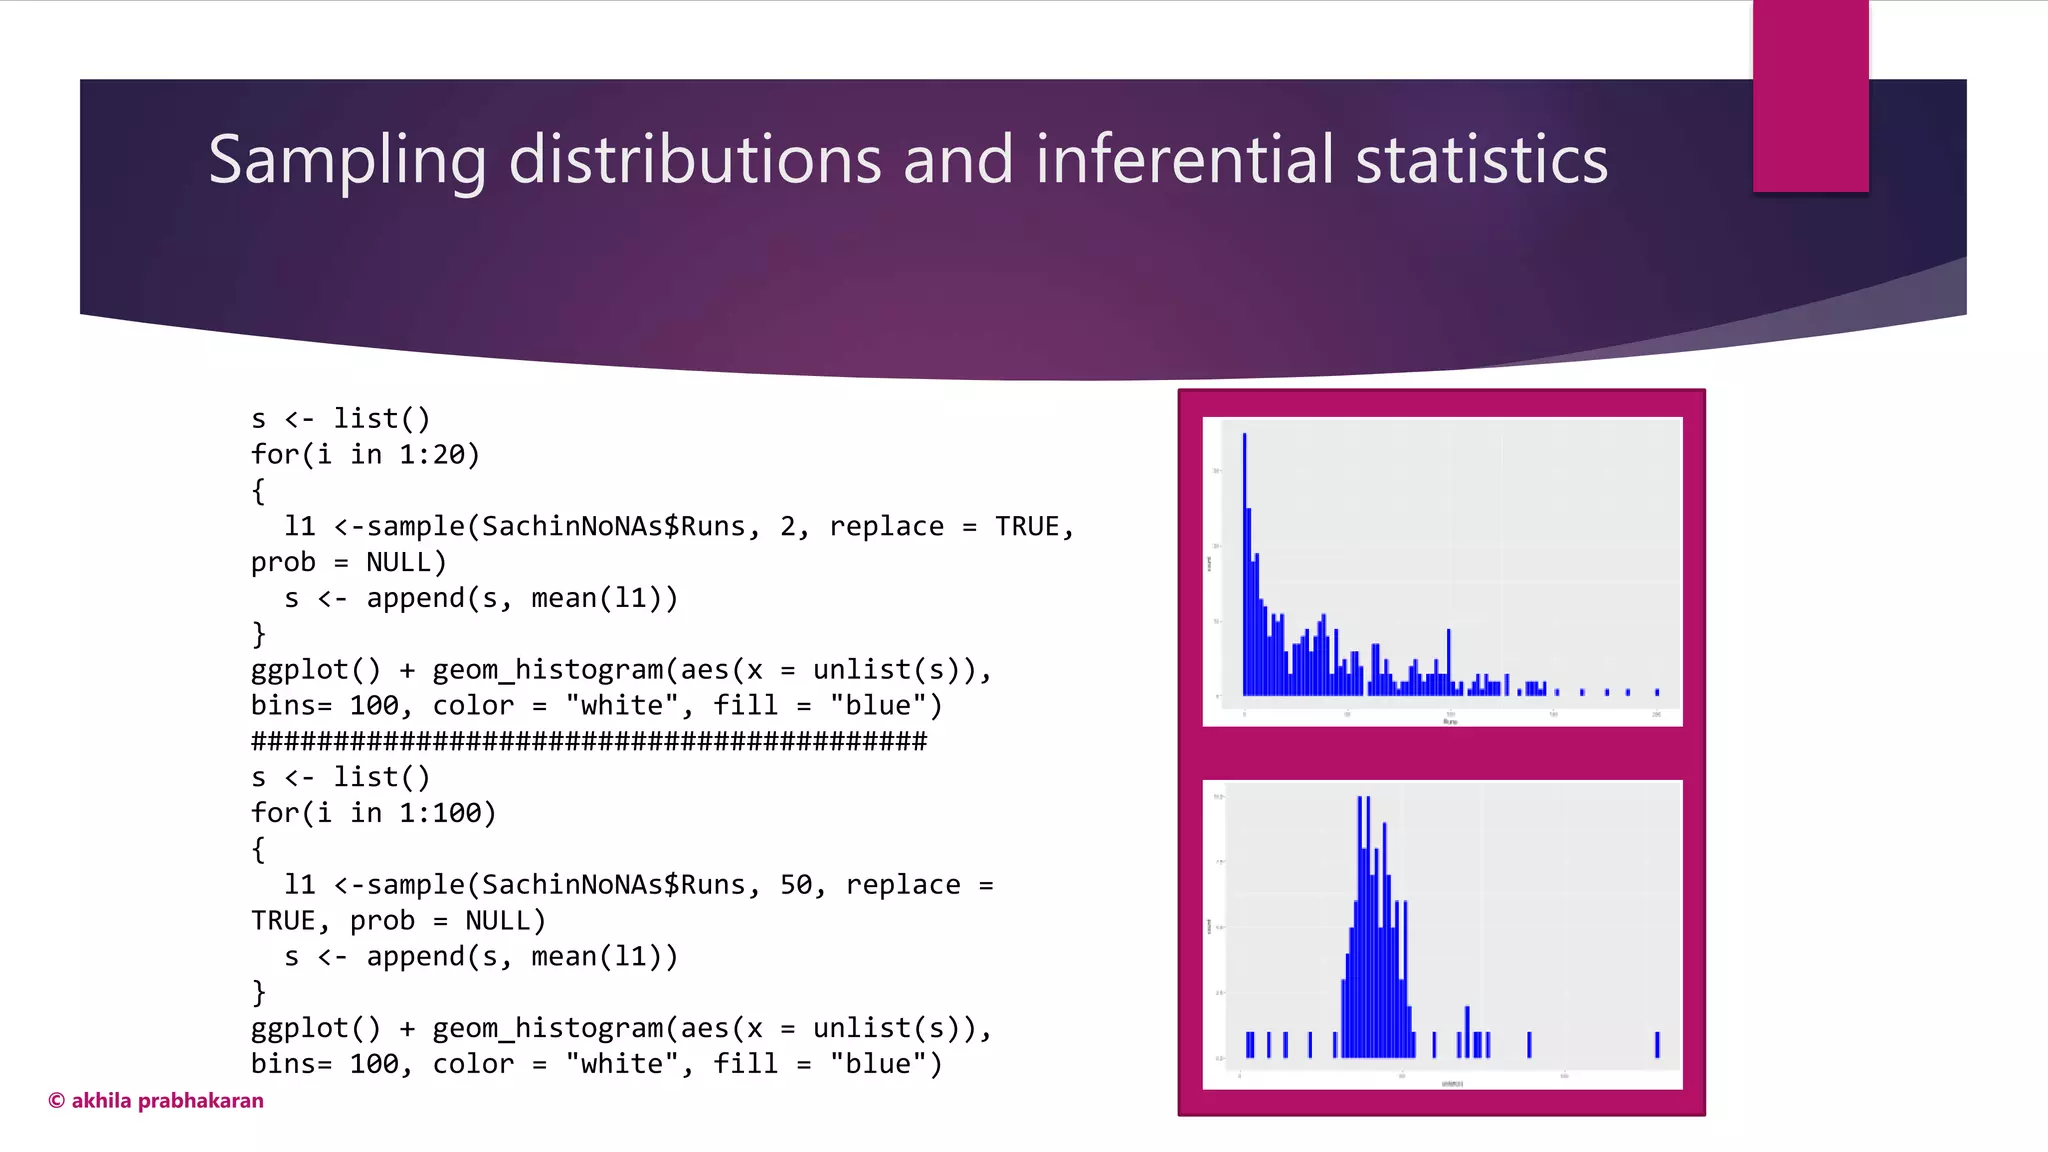
Introduction to inferential statistics and sampling distributions.
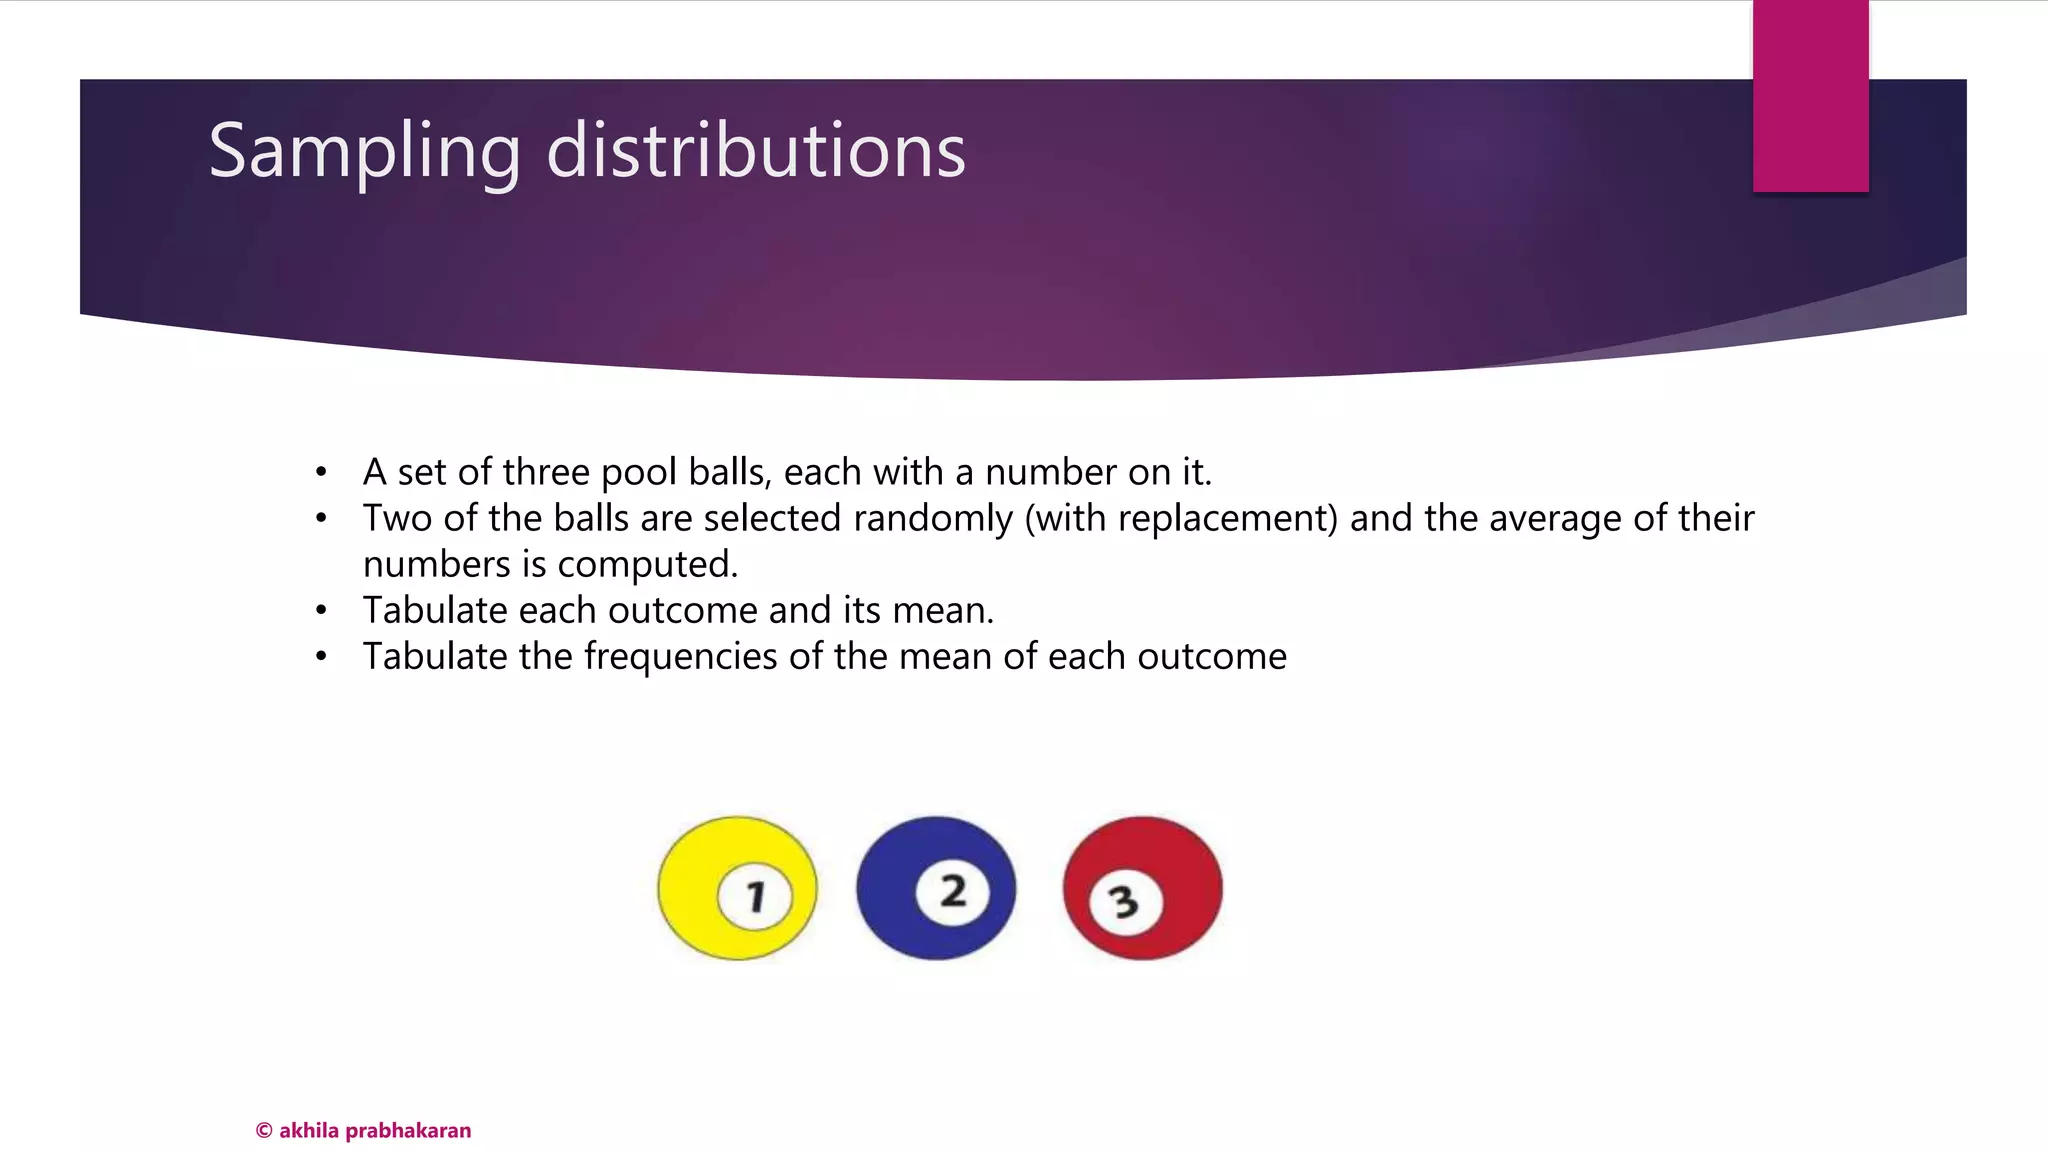
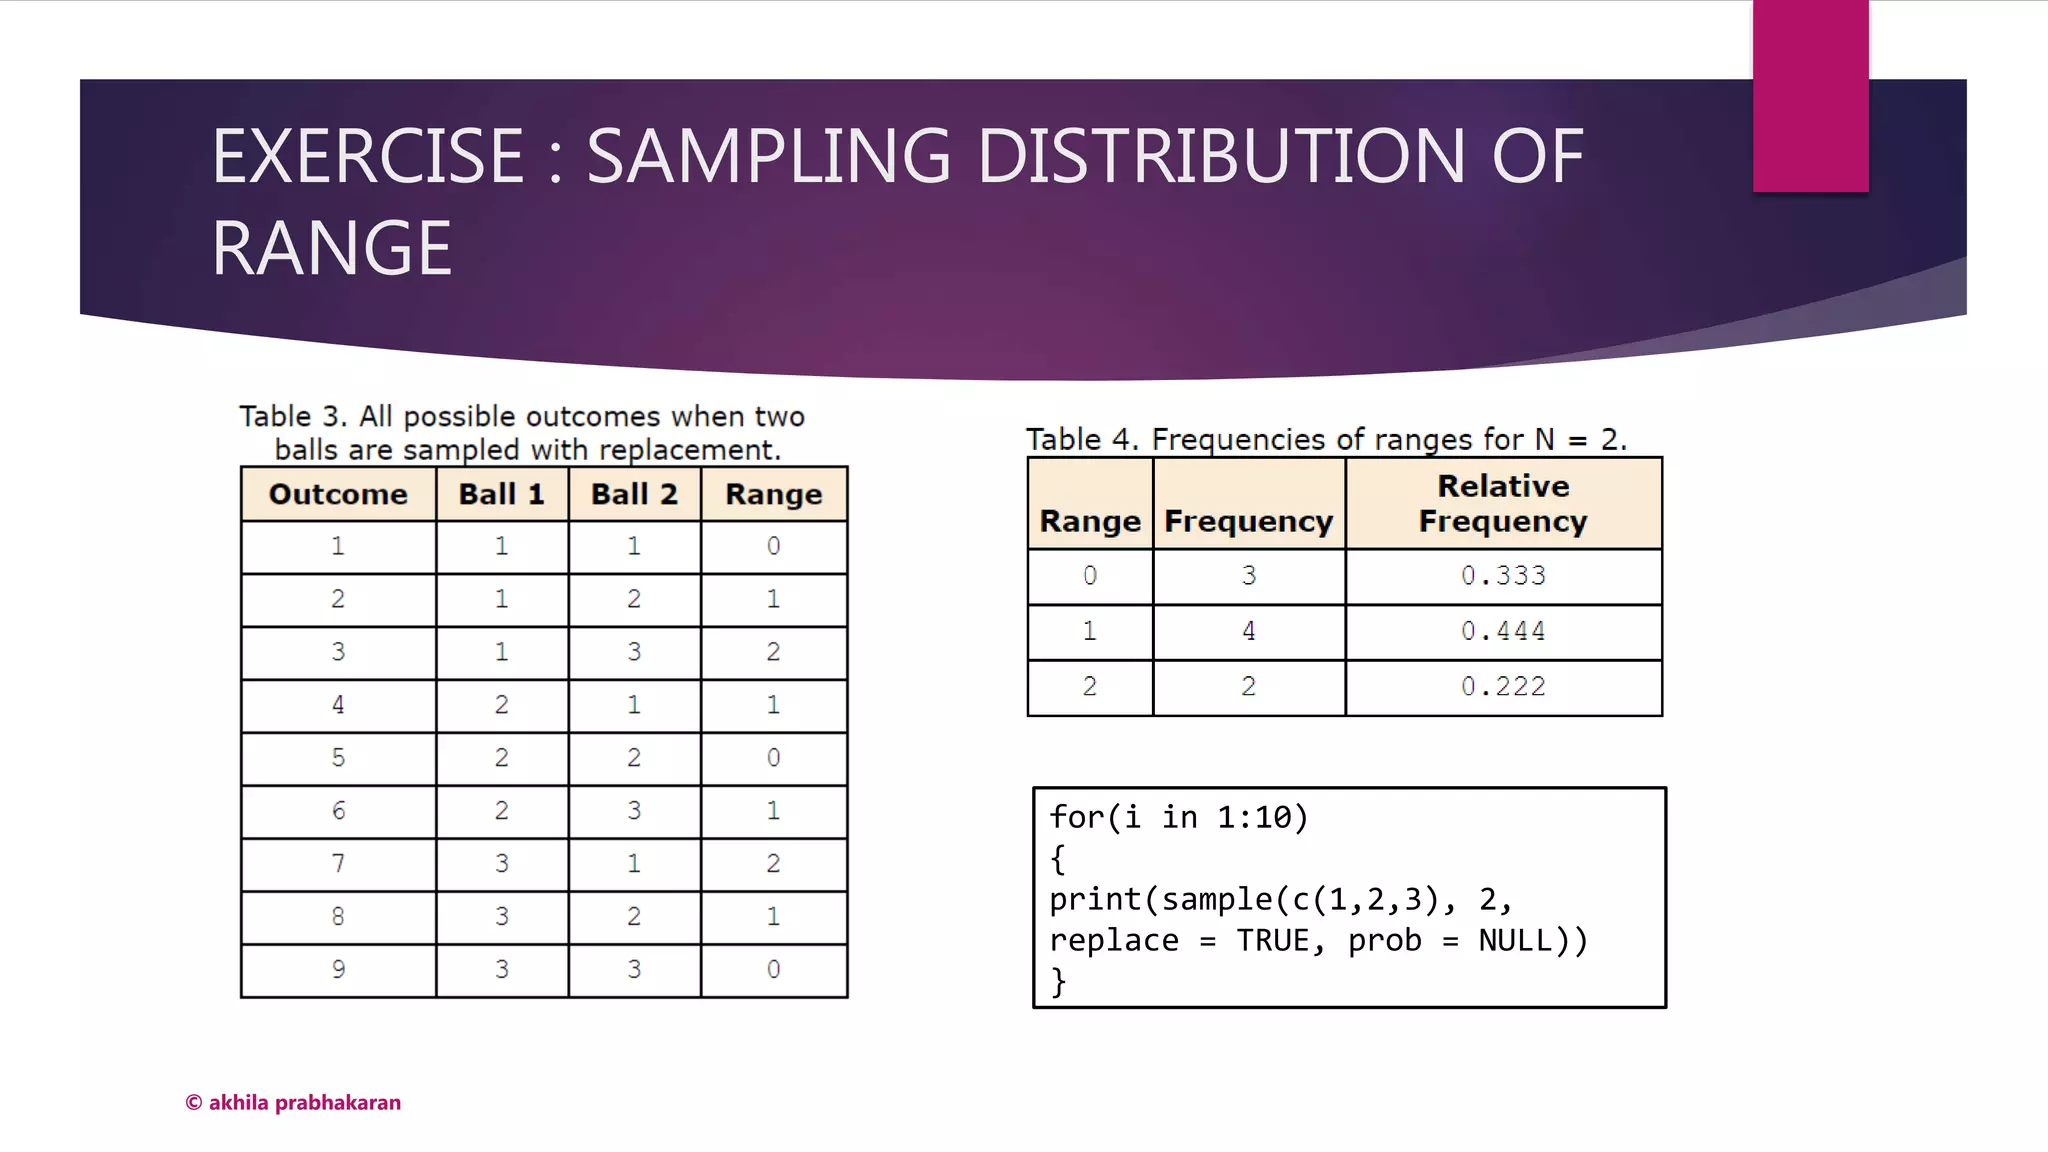
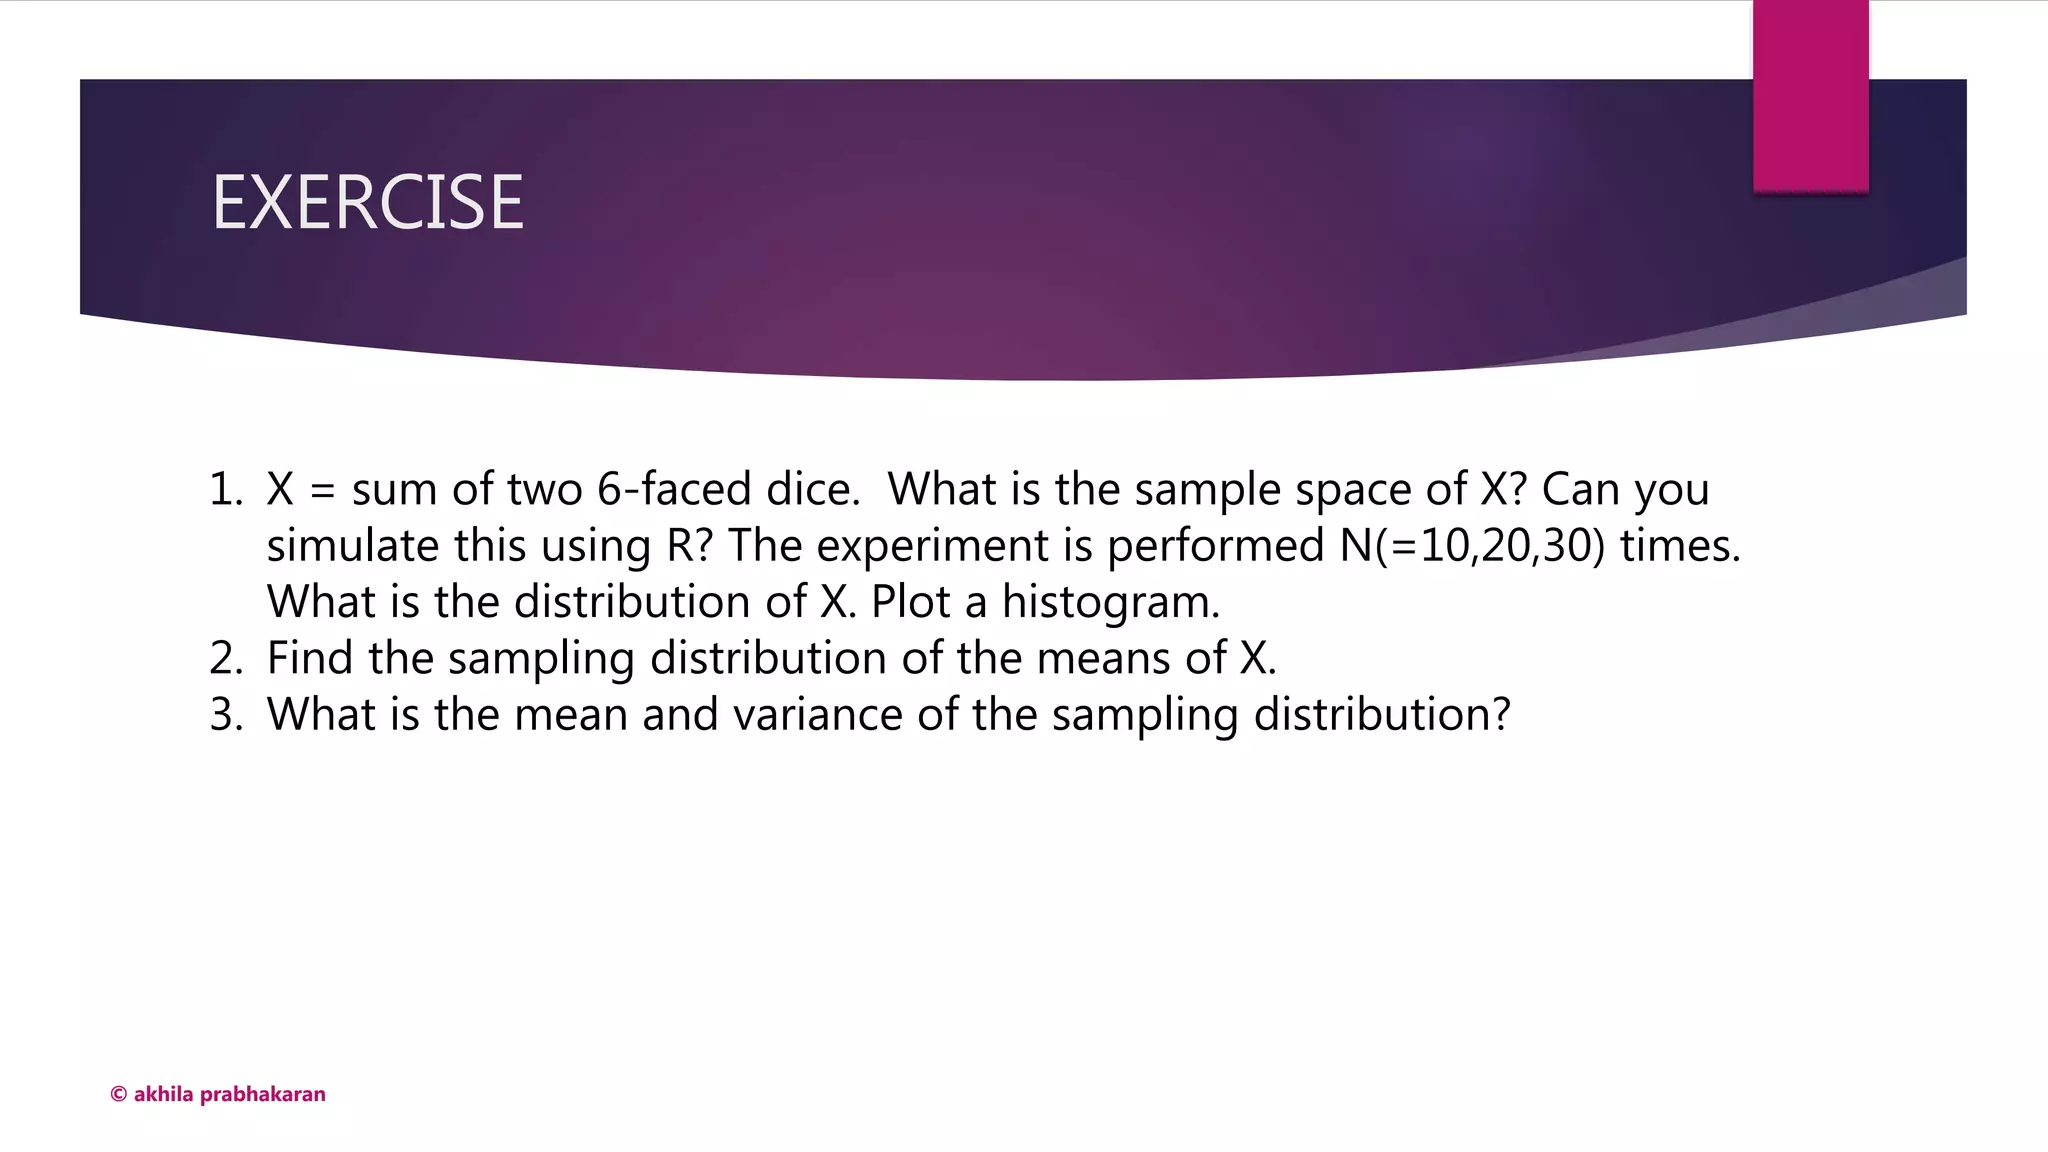
Exercises related to sampling distribution for understanding statistical analysis.
Concept of normal approximation to the binomial distribution with example problems.
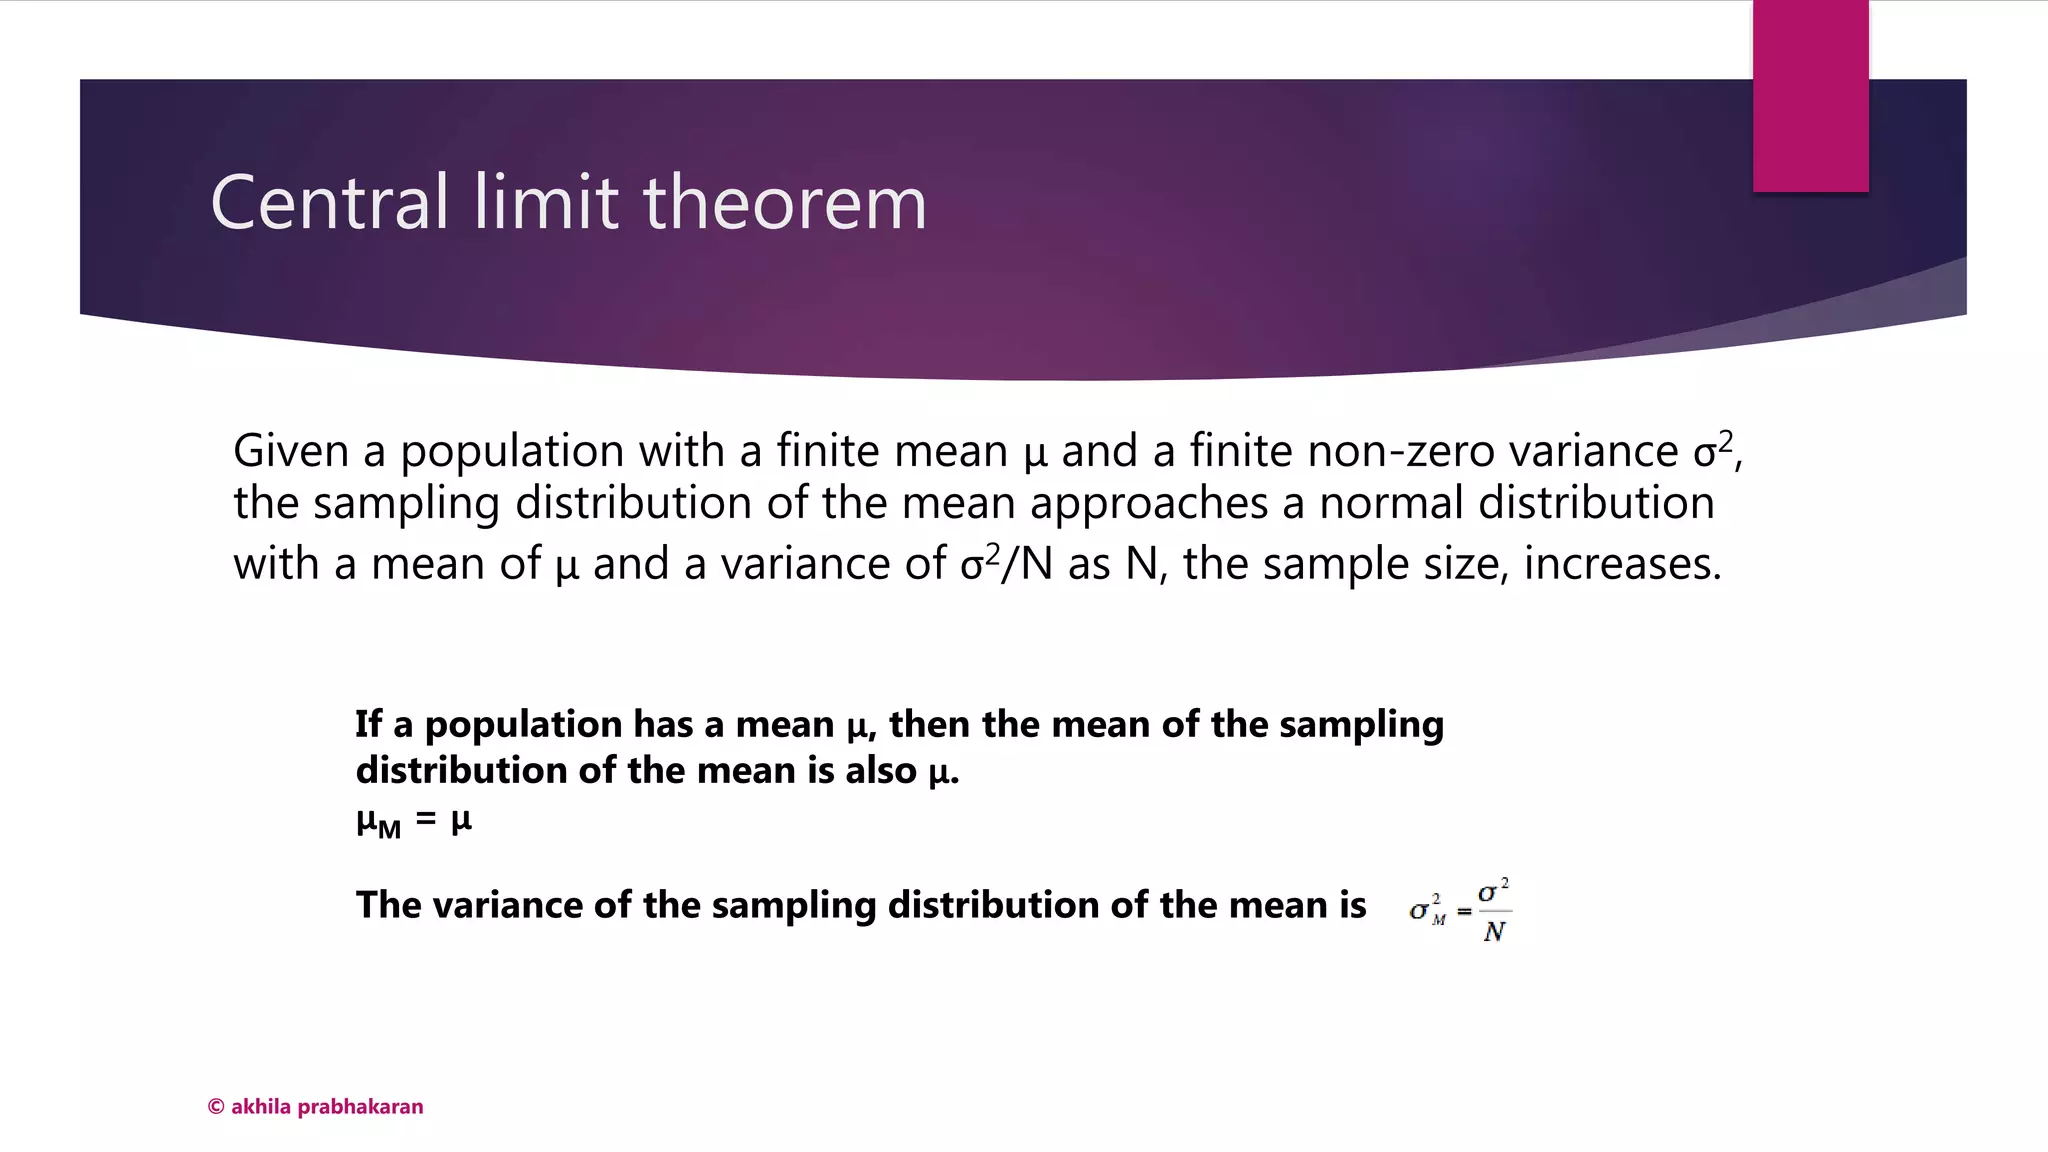
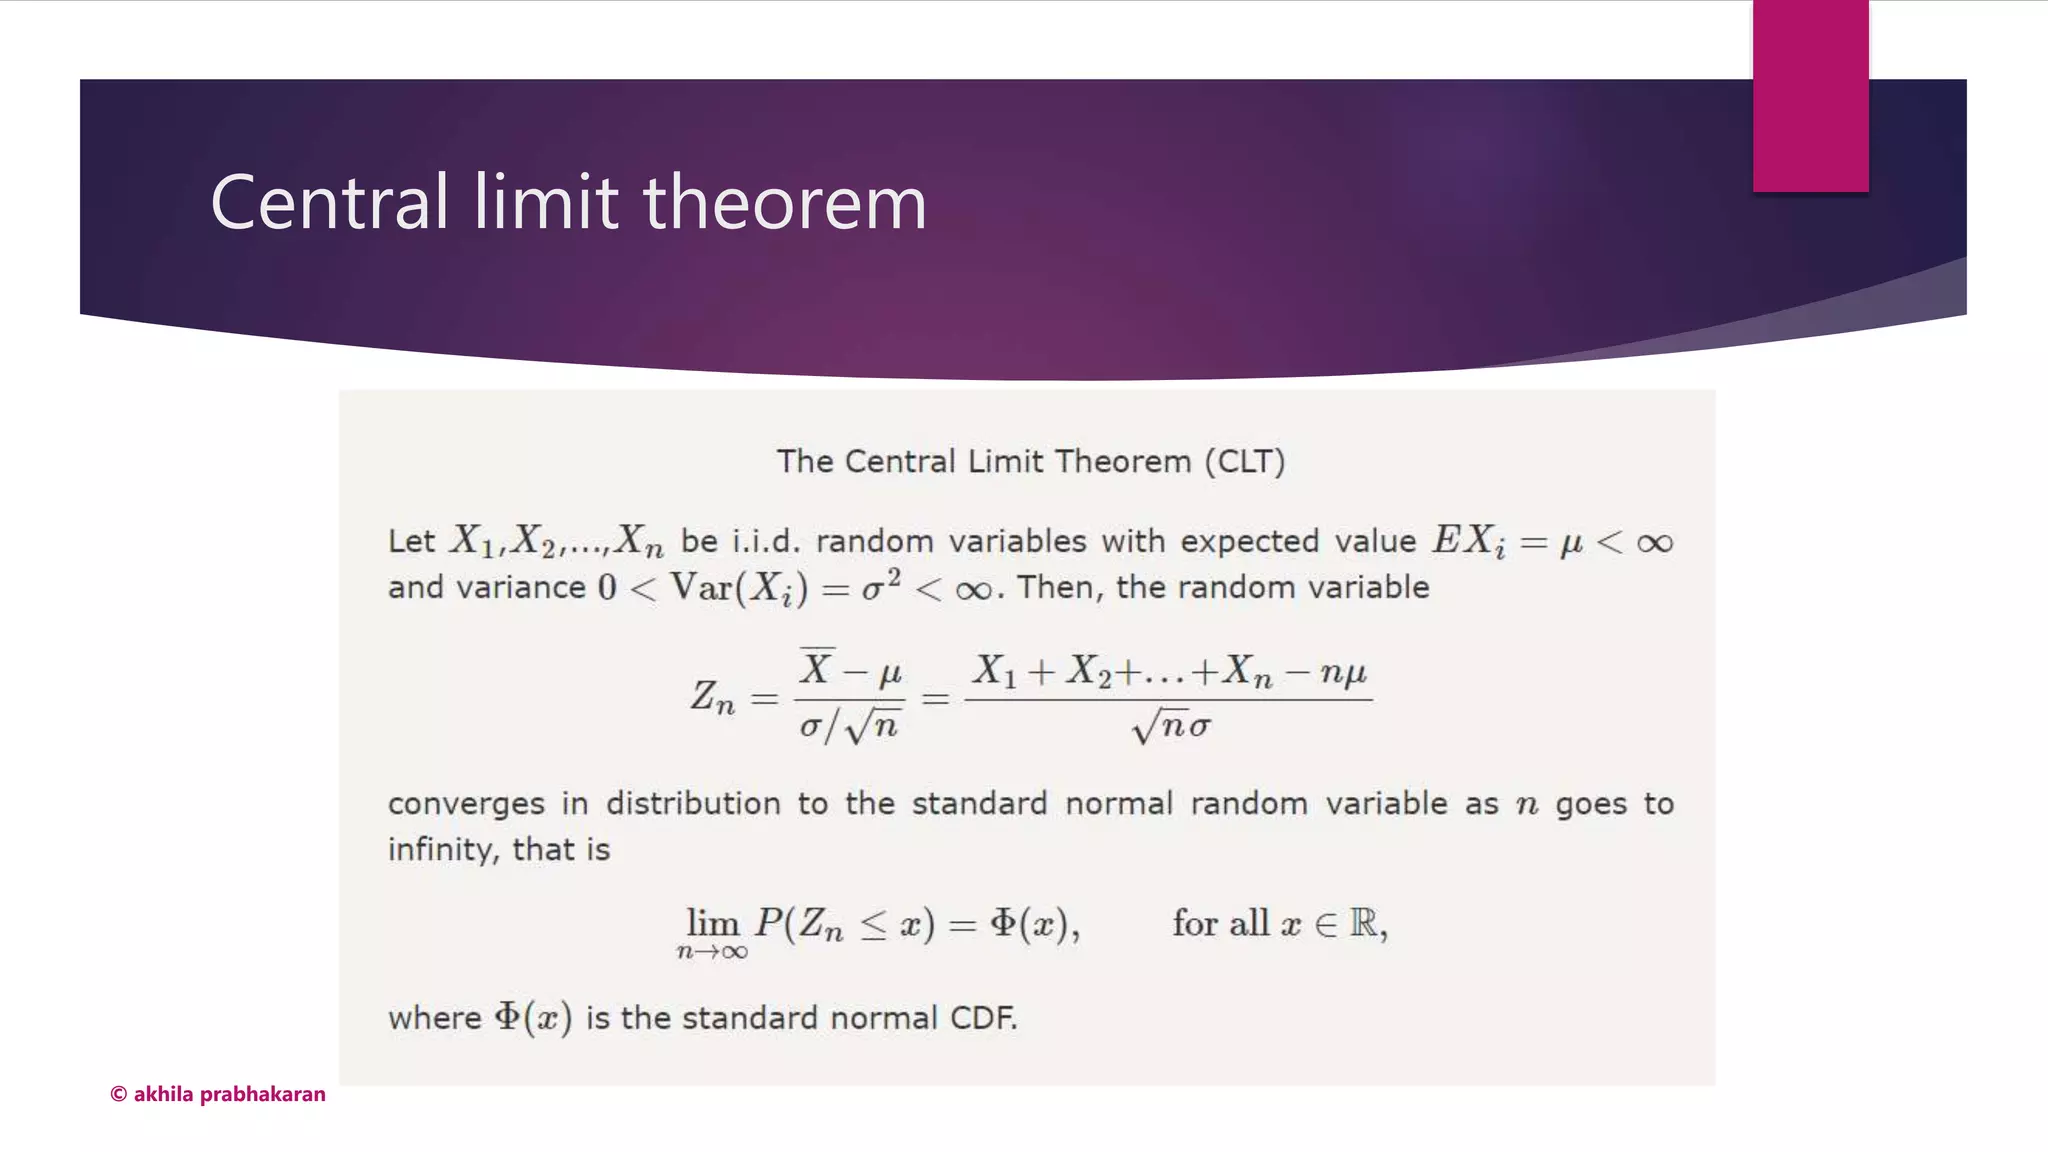
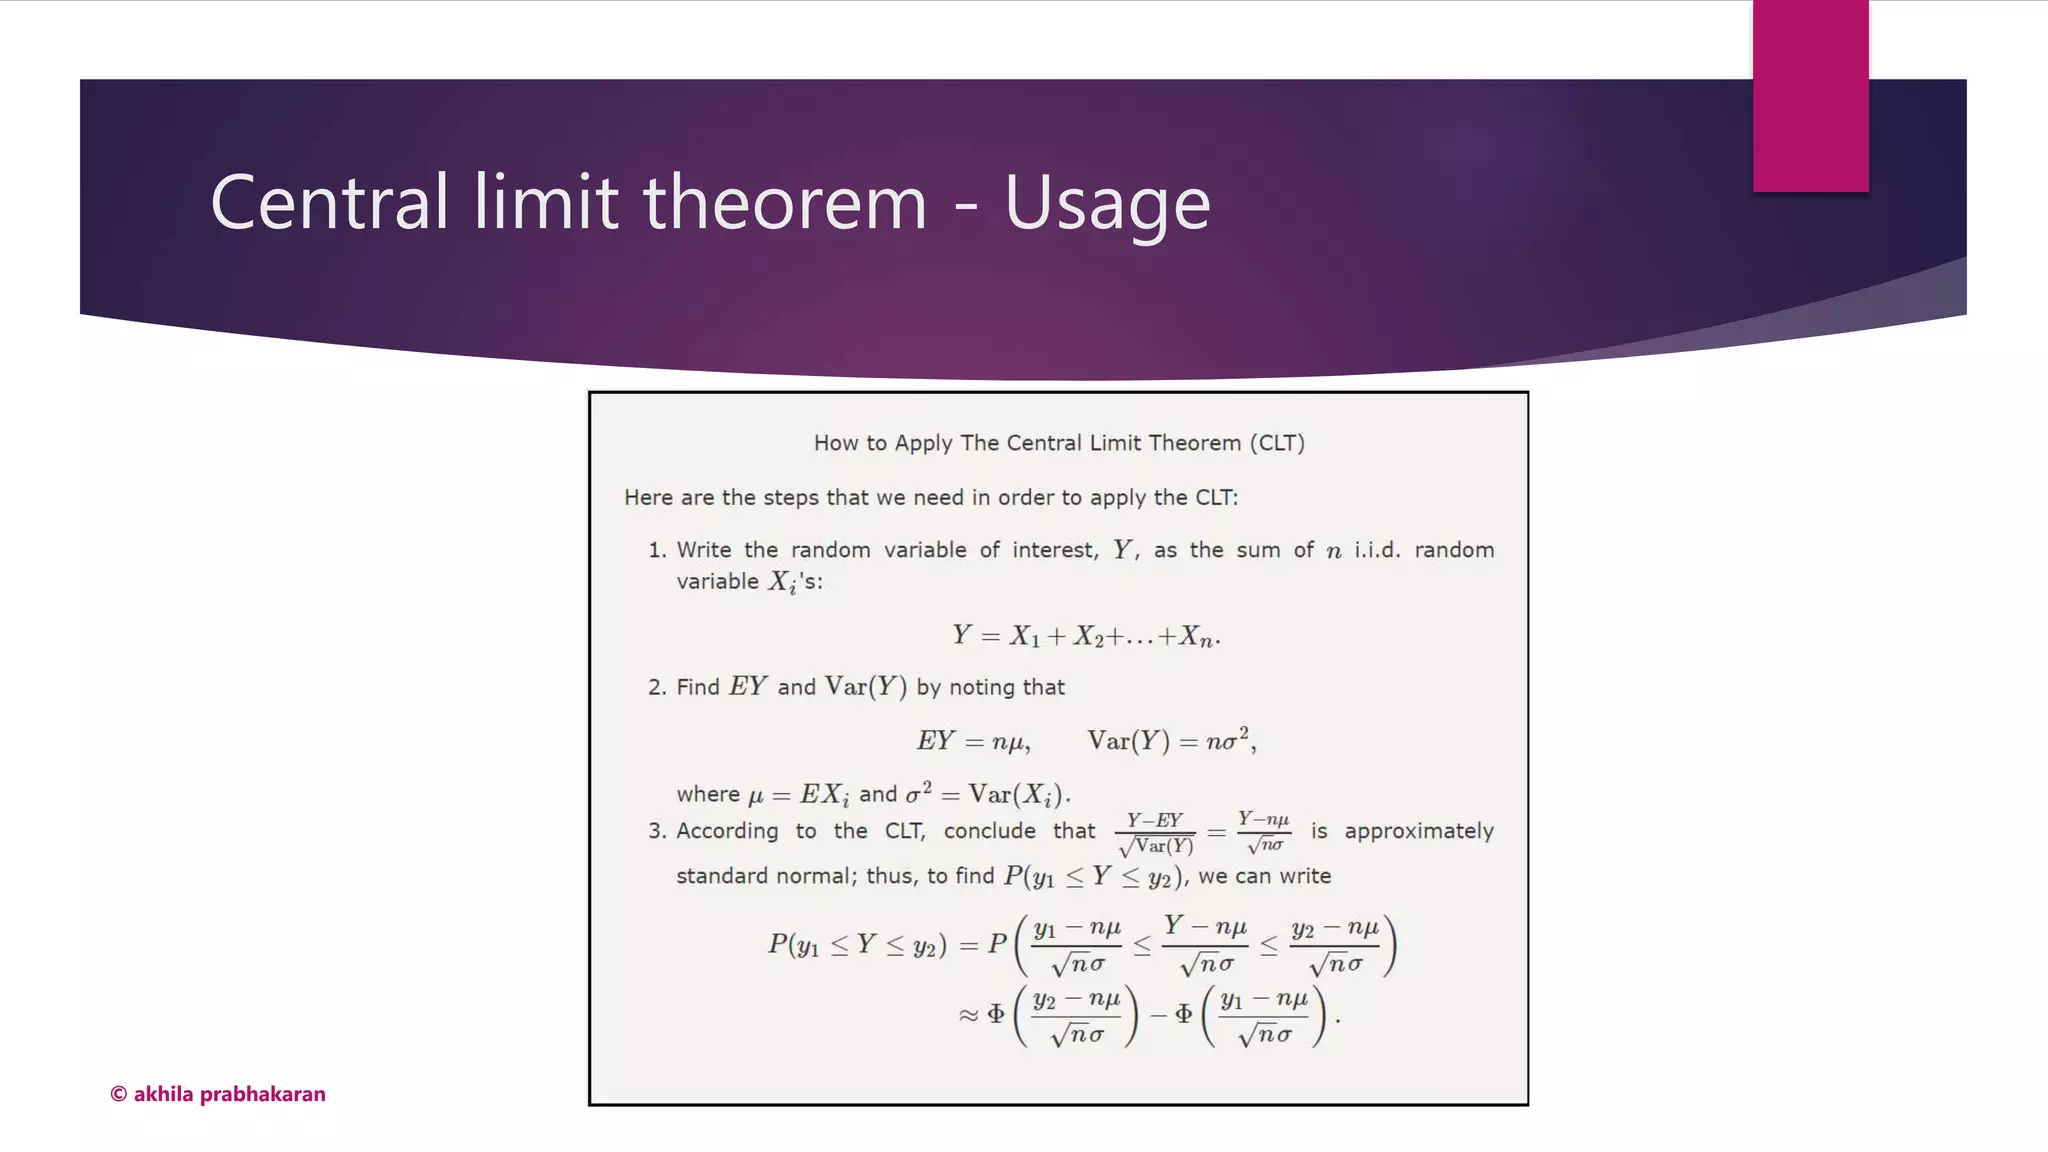
Understanding the central limit theorem and its implications for sampling distributions.
Applications of the central limit theorem to real-world problems involving sampling.
Introduction to chi-square distribution, its properties and calculations.
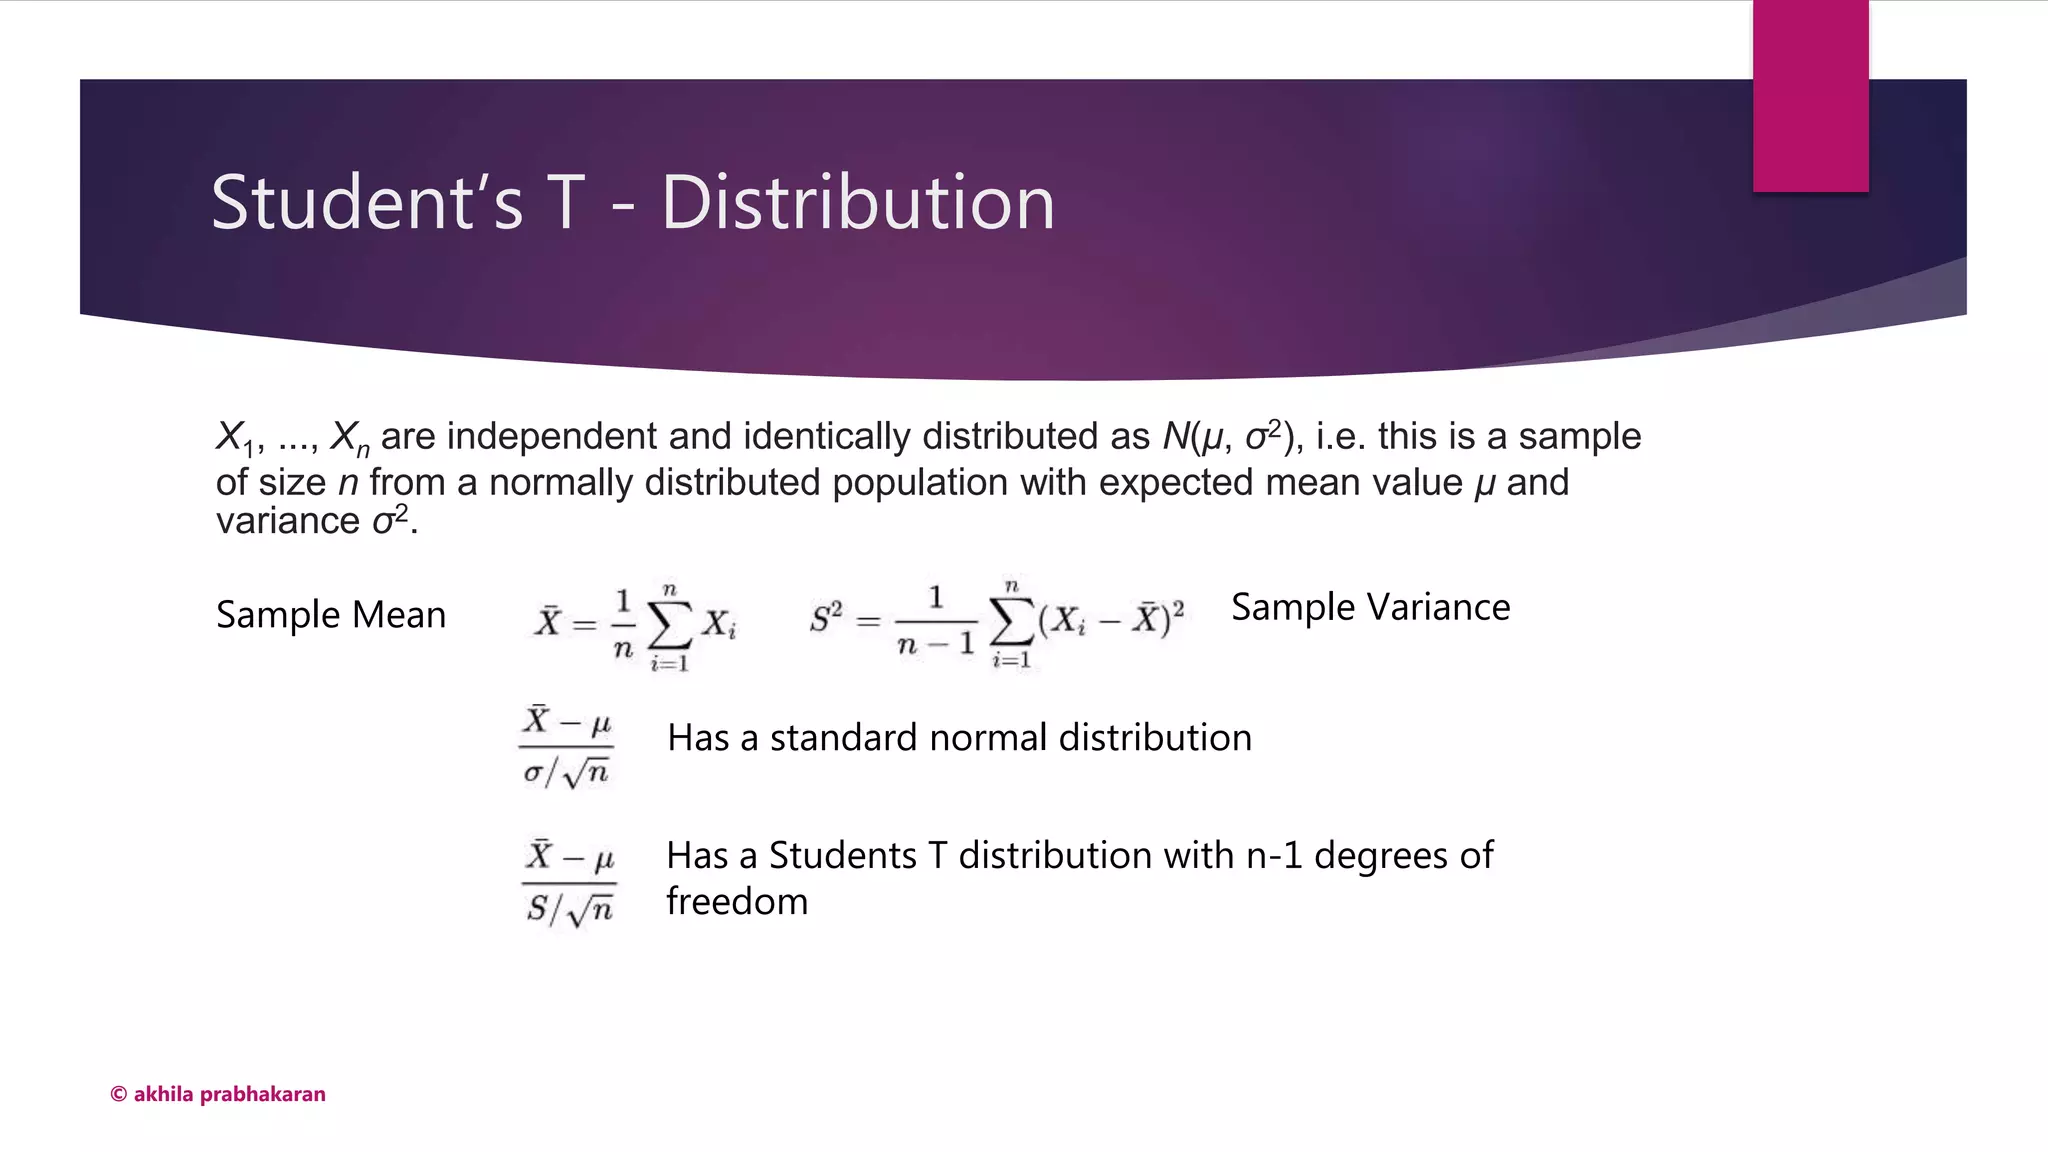
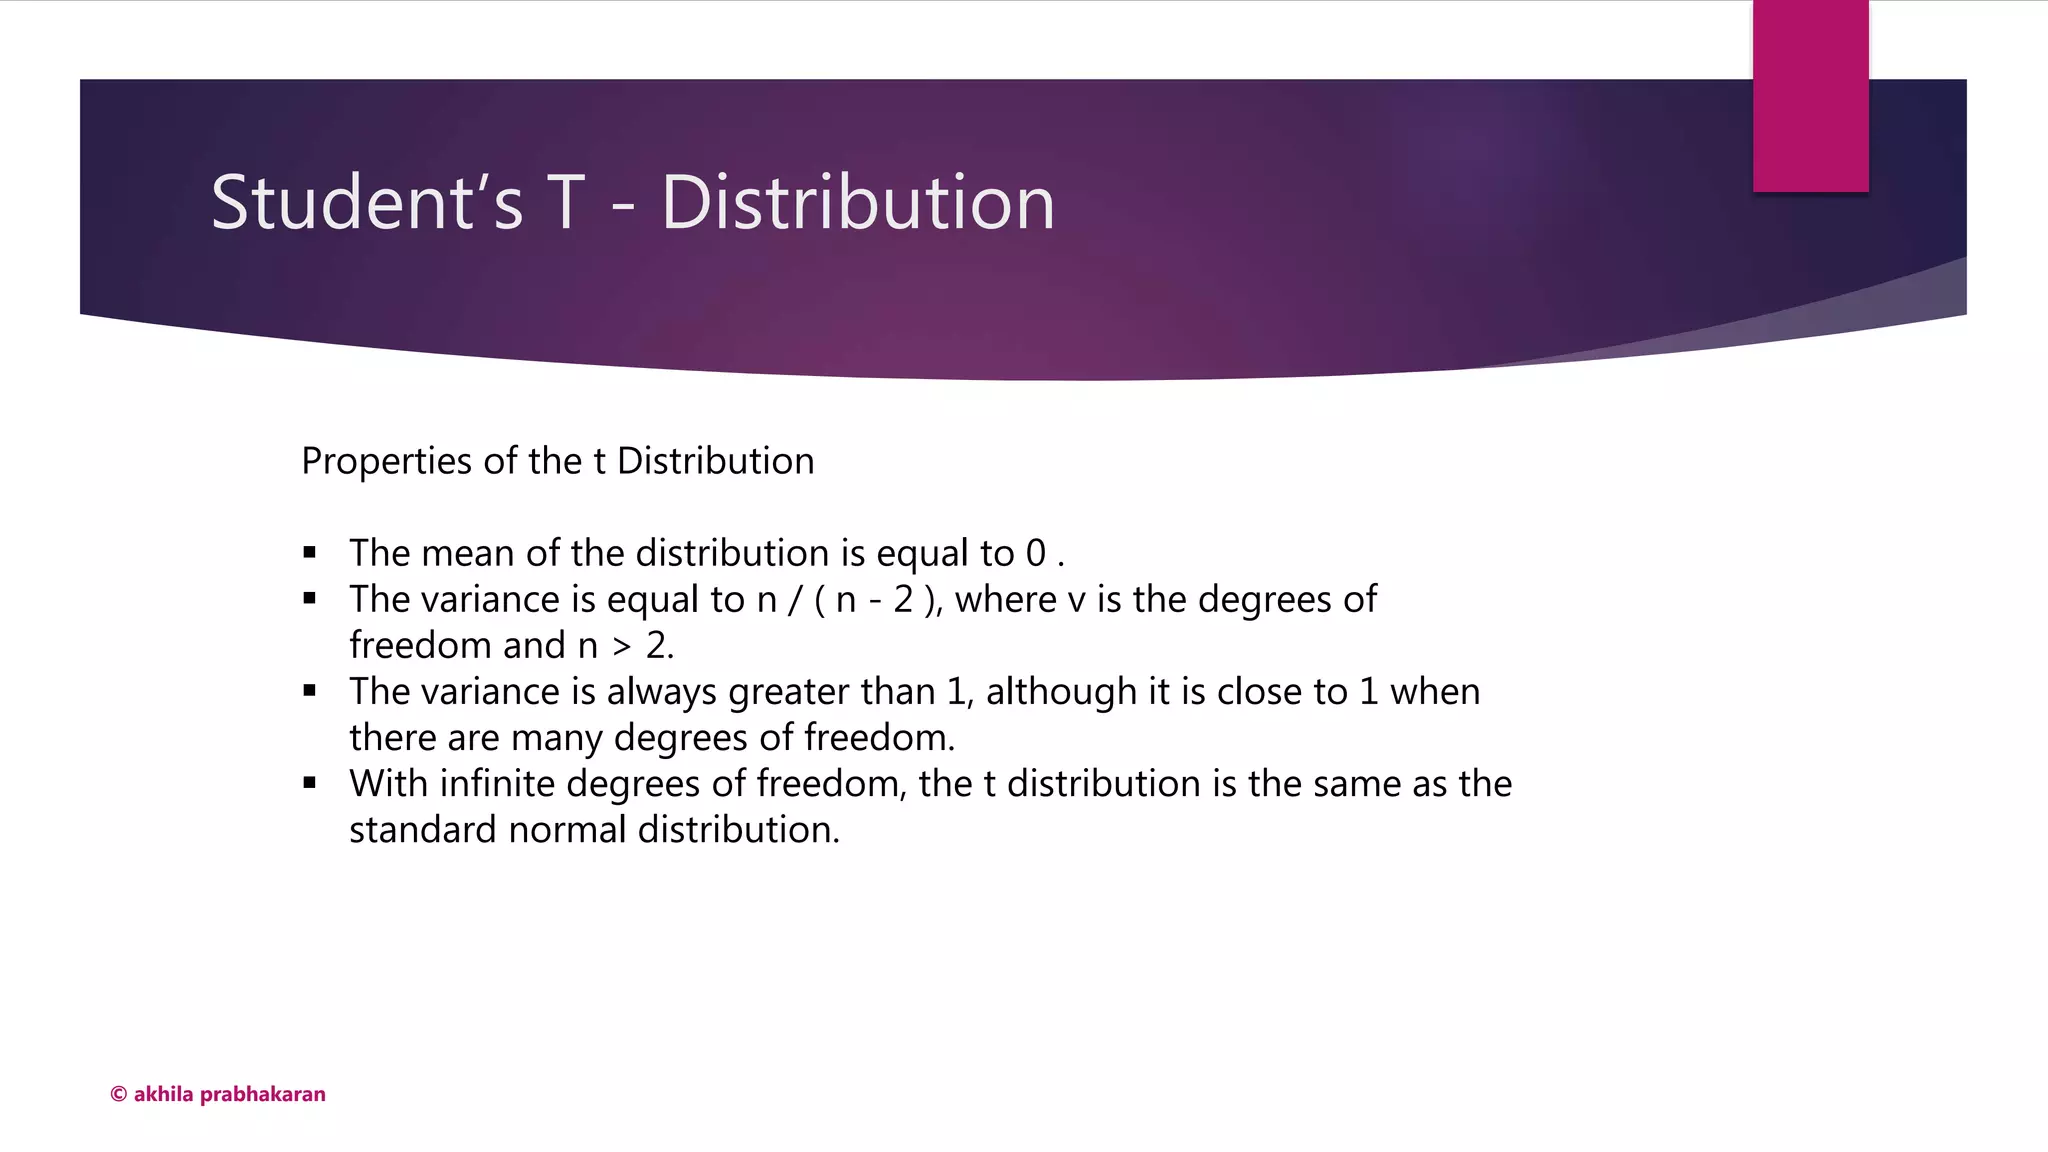
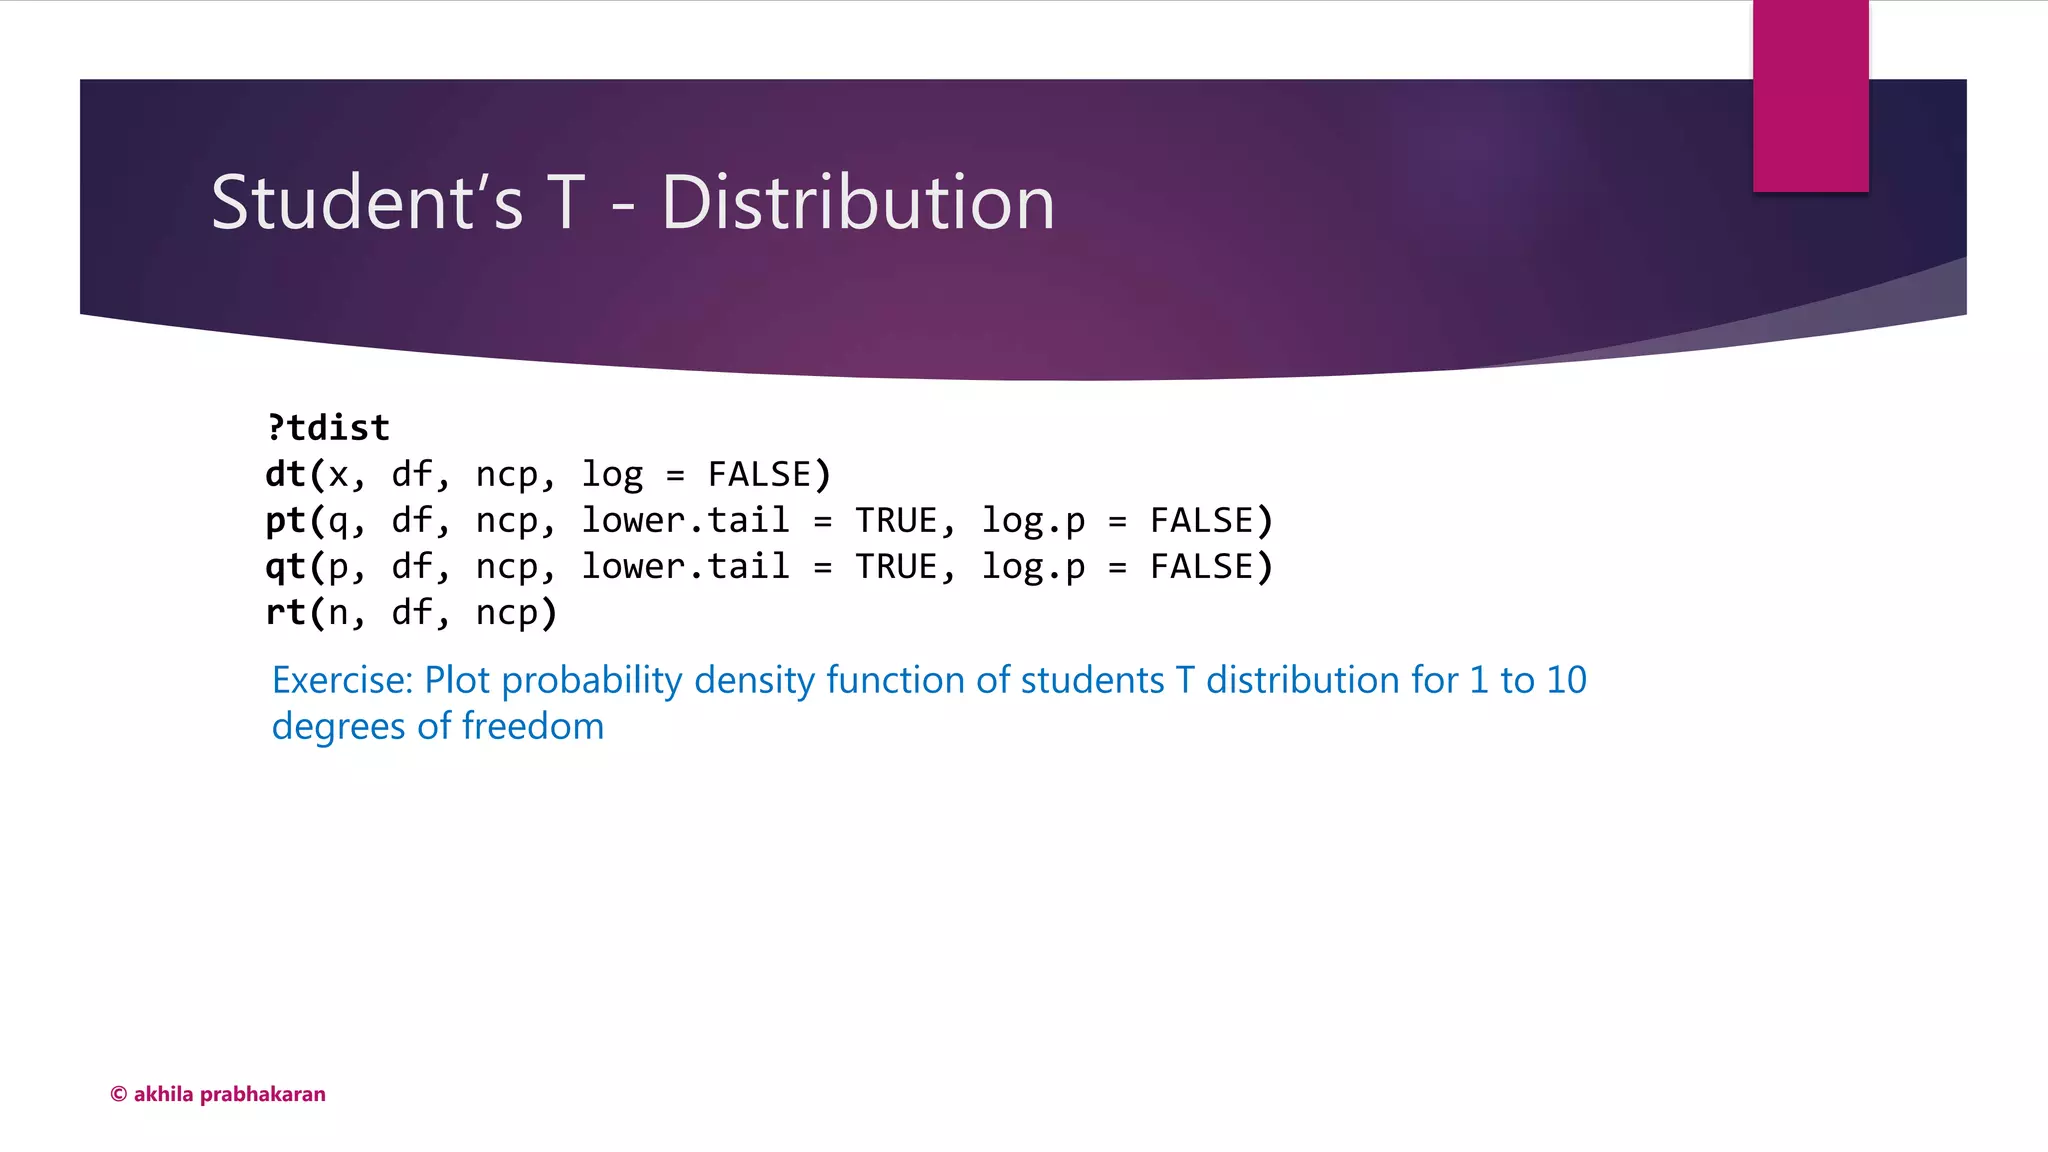
Properties and applications of the Student’s t-distribution in statistics.