Downloaded 4,297 times

![Searching Twitter in one line
R’s XML and RCurl packages make it easy to grab web data, but Jeff
Gentry’s twitteR package makes searching Twitter almost too easy:
> # load the package
> library(twitteR)
> # get the 1,500 most recent tweets mentioning ‘@delta’:
> delta.tweets = searchTwitter('@delta', n=1500)
See what we got in return: A “list” in R is a collection of
objects and its elements may be
> length(delta.tweets) named or just numbered.
[1] 1500
> class(delta.tweets)
[1] "list"
“[[ ]]” is used to access elements.](https://image.slidesharecdn.com/twittertextminingwithr-110704131659-phpapp02/75/R-by-example-mining-Twitter-for-consumer-attitudes-towards-airlines-7-2048.jpg)
![Examine the output
Let’s take a look at the first tweet in the output list:
> tweet = delta.tweets[[1]]
tweet is an object of type “status”
from the “twitteR” package.
> class(tweet)
[1] "status"
attr(,"package") It holds all the information about
[1] "twitteR" the tweet returned from Twitter.
The help page (“?status”) describes some accessor methods like
getScreenName() and getText() which do what you would expect:
> tweet$getScreenName()
[1] "Alaqawari"
> tweet$getText()
[1] "I am ready to head home. Inshallah will try to get on the earlier
flight to Fresno. @Delta @DeltaAssist"](https://image.slidesharecdn.com/twittertextminingwithr-110704131659-phpapp02/75/R-by-example-mining-Twitter-for-consumer-attitudes-towards-airlines-8-2048.jpg)
![Extract the tweet text
R has several (read: too many) ways to apply functions iteratively.
•The plyr package unifies them all with a consistent naming convention.
•The function name is determined by the input and output data types. We
have a list and would like a simple array output, so we use “laply”:
> delta.text = laply(delta.tweets, function(t) t$getText() )
> length(delta.text)[1] 1500
> head(delta.text, 5)
[1] "I am ready to head home. Inshallah will try to get on the earlier
flight to Fresno. @Delta @DeltaAssist"
[2] "@Delta Releases 2010 Corporate Responsibility Report - @PRNewswire
(press release) : http://tinyurl.com/64mz3oh"
[3] "Another week, another upgrade! Thanks @Delta!"
[4] "I'm not able to check in or select a seat for flight DL223/KL6023 to
Seattle tomorrow. Help? @KLM @delta"
[5] "In my boredom of waiting realized @deltaairlines is now @delta
seriously..... Stil waiting and your not even unloading status yet"](https://image.slidesharecdn.com/twittertextminingwithr-110704131659-phpapp02/75/R-by-example-mining-Twitter-for-consumer-attitudes-towards-airlines-9-2048.jpg)
![Algorithm sanity check
> sample = c("You're awesome and I love you",
"I hate and hate and hate. So angry. Die!",
"Impressed and amazed: you are peerless in your achievement of
unparalleled mediocrity.")
> result = score.sentiment(sample, pos.words, neg.words)
> class(result)
data.frames hold tabular data so they
[1] "data.frame"
consist of columns & rows which can
> result$score
be accessed by name or number.
[1] 2 -5 4
Here, “score” is the name of a column.
So, not so good with sarcasm. Here are a couple of real tweets:
> score.sentiment(c("@Delta I'm going to need you to get it together.
Delay on tarmac, delayed connection, crazy gate changes... #annoyed",
"Surprised and happy that @Delta helped me avoid the 3.5 hr layover I
was scheduled for. Patient and helpful agents. #remarkable"),
pos.words, neg.words)$score
[1] -4 5](https://image.slidesharecdn.com/twittertextminingwithr-110704131659-phpapp02/75/R-by-example-mining-Twitter-for-consumer-attitudes-towards-airlines-14-2048.jpg)
![Accessing data.frames
Here’s the data.frame just returned from score.sentiment():
> result
score text
1 2 You're awesome and I love you
2 -5 I hate and hate and hate. So angry. Die!
3 4 Impressed and amazed: you are peerless in your achievement of unparalleled mediocrity.
Elements can be accessed by name or position, and positions can be
ranges:
> result[1,1]
[1] 2
> result[1,'score']
[1] 2
> result[1:2, 'score']
[1] 2 -5
> result[c(1,3), 'score']
[1] 2 4
> result[,'score']
[1] 2 -5 4](https://image.slidesharecdn.com/twittertextminingwithr-110704131659-phpapp02/75/R-by-example-mining-Twitter-for-consumer-attitudes-towards-airlines-15-2048.jpg)
![Scrape, don’t type
XML package provides amazing readHTMLtable() function:
> library(XML)
> acsi.url = 'http://www.theacsi.org/index.php?
option=com_content&view=article&id=147&catid=&Itemid=212&i=Airlines'
> acsi.df = readHTMLTable(acsi.url, header=T, which=1,
stringsAsFactors=F)
> # only keep column #1 (name) and #18 (2010 score)
> acsi.df = acsi.df[,c(1,18)]
> head(acsi.df,1)
10
1 Southwest Airlines 79
Well, typing metadata is OK, I guess... clean up column names, etc:
> colnames(acsi.df) = c('airline', 'score') NA (as in “n/a”) is
> acsi.df$code = c('WN', NA, 'CO', NA, 'AA', 'DL', supported as a
'US', 'NW', 'UA') valid value
> acsi.df$score = as.numeric(acsi.df$score) everywhere in R.](https://image.slidesharecdn.com/twittertextminingwithr-110704131659-phpapp02/75/R-by-example-mining-Twitter-for-consumer-attitudes-towards-airlines-25-2048.jpg)

![R code for example scoring function
score.sentiment = function(sentences, pos.words, neg.words, .progress='none')
{
require(plyr)
require(stringr)
# we got a vector of sentences. plyr will handle a list or a vector as an "l" for us
# we want a simple array of scores back, so we use "l" + "a" + "ply" = laply:
scores = laply(sentences, function(sentence, pos.words, neg.words) {
# clean up sentences with R's regex-driven global substitute, gsub():
sentence = gsub('[[:punct:]]', '', sentence)
sentence = gsub('[[:cntrl:]]', '', sentence)
sentence = gsub('d+', '', sentence)
# and convert to lower case:
sentence = tolower(sentence)
# split into words. str_split is in the stringr package
word.list = str_split(sentence, 's+')
# sometimes a list() is one level of hierarchy too much
words = unlist(word.list)
# compare our words to the dictionaries of positive & negative terms
pos.matches = match(words, pos.words)
neg.matches = match(words, neg.words)
# match() returns the position of the matched term or NA
# we just want a TRUE/FALSE:
pos.matches = !is.na(pos.matches)
neg.matches = !is.na(neg.matches)
# and conveniently enough, TRUE/FALSE will be treated as 1/0 by sum():
score = sum(pos.matches) - sum(neg.matches)
return(score)
}, pos.words, neg.words, .progress=.progress )
scores.df = data.frame(score=scores, text=sentences)
return(scores.df)
} 39](https://image.slidesharecdn.com/twittertextminingwithr-110704131659-phpapp02/75/R-by-example-mining-Twitter-for-consumer-attitudes-towards-airlines-30-2048.jpg)


![Searching Twitter in one line
R’s XML and RCurl packages make it easy to grab web data, but Jeff
Gentry’s twitteR package makes searching Twitter almost too easy:
> # load the package
> library(twitteR)
> # get the 1,500 most recent tweets mentioning ‘@delta’:
> delta.tweets = searchTwitter('@delta', n=1500)
See what we got in return: A “list” in R is a collection of
objects and its elements may be
> length(delta.tweets) named or just numbered.
[1] 1500
> class(delta.tweets)
[1] "list"
“[[ ]]” is used to access elements.](https://crownmelresort.com/image.slidesharecdn.com/twittertextminingwithr-110704131659-phpapp02/75/R-by-example-mining-Twitter-for-consumer-attitudes-towards-airlines-7-2048.jpg)
![Examine the output
Let’s take a look at the first tweet in the output list:
> tweet = delta.tweets[[1]]
tweet is an object of type “status”
from the “twitteR” package.
> class(tweet)
[1] "status"
attr(,"package") It holds all the information about
[1] "twitteR" the tweet returned from Twitter.
The help page (“?status”) describes some accessor methods like
getScreenName() and getText() which do what you would expect:
> tweet$getScreenName()
[1] "Alaqawari"
> tweet$getText()
[1] "I am ready to head home. Inshallah will try to get on the earlier
flight to Fresno. @Delta @DeltaAssist"](https://crownmelresort.com/image.slidesharecdn.com/twittertextminingwithr-110704131659-phpapp02/75/R-by-example-mining-Twitter-for-consumer-attitudes-towards-airlines-8-2048.jpg)
![Extract the tweet text
R has several (read: too many) ways to apply functions iteratively.
•The plyr package unifies them all with a consistent naming convention.
•The function name is determined by the input and output data types. We
have a list and would like a simple array output, so we use “laply”:
> delta.text = laply(delta.tweets, function(t) t$getText() )
> length(delta.text)[1] 1500
> head(delta.text, 5)
[1] "I am ready to head home. Inshallah will try to get on the earlier
flight to Fresno. @Delta @DeltaAssist"
[2] "@Delta Releases 2010 Corporate Responsibility Report - @PRNewswire
(press release) : http://tinyurl.com/64mz3oh"
[3] "Another week, another upgrade! Thanks @Delta!"
[4] "I'm not able to check in or select a seat for flight DL223/KL6023 to
Seattle tomorrow. Help? @KLM @delta"
[5] "In my boredom of waiting realized @deltaairlines is now @delta
seriously..... Stil waiting and your not even unloading status yet"](https://crownmelresort.com/image.slidesharecdn.com/twittertextminingwithr-110704131659-phpapp02/75/R-by-example-mining-Twitter-for-consumer-attitudes-towards-airlines-9-2048.jpg)


![Algorithm sanity check
> sample = c("You're awesome and I love you",
"I hate and hate and hate. So angry. Die!",
"Impressed and amazed: you are peerless in your achievement of
unparalleled mediocrity.")
> result = score.sentiment(sample, pos.words, neg.words)
> class(result)
data.frames hold tabular data so they
[1] "data.frame"
consist of columns & rows which can
> result$score
be accessed by name or number.
[1] 2 -5 4
Here, “score” is the name of a column.
So, not so good with sarcasm. Here are a couple of real tweets:
> score.sentiment(c("@Delta I'm going to need you to get it together.
Delay on tarmac, delayed connection, crazy gate changes... #annoyed",
"Surprised and happy that @Delta helped me avoid the 3.5 hr layover I
was scheduled for. Patient and helpful agents. #remarkable"),
pos.words, neg.words)$score
[1] -4 5](https://crownmelresort.com/image.slidesharecdn.com/twittertextminingwithr-110704131659-phpapp02/75/R-by-example-mining-Twitter-for-consumer-attitudes-towards-airlines-14-2048.jpg)
![Accessing data.frames
Here’s the data.frame just returned from score.sentiment():
> result
score text
1 2 You're awesome and I love you
2 -5 I hate and hate and hate. So angry. Die!
3 4 Impressed and amazed: you are peerless in your achievement of unparalleled mediocrity.
Elements can be accessed by name or position, and positions can be
ranges:
> result[1,1]
[1] 2
> result[1,'score']
[1] 2
> result[1:2, 'score']
[1] 2 -5
> result[c(1,3), 'score']
[1] 2 4
> result[,'score']
[1] 2 -5 4](https://crownmelresort.com/image.slidesharecdn.com/twittertextminingwithr-110704131659-phpapp02/75/R-by-example-mining-Twitter-for-consumer-attitudes-towards-airlines-15-2048.jpg)


![Scrape, don’t type
XML package provides amazing readHTMLtable() function:
> library(XML)
> acsi.url = 'http://www.theacsi.org/index.php?
option=com_content&view=article&id=147&catid=&Itemid=212&i=Airlines'
> acsi.df = readHTMLTable(acsi.url, header=T, which=1,
stringsAsFactors=F)
> # only keep column #1 (name) and #18 (2010 score)
> acsi.df = acsi.df[,c(1,18)]
> head(acsi.df,1)
10
1 Southwest Airlines 79
Well, typing metadata is OK, I guess... clean up column names, etc:
> colnames(acsi.df) = c('airline', 'score') NA (as in “n/a”) is
> acsi.df$code = c('WN', NA, 'CO', NA, 'AA', 'DL', supported as a
'US', 'NW', 'UA') valid value
> acsi.df$score = as.numeric(acsi.df$score) everywhere in R.](https://crownmelresort.com/image.slidesharecdn.com/twittertextminingwithr-110704131659-phpapp02/75/R-by-example-mining-Twitter-for-consumer-attitudes-towards-airlines-25-2048.jpg)


![R code for example scoring function
score.sentiment = function(sentences, pos.words, neg.words, .progress='none')
{
require(plyr)
require(stringr)
# we got a vector of sentences. plyr will handle a list or a vector as an "l" for us
# we want a simple array of scores back, so we use "l" + "a" + "ply" = laply:
scores = laply(sentences, function(sentence, pos.words, neg.words) {
# clean up sentences with R's regex-driven global substitute, gsub():
sentence = gsub('[[:punct:]]', '', sentence)
sentence = gsub('[[:cntrl:]]', '', sentence)
sentence = gsub('d+', '', sentence)
# and convert to lower case:
sentence = tolower(sentence)
# split into words. str_split is in the stringr package
word.list = str_split(sentence, 's+')
# sometimes a list() is one level of hierarchy too much
words = unlist(word.list)
# compare our words to the dictionaries of positive & negative terms
pos.matches = match(words, pos.words)
neg.matches = match(words, neg.words)
# match() returns the position of the matched term or NA
# we just want a TRUE/FALSE:
pos.matches = !is.na(pos.matches)
neg.matches = !is.na(neg.matches)
# and conveniently enough, TRUE/FALSE will be treated as 1/0 by sum():
score = sum(pos.matches) - sum(neg.matches)
return(score)
}, pos.words, neg.words, .progress=.progress )
scores.df = data.frame(score=scores, text=sentences)
return(scores.df)
} 39](https://crownmelresort.com/image.slidesharecdn.com/twittertextminingwithr-110704131659-phpapp02/75/R-by-example-mining-Twitter-for-consumer-attitudes-towards-airlines-30-2048.jpg)

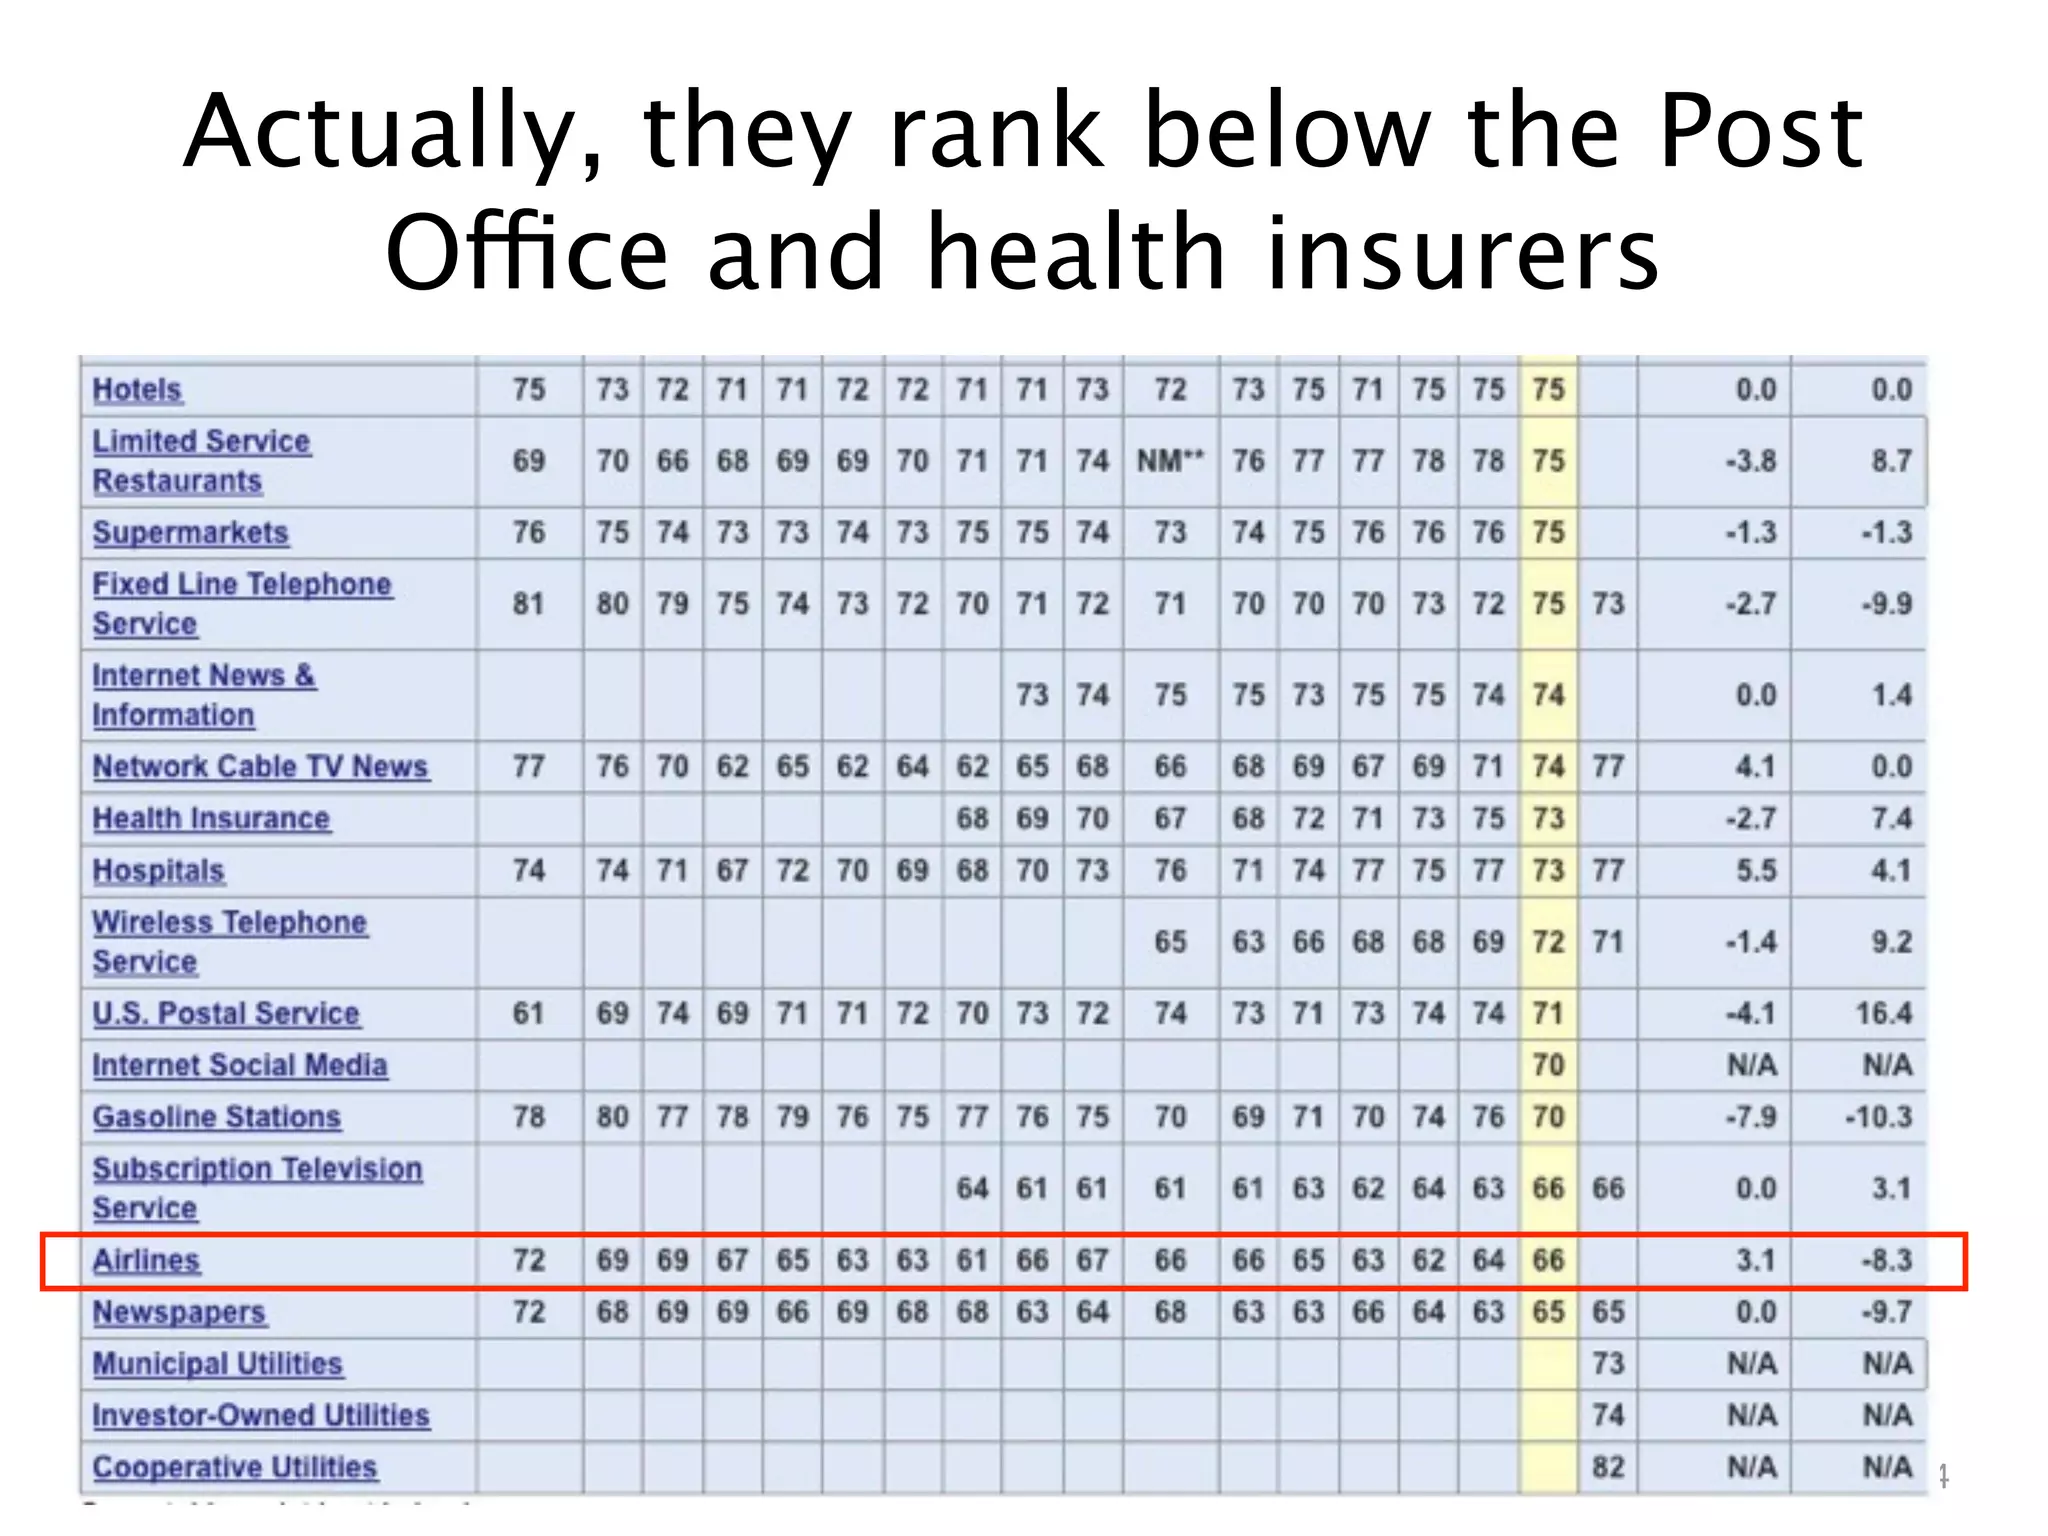
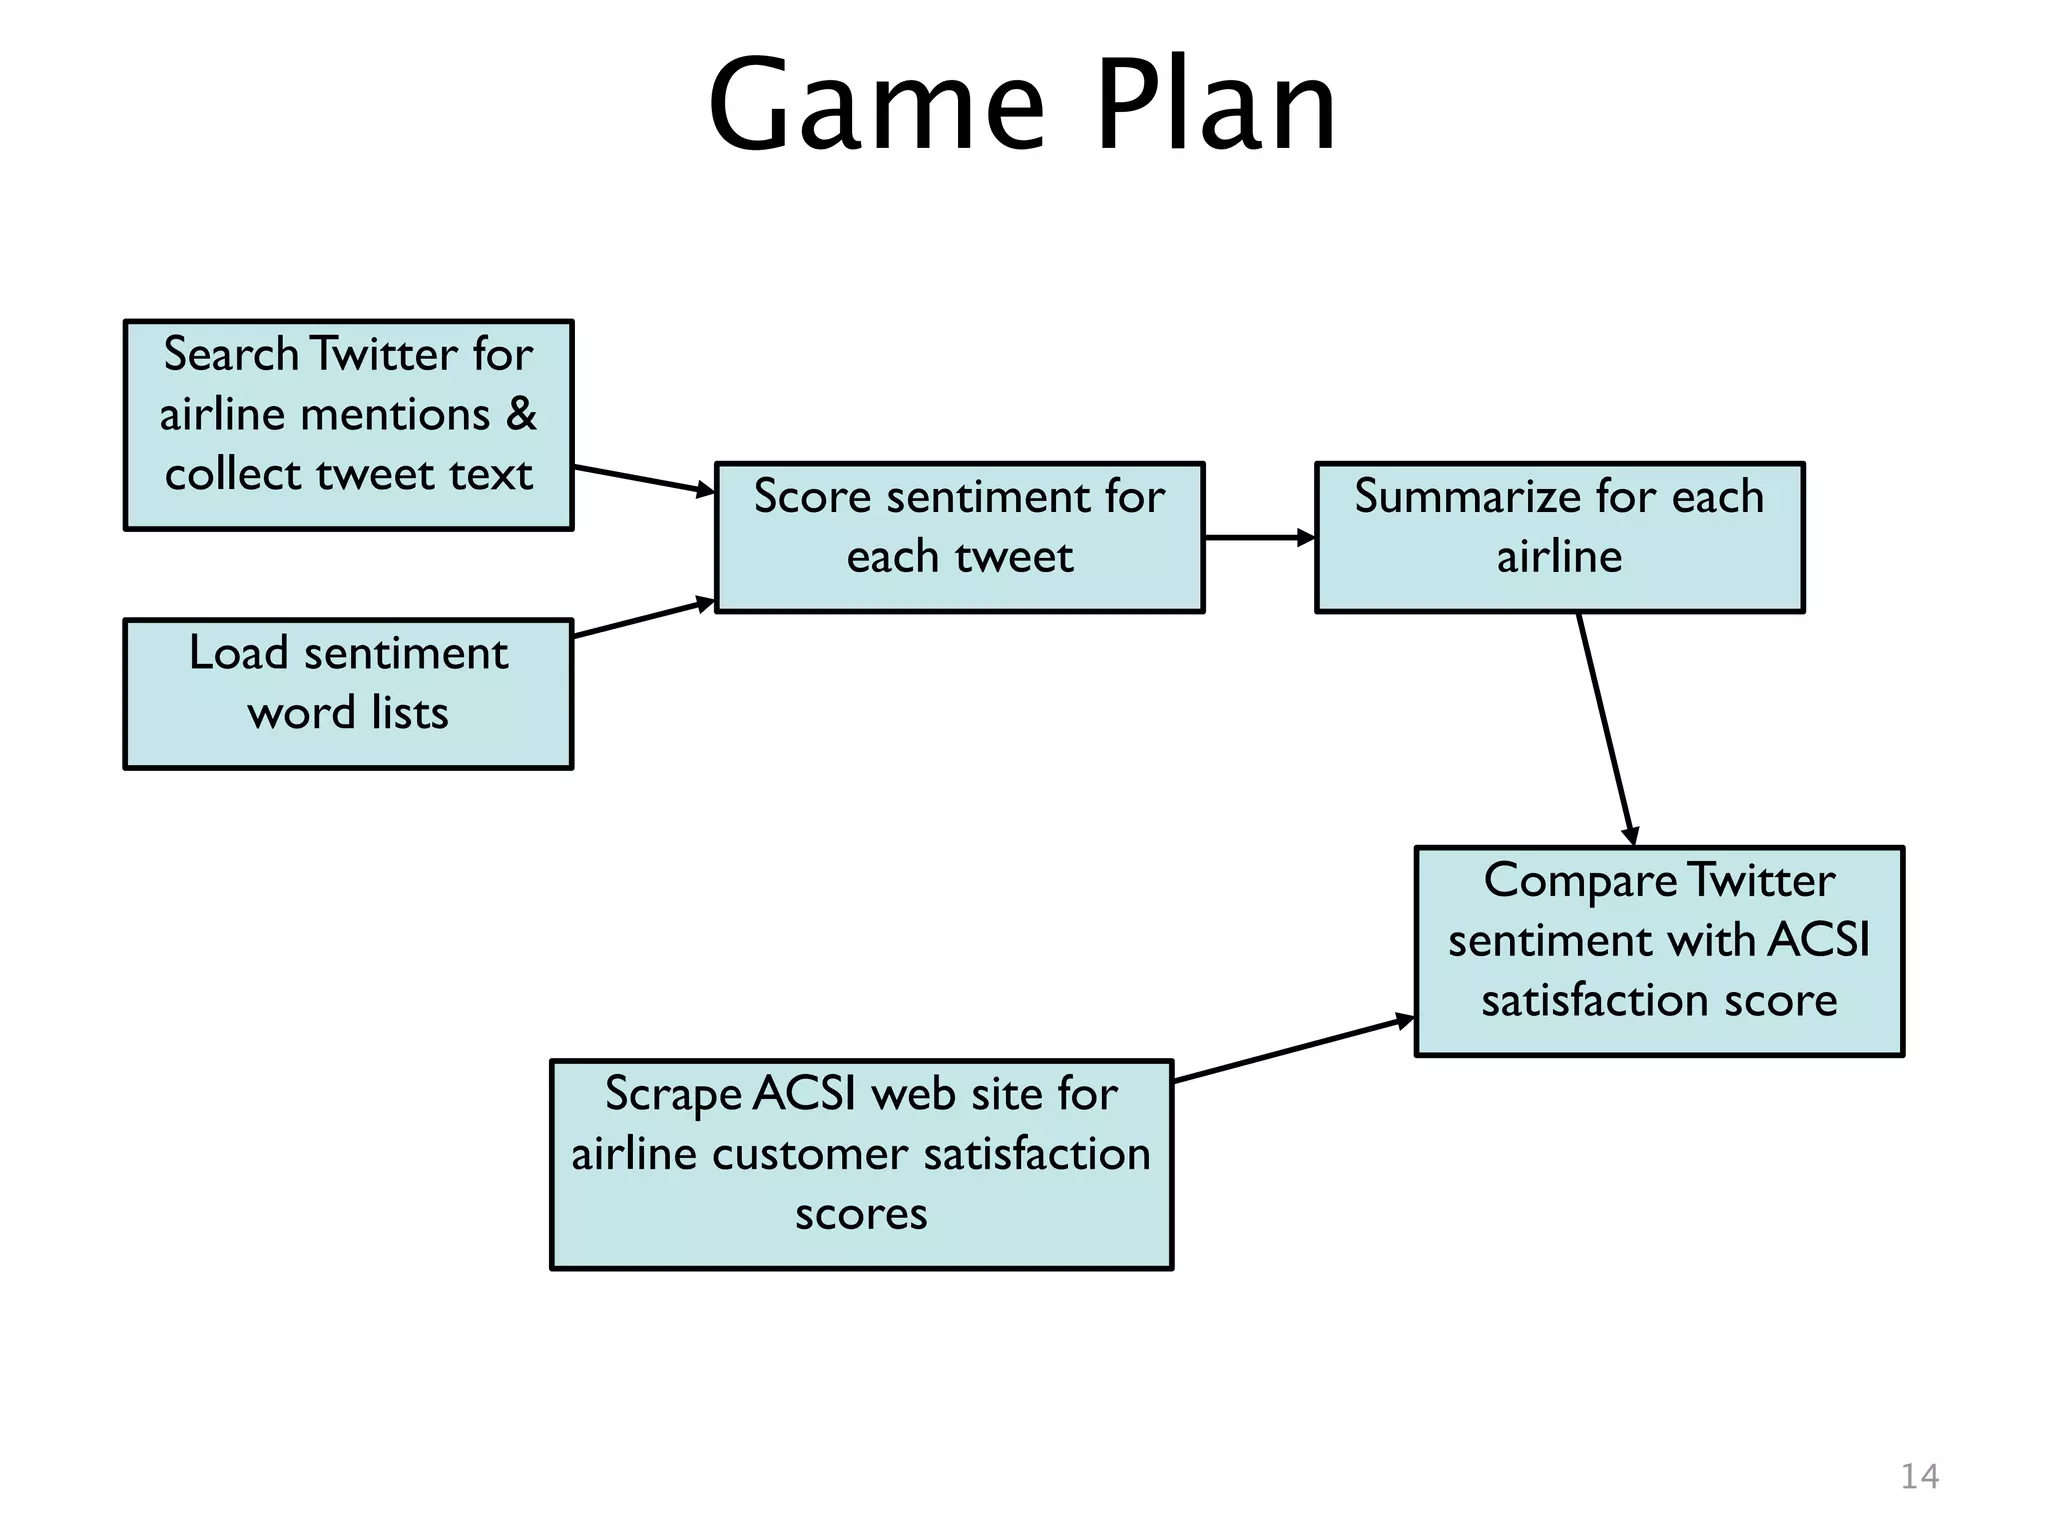
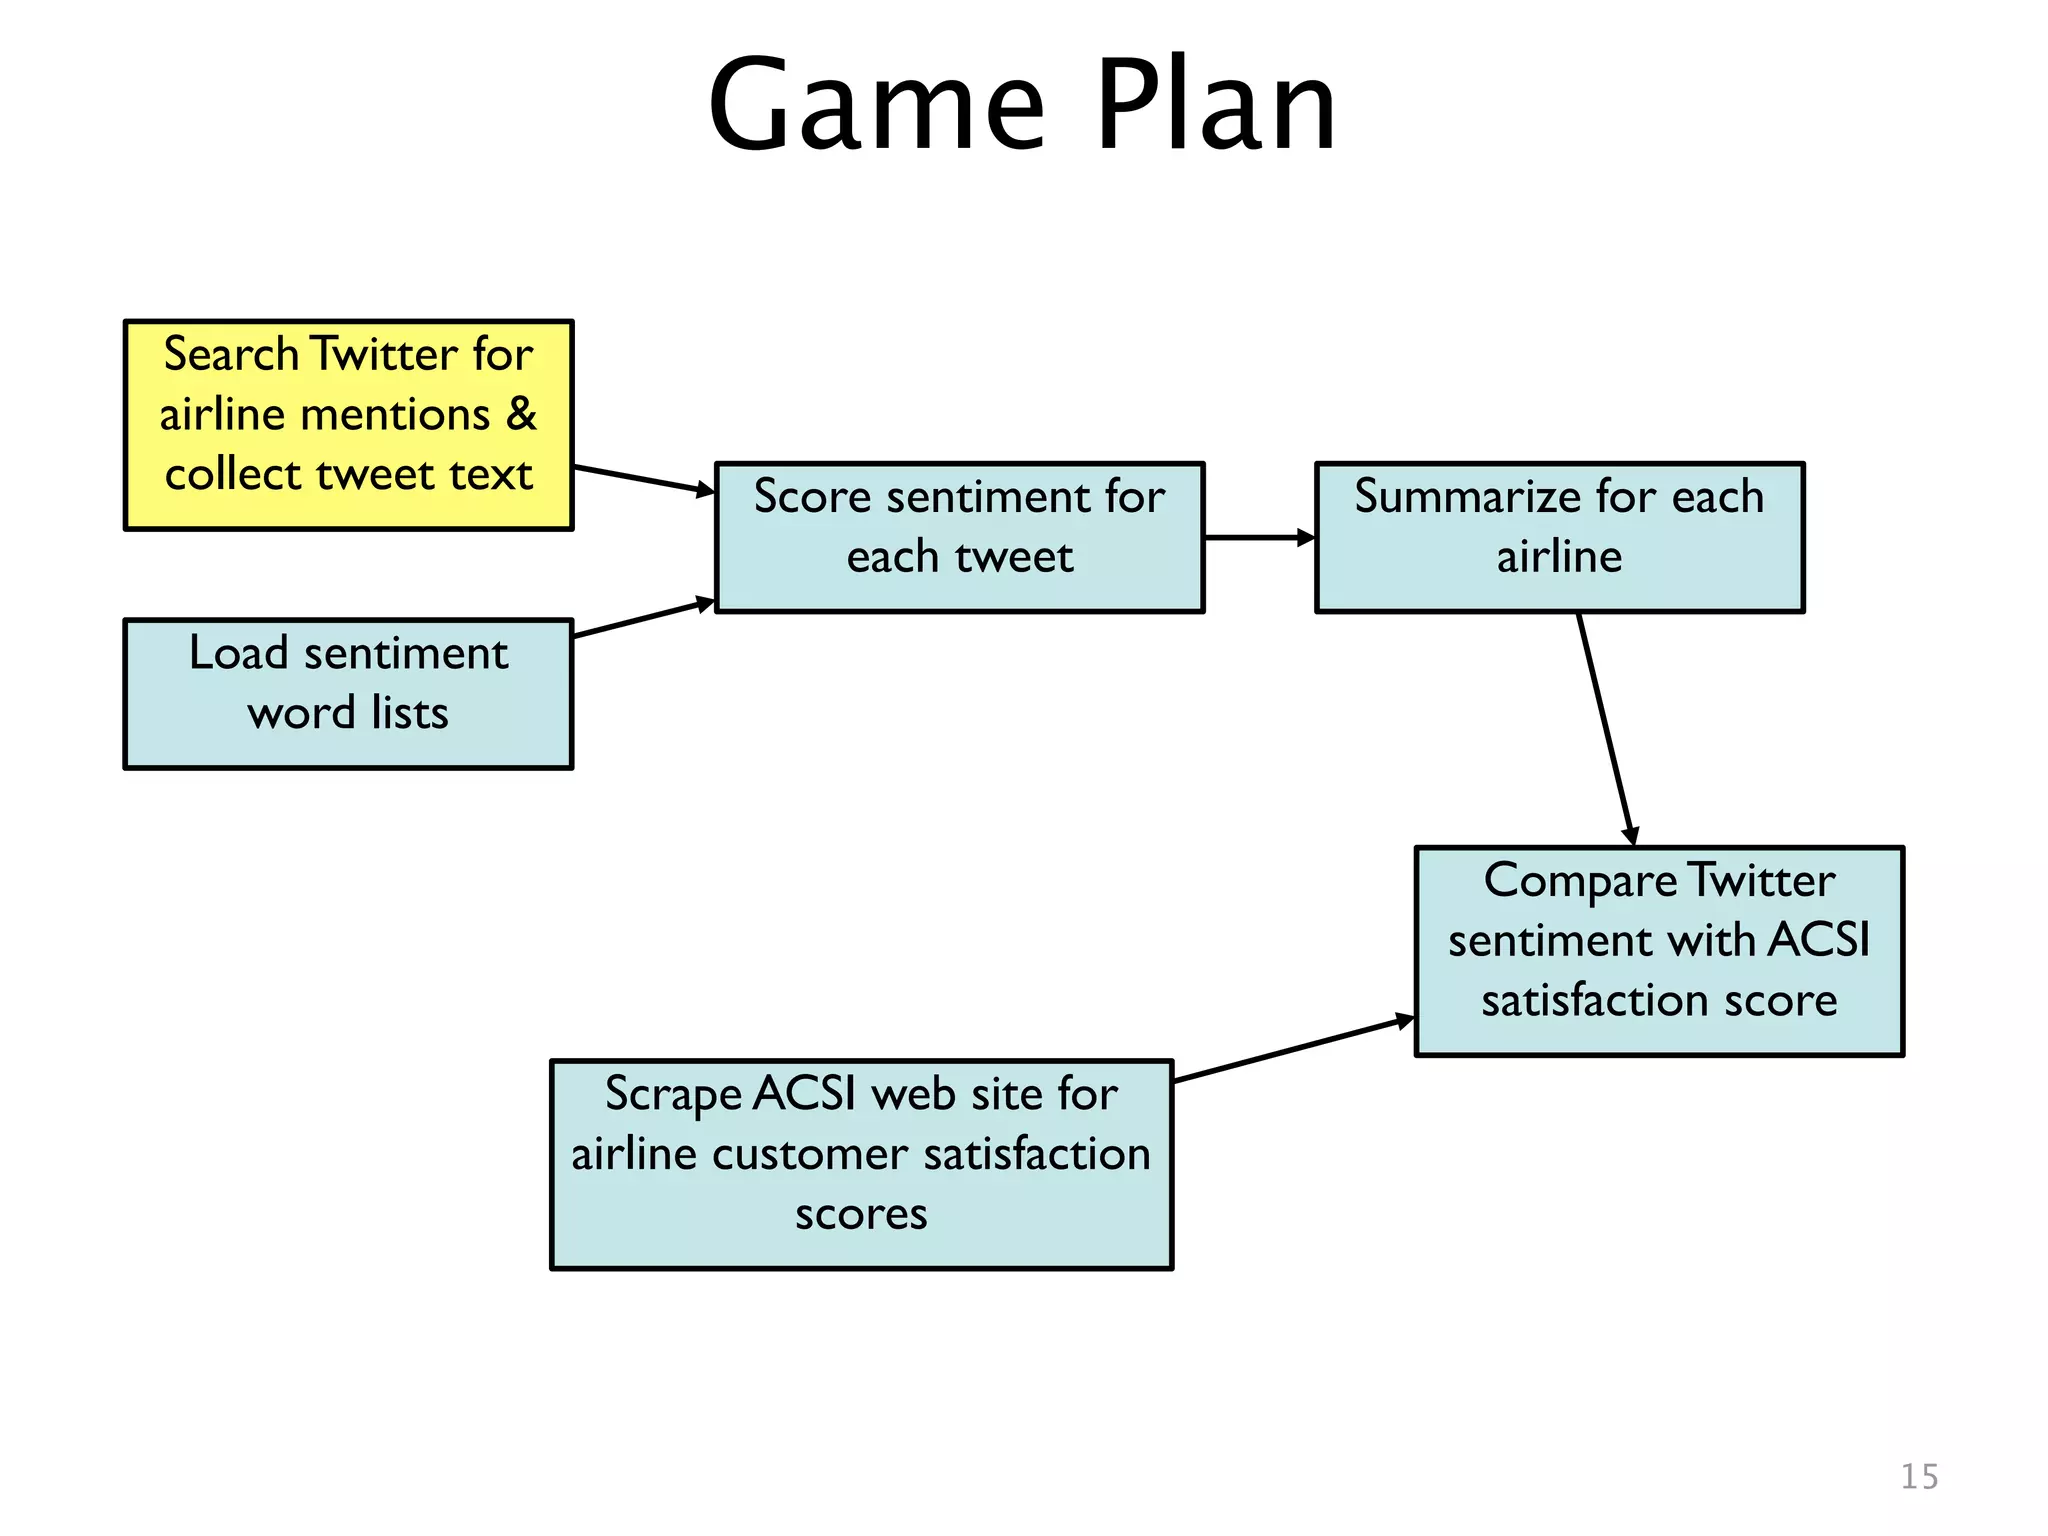
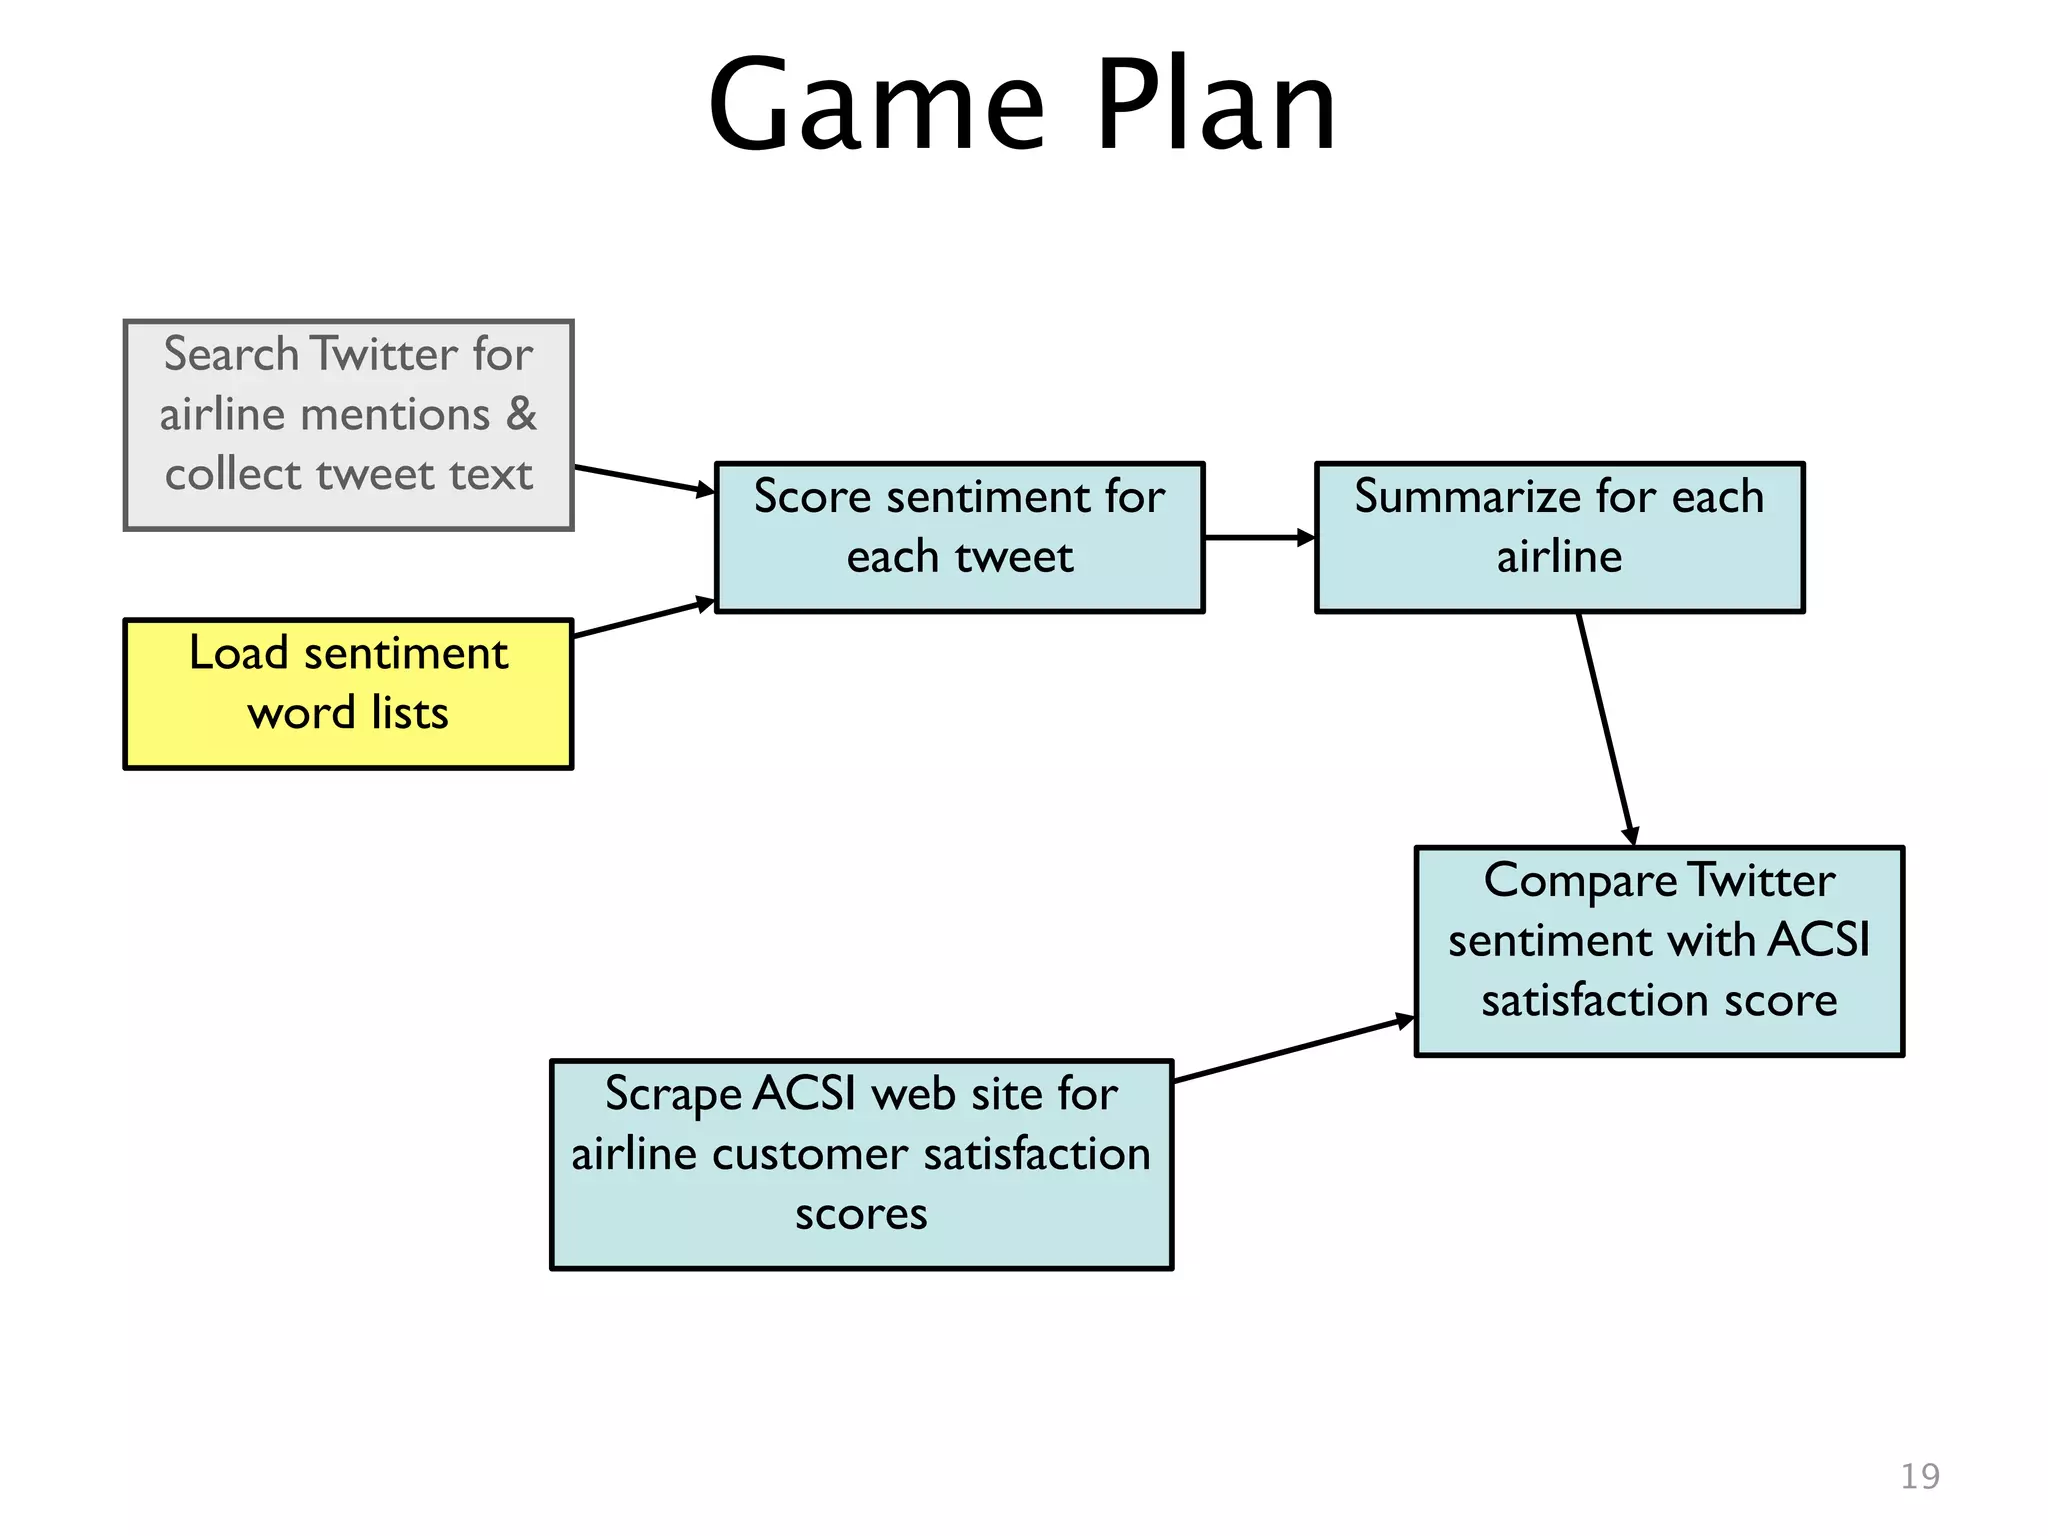
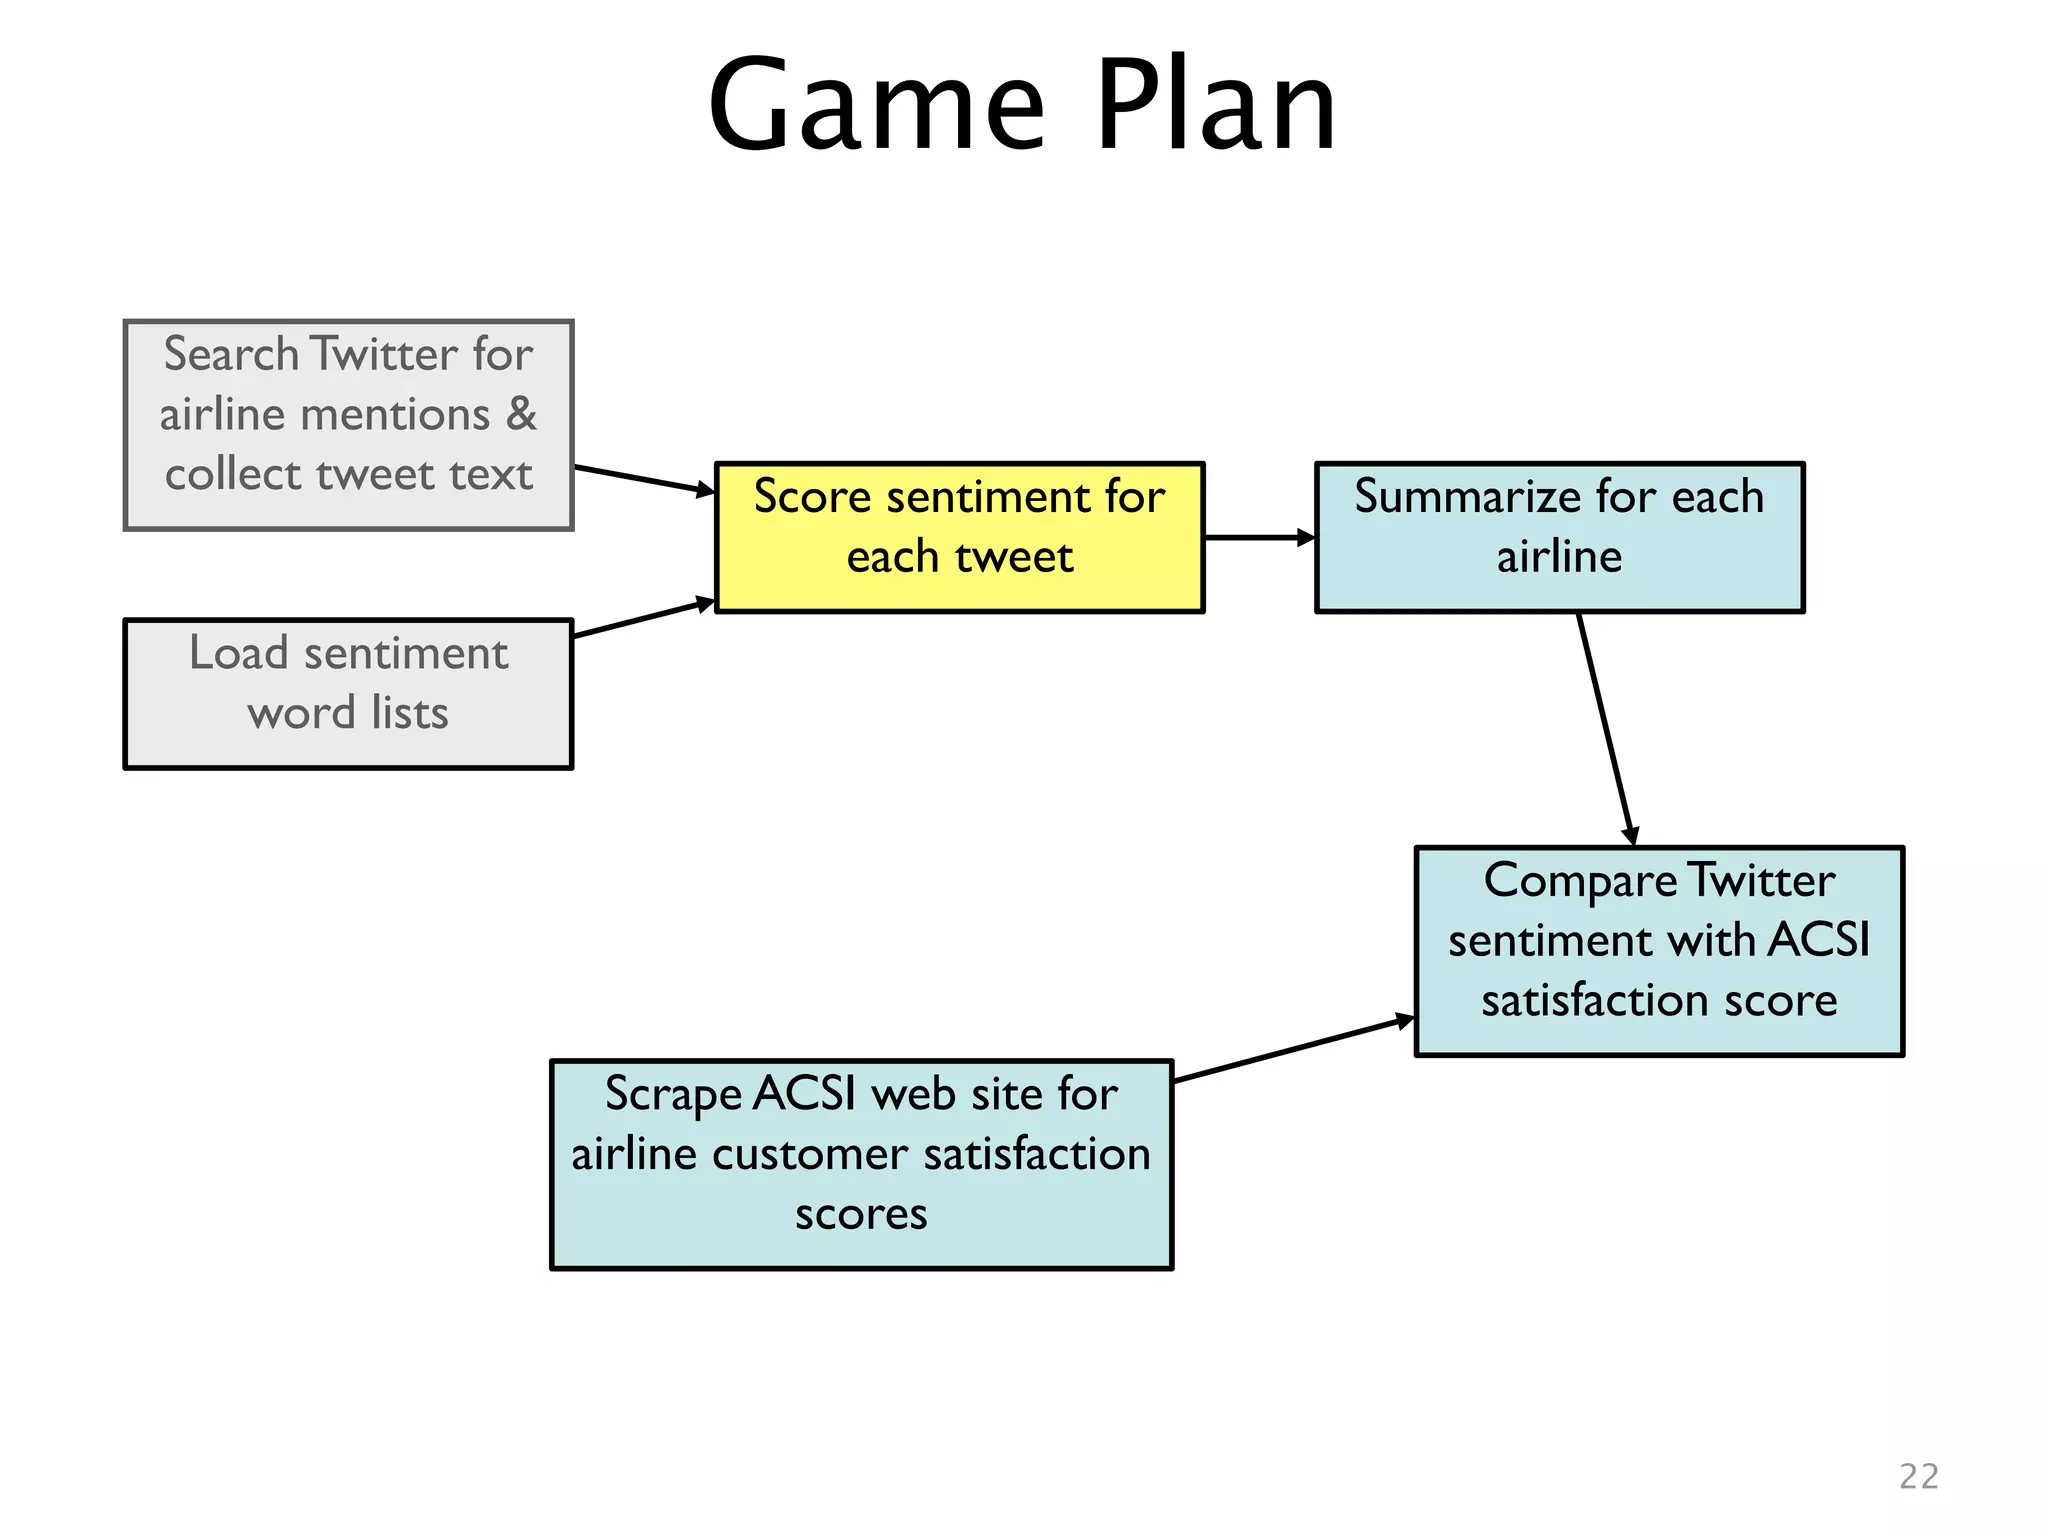
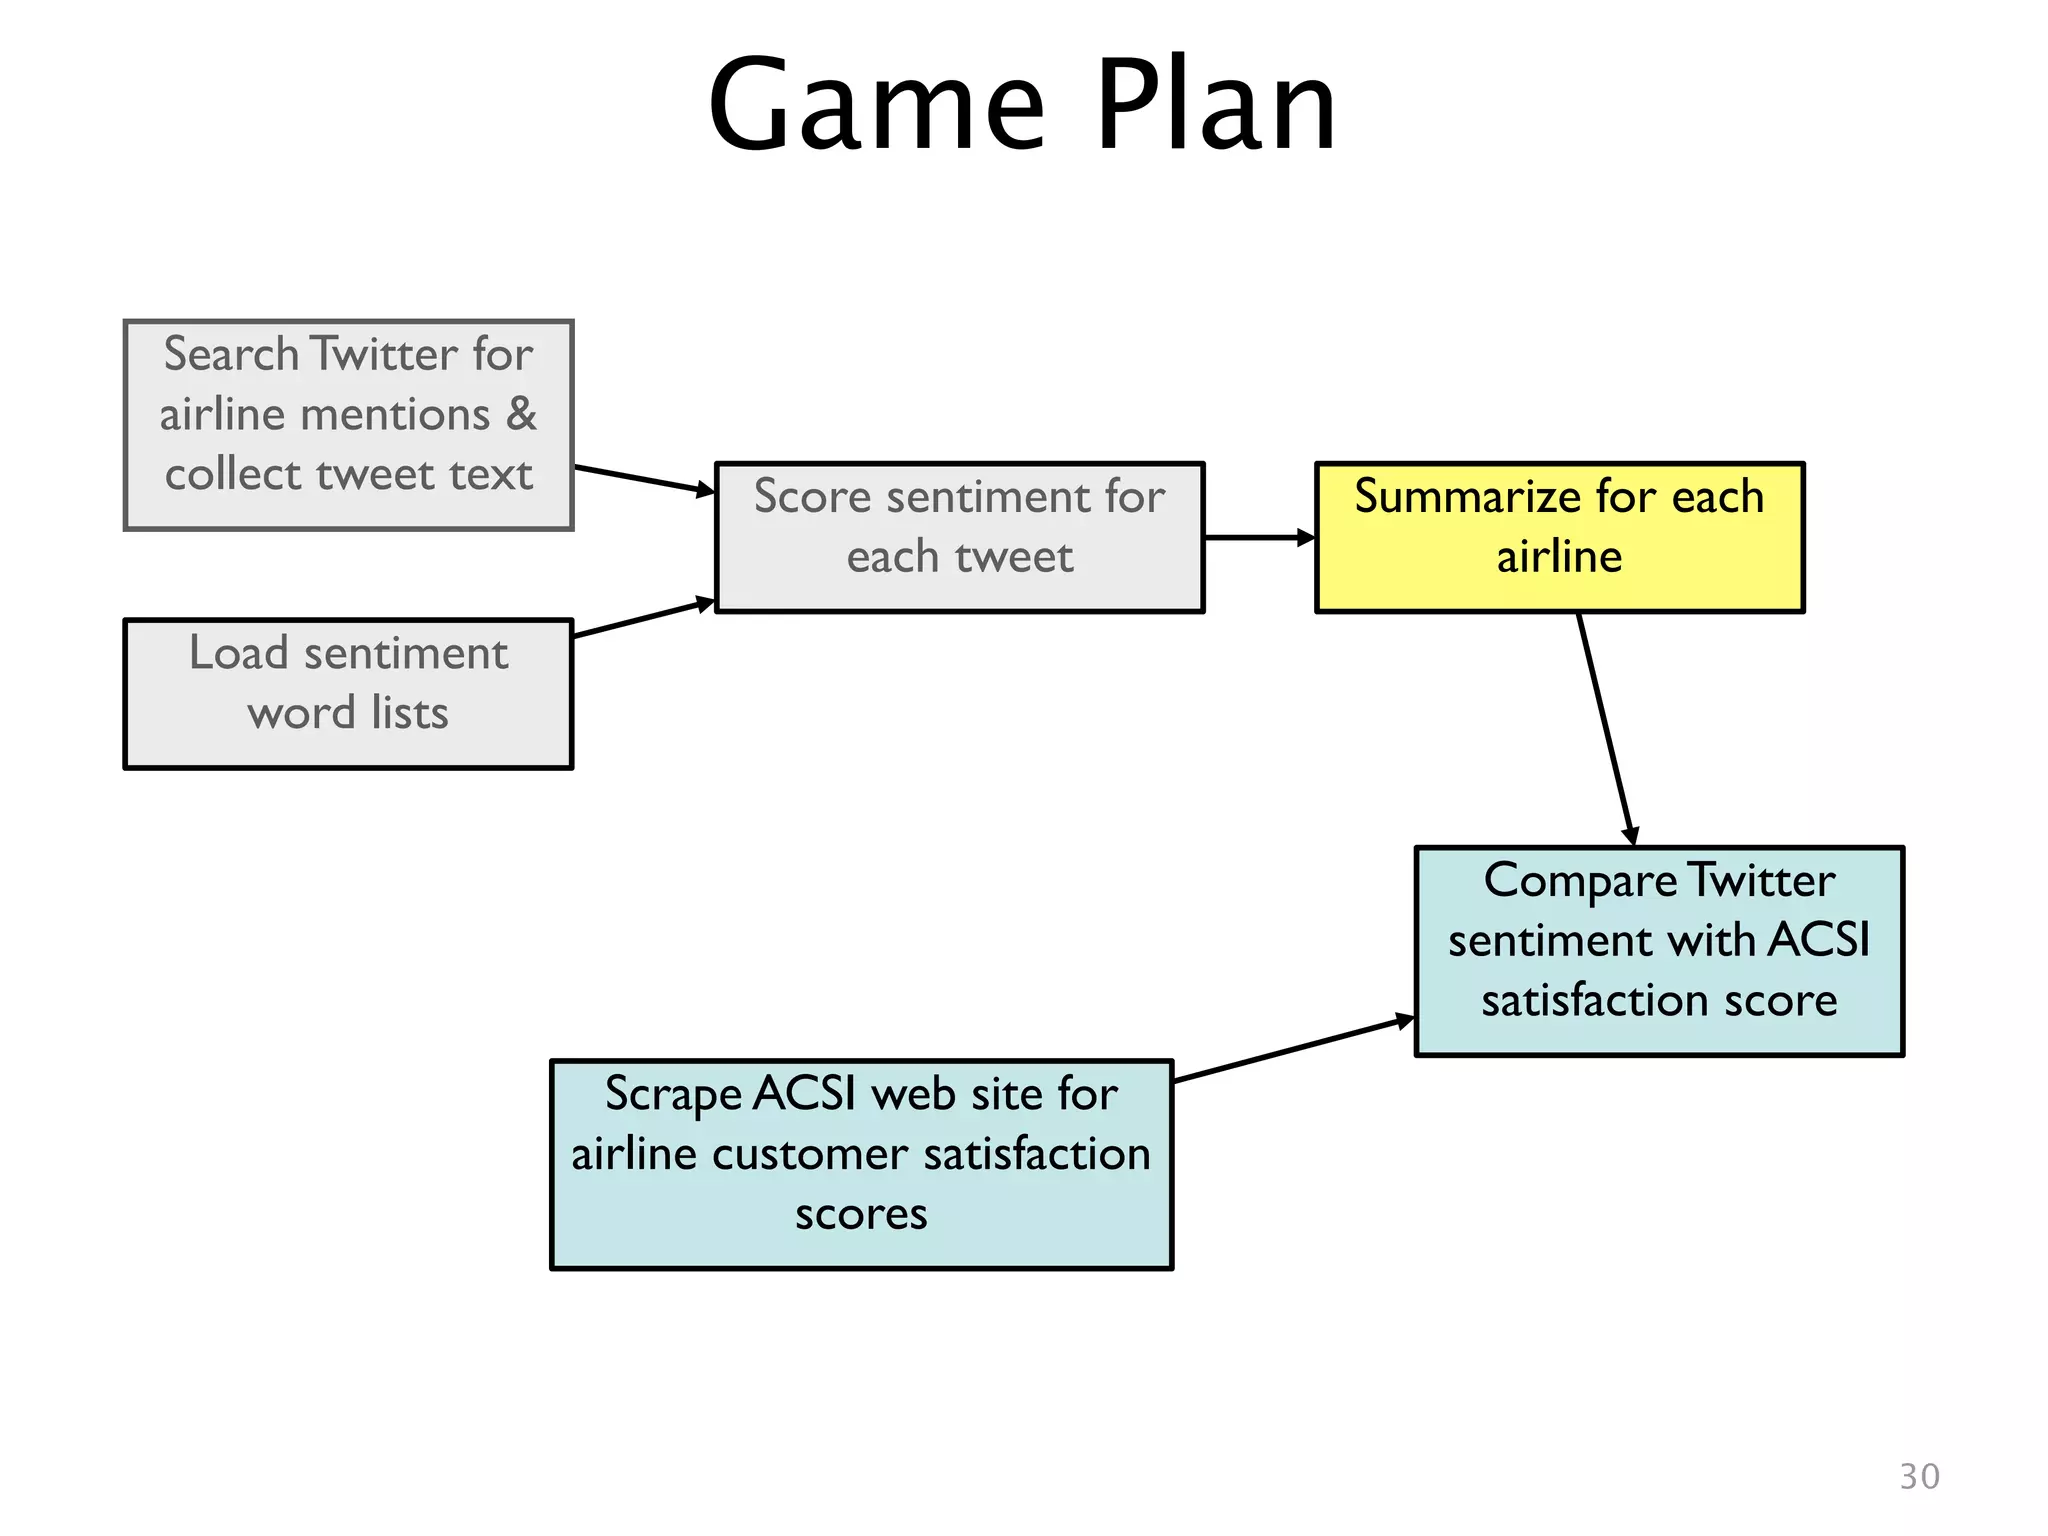
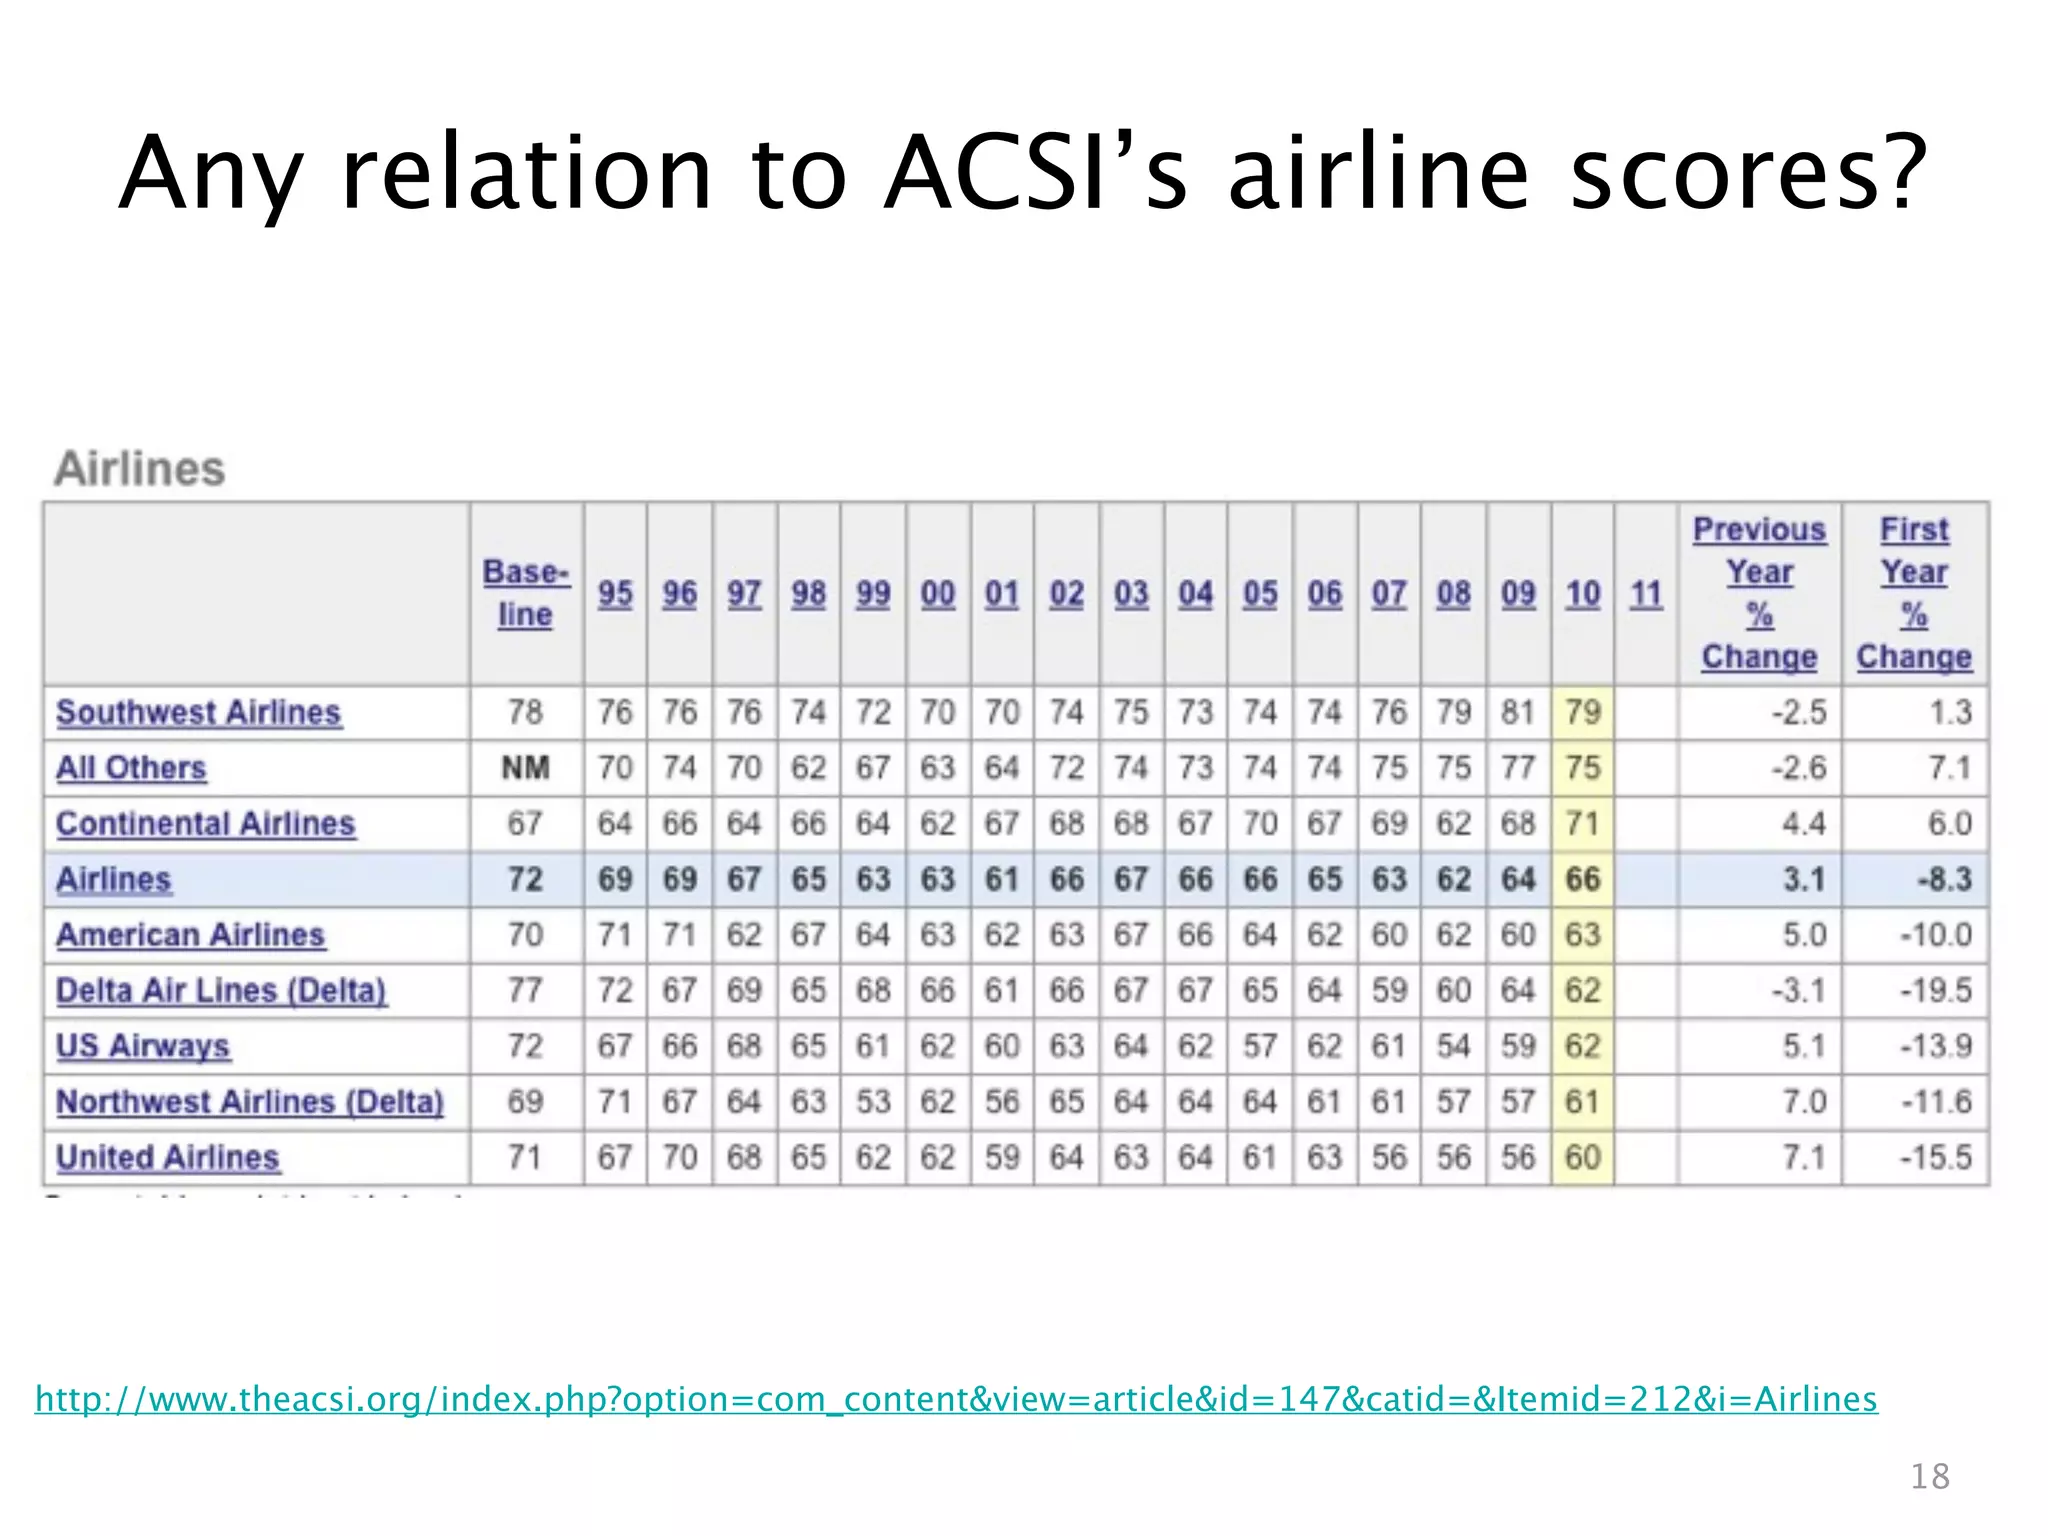
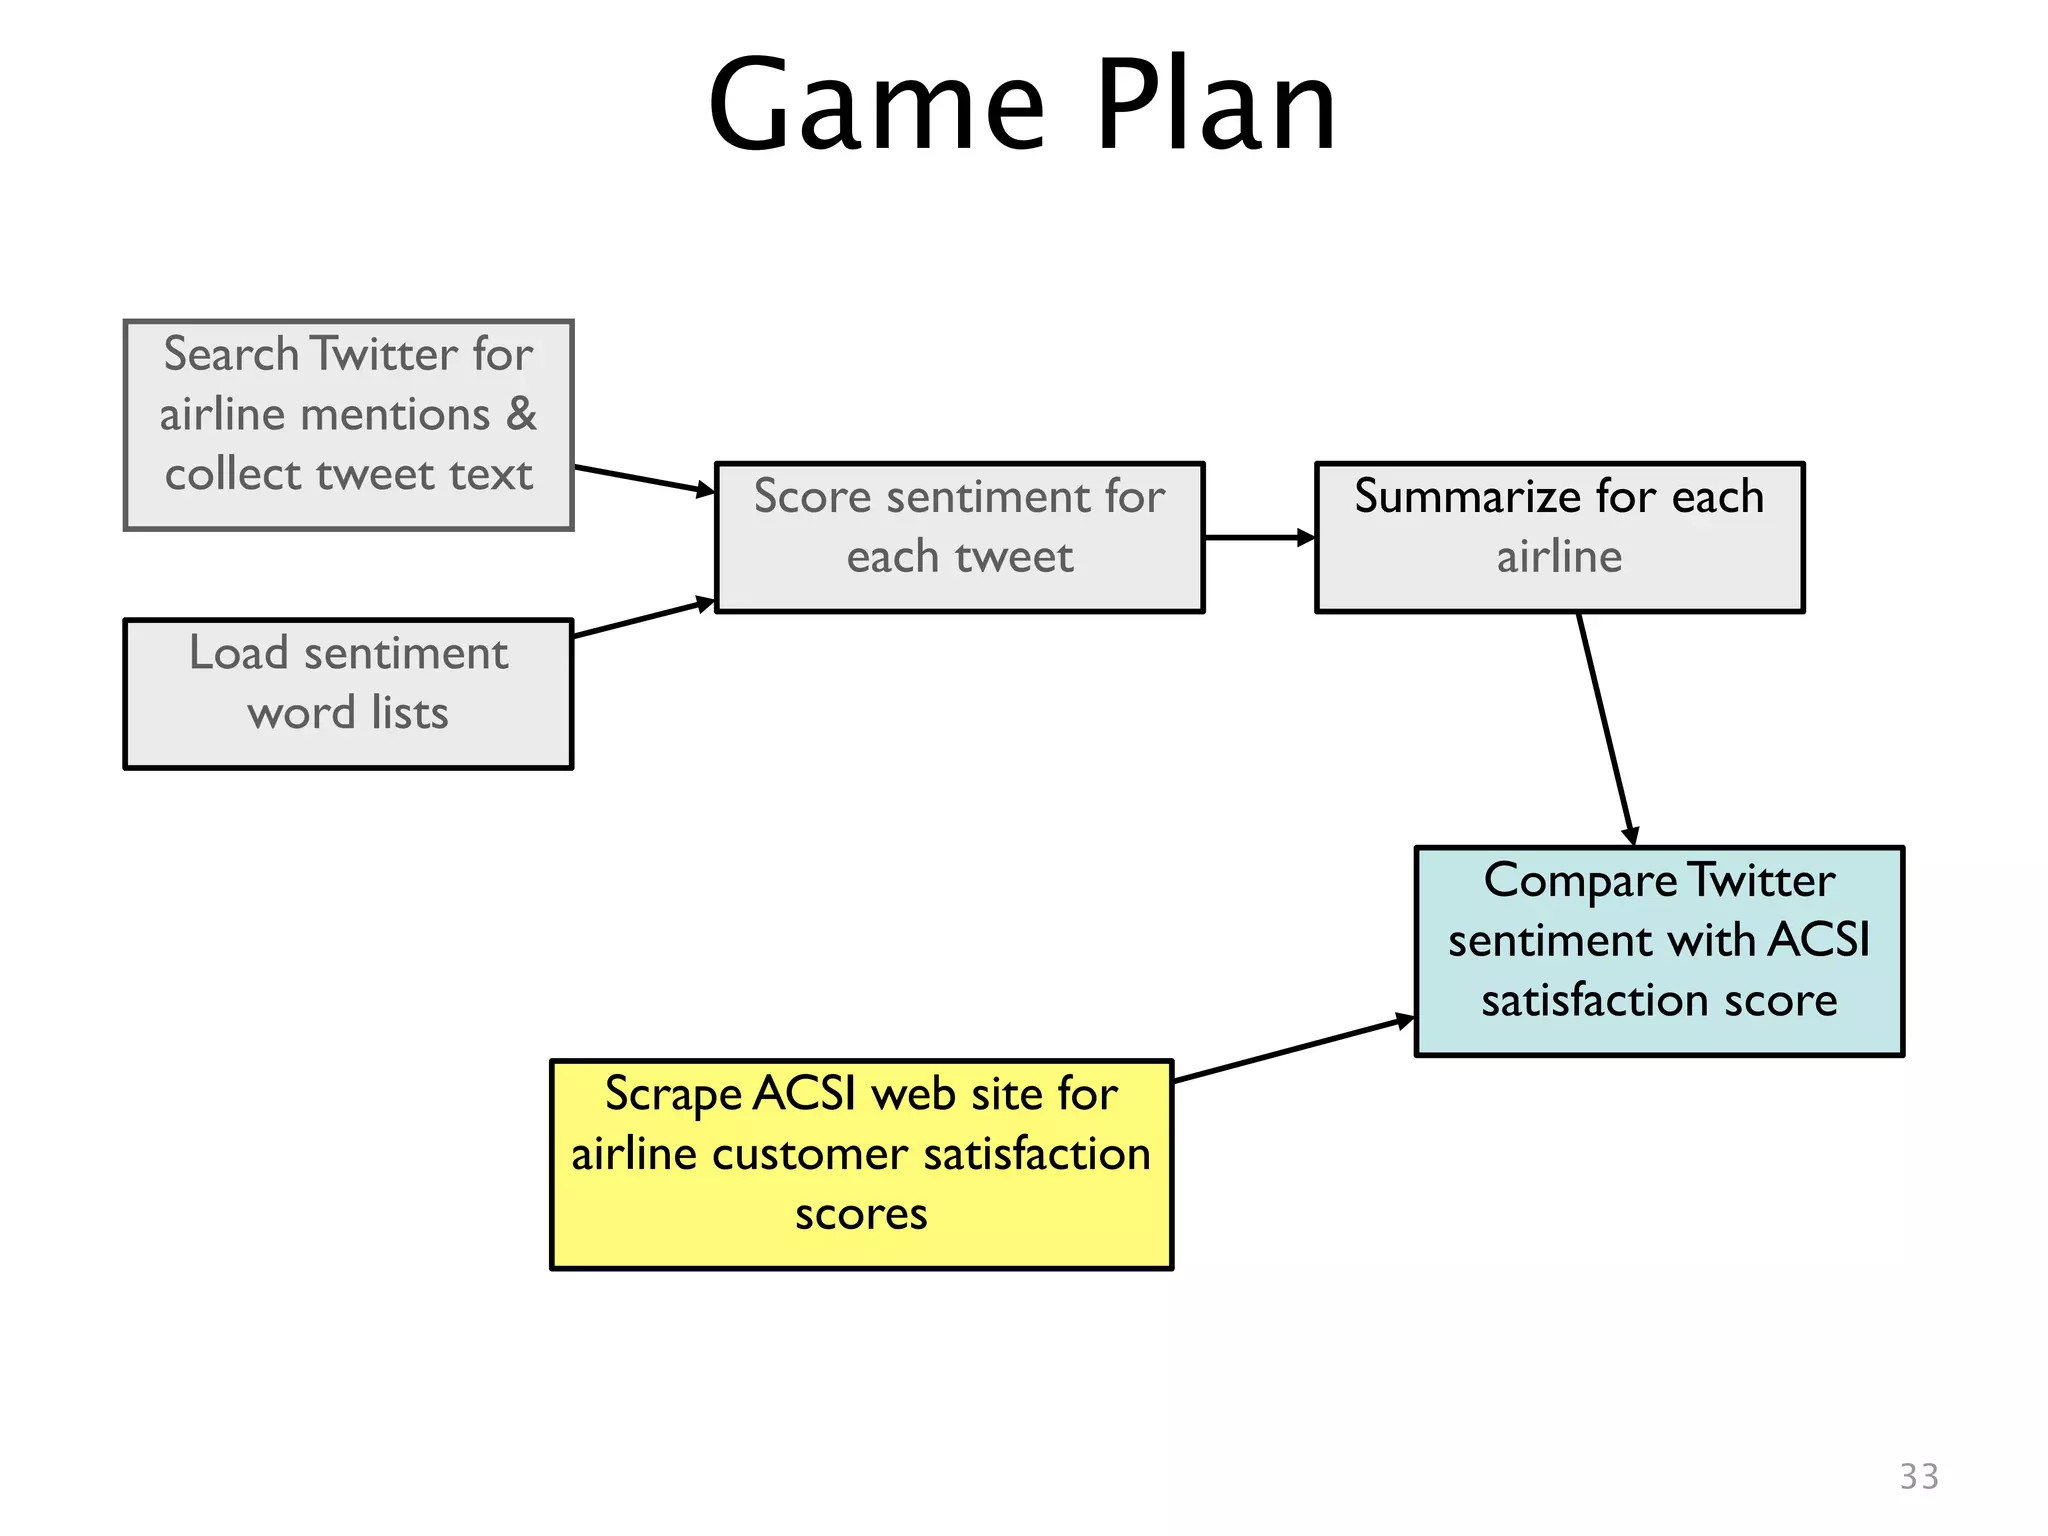
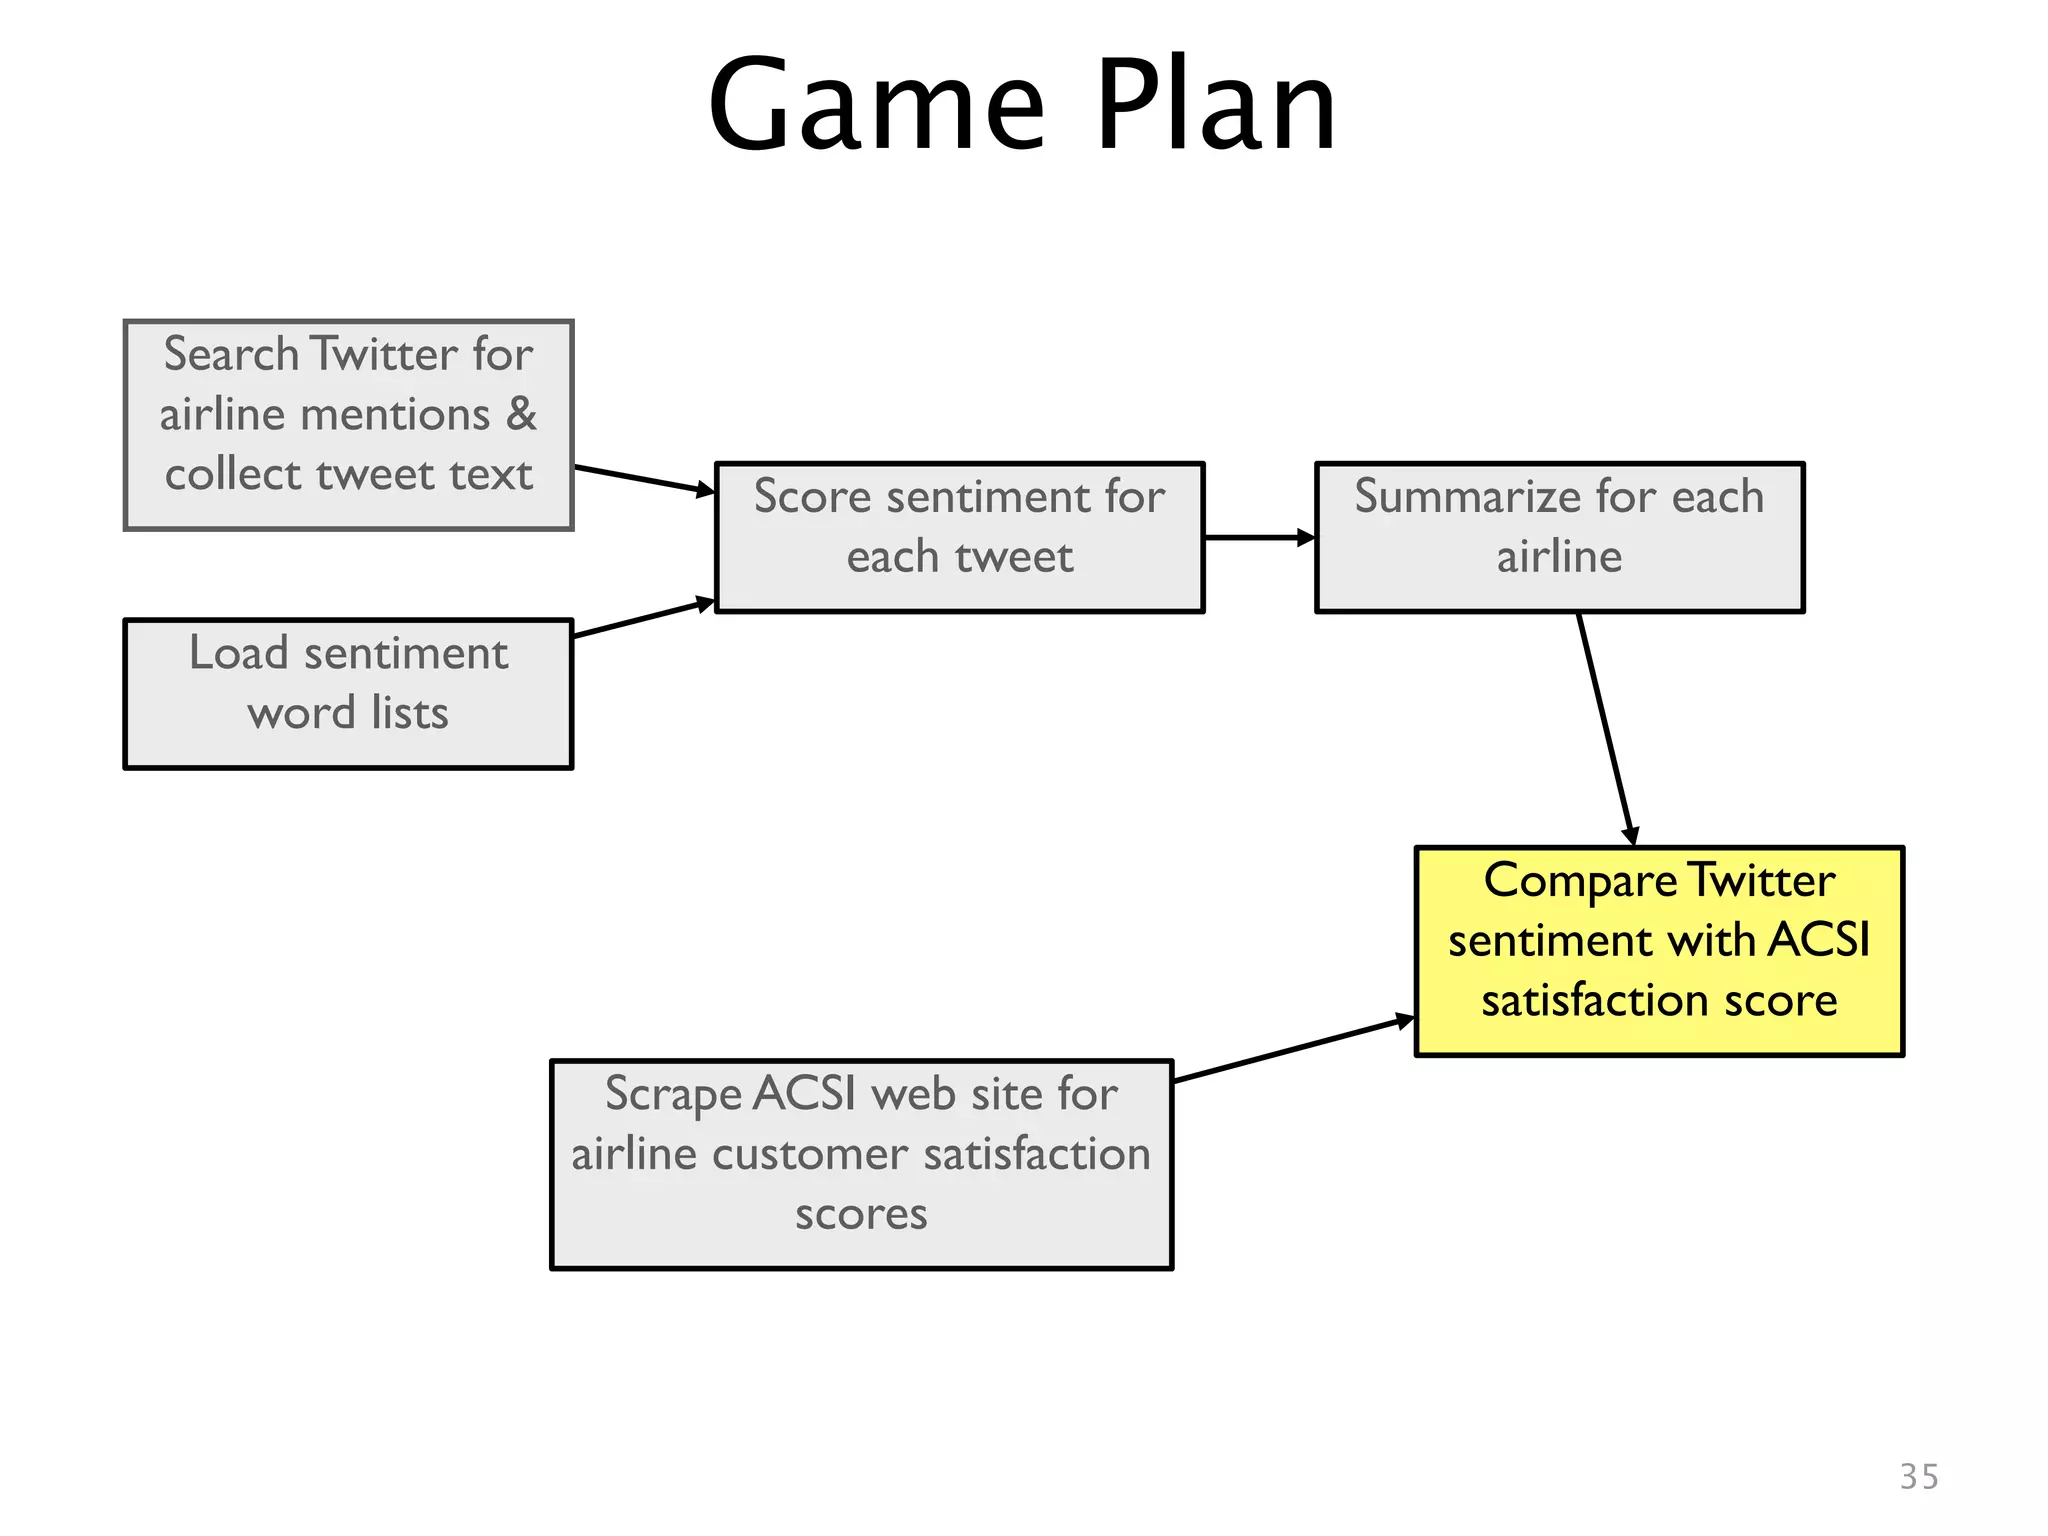
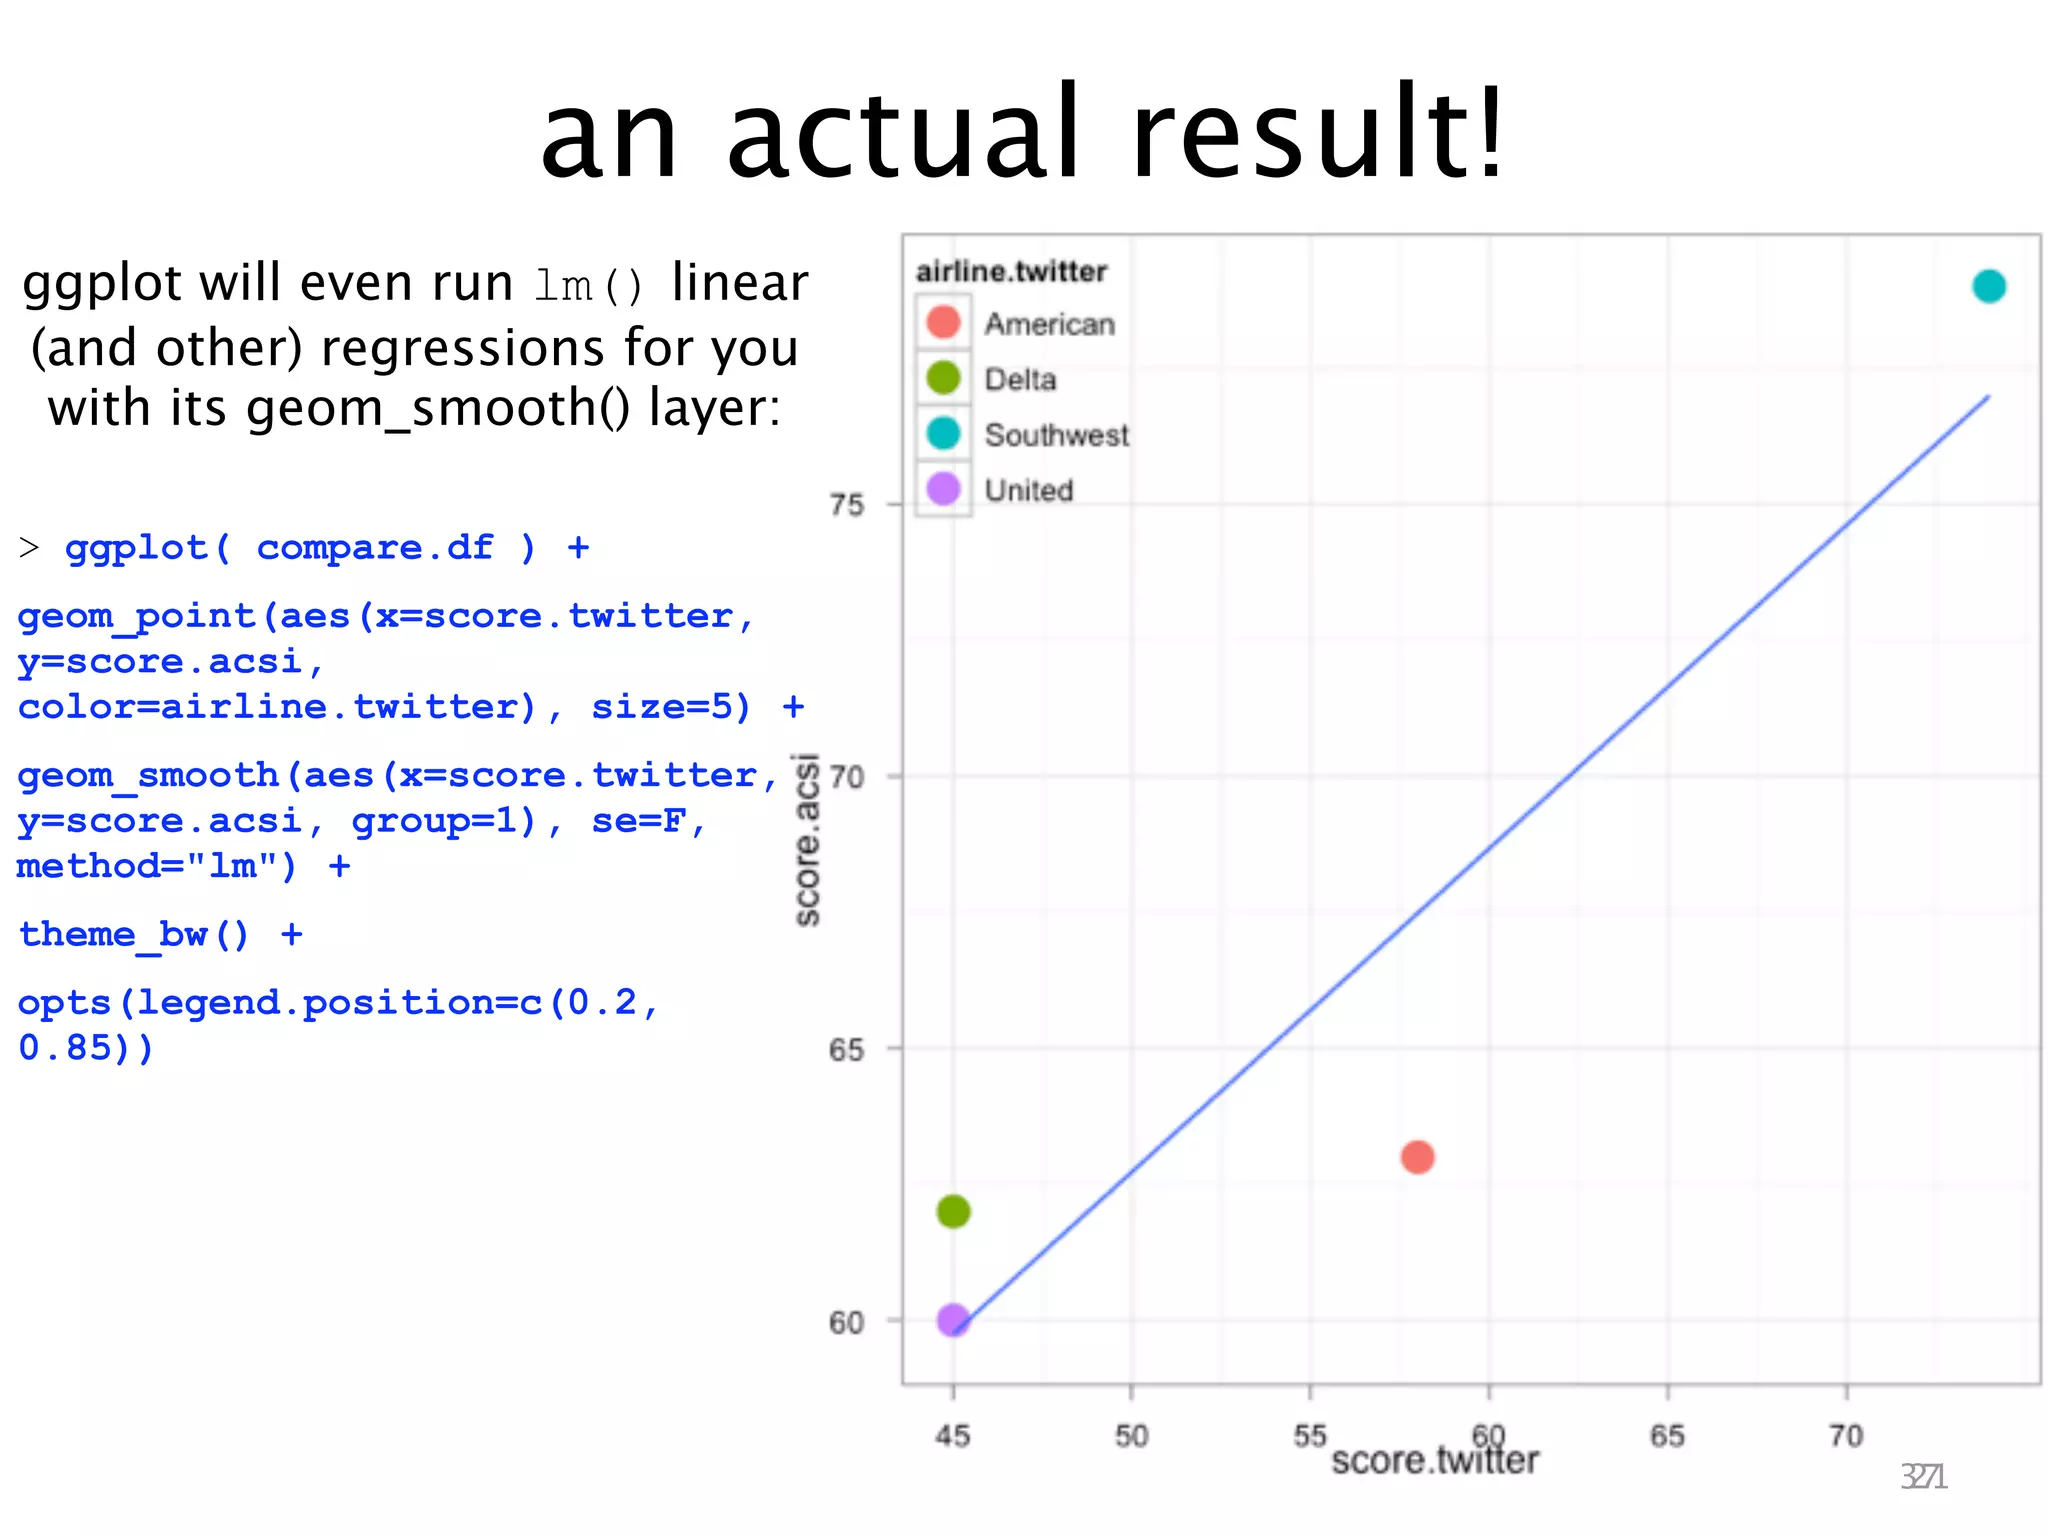
This document describes analyzing sentiment towards airlines on Twitter. It searches Twitter for mentions of airlines, collects the tweets, scores the sentiment of each tweet using a simple word counting algorithm, and summarizes the results for each airline. It then compares the Twitter sentiment scores to customer satisfaction scores from the American Customer Satisfaction Index. A linear regression shows a relationship between the Twitter and ACSI scores, suggesting Twitter sentiment analysis can provide insights into customer satisfaction.


![Social text sentiment and tone analysis [aai 201] - (4160)](https://cdn.slidesharecdn.com/ss_thumbnails/socialtextsentimentandtoneanalysisaai-201-4160-130415092225-phpapp01-thumbnail.jpg?width=640&height=640&fit=bounds)


![Support, Monitoring, Continuous Improvement & Scaling Agentic Automation [3/3]](https://cdn.slidesharecdn.com/ss_thumbnails/agenticcommunityseries-day3-cfd-251120170304-ddef8112-thumbnail.jpg?width=640&height=640&fit=bounds)


