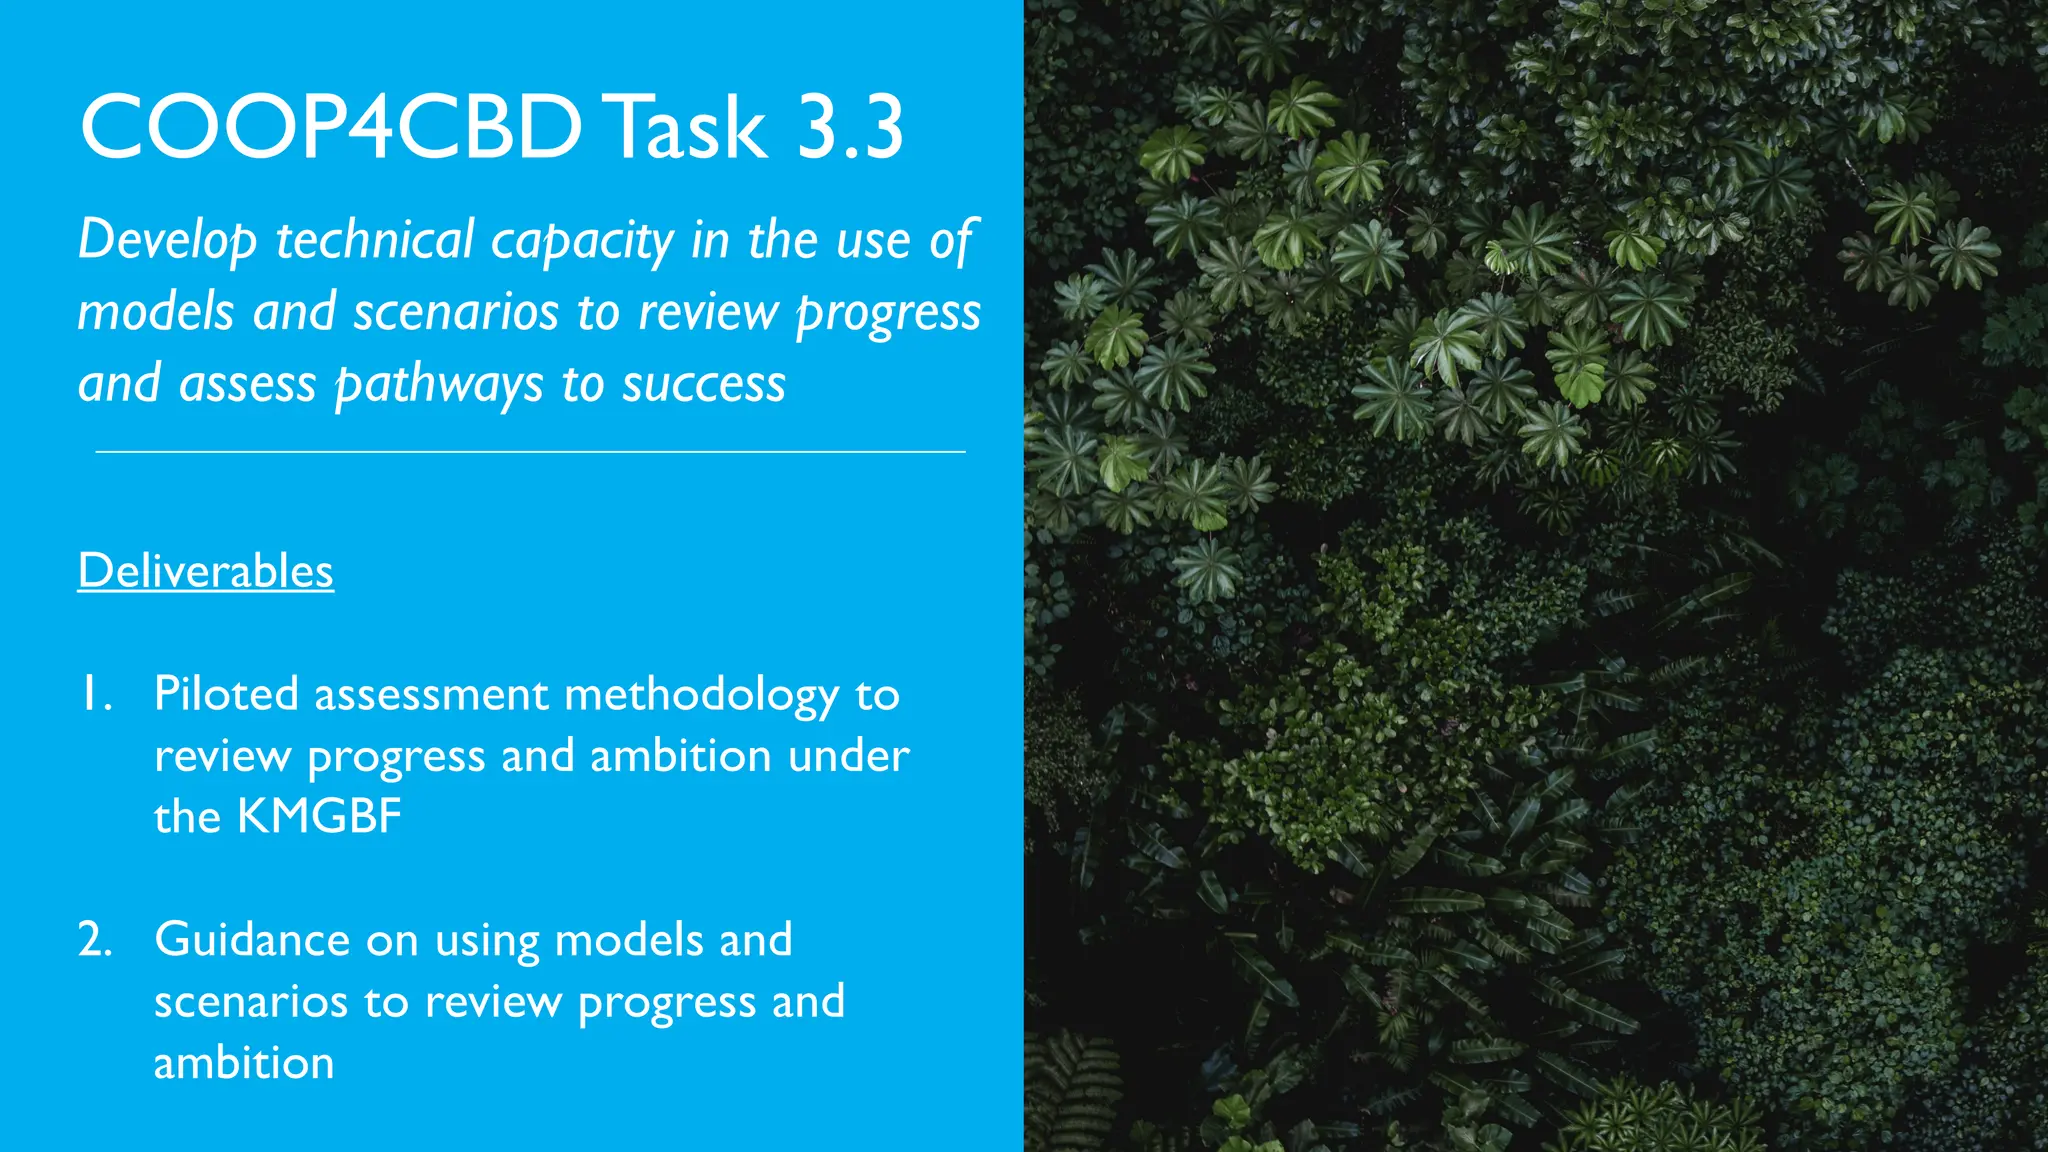
COOP4CBD Task 3.3
Developtechnical capacity in the use of
models and scenarios to review progress
and assess pathways to success
Deliverables
1. Piloted assessment methodology to
review progress and ambition under
the KMGBF
2. Guidance on using models and
scenarios to review progress and
ambition
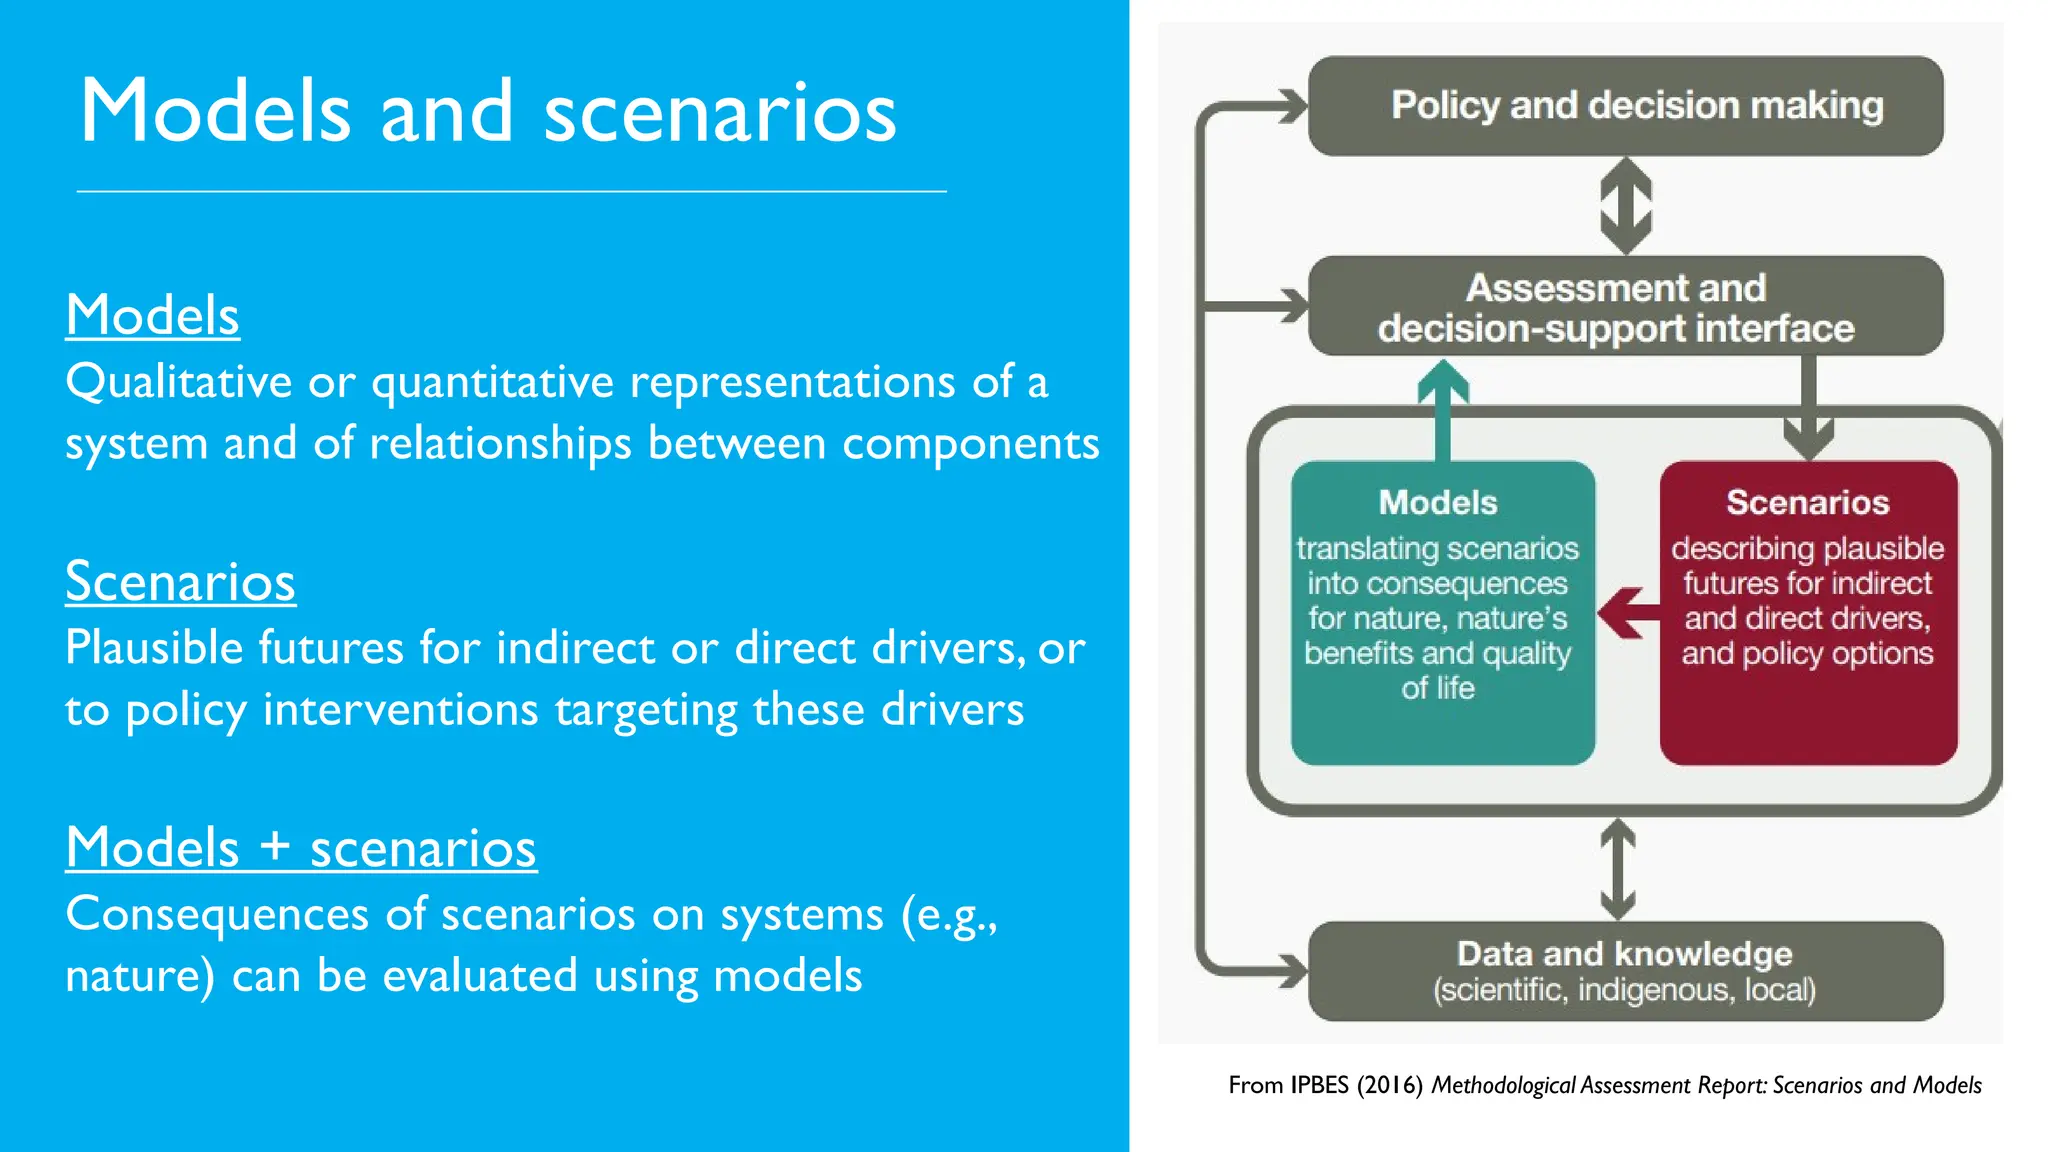
Models and scenarios
FromIPBES (2016) Methodological Assessment Report: Scenarios and Models
Models
Qualitative or quantitative representations of a
system and of relationships between components
Scenarios
Plausible futures for indirect or direct drivers, or
to policy interventions targeting these drivers
Models + scenarios
Consequences of scenarios on systems (e.g.,
nature) can be evaluated using models
6.
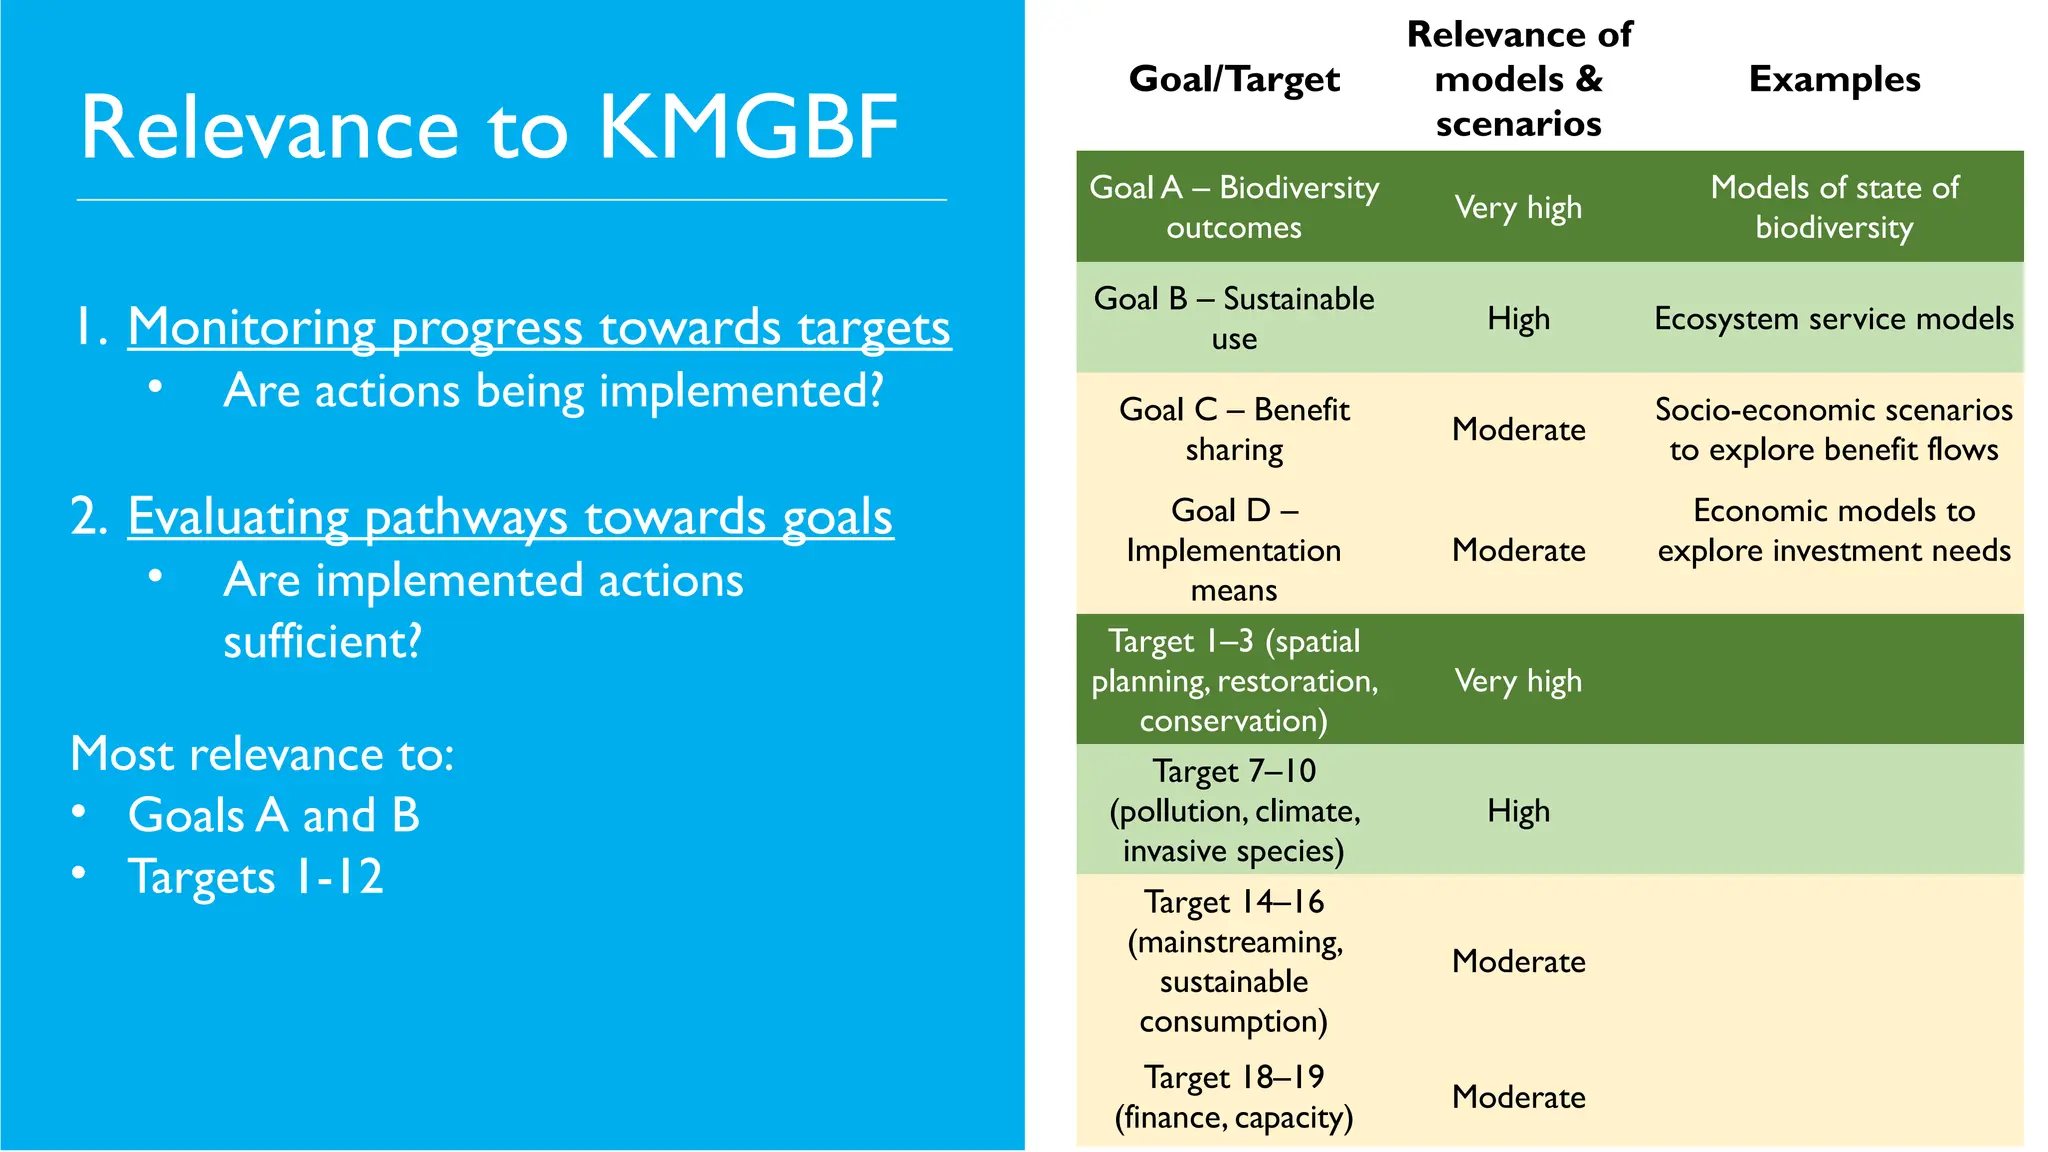
Relevance to KMGBF
Goal/Target
Relevanceof
models &
scenarios
Examples
Goal A – Biodiversity
outcomes
Very high
Models of state of
biodiversity
Goal B – Sustainable
use
High Ecosystem service models
Goal C – Benefit
sharing
Moderate
Socio-economic scenarios
to explore benefit flows
Goal D –
Implementation
means
Moderate
Economic models to
explore investment needs
1. Monitoring progress towards targets
• Are actions being implemented?
2. Evaluating pathways towards goals
• Are implemented actions
sufficient?
Most relevance to:
• Goals A and B
• Targets 1-12
Target 1–3 (spatial
planning, restoration,
conservation)
Very high
Target 7–10
(pollution, climate,
invasive species)
High
Target 14–16
(mainstreaming,
sustainable
consumption)
Moderate
Target 18–19
(finance, capacity)
Moderate
7.
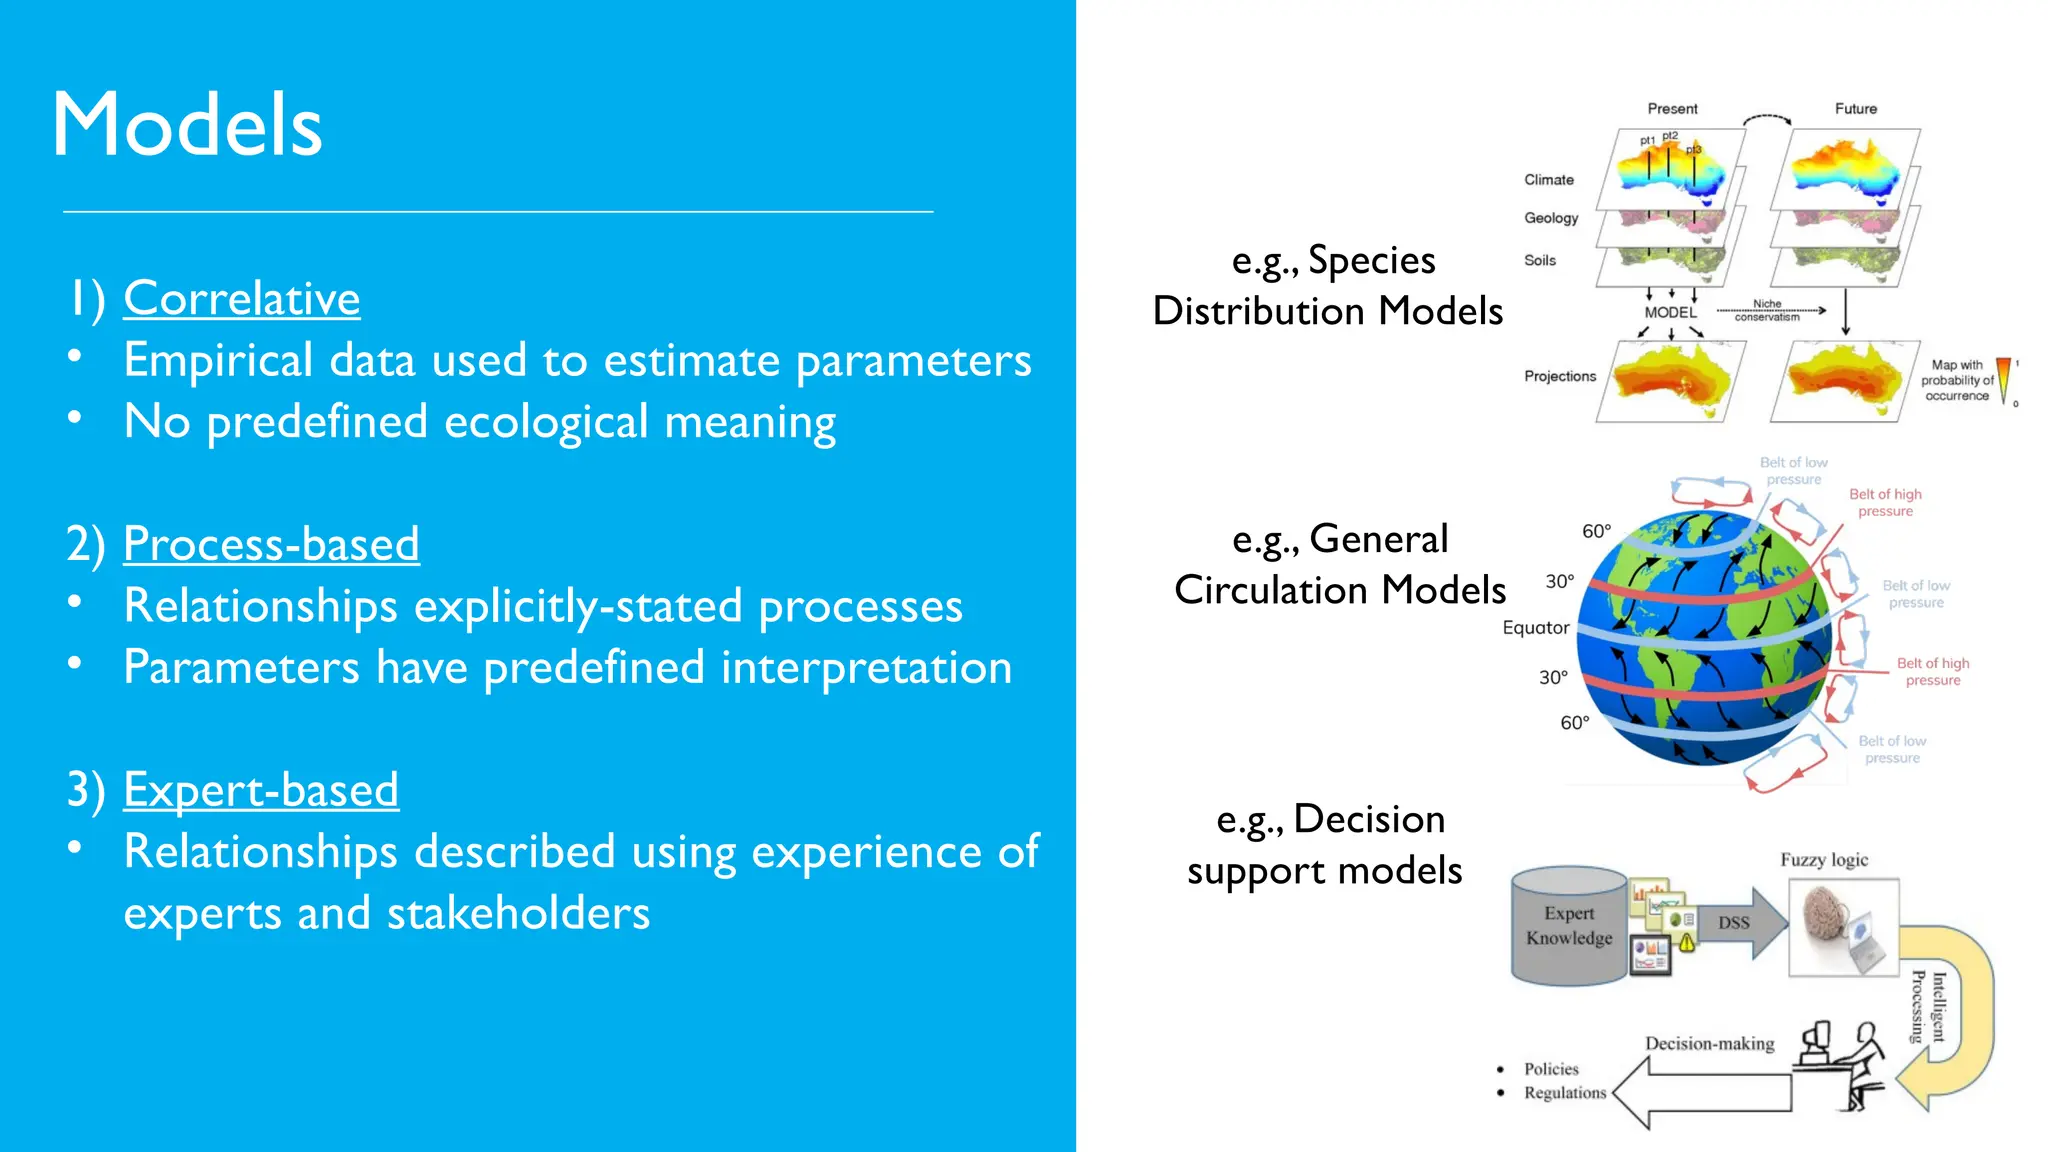
Models
1) Correlative
• Empiricaldata used to estimate parameters
• No predefined ecological meaning
2) Process-based
• Relationships explicitly-stated processes
• Parameters have predefined interpretation
3) Expert-based
• Relationships described using experience of
experts and stakeholders
e.g., General
Circulation Models
e.g., Species
Distribution Models
e.g., Decision
support models
8.
Models and indicators
Twotypes of biodiversity indicator:
Compiled indicators
- Trends determined from data on
biodiversity
- May incorporate some modelling e.g.,
gap-filling, correcting biases, smoothing
Model-based indicators
- Trends estimated from models that
incorporate drivers of change
- Can project whether a set of proposed
actions are expected to be sufficient to
achieve goals
A.3 Red List Index
Biodiversity Intactness Index
9.
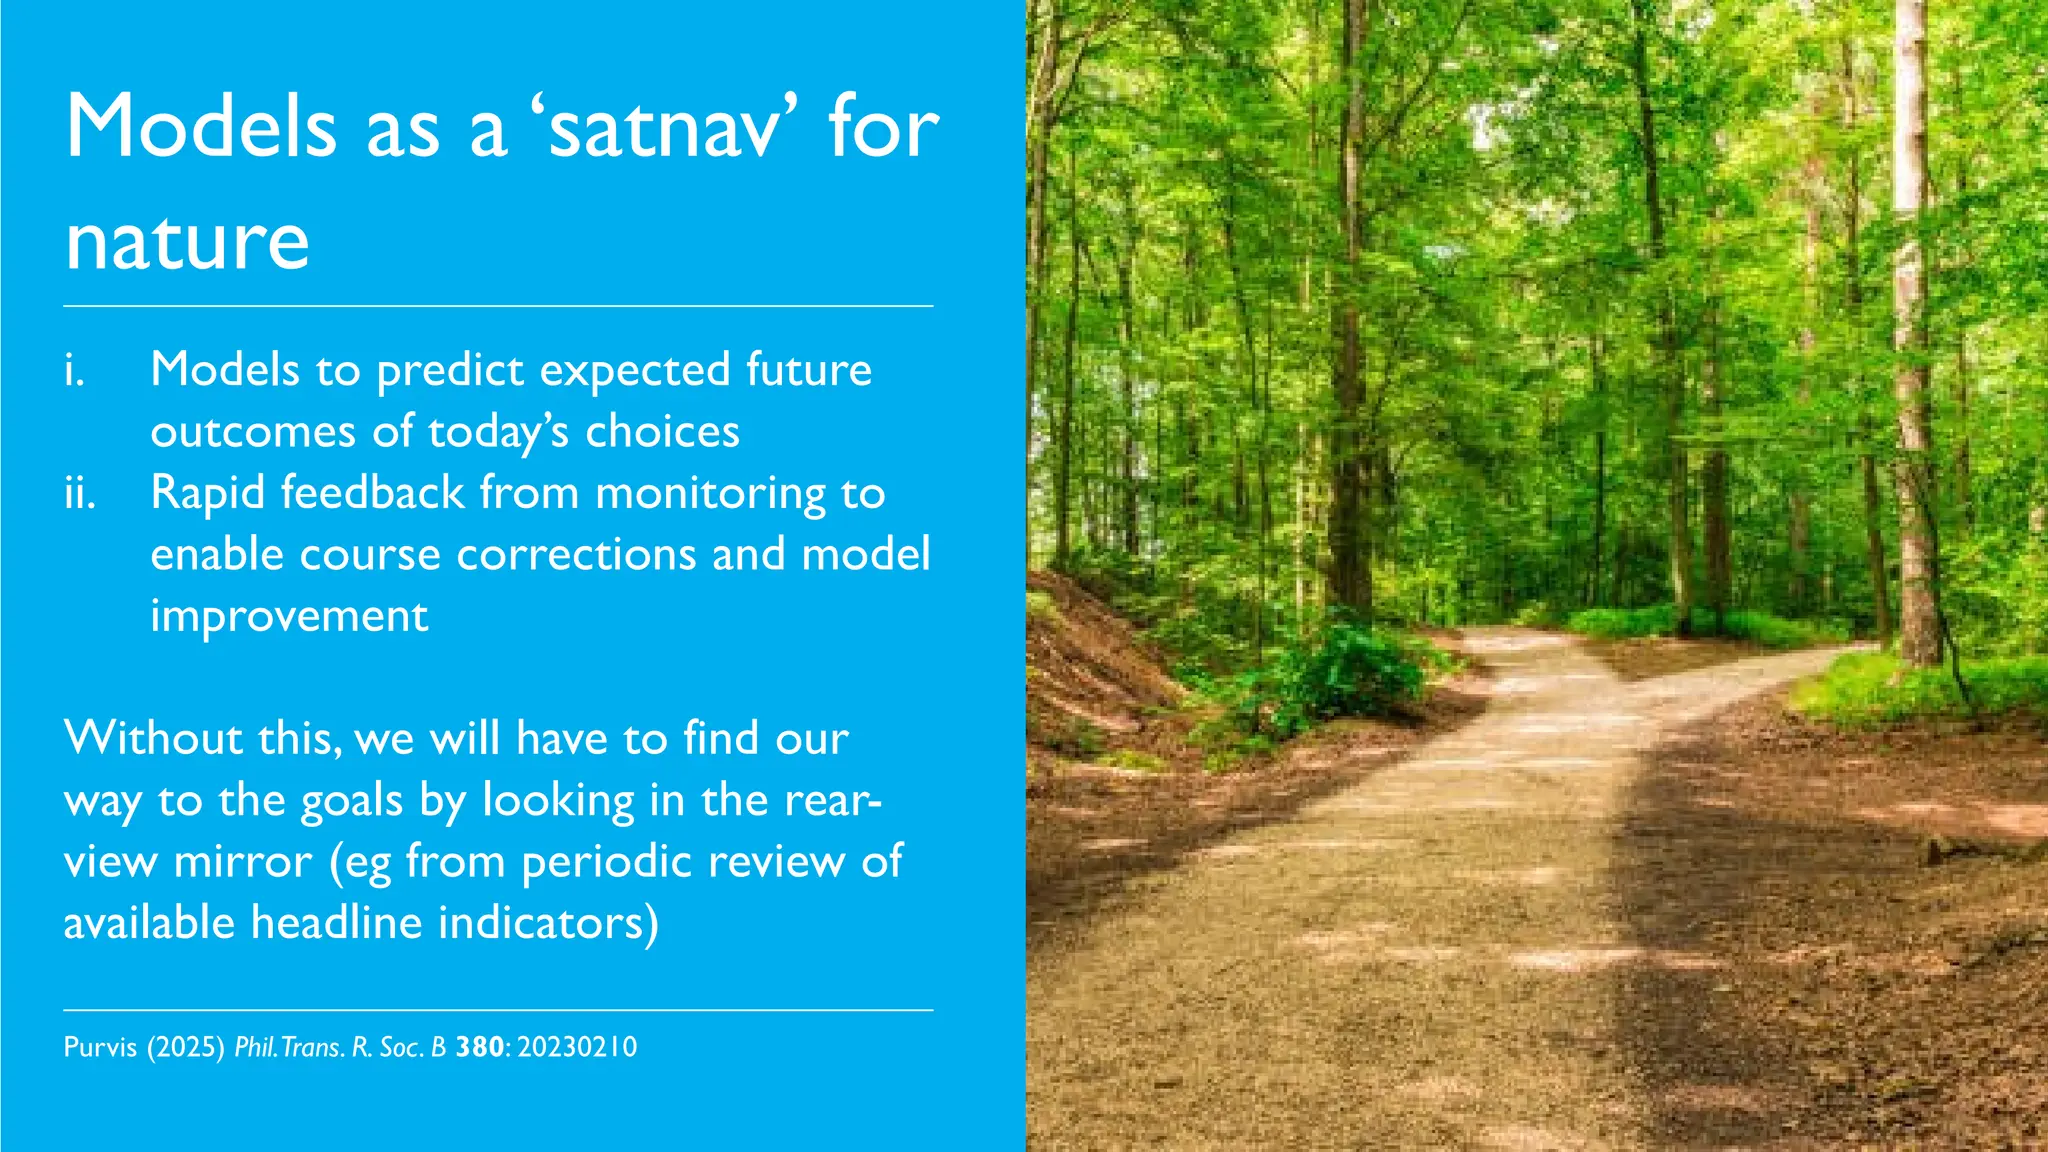
Models as a‘satnav’ for
nature
i. Models to predict expected future
outcomes of today’s choices
ii. Rapid feedback from monitoring to
enable course corrections and model
improvement
Without this, we will have to find our
way to the goals by looking in the rear-
view mirror (eg from periodic review of
available headline indicators)
Purvis (2025) Phil.Trans. R. Soc. B 380: 20230210
10.
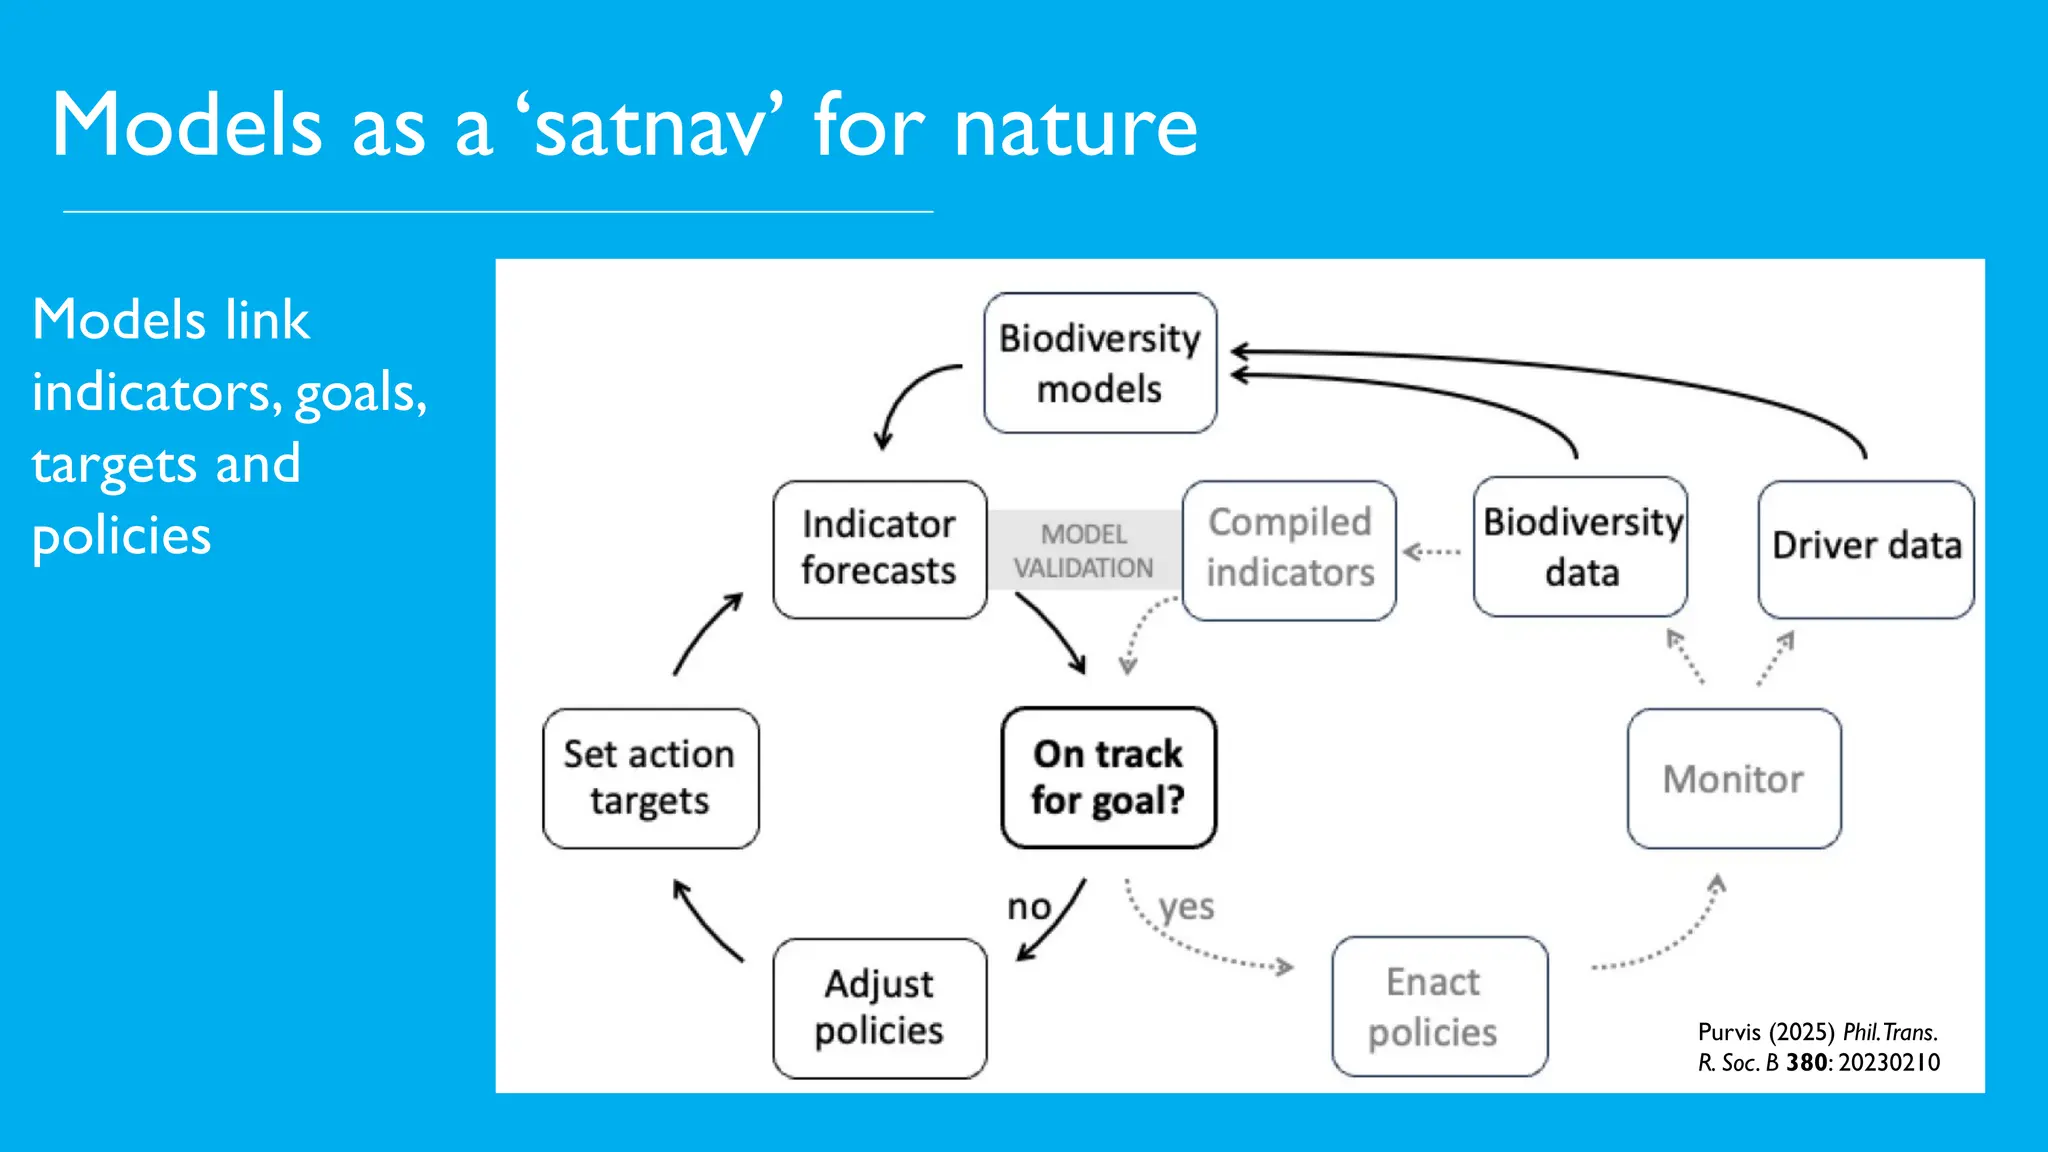
Models as a‘satnav’ for nature
Purvis (2025) Phil.Trans.
R. Soc. B 380: 20230210
Models link
indicators, goals,
targets and
policies
11.
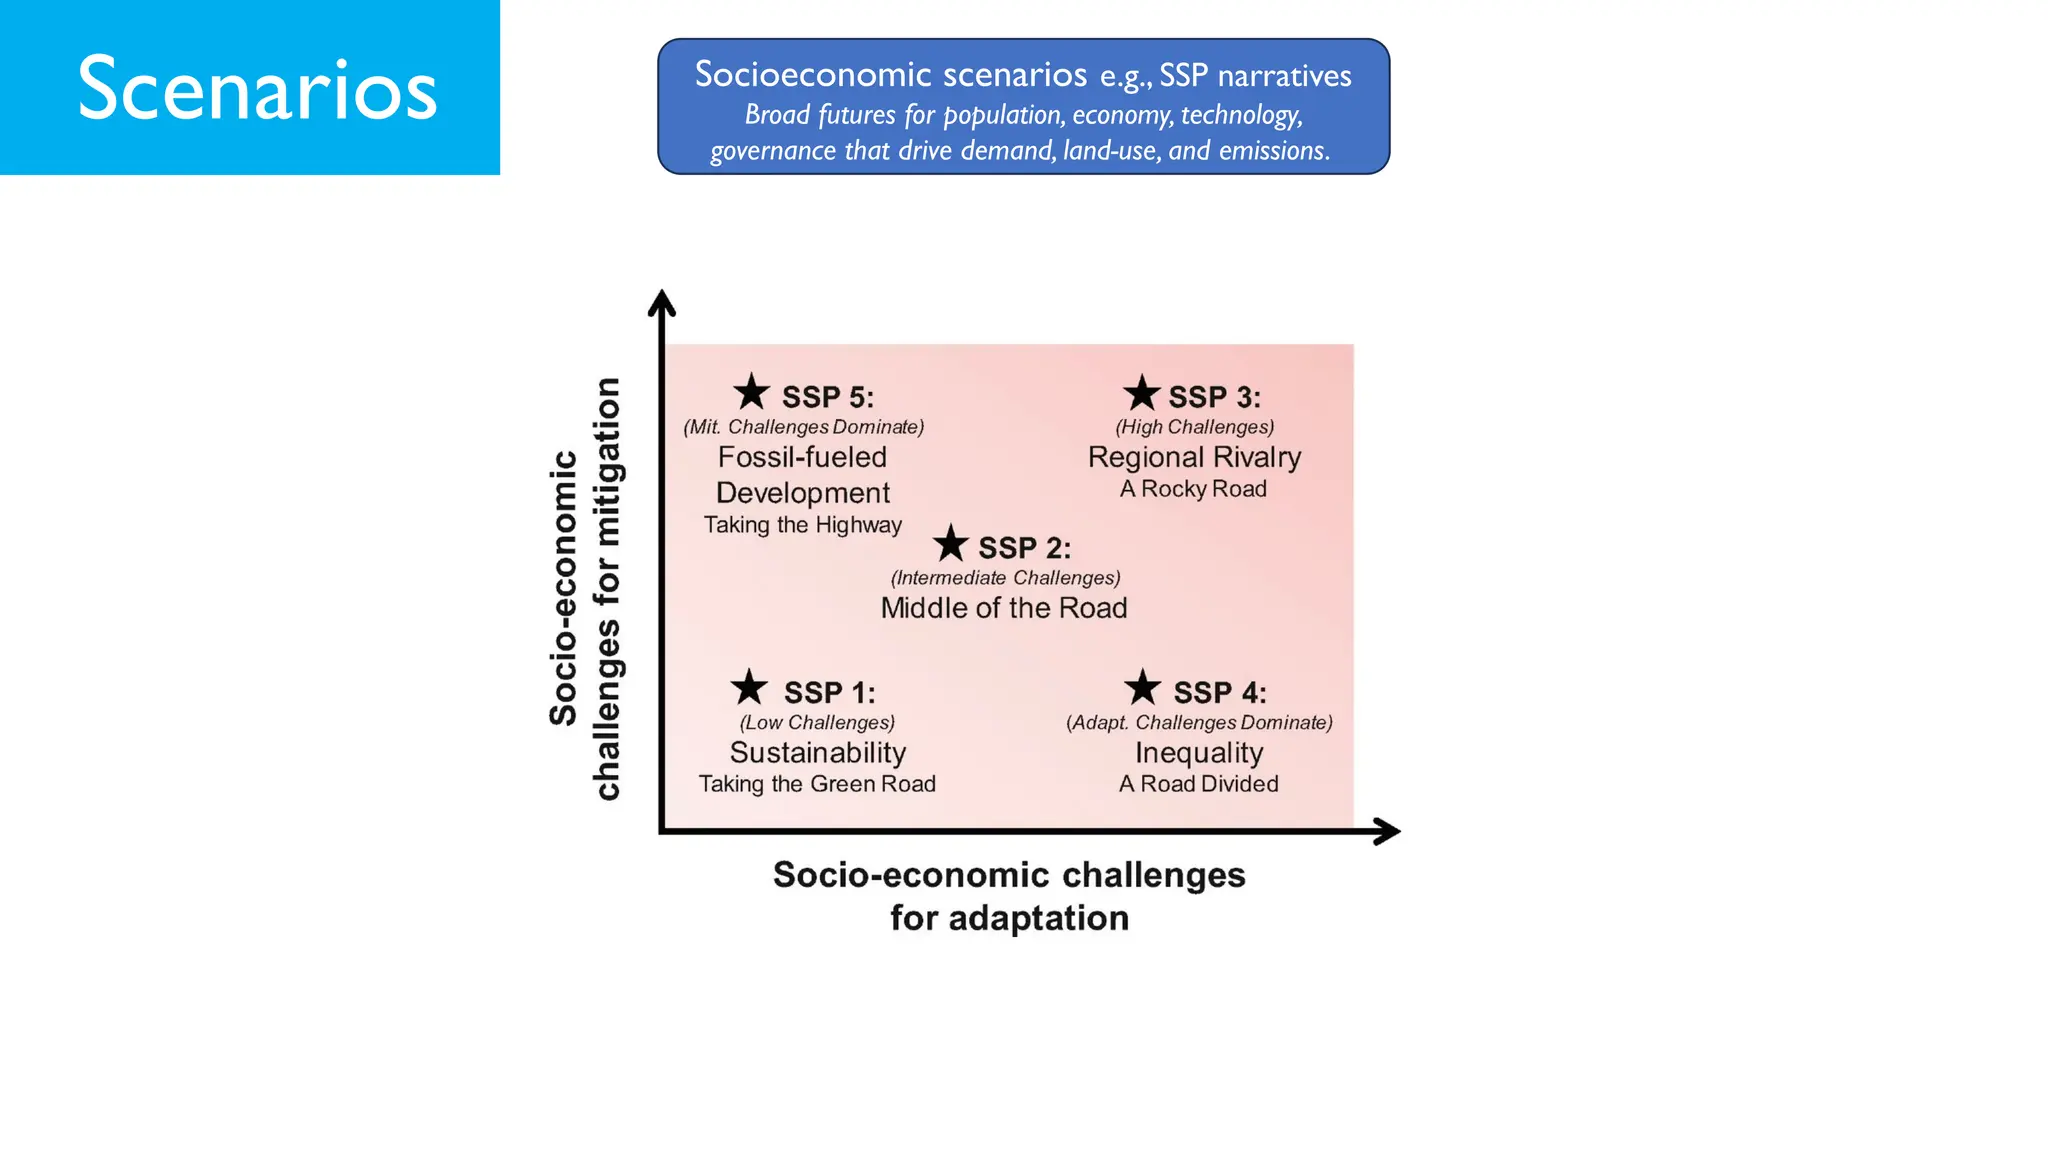
Scenarios Socioeconomic scenariose.g., SSP narratives
Broad futures for population, economy, technology,
governance that drive demand, land-use, and emissions.
12.
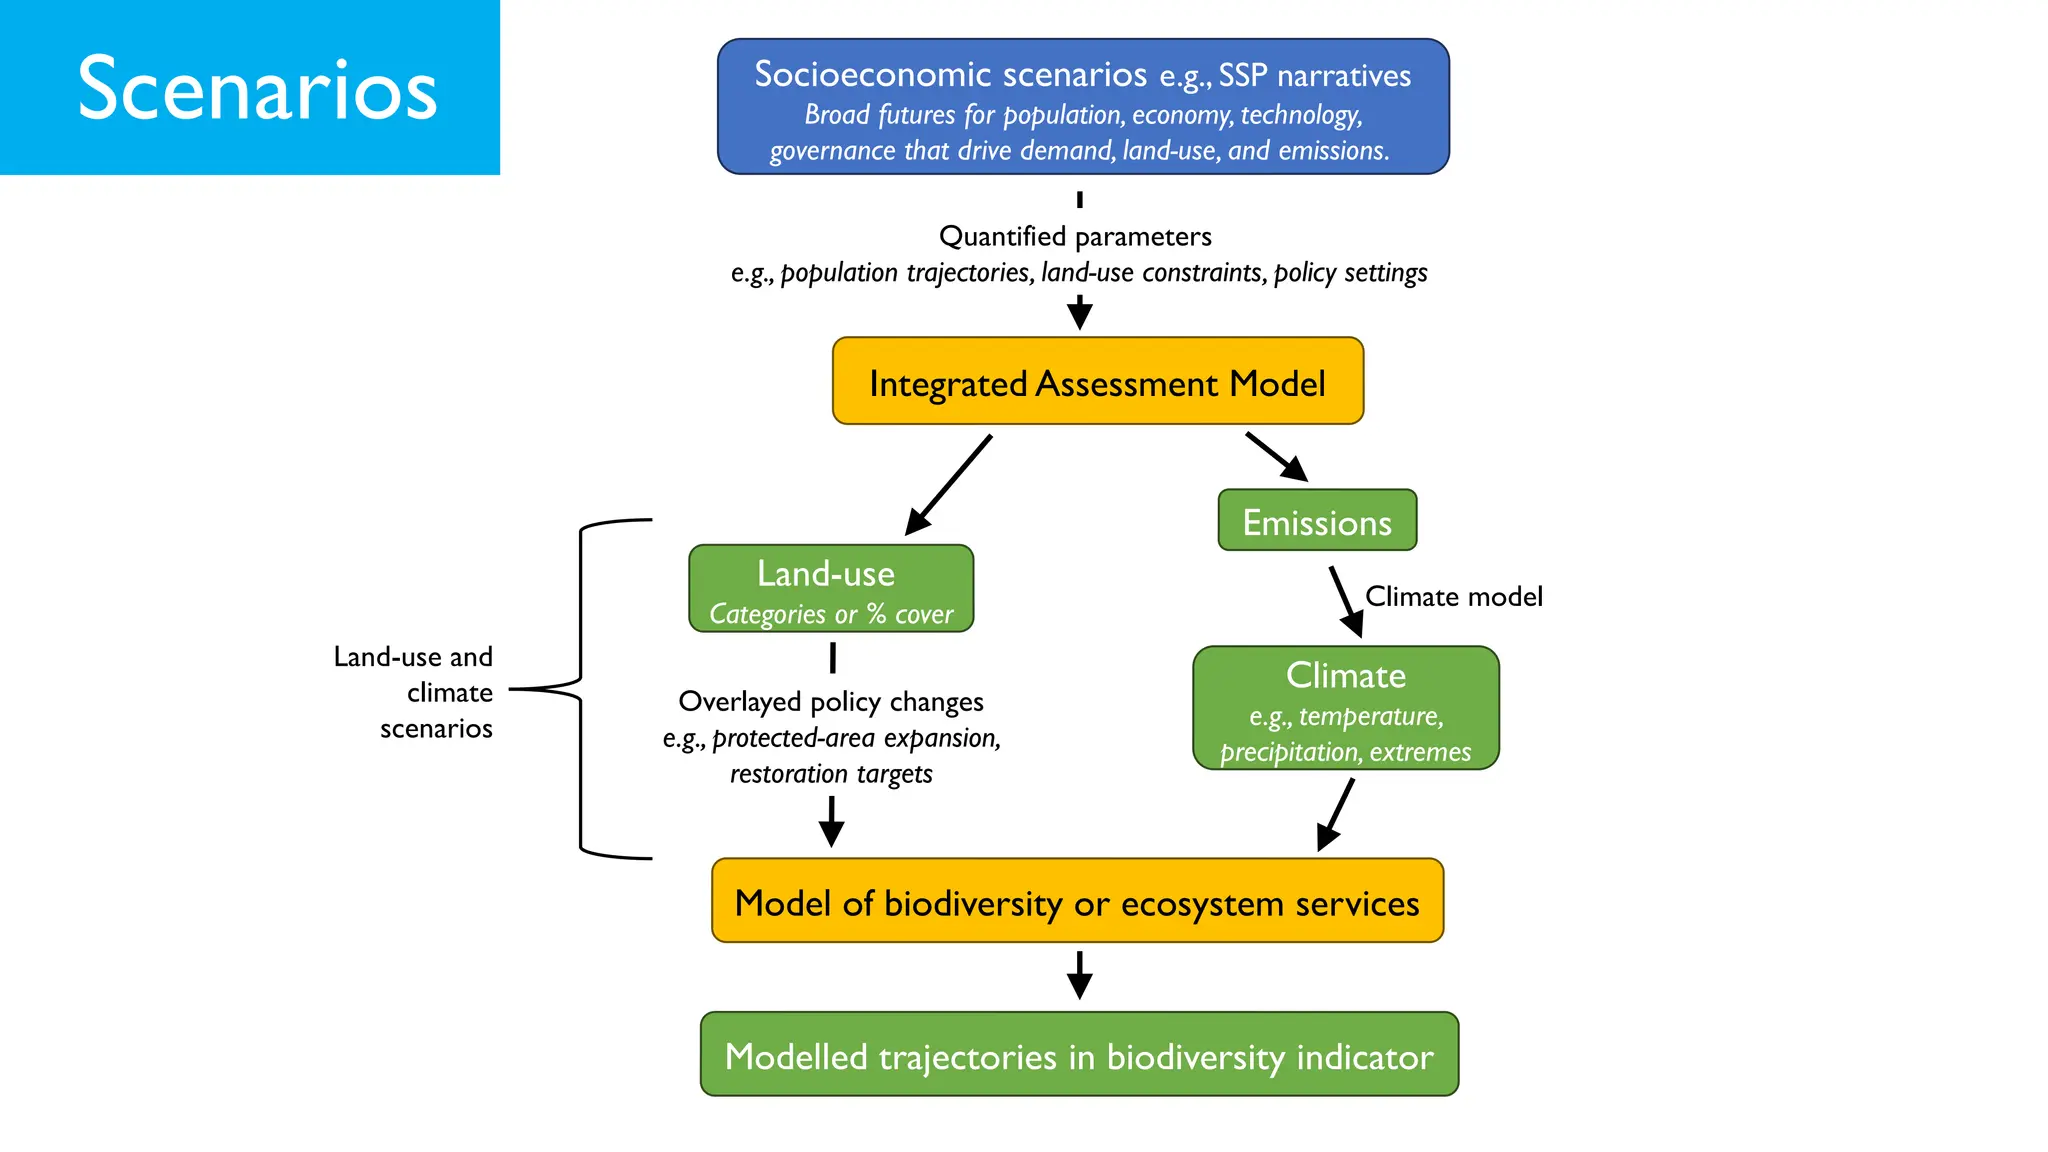
Scenarios Socioeconomic scenariose.g., SSP narratives
Broad futures for population, economy, technology,
governance that drive demand, land-use, and emissions.
Integrated Assessment Model
Quantified parameters
e.g., population trajectories, land-use constraints, policy settings
Emissions
Land-use
Categories or % cover
Climate
e.g., temperature,
precipitation, extremes
Climate model
Model of biodiversity or ecosystem services
Modelled trajectories in biodiversity indicator
Overlayed policy changes
e.g., protected-area expansion,
restoration targets
Land-use and
climate
scenarios
Scenarios
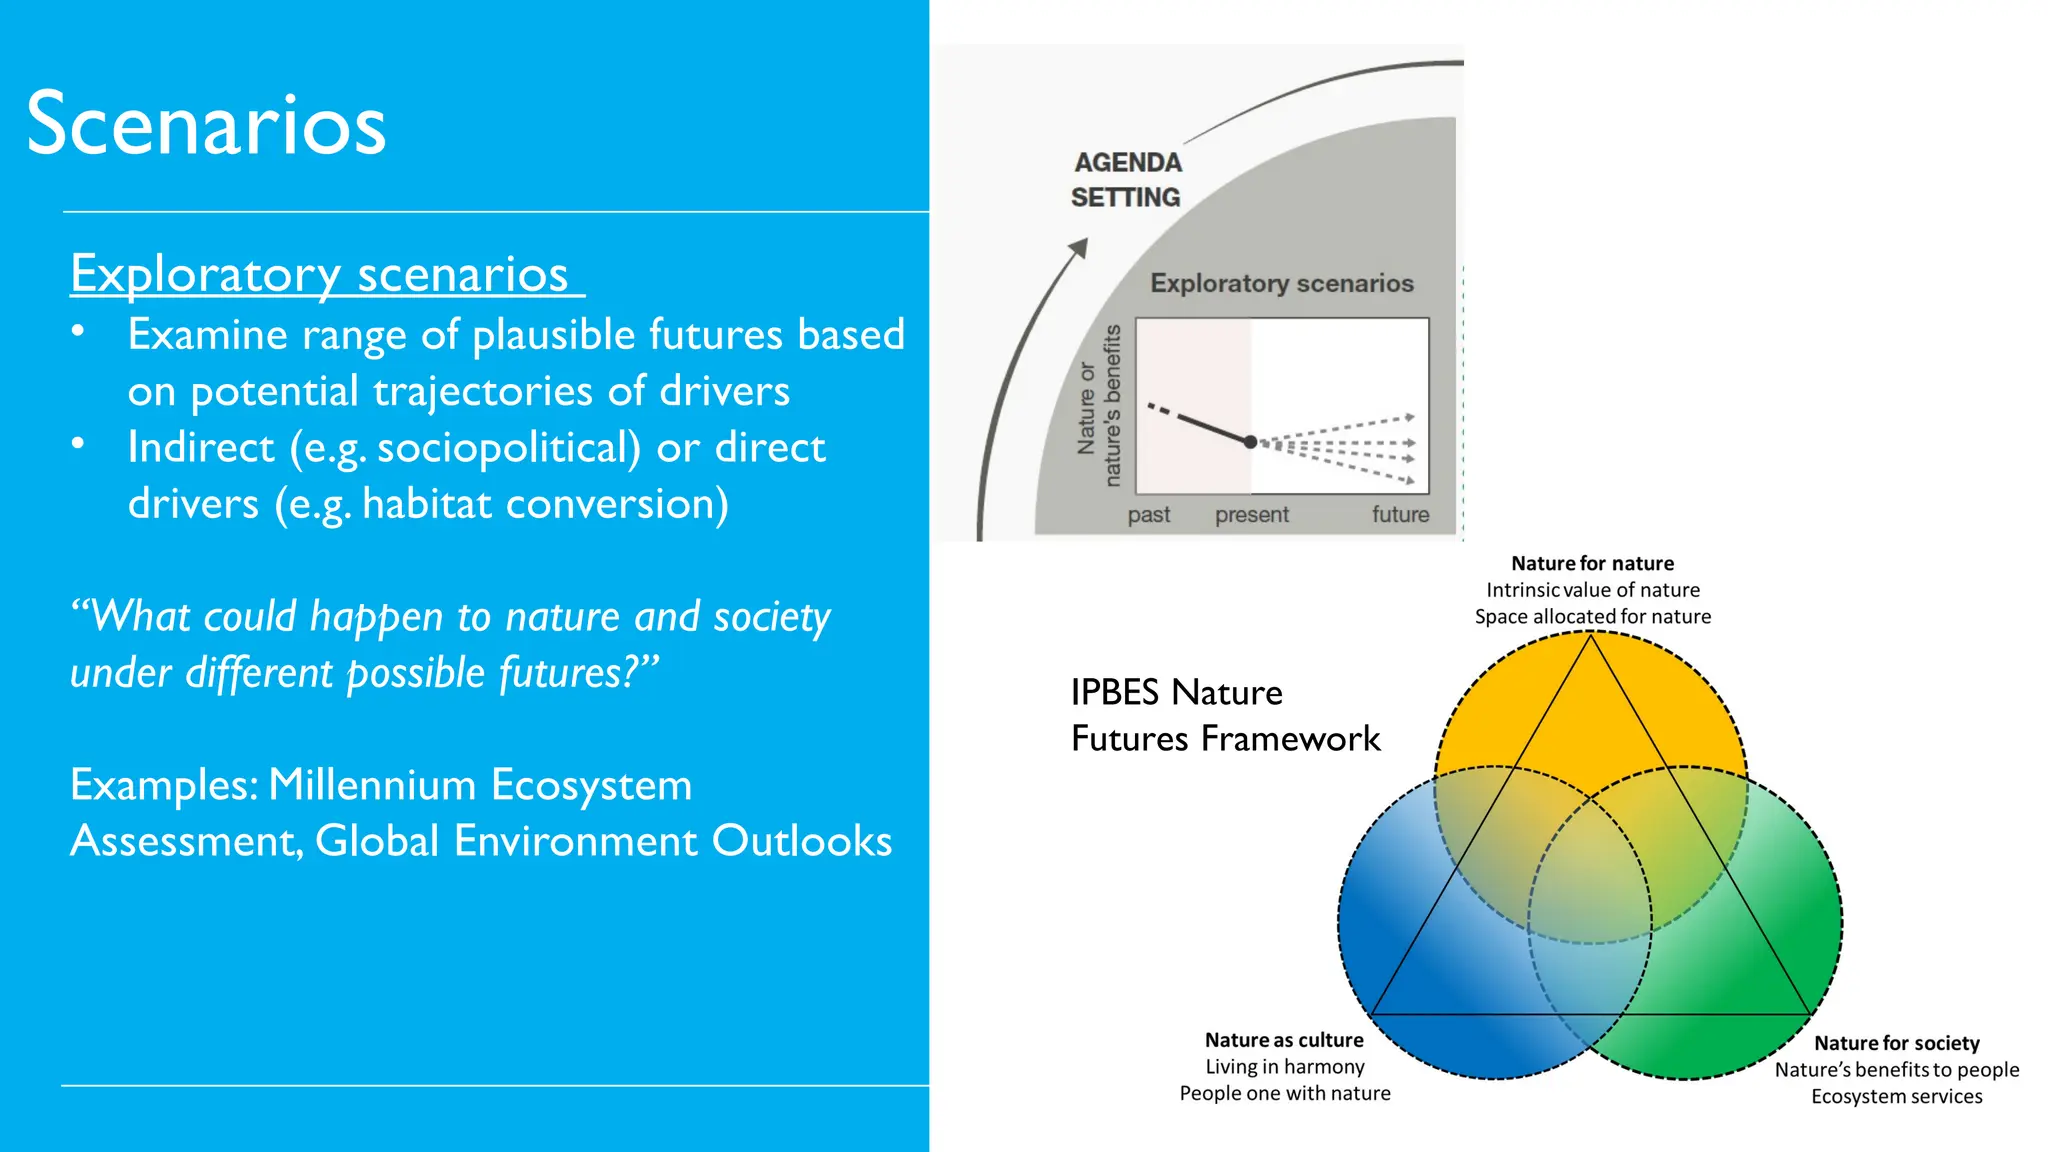
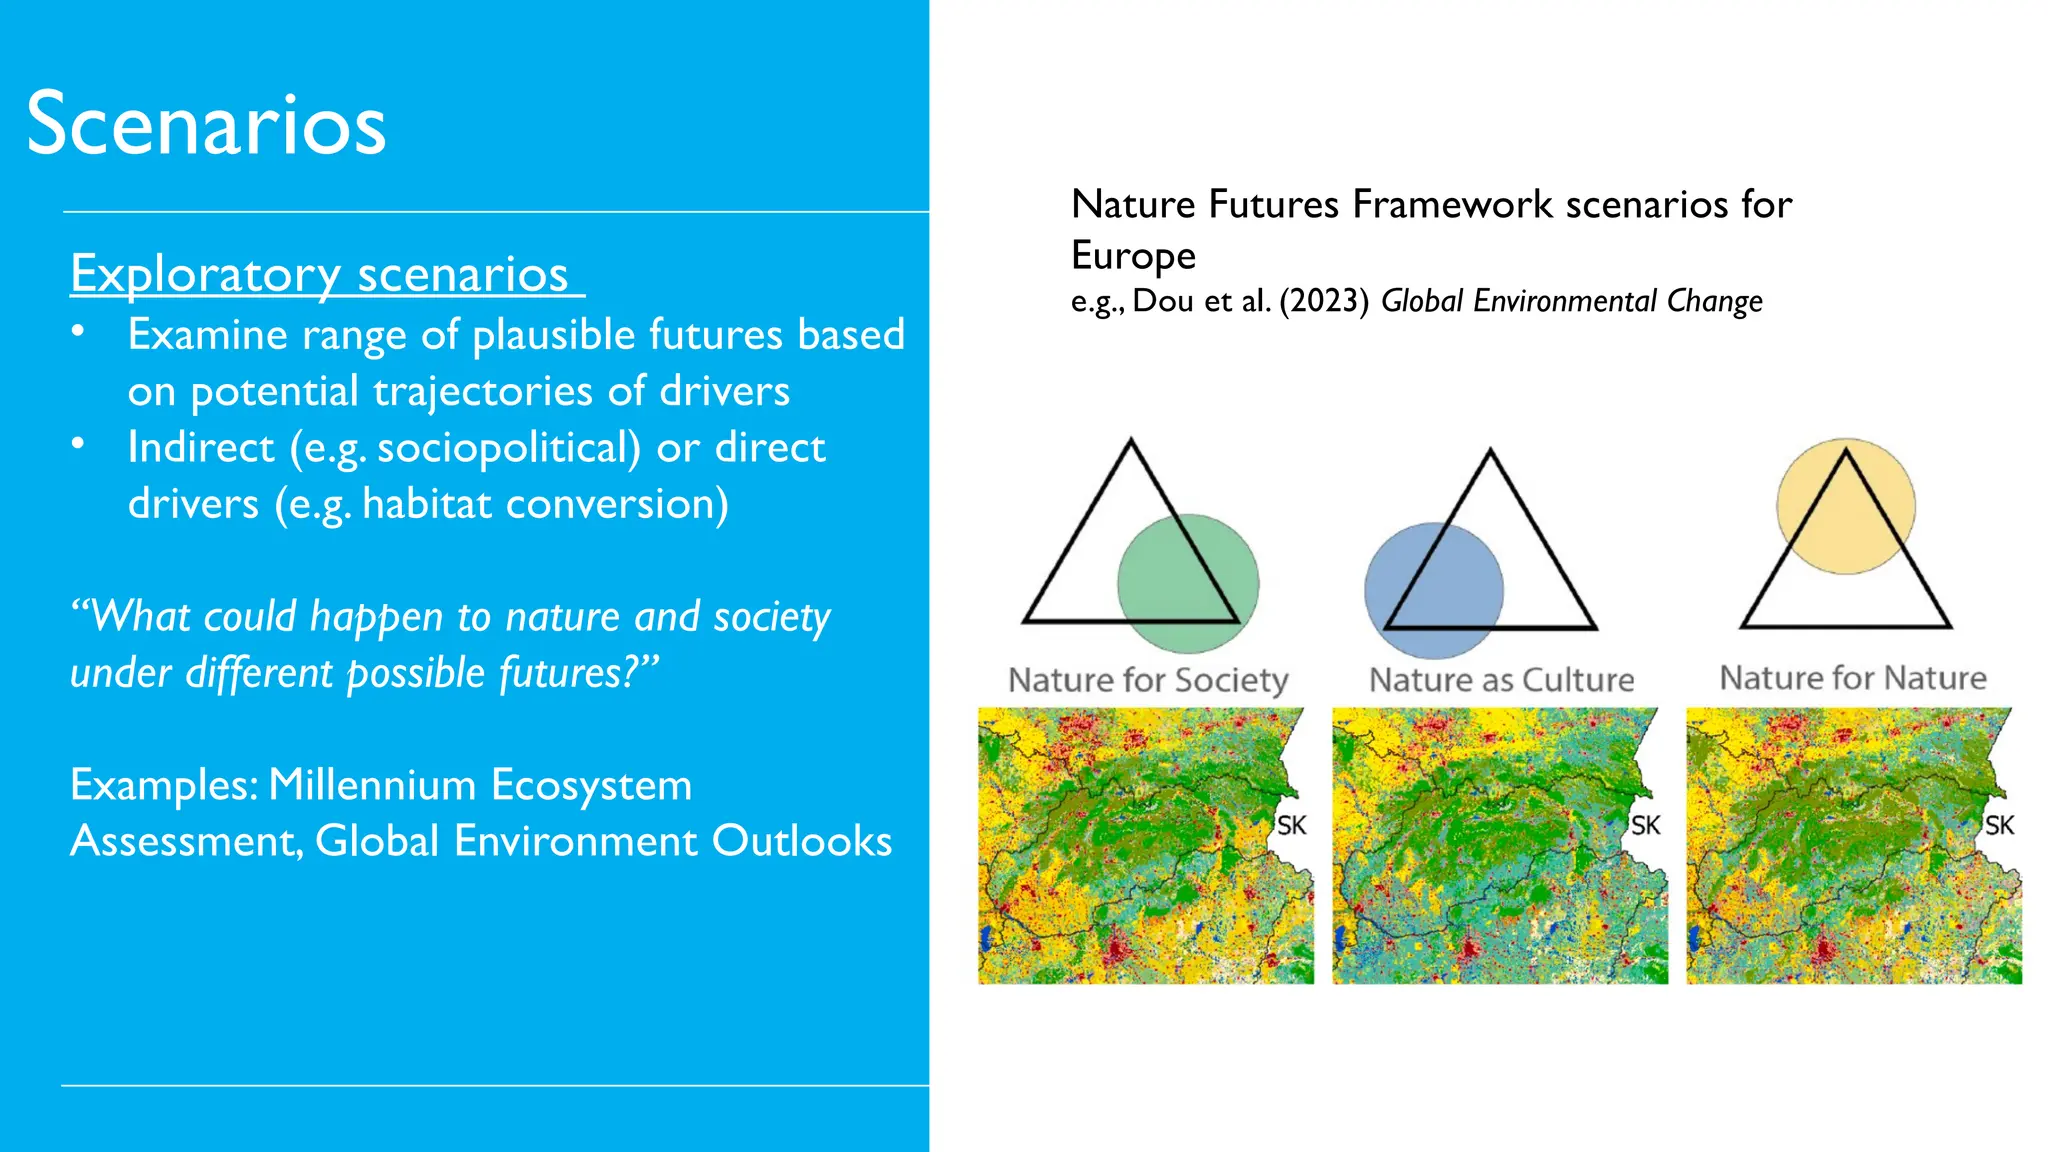
Exploratory scenarios
• Examinerange of plausible futures based
on potential trajectories of drivers
• Indirect (e.g. sociopolitical) or direct
drivers (e.g. habitat conversion)
“What could happen to nature and society
under different possible futures?”
Examples: Millennium Ecosystem
Assessment, Global Environment Outlooks
IPBES Nature
Futures Framework
15.
Scenarios
Nature Futures Frameworkscenarios for
Europe
e.g., Dou et al. (2023) Global Environmental Change
Exploratory scenarios
• Examine range of plausible futures based
on potential trajectories of drivers
• Indirect (e.g. sociopolitical) or direct
drivers (e.g. habitat conversion)
“What could happen to nature and society
under different possible futures?”
Examples: Millennium Ecosystem
Assessment, Global Environment Outlooks
16.
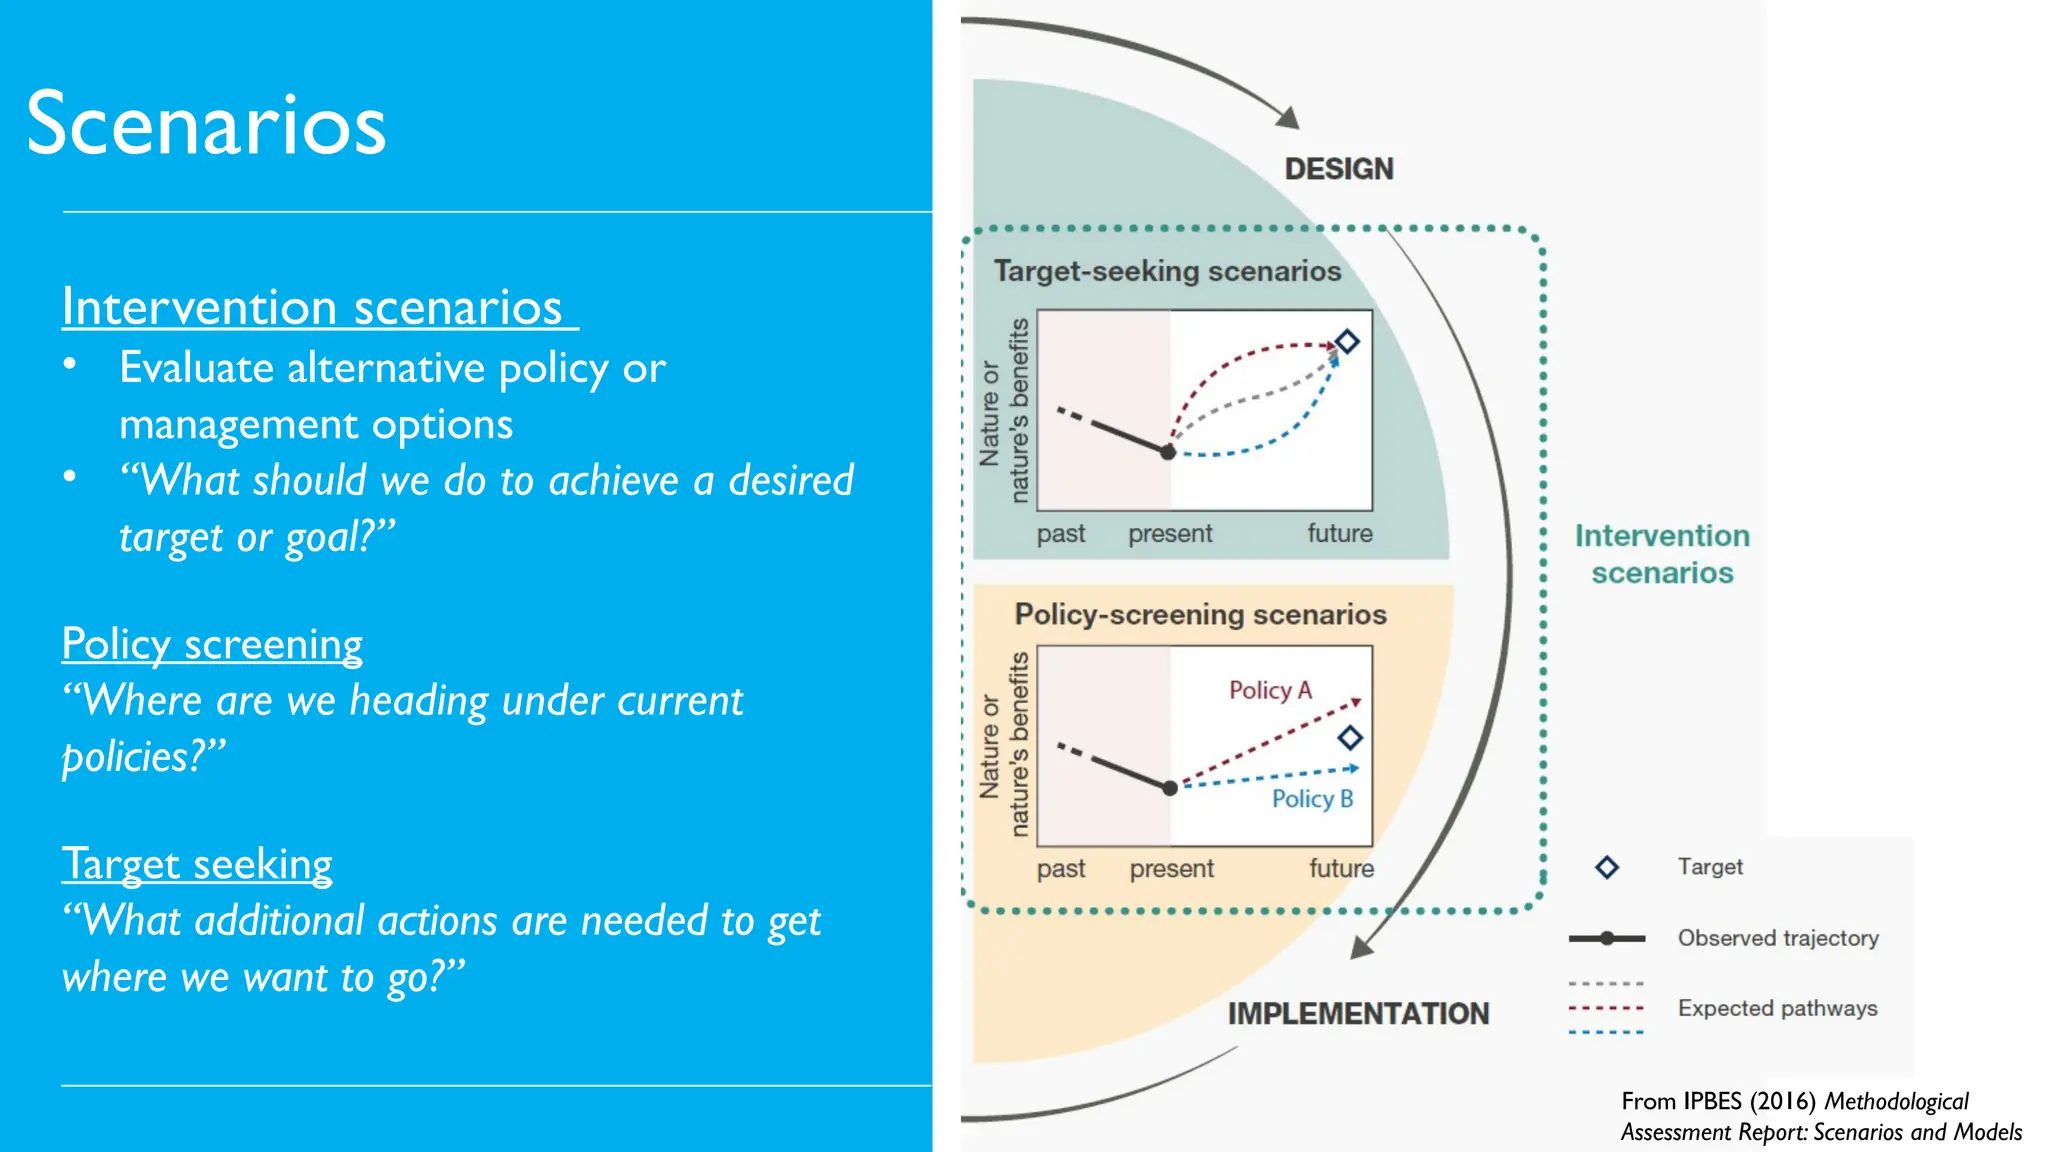
Scenarios
Intervention scenarios
• Evaluatealternative policy or
management options
• “What should we do to achieve a desired
target or goal?”
Policy screening
“Where are we heading under current
policies?”
Target seeking
“What additional actions are needed to get
where we want to go?”
From IPBES (2016) Methodological
Assessment Report: Scenarios and Models
17.
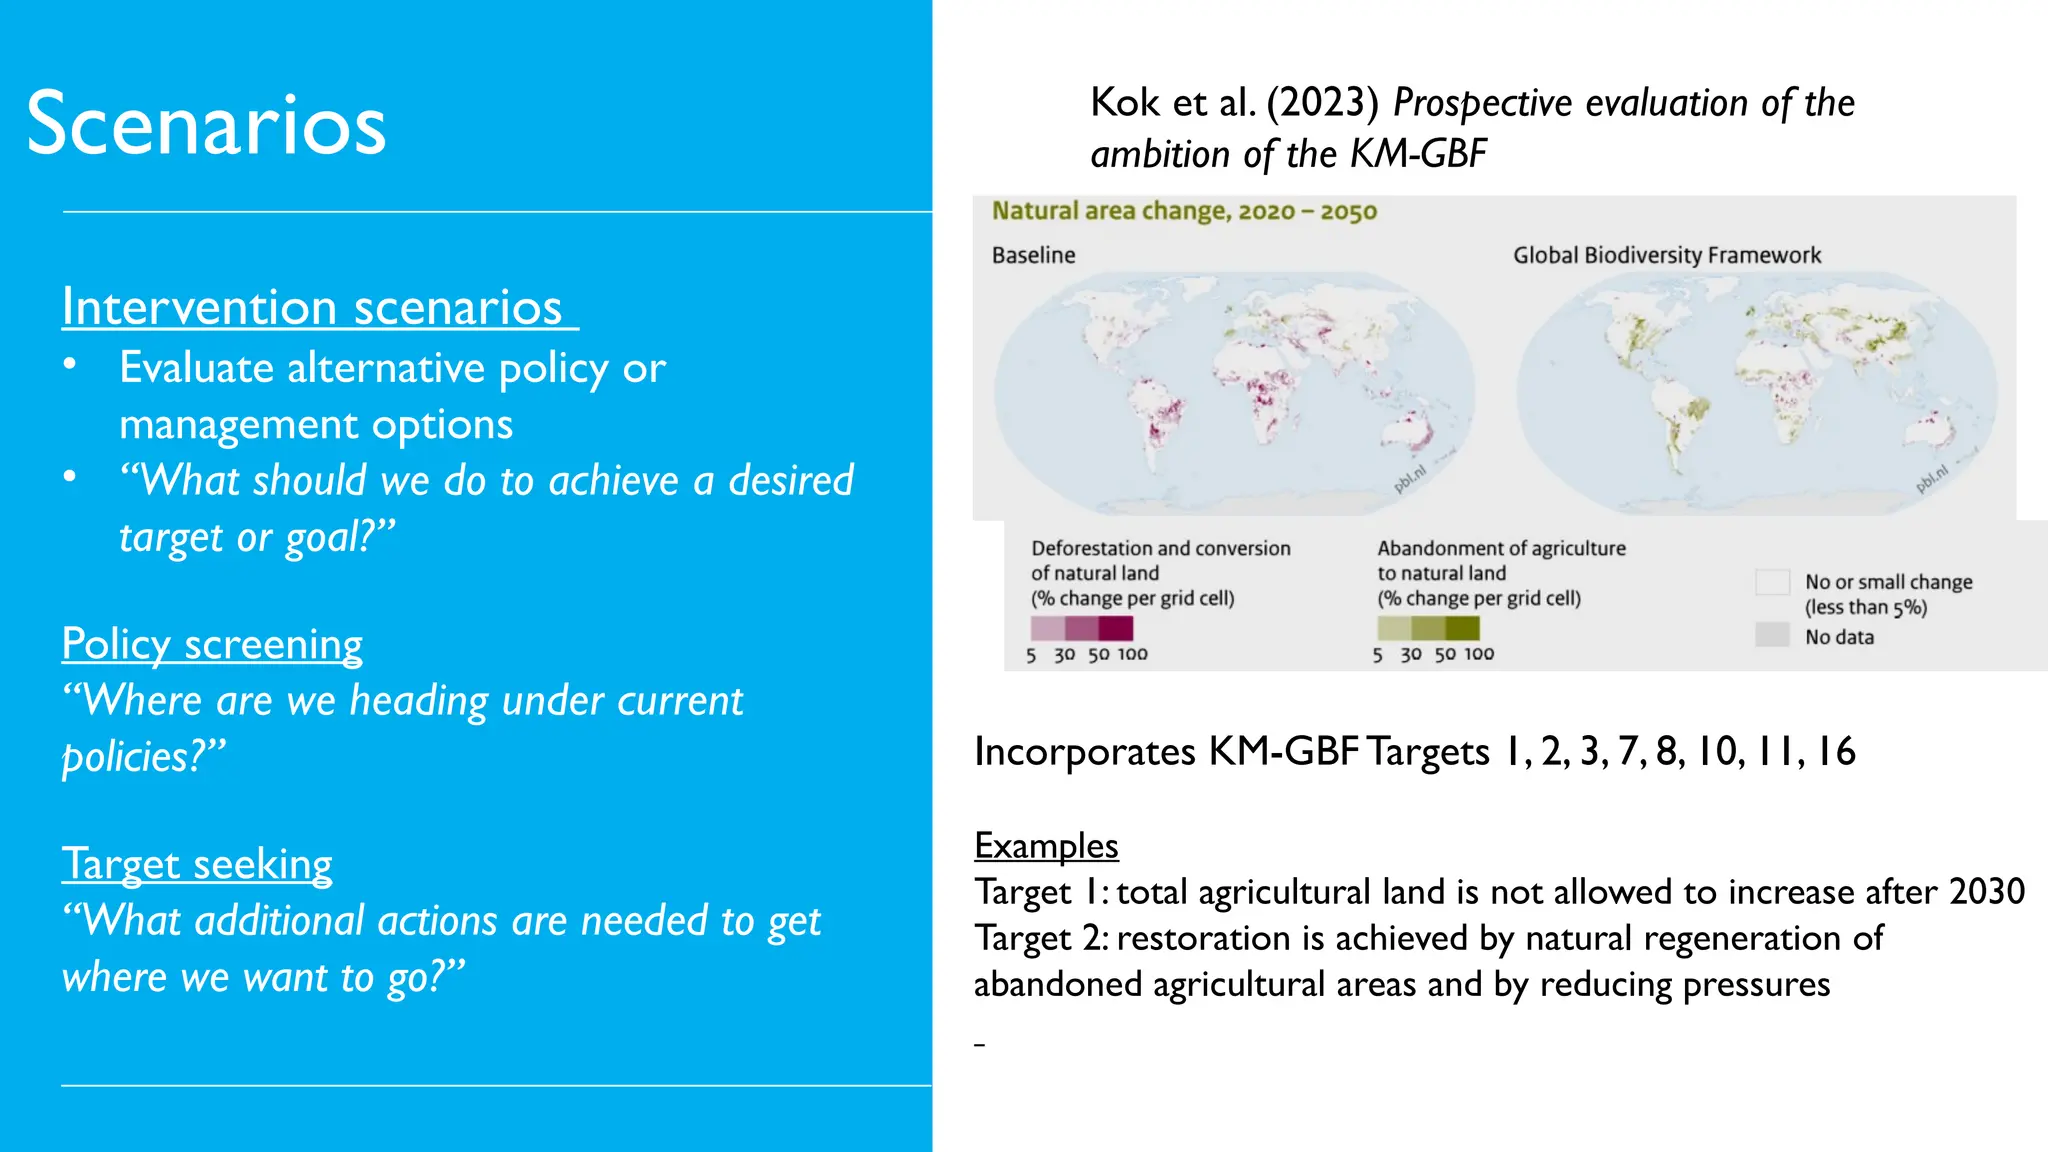
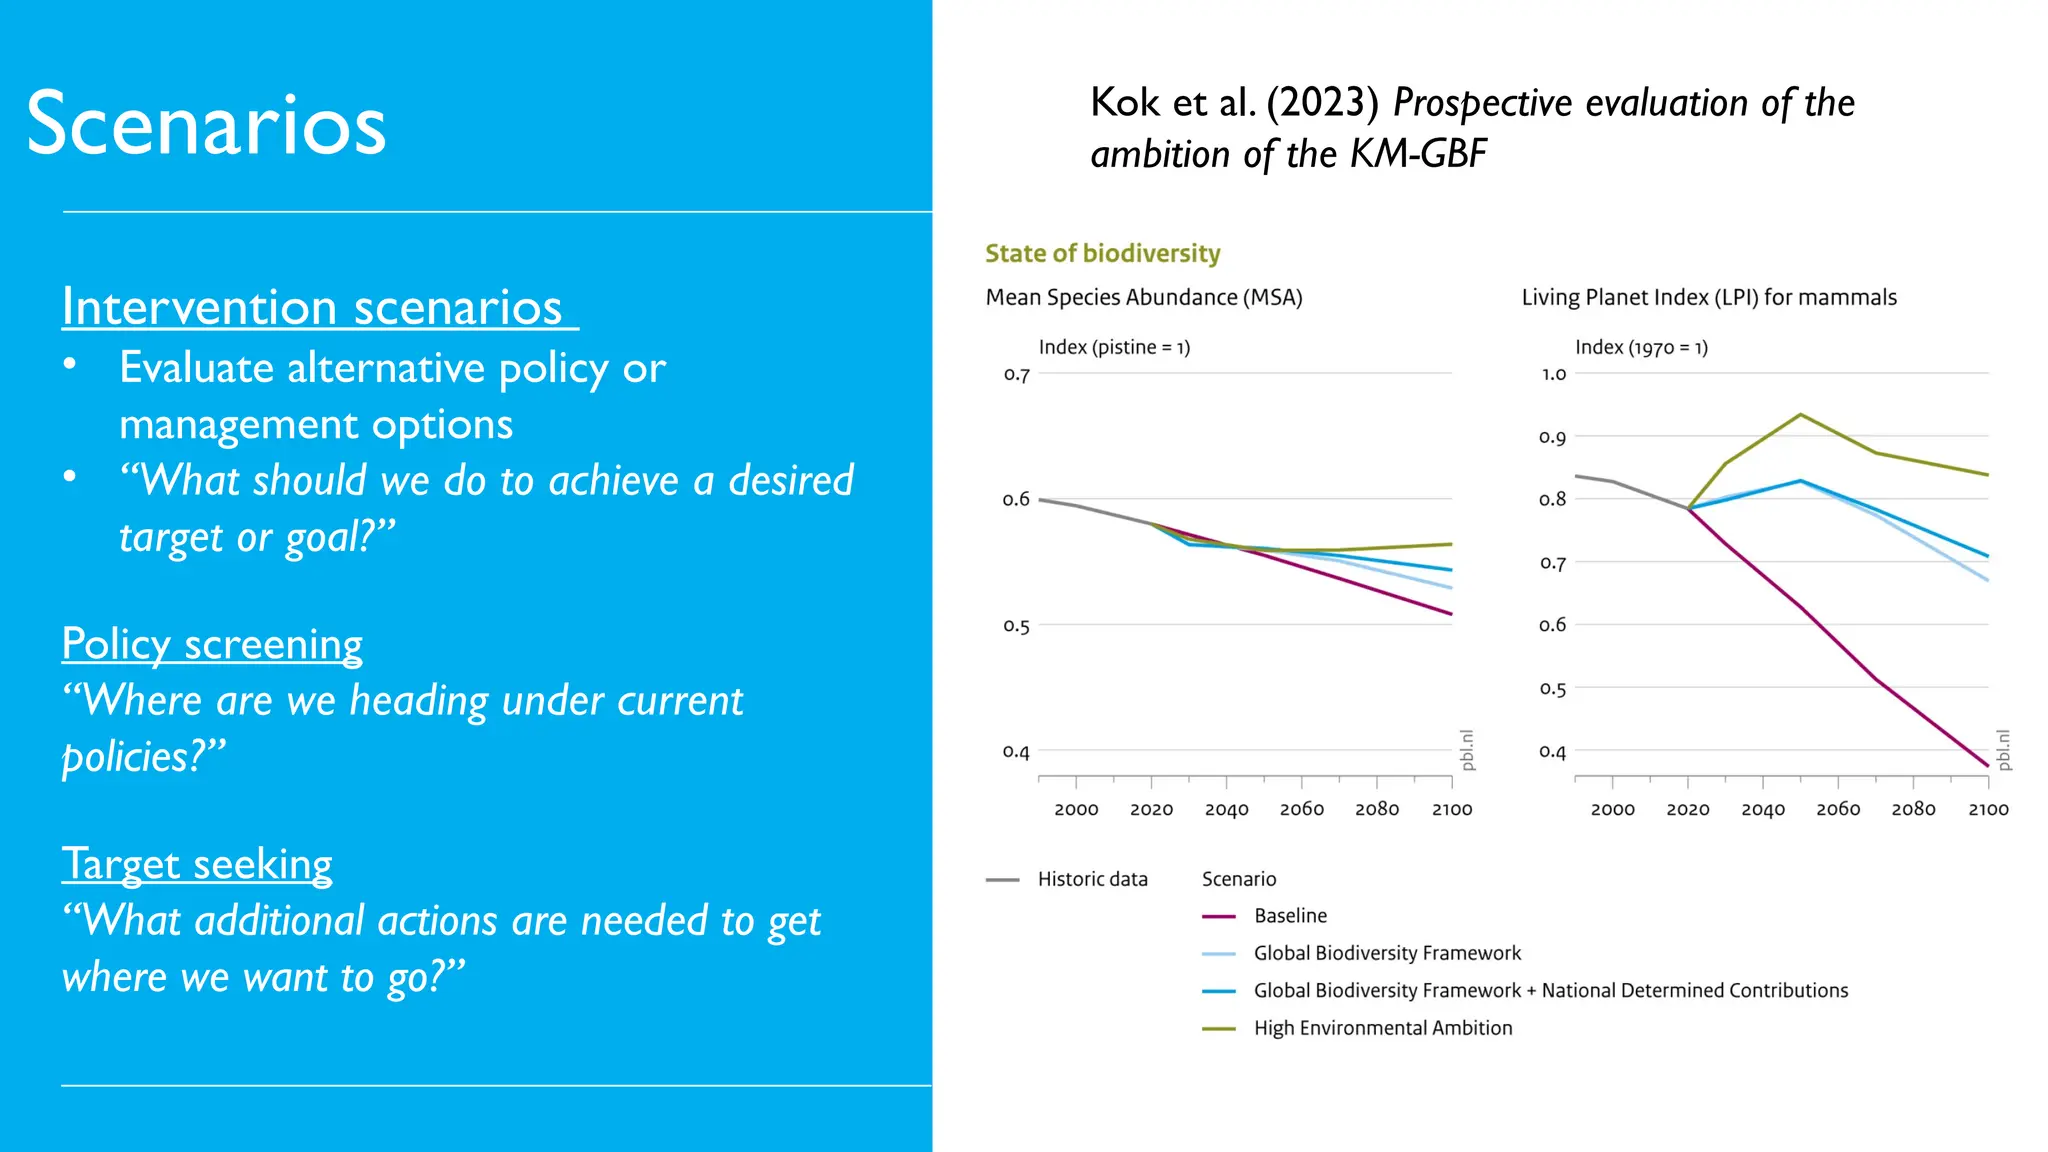
Scenarios
Intervention scenarios
• Evaluatealternative policy or
management options
• “What should we do to achieve a desired
target or goal?”
Policy screening
“Where are we heading under current
policies?”
Target seeking
“What additional actions are needed to get
where we want to go?”
Kok et al. (2023) Prospective evaluation of the
ambition of the KM-GBF
Incorporates KM-GBFTargets 1, 2, 3, 7, 8, 10, 11, 16
Examples
Target 1: total agricultural land is not allowed to increase after 2030
Target 2: restoration is achieved by natural regeneration of
abandoned agricultural areas and by reducing pressures
18.
Scenarios
Intervention scenarios
• Evaluatealternative policy or
management options
• “What should we do to achieve a desired
target or goal?”
Policy screening
“Where are we heading under current
policies?”
Target seeking
“What additional actions are needed to get
where we want to go?”
Kok et al. (2023) Prospective evaluation of the
ambition of the KM-GBF
19.
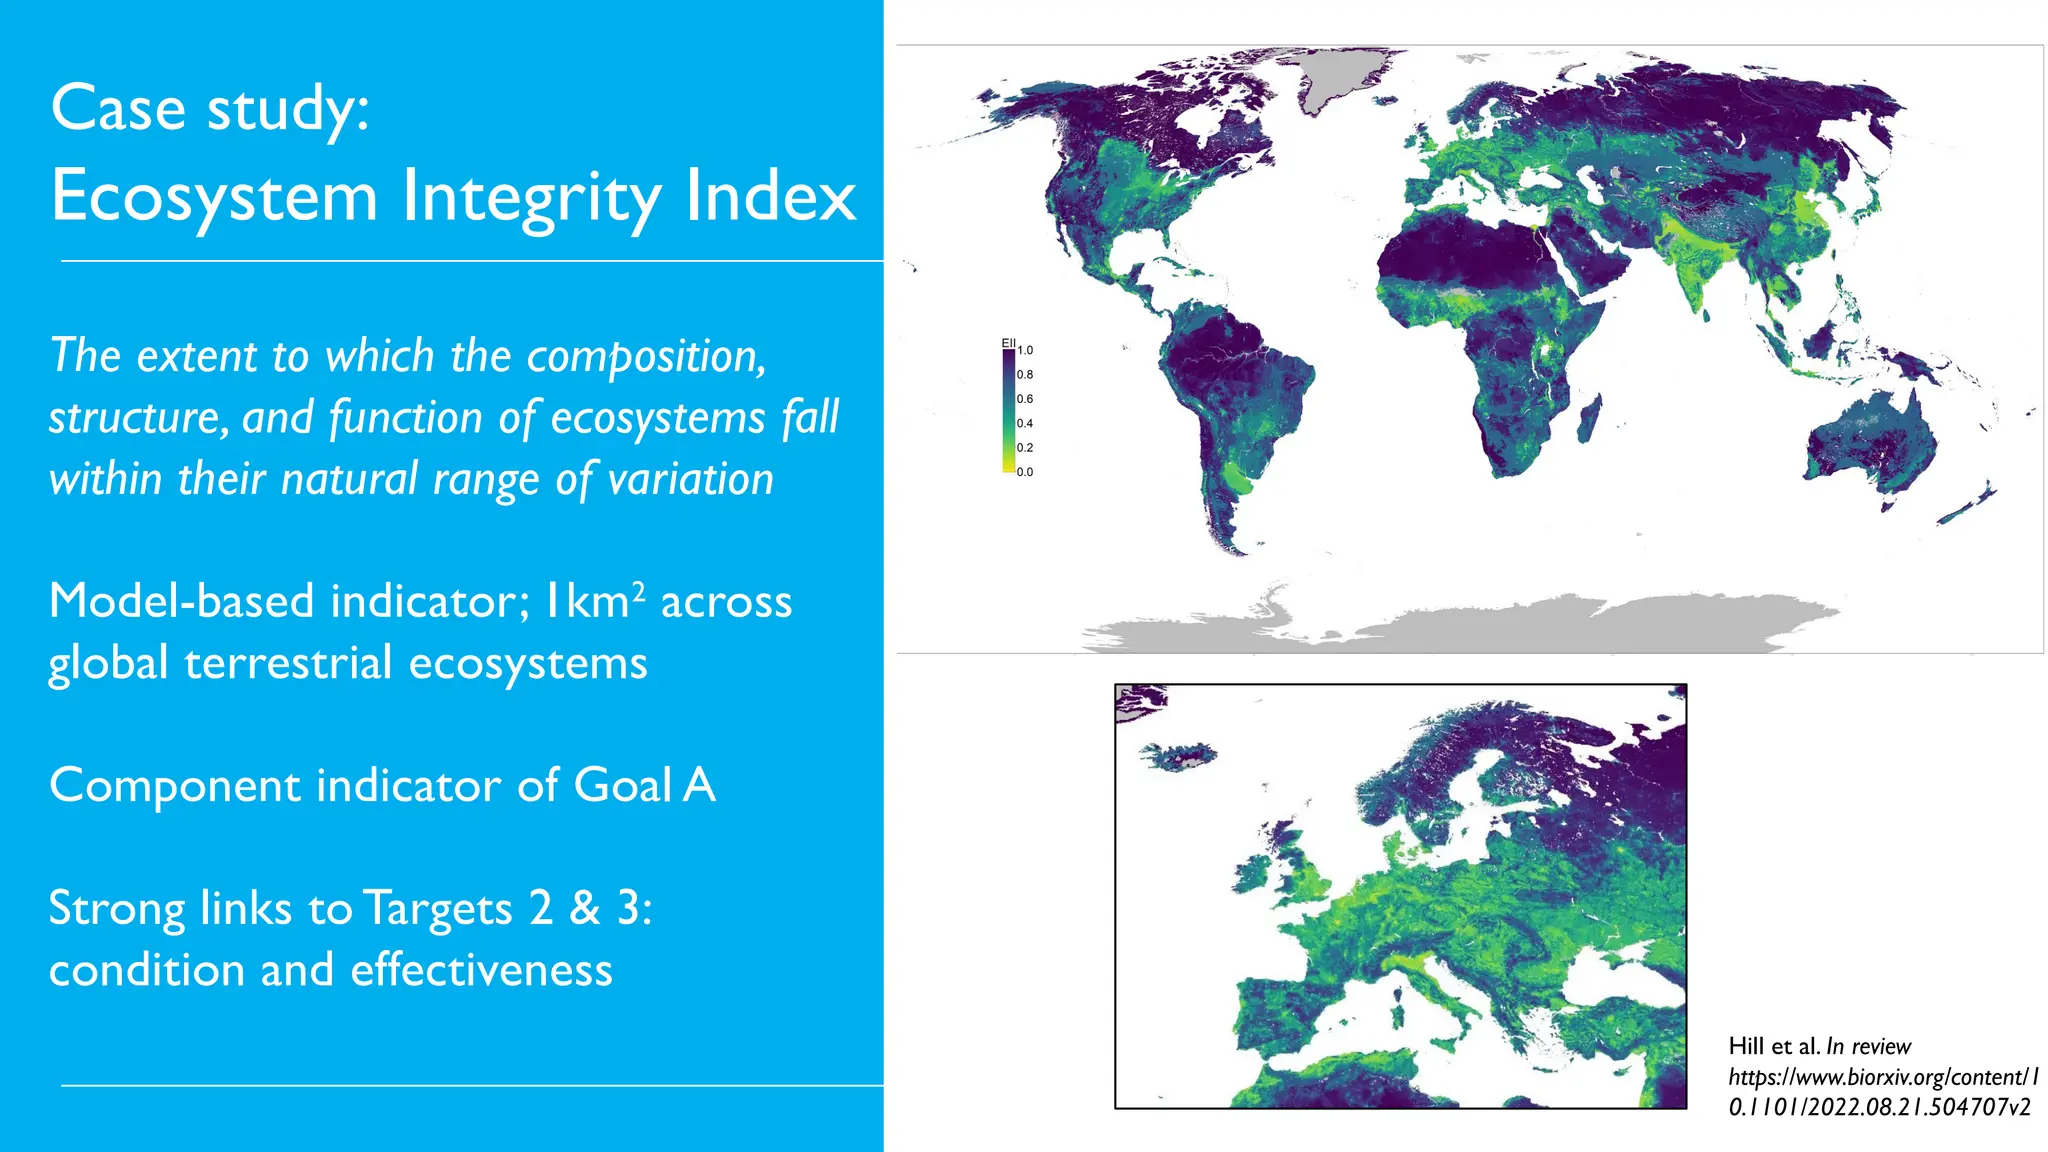
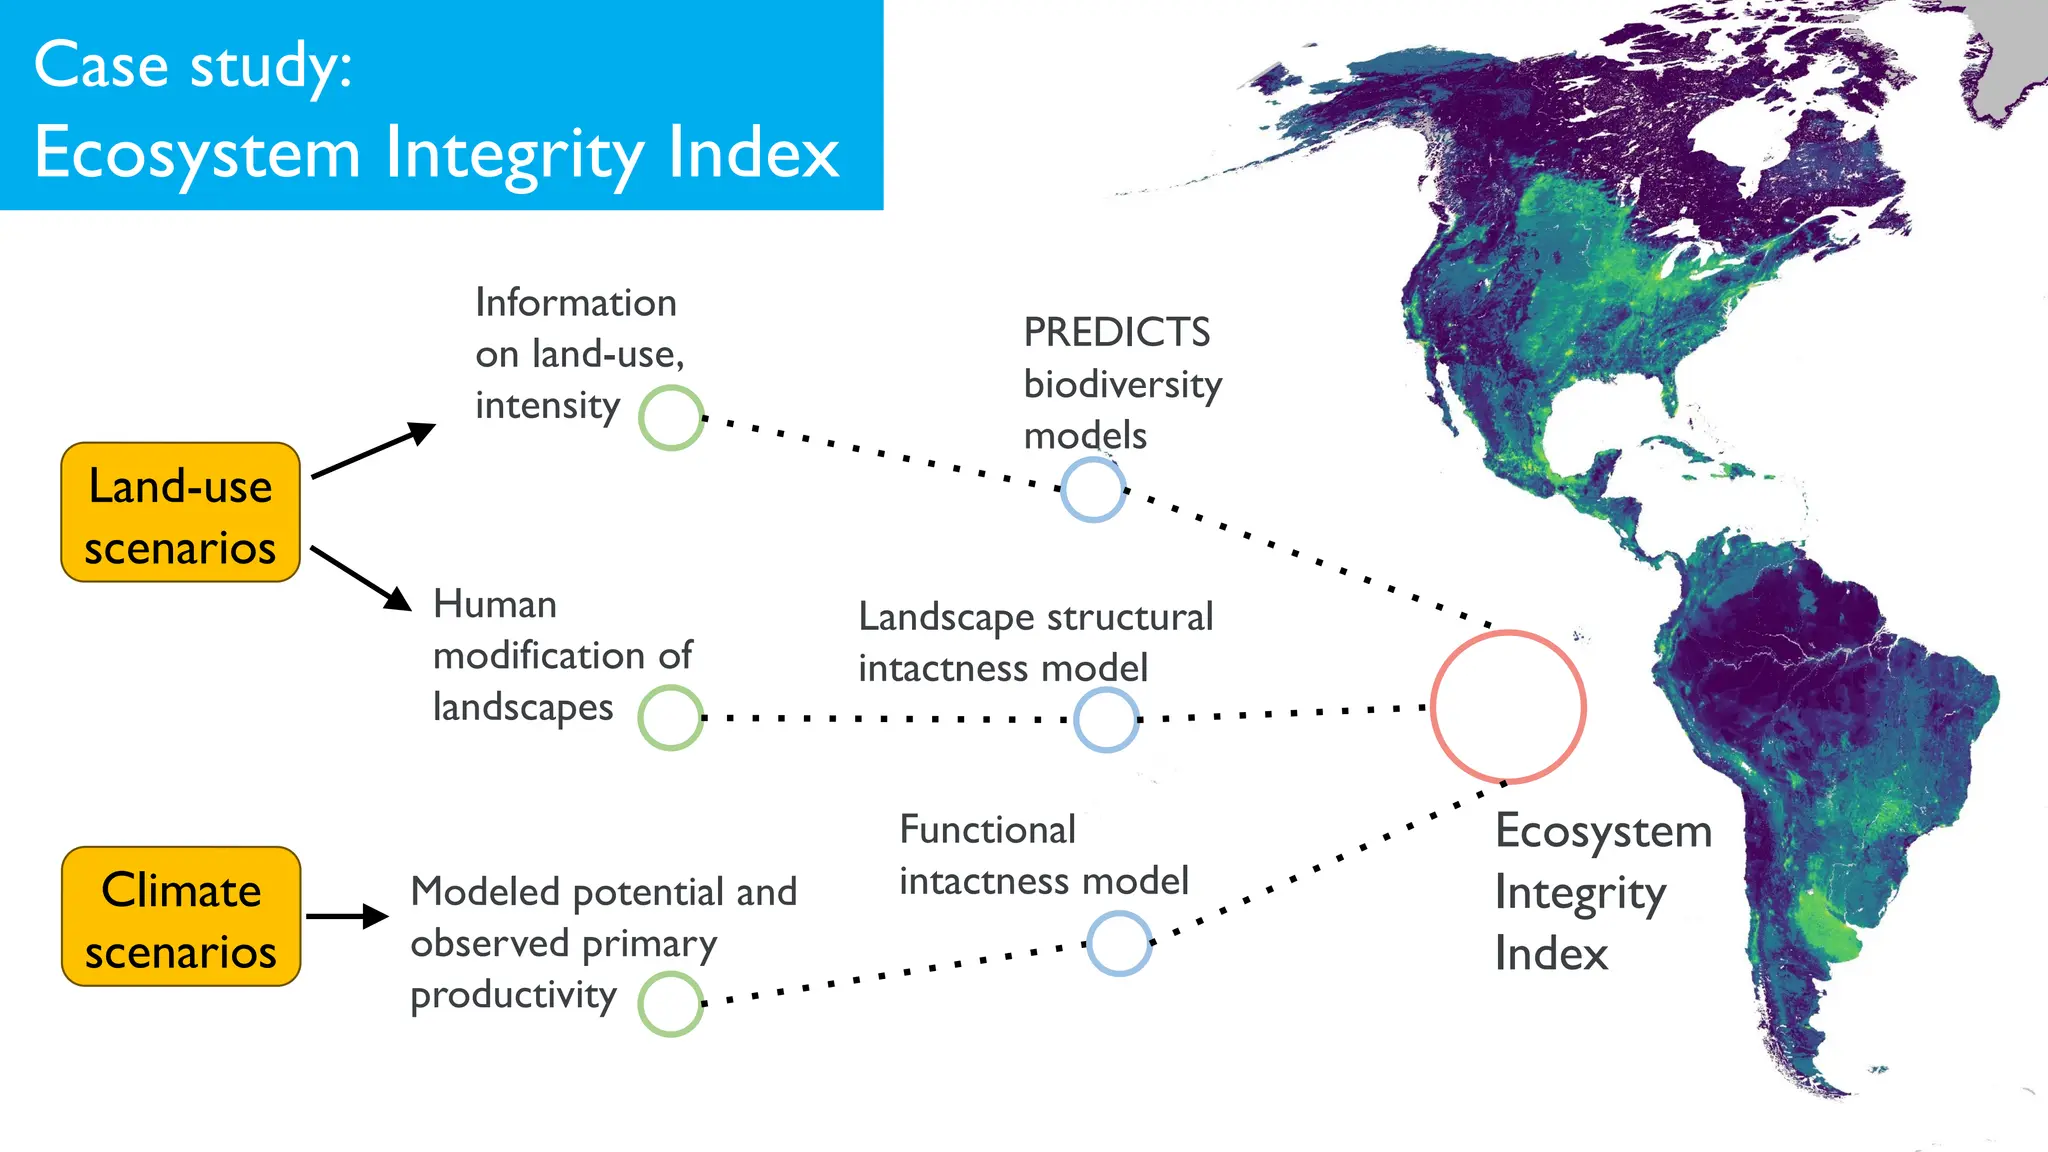
Case study:
Ecosystem IntegrityIndex
The extent to which the composition,
structure, and function of ecosystems fall
within their natural range of variation
Model-based indicator; 1km2
across
global terrestrial ecosystems
Component indicator of Goal A
Strong links to Targets 2 & 3:
condition and effectiveness
Hill et al. In review
https://www.biorxiv.org/content/1
0.1101/2022.08.21.504707v2
20.
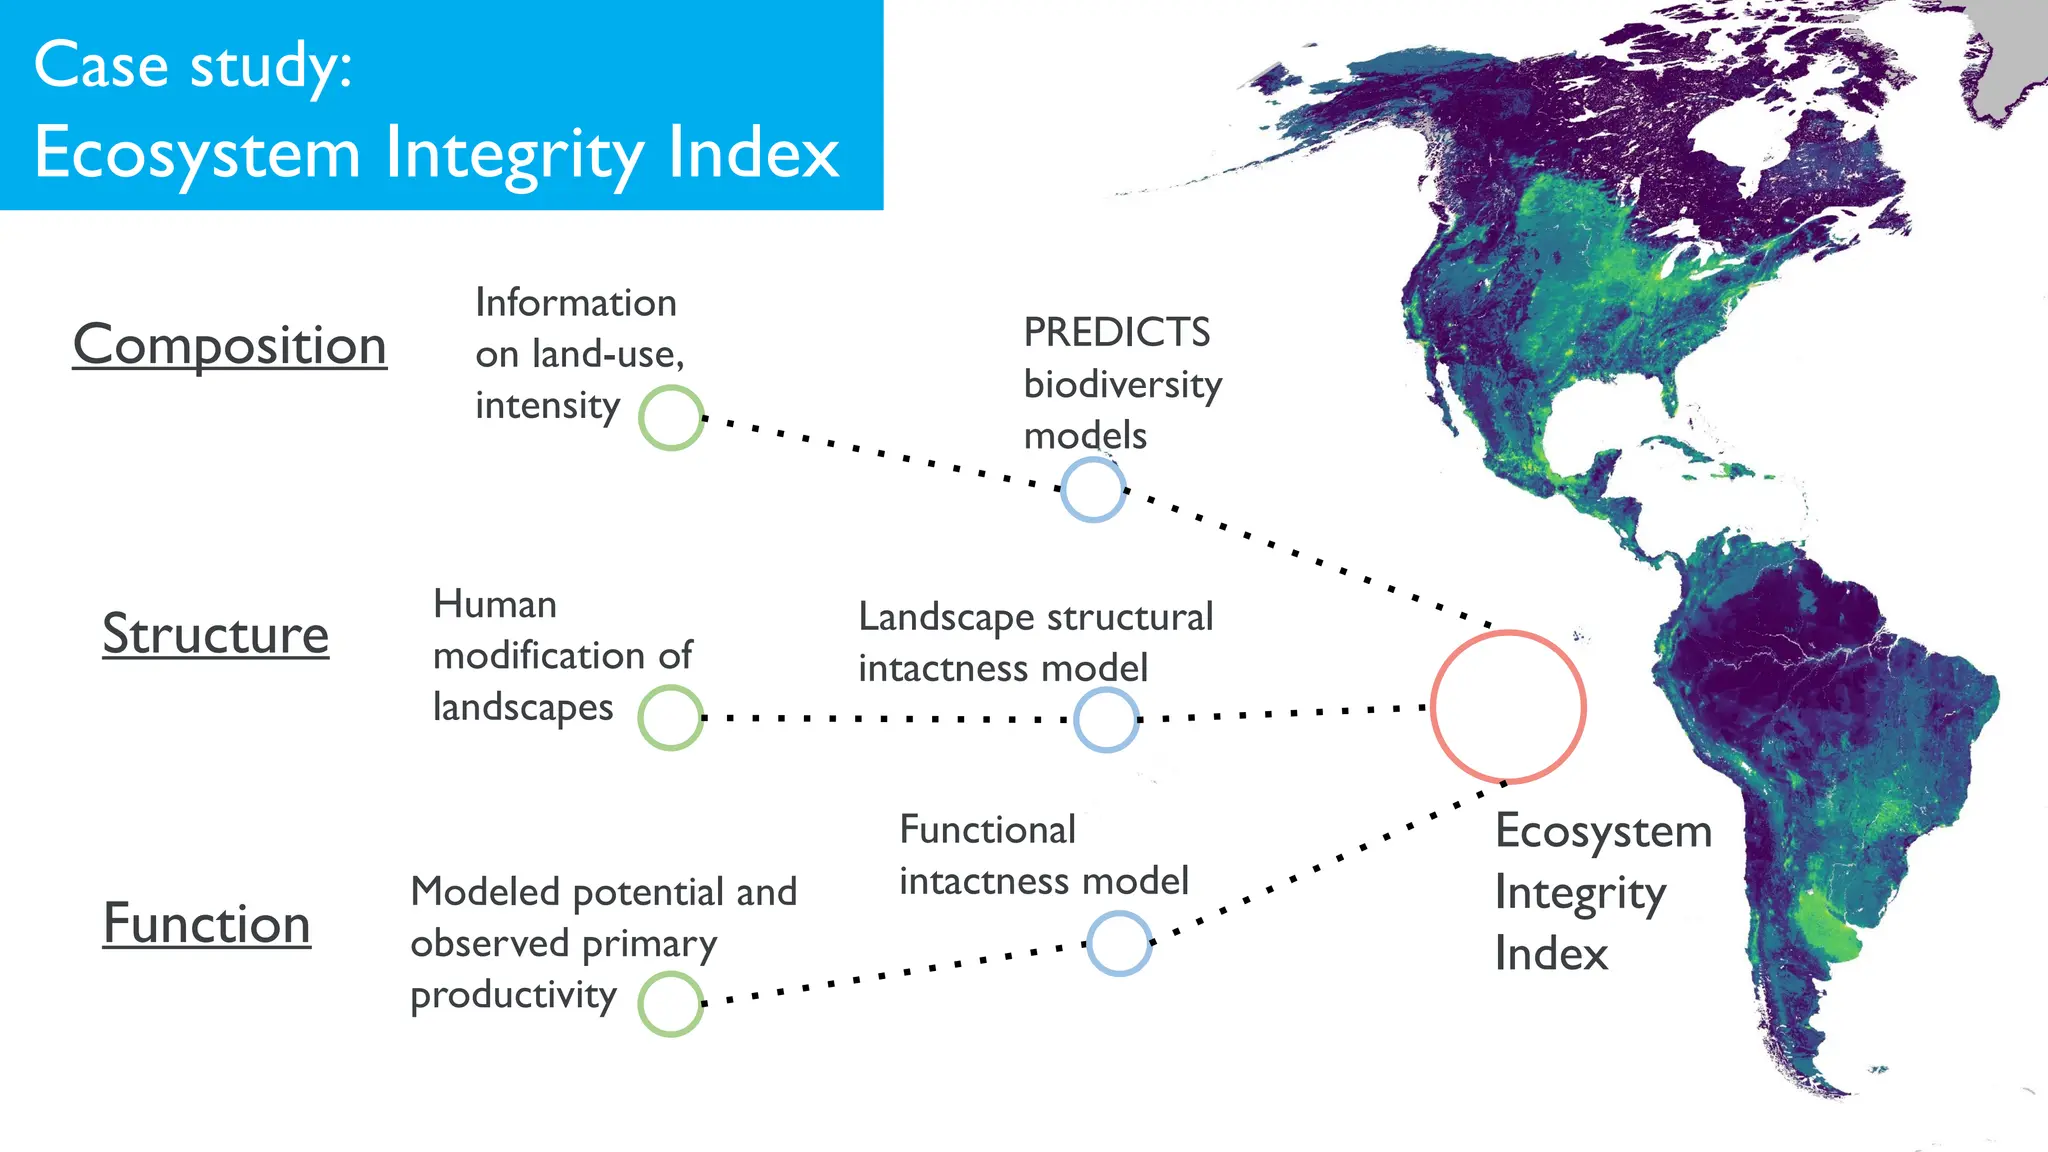
Ecosystem
Integrity
Index
Case study:
Ecosystem IntegrityIndex
PREDICTS
biodiversity
models
Information
on land-use,
intensity
Composition
Human
modification of
landscapes
Landscape structural
intactness model
Structure
Functional
intactness model
Modeled potential and
observed primary
productivity
Function
21.
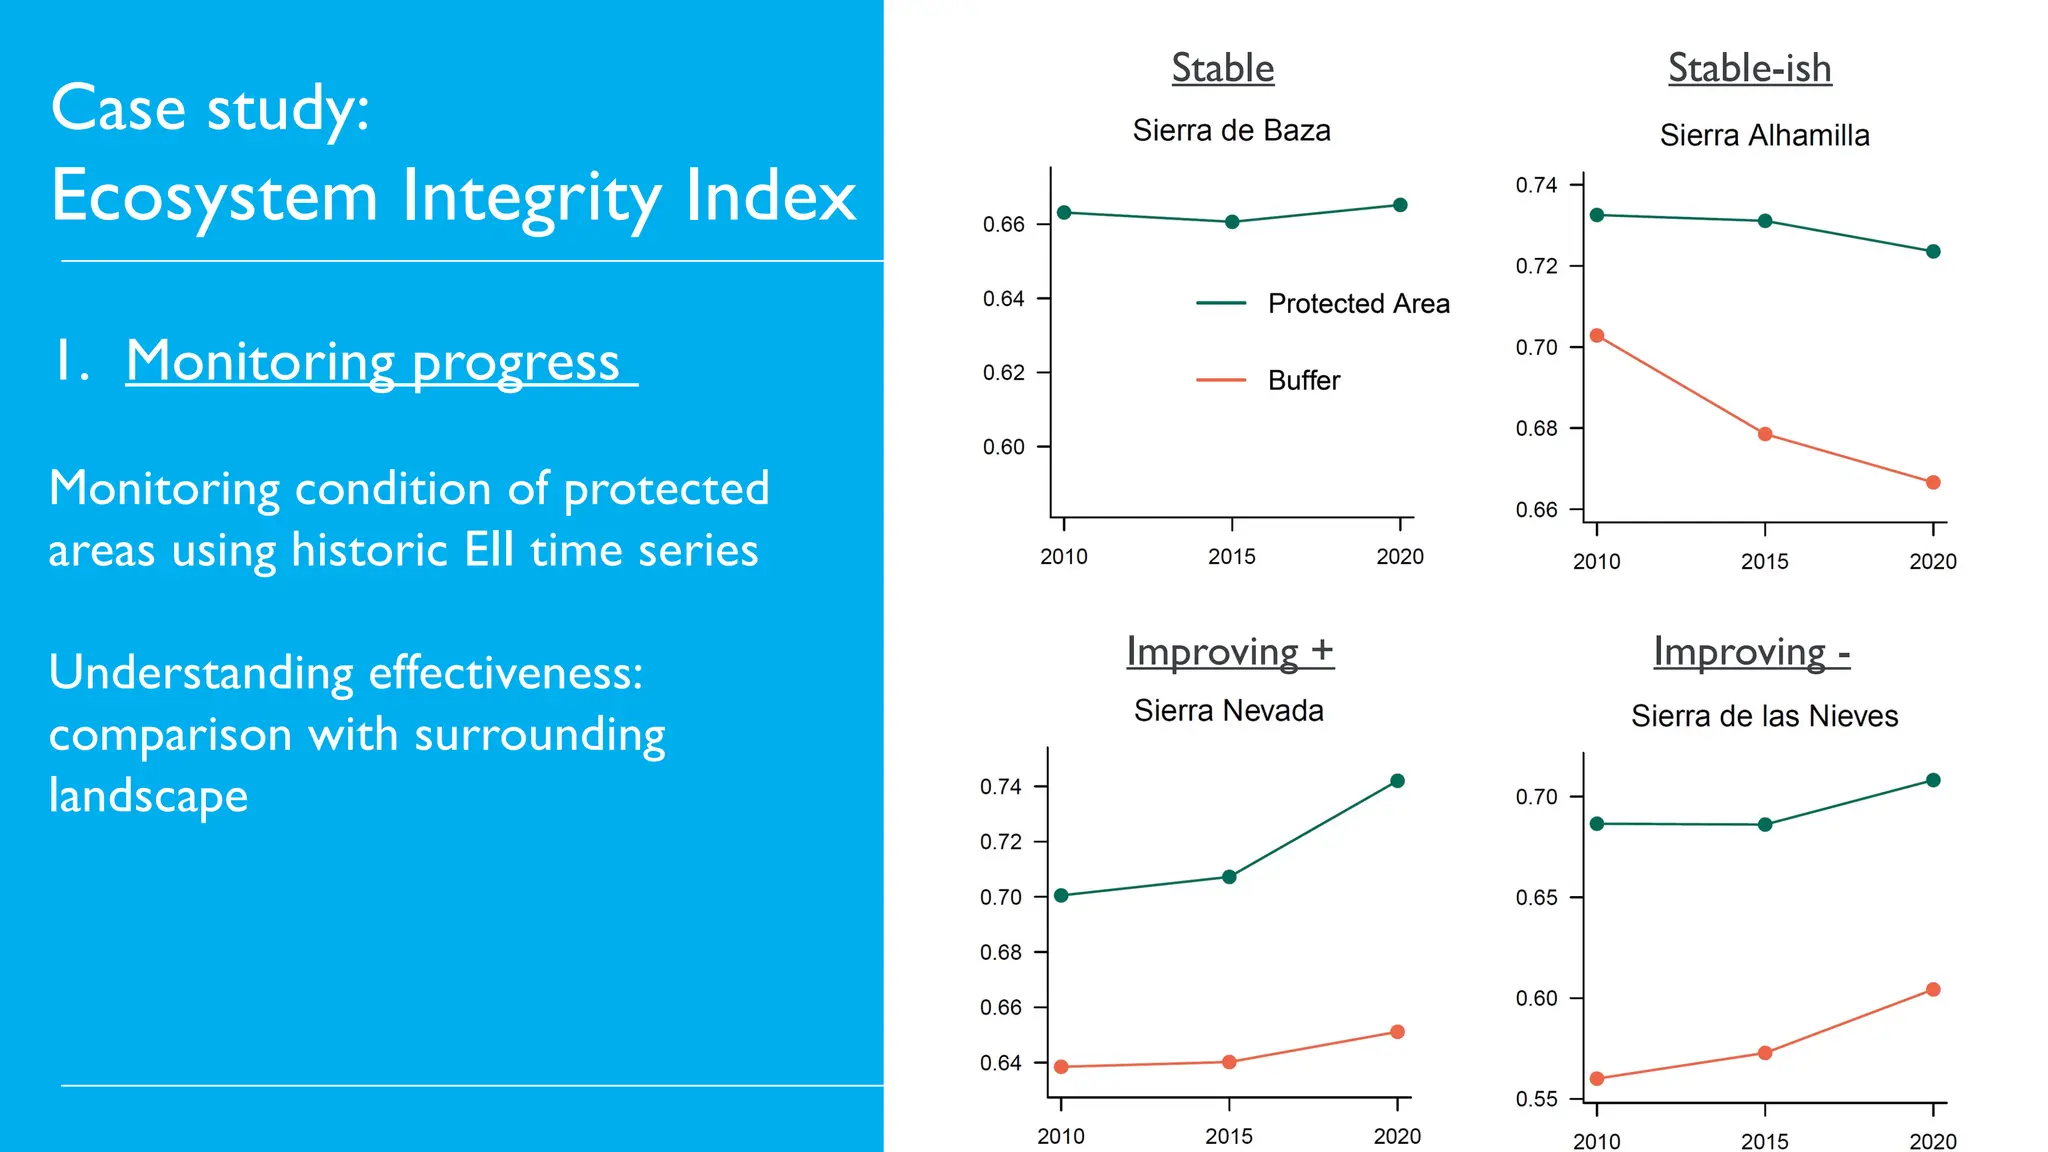
Stable
Case study:
Ecosystem IntegrityIndex
1. Monitoring progress
Monitoring condition of protected
areas using historic EII time series
Understanding effectiveness:
comparison with surrounding
landscape
Stable-ish
Improving + Improving -
22.
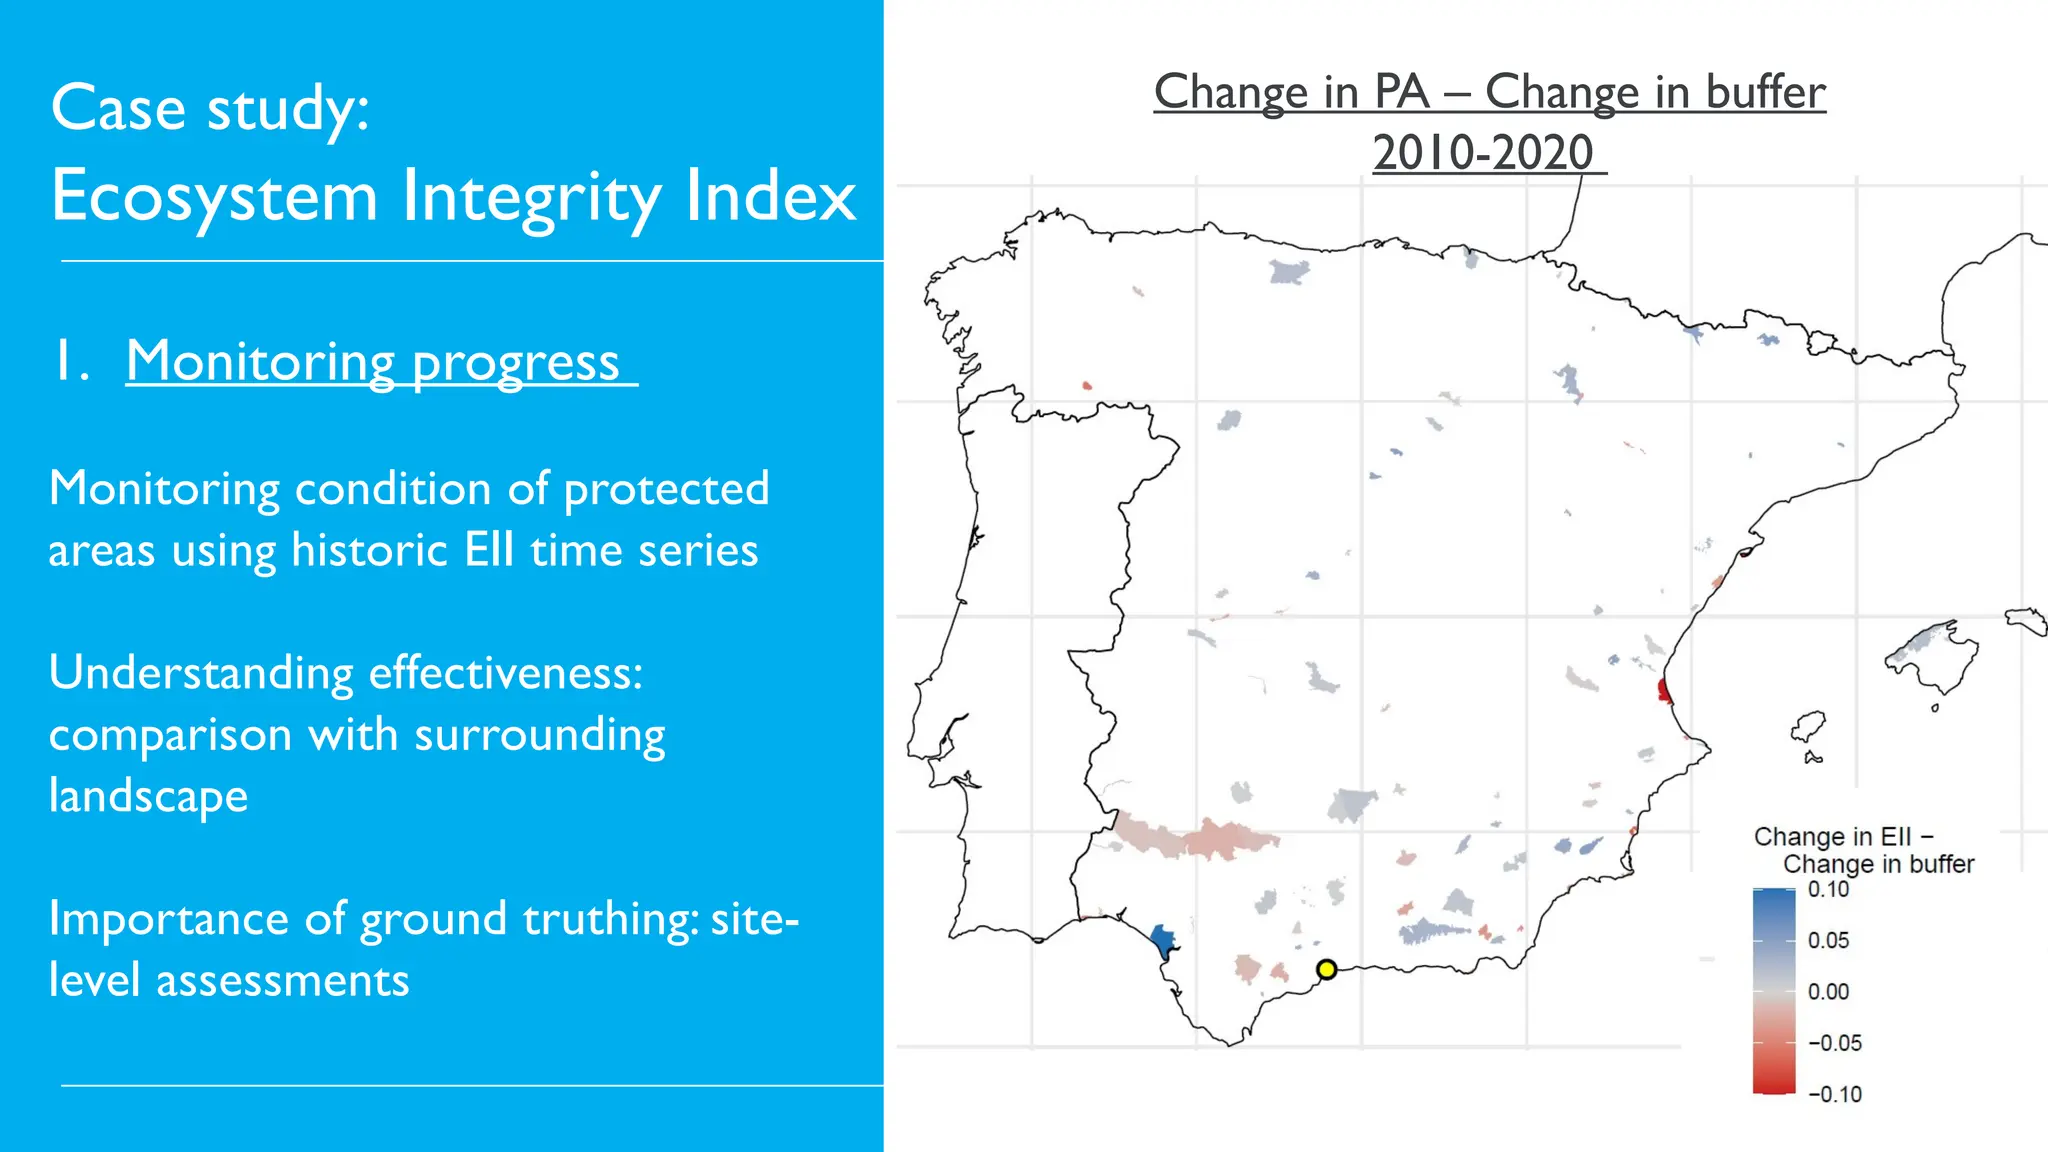
Case study:
Ecosystem IntegrityIndex
1. Monitoring progress
Monitoring condition of protected
areas using historic EII time series
Understanding effectiveness:
comparison with surrounding
landscape
Importance of ground truthing: site-
level assessments
Change in PA – Change in buffer
2010-2020
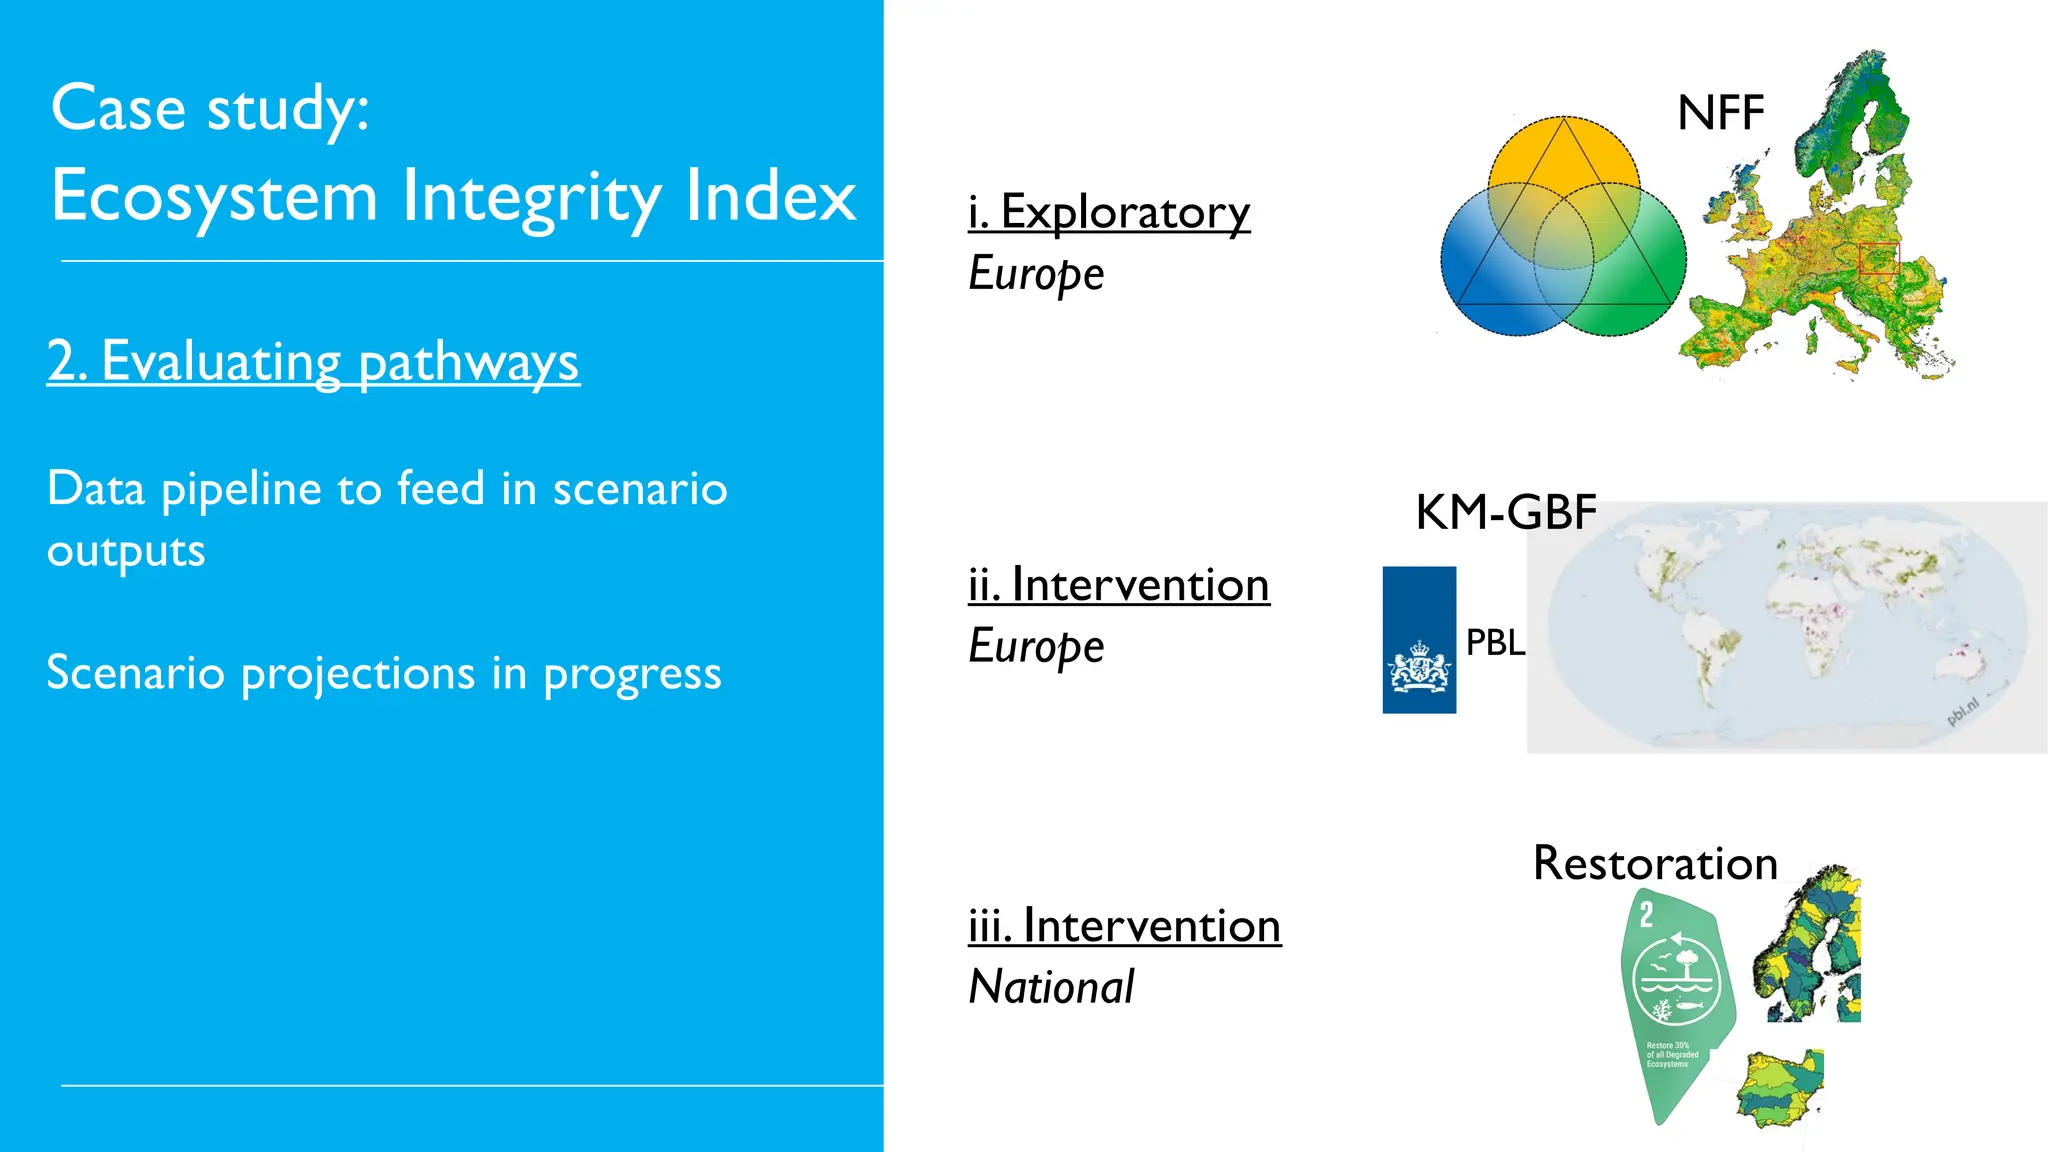
Case study:
Ecosystem IntegrityIndex
2. Evaluating pathways
Data pipeline to feed in scenario
outputs
Scenario projections in progress
NFF
i. Exploratory
Europe
KM-GBF
PBL
ii. Intervention
Europe
iii. Intervention
National
Restoration
26.
COOP4CBD Task 3.3
Deliverables
1.Piloted assessment methodology to
review progress and ambition under
the KMGBF
2. Guidance on using models and
scenarios to review progress and
ambition
• Guidance document, including
examples using methodology
• Webinars
27.
Useful resources
Guidance materials
IPBES(2016) The methodological assessment report on scenarios and models of biodiversity and ecosystem
services
https://files.ipbes.net/ipbes-web-prod-public-files/downloads/pdf/2016.methodological_assessment_re
port_scenarios_models.pdf
Biodiversa (2020) Handbook on biodiversity scenarios for decision-making
https://www.biodiversa.eu/2023/07/13/handbook-on-biodiversity-scenarios-for-decision-making/
28.
Useful resources
Scenarios
Dou etal. (2023) Using the Nature Futures Framework as a lens for developing plural land use
scenarios for Europe for 2050 Global Environmental Change
https://www.sciencedirect.com/science/article/pii/S0959378023001322
Kok et al. (2024) A prospective evaluation of the ambition of the Kunming-Montreal Global Biodiversity
Framework goals and targets
https://www.pbl.nl/en/publications/a-prospective-evaluation-of-the-ambition-of-the-kunming-montreal
-global-biodiversity-framework-goals-and-targets
Ecosystem Integrity Index
Hill et al. In review https://www.biorxiv.org/content/10.1101/2022.08.21.504707v2
#3 Aims to increase the understanding on the use of scenarios and models to review implementation over time and evaluate the adequacy of ambition
#6 Most relevance to those goals and targets concerning state of nature and nature’s contributions to people
#8 Many of the limitations common to compiled indicators—geographic and taxonomic biases in data, time lags in compilation,
synthesis and reporting—can in principle be greatly mitigated through enhanced data collection and aggregation.
A more fundamental limitation is that compiled indicators are informative only about what has happened so far, not about what
Might happen in the future or how to change future trajectories.
they can project whether a set of proposed actions are
expected—based on the current understanding of the models embody—to be sufficient to achieve the desired outcome goals.
Models vary widely in how they work and how they make predictions: they range from highly mechanistic (i.e. process-based) to purely phenomenological (i.e. pattern-based), and from
fully static (modelling net effects on the equilibrium state) to completely dynamic (explicitly considering the time course of changes
#9 To meet the outcome goals of KMGBF, the GBMF should support adaptive
policy responses to the state of biodiversity, which in turn requires a
‘satnav’ for nature.
#10 To meet the outcome goals of KMGBF, the GBMF should support adaptive
policy responses to the state of biodiversity, which in turn requires a
‘satnav’ for nature.
#11 | SSP | Name | Key Features | Implications for Climate & Adaptation |
| ---- | ------------------------------------------------ | ----------------------------------------------------------------------------------------------------------- | --------------------------------------------------------------------- |
| SSP1 | Sustainability (“Taking the Green Road”) | Low population growth, high education & health, rapid technological progress, strong environmental policies | Low emissions, high adaptive capacity |
| SSP2 | Middle of the Road | Trends continue roughly as today, moderate economic & population growth | Moderate emissions and adaptation challenges |
| SSP3 | Regional Rivalry (“Fragmented World”) | High population growth in developing countries, slow economic growth, weak international cooperation | High emissions, low adaptive capacity, fragmented response |
| SSP4 | Inequality | High inequality, uneven development, elites thrive while large parts of the population lag | Moderate to high emissions, very uneven adaptation capacity |
| SSP5 | Fossil-fueled Development (“Taking the Highway”) | Rapid economic growth, heavy reliance on fossil fuels, high energy demand | High emissions, strong resources for adaptation but high climate risk |
#12 | SSP | Name | Key Features | Implications for Climate & Adaptation |
| ---- | ------------------------------------------------ | ----------------------------------------------------------------------------------------------------------- | --------------------------------------------------------------------- |
| SSP1 | Sustainability (“Taking the Green Road”) | Low population growth, high education & health, rapid technological progress, strong environmental policies | Low emissions, high adaptive capacity |
| SSP2 | Middle of the Road | Trends continue roughly as today, moderate economic & population growth | Moderate emissions and adaptation challenges |
| SSP3 | Regional Rivalry (“Fragmented World”) | High population growth in developing countries, slow economic growth, weak international cooperation | High emissions, low adaptive capacity, fragmented response |
| SSP4 | Inequality | High inequality, uneven development, elites thrive while large parts of the population lag | Moderate to high emissions, very uneven adaptation capacity |
| SSP5 | Fossil-fueled Development (“Taking the Highway”) | Rapid economic growth, heavy reliance on fossil fuels, high energy demand | High emissions, strong resources for adaptation but high climate risk |
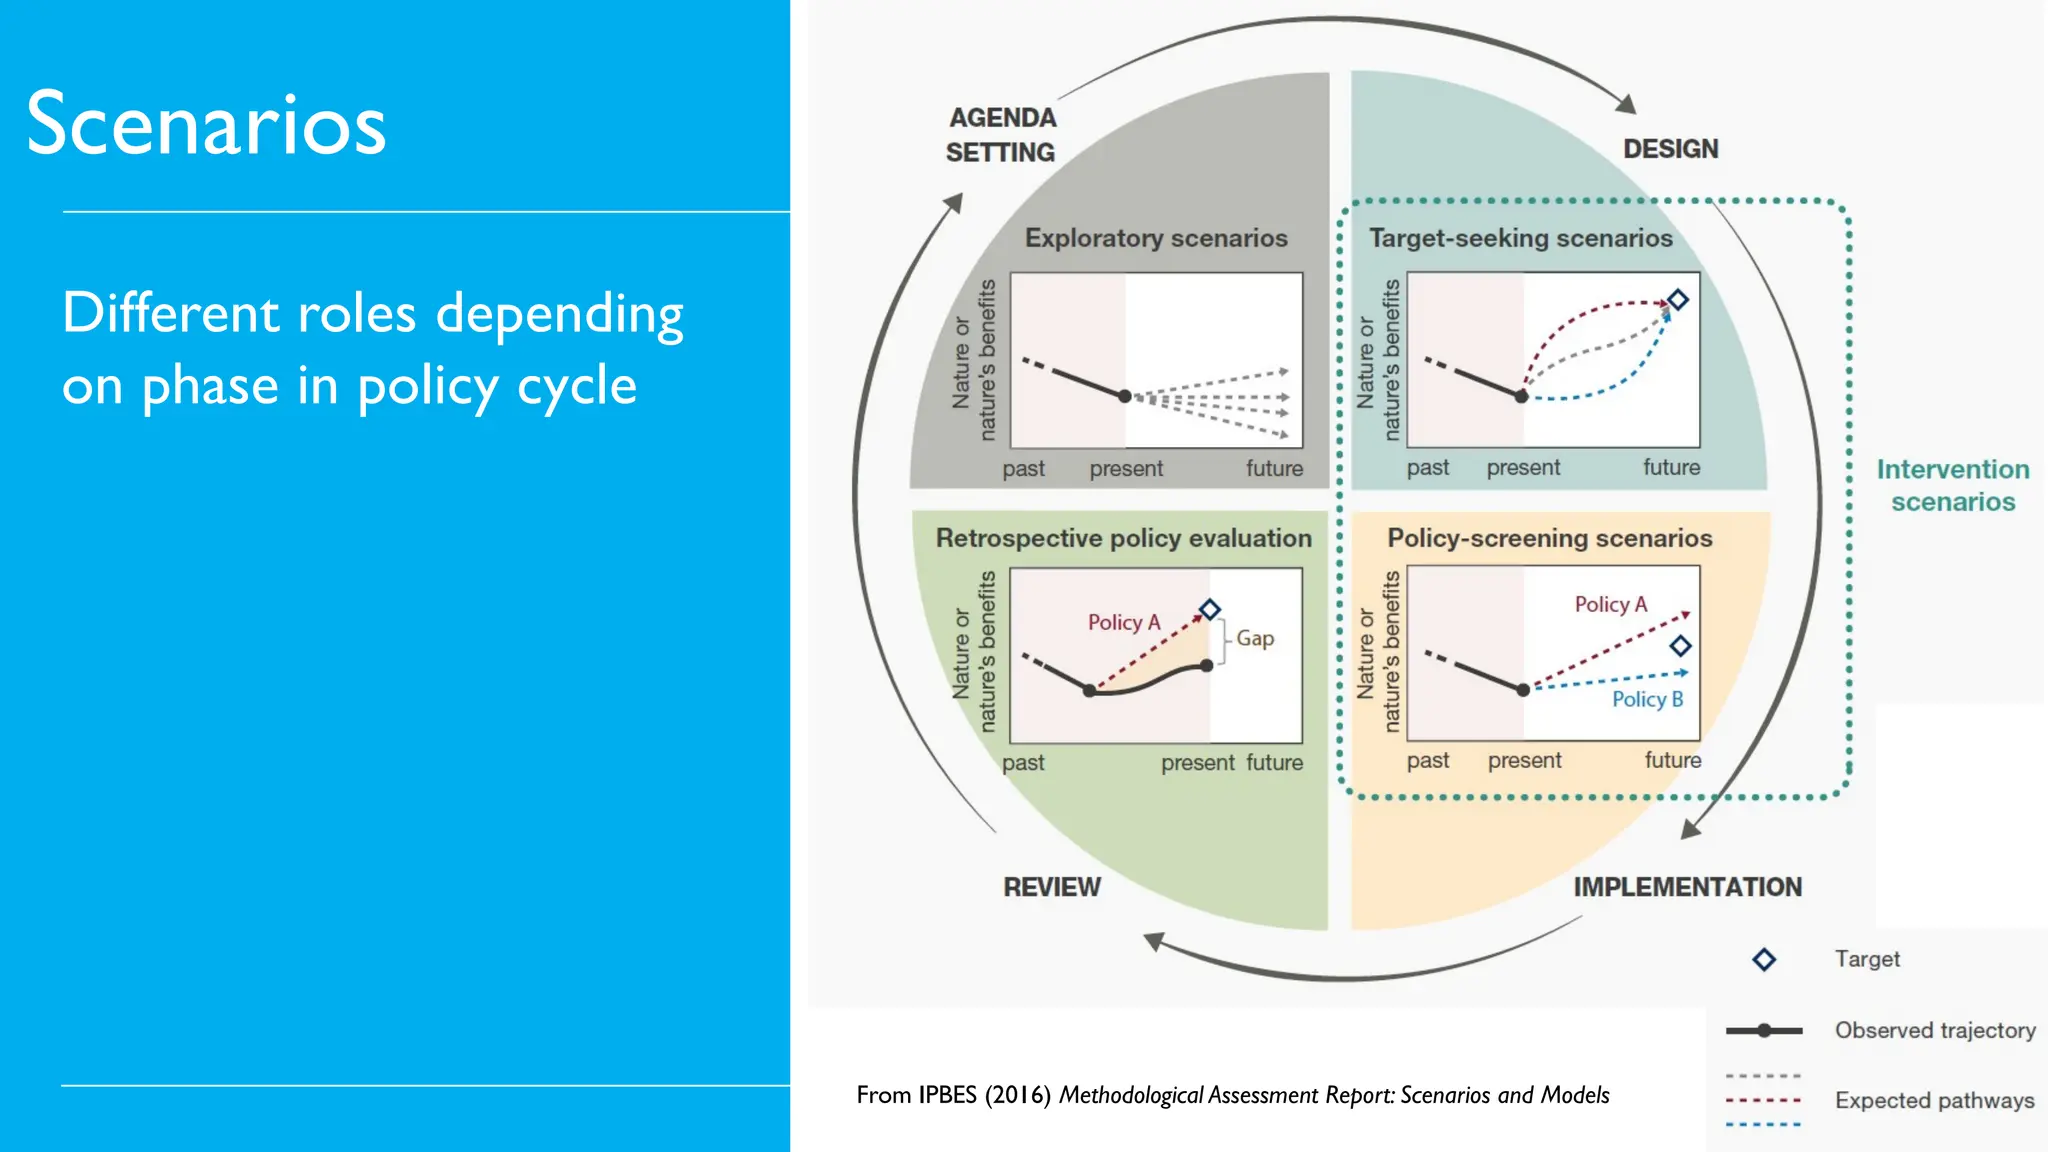
#13 This figure shows the roles played by different types of scenarios corresponding to the major phases of the policy
cycle. Types of scenarios are illustrated by graphs of changes in nature and nature’s benefits over time. The four major phases of
the policy cycle are indicated by the labels and grey arrows outside the coloured quarters of the circle. In “exploratory scenarios”, the
dashed lines represent different plausible futures, often based on storylines. In “target-seeking scenarios” (also known as “normative
scenarios”), the diamond represents an agreed-upon future target and the coloured dashed lines indicate scenarios that provide
alternative pathways for reaching this target. In “policy-screening scenarios” (also known as “ex-ante scenarios”), the dashed lines
represent various policy options under consideration. In “retrospective policy evaluation” (also known as “ex-post evaluation”), the
observed trajectory of a policy implemented in the past (solid black line) is compared to scenarios that would have achieved the
intended target (dashed line).
#26 Aims to increase the understanding on the use of scenarios and models to review implementation over time and evaluate the adequacy of ambition