IUCN support, tools and data for GBF headline indicators
1.
INTERNATIONAL UNION FORCONSERVATION OF NATURE
IUCN support, tools and data for GBF
headline indicators
Catherine Numa
Biodiversity Standards & Indicators Manager
IUCN Centre for Mediterranean Cooperation
2.
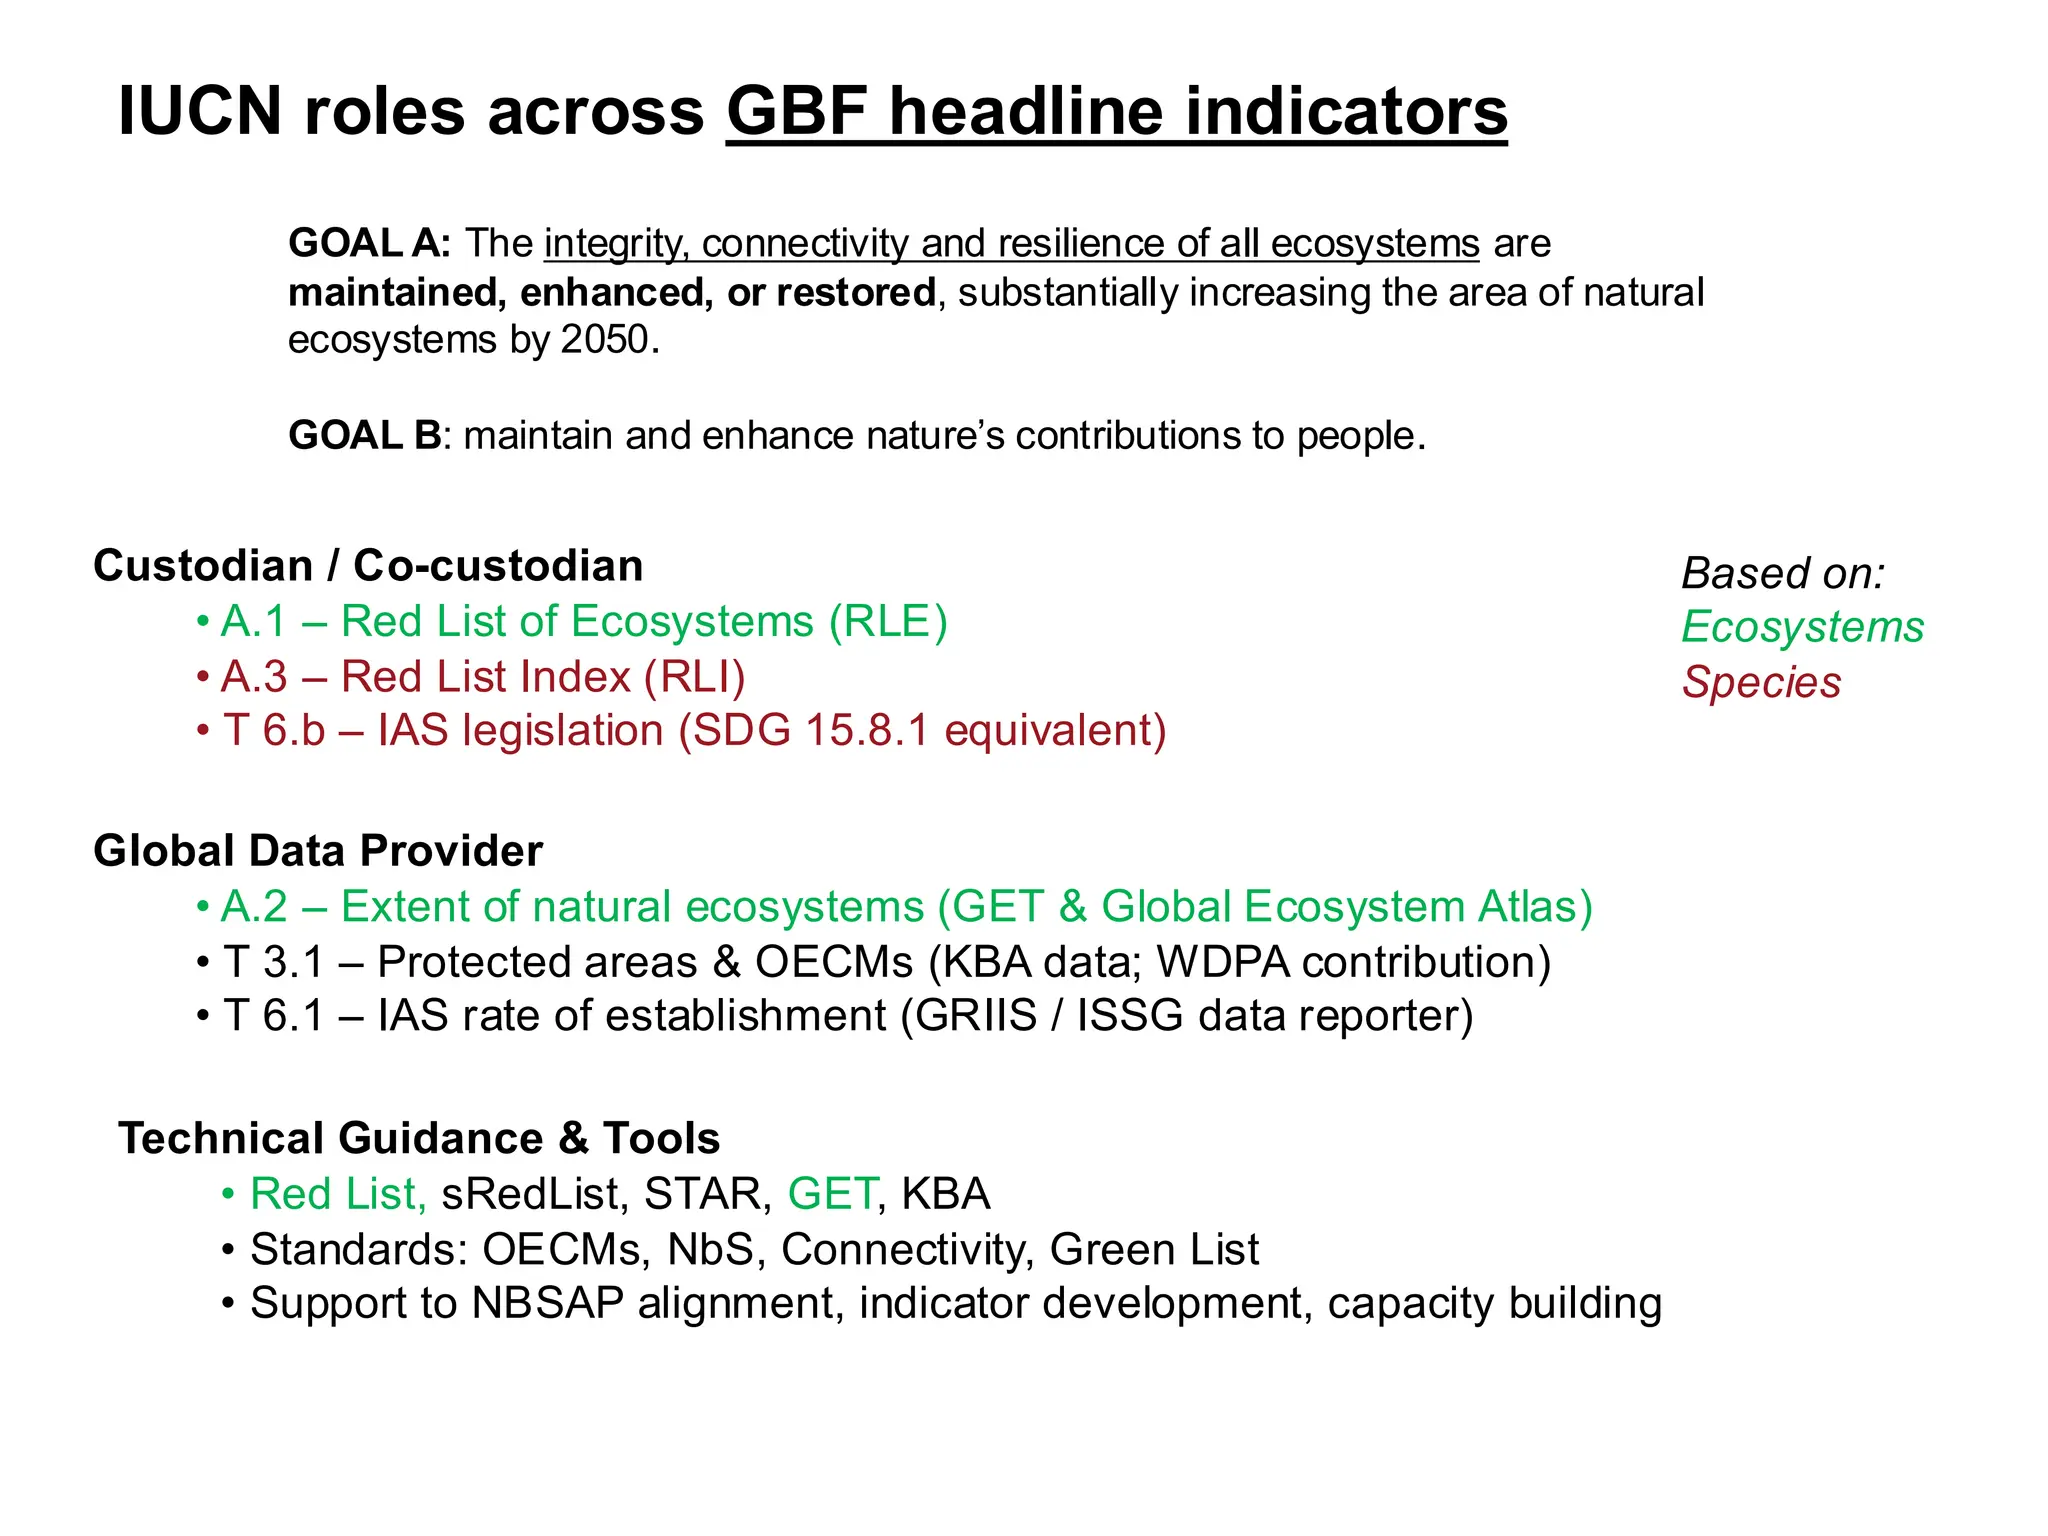
IUCN roles acrossGBF headline indicators
Custodian / Co-custodian
• A.1 – Red List of Ecosystems (RLE)
• A.3 – Red List Index (RLI)
• T 6.b – IAS legislation (SDG 15.8.1 equivalent)
Global Data Provider
• A.2 – Extent of natural ecosystems (GET & Global Ecosystem Atlas)
• T 3.1 – Protected areas & OECMs (KBA data; WDPA contribution)
• T 6.1 – IAS rate of establishment (GRIIS / ISSG data reporter)
Technical Guidance & Tools
• Red List, sRedList, STAR, GET, KBA
• Standards: OECMs, NbS, Connectivity, Green List
• Support to NBSAP alignment, indicator development, capacity building
Based on:
Ecosystems
Species
GOAL A: The integrity, connectivity and resilience of all ecosystems are
maintained, enhanced, or restored, substantially increasing the area of natural
ecosystems by 2050.
GOAL B: maintain and enhance nature’s contributions to people.
3.
3
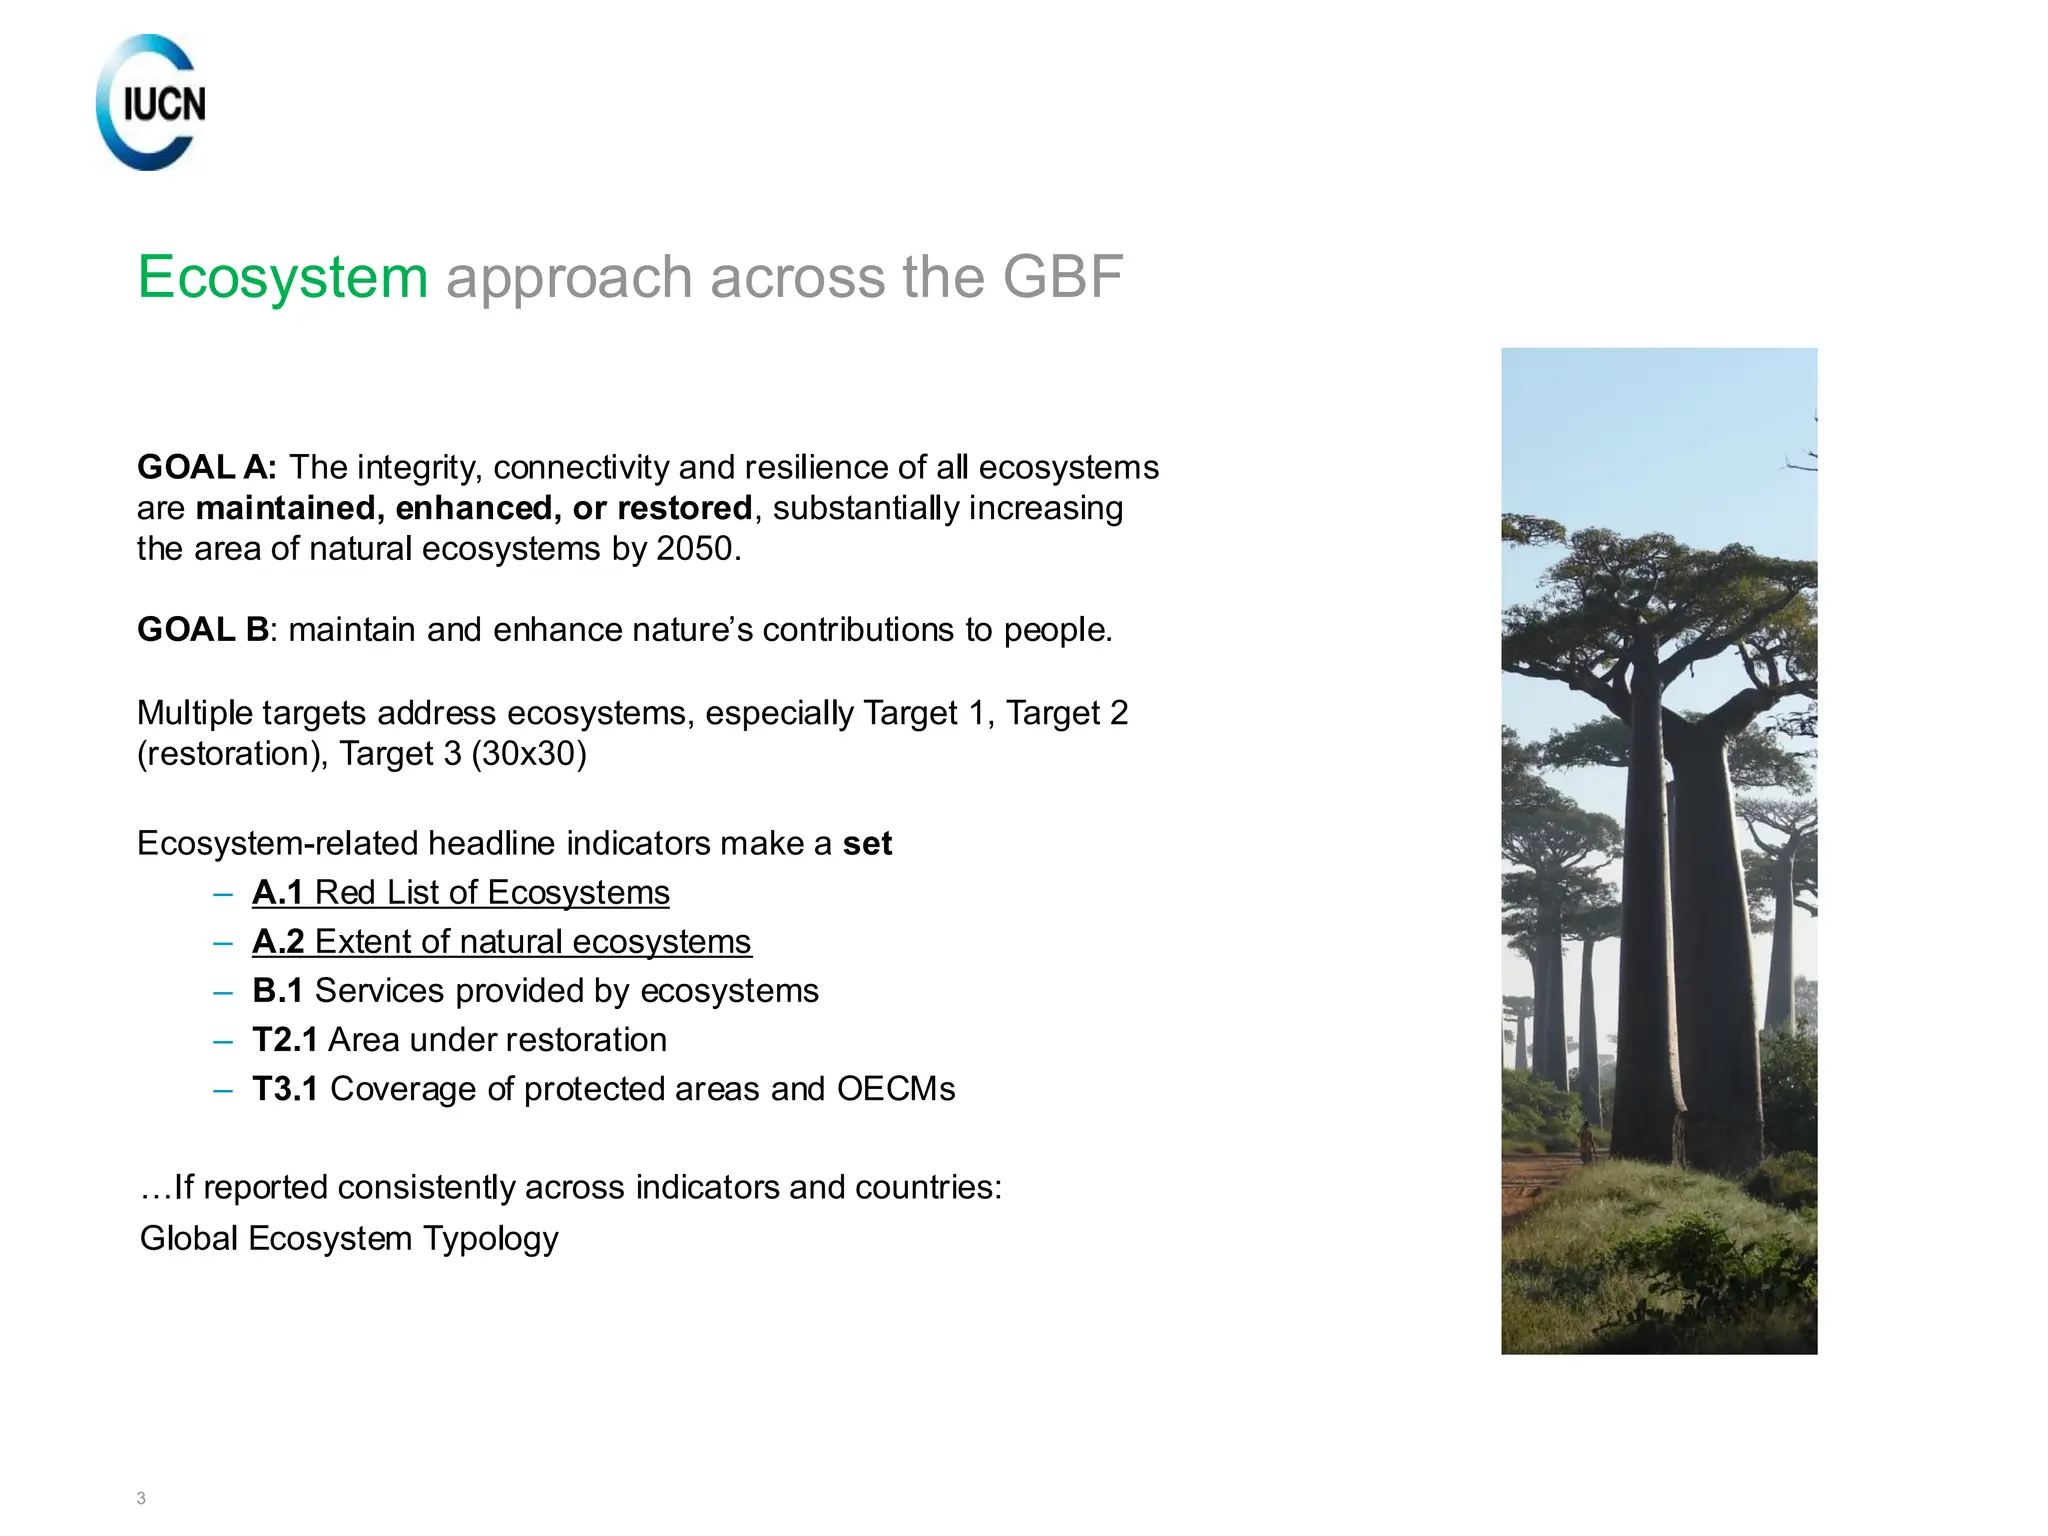
Ecosystem approach acrossthe GBF
GOAL A: The integrity, connectivity and resilience of all ecosystems
are maintained, enhanced, or restored, substantially increasing
the area of natural ecosystems by 2050.
GOAL B: maintain and enhance nature’s contributions to people.
Multiple targets address ecosystems, especially Target 1, Target 2
(restoration), Target 3 (30x30)
Ecosystem-related headline indicators make a set
– A.1 Red List of Ecosystems
– A.2 Extent of natural ecosystems
– B.1 Services provided by ecosystems
– T2.1 Area under restoration
– T3.1 Coverage of protected areas and OECMs
…If reported consistently across indicators and countries:
Global Ecosystem Typology
4.
4
Marine Freshwater
Terrestrial
MT TF
FM
MFT
T1T2 T3 T4 T5 T6 T7
T3.1 T3.2 T3.3 T3.4 T3.5
T3.2a T3.2b
C
A B
T3.2.1 T3.2.2 T3.2.3
1. Realms
2. Biomes
3. Ecosystem
functional groups
4. Biogeographic
functional groups
Top down classes
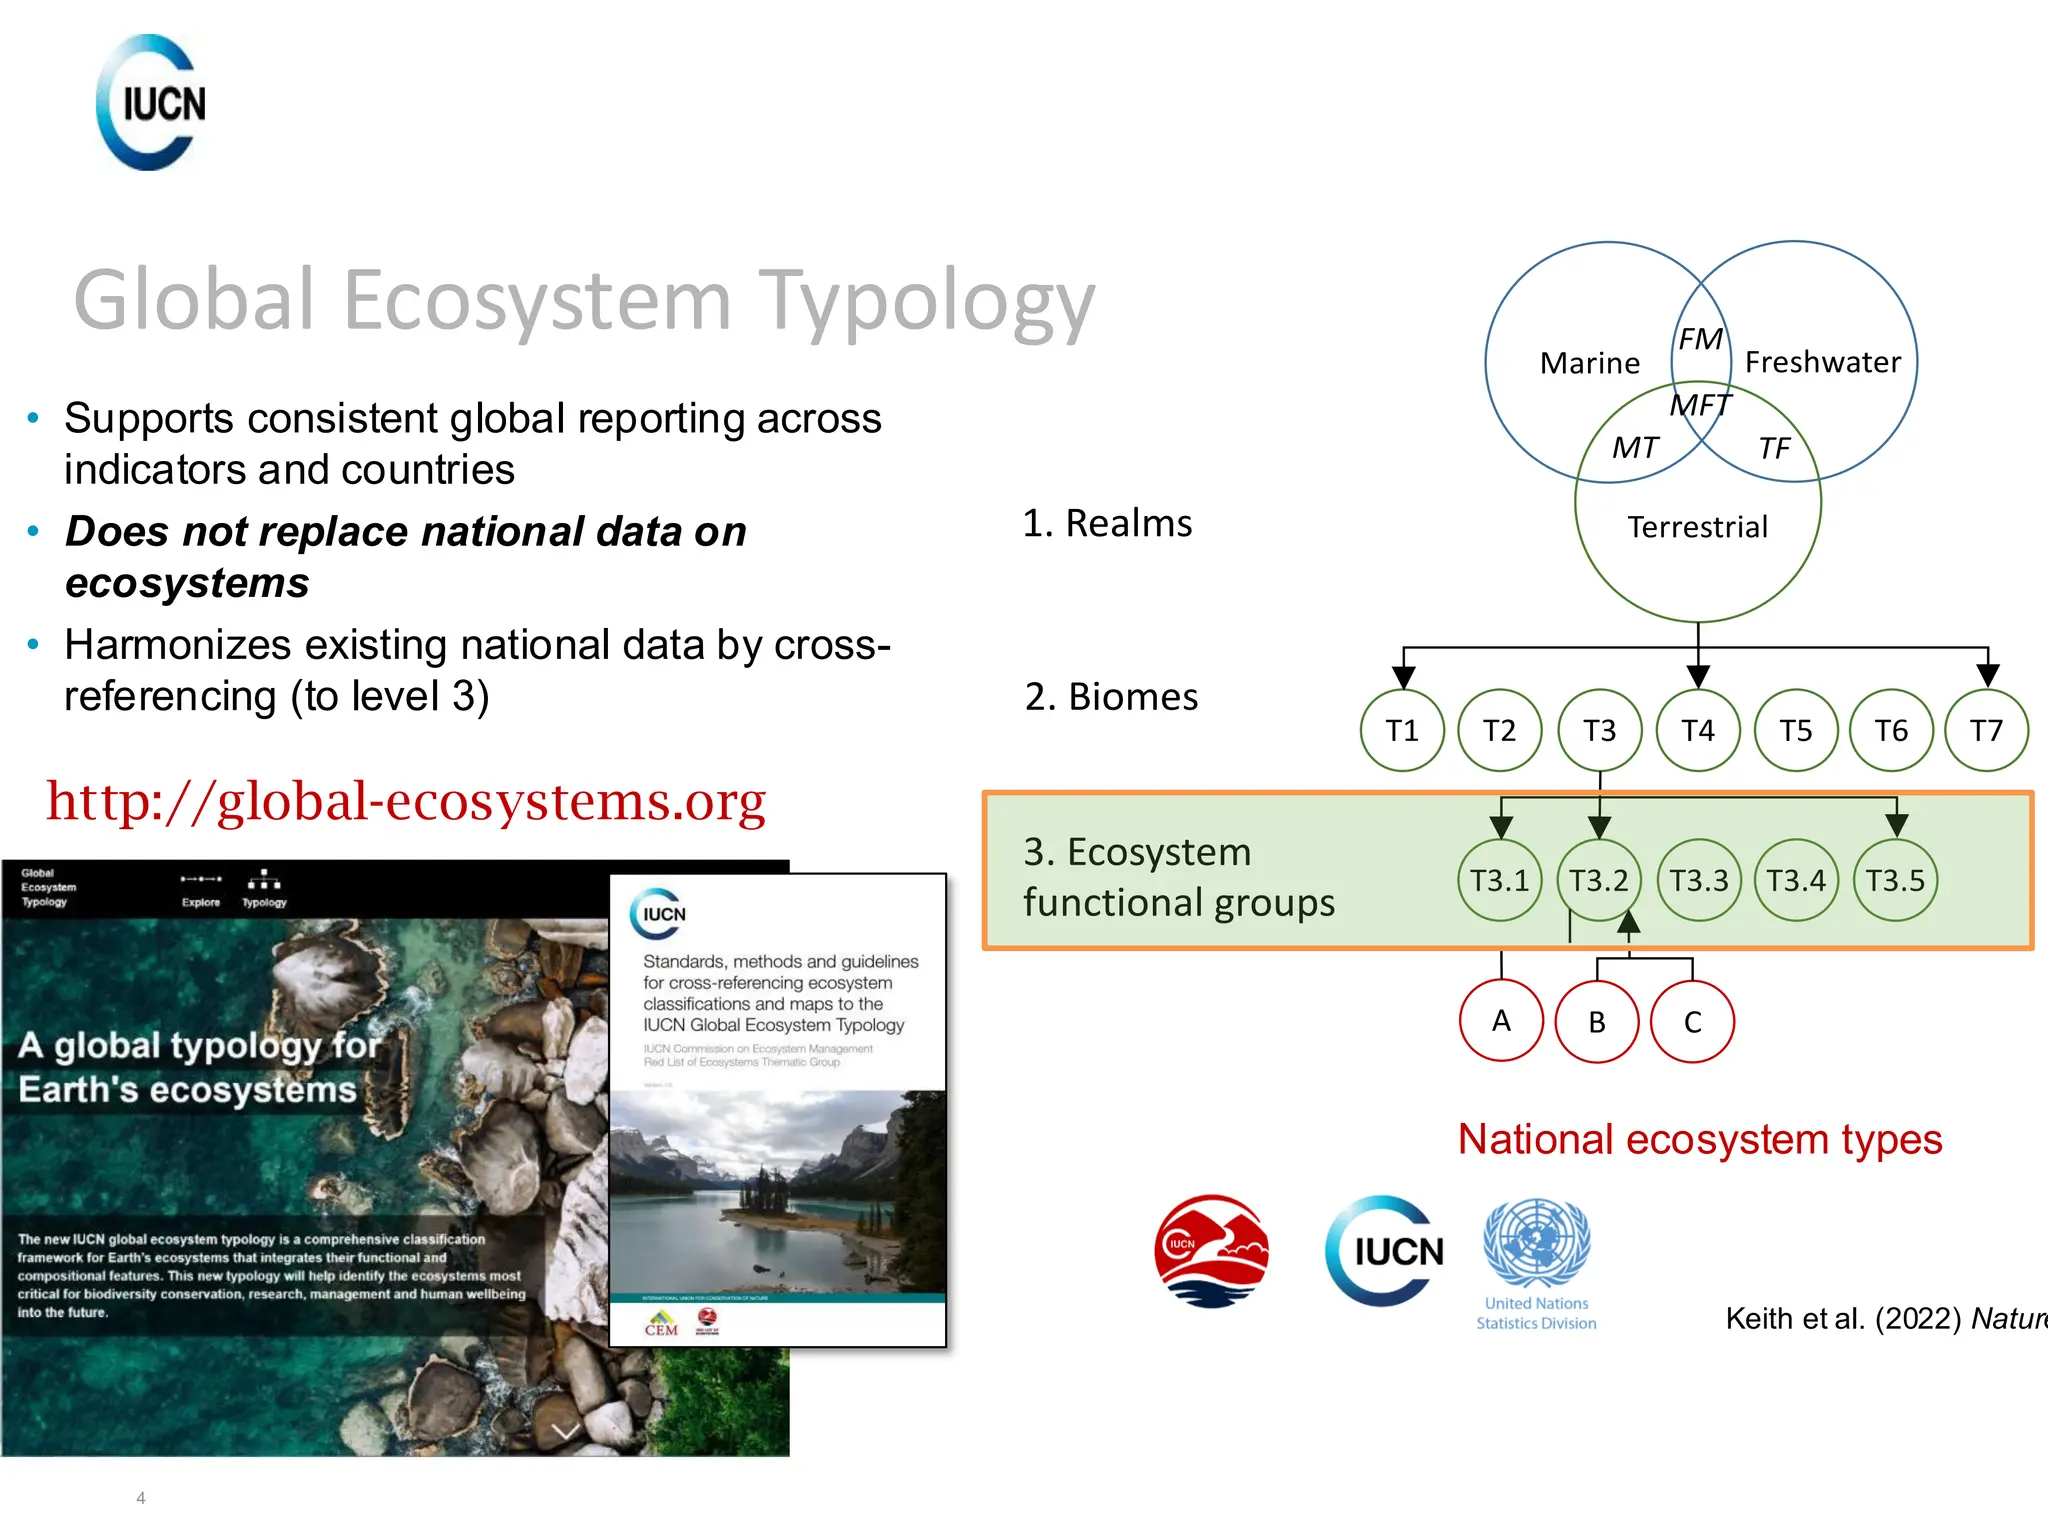
• Supports consistent global reporting across
indicators and countries
• Does not replace national data on
ecosystems
• Harmonizes existing national data by cross-
referencing (to level 3)
Global Ecosystem Typology
Marine Freshwater
Terrestrial
MT TF
FM
MFT
T1 T2 T3 T4 T5 T6 T7
T3.1 T3.2 T3.3 T3.4 T3.5
T3.2a T3.2b
C
A B
T3.2.1 T3.2.2 T3.2.3
1. Realms
2. Biomes
3. Ecosystem
functional groups
4. Biogeographic
functional groups
5. Global
ecosystem ty
6. Local
ecosystem ty
Top down classes Bottom-up clas
National ecosystem types
Keith et al. (2022) Nature
http://global-ecosystems.org
5.
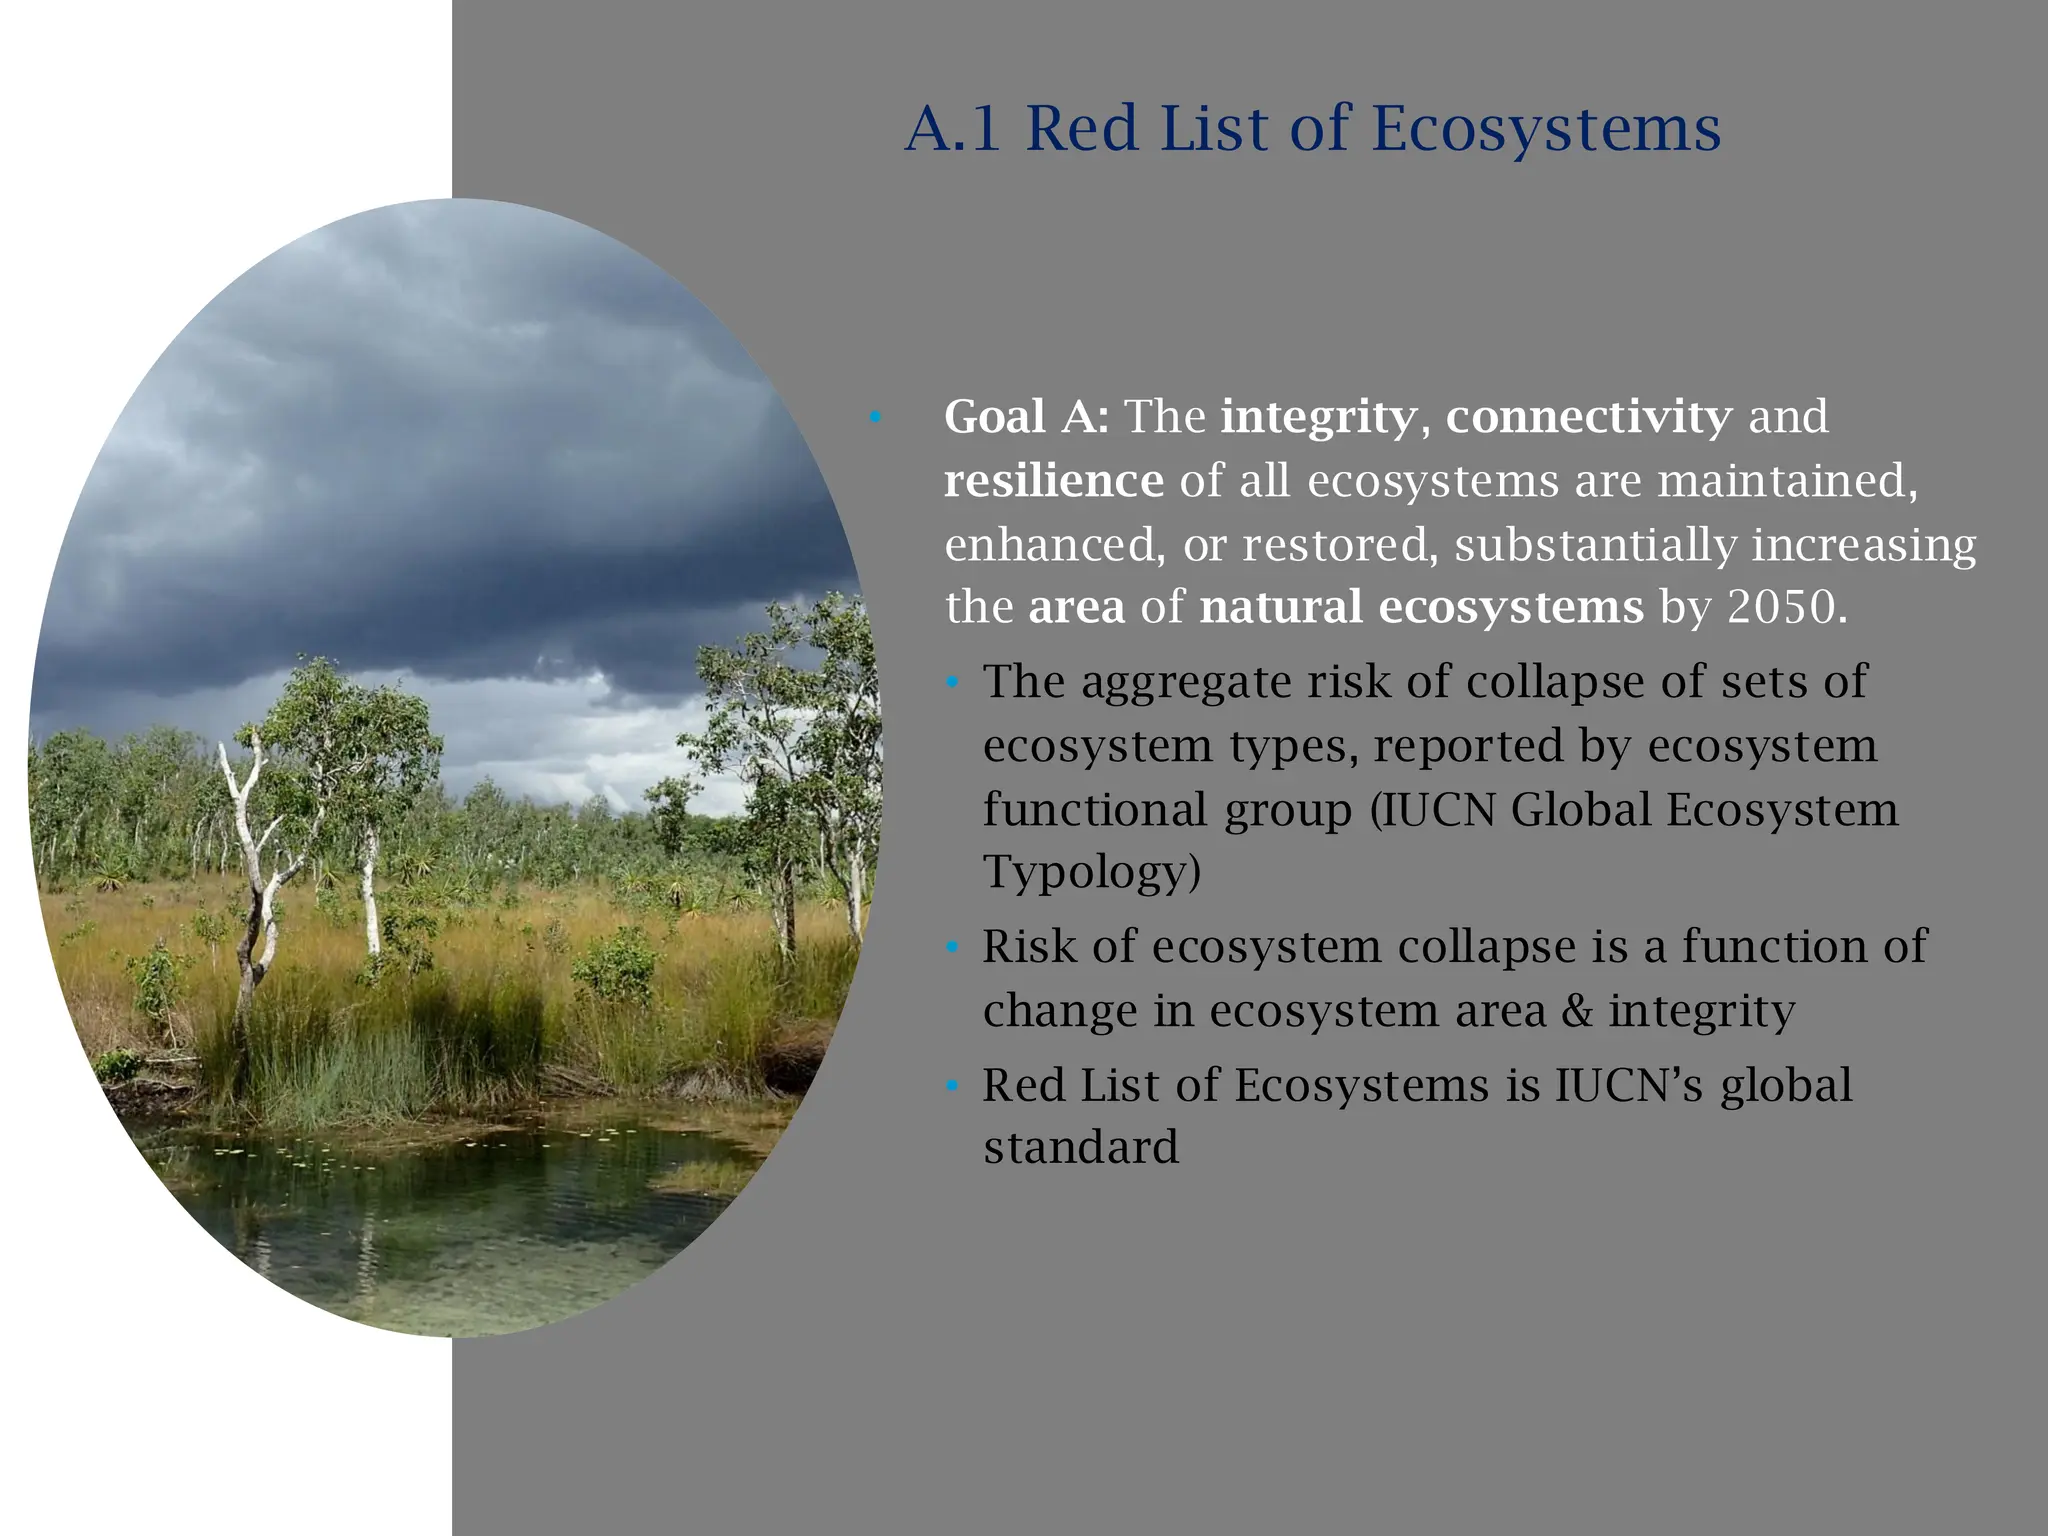
• Goal A:The integrity, connectivity and
resilience of all ecosystems are maintained,
enhanced, or restored, substantially increasing
the area of natural ecosystems by 2050.
• The aggregate risk of collapse of sets of
ecosystem types, reported by ecosystem
functional group (IUCN Global Ecosystem
Typology)
• Risk of ecosystem collapse is a function of
change in ecosystem area & integrity
• Red List of Ecosystems is IUCN’s global
standard
A.1 Red List of Ecosystems
6.
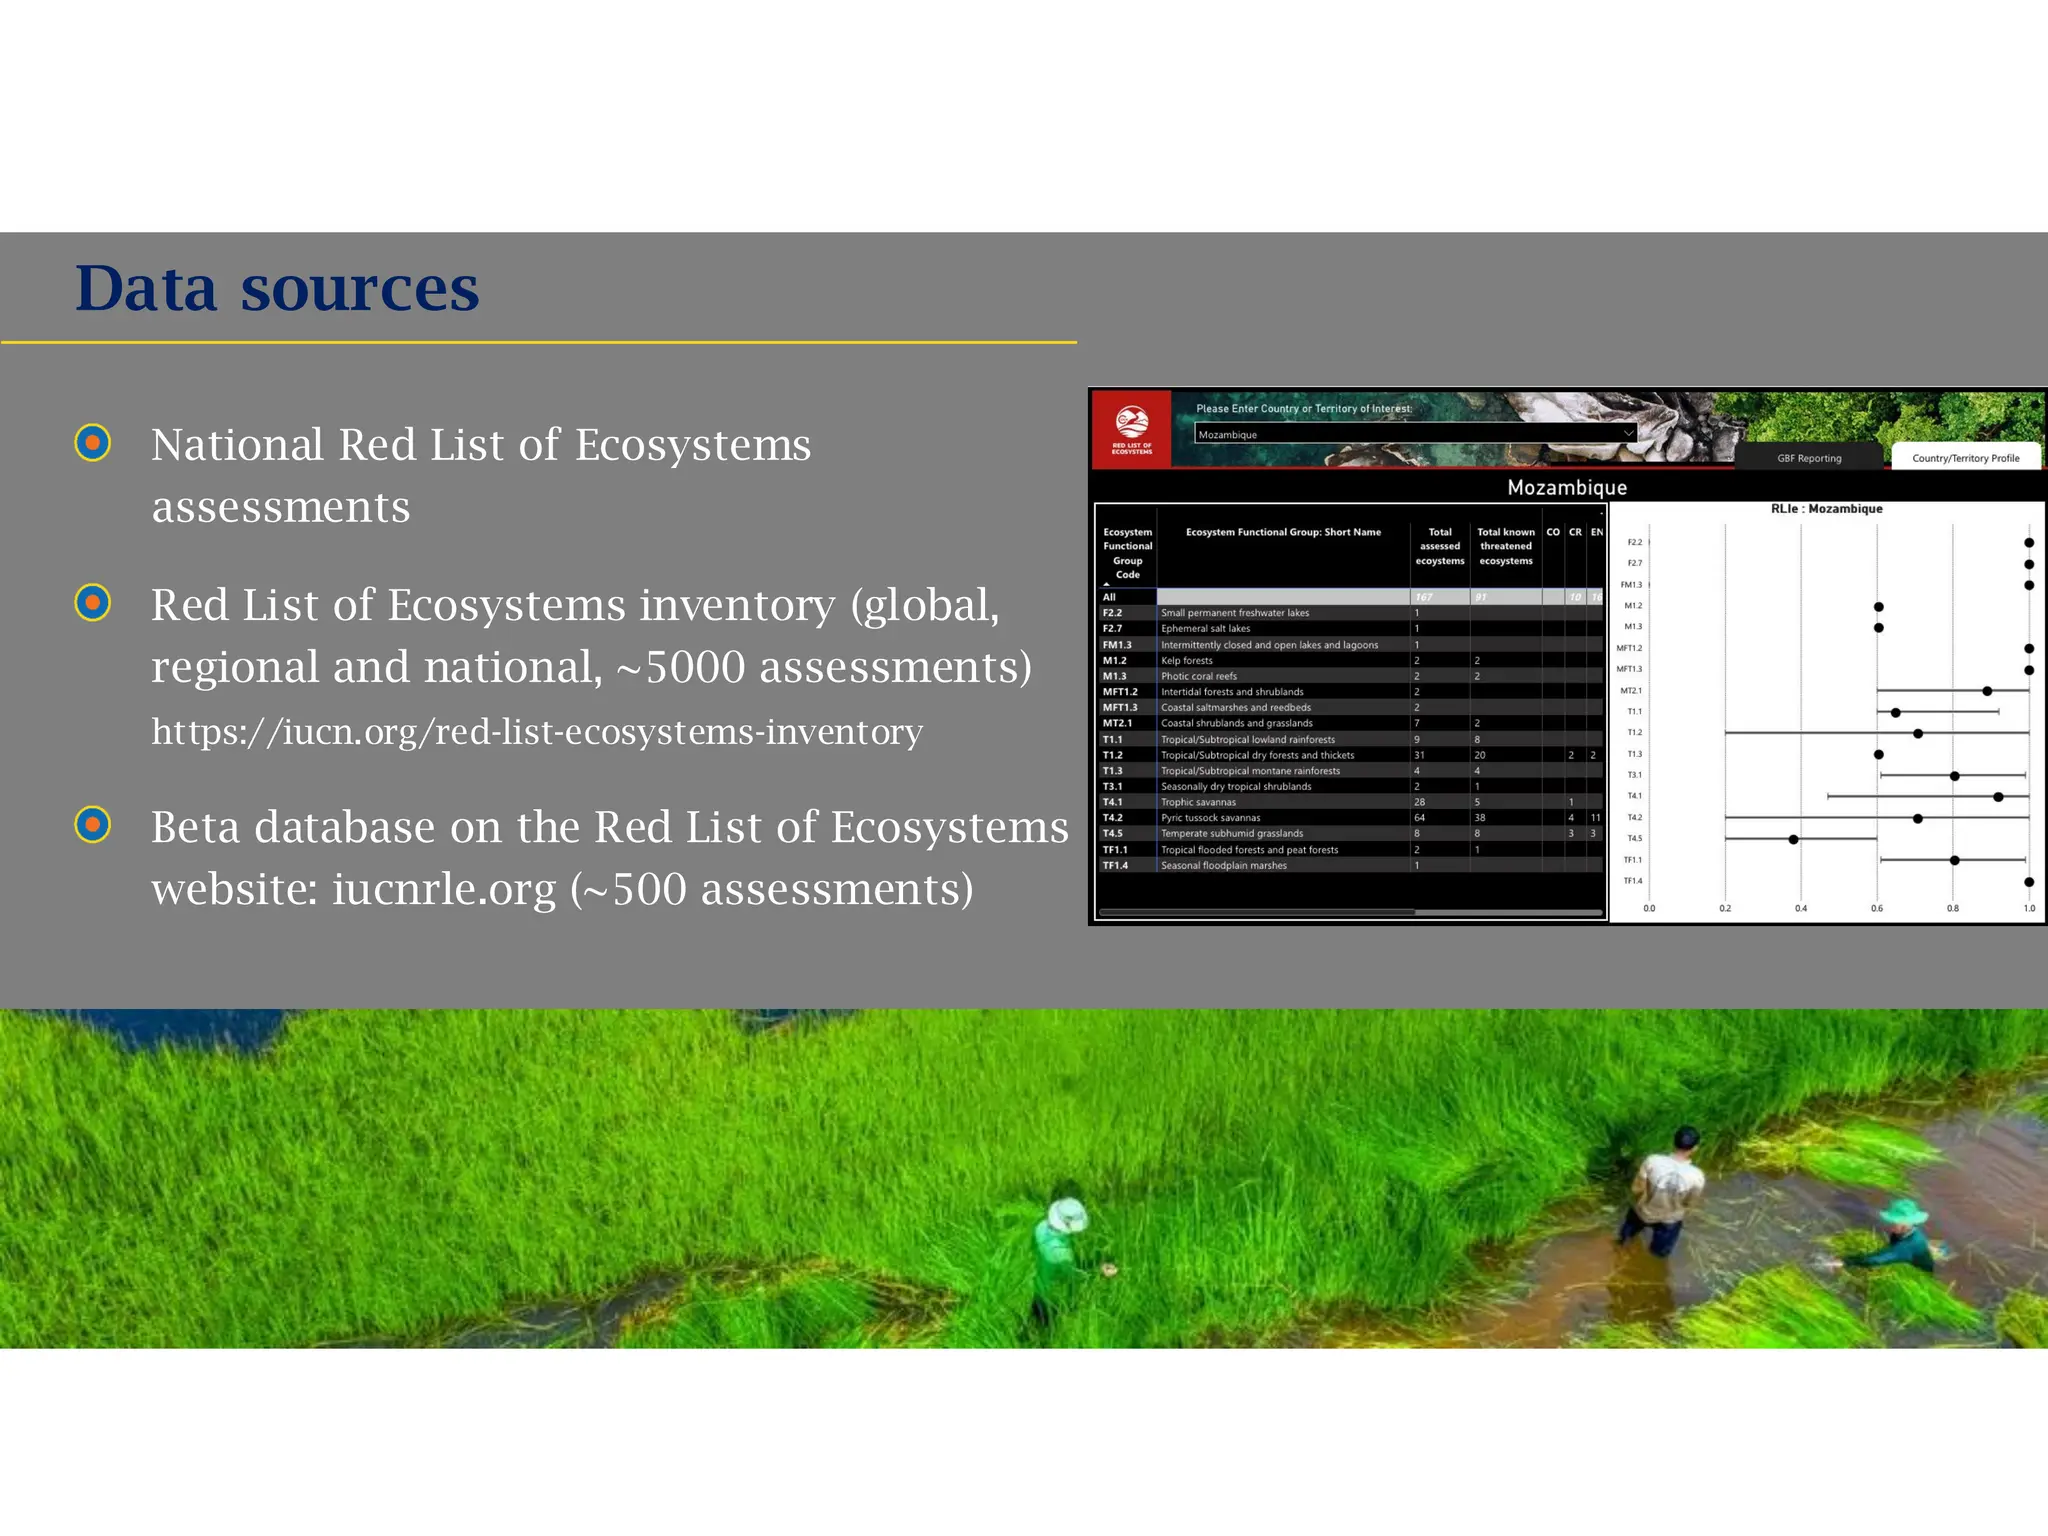
National Red Listof Ecosystems
assessments
Red List of Ecosystems inventory (global,
regional and national, ~5000 assessments)
https://iucn.org/red-list-ecosystems-inventory
Beta database on the Red List of Ecosystems
website: iucnrle.org (~500 assessments)
Data sources
7.
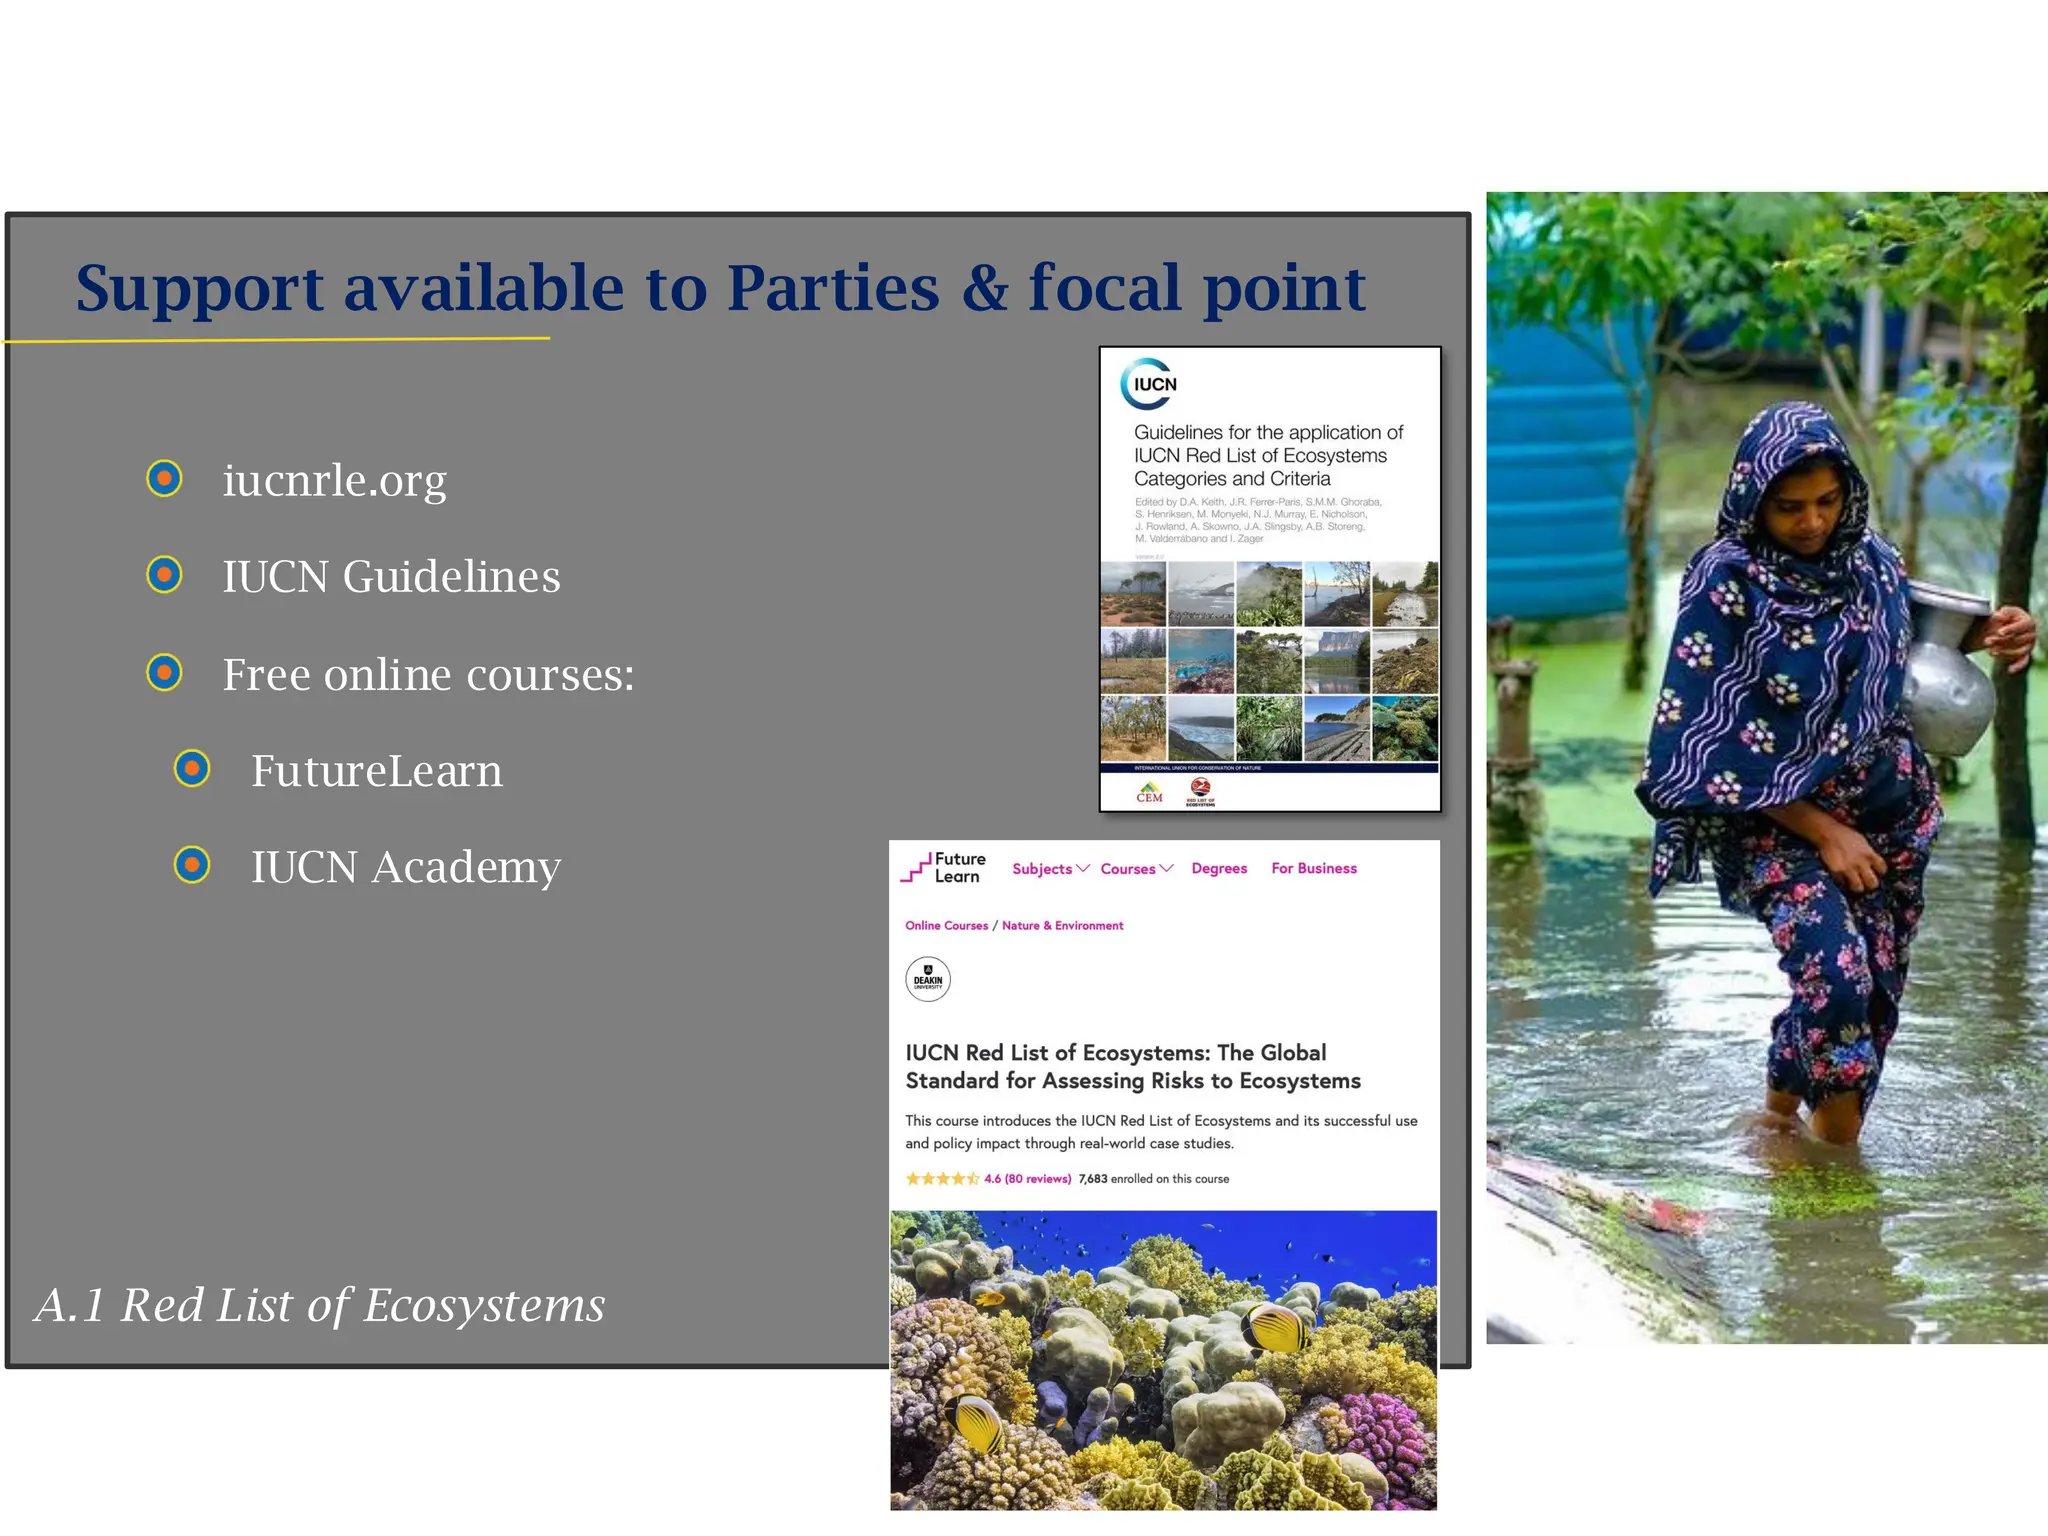
Support available toParties & focal point
iucnrle.org
IUCN Guidelines
Free online courses:
FutureLearn
IUCN Academy
A.1 Red List of Ecosystems
8.
• The extentof natural ecosystems as a
proportion of overall area, tracked over time.
• Element of Goal A refers to:
– “substantially increasing the area of natural
ecosystems by 2050”.
• Elements of Target 1 that refer to:
– “addressing land and sea use change”,
– “to bring the loss of areas of high biodiversity
importance, including ecosystems of high
ecological integrity, close to zero by 2030”.
• The indicator can be disaggregated into
different natural ecosystem types.
A.2 Extent of natural ecosystems
9.
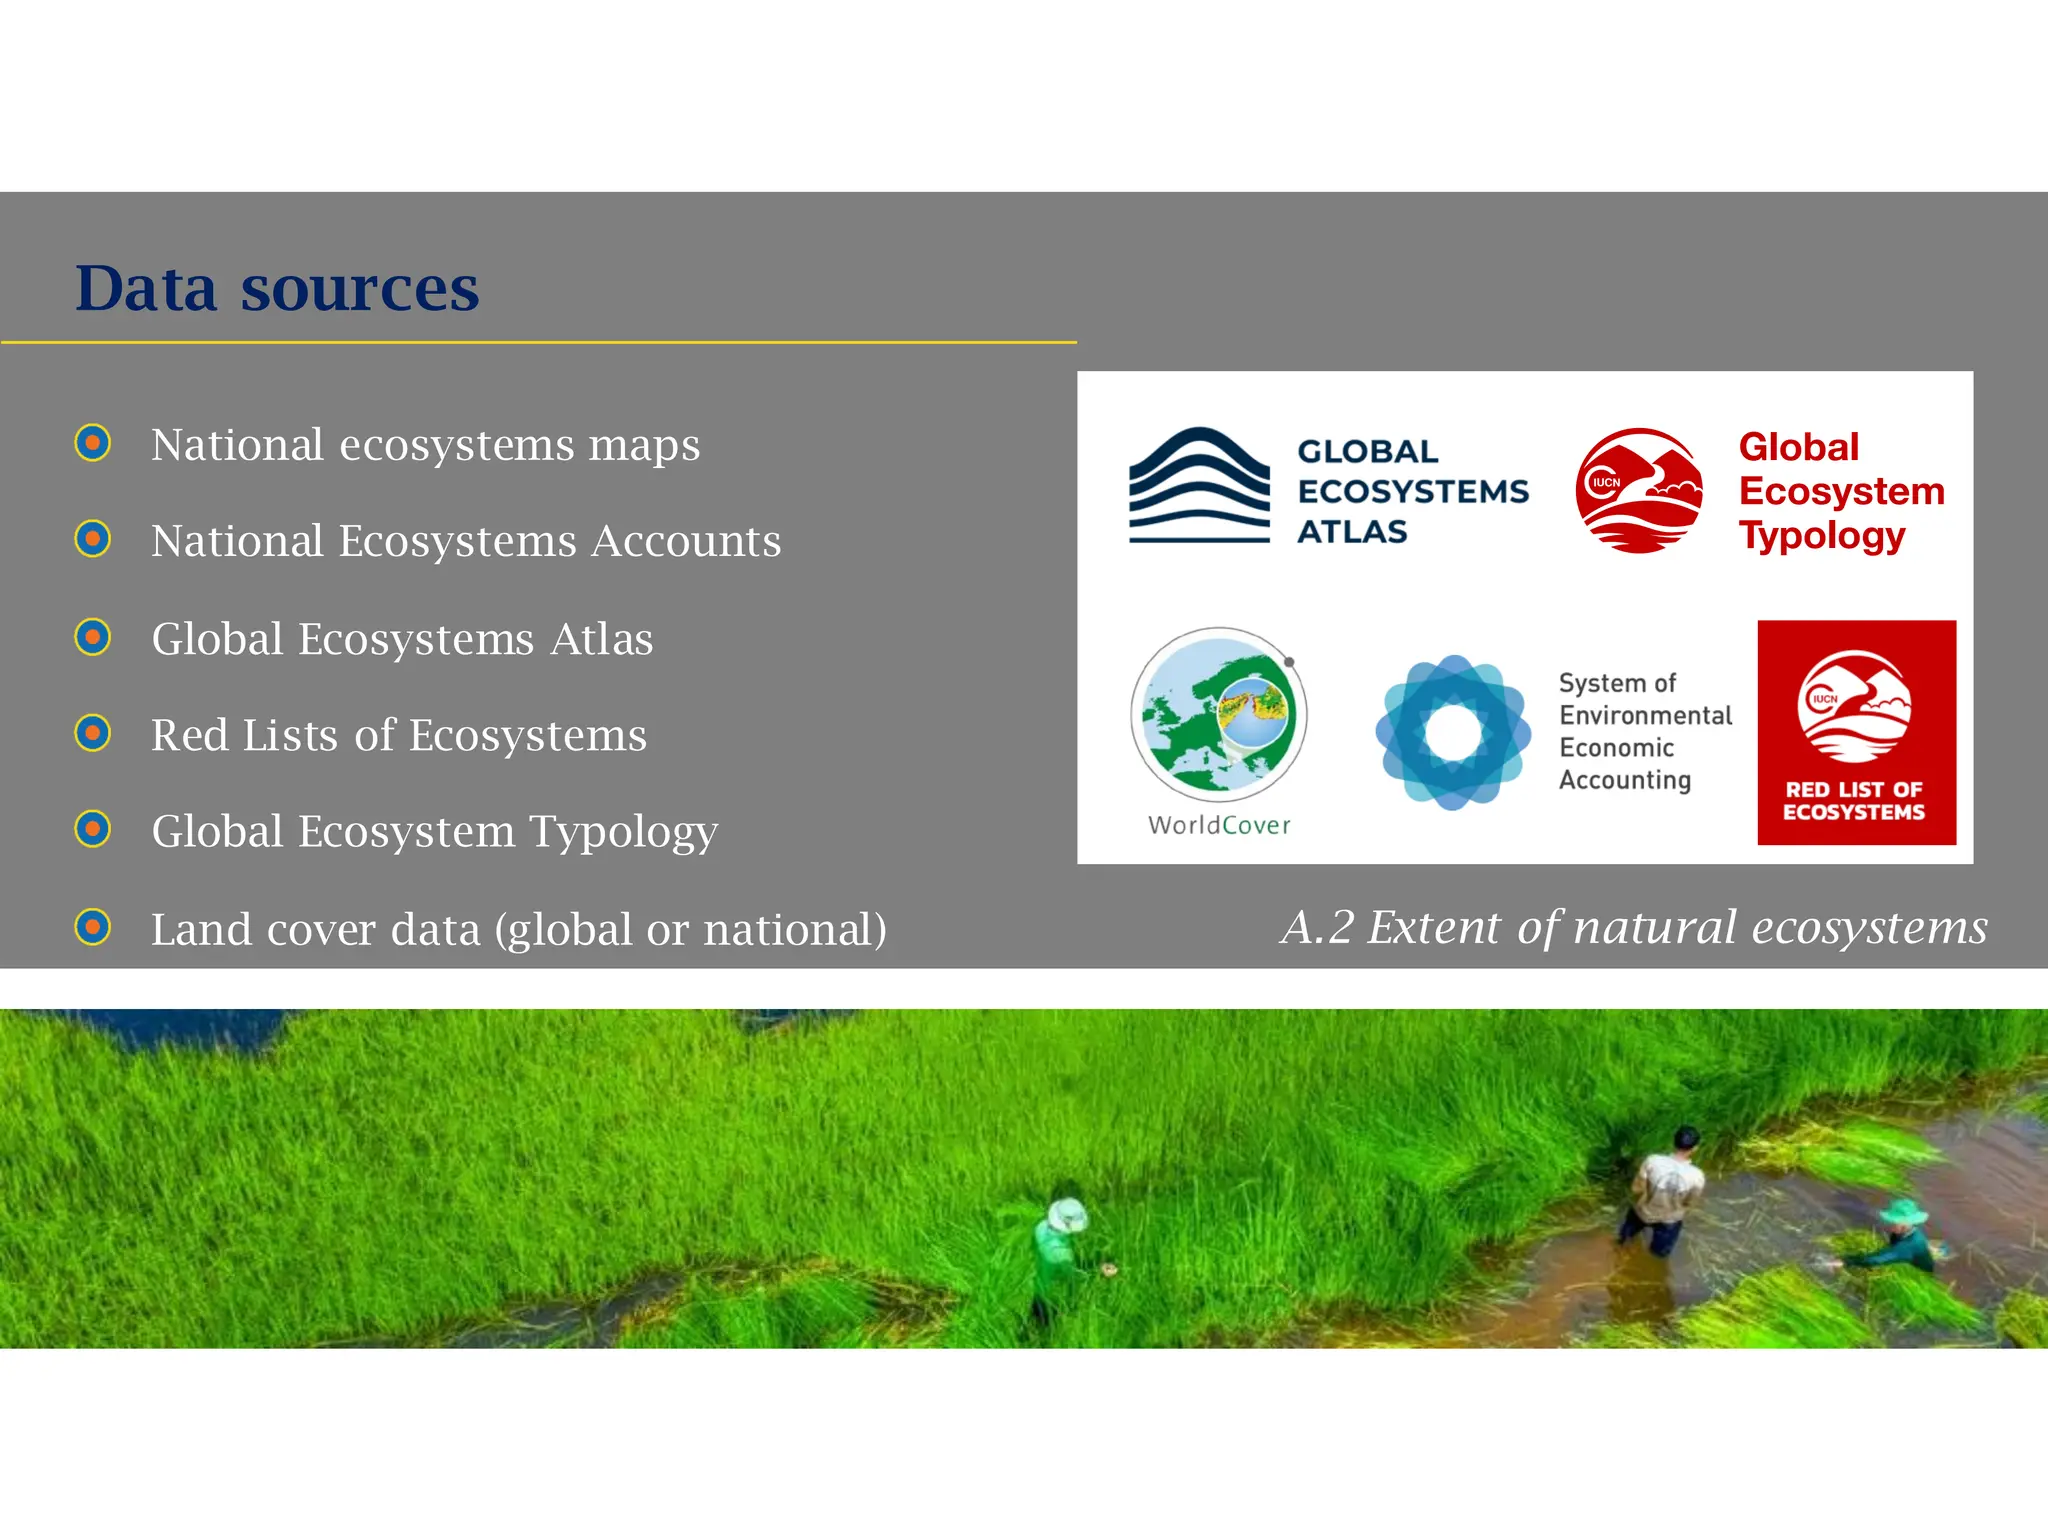
National ecosystems maps
NationalEcosystems Accounts
Global Ecosystems Atlas
Red Lists of Ecosystems
Global Ecosystem Typology
Land cover data (global or national)
Data sources
A.2 Extent of natural ecosystems
https://www.google.com/url?sa=i&url=h
ttps%3A%2F%2Fgithub.com%2FESA-
WorldCover%2Fesa-worldcover-
datasets&psig=AOvVaw2FZaEKTlkUoDD8
E2E2nRXr&ust=1759820596591000&sou
rce=images&cd=vfe&opi=89978449&ved
=0CBUQjRxqFwoTCJib5dOAj5ADFQAAAA
AdAAAAABAE
10.
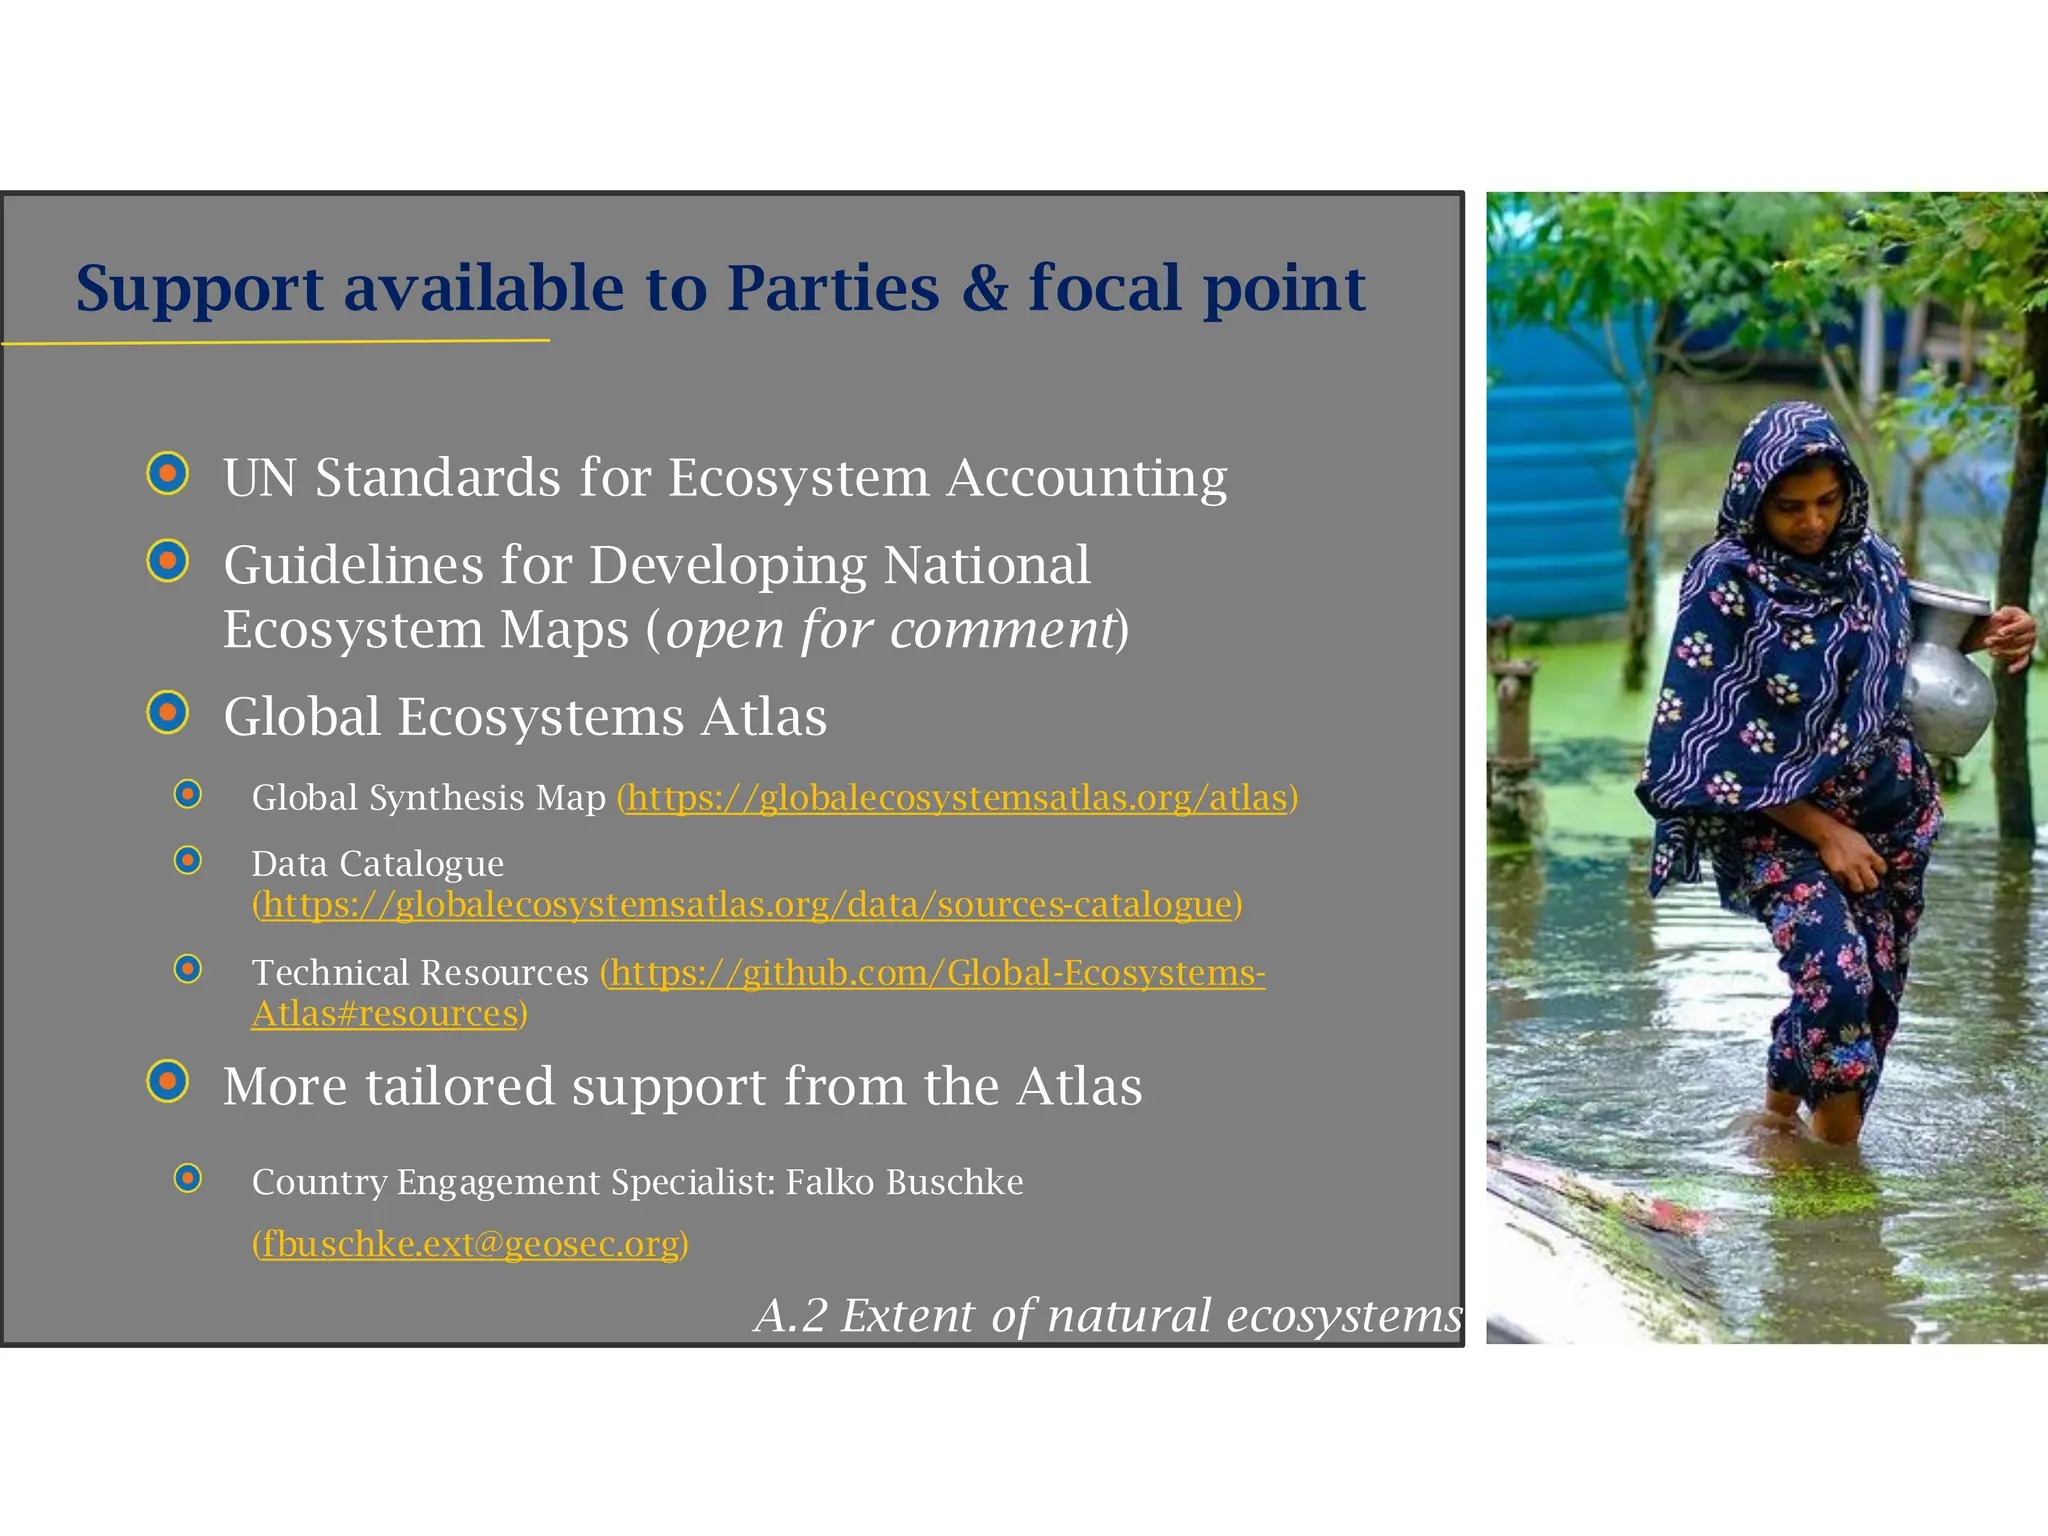
Support available toParties & focal point
UN Standards for Ecosystem Accounting
Guidelines for Developing National
Ecosystem Maps (open for comment)
Global Ecosystems Atlas
Global Synthesis Map (https://globalecosystemsatlas.org/atlas)
Data Catalogue
(https://globalecosystemsatlas.org/data/sources-catalogue)
Technical Resources (https://github.com/Global-Ecosystems-
Atlas#resources)
More tailored support from the Atlas
Country Engagement Specialist: Falko Buschke
(fbuschke.ext@geosec.org)
A.2 Extent of natural ecosystems
11.
INTERNATIONAL UNION FORCONSERVATION OF NATURE
0 0.2 0.4 0.6 0.8 1
0
5
1
0
R
L
I
e
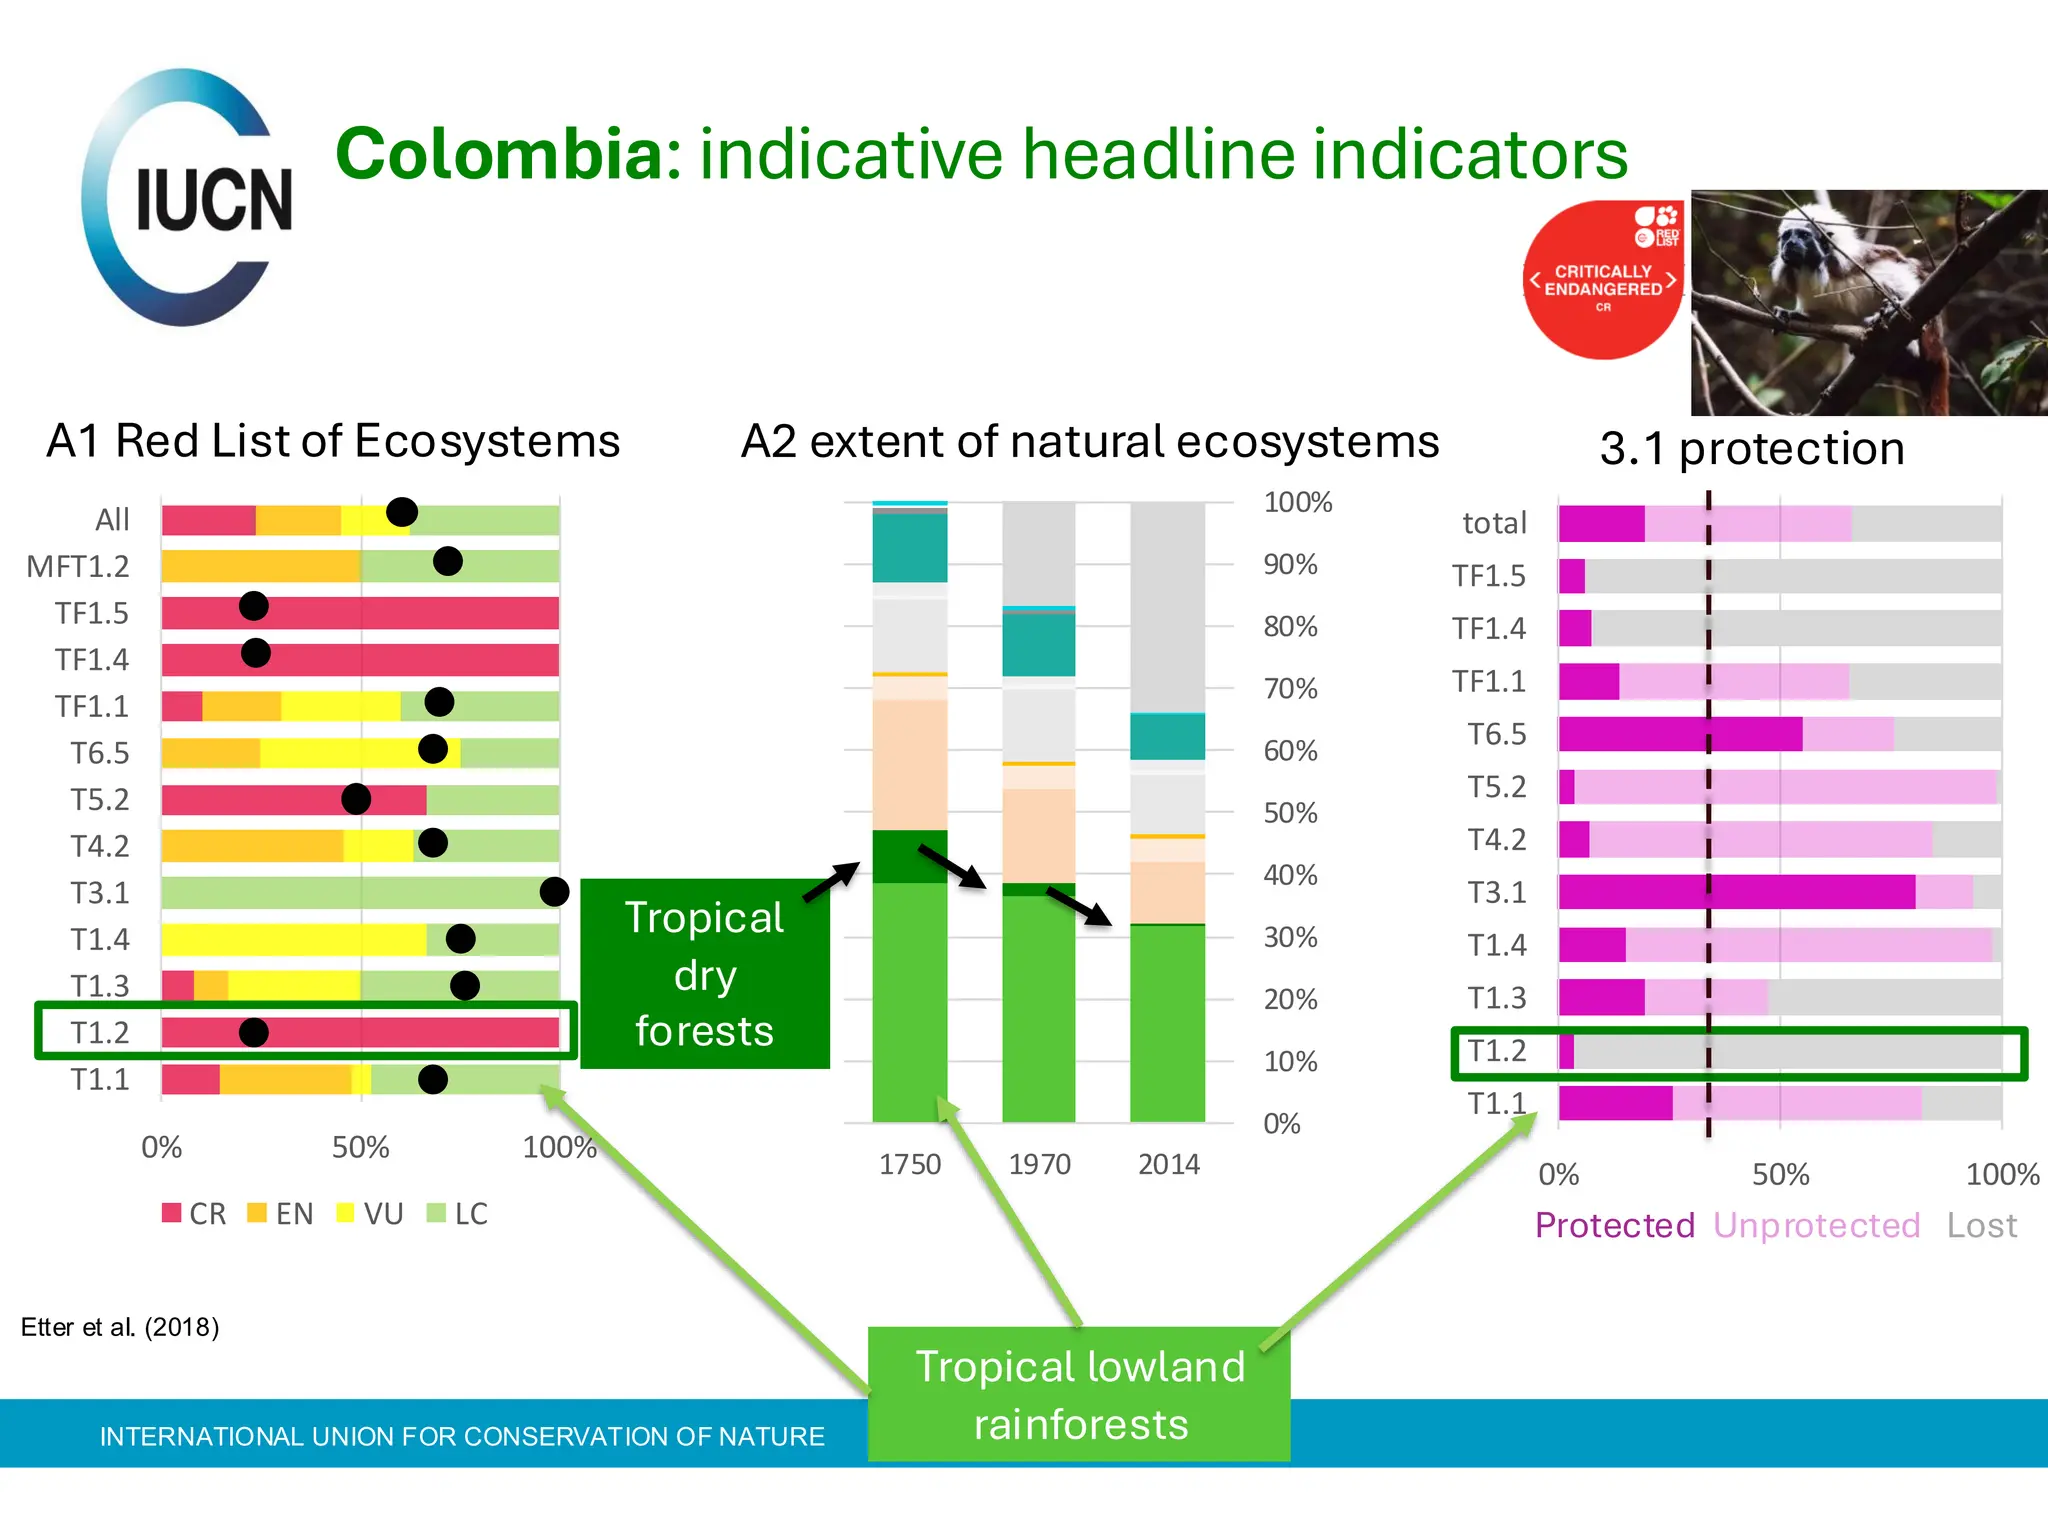
Colombia: indicative headline indicators
0% 50% 100%
T1.1
T1.2
T1.3
T1.4
T3.1
T4.2
T5.2
T6.5
TF1.1
TF1.4
TF1.5
MFT1.2
All
CR EN VU LC
0%
10%
20%
30%
40%
50%
60%
70%
80%
90%
100%
1750 1970 2014
T1.1 T1.2 T1.3
T1.4 T3.1 T4.2
Tropical lowland
rainforests
Tropical
dry
forests
0% 50% 100%
total
TF1.5
TF1.4
TF1.1
T6.5
T5.2
T4.2
T3.1
T1.4
T1.3
T1.2
T1.1
Protected Unprotected Lost
A1 Red List of Ecosystems A2 extent of natural ecosystems 3.1 protection
Etter et al. (2018)
12.
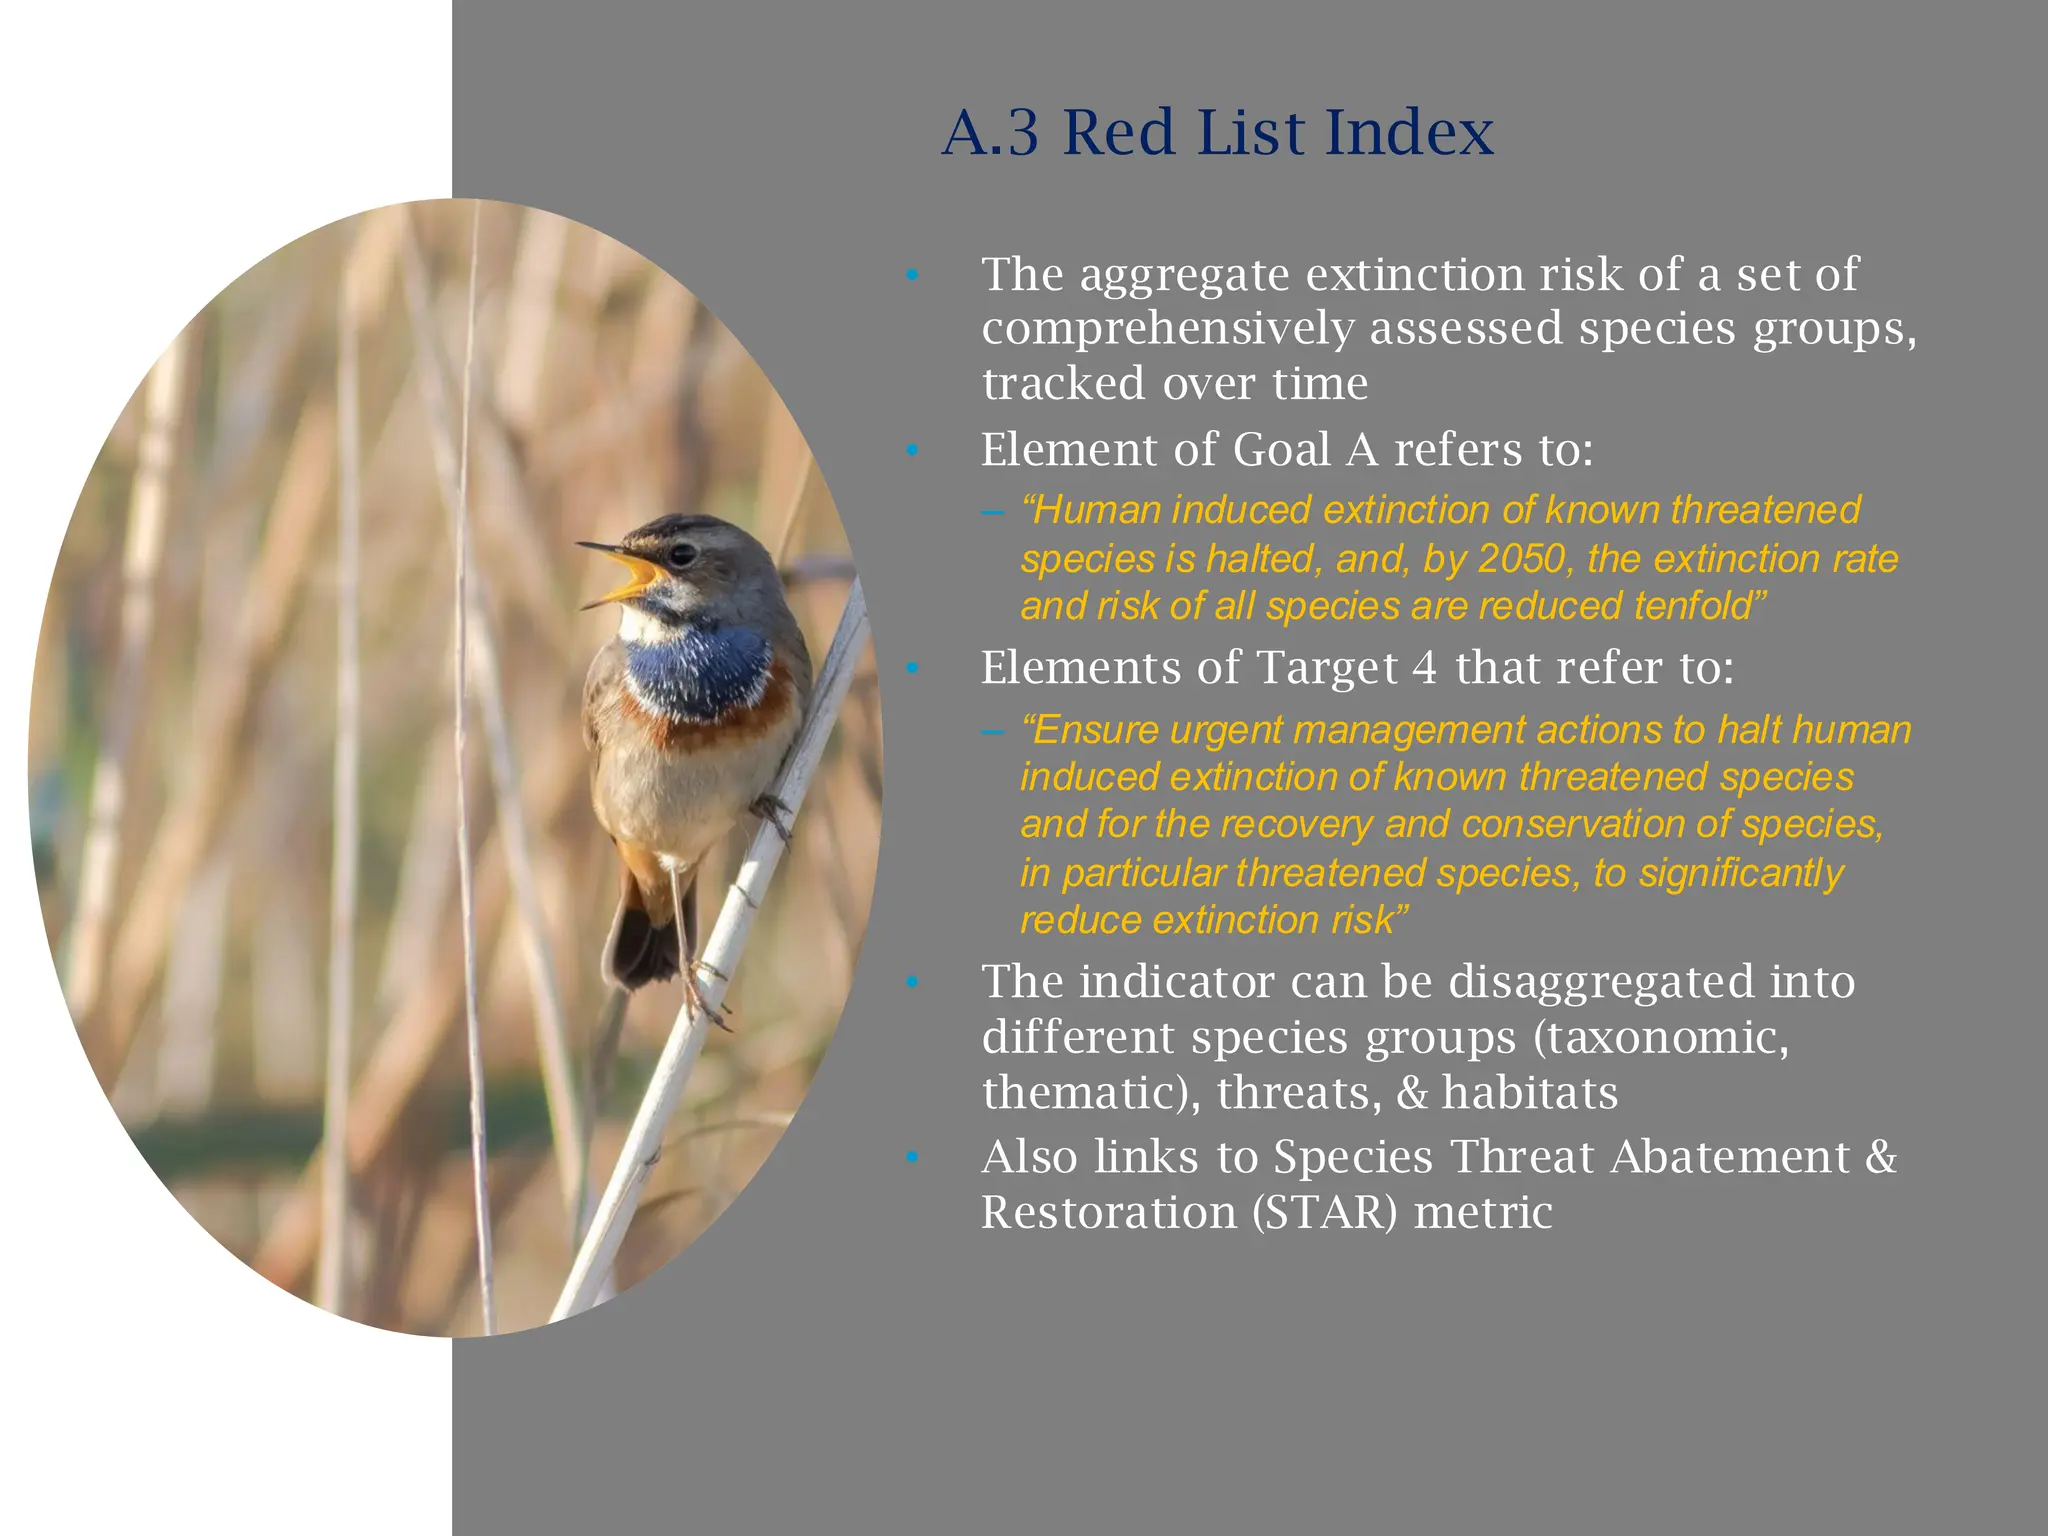
• The aggregateextinction risk of a set of
comprehensively assessed species groups,
tracked over time
• Element of Goal A refers to:
– “Human induced extinction of known threatened
species is halted, and, by 2050, the extinction rate
and risk of all species are reduced tenfold”
• Elements of Target 4 that refer to:
– “Ensure urgent management actions to halt human
induced extinction of known threatened species
and for the recovery and conservation of species,
in particular threatened species, to significantly
reduce extinction risk”
• The indicator can be disaggregated into
different species groups (taxonomic,
thematic), threats, & habitats
• Also links to Species Threat Abatement &
Restoration (STAR) metric
A.3 Red List Index
13.
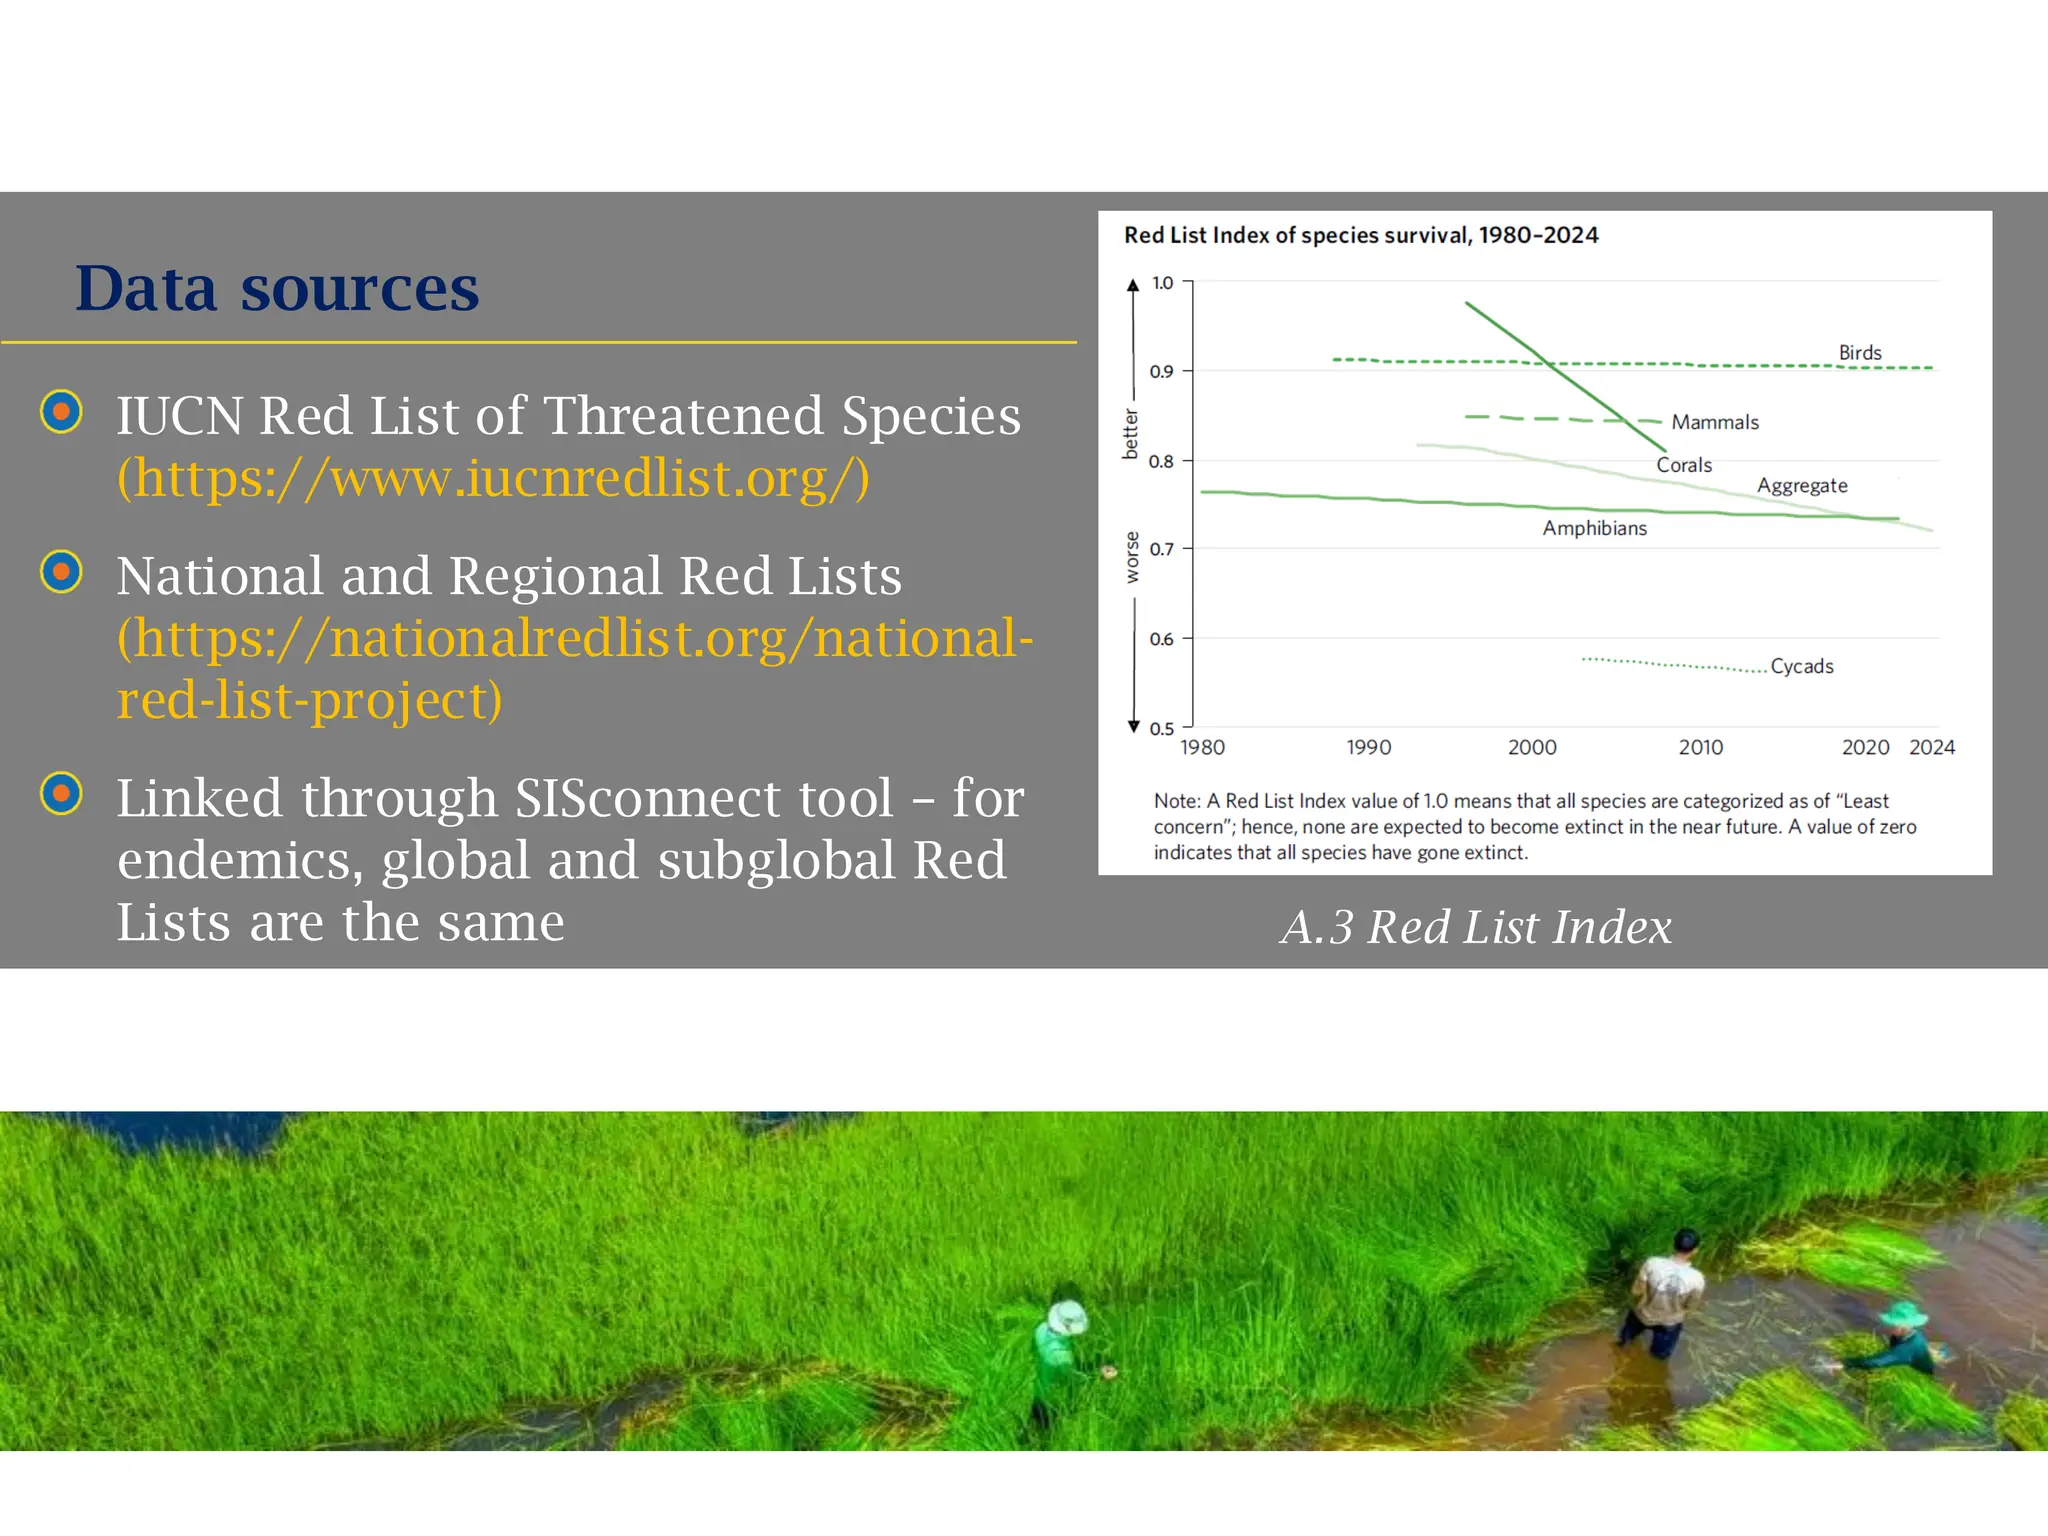
IUCN Red Listof Threatened Species
(https://www.iucnredlist.org/)
National and Regional Red Lists
(https://nationalredlist.org/national-
red-list-project)
Linked through SISconnect tool – for
endemics, global and subglobal Red
Lists are the same
Data sources
Text
Text
Text
A.3 Red List Index
14.
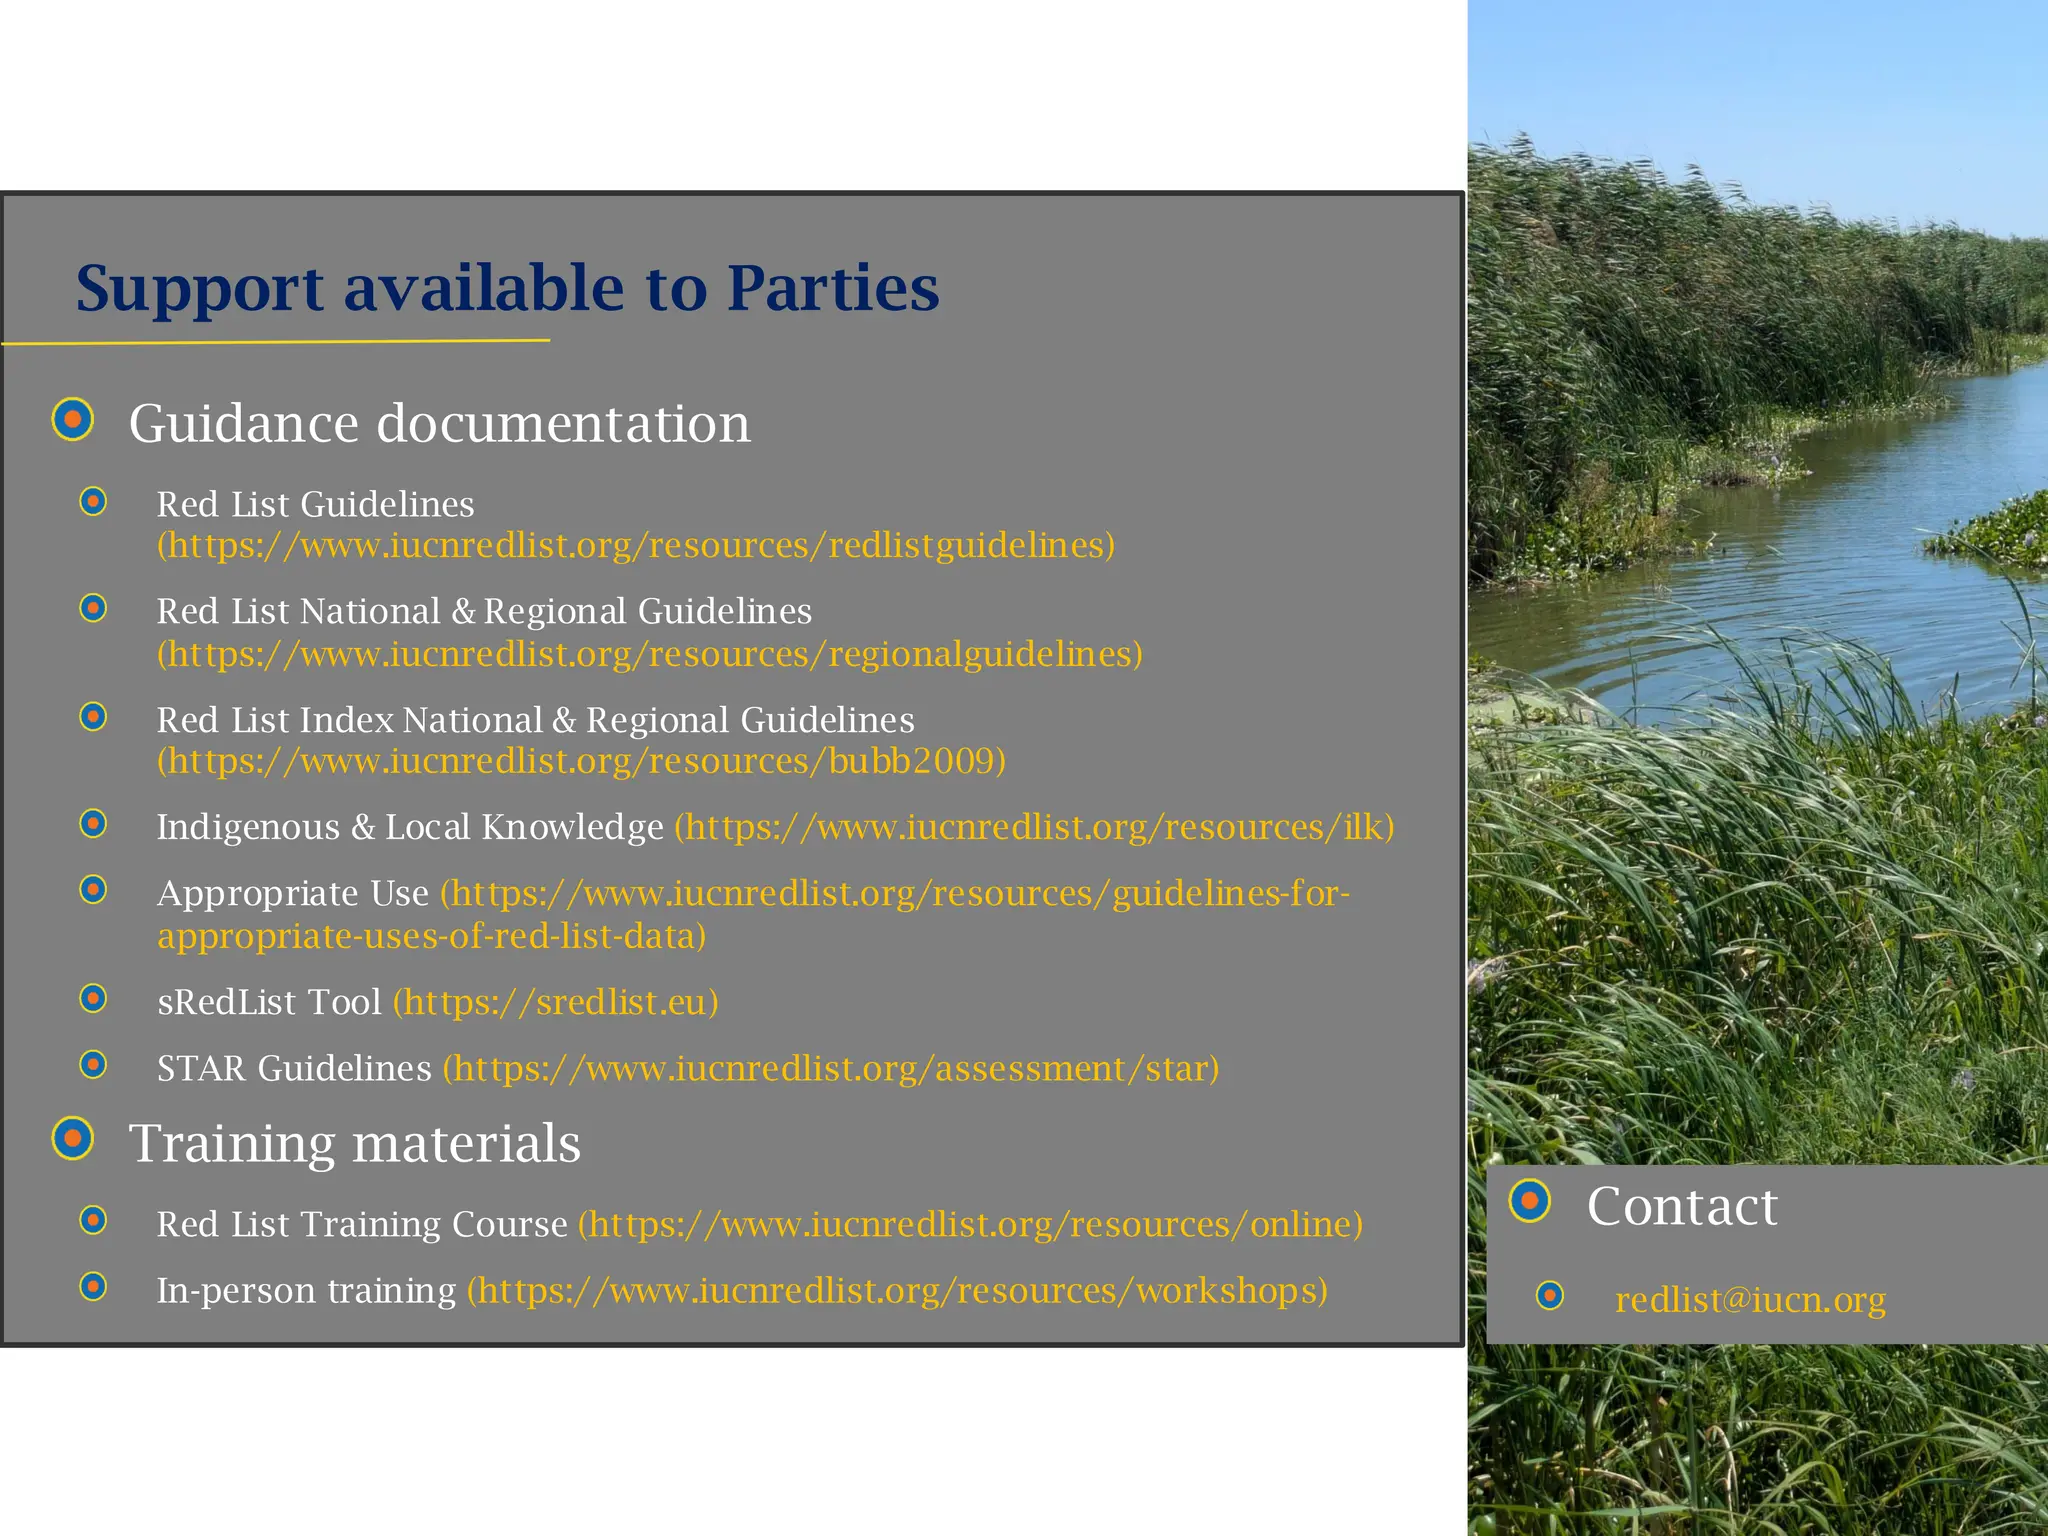
Support available toParties
Contact
redlist@iucn.org
Guidance documentation
Red List Guidelines
(https://www.iucnredlist.org/resources/redlistguidelines)
Red List National & Regional Guidelines
(https://www.iucnredlist.org/resources/regionalguidelines)
Red List Index National & Regional Guidelines
(https://www.iucnredlist.org/resources/bubb2009)
Indigenous & Local Knowledge (https://www.iucnredlist.org/resources/ilk)
Appropriate Use (https://www.iucnredlist.org/resources/guidelines-for-
appropriate-uses-of-red-list-data)
sRedList Tool (https://sredlist.eu)
STAR Guidelines (https://www.iucnredlist.org/assessment/star)
Training materials
Red List Training Course (https://www.iucnredlist.org/resources/online)
In-person training (https://www.iucnredlist.org/resources/workshops)
15.
15
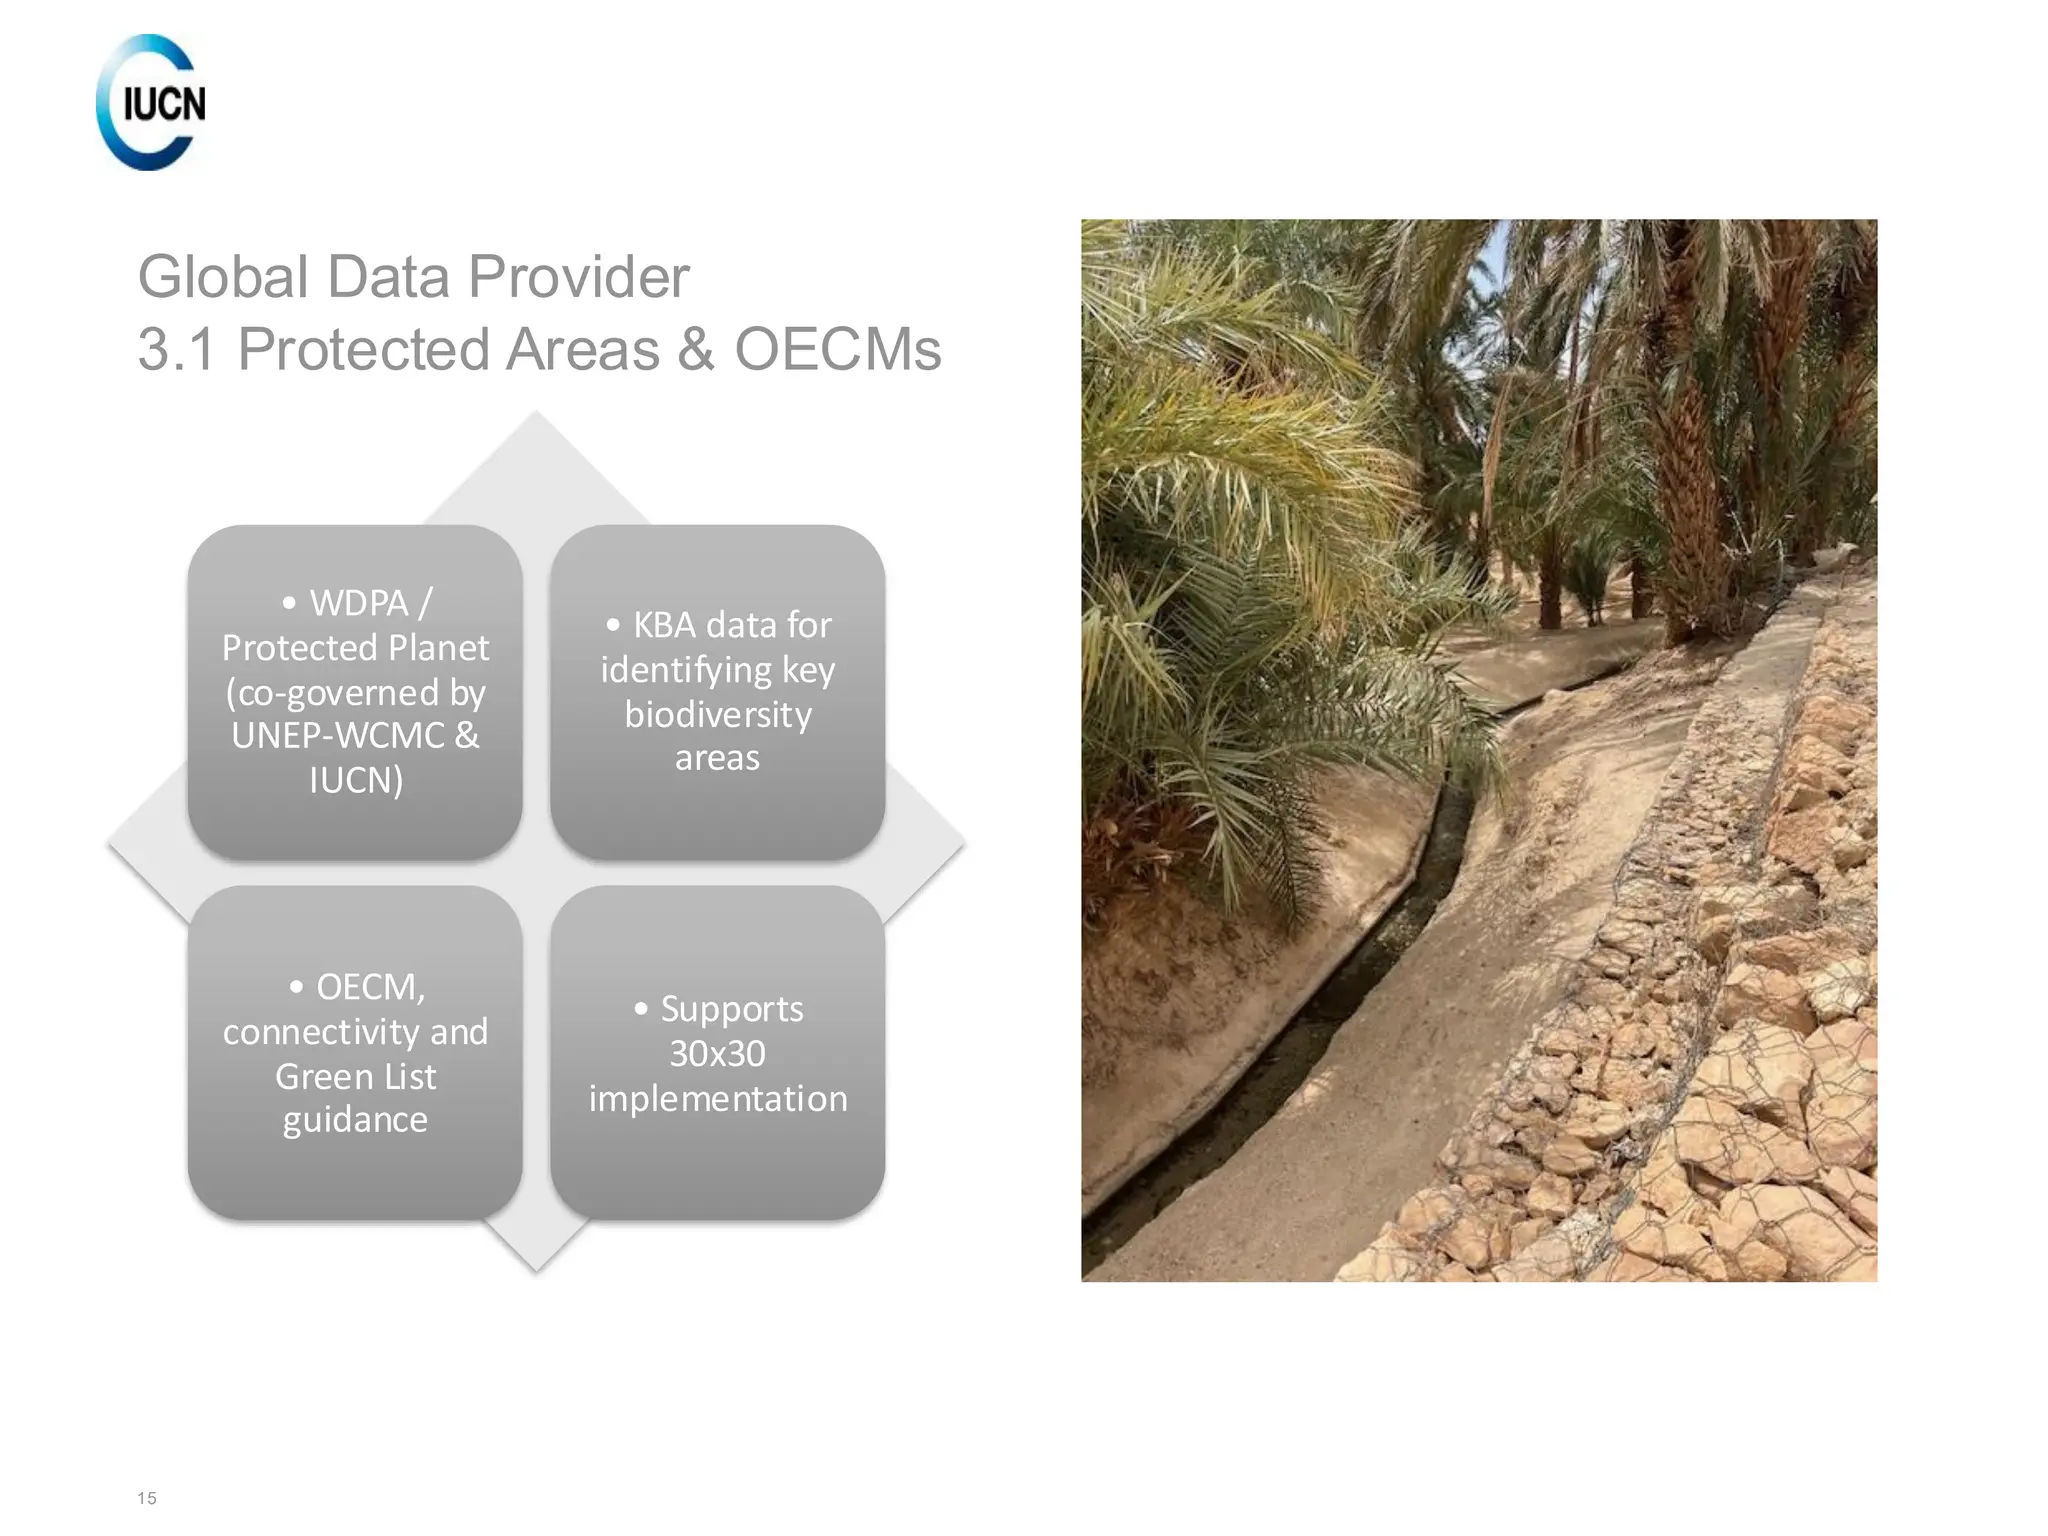
Global Data Provider
3.1Protected Areas & OECMs
• WDPA /
Protected Planet
(co-governed by
UNEP-WCMC &
IUCN)
• KBA data for
identifying key
biodiversity
areas
• OECM,
connectivity and
Green List
guidance
• Supports
30x30
implementation
16.
16
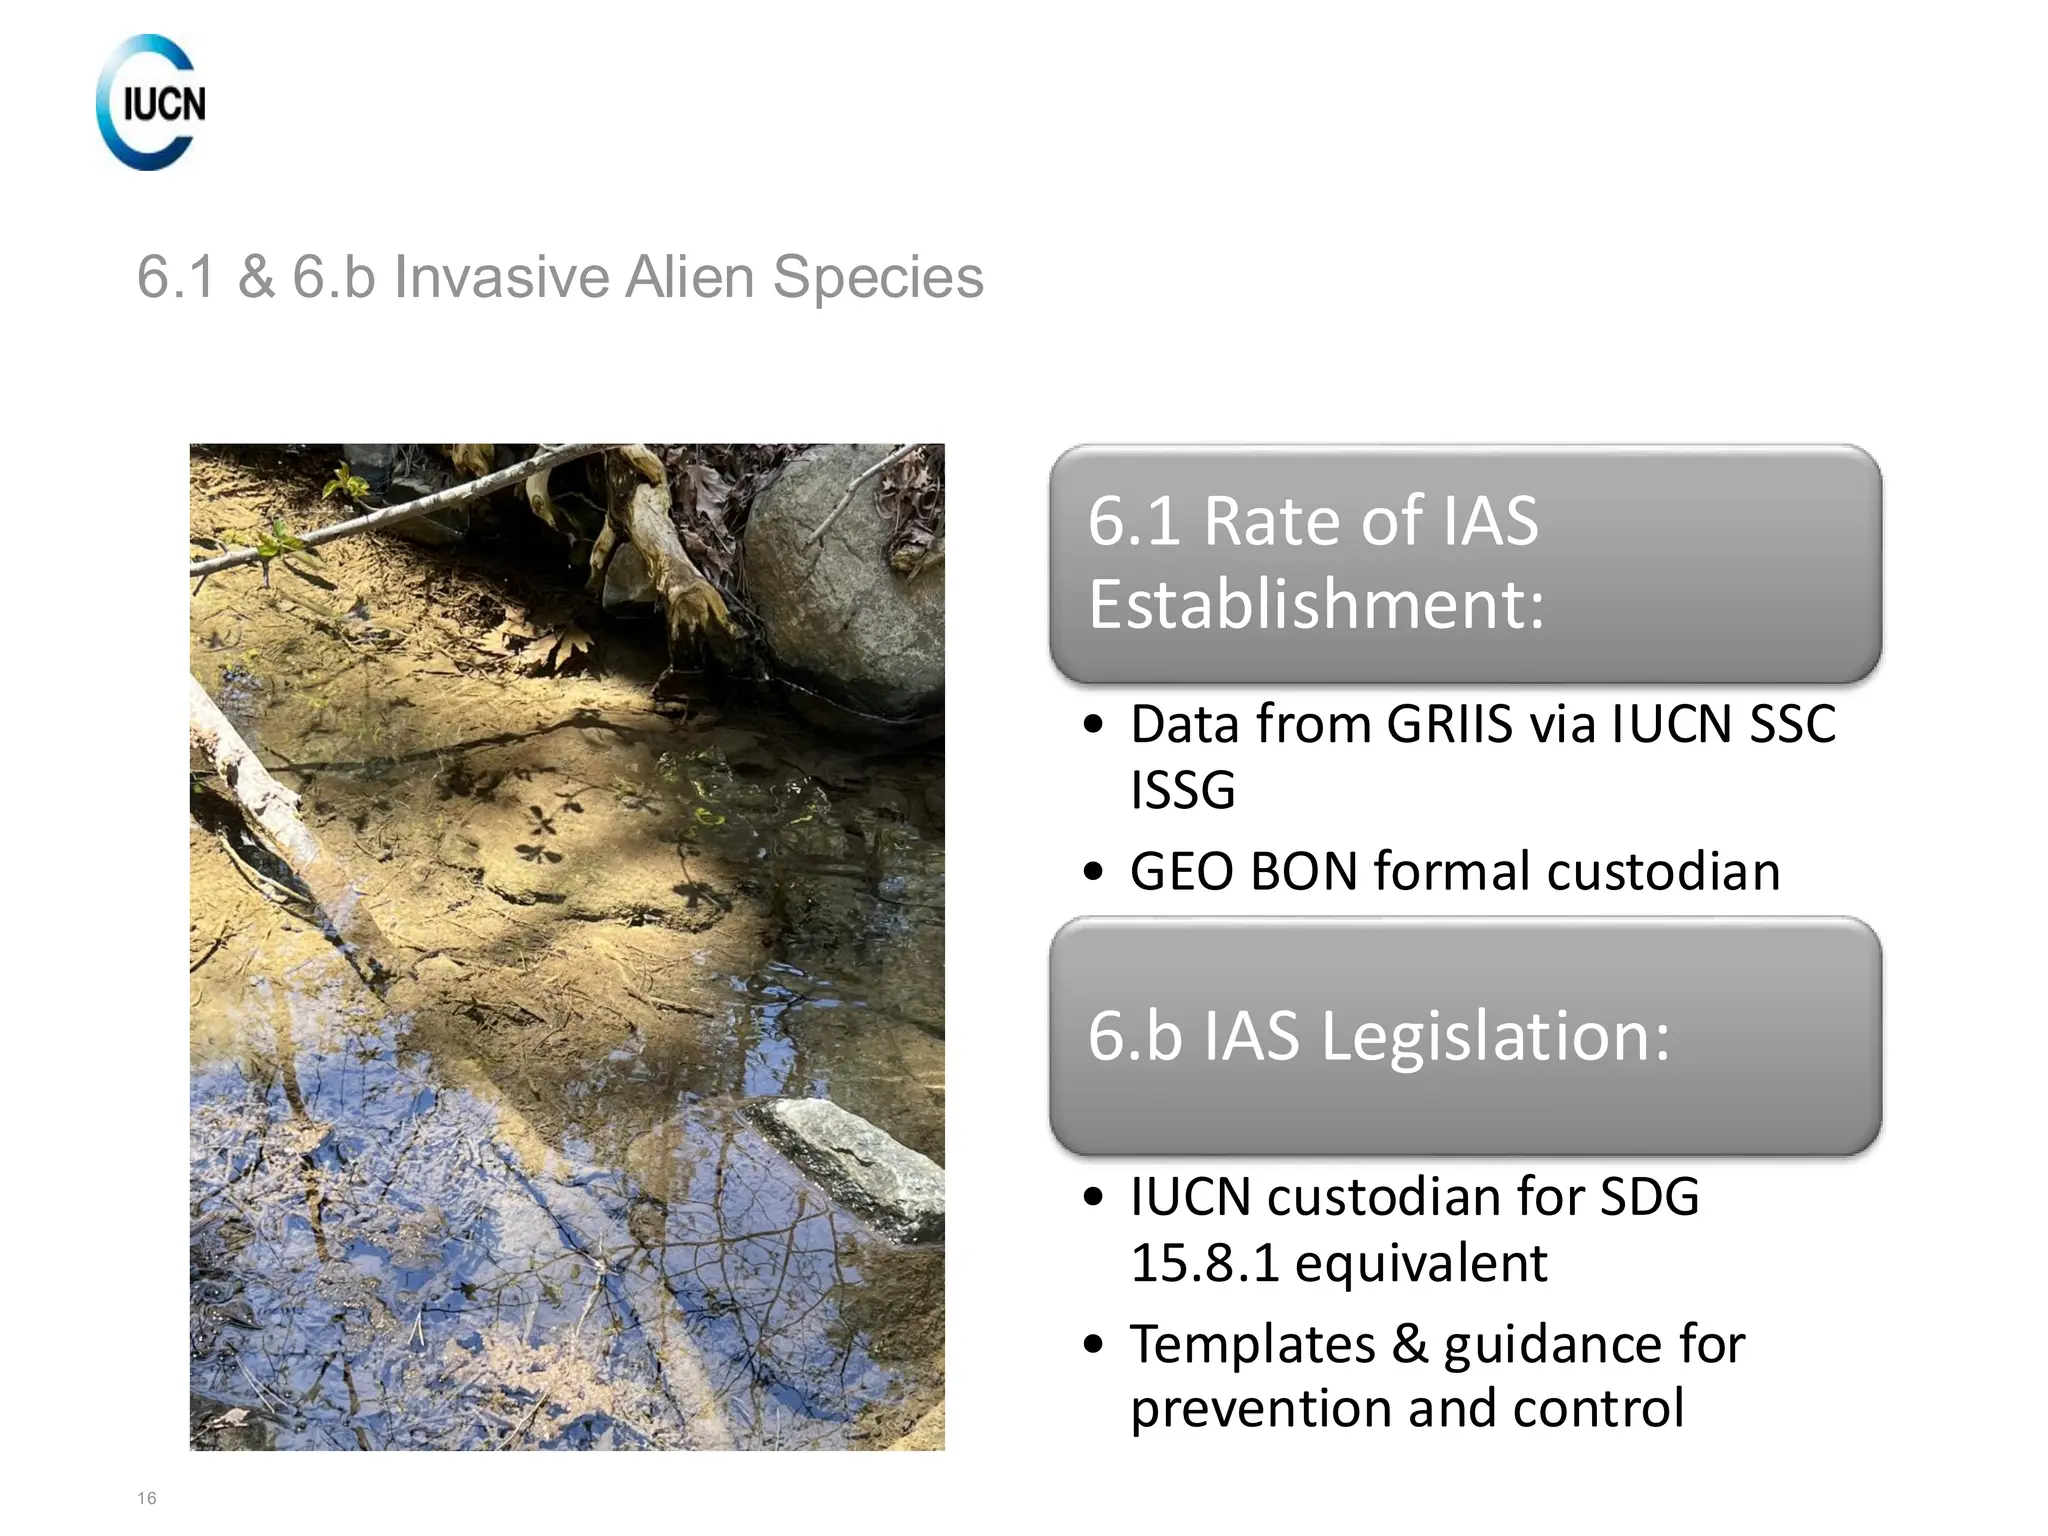
6.1 & 6.bInvasive Alien Species
6.1 Rate of IAS
Establishment:
• Data from GRIIS via IUCN SSC
ISSG
• GEO BON formal custodian
6.b IAS Legislation:
• IUCN custodian for SDG
15.8.1 equivalent
• Templates & guidance for
prevention and control
17.
17
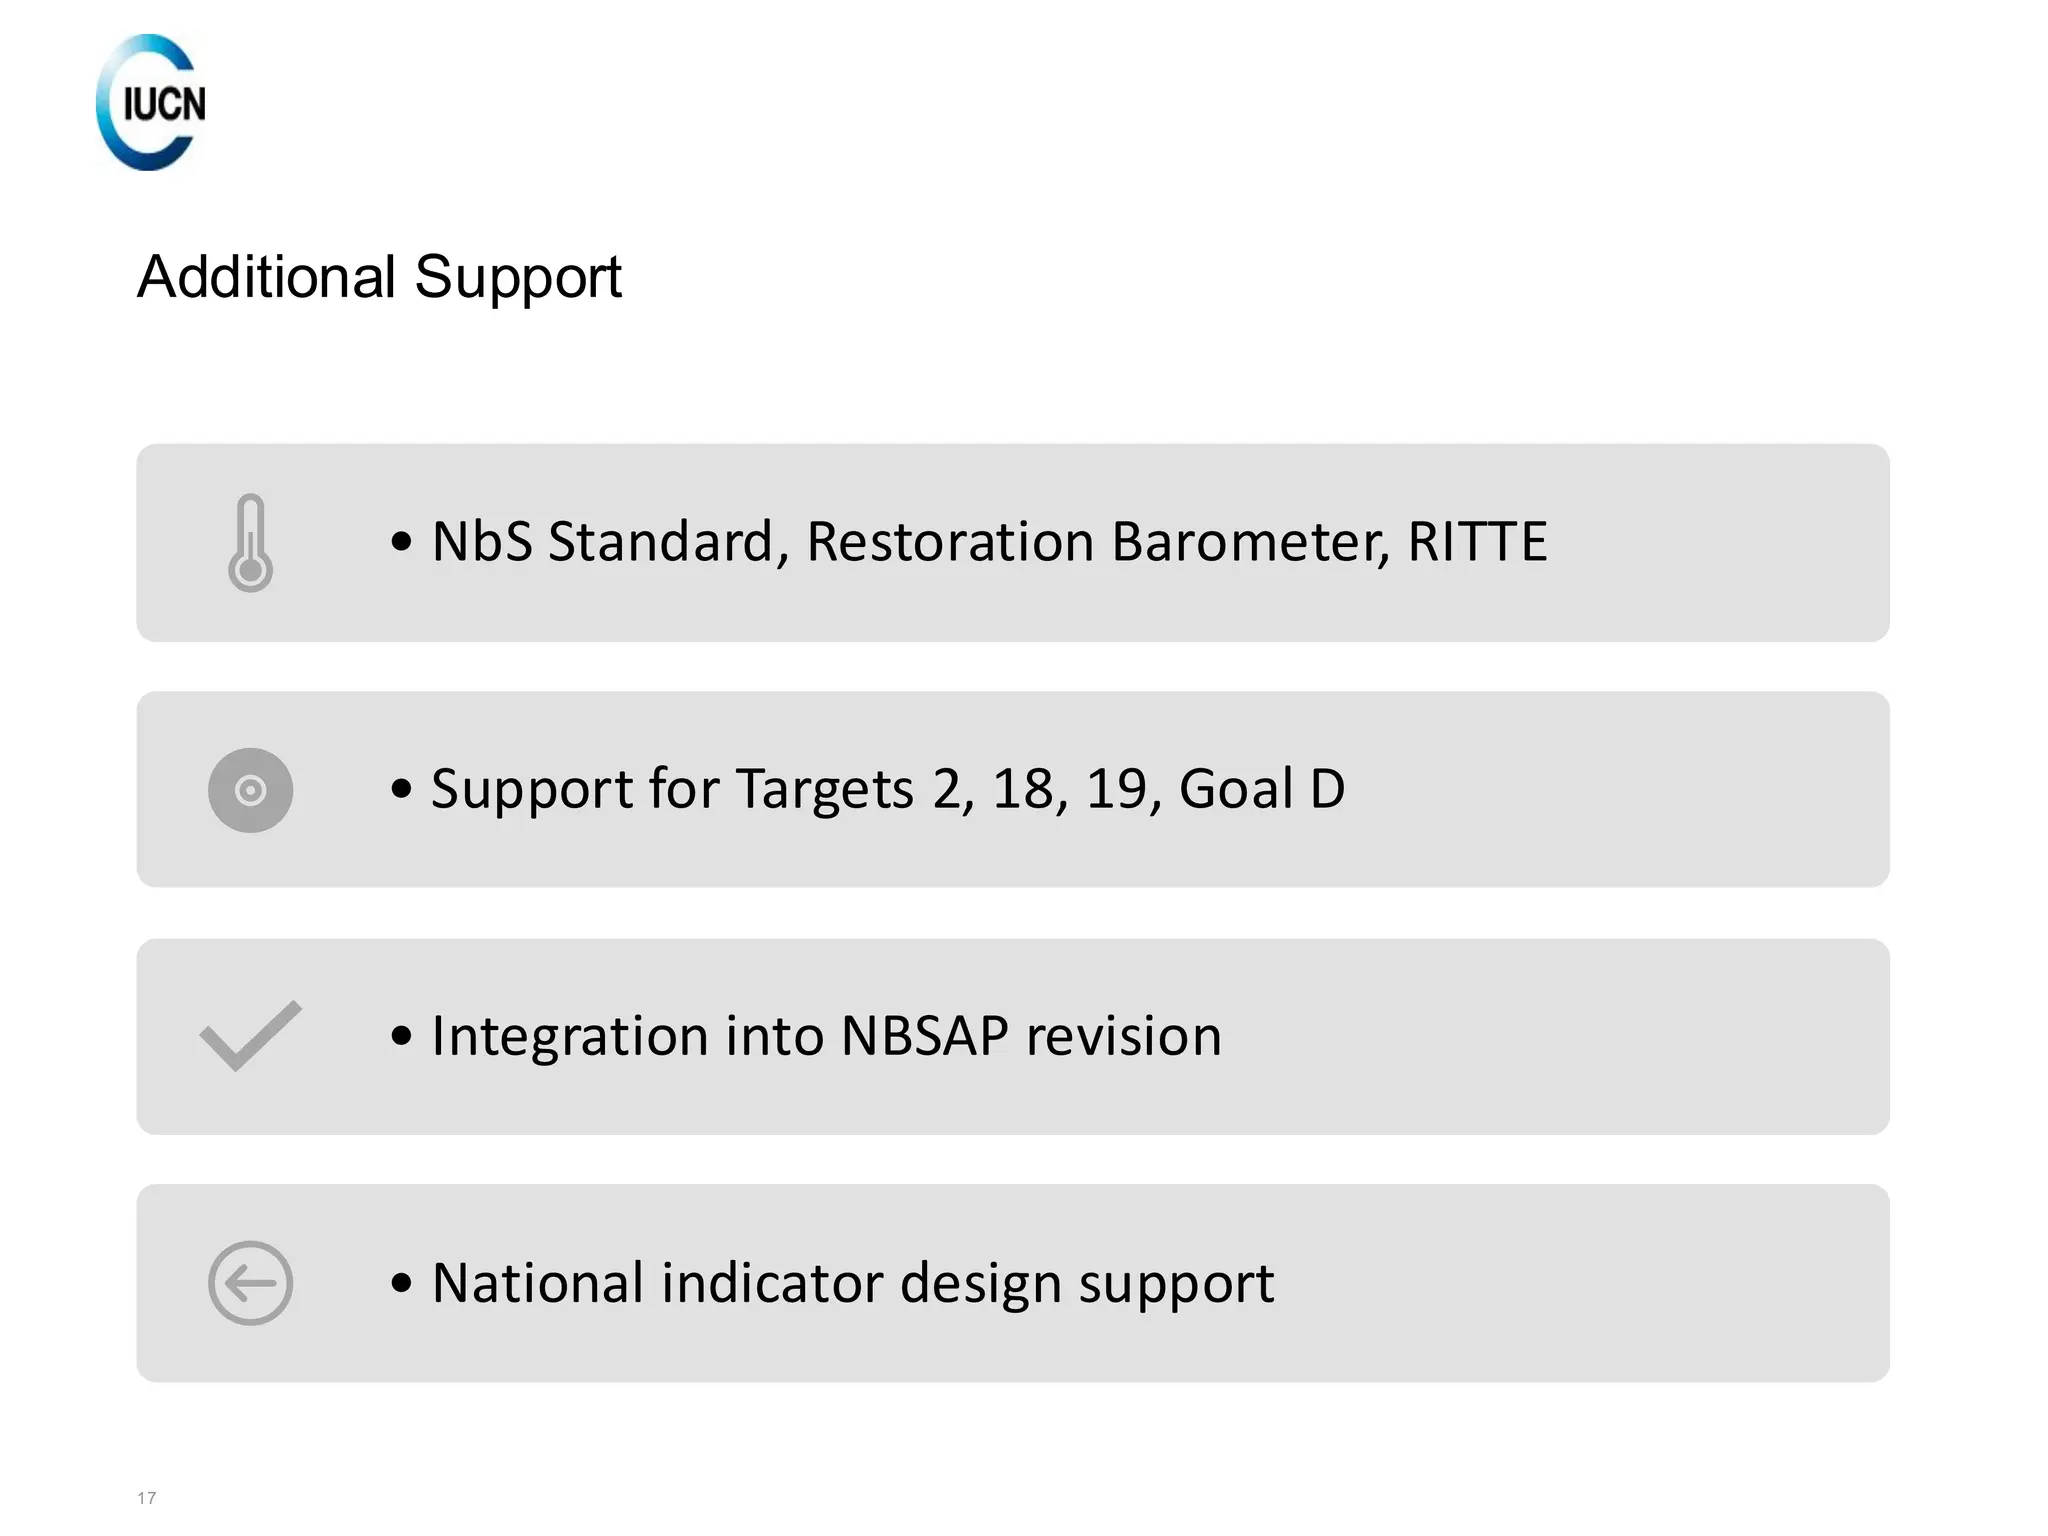
Additional Support
• NbSStandard, Restoration Barometer, RITTE
• Support for Targets 2, 18, 19, Goal D
• Integration into NBSAP revision
• National indicator design support
18.
• Collaboration underthe CBD–IUCN
MOU to connect PANORAMA – a global
platform of verified, replicable
conservation and sustainability
solutions – with CBD digital platforms
(website, CHM, national CHMs).
• PANORAMA widget already live on all
Bioland national CHMs.
• Joint effort to apply GBF Target tagging
to all PANORAMA solutions.
• Priority: data-level interoperability so
solutions appear in CHM search and
GBF target pages.
• Exploring AI-supported tagging and
CBD’s emerging GBF taxonomy.
CBD–PANORAMA Interoperability
(non-indicator work)
19.
Parties can expect:
•Science-based global
standards
• Open data tools and
technical guidance
• Support for national
monitoring
• Collaboration via IUCN
Commissions
IUCN support