1
PAPG – SPEATC 2014
Un-Proven Plays in Middle Indus Basin
Kamran Aziz (Kamran.Aziz@omv.com), Aamir Rasheed (Aamir.Rasheed@omv.com), Adnan Zaidi
(Syed_Adnan.Zaidi@omv.com) & Adil Azeem (Adil.Azeem@omv.com)
OMV (Pakistan) Exploration GmbH OMV (Pakistan) Exploration GmbH
Abstract
The recent integrated regional sequence
stratigraphic study confirmed the long-known
interpretation of the early to mid-Cretaceous
successions as representing a transition from
shallow to deep marine rocks during the
progradation of sedimentary wedges. During
deposition, the effects of the Kandra palaeo-
high were significant with deposits effectively
ponding against it as progradation continued to
infill accommodation. The main gas fields in
this succession are developed in the shallow-
marine sands at the top of this wedge. The
basinal turbidite sandstones and/or lowstand
delta sands have the potential to provide
underexplored or new exploration
opportunities. Deposition under different 3rd
order cycles of sea-level change had a profound
influence on the regional development of
reservoirs with the main fields occurring in
transgressive/regressive sandstones sealed by
the overlying shales.
This study revealed that sub-regional variations
in subsidence occurred across the Middle Indus
Basin and had significant influences on
sedimentation. This is represented by the
creation of smaller depo-centres that either (i)
created anomalous thicknesses of shallow-
marine rocks or (ii) created deeper basins
containing locally preserved turbidites. It is
highly likely that the majority of these fairways
are fully exploited with the potential for
significant petroleum accumulations (to the west
of the current fields) being extremely limited.
Therefore, it is anticipated that any new
reserves in the Middle Indus Basin will be
represented in unproven plays.
These unproven plays include turbidites &
Lowstand deposits. The turbidites occur within
or near to the base of the Sembar Formation
and as a consequence, reservoir effectiveness
represents an intermediate risk due to depth of
burial. In addition to this, due to the limited
number of well-penetrations, the regional
development of these sandstones is yet to be
demonstrated.
Based on the evaluation of Cretaceous gas plays
in the Middle Indus Basin, it is recommended
that less time is devoted to exploring the
established play as these less likely to have a
significant lateral extent to the west. In
contrast, some of the deeper plays may have
untapped potential e.g. turbidites and low sand
deposits. These require more work to reduce
the risk associated with them.
1. Introduction:
Objective of this article is to highlight the
importance of the unproven plays in the future
exploration strategy of the Middle Indus Basin.
The Middle Indus Basin lies in the Southern
Pakistan on the northern side of Lower Indus
Basin from the flanks of Jaccobabad –
Khairpur high to the Flanks of Mari –
Kandhkot high. In general, the study area
comprises a relatively steeper south easterly
dipping monocline on the eastern flank of
Jaccobabad – Khairpur high (Figure-1)
intersected by intra-basinal highs and lows [16].
As previously cited by [2], Early to Mid-
Cretaceous sandstone bodies are interpreted to
be deposited in a depositional environment
representing a transition from deep to shallow
marine rocks (Figure-2). The main gas fields in
this succession are developed in the shallow-
marine sandstone. The basinal turbidite
sandstones and/or lowstand delta sands have the
potential to provide underexplored or new
exploration opportunities. By examination of
the creaming curve of Middle Indus Basin
(Figure-3) it is observed that Lower Goru play
has some terraces and steep legs [5]. Two
conclusions can be made by comparison of this
creaming curve with the world’s mature basins,
keeping in view the sequence stratigraphic
framework;
1) Initial exploration has focused on TST and
HST (with exception of Sawan field, which
is a lowstand shelf-edge delta system) [1].
2.
2
2) Existing playshave limited or very limited
reserves and next steep leg would come
from a new play. This analysis has some
similarities with the concept that,
discoveries in Lowstand system tract usually
sit on the last steep leg of the creaming
curve [21].
2. Petroleum System:
Sembar is considered to be the primary
petroleum source rock for most of the Lower
and Middle Indus Basins. Early to Peak Gas
maturation of Sembar-Lower Goru Petroleum
System in Middle Indus Basin is from Late
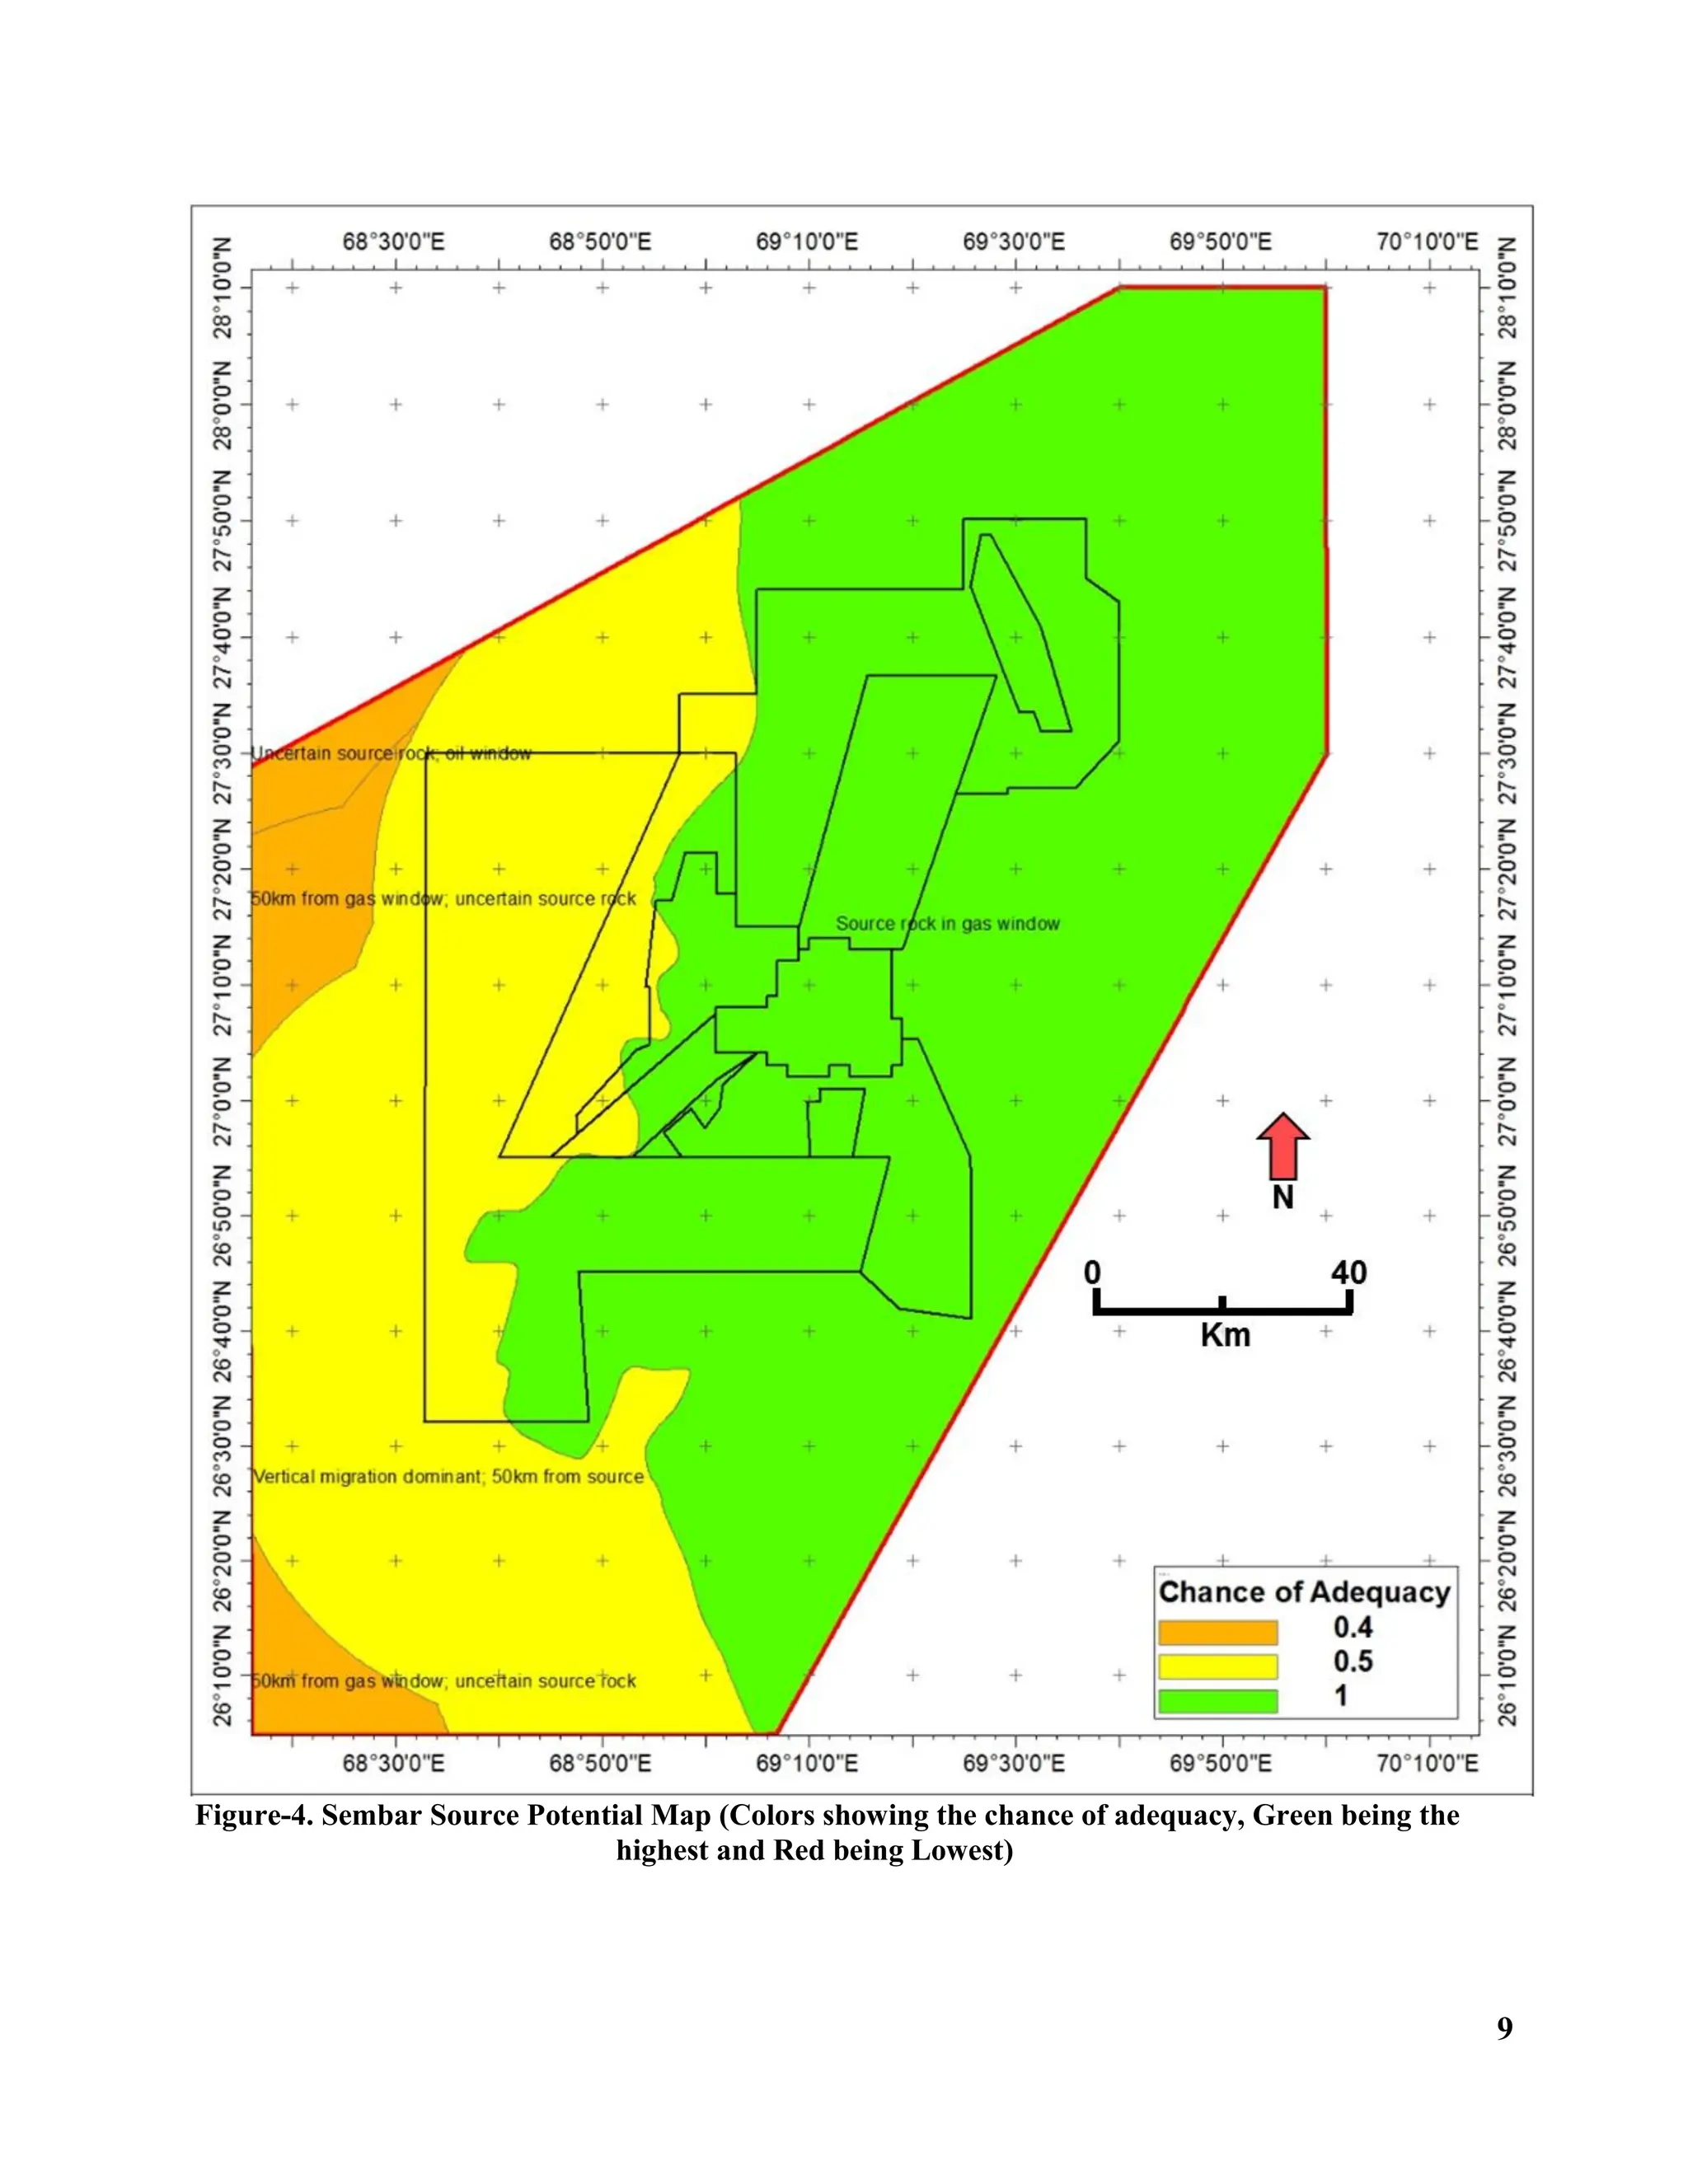
Cretaceous to Paleocene [12]. Hydrocarbon
charge is considered low risk in the area due to
the widespread development of mature source
rock (Sembar Formation). Vertical migration
dominates above the main gas window. To the
West of the Middle Indus Basin, longer distance
migration is required, which increases the
exploration risk (Figure-4).
3. Sequence Stratigraphy:
Sequence Stratigraphic scheme and
nomenclature used in this framework is based
upon the recognition of third order sequences
(1-3 Ma) across Arabian Plate in 2001 and 2004
(Figure-5) [6], [18], [19], [20]. This includes
studies in the clastic succession of the Black Sea,
mixed carbonate clastics of the Eastern
Mediterranean and the carbonates of Abu
Dhabi. This scheme focuses on the recognition
of Maximum Flooding Surfaces (MFS) and
Sequence Boundaries (SB) which are
demonstrated to occur in other parts of the
globe, correlated at biozone level (Resolution ~
500,000 years, although variable). This scheme
is then correlated with the lithostratigraphic
units and their nomenclature, which has been
conventionally used by different operators in
the study area (Figure-6).
OMV conventionally subdivides the Lower
Goru Formation into 4 intervals; from bottom
to top these are the A, B, C, and D Intervals.
These contain the main hydrocarbon producing
sandstone reservoir units from, and explored
for, across the Middle Indus Basin. At the top of
each Interval there is a regionally extensive
flooding surface recognized in well and seismic
data. This attribute allows the easy integration
of this scheme with a sequence stratigraphic
model.
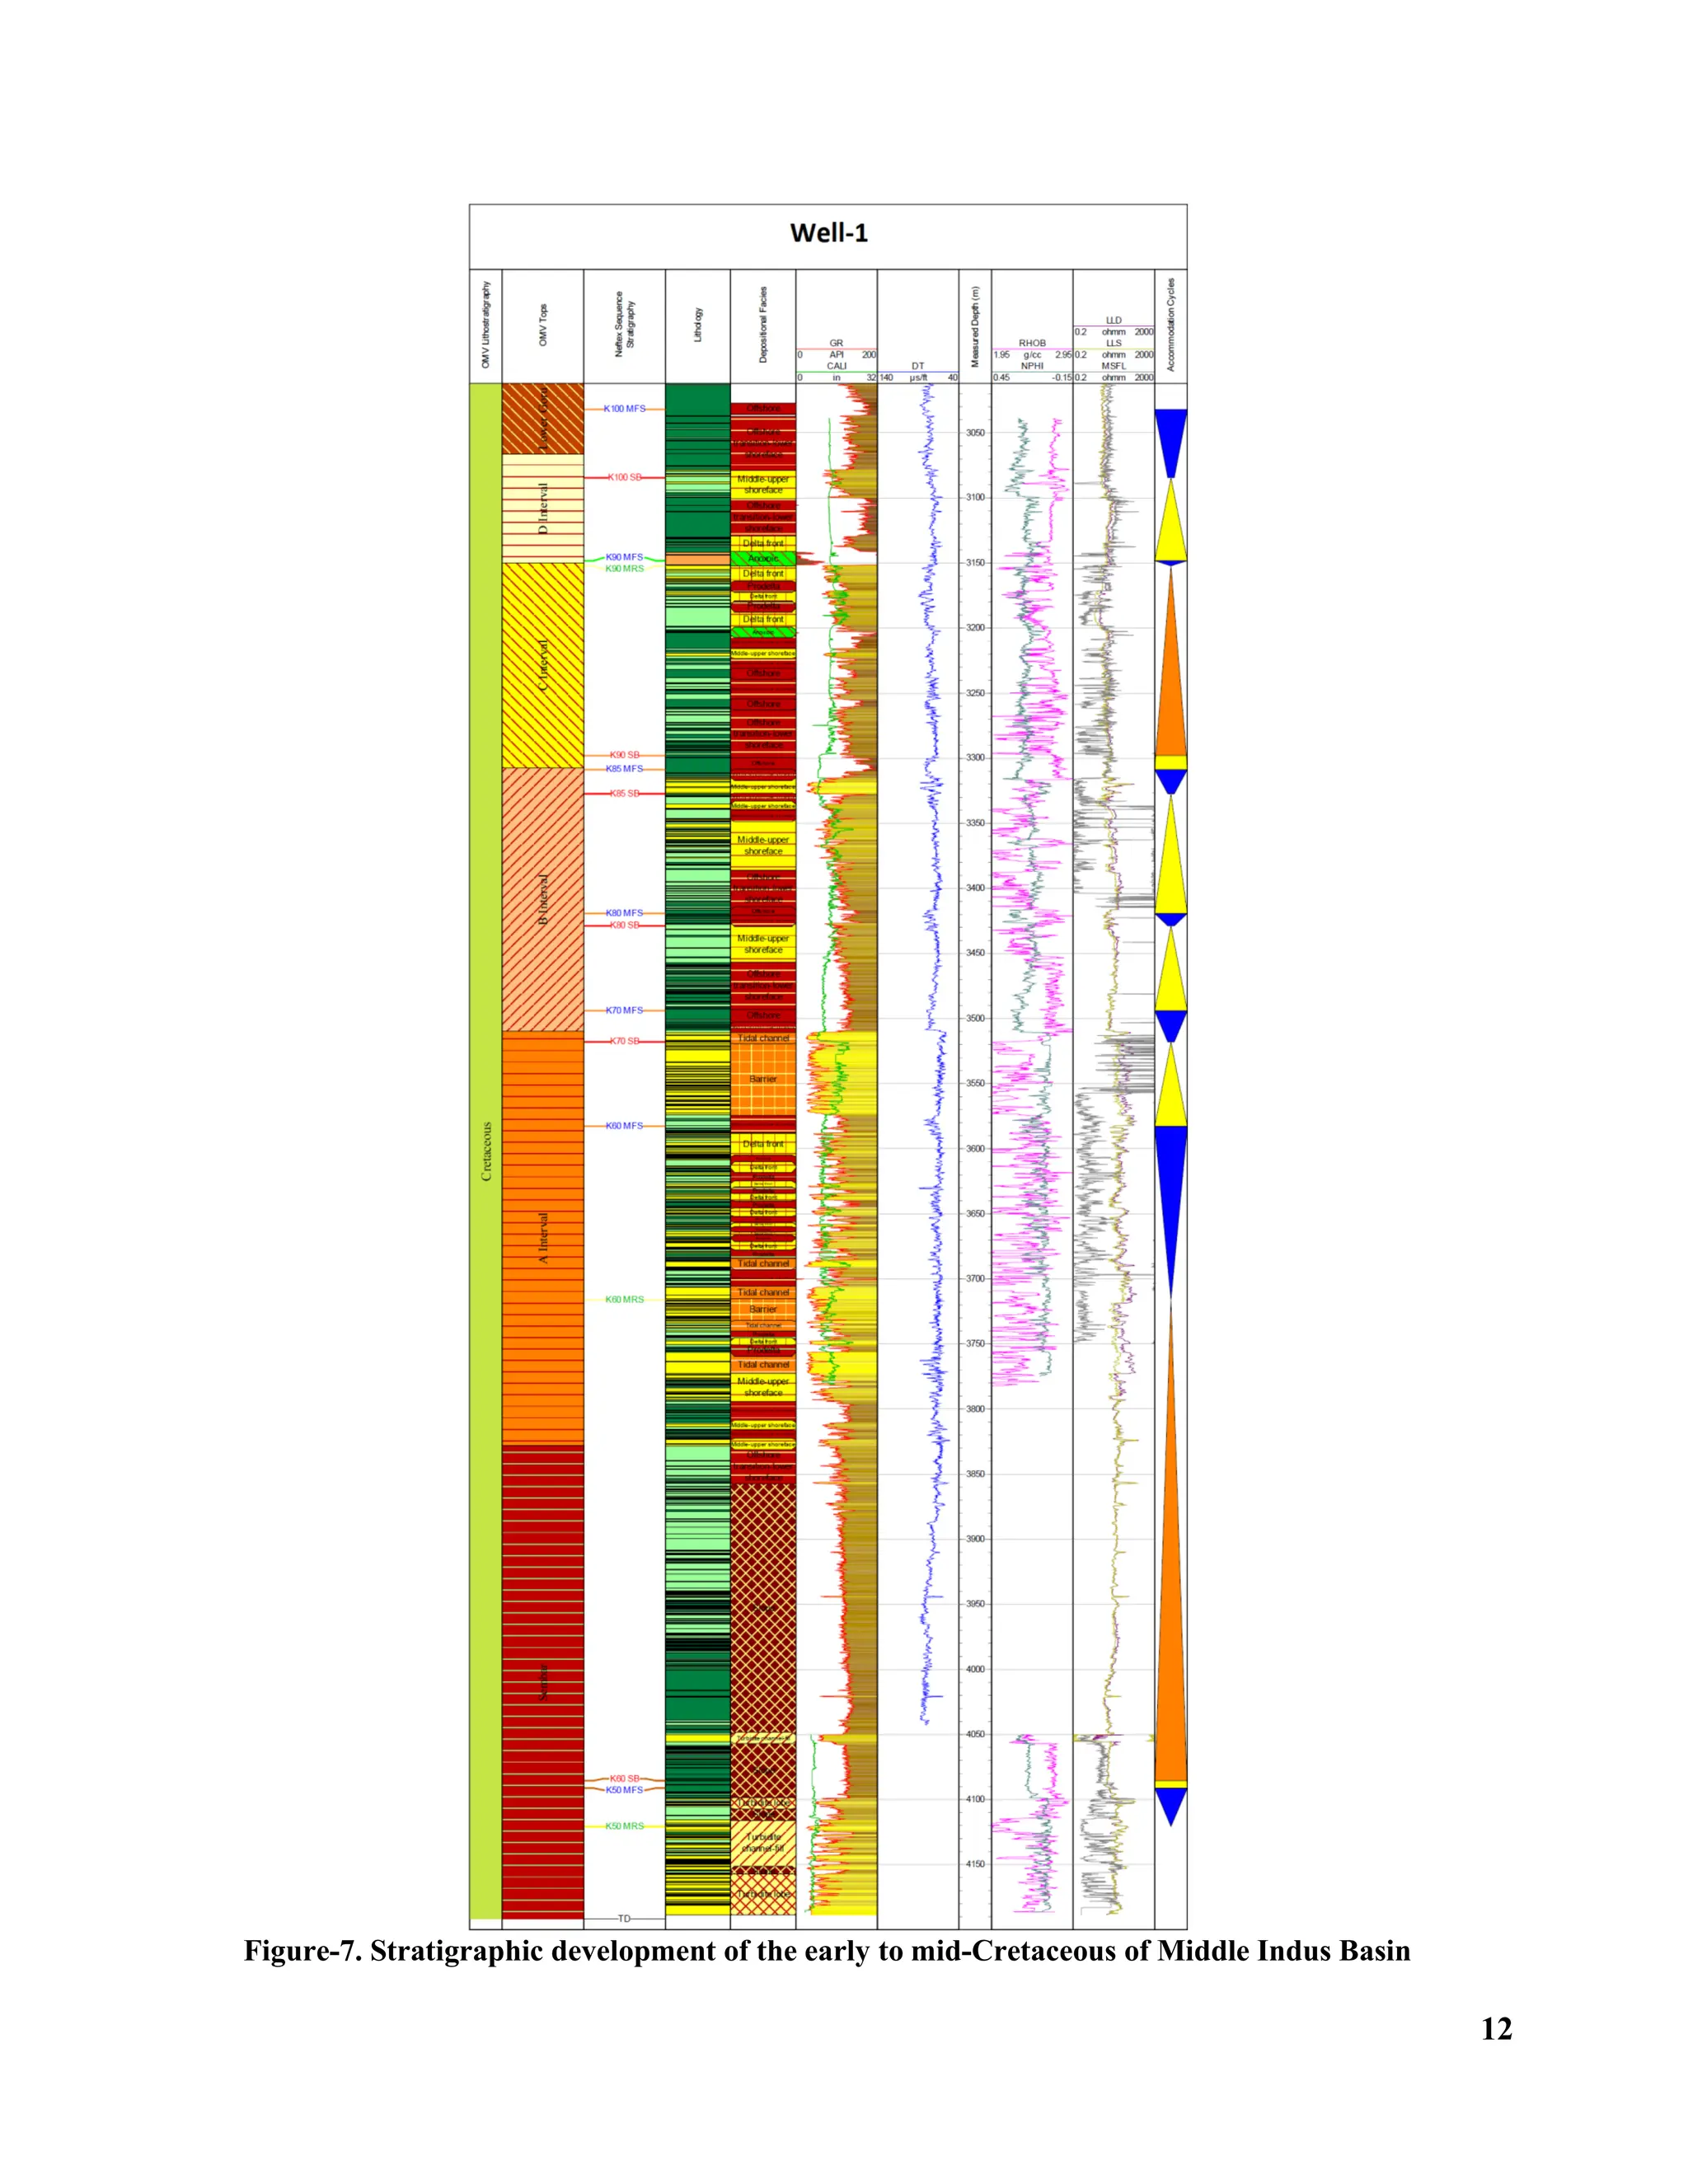
Using the sequence stratigraphic model
described by [18], it was possible to subdivide
the early and middle Cretaceous rocks into
sequences deposited during different cycles of
sea-level change. In this instance, unlike other
studies in the Middle Indus Basin, this study
defines the base of a sequence at a sequence
boundary (Figure-7) rather than a maximum
flooding surface.
Clastic successions of the Sembar and Lower
Goru formations rest unconformably on the
carbonates of the Chiltan Formation. The top
of this limestone forms a prominent seismic
marker in the basin and is considered to
represent a subaerial unconformity [11]. This
Limestone is taken as acoustic marker in order
to better understand the sequence stratigraphic
relationships of the overlying stratigraphic
intervals.
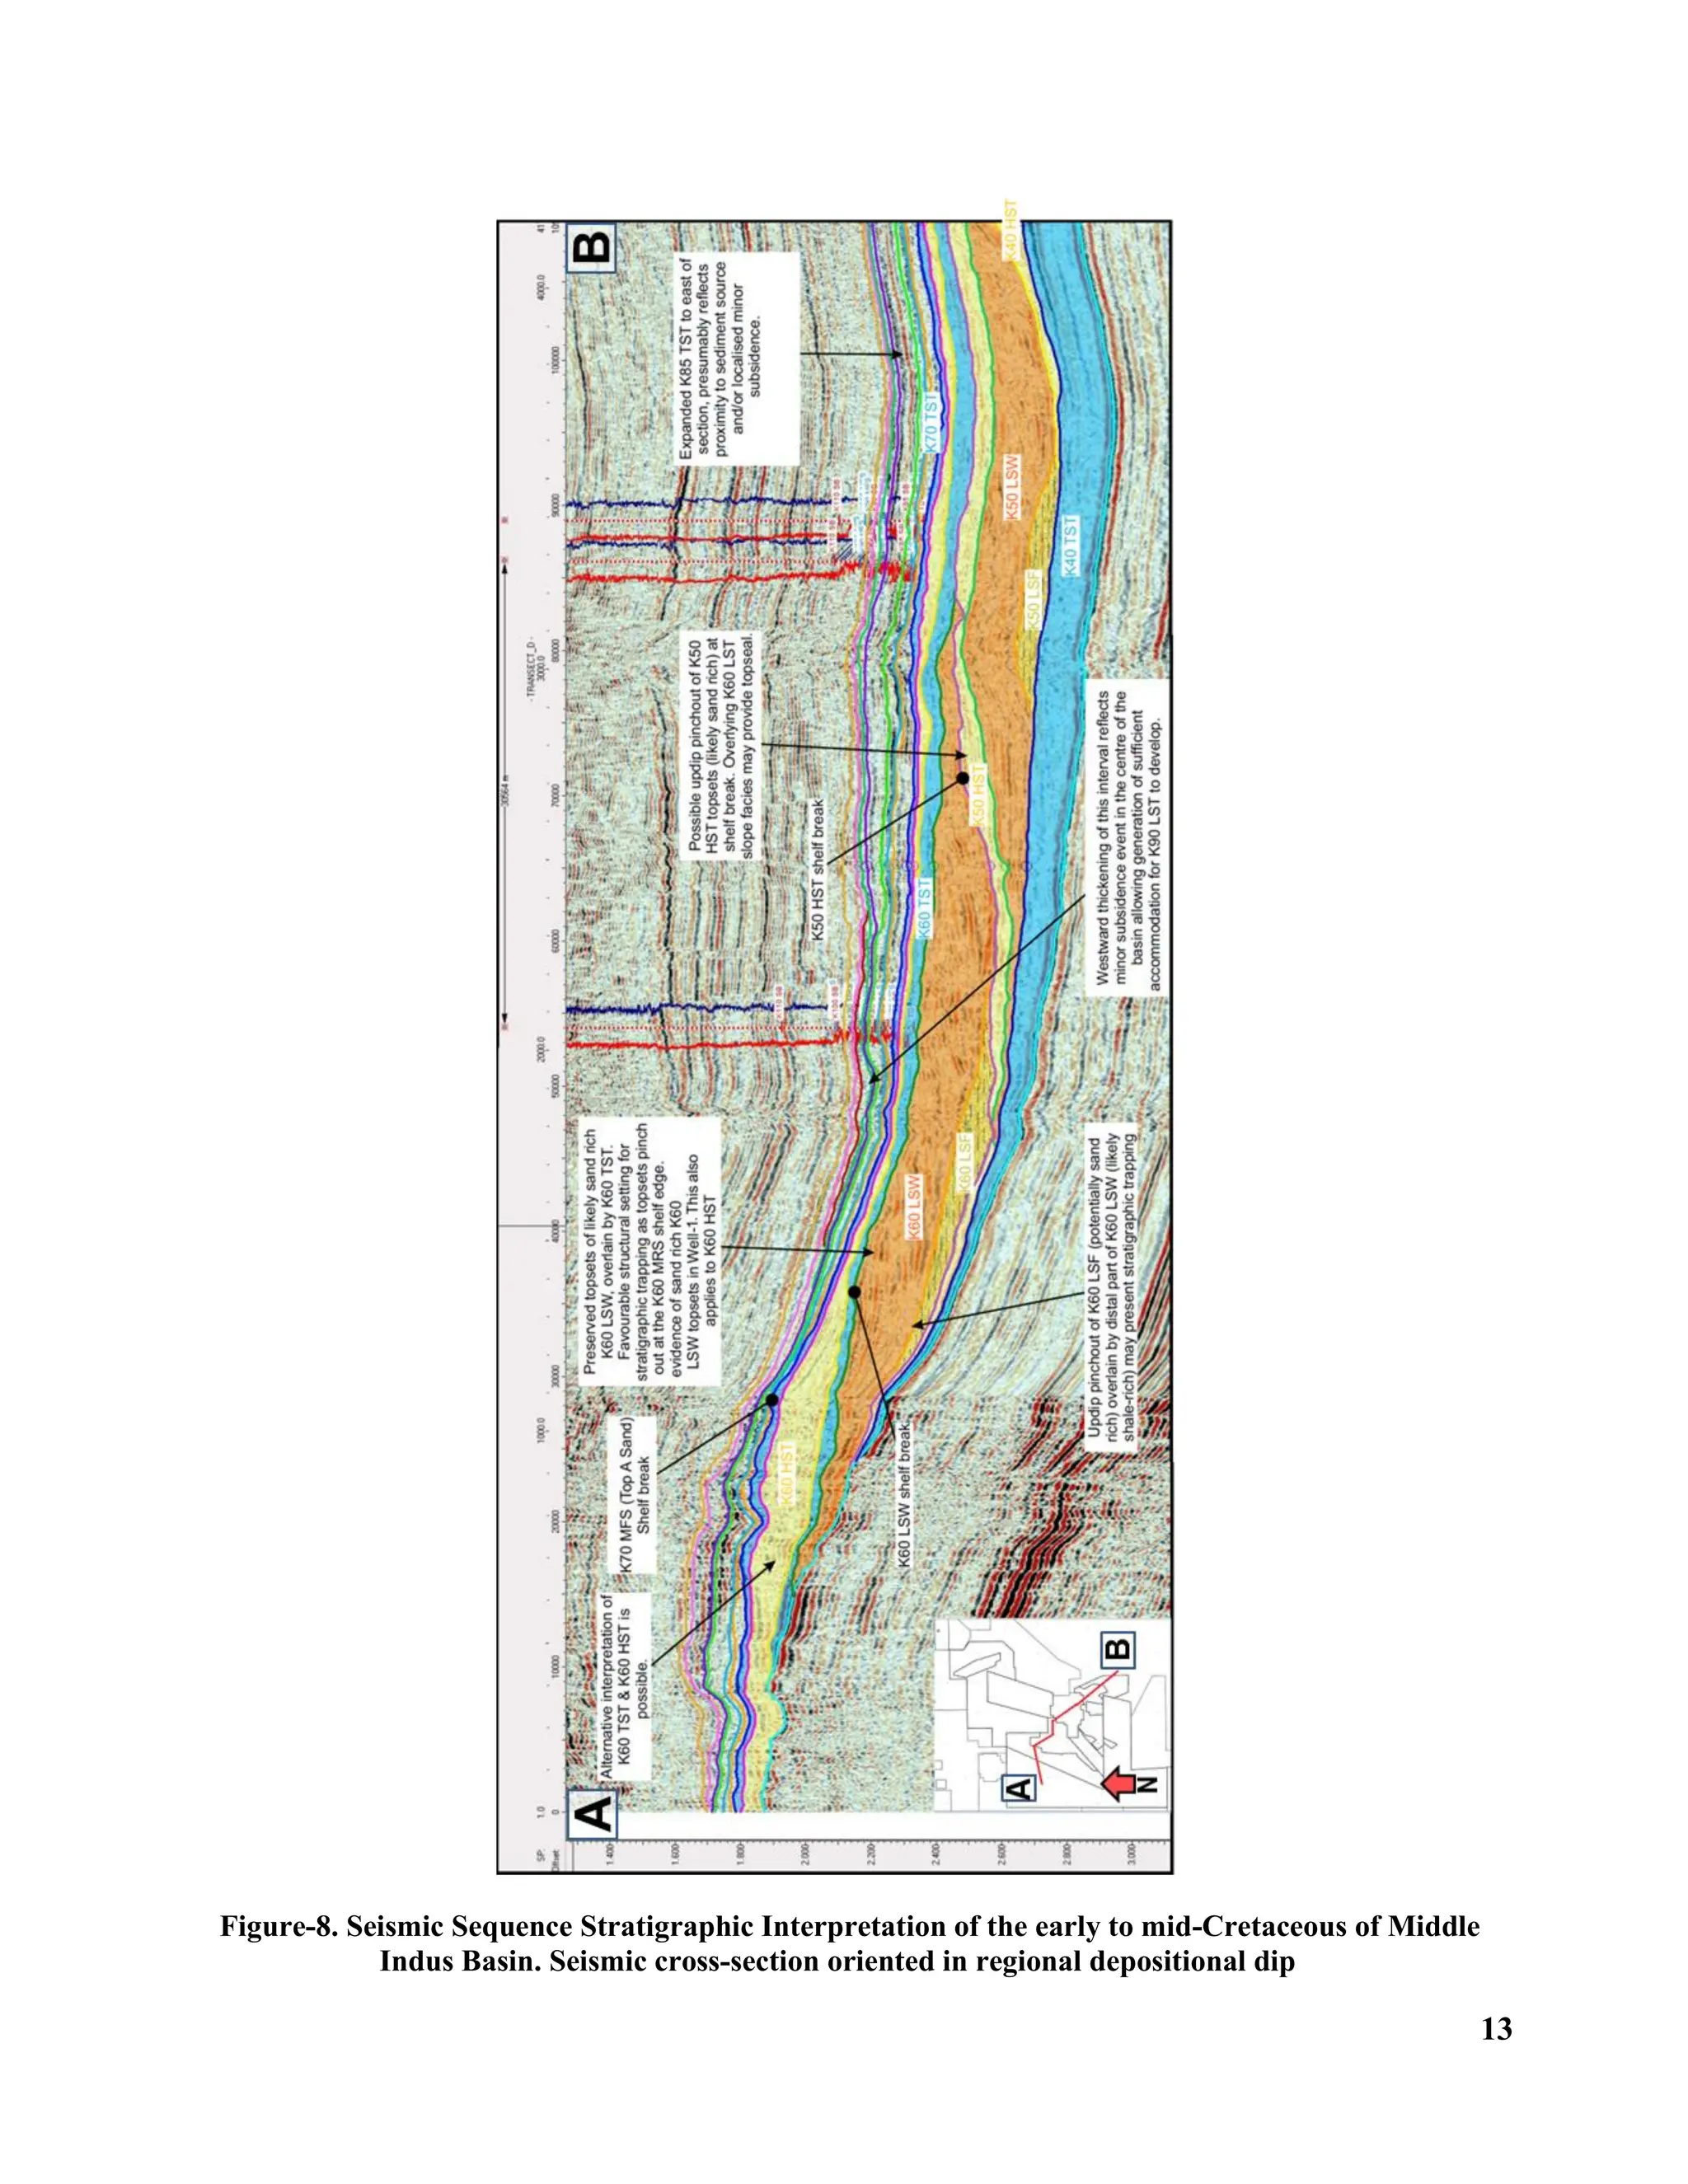
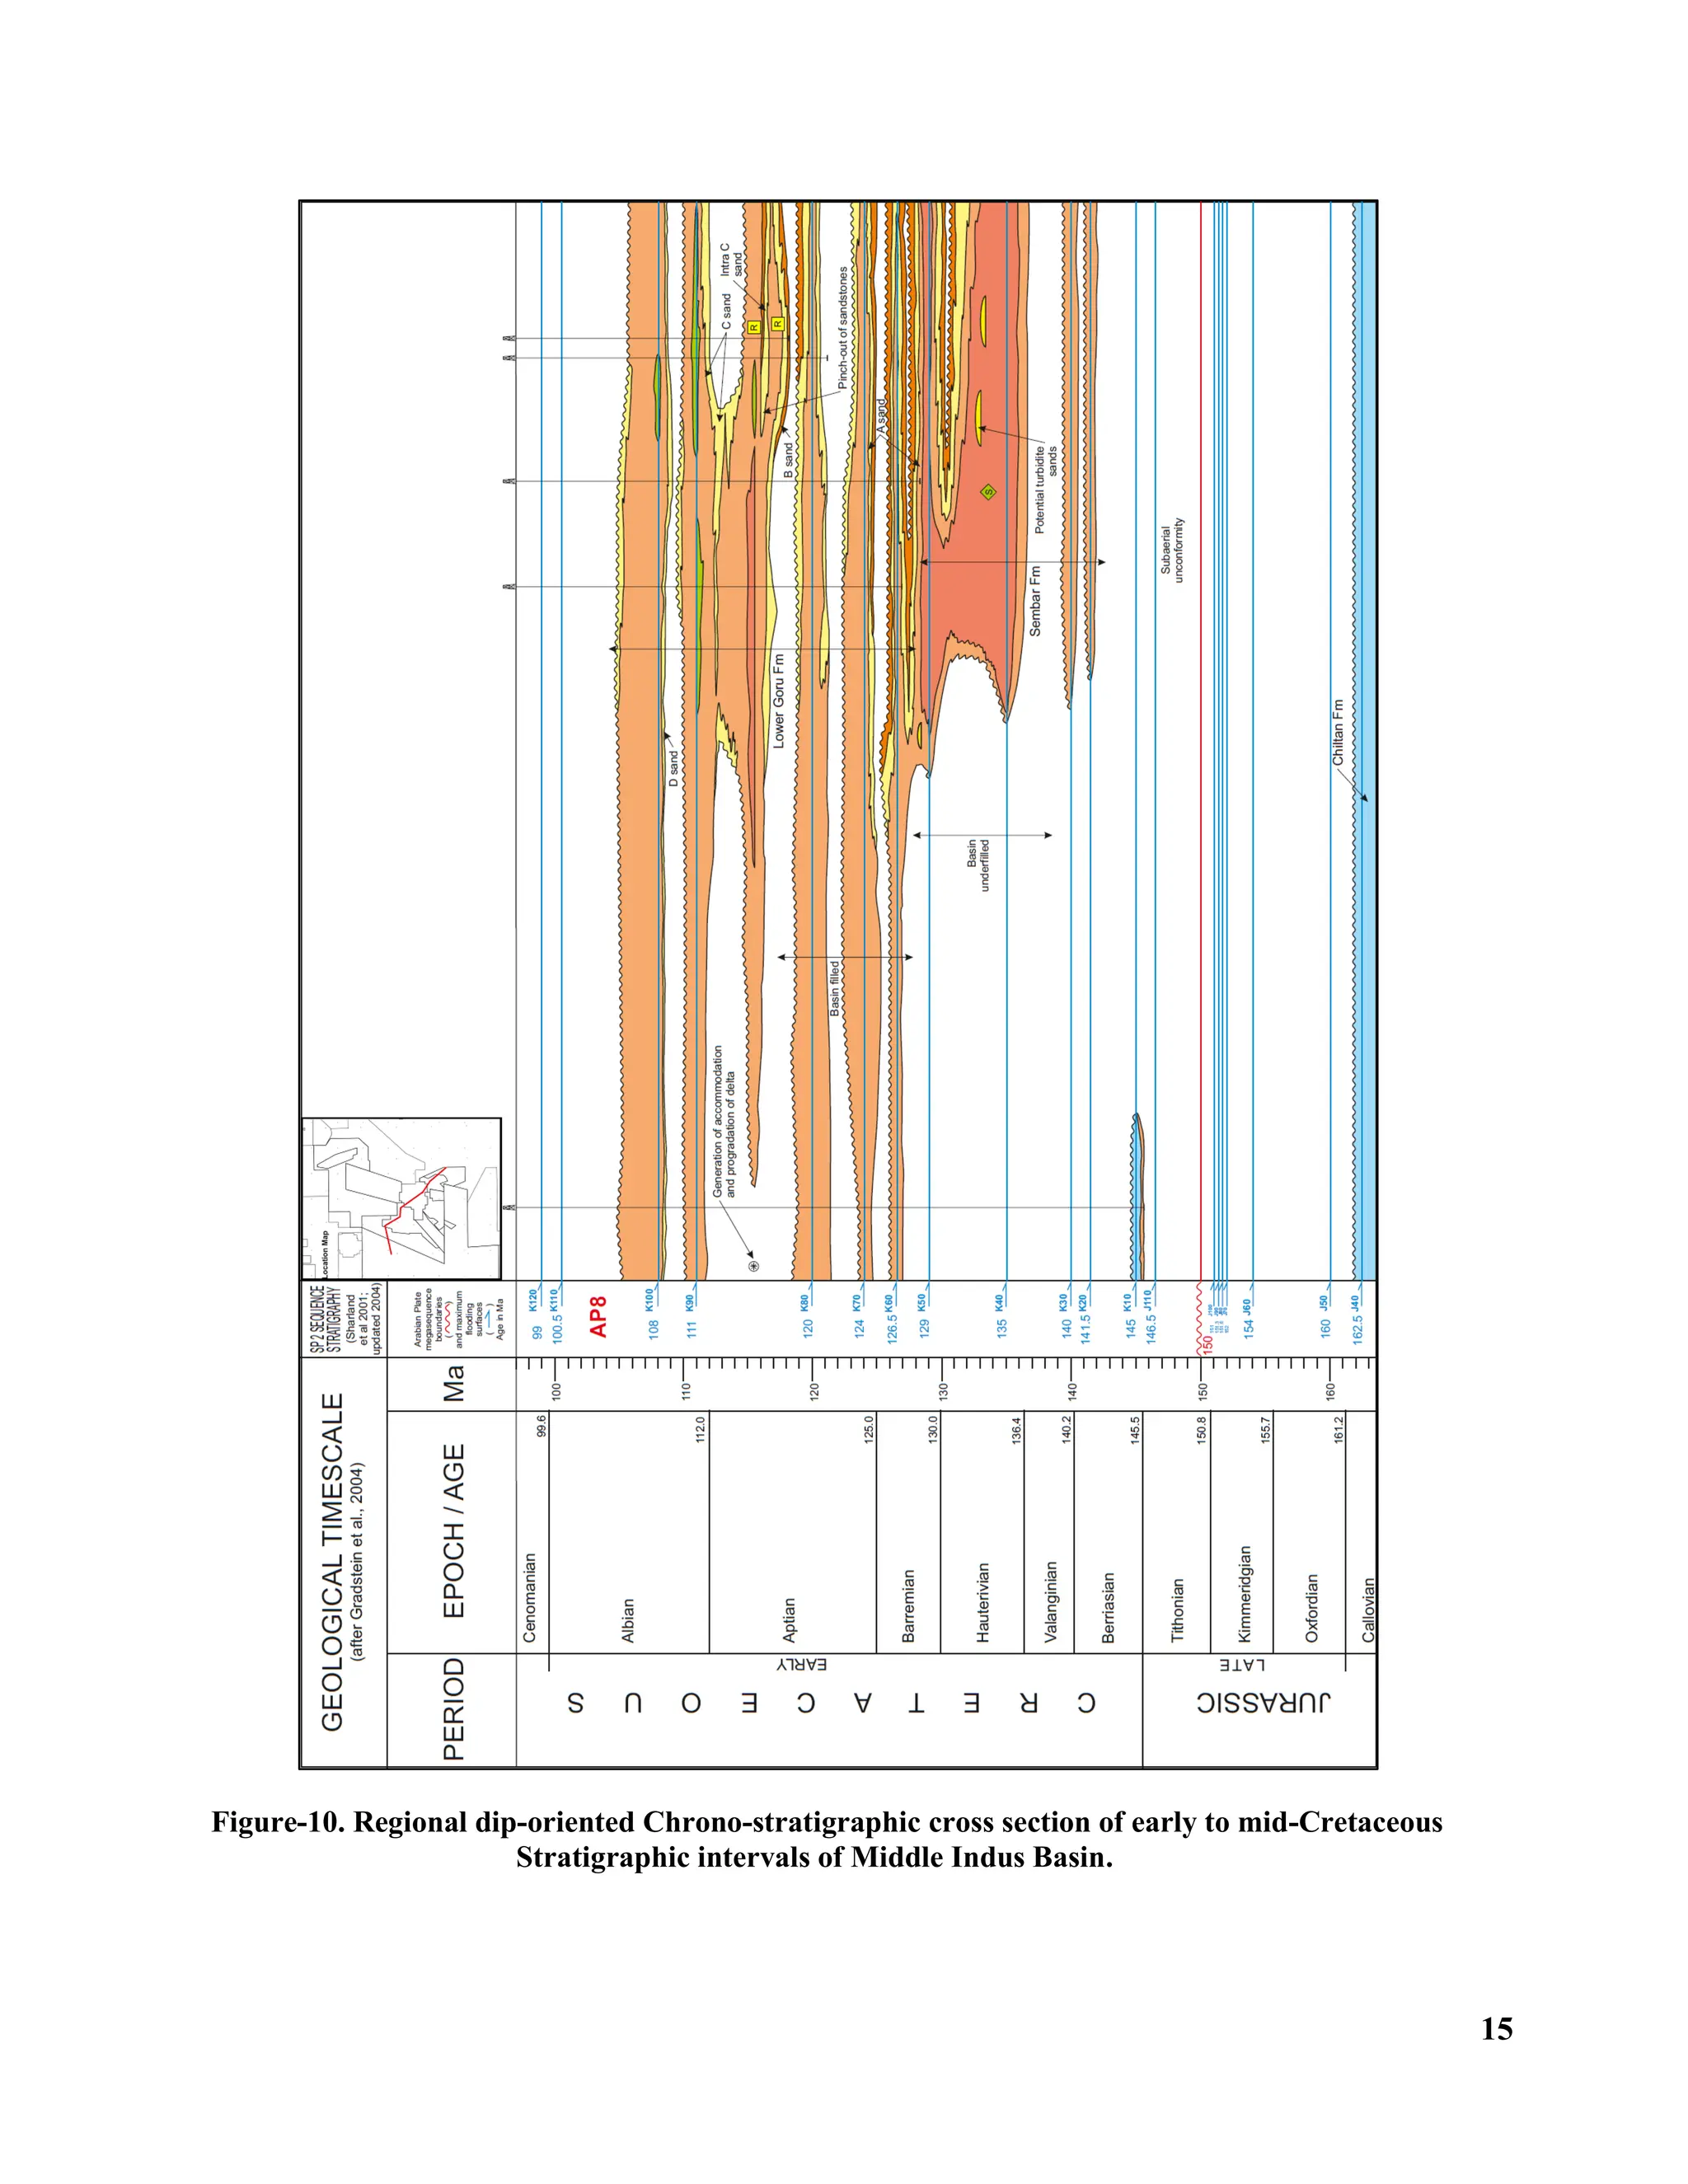
Sembar Formation marks the onset of the
sedimentation in a deep basin; refer to the
height of the clinoforms on seismic cross-section
(Figure-8). High sedimentation rates resulted in
the progressive infill of this basin by large
prograding wedges of sediment that included
turbidites deposited in basin floor fan and/or
lower slope settings (Figure-8). Generally the
sediment input direction is from eastern side
(Indian Craton) of the study area. These
sandstones in the Sembar Formation represent
additional exploration targets. As
sedimentation progressed, the deposition of the
A Interval represents a transition from an
under- to an overfilled state. In general, the A-
D Intervals are dominated by shallow-marine to
paralic successions. During deposition, local
tectonism and eustasy had a profound influence
on deposition.
Two distinctive patterns in the strata lying
above Chiltan limestone can be observed
(Figure-8).
3.
3
1 - ProgradingWedges, encompassing K40 to
K60 Sequences shows that the basin was under
filled at the time. These prograding clinoforms
would be expected to have basin floor fan and
lowstand delta top. An analogue for these rocks
is the Lewis Shale of the USA, which contains
both basin-floor fan, delta top and shales gas
resources within it (Figure-9) [14].
Traditionally, work on these plays has not been
extensive and currently no fields are producing
from these plays. This article will highlight the
mechanism and potential of these plays.
2- Parallel to sub-parallel reflectors,
encompassing K70 to K100 sequences,
representing shallow marine environment
across the basin. Plays in these intervals have
been extensively worked upon by different
operators in the area especially by OMV [1], [2],
[3], [10], [12], [15], & [22].
4. Unproven Plays:-
a. Sembar Turbidite K50 and K60 LST
Plays
No fields in Middle Indus Basin are currently
recognized in this play but is noted that shows
do occur in many of the reservoir sandstones.
The petroleum system elements for this play are
(Figure-6 & 10):
► Reservoirs: K50/K60 LST turbidite
sandstones
► Top seal: K50/60 LST slope shales
► Bottom seal: K50/60 LST slope shales, and
► Charge: Sembar Formation.
One of the main issues with this play is
uncertainty due to the limited number of well
penetrations in Middle Indus Basin. It is also
likely that some of the turbidite sandstones in
this play are buried to a sufficient depth,
indicating an intermediate reservoir
effectiveness risk for them. If the reservoir is
buried below 3000m overburden, in such a
scenario, early chlorite coating of the sandstone
reservoir becomes very crucial. Referring to
Figure-11, after point “B” which is the onset of
chemical compaction; quartz cementation takes
place; it would significantly hamper the
porosity of sandstone reservoirs [4]. In this
situation, either early chlorite coating is
essential or the grains should be sufficiently
rigid to hold the porosity framework, such that
the porosity trend would likely follow trend
“D”. Also a contributing factor to inhibit
porosity reduction can be early hydrocarbon
charge. Due to this pore-pressure inhibits the
chemical compaction which in turn is very
critical for porosity preservation in siliciclastic
sedimentary rocks.
The sandstones of this play will occur in slope or
base of slope successions and are unlikely to
occur on the Jacobad-Khairpur paleo-high
(Figure-8). The risks associated with this play
will only be reduced through the collation of
additional data. This would include well or
high-resolution seismic data that can better
define reservoir presence at depth.
Future Additional Work for Play
Evaluation
► Additional penetration in the play would be
very critical, effectively providing porosity-
permeability data from turbidite deposits in
Sembar Formation of both the Middle Indus
and Lower Indus Basins. The depth-
threshold for reservoir cut-off is only loosely
defined. During this process, it should also
be considered that the Sembar Formation
could be over-pressured as it is buried
within the gas window. This attribute will
allow porosities and fluid flow to be higher
than anticipated.
► High resolution sequence stratigraphic
interpretation of the Sembar Formations is
required to better observe the geometries of
potential turbidites and the likely location of
stratigraphic pinch-out. An attempt can also
be made to define a range of analogue
models for comparable turbidite basins that
are developed on continental crust from
other parts of the World.
4.
4
b. Intra-A SandK60 Lowstand Delta Play
No fields are known in this play but significant
prospects may occur within it (Figure-8).
Shows are recognized throughout the extent of
the play. The petroleum system elements are
(Figure- 6);
► Reservoirs: K60 LSD sandstones
► Top seal: K60 TST shales
► Bottom seal: K60 slope to lowstand delta
shales
► Charge: Sembar Formation.
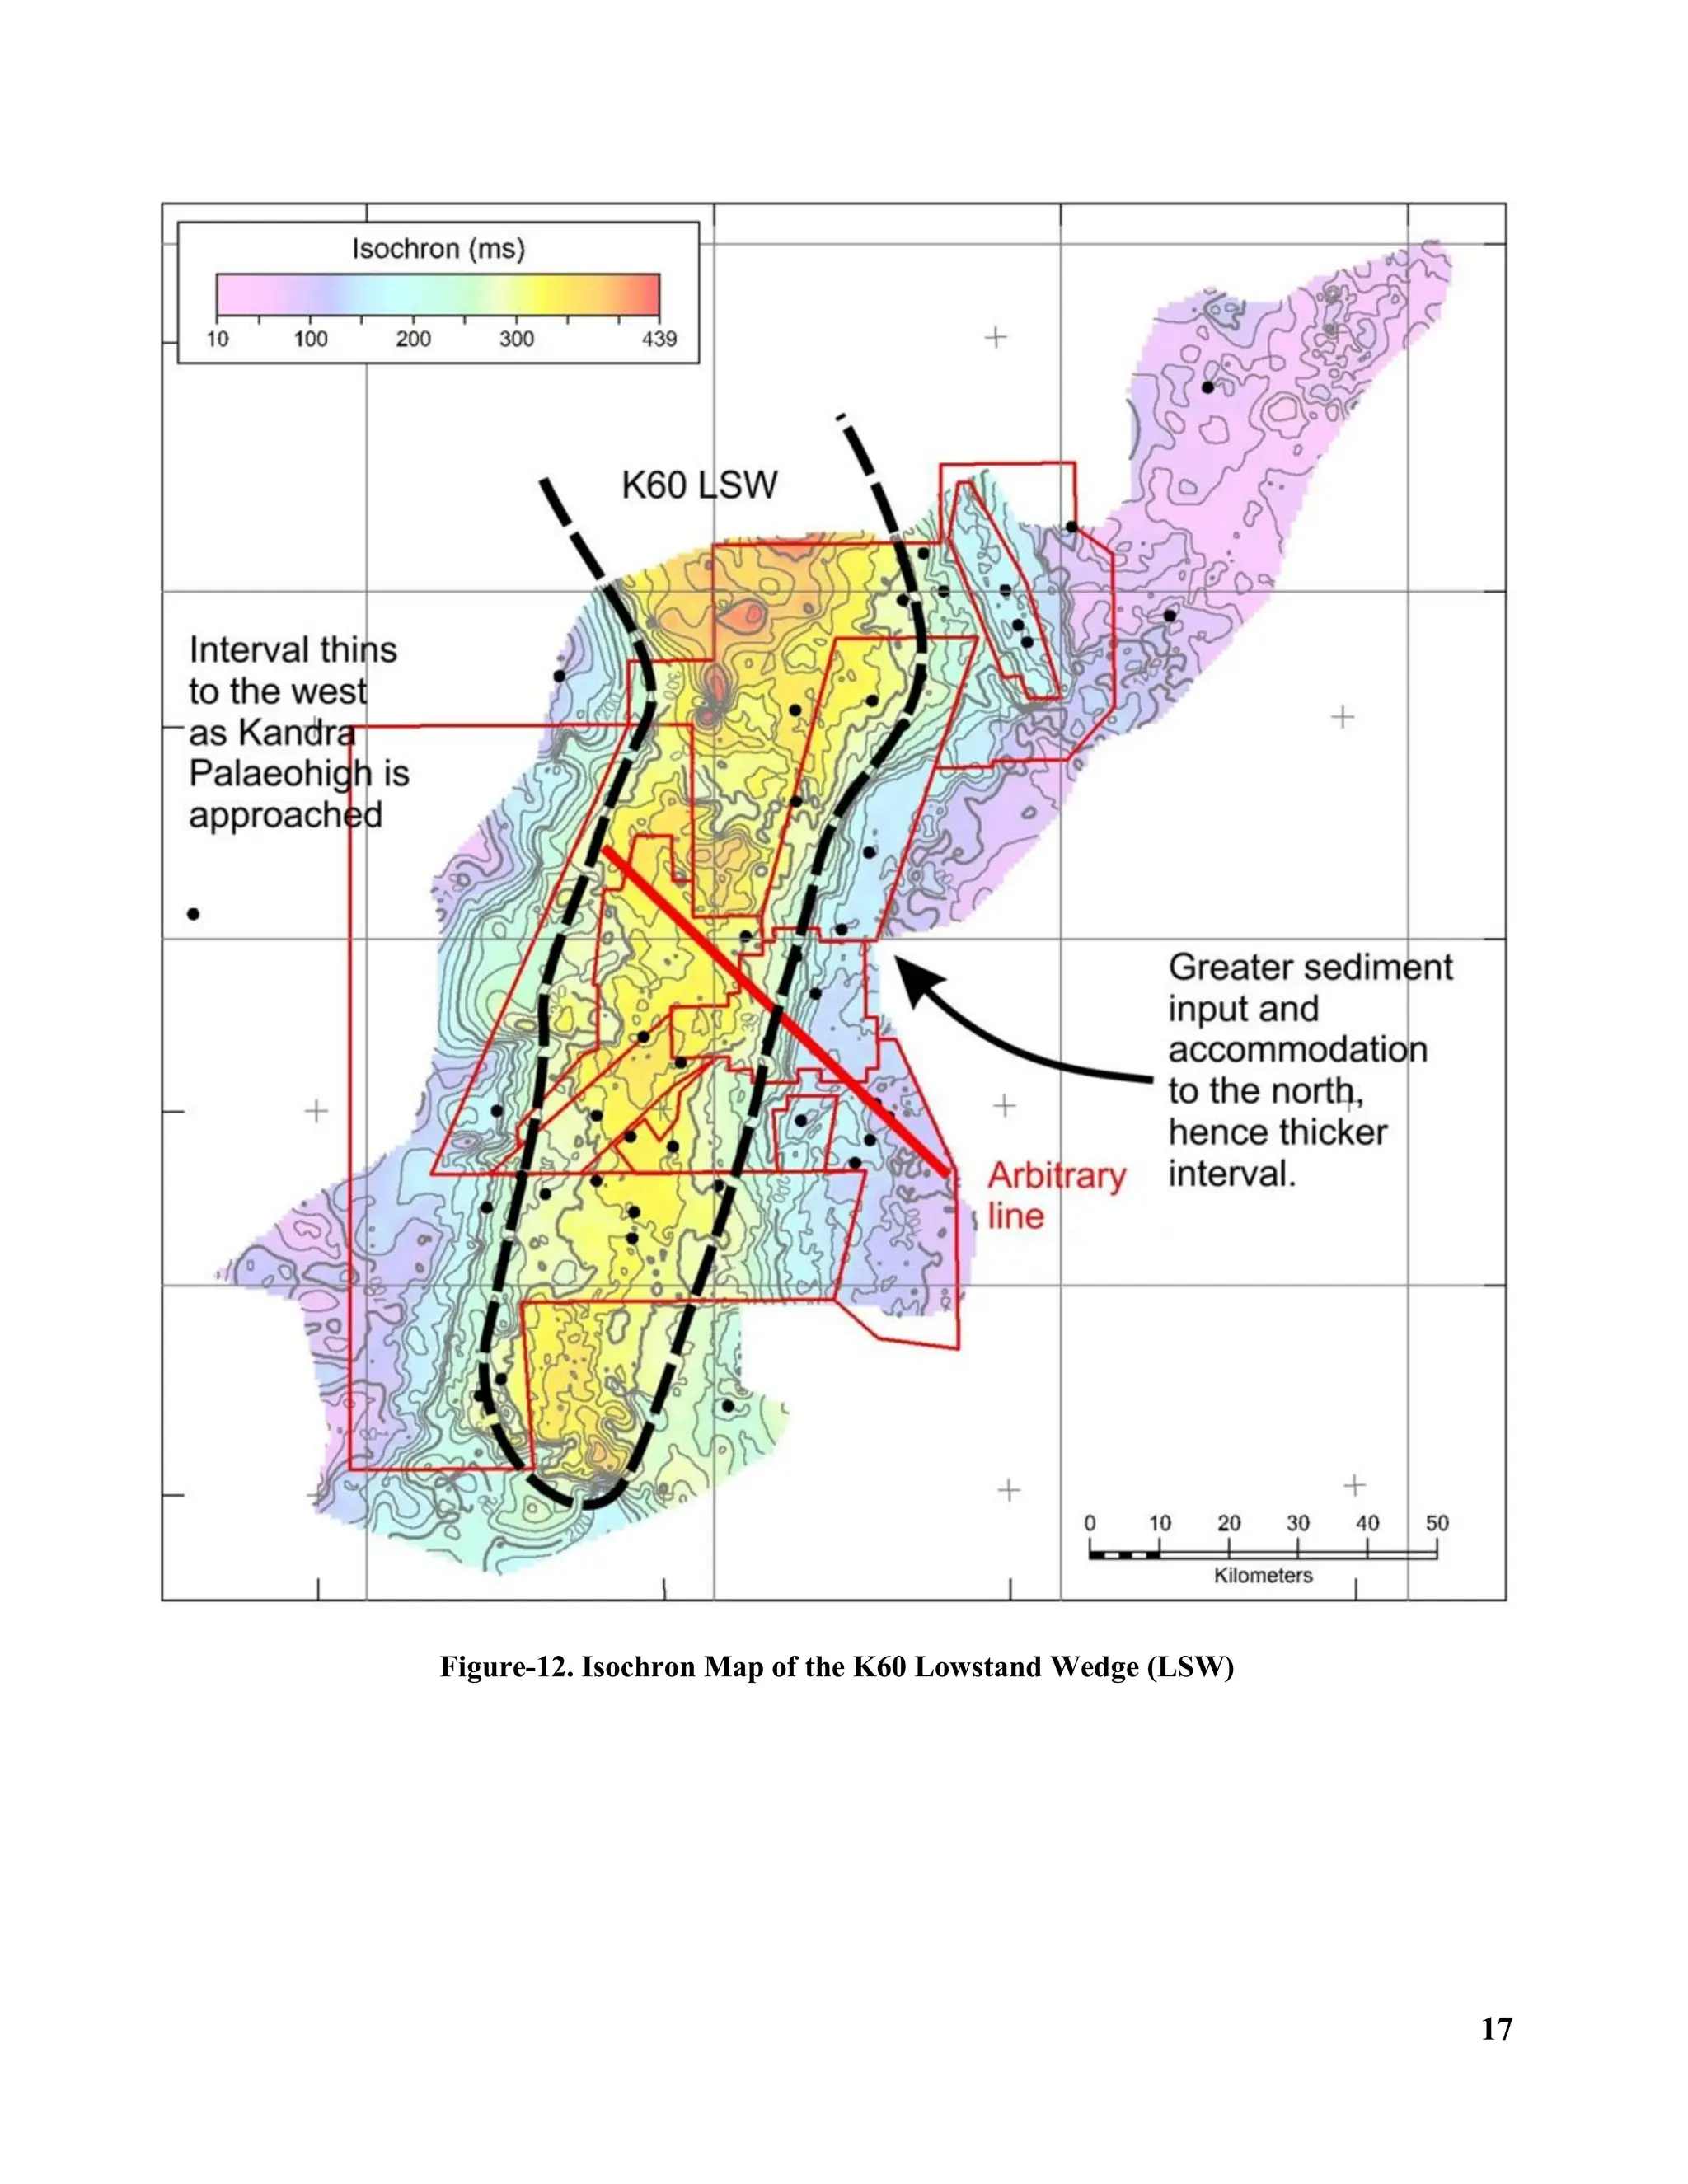
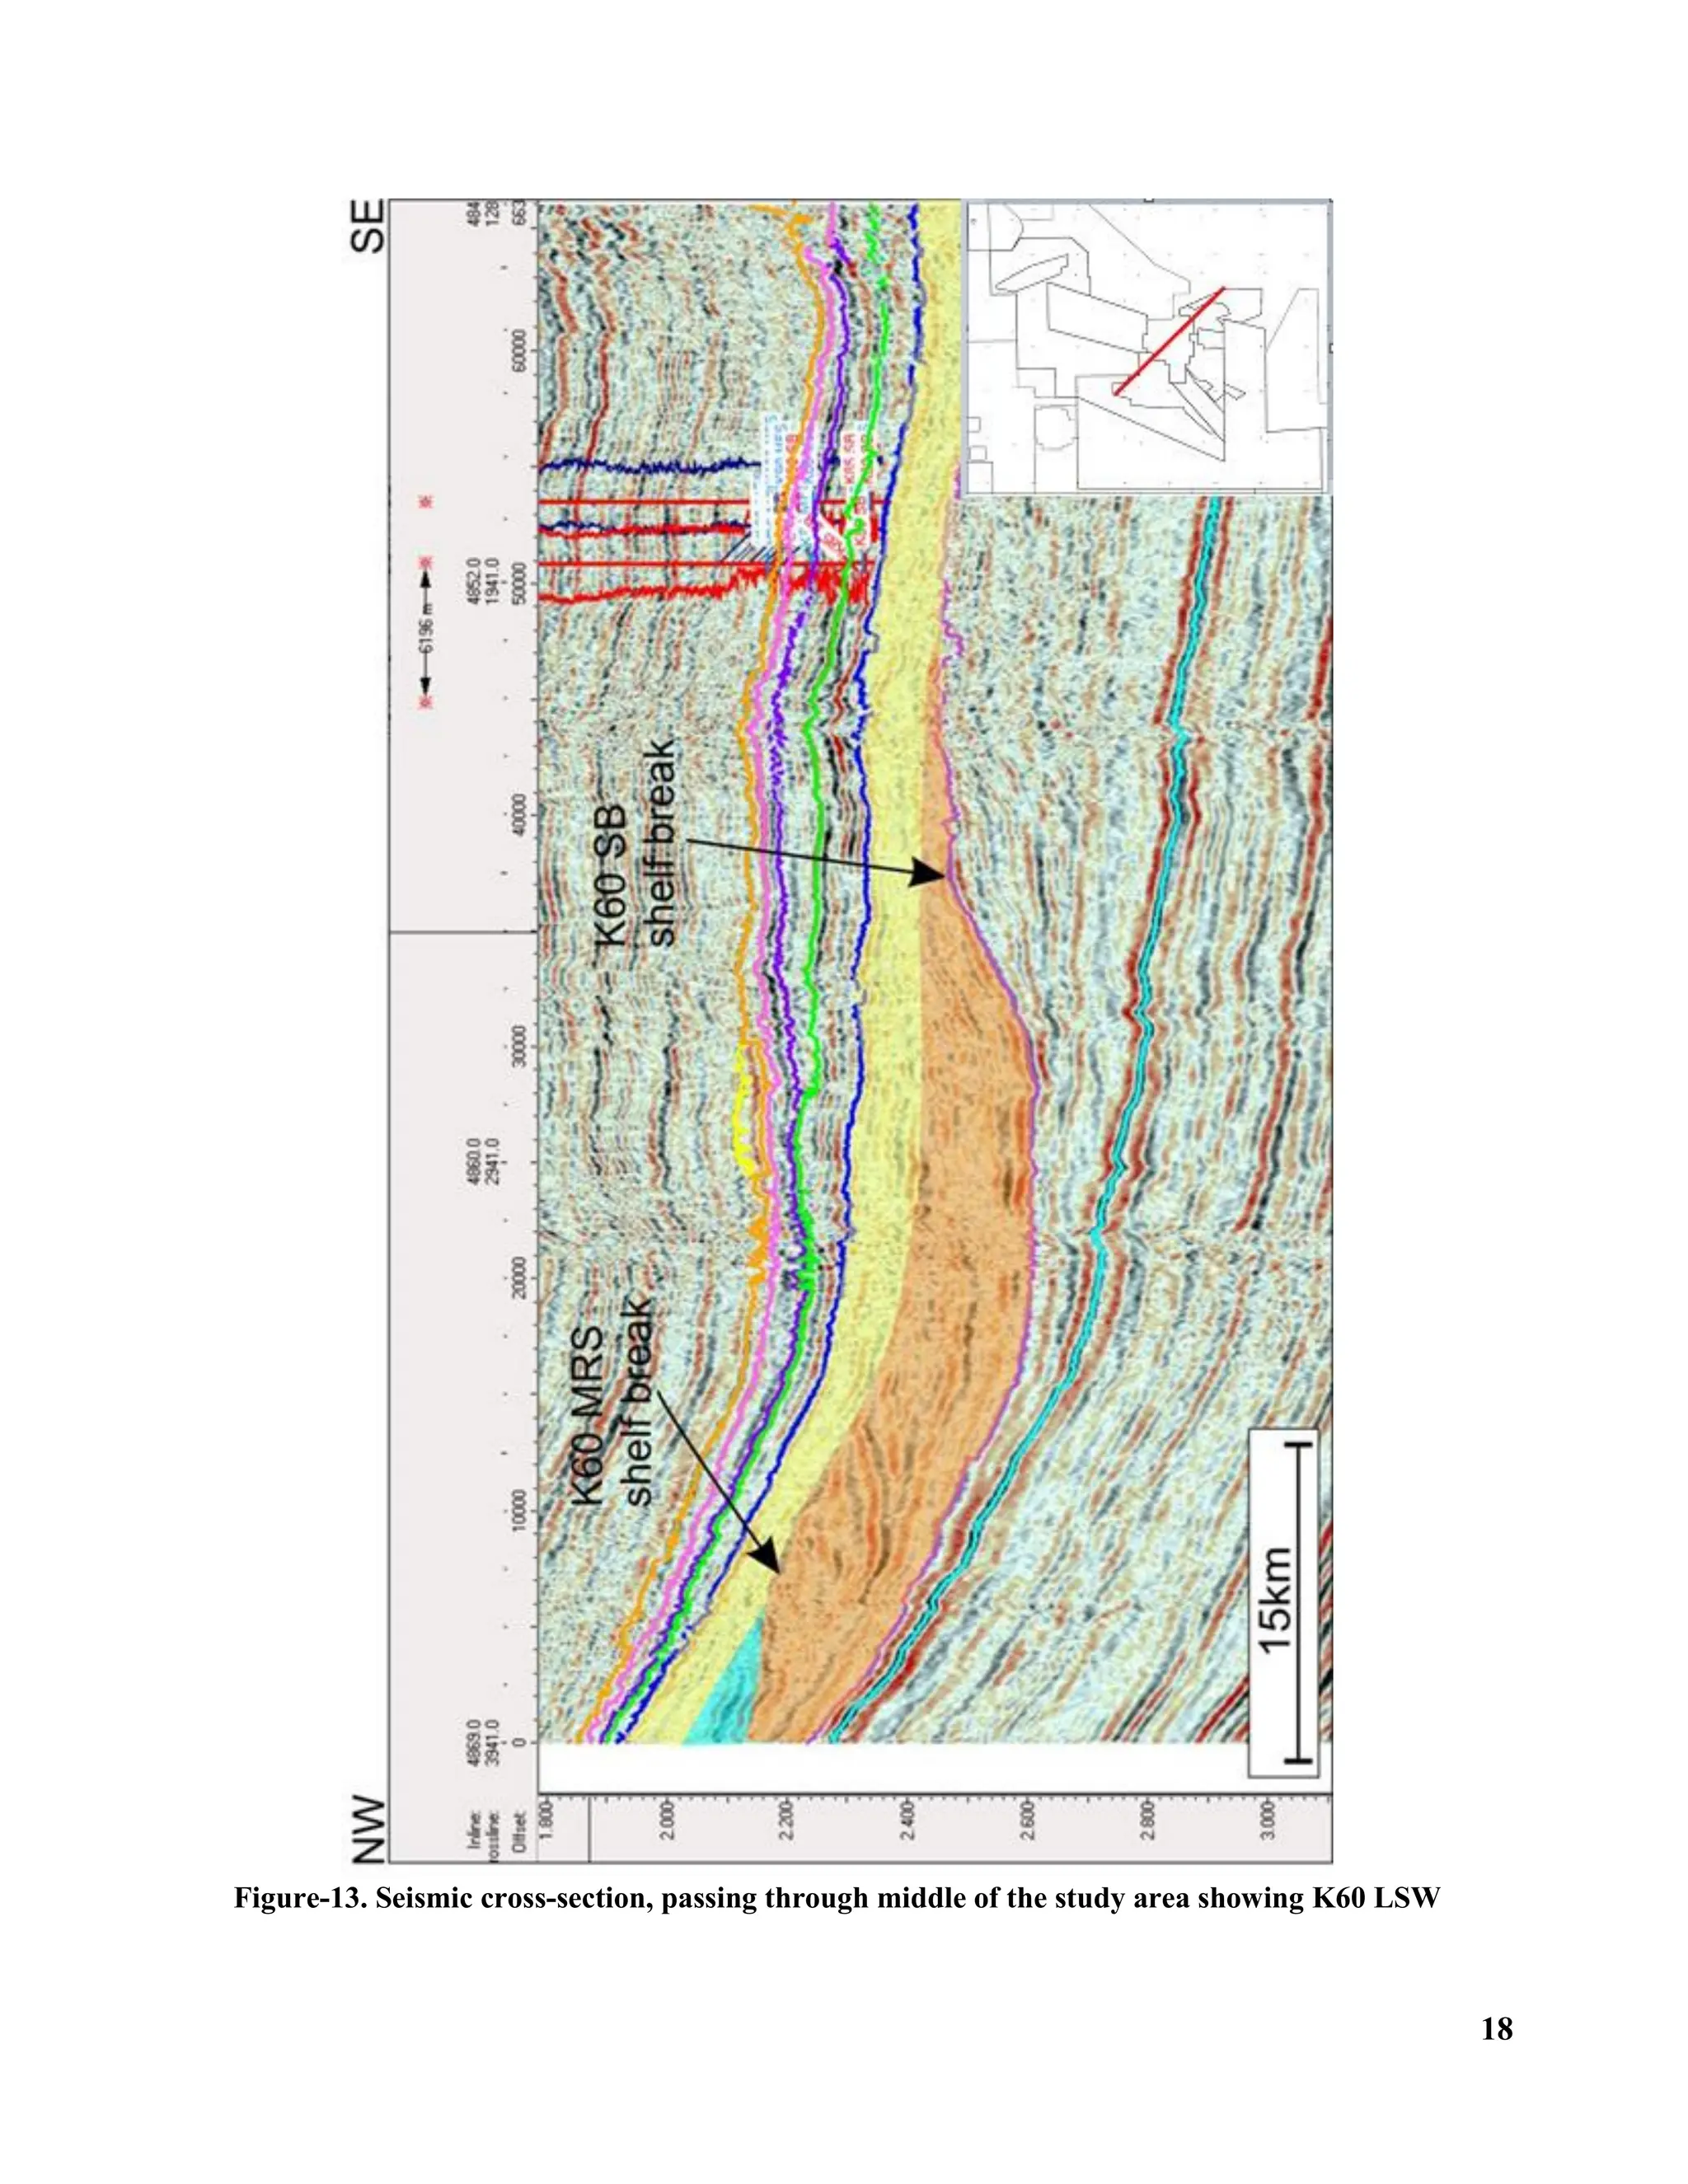
The Maximum thickness of the K60 Lowstand
wedge (LSW) is generally in the mid-western
part of the study area. The strike of this deposit
is generally North-South, while it thins towards
the Kandra paleo-high. This deposit thickens
towards the north along strike, suggesting
greater accommodation and sediment dispersal
in that direction (Figure-12 & 13).
In this play, three of the petroleum system
elements interact to limit its extent. Reservoir
risks increase to the west towards the edge of
the K60 LST. Due to the sand-prone nature of
the A Interval, top seal will tend to be an
intermediate risk over most of this basin (the
risk would decrease towards west), whilst
bottom seals are only developed in the region
between the K60 SB and MRS (Figure-7).
Future Additional Work for Play
Evaluation
► Additional penetrations would add value
and help delineate the nature of the
transition into lower quality reservoir
towards the west. Also this will help to
define the extension of the Top and Bottom
Seals towards west.
► If high resolution seismic data is acquired, it
will add value to the interpretation,
especially towards west of the study area.
► High resolution sequence stratigraphic
seismic correlation of the depo-centre into
which the K60 Lowstand Delta progrades.
Risks Associated with Unproven Plays &
Recent Well Results
a. Sembar Turbidite K50 and K60 LST
Plays
Major risk associated with Sembar Turbidite
K50 and K60 LST Plays is the presence of
effective reservoir. These reservoirs are found
near the base of slope succession and
throughout the Middle Indus Basin, they are
found fairly deep. Consequently, burial
diagenesis which hampers the permeability of
reservoir is a major risk for this play.
b. Intra-A Sand K60 Lowstand Delta Play
Major Risk associated with Intra-A sand of K60
Lowstand Delta play is the presence of effective
top seal which can be provided by K60 TST.
The reservoir separation from overlying K60
HST deposits seems to be the major risk for this
play.
c. Recent Well Results
Recently, OMV has tested both these plays in
one of the wildcat exploration well as secondary
and tertiary targets. Sembar turbidites of K60
LST (tertiary target) were found tight.
However, the well location itself was not ideal
for testing this play as this may be at tail of the
turbidite lobe and was also found at fairly large
depth >3500m. Moreover, in order to test these
sands at an ideal location, detailed mapping of
Lowstand fan has to be carried-out separately.
Intra-A sand of K60 Lowstand Delta play was
also tested (secondary target), which proved the
presence of a thick K60 TST deposit above the
reservoir sands, which provided an effective top
seal. However, reservoir quality is low at well
location, which can be attributed to distal
position of the delta. The proximal part may
exhibit good reservoir quality sand. In order to
mitigate the reservoir effectiveness risk,
5.
5
additional reservoir studiesand sequence
stratigraphic interpretation needs to be carried
out in detail.
5. Conclusions and Recommendations
After seismic sequence stratigraphic analysis of
early to mid-Cretaceous intervals in Middle
Indus Basin, Pakistan, it is concluded and
recommended that:
1. K70 to K100 sequence stratigraphic
intervals, containing most of the fields in
Middle Indus Basin. Only limited potential
for significant petroleum accumulations
occur to the west of the current fields.
2. K40 to K60 sequence stratigraphic intervals
are under-explored and un-proven. So next
steep leg in the creaming curve of Lower
Goru can be expected from plays within
these intervals, which might add significant
reserves.
3. The K50 or K60 turbidite sandstones play
occurs within, or near to the base, of the
Sembar Formation and as a consequence,
reservoir effectiveness represents an
intermediate risk due to depth of burial.
Regional development of these sandstones
has yet to be reasonably demonstrated.
Further information, reservoir presence is
considered an uncertain but intermediate
risk.
4. The K60 Lowstand Delta Play is limited by
reservoir presence with the notable addition
of a top seal risk. Reservoir presence
improves to the east, whilst top-seal
development improves in the opposite
direction.
5. K60 Lowstand Wedge has significant
thickness in the mid-western part of the
study area. It poses a very attractive
exploration opportunity and needs more
work at prospect level.
6. High resolution seismic sequence
stratigraphic interpretation is required in
order to properly delineate unproven plays
at prospect scale.
6. References
[1] Afzal, J., Kuffner, T., Rahman, A., Ibrahim,
M [2009]. Seismic and well-log based sequence
stratigraphy of the early Cretaceous, Lower
Goru “C” sand of the Sawan gas field, Middle
Indus Platform, Pakistan. AAPG Search and
Discovery Article # 90139.
[2] Ahmad, N, Fink, P., Sturrock, S., Mahmood,
T and Ibrahim, M [2004]. Sequence
stratigraphy as a predictive tool in Lower Goru
Fairway, Lower and Middle Indus Platform,
Pakistan. AAPG Search and Discovery Article
#10404
[3] Ahmed, A.R. and Ibrahim, M [2008]. 3D
modeling of reservoir classes using seismic
acoustic impedance data. AAPG Search and
Discovery Article # 90151.
[4] Ajdukiewicz, J.M and Lander, R.H [2010].
Sandstone reservoir quality prediction: The
state of the art. AAPG Bulletin, v. 94, no. 8
(August 2010), p.1083-1091.
[5] Daud, F., Khan, G.N., Ibrahim, M [2011].
Remaining hydrocarbon potential in Pakistan.
A statistical review. AAPG Search and
Discovery Article # 90138.
[6] Davies, R.B., Casey, D.M., Horbury, A.D.,
Sharland, P.R and Simmons M.D. [2002]. Early
to mid-Cretaceous mixed carbonate-clastic
shelfal systems: examples, issues and models
from the Arabian Plate. GeoArabia, v. 7, no. 3,
p.541-598.
[7] Gradstein, F.M. and Ogg J.G [2004].
Geologic Time Scale 2004 – why, how, and
where next! Lethaia, v. 37, p. 175-181.
[8] Gradstein, F.M., Ogg, J.G. and Smith, A.G.
(Eds.) [2004]. Geologic Time Scale 2004.
Cambridge University Press, p.500.
6.
6
[9] I.E.D.S., [1995],a sequence stratigraphic
study of the Lower Goru – Sembar formations
of Lower and Middle Indus Basins of Pakistan
and Rajasthan: Multiclient Study.
[10] Ibrahim, M [2007]. Seismic inversion data,
a tool for reservoir characterization/modeling
Sawan gas field – A case study. AAPG Search
and Discovery Article # 90140.
[11] Iqbal, M, Nazeer, A., Ahmad, H and
Murtaza, G [2012]. Hydrocarbon exploration
perspective in Middle Jurassic-Early
Cretaceous reservoirs in the Sulaiman Fold
Belt, Pakistan. AAPG Search and Discovery
Article #10394.
[12] Krois, P., Mahmood, T and Milan, G
[1998]. Miano field, Pakistan, A case history of
model driven exploration. AAPG Search and
Discovery Article # 90145.
[13] OMV internal, Basin Analysis Study –
Unpublished.
[14] Pyles, D.R and Slatt, R.M [2008].
Stratigraphy of the Lewis shale, Wyoming,
USA: Application to understanding shelf-edge
to base-of-slope changes in stratigraphic
architecture of prograding basin margins. The
American Association of Petroleum Geologists –
Studies in Geology 56, p.485-489.
[15] Rahman, A and Ibrahim, M [2009].
Uncertainty analysis in the Sawan static
reservoir model and optimization of facies using
neural network technology. AAPG Search and
Discovery Article # 90139.
[16] Raza, H.A., Ahmed, R., Ali, S.M., Sheikh,
A.M., and Shafique, N.A. [1989]. Exploration
performance in sedimentary zones of Pakistan.
Pakistan Journal of Hydrocarbon Research
v.1(1): p.1-7.
[17] Reynolds, M. W., 1976, Influence of
recurrent Laramide structural growth on
sedimentation and petroleum accumulation,
Lost Soldier Area, Wyoming: AAPG Bulletin, v.
60, p. 12-33.
[18] Sharland, P.R., Archer, R., Casey, D.M.,
Davies, R.B., Hall, S.H., Heward, A.P.,
Horbury, A.D and Simmons M.D. [2001].
Arabian Plate Sequence Stratigraphy.
GeoArabia Special Publication 2, Gulf
PetroLink, Bahrain, p.371.
[19] Sharland, P.R., Casey, D.M., Davies, R.B.,
Simmons, M.D and Sutcliffe, O.E [2004].
Arabian Plate Sequence Stratigraphy –
revisions to SP2. GeoArabia, v. 9, no. 1, p. 199-
214.
[20] Simmons, M.D., Sharland, P.R., Casey,
D.M., Davies, R.B., Sutcliffe, O.E [2007].
Arabian Plate sequence stratigraphy: Potential
implications for global chronostratigraphy.
GeoArabia, v. 12, no. 4, p.101-104.
[21] Snedden, J.W., Sarg, J.F and Ying, X
[2003]. Exploration play analysis from a
sequence stratigraphic perspective: AAPG
Search and Discovery Article #40079.
[22] Sultan, S and Ilyas, A [2010]. New
stratigraphic play identified in the lower
Cretaceous sequence of Middle Indus Basin,
Pakistan. AAPG Search and Discovery Articcle
# 90120
7.
7
Figure-1. Structural Settingof Middle Indus Basin, Pakistan
Figure-2. Sequence stratigraphy and play summary chart of the Sembar and Lower Goru
sequences, along with the stratigraphic nomenclature used in the industry [2]
Study Area
8.
8
Figure-3. Creaming curvefor Middle Indus Basin. Each hash represents number of exploration
wells drilled [5]
Middle Indus Basin - Creaming Curve
0.00
500.00
1000.00
1500.00
2000.00
2500.00
3000.00
3500.00
1925
1928
1931
1934
1937
1940
1943
1946
1949
1952
1955
1958
1961
1964
1967
1970
1973
1976
1979
1982
1985
1988
1991
1994
1997
2000
2003
2006
2009
Cummulative
Mari
Kandhkot
Kadanwari
Qadirpur
Kandra
Miano
Block 22 SML discoveries
Mari Deep
Sawan
L. Goru & SML discoveries
Major discoveries in Tertiary Carbonates
Lower Goru Sandstone discoveries
Limited seismic coverage,
discovered on highs
Dense seismic, stratigraphic
and combination traps,
Reserves
-
MMBOE
9.
9
Figure-4. Sembar SourcePotential Map (Colors showing the chance of adequacy, Green being the
highest and Red being Lowest)
10.
10
Figure-5. Geological TimeScale 2004 [7] & [8]. The Arabian Plate Sequence Stratigraphic
Model [18] & [19] is plotted against this timescale
11.
11
Figure-6. Nomenclature usedby different Operators and Regional studies in the Study Area.
Comparison with Global Sequence Stratigraphic Scheme proposed by [9] & [18].
13
Figure-8. Seismic SequenceStratigraphic Interpretation of the early to mid-Cretaceous of Middle
Indus Basin. Seismic cross-section oriented in regional depositional dip
15
Figure-10. Regional dip-orientedChrono-stratigraphic cross section of early to mid-Cretaceous
Stratigraphic intervals of Middle Indus Basin.
16.
16
Figure-11. Porosity-depth trends.Shown is a modeled porosity evolution with burial for well-sorted,
fine-grained, quartzo-feldspathic (rigid-grained) sandstone with variable grain coats formed near the
surface [4]
19
Mr. Kamran Aziz
Kamranreceived his B.Sc.
(Hons) & M.Sc. degrees in
Geology from the University
of Karachi in 1996 & 1997
respectively. He has also
obtained another M.Sc.
degree in Petroleum
Geoscience with distinction
from Oxford Brookes University, Oxford, UK in
2002. He joined OMV (Pakistan) Exploration
G.m.b.H in May 2010 and currently working as
Lead Geologist in their Exploration
Department. In OMV (Pakistan), he is leading
the Fold Belt & New Ventures Team since
September 2012 and responsible for all G&G
activities in Operated/Non-Operated Assets.
Before that he was leading the Middle Indus
Ventures Team. Previously, he worked for
Pakistan Petroleum Limited (PPL) from
October 1998 to May 2010 (12 years) at
different technical/management positions and
was Deputy Chief Geologist in their Exploration
Department at the time of leaving the company.
His main interests are play fairway analysis
using the sequence stratigraphic tool, lead to
prospect generation, re-evaluation of remaining
block prospectivity, near field exploration,
formation evaluation, evaluation of new
ventures opportunities and new acquisition. He
is an active member of AAPG and PAPG since
2001 and 1998 respectively.
Mr. M. Aamir Rasheed
Aamir is a Geophysicist
by profession. He did his
M.Sc. in Geophysics from
Quaid-i-Azam University,
Islamabad in 2000. He
also holds the B.Sc.
(Hons) degree in Applied
Geology from University
of Punjab (1998) with distinction. He started his
professional career with BP Pakistan as a
Trainee Geophysicist in 2000. During his plus
eight years association with BP Pakistan, he
remained actively involved in all E&P activities
of the company from seismic acquisition till
prospect generation/evaluation. Since late 2008,
he has been with OMV Pakistan & currently
working as a Senior Geophysicist, mainly
responsible for G&G activities / studies and
prospect evaluation of all operated ventures of
Middle Indus Basin. He takes keen interest in
Reservoir Characterization through seismic
with the state of the art technologies like seismic
inversion, special attributes interpretation, and
seismic forward modeling. He is an active
member of AAPG, SEG and PAPG.
Mr. Syed Adnan Haider
Zaidi
Syed Adnan Haider Zaidi is
a Geologist by profession.
He did his M.Sc. in Geology
in 2003 from the University
of the Punjab with major in
Petroleum and Structural Geology. He started
his professional career with OGDCL, Pakistan
in April 2004 and then joined OMV (Pakistan)
in February 2012. Currently he is working on
OMV operated Middle Indus Ventures. He is
involved in Petroleum Systems Evaluation, Play
Fairway Analysis and Prospect Generation. He
has special interest in Integrated Sedimentology
and Sequence Stratigraphy.
Mr. Adil Azeem
Adil is a Geophysicist in
OMV (Pakistan). He did
his M.Sc (Geophysics)
from Quaid-i-Azam
University Islamabad with
distinction in 2010. He
started his career with
Ocean Petroleum Limited
as a Trainee Geophysicist.
Since Mid-2011, he has been associated with
OMV, actively involved in a wide range of E&P
projects. Mainly focusing on prospect
generation/evaluation in very challenging
Middle Indus Basin operated ventures. His
professional interests include Seismic sequence
stratigraphy, Forward seismic modeling and
quantitative seismic interpretation.
![1
PAPG – SPE ATC 2014
Un-Proven Plays in Middle Indus Basin
Kamran Aziz (Kamran.Aziz@omv.com), Aamir Rasheed (Aamir.Rasheed@omv.com), Adnan Zaidi
(Syed_Adnan.Zaidi@omv.com) & Adil Azeem (Adil.Azeem@omv.com)
OMV (Pakistan) Exploration GmbH OMV (Pakistan) Exploration GmbH
Abstract
The recent integrated regional sequence
stratigraphic study confirmed the long-known
interpretation of the early to mid-Cretaceous
successions as representing a transition from
shallow to deep marine rocks during the
progradation of sedimentary wedges. During
deposition, the effects of the Kandra palaeo-
high were significant with deposits effectively
ponding against it as progradation continued to
infill accommodation. The main gas fields in
this succession are developed in the shallow-
marine sands at the top of this wedge. The
basinal turbidite sandstones and/or lowstand
delta sands have the potential to provide
underexplored or new exploration
opportunities. Deposition under different 3rd
order cycles of sea-level change had a profound
influence on the regional development of
reservoirs with the main fields occurring in
transgressive/regressive sandstones sealed by
the overlying shales.
This study revealed that sub-regional variations
in subsidence occurred across the Middle Indus
Basin and had significant influences on
sedimentation. This is represented by the
creation of smaller depo-centres that either (i)
created anomalous thicknesses of shallow-
marine rocks or (ii) created deeper basins
containing locally preserved turbidites. It is
highly likely that the majority of these fairways
are fully exploited with the potential for
significant petroleum accumulations (to the west
of the current fields) being extremely limited.
Therefore, it is anticipated that any new
reserves in the Middle Indus Basin will be
represented in unproven plays.
These unproven plays include turbidites &
Lowstand deposits. The turbidites occur within
or near to the base of the Sembar Formation
and as a consequence, reservoir effectiveness
represents an intermediate risk due to depth of
burial. In addition to this, due to the limited
number of well-penetrations, the regional
development of these sandstones is yet to be
demonstrated.
Based on the evaluation of Cretaceous gas plays
in the Middle Indus Basin, it is recommended
that less time is devoted to exploring the
established play as these less likely to have a
significant lateral extent to the west. In
contrast, some of the deeper plays may have
untapped potential e.g. turbidites and low sand
deposits. These require more work to reduce
the risk associated with them.
1. Introduction:
Objective of this article is to highlight the
importance of the unproven plays in the future
exploration strategy of the Middle Indus Basin.
The Middle Indus Basin lies in the Southern
Pakistan on the northern side of Lower Indus
Basin from the flanks of Jaccobabad –
Khairpur high to the Flanks of Mari –
Kandhkot high. In general, the study area
comprises a relatively steeper south easterly
dipping monocline on the eastern flank of
Jaccobabad – Khairpur high (Figure-1)
intersected by intra-basinal highs and lows [16].
As previously cited by [2], Early to Mid-
Cretaceous sandstone bodies are interpreted to
be deposited in a depositional environment
representing a transition from deep to shallow
marine rocks (Figure-2). The main gas fields in
this succession are developed in the shallow-
marine sandstone. The basinal turbidite
sandstones and/or lowstand delta sands have the
potential to provide underexplored or new
exploration opportunities. By examination of
the creaming curve of Middle Indus Basin
(Figure-3) it is observed that Lower Goru play
has some terraces and steep legs [5]. Two
conclusions can be made by comparison of this
creaming curve with the world’s mature basins,
keeping in view the sequence stratigraphic
framework;
1) Initial exploration has focused on TST and
HST (with exception of Sawan field, which
is a lowstand shelf-edge delta system) [1].](https://image.slidesharecdn.com/unprovenplaysinmib-251113102159-a6b7667a/75/Unproven-Plays-A-Sand-in-Middle-Indus-Basin-1-2048.jpg)
![2
2) Existing plays have limited or very limited
reserves and next steep leg would come
from a new play. This analysis has some
similarities with the concept that,
discoveries in Lowstand system tract usually
sit on the last steep leg of the creaming
curve [21].
2. Petroleum System:
Sembar is considered to be the primary
petroleum source rock for most of the Lower
and Middle Indus Basins. Early to Peak Gas
maturation of Sembar-Lower Goru Petroleum
System in Middle Indus Basin is from Late
Cretaceous to Paleocene [12]. Hydrocarbon
charge is considered low risk in the area due to
the widespread development of mature source
rock (Sembar Formation). Vertical migration
dominates above the main gas window. To the
West of the Middle Indus Basin, longer distance
migration is required, which increases the
exploration risk (Figure-4).
3. Sequence Stratigraphy:
Sequence Stratigraphic scheme and
nomenclature used in this framework is based
upon the recognition of third order sequences
(1-3 Ma) across Arabian Plate in 2001 and 2004
(Figure-5) [6], [18], [19], [20]. This includes
studies in the clastic succession of the Black Sea,
mixed carbonate clastics of the Eastern
Mediterranean and the carbonates of Abu
Dhabi. This scheme focuses on the recognition
of Maximum Flooding Surfaces (MFS) and
Sequence Boundaries (SB) which are
demonstrated to occur in other parts of the
globe, correlated at biozone level (Resolution ~
500,000 years, although variable). This scheme
is then correlated with the lithostratigraphic
units and their nomenclature, which has been
conventionally used by different operators in
the study area (Figure-6).
OMV conventionally subdivides the Lower
Goru Formation into 4 intervals; from bottom
to top these are the A, B, C, and D Intervals.
These contain the main hydrocarbon producing
sandstone reservoir units from, and explored
for, across the Middle Indus Basin. At the top of
each Interval there is a regionally extensive
flooding surface recognized in well and seismic
data. This attribute allows the easy integration
of this scheme with a sequence stratigraphic
model.
Using the sequence stratigraphic model
described by [18], it was possible to subdivide
the early and middle Cretaceous rocks into
sequences deposited during different cycles of
sea-level change. In this instance, unlike other
studies in the Middle Indus Basin, this study
defines the base of a sequence at a sequence
boundary (Figure-7) rather than a maximum
flooding surface.
Clastic successions of the Sembar and Lower
Goru formations rest unconformably on the
carbonates of the Chiltan Formation. The top
of this limestone forms a prominent seismic
marker in the basin and is considered to
represent a subaerial unconformity [11]. This
Limestone is taken as acoustic marker in order
to better understand the sequence stratigraphic
relationships of the overlying stratigraphic
intervals.
Sembar Formation marks the onset of the
sedimentation in a deep basin; refer to the
height of the clinoforms on seismic cross-section
(Figure-8). High sedimentation rates resulted in
the progressive infill of this basin by large
prograding wedges of sediment that included
turbidites deposited in basin floor fan and/or
lower slope settings (Figure-8). Generally the
sediment input direction is from eastern side
(Indian Craton) of the study area. These
sandstones in the Sembar Formation represent
additional exploration targets. As
sedimentation progressed, the deposition of the
A Interval represents a transition from an
under- to an overfilled state. In general, the A-
D Intervals are dominated by shallow-marine to
paralic successions. During deposition, local
tectonism and eustasy had a profound influence
on deposition.
Two distinctive patterns in the strata lying
above Chiltan limestone can be observed
(Figure-8).](https://image.slidesharecdn.com/unprovenplaysinmib-251113102159-a6b7667a/75/Unproven-Plays-A-Sand-in-Middle-Indus-Basin-2-2048.jpg)
![3
1 - Prograding Wedges, encompassing K40 to
K60 Sequences shows that the basin was under
filled at the time. These prograding clinoforms
would be expected to have basin floor fan and
lowstand delta top. An analogue for these rocks
is the Lewis Shale of the USA, which contains
both basin-floor fan, delta top and shales gas
resources within it (Figure-9) [14].
Traditionally, work on these plays has not been
extensive and currently no fields are producing
from these plays. This article will highlight the
mechanism and potential of these plays.
2- Parallel to sub-parallel reflectors,
encompassing K70 to K100 sequences,
representing shallow marine environment
across the basin. Plays in these intervals have
been extensively worked upon by different
operators in the area especially by OMV [1], [2],
[3], [10], [12], [15], & [22].
4. Unproven Plays:-
a. Sembar Turbidite K50 and K60 LST
Plays
No fields in Middle Indus Basin are currently
recognized in this play but is noted that shows
do occur in many of the reservoir sandstones.
The petroleum system elements for this play are
(Figure-6 & 10):
► Reservoirs: K50/K60 LST turbidite
sandstones
► Top seal: K50/60 LST slope shales
► Bottom seal: K50/60 LST slope shales, and
► Charge: Sembar Formation.
One of the main issues with this play is
uncertainty due to the limited number of well
penetrations in Middle Indus Basin. It is also
likely that some of the turbidite sandstones in
this play are buried to a sufficient depth,
indicating an intermediate reservoir
effectiveness risk for them. If the reservoir is
buried below 3000m overburden, in such a
scenario, early chlorite coating of the sandstone
reservoir becomes very crucial. Referring to
Figure-11, after point “B” which is the onset of
chemical compaction; quartz cementation takes
place; it would significantly hamper the
porosity of sandstone reservoirs [4]. In this
situation, either early chlorite coating is
essential or the grains should be sufficiently
rigid to hold the porosity framework, such that
the porosity trend would likely follow trend
“D”. Also a contributing factor to inhibit
porosity reduction can be early hydrocarbon
charge. Due to this pore-pressure inhibits the
chemical compaction which in turn is very
critical for porosity preservation in siliciclastic
sedimentary rocks.
The sandstones of this play will occur in slope or
base of slope successions and are unlikely to
occur on the Jacobad-Khairpur paleo-high
(Figure-8). The risks associated with this play
will only be reduced through the collation of
additional data. This would include well or
high-resolution seismic data that can better
define reservoir presence at depth.
Future Additional Work for Play
Evaluation
► Additional penetration in the play would be
very critical, effectively providing porosity-
permeability data from turbidite deposits in
Sembar Formation of both the Middle Indus
and Lower Indus Basins. The depth-
threshold for reservoir cut-off is only loosely
defined. During this process, it should also
be considered that the Sembar Formation
could be over-pressured as it is buried
within the gas window. This attribute will
allow porosities and fluid flow to be higher
than anticipated.
► High resolution sequence stratigraphic
interpretation of the Sembar Formations is
required to better observe the geometries of
potential turbidites and the likely location of
stratigraphic pinch-out. An attempt can also
be made to define a range of analogue
models for comparable turbidite basins that
are developed on continental crust from
other parts of the World.](https://image.slidesharecdn.com/unprovenplaysinmib-251113102159-a6b7667a/75/Unproven-Plays-A-Sand-in-Middle-Indus-Basin-3-2048.jpg)
![5
additional reservoir studies and sequence
stratigraphic interpretation needs to be carried
out in detail.
5. Conclusions and Recommendations
After seismic sequence stratigraphic analysis of
early to mid-Cretaceous intervals in Middle
Indus Basin, Pakistan, it is concluded and
recommended that:
1. K70 to K100 sequence stratigraphic
intervals, containing most of the fields in
Middle Indus Basin. Only limited potential
for significant petroleum accumulations
occur to the west of the current fields.
2. K40 to K60 sequence stratigraphic intervals
are under-explored and un-proven. So next
steep leg in the creaming curve of Lower
Goru can be expected from plays within
these intervals, which might add significant
reserves.
3. The K50 or K60 turbidite sandstones play
occurs within, or near to the base, of the
Sembar Formation and as a consequence,
reservoir effectiveness represents an
intermediate risk due to depth of burial.
Regional development of these sandstones
has yet to be reasonably demonstrated.
Further information, reservoir presence is
considered an uncertain but intermediate
risk.
4. The K60 Lowstand Delta Play is limited by
reservoir presence with the notable addition
of a top seal risk. Reservoir presence
improves to the east, whilst top-seal
development improves in the opposite
direction.
5. K60 Lowstand Wedge has significant
thickness in the mid-western part of the
study area. It poses a very attractive
exploration opportunity and needs more
work at prospect level.
6. High resolution seismic sequence
stratigraphic interpretation is required in
order to properly delineate unproven plays
at prospect scale.
6. References
[1] Afzal, J., Kuffner, T., Rahman, A., Ibrahim,
M [2009]. Seismic and well-log based sequence
stratigraphy of the early Cretaceous, Lower
Goru “C” sand of the Sawan gas field, Middle
Indus Platform, Pakistan. AAPG Search and
Discovery Article # 90139.
[2] Ahmad, N, Fink, P., Sturrock, S., Mahmood,
T and Ibrahim, M [2004]. Sequence
stratigraphy as a predictive tool in Lower Goru
Fairway, Lower and Middle Indus Platform,
Pakistan. AAPG Search and Discovery Article
#10404
[3] Ahmed, A.R. and Ibrahim, M [2008]. 3D
modeling of reservoir classes using seismic
acoustic impedance data. AAPG Search and
Discovery Article # 90151.
[4] Ajdukiewicz, J.M and Lander, R.H [2010].
Sandstone reservoir quality prediction: The
state of the art. AAPG Bulletin, v. 94, no. 8
(August 2010), p.1083-1091.
[5] Daud, F., Khan, G.N., Ibrahim, M [2011].
Remaining hydrocarbon potential in Pakistan.
A statistical review. AAPG Search and
Discovery Article # 90138.
[6] Davies, R.B., Casey, D.M., Horbury, A.D.,
Sharland, P.R and Simmons M.D. [2002]. Early
to mid-Cretaceous mixed carbonate-clastic
shelfal systems: examples, issues and models
from the Arabian Plate. GeoArabia, v. 7, no. 3,
p.541-598.
[7] Gradstein, F.M. and Ogg J.G [2004].
Geologic Time Scale 2004 – why, how, and
where next! Lethaia, v. 37, p. 175-181.
[8] Gradstein, F.M., Ogg, J.G. and Smith, A.G.
(Eds.) [2004]. Geologic Time Scale 2004.
Cambridge University Press, p.500.](https://image.slidesharecdn.com/unprovenplaysinmib-251113102159-a6b7667a/75/Unproven-Plays-A-Sand-in-Middle-Indus-Basin-5-2048.jpg)
![6
[9] I.E.D.S., [1995], a sequence stratigraphic
study of the Lower Goru – Sembar formations
of Lower and Middle Indus Basins of Pakistan
and Rajasthan: Multiclient Study.
[10] Ibrahim, M [2007]. Seismic inversion data,
a tool for reservoir characterization/modeling
Sawan gas field – A case study. AAPG Search
and Discovery Article # 90140.
[11] Iqbal, M, Nazeer, A., Ahmad, H and
Murtaza, G [2012]. Hydrocarbon exploration
perspective in Middle Jurassic-Early
Cretaceous reservoirs in the Sulaiman Fold
Belt, Pakistan. AAPG Search and Discovery
Article #10394.
[12] Krois, P., Mahmood, T and Milan, G
[1998]. Miano field, Pakistan, A case history of
model driven exploration. AAPG Search and
Discovery Article # 90145.
[13] OMV internal, Basin Analysis Study –
Unpublished.
[14] Pyles, D.R and Slatt, R.M [2008].
Stratigraphy of the Lewis shale, Wyoming,
USA: Application to understanding shelf-edge
to base-of-slope changes in stratigraphic
architecture of prograding basin margins. The
American Association of Petroleum Geologists –
Studies in Geology 56, p.485-489.
[15] Rahman, A and Ibrahim, M [2009].
Uncertainty analysis in the Sawan static
reservoir model and optimization of facies using
neural network technology. AAPG Search and
Discovery Article # 90139.
[16] Raza, H.A., Ahmed, R., Ali, S.M., Sheikh,
A.M., and Shafique, N.A. [1989]. Exploration
performance in sedimentary zones of Pakistan.
Pakistan Journal of Hydrocarbon Research
v.1(1): p.1-7.
[17] Reynolds, M. W., 1976, Influence of
recurrent Laramide structural growth on
sedimentation and petroleum accumulation,
Lost Soldier Area, Wyoming: AAPG Bulletin, v.
60, p. 12-33.
[18] Sharland, P.R., Archer, R., Casey, D.M.,
Davies, R.B., Hall, S.H., Heward, A.P.,
Horbury, A.D and Simmons M.D. [2001].
Arabian Plate Sequence Stratigraphy.
GeoArabia Special Publication 2, Gulf
PetroLink, Bahrain, p.371.
[19] Sharland, P.R., Casey, D.M., Davies, R.B.,
Simmons, M.D and Sutcliffe, O.E [2004].
Arabian Plate Sequence Stratigraphy –
revisions to SP2. GeoArabia, v. 9, no. 1, p. 199-
214.
[20] Simmons, M.D., Sharland, P.R., Casey,
D.M., Davies, R.B., Sutcliffe, O.E [2007].
Arabian Plate sequence stratigraphy: Potential
implications for global chronostratigraphy.
GeoArabia, v. 12, no. 4, p.101-104.
[21] Snedden, J.W., Sarg, J.F and Ying, X
[2003]. Exploration play analysis from a
sequence stratigraphic perspective: AAPG
Search and Discovery Article #40079.
[22] Sultan, S and Ilyas, A [2010]. New
stratigraphic play identified in the lower
Cretaceous sequence of Middle Indus Basin,
Pakistan. AAPG Search and Discovery Articcle
# 90120](https://image.slidesharecdn.com/unprovenplaysinmib-251113102159-a6b7667a/75/Unproven-Plays-A-Sand-in-Middle-Indus-Basin-6-2048.jpg)
![7
Figure-1. Structural Setting of Middle Indus Basin, Pakistan
Figure-2. Sequence stratigraphy and play summary chart of the Sembar and Lower Goru
sequences, along with the stratigraphic nomenclature used in the industry [2]
Study Area](https://image.slidesharecdn.com/unprovenplaysinmib-251113102159-a6b7667a/75/Unproven-Plays-A-Sand-in-Middle-Indus-Basin-7-2048.jpg)
![8
Figure-3. Creaming curve for Middle Indus Basin. Each hash represents number of exploration
wells drilled [5]
Middle Indus Basin - Creaming Curve
0.00
500.00
1000.00
1500.00
2000.00
2500.00
3000.00
3500.00
1925
1928
1931
1934
1937
1940
1943
1946
1949
1952
1955
1958
1961
1964
1967
1970
1973
1976
1979
1982
1985
1988
1991
1994
1997
2000
2003
2006
2009
Cummulative
Mari
Kandhkot
Kadanwari
Qadirpur
Kandra
Miano
Block 22 SML discoveries
Mari Deep
Sawan
L. Goru & SML discoveries
Major discoveries in Tertiary Carbonates
Lower Goru Sandstone discoveries
Limited seismic coverage,
discovered on highs
Dense seismic, stratigraphic
and combination traps,
Reserves
-
MMBOE
Middle Indus Basin - Creaming Curve
0.00
500.00
1000.00
1500.00
2000.00
2500.00
3000.00
3500.00
1925
1928
1931
1934
1937
1940
1943
1946
1949
1952
1955
1958
1961
1964
1967
1970
1973
1976
1979
1982
1985
1988
1991
1994
1997
2000
2003
2006
2009
Cummulative
Mari
Kandhkot
Kadanwari
Qadirpur
Kandra
Miano
Block 22 SML discoveries
Mari Deep
Sawan
L. Goru & SML discoveries
Major discoveries in Tertiary Carbonates
Lower Goru Sandstone discoveries
Limited seismic coverage,
discovered on highs
Dense seismic, stratigraphic
and combination traps,
Reserves
-
MMBOE](https://image.slidesharecdn.com/unprovenplaysinmib-251113102159-a6b7667a/75/Unproven-Plays-A-Sand-in-Middle-Indus-Basin-8-2048.jpg)
![10
Figure-5. Geological Time Scale 2004 [7] & [8]. The Arabian Plate Sequence Stratigraphic
Model [18] & [19] is plotted against this timescale](https://image.slidesharecdn.com/unprovenplaysinmib-251113102159-a6b7667a/75/Unproven-Plays-A-Sand-in-Middle-Indus-Basin-10-2048.jpg)
![11
Figure-6. Nomenclature used by different Operators and Regional studies in the Study Area.
Comparison with Global Sequence Stratigraphic Scheme proposed by [9] & [18].](https://image.slidesharecdn.com/unprovenplaysinmib-251113102159-a6b7667a/75/Unproven-Plays-A-Sand-in-Middle-Indus-Basin-11-2048.jpg)
![14
Figure-9. Regional dip-oriented stratigraphic cross section of the Lewis Shale and adjacent
formations, [14] & [17].](https://image.slidesharecdn.com/unprovenplaysinmib-251113102159-a6b7667a/75/Unproven-Plays-A-Sand-in-Middle-Indus-Basin-14-2048.jpg)
![16
Figure-11. Porosity-depth trends. Shown is a modeled porosity evolution with burial for well-sorted,
fine-grained, quartzo-feldspathic (rigid-grained) sandstone with variable grain coats formed near the
surface [4]](https://image.slidesharecdn.com/unprovenplaysinmib-251113102159-a6b7667a/75/Unproven-Plays-A-Sand-in-Middle-Indus-Basin-16-2048.jpg)
![1
PAPG – SPE ATC 2014
Un-Proven Plays in Middle Indus Basin
Kamran Aziz (Kamran.Aziz@omv.com), Aamir Rasheed (Aamir.Rasheed@omv.com), Adnan Zaidi
(Syed_Adnan.Zaidi@omv.com) & Adil Azeem (Adil.Azeem@omv.com)
OMV (Pakistan) Exploration GmbH OMV (Pakistan) Exploration GmbH
Abstract
The recent integrated regional sequence
stratigraphic study confirmed the long-known
interpretation of the early to mid-Cretaceous
successions as representing a transition from
shallow to deep marine rocks during the
progradation of sedimentary wedges. During
deposition, the effects of the Kandra palaeo-
high were significant with deposits effectively
ponding against it as progradation continued to
infill accommodation. The main gas fields in
this succession are developed in the shallow-
marine sands at the top of this wedge. The
basinal turbidite sandstones and/or lowstand
delta sands have the potential to provide
underexplored or new exploration
opportunities. Deposition under different 3rd
order cycles of sea-level change had a profound
influence on the regional development of
reservoirs with the main fields occurring in
transgressive/regressive sandstones sealed by
the overlying shales.
This study revealed that sub-regional variations
in subsidence occurred across the Middle Indus
Basin and had significant influences on
sedimentation. This is represented by the
creation of smaller depo-centres that either (i)
created anomalous thicknesses of shallow-
marine rocks or (ii) created deeper basins
containing locally preserved turbidites. It is
highly likely that the majority of these fairways
are fully exploited with the potential for
significant petroleum accumulations (to the west
of the current fields) being extremely limited.
Therefore, it is anticipated that any new
reserves in the Middle Indus Basin will be
represented in unproven plays.
These unproven plays include turbidites &
Lowstand deposits. The turbidites occur within
or near to the base of the Sembar Formation
and as a consequence, reservoir effectiveness
represents an intermediate risk due to depth of
burial. In addition to this, due to the limited
number of well-penetrations, the regional
development of these sandstones is yet to be
demonstrated.
Based on the evaluation of Cretaceous gas plays
in the Middle Indus Basin, it is recommended
that less time is devoted to exploring the
established play as these less likely to have a
significant lateral extent to the west. In
contrast, some of the deeper plays may have
untapped potential e.g. turbidites and low sand
deposits. These require more work to reduce
the risk associated with them.
1. Introduction:
Objective of this article is to highlight the
importance of the unproven plays in the future
exploration strategy of the Middle Indus Basin.
The Middle Indus Basin lies in the Southern
Pakistan on the northern side of Lower Indus
Basin from the flanks of Jaccobabad –
Khairpur high to the Flanks of Mari –
Kandhkot high. In general, the study area
comprises a relatively steeper south easterly
dipping monocline on the eastern flank of
Jaccobabad – Khairpur high (Figure-1)
intersected by intra-basinal highs and lows [16].
As previously cited by [2], Early to Mid-
Cretaceous sandstone bodies are interpreted to
be deposited in a depositional environment
representing a transition from deep to shallow
marine rocks (Figure-2). The main gas fields in
this succession are developed in the shallow-
marine sandstone. The basinal turbidite
sandstones and/or lowstand delta sands have the
potential to provide underexplored or new
exploration opportunities. By examination of
the creaming curve of Middle Indus Basin
(Figure-3) it is observed that Lower Goru play
has some terraces and steep legs [5]. Two
conclusions can be made by comparison of this
creaming curve with the world’s mature basins,
keeping in view the sequence stratigraphic
framework;
1) Initial exploration has focused on TST and
HST (with exception of Sawan field, which
is a lowstand shelf-edge delta system) [1].](https://crownmelresort.com/image.slidesharecdn.com/unprovenplaysinmib-251113102159-a6b7667a/75/Unproven-Plays-A-Sand-in-Middle-Indus-Basin-1-2048.jpg)
![2
2) Existing plays have limited or very limited
reserves and next steep leg would come
from a new play. This analysis has some
similarities with the concept that,
discoveries in Lowstand system tract usually
sit on the last steep leg of the creaming
curve [21].
2. Petroleum System:
Sembar is considered to be the primary
petroleum source rock for most of the Lower
and Middle Indus Basins. Early to Peak Gas
maturation of Sembar-Lower Goru Petroleum
System in Middle Indus Basin is from Late
Cretaceous to Paleocene [12]. Hydrocarbon
charge is considered low risk in the area due to
the widespread development of mature source
rock (Sembar Formation). Vertical migration
dominates above the main gas window. To the
West of the Middle Indus Basin, longer distance
migration is required, which increases the
exploration risk (Figure-4).
3. Sequence Stratigraphy:
Sequence Stratigraphic scheme and
nomenclature used in this framework is based
upon the recognition of third order sequences
(1-3 Ma) across Arabian Plate in 2001 and 2004
(Figure-5) [6], [18], [19], [20]. This includes
studies in the clastic succession of the Black Sea,
mixed carbonate clastics of the Eastern
Mediterranean and the carbonates of Abu
Dhabi. This scheme focuses on the recognition
of Maximum Flooding Surfaces (MFS) and
Sequence Boundaries (SB) which are
demonstrated to occur in other parts of the
globe, correlated at biozone level (Resolution ~
500,000 years, although variable). This scheme
is then correlated with the lithostratigraphic
units and their nomenclature, which has been
conventionally used by different operators in
the study area (Figure-6).
OMV conventionally subdivides the Lower
Goru Formation into 4 intervals; from bottom
to top these are the A, B, C, and D Intervals.
These contain the main hydrocarbon producing
sandstone reservoir units from, and explored
for, across the Middle Indus Basin. At the top of
each Interval there is a regionally extensive
flooding surface recognized in well and seismic
data. This attribute allows the easy integration
of this scheme with a sequence stratigraphic
model.
Using the sequence stratigraphic model
described by [18], it was possible to subdivide
the early and middle Cretaceous rocks into
sequences deposited during different cycles of
sea-level change. In this instance, unlike other
studies in the Middle Indus Basin, this study
defines the base of a sequence at a sequence
boundary (Figure-7) rather than a maximum
flooding surface.
Clastic successions of the Sembar and Lower
Goru formations rest unconformably on the
carbonates of the Chiltan Formation. The top
of this limestone forms a prominent seismic
marker in the basin and is considered to
represent a subaerial unconformity [11]. This
Limestone is taken as acoustic marker in order
to better understand the sequence stratigraphic
relationships of the overlying stratigraphic
intervals.
Sembar Formation marks the onset of the
sedimentation in a deep basin; refer to the
height of the clinoforms on seismic cross-section
(Figure-8). High sedimentation rates resulted in
the progressive infill of this basin by large
prograding wedges of sediment that included
turbidites deposited in basin floor fan and/or
lower slope settings (Figure-8). Generally the
sediment input direction is from eastern side
(Indian Craton) of the study area. These
sandstones in the Sembar Formation represent
additional exploration targets. As
sedimentation progressed, the deposition of the
A Interval represents a transition from an
under- to an overfilled state. In general, the A-
D Intervals are dominated by shallow-marine to
paralic successions. During deposition, local
tectonism and eustasy had a profound influence
on deposition.
Two distinctive patterns in the strata lying
above Chiltan limestone can be observed
(Figure-8).](https://crownmelresort.com/image.slidesharecdn.com/unprovenplaysinmib-251113102159-a6b7667a/75/Unproven-Plays-A-Sand-in-Middle-Indus-Basin-2-2048.jpg)
![3
1 - Prograding Wedges, encompassing K40 to
K60 Sequences shows that the basin was under
filled at the time. These prograding clinoforms
would be expected to have basin floor fan and
lowstand delta top. An analogue for these rocks
is the Lewis Shale of the USA, which contains
both basin-floor fan, delta top and shales gas
resources within it (Figure-9) [14].
Traditionally, work on these plays has not been
extensive and currently no fields are producing
from these plays. This article will highlight the
mechanism and potential of these plays.
2- Parallel to sub-parallel reflectors,
encompassing K70 to K100 sequences,
representing shallow marine environment
across the basin. Plays in these intervals have
been extensively worked upon by different
operators in the area especially by OMV [1], [2],
[3], [10], [12], [15], & [22].
4. Unproven Plays:-
a. Sembar Turbidite K50 and K60 LST
Plays
No fields in Middle Indus Basin are currently
recognized in this play but is noted that shows
do occur in many of the reservoir sandstones.
The petroleum system elements for this play are
(Figure-6 & 10):
► Reservoirs: K50/K60 LST turbidite
sandstones
► Top seal: K50/60 LST slope shales
► Bottom seal: K50/60 LST slope shales, and
► Charge: Sembar Formation.
One of the main issues with this play is
uncertainty due to the limited number of well
penetrations in Middle Indus Basin. It is also
likely that some of the turbidite sandstones in
this play are buried to a sufficient depth,
indicating an intermediate reservoir
effectiveness risk for them. If the reservoir is
buried below 3000m overburden, in such a
scenario, early chlorite coating of the sandstone
reservoir becomes very crucial. Referring to
Figure-11, after point “B” which is the onset of
chemical compaction; quartz cementation takes
place; it would significantly hamper the
porosity of sandstone reservoirs [4]. In this
situation, either early chlorite coating is
essential or the grains should be sufficiently
rigid to hold the porosity framework, such that
the porosity trend would likely follow trend
“D”. Also a contributing factor to inhibit
porosity reduction can be early hydrocarbon
charge. Due to this pore-pressure inhibits the
chemical compaction which in turn is very
critical for porosity preservation in siliciclastic
sedimentary rocks.
The sandstones of this play will occur in slope or
base of slope successions and are unlikely to
occur on the Jacobad-Khairpur paleo-high
(Figure-8). The risks associated with this play
will only be reduced through the collation of
additional data. This would include well or
high-resolution seismic data that can better
define reservoir presence at depth.
Future Additional Work for Play
Evaluation
► Additional penetration in the play would be
very critical, effectively providing porosity-
permeability data from turbidite deposits in
Sembar Formation of both the Middle Indus
and Lower Indus Basins. The depth-
threshold for reservoir cut-off is only loosely
defined. During this process, it should also
be considered that the Sembar Formation
could be over-pressured as it is buried
within the gas window. This attribute will
allow porosities and fluid flow to be higher
than anticipated.
► High resolution sequence stratigraphic
interpretation of the Sembar Formations is
required to better observe the geometries of
potential turbidites and the likely location of
stratigraphic pinch-out. An attempt can also
be made to define a range of analogue
models for comparable turbidite basins that
are developed on continental crust from
other parts of the World.](https://crownmelresort.com/image.slidesharecdn.com/unprovenplaysinmib-251113102159-a6b7667a/75/Unproven-Plays-A-Sand-in-Middle-Indus-Basin-3-2048.jpg)

![5
additional reservoir studies and sequence
stratigraphic interpretation needs to be carried
out in detail.
5. Conclusions and Recommendations
After seismic sequence stratigraphic analysis of
early to mid-Cretaceous intervals in Middle
Indus Basin, Pakistan, it is concluded and
recommended that:
1. K70 to K100 sequence stratigraphic
intervals, containing most of the fields in
Middle Indus Basin. Only limited potential
for significant petroleum accumulations
occur to the west of the current fields.
2. K40 to K60 sequence stratigraphic intervals
are under-explored and un-proven. So next
steep leg in the creaming curve of Lower
Goru can be expected from plays within
these intervals, which might add significant
reserves.
3. The K50 or K60 turbidite sandstones play
occurs within, or near to the base, of the
Sembar Formation and as a consequence,
reservoir effectiveness represents an
intermediate risk due to depth of burial.
Regional development of these sandstones
has yet to be reasonably demonstrated.
Further information, reservoir presence is
considered an uncertain but intermediate
risk.
4. The K60 Lowstand Delta Play is limited by
reservoir presence with the notable addition
of a top seal risk. Reservoir presence
improves to the east, whilst top-seal
development improves in the opposite
direction.
5. K60 Lowstand Wedge has significant
thickness in the mid-western part of the
study area. It poses a very attractive
exploration opportunity and needs more
work at prospect level.
6. High resolution seismic sequence
stratigraphic interpretation is required in
order to properly delineate unproven plays
at prospect scale.
6. References
[1] Afzal, J., Kuffner, T., Rahman, A., Ibrahim,
M [2009]. Seismic and well-log based sequence
stratigraphy of the early Cretaceous, Lower
Goru “C” sand of the Sawan gas field, Middle
Indus Platform, Pakistan. AAPG Search and
Discovery Article # 90139.
[2] Ahmad, N, Fink, P., Sturrock, S., Mahmood,
T and Ibrahim, M [2004]. Sequence
stratigraphy as a predictive tool in Lower Goru
Fairway, Lower and Middle Indus Platform,
Pakistan. AAPG Search and Discovery Article
#10404
[3] Ahmed, A.R. and Ibrahim, M [2008]. 3D
modeling of reservoir classes using seismic
acoustic impedance data. AAPG Search and
Discovery Article # 90151.
[4] Ajdukiewicz, J.M and Lander, R.H [2010].
Sandstone reservoir quality prediction: The
state of the art. AAPG Bulletin, v. 94, no. 8
(August 2010), p.1083-1091.
[5] Daud, F., Khan, G.N., Ibrahim, M [2011].
Remaining hydrocarbon potential in Pakistan.
A statistical review. AAPG Search and
Discovery Article # 90138.
[6] Davies, R.B., Casey, D.M., Horbury, A.D.,
Sharland, P.R and Simmons M.D. [2002]. Early
to mid-Cretaceous mixed carbonate-clastic
shelfal systems: examples, issues and models
from the Arabian Plate. GeoArabia, v. 7, no. 3,
p.541-598.
[7] Gradstein, F.M. and Ogg J.G [2004].
Geologic Time Scale 2004 – why, how, and
where next! Lethaia, v. 37, p. 175-181.
[8] Gradstein, F.M., Ogg, J.G. and Smith, A.G.
(Eds.) [2004]. Geologic Time Scale 2004.
Cambridge University Press, p.500.](https://crownmelresort.com/image.slidesharecdn.com/unprovenplaysinmib-251113102159-a6b7667a/75/Unproven-Plays-A-Sand-in-Middle-Indus-Basin-5-2048.jpg)
![6
[9] I.E.D.S., [1995], a sequence stratigraphic
study of the Lower Goru – Sembar formations
of Lower and Middle Indus Basins of Pakistan
and Rajasthan: Multiclient Study.
[10] Ibrahim, M [2007]. Seismic inversion data,
a tool for reservoir characterization/modeling
Sawan gas field – A case study. AAPG Search
and Discovery Article # 90140.
[11] Iqbal, M, Nazeer, A., Ahmad, H and
Murtaza, G [2012]. Hydrocarbon exploration
perspective in Middle Jurassic-Early
Cretaceous reservoirs in the Sulaiman Fold
Belt, Pakistan. AAPG Search and Discovery
Article #10394.
[12] Krois, P., Mahmood, T and Milan, G
[1998]. Miano field, Pakistan, A case history of
model driven exploration. AAPG Search and
Discovery Article # 90145.
[13] OMV internal, Basin Analysis Study –
Unpublished.
[14] Pyles, D.R and Slatt, R.M [2008].
Stratigraphy of the Lewis shale, Wyoming,
USA: Application to understanding shelf-edge
to base-of-slope changes in stratigraphic
architecture of prograding basin margins. The
American Association of Petroleum Geologists –
Studies in Geology 56, p.485-489.
[15] Rahman, A and Ibrahim, M [2009].
Uncertainty analysis in the Sawan static
reservoir model and optimization of facies using
neural network technology. AAPG Search and
Discovery Article # 90139.
[16] Raza, H.A., Ahmed, R., Ali, S.M., Sheikh,
A.M., and Shafique, N.A. [1989]. Exploration
performance in sedimentary zones of Pakistan.
Pakistan Journal of Hydrocarbon Research
v.1(1): p.1-7.
[17] Reynolds, M. W., 1976, Influence of
recurrent Laramide structural growth on
sedimentation and petroleum accumulation,
Lost Soldier Area, Wyoming: AAPG Bulletin, v.
60, p. 12-33.
[18] Sharland, P.R., Archer, R., Casey, D.M.,
Davies, R.B., Hall, S.H., Heward, A.P.,
Horbury, A.D and Simmons M.D. [2001].
Arabian Plate Sequence Stratigraphy.
GeoArabia Special Publication 2, Gulf
PetroLink, Bahrain, p.371.
[19] Sharland, P.R., Casey, D.M., Davies, R.B.,
Simmons, M.D and Sutcliffe, O.E [2004].
Arabian Plate Sequence Stratigraphy –
revisions to SP2. GeoArabia, v. 9, no. 1, p. 199-
214.
[20] Simmons, M.D., Sharland, P.R., Casey,
D.M., Davies, R.B., Sutcliffe, O.E [2007].
Arabian Plate sequence stratigraphy: Potential
implications for global chronostratigraphy.
GeoArabia, v. 12, no. 4, p.101-104.
[21] Snedden, J.W., Sarg, J.F and Ying, X
[2003]. Exploration play analysis from a
sequence stratigraphic perspective: AAPG
Search and Discovery Article #40079.
[22] Sultan, S and Ilyas, A [2010]. New
stratigraphic play identified in the lower
Cretaceous sequence of Middle Indus Basin,
Pakistan. AAPG Search and Discovery Articcle
# 90120](https://crownmelresort.com/image.slidesharecdn.com/unprovenplaysinmib-251113102159-a6b7667a/75/Unproven-Plays-A-Sand-in-Middle-Indus-Basin-6-2048.jpg)
![7
Figure-1. Structural Setting of Middle Indus Basin, Pakistan
Figure-2. Sequence stratigraphy and play summary chart of the Sembar and Lower Goru
sequences, along with the stratigraphic nomenclature used in the industry [2]
Study Area](https://crownmelresort.com/image.slidesharecdn.com/unprovenplaysinmib-251113102159-a6b7667a/75/Unproven-Plays-A-Sand-in-Middle-Indus-Basin-7-2048.jpg)
![8
Figure-3. Creaming curve for Middle Indus Basin. Each hash represents number of exploration
wells drilled [5]
Middle Indus Basin - Creaming Curve
0.00
500.00
1000.00
1500.00
2000.00
2500.00
3000.00
3500.00
1925
1928
1931
1934
1937
1940
1943
1946
1949
1952
1955
1958
1961
1964
1967
1970
1973
1976
1979
1982
1985
1988
1991
1994
1997
2000
2003
2006
2009
Cummulative
Mari
Kandhkot
Kadanwari
Qadirpur
Kandra
Miano
Block 22 SML discoveries
Mari Deep
Sawan
L. Goru & SML discoveries
Major discoveries in Tertiary Carbonates
Lower Goru Sandstone discoveries
Limited seismic coverage,
discovered on highs
Dense seismic, stratigraphic
and combination traps,
Reserves
-
MMBOE
Middle Indus Basin - Creaming Curve
0.00
500.00
1000.00
1500.00
2000.00
2500.00
3000.00
3500.00
1925
1928
1931
1934
1937
1940
1943
1946
1949
1952
1955
1958
1961
1964
1967
1970
1973
1976
1979
1982
1985
1988
1991
1994
1997
2000
2003
2006
2009
Cummulative
Mari
Kandhkot
Kadanwari
Qadirpur
Kandra
Miano
Block 22 SML discoveries
Mari Deep
Sawan
L. Goru & SML discoveries
Major discoveries in Tertiary Carbonates
Lower Goru Sandstone discoveries
Limited seismic coverage,
discovered on highs
Dense seismic, stratigraphic
and combination traps,
Reserves
-
MMBOE](https://crownmelresort.com/image.slidesharecdn.com/unprovenplaysinmib-251113102159-a6b7667a/75/Unproven-Plays-A-Sand-in-Middle-Indus-Basin-8-2048.jpg)

![10
Figure-5. Geological Time Scale 2004 [7] & [8]. The Arabian Plate Sequence Stratigraphic
Model [18] & [19] is plotted against this timescale](https://crownmelresort.com/image.slidesharecdn.com/unprovenplaysinmib-251113102159-a6b7667a/75/Unproven-Plays-A-Sand-in-Middle-Indus-Basin-10-2048.jpg)
![11
Figure-6. Nomenclature used by different Operators and Regional studies in the Study Area.
Comparison with Global Sequence Stratigraphic Scheme proposed by [9] & [18].](https://crownmelresort.com/image.slidesharecdn.com/unprovenplaysinmib-251113102159-a6b7667a/75/Unproven-Plays-A-Sand-in-Middle-Indus-Basin-11-2048.jpg)


![14
Figure-9. Regional dip-oriented stratigraphic cross section of the Lewis Shale and adjacent
formations, [14] & [17].](https://crownmelresort.com/image.slidesharecdn.com/unprovenplaysinmib-251113102159-a6b7667a/75/Unproven-Plays-A-Sand-in-Middle-Indus-Basin-14-2048.jpg)

![16
Figure-11. Porosity-depth trends. Shown is a modeled porosity evolution with burial for well-sorted,
fine-grained, quartzo-feldspathic (rigid-grained) sandstone with variable grain coats formed near the
surface [4]](https://crownmelresort.com/image.slidesharecdn.com/unprovenplaysinmib-251113102159-a6b7667a/75/Unproven-Plays-A-Sand-in-Middle-Indus-Basin-16-2048.jpg)


