Downloaded 14 times
![IJRET: International Journal of Research in Engineering and Technology ISSN: 2319-1163
__________________________________________________________________________________________
Volume: 02 Issue: 01 | Jan-2013, Available @ http://www.ijret.org 65
EFFECT OF MACHINING PARAMETERS ON SURFACE ROUGHNESS
FOR 6063 AL-TIC (5 & 10 %) METAL MATRIX COMPOSITE USING RSM
P. R. Patel1
, B. B. Patel2
, V. A. Patel3
1 Department of Mechanical Engineering, L. D. College of engineering, Ahmedabad, pragneshpatel27@yahoo.com
2 Department of Mechanical Engineering Sankalchand Patel college of Engg.Visnagar, bbpatel.mech@spcevng.ac.in
3 Department of Mechanical Engineering Sankalchand Patel college of EnggVisnagar, vapatel.mech@spcevng.ac.in
Abstract
Metal matrix Composites are new class of material which offers superior Properties over alloys. Problem associated with MMCs is
that they are very difficult to machine and quality of machining specially surface finish due to the hardness and abrasive nature of
Carbide particles. Characteristics of machined surfaces are known to influence the product performance significantly since they are
directly linked to the ability of the material to withstand stresses, temperature, friction and corrosion. This paper presents an
experimental work on the analysis of machined surface quality on 6063 Al/TiC metal matrix composites with PCD insert in hard
turning leading to Response surface methodology based model to predict the surface roughness.
Index Terms: Metal matrix composite, Surface Roughness, Response surface methodology.
-----------------------------------------------------------------------***-----------------------------------------------------------------------
1. INTRODUCTION
Increasing quantities of metal matrix composites (MMCs) are
being used to replace conventional materials in many
applications, especially in the automobile and recreational
industries. The most popular types of MMCs are aluminum
alloys reinforcing with ceramic particles. These low cost
composites provide higher strength, stiffness and fatigue
resistance with a minimal increase in density over the base
alloy [1]. Al–TiC belongs to the new generation of particulate
reinforced aluminium alloy based metal-matrix composites
(MMCs). Particle reinforced metal-matrix composites are
likely to find high commercial application due to their low
cost, ease of fabrication and improved properties. The
practical applications of Al–TiC metal-matrix composites are
in aerospace, automobile and structural industries [2]. A
continuing problem with MMCs is that they are difficult to
machine, due to the hardness and abrasive nature of the TiC or
other reinforcing particles. The particles used in MMCs are
harder than tungsten carbide (WC), the main constituent of
hard metal and even than most of the cutting tool materials.
Diamond is exception, for instance, which is approximately
three to four times harder than hard metal [3]. That’s why
PCD tool was used as wear resistive tool in order to achieve
desire surface finish.
Caroline J.E. Andrewes, Hsi-Yung Feng, W.M. Lau et al. [4]
were carried out to machine a DuralcanAL/SiC composite
using Kennametal's PCD and CVD diamond inserts. The
present results indicate that crater wear may not be a main
concern to the diamond inserts due to the very low coefficient
of friction and the high thermal conductivity of diamonds.
YanmingQuan, Bangyan Ye et al. [5] investigated the
hardness and residual stress of composites in the surface layer
affected by machining. The results indicate that the work
hardening and residual stress of composites in the machined
surface layer have some peculiarities. Mariam S. El-Gallab,
Mateusz P. Skladet al. [6] developed 3D thermo-mechanical
finite element model of the machined composite workpiece.
The model is used to predict the effect of the different cutting
parameters on the workpiece subsurface damage produced due
to machining. The modelpredicts high localized stresses in the
matrix material around the SiC reinforcement particles,
leading to matrix cracking. ShibenduShekhar Roy et al. [7]
design an expert system using two soft computing tools,
namely fuzzy logic and genetic algorithm, so that the surface
finish in ultra-precision diamond turning of metal matrix
composite can be modeled for set of given cutting parameters,
namely spindle speed, feed rate and depth of cut.
Ultra-precision turning tests on SiCp/2024Al and
SiCp/ZL101A composites were carried out to investigate the
surface quality using single point diamond tools (SPDT) and
polycrystalline diamond (PCD) cutters. Examined by SEM
and AFM, the machined surfaces took on many defects such
as pits, voids, micro cracks, grooves, protuberances, matrix
tearing and so on. It was found that cutting parameters, tool
material and geometries, particle reinforcement’ size and
distribution, reinforcement’ volume fraction and cooling
conditions all had a significant effect on the surface integrity
when ultra-precision turning [8]. N. Muthukrishnan, M.
Murugan& K. PrahladaRao et al. [9] presents the results of an
experimental investigation on the machinability of fabricated
aluminum metal matrix composite (A356/SiC/10p) during
continuous turning of composite rods using medium grade
polycrystalline diamond (PCD 1500) inserts. MMC’s are very
difficult to machine and PCD tools are considered by far, the](https://image.slidesharecdn.com/effectofmachiningparametersonsurfaceroughnessfor6063al-tic510metalmatrixcompositeusingrsm-140801004113-phpapp02/75/Effect-of-machining-parameters-on-surface-roughness-for-6063-al-tic-5-10-metal-matrix-composite-using-rsm-1-2048.jpg)
![IJRET: International Journal of Research in Engineering and Technology ISSN: 2319-1163
__________________________________________________________________________________________
Volume: 02 Issue: 01 | Jan-2013, Available @ http://www.ijret.org 66
best choice for the machining of these materials. A. Pramanik,
L. C. Zhang, J. A. Arsecularatne et al. [10] investigated
experimentally the effects of reinforcement particles on the
machining of MMCs. The major findings are: (a) the surface
residual stresses on the machined MMC are compressive; (b)
the surface roughness is controlled by feed; (c) particle pull-
out influences the roughness when feed is low; (d) particles
facilitate chip breaking and affect the generation of residual
stresses; and (e) the shear and friction angles depend
significantly on feed but are almost independent of speed.
Rajesh Kumar Bhushan&Sudhir Kumar & S. Das et al. [11]
investigated the influence of cutting speed, depth of cut, and
feed rate on surface roughness during machining of 7075 Al
alloy and 10 wt.% SiC particulate metal-matrix composites.
The experiments were conducted on a CNC Turning Machine
using tungsten carbide and polycrystalline diamond (PCD)
inserts. Surface roughness of 7075Al alloy with 10 wt.%SiC
composite during machining by tungsten carbide tool was
found to be lower than PCD.
Not much work to be done in the area of machinability of
composite materials particularly Al–TiC. MMCs in general are
difficult to machine (turning, milling, drilling, threading and
shaping) due to their hardness and abrasive nature of
reinforced particles. The objective of the present work is,
therefore, to evaluate the machining behaviour of these
composites (Al–TiC).
2. EXPERIMENTAL DETAILS
2.1 Workpiece and cutting tool
Table 1 physical and Mechanical properties of 6063Al-TiC
Properties Material
Al alloy 5
% TiC
Al alloy 10
% TiC
Density (Kg/m3) 2632 2734
Hardness (BHN) 95 113
Modulas Elasticity (Gpa) 77 82
Tensile Strength yield
strength (Mpa)
103 127
Tensile Strength Ultm
strength (Mpa)
140 152
% Elongation 3 1
The work material selected for the study was 6063 Al alloy 5
% TiC MMC and 6063 Al alloy 10% TiC MMC of cylinder
bars (36 mm Diameter and 200 mm length). Table 1 show the
physical and mechanical properties of 6063 Al alloy TiC. The
chemical composition of this material kept confidential.
The cutting tool selected for machining of Al-TiC Metal
matrix composites was polycrystalline diamond insert of fine
grade (2000), because it had been found that PCD tool is best
choice for machining of MMCs due to its high wear
resistance. The cutting tool used had PCD insert: ISO coding
DCMW 11T304. The Characteristics of insert are as follows:
Average particles Size - 10μm, Volume fraction of Diamond –
89 to 93 %, Transverse Rapture strength - 2.20 GPa, Knoop
hardness at 3 Kg load - 8378.5 kg/mm2
.
2.2 Experimental procedure
The cutting inserts were clamped on a right-hand tool holder
with ISO designation PCLNR 25×25 M12. The clamping of
the insert on the tool holder resulted in -60
rake angle, -60
clearance angle, and 930
approach angle. The turning tests on
the workpiece were conducted under dry conditions on an
Engine lathe having spindle power of 2 Kw.
The surface roughness of the machined samples was measured
with a surface roughness analyzer (Mitutoyo, surftest set no:
178-923e) with a cut-off length of 0.8mm over three sampling
lengths. The average value of surface roughness (Ra) was used
to quantify the roughness achieved on machined surfaces.
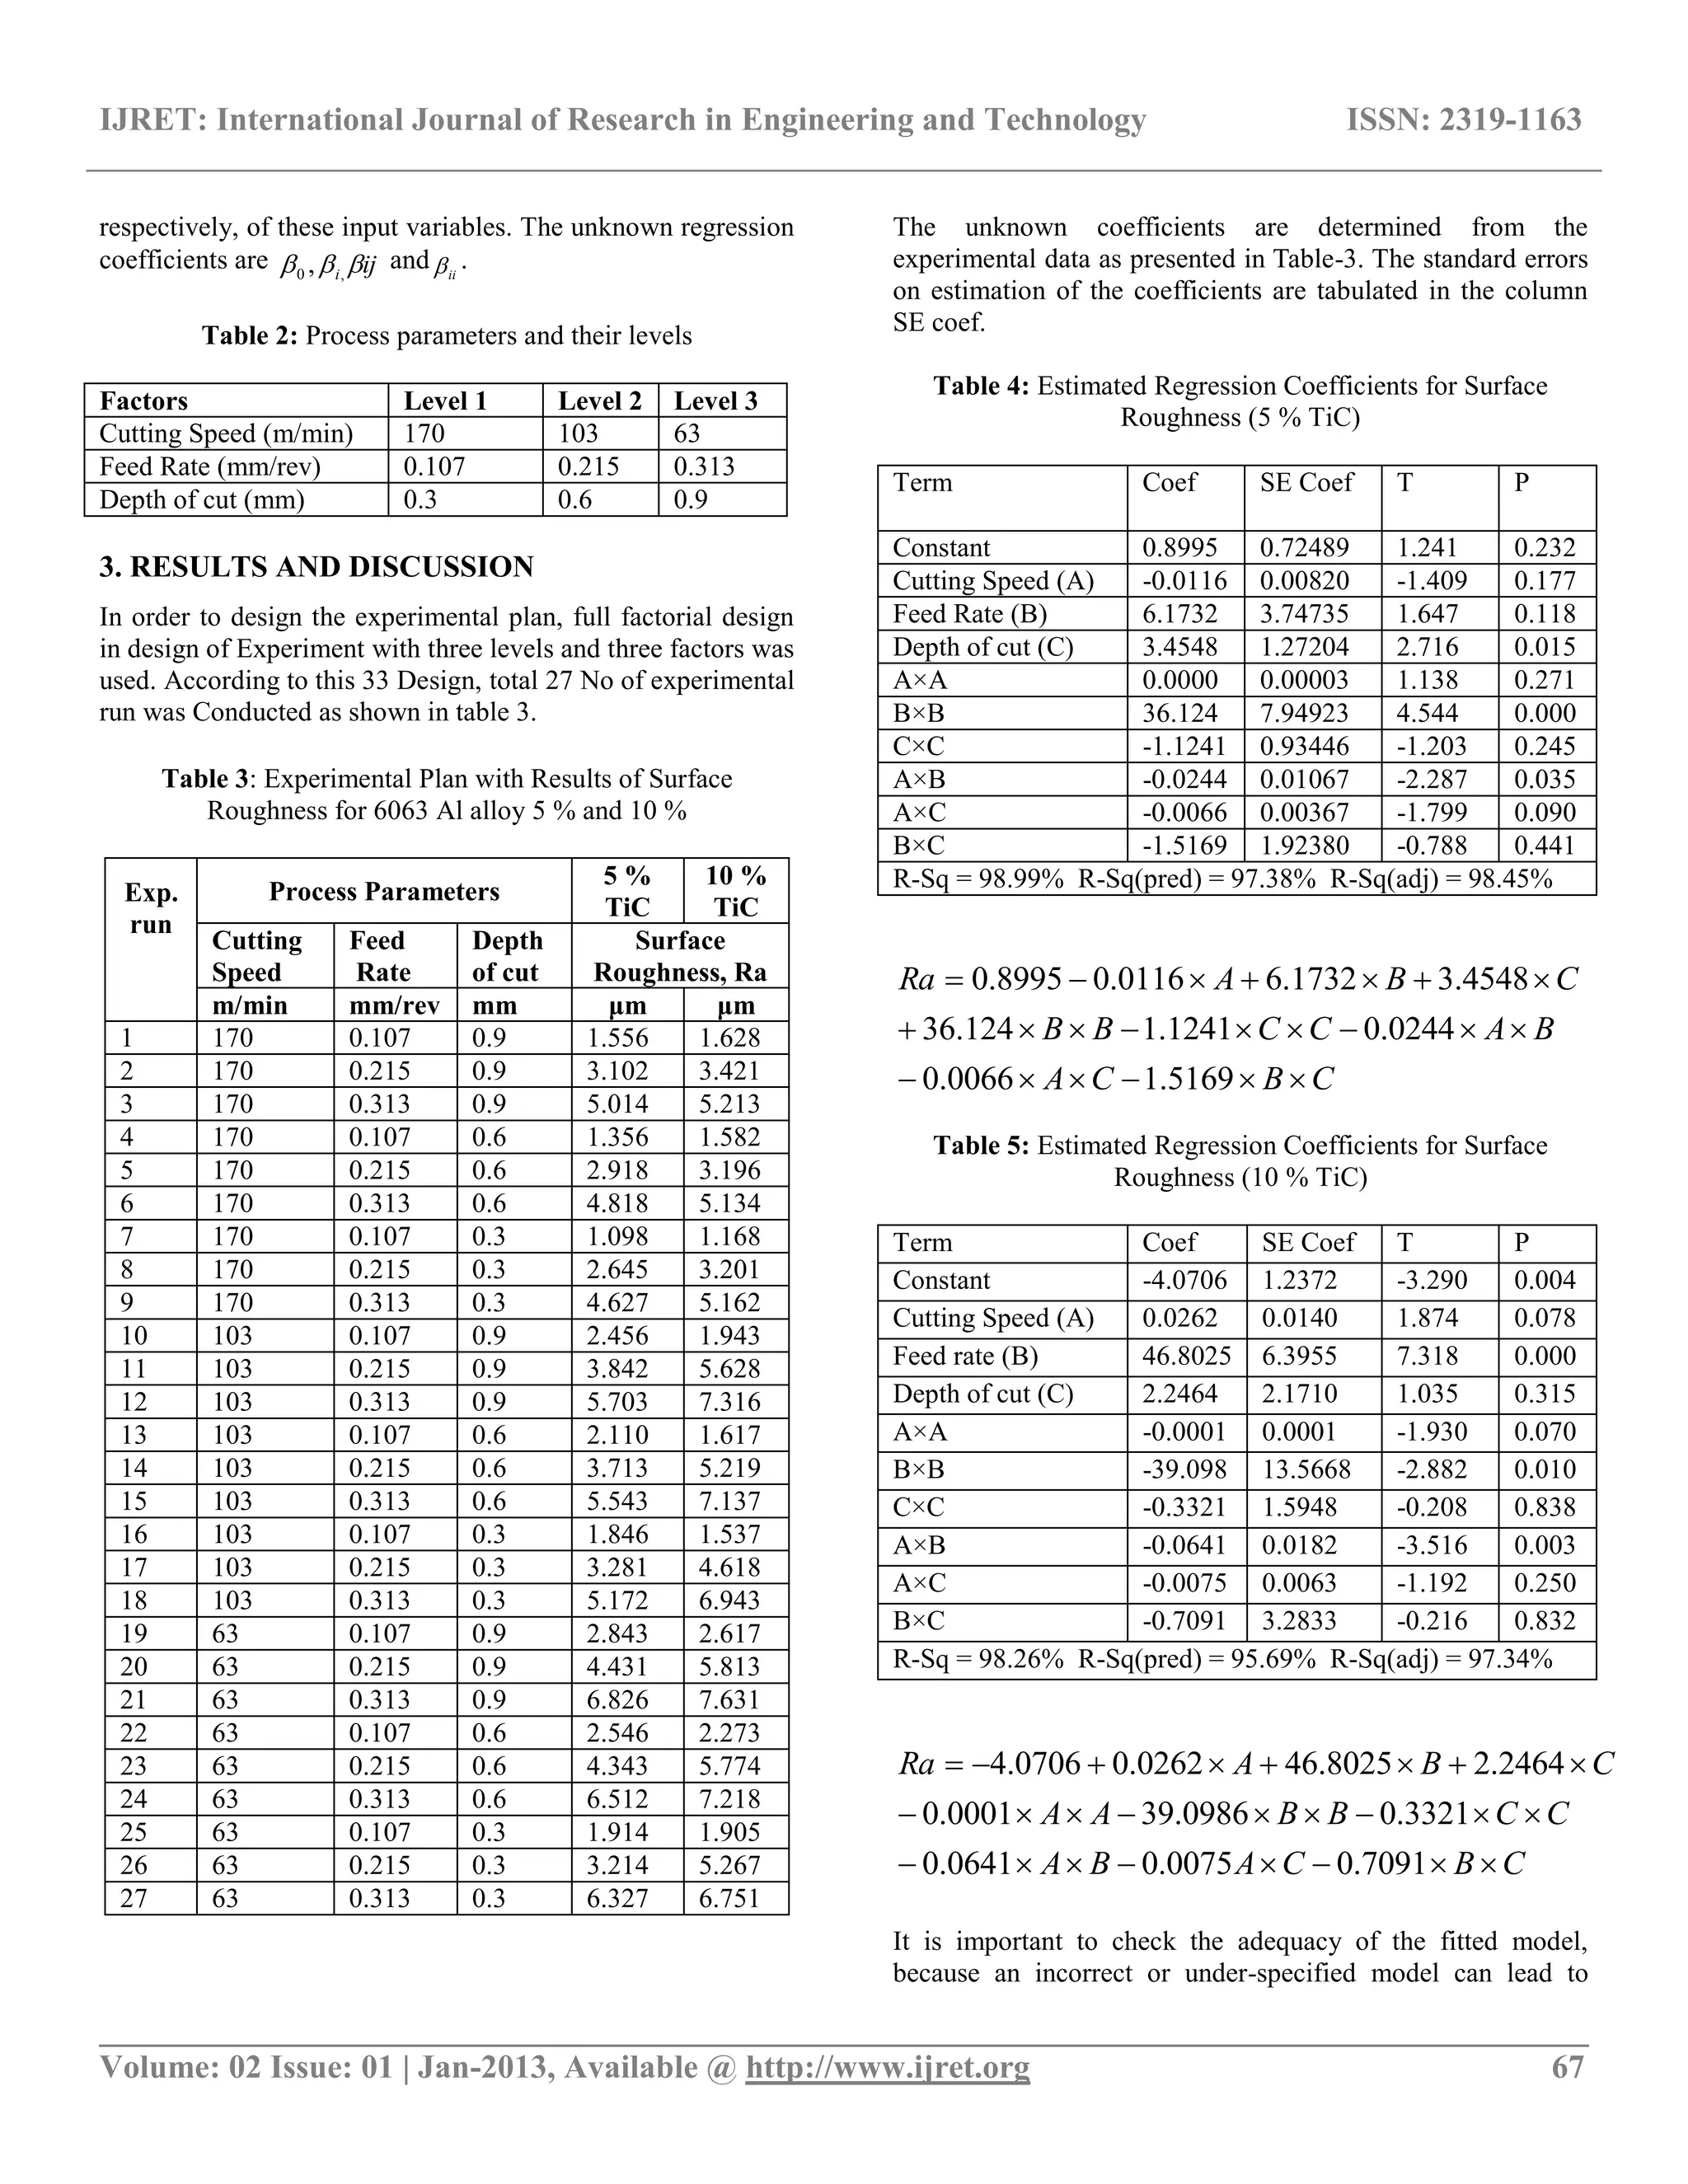
2.3 Design of experiments
In order to investigate the influence of machining conditions
on surface roughness - cutting speed, feed rate and depth of
cut were selected as the input parameters. The RSM was
employed to quantify the relationship between the individual
response factors and the input machining parameters of the
following form:
Y= f (A, B, C)
Where Y is the desired response and F is the response function
or response surface.
RSM is a collection of mathematical and statistical techniques
that are useful for modeling and analysis of problems in which
the response of interest is influenced by several variables and
objective is to optimize this response [12]. In order to design
the experimental plan, full factorial method was chosen to
determine the relationship between four operating variables
namely cutting speed, feed rate and depth of cut. In order to
study the effects of the EDM parameters on the above
mentioned machining criteria, second order polynomial
response surface mathematical models can be developed. In
the general case, the response surface is described by an
equation of the form:
k
i
k
i
r
ji
jiijiiiii xxxxY
1 1
2
2
2
0
Where Y is the corresponding response, ix is the input
variables, ixi
2
and ji xx are the squares and interaction terms,](https://image.slidesharecdn.com/effectofmachiningparametersonsurfaceroughnessfor6063al-tic510metalmatrixcompositeusingrsm-140801004113-phpapp02/75/Effect-of-machining-parameters-on-surface-roughness-for-6063-al-tic-5-10-metal-matrix-composite-using-rsm-2-2048.jpg)
![IJRET: International Journal of Research in Engineering and Technology ISSN: 2319-1163
__________________________________________________________________________________________
Volume: 02 Issue: 01 | Jan-2013, Available @ http://www.ijret.org 70
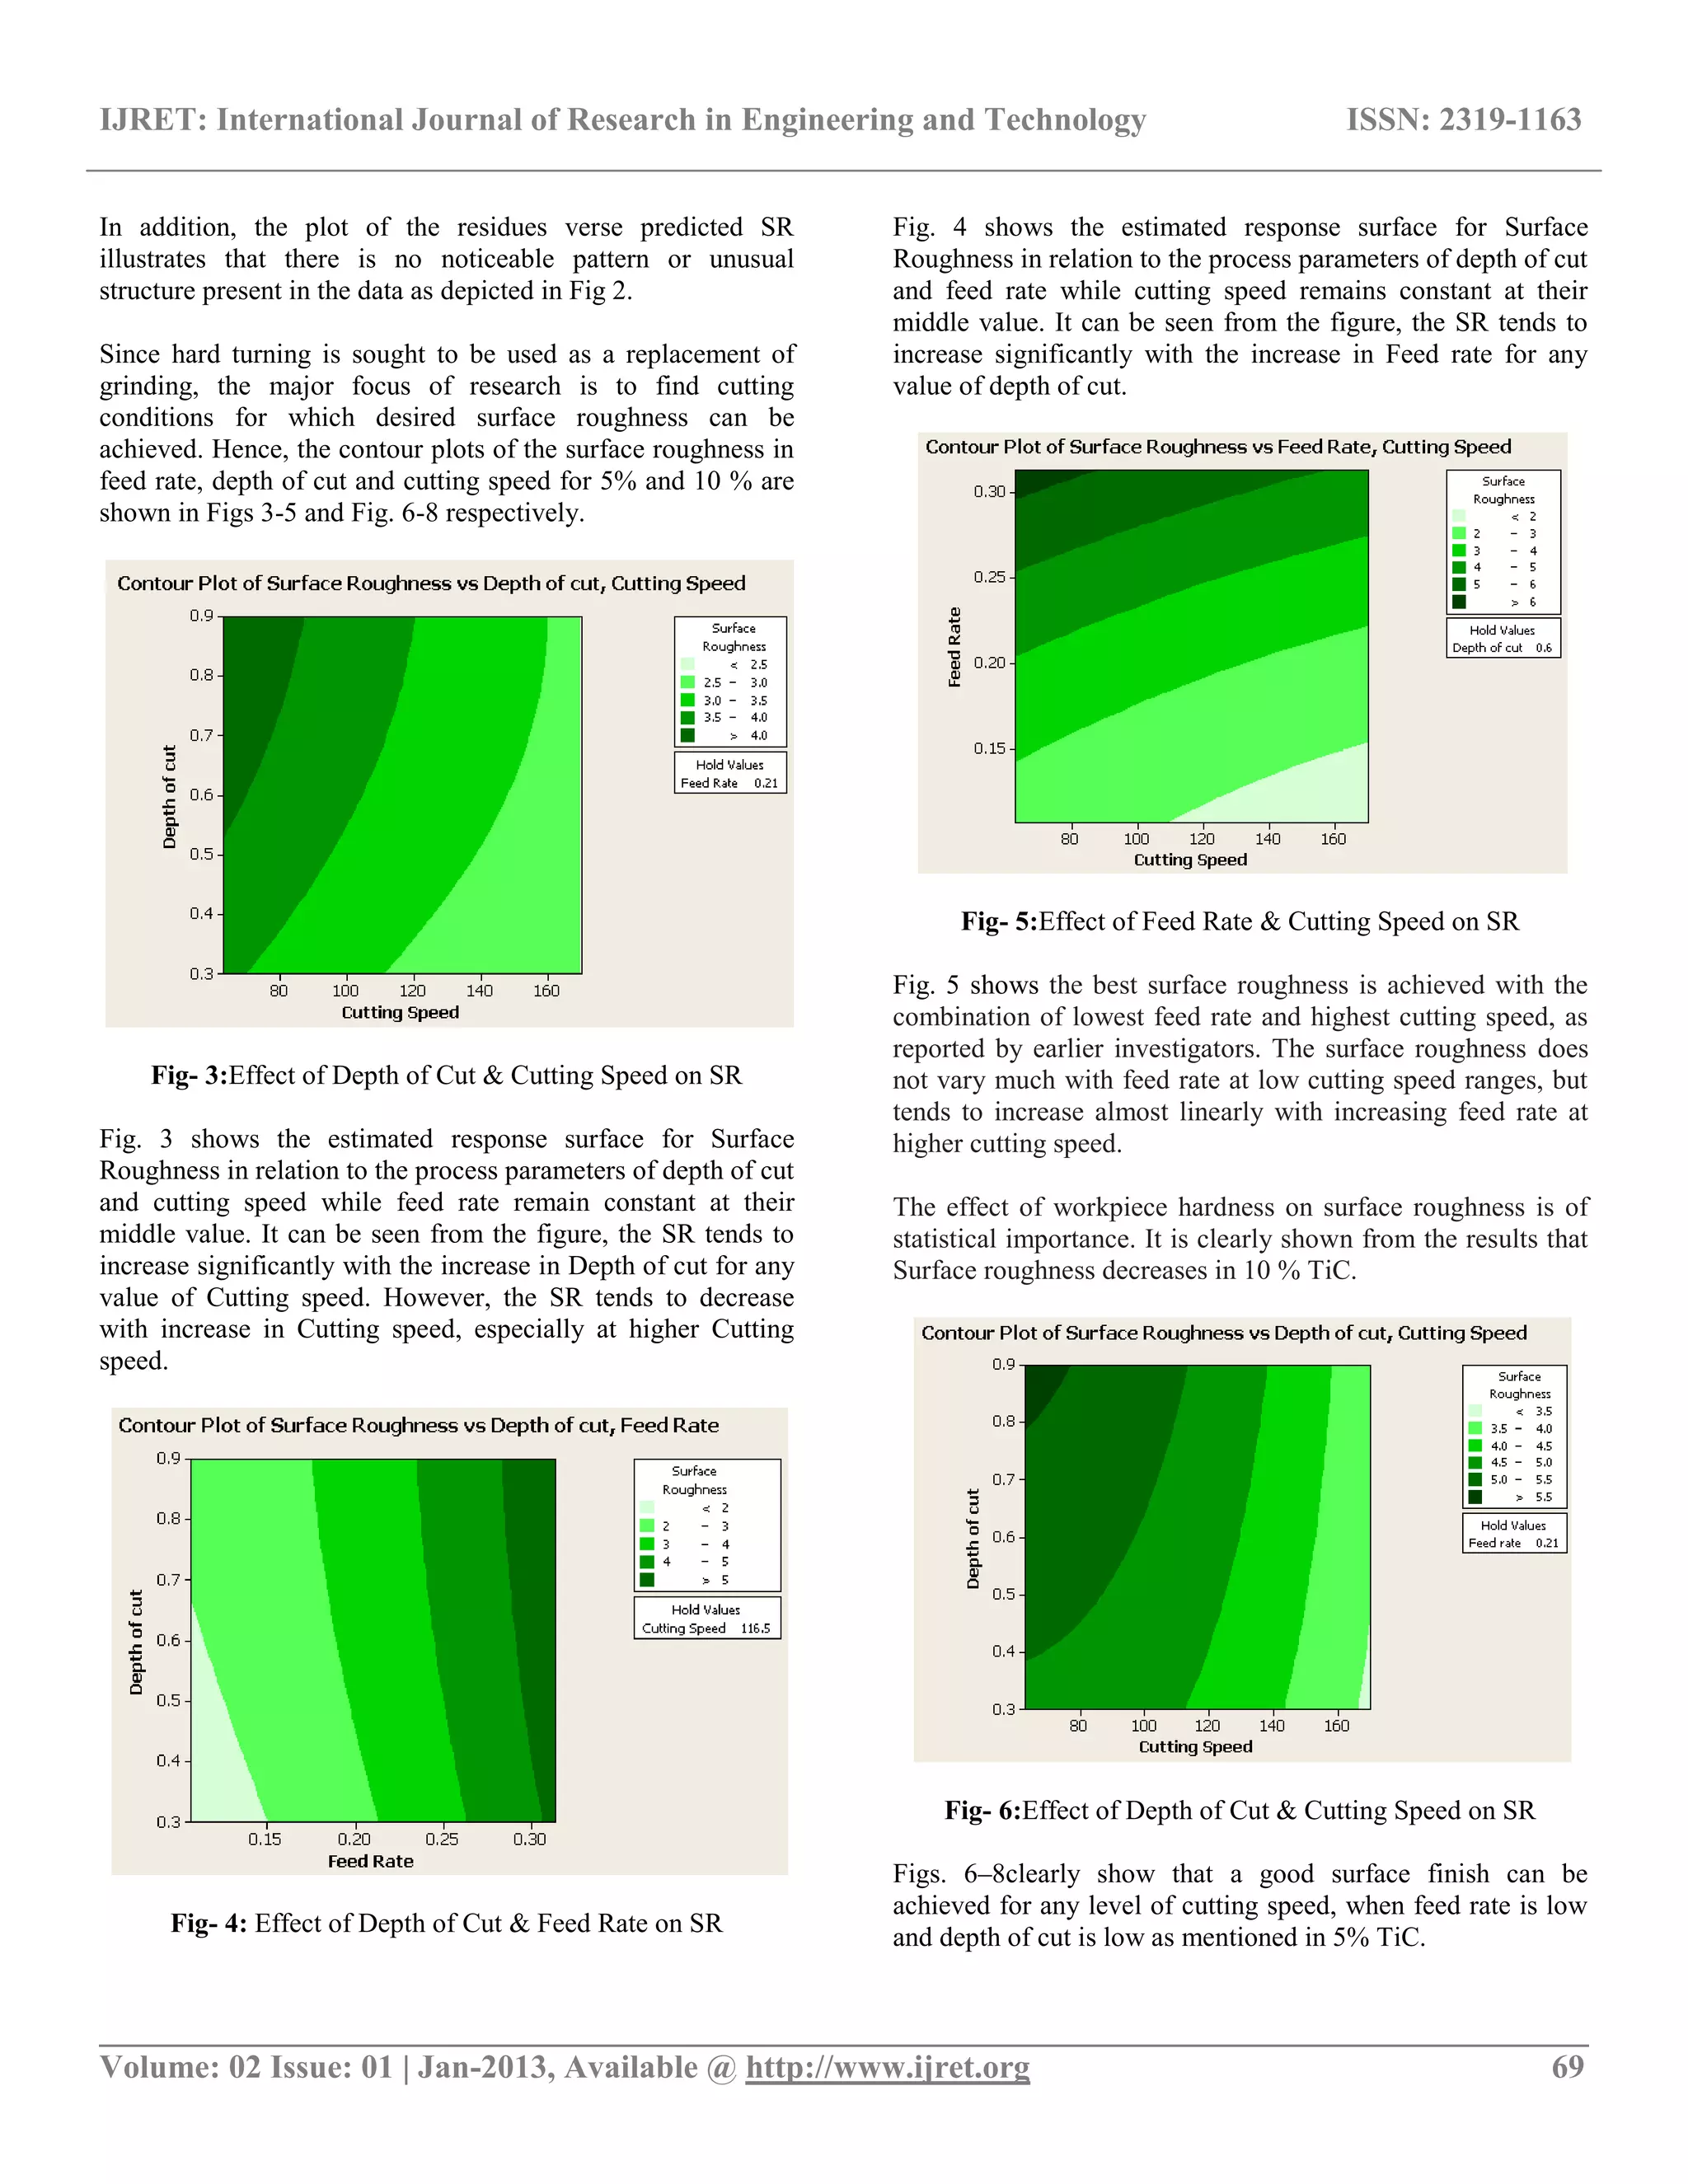
Fig-7:Effect of Depth of Cut & Feed Rate on SR
Fig-8: Effect of Feed Rate & Cutting Speed on SR
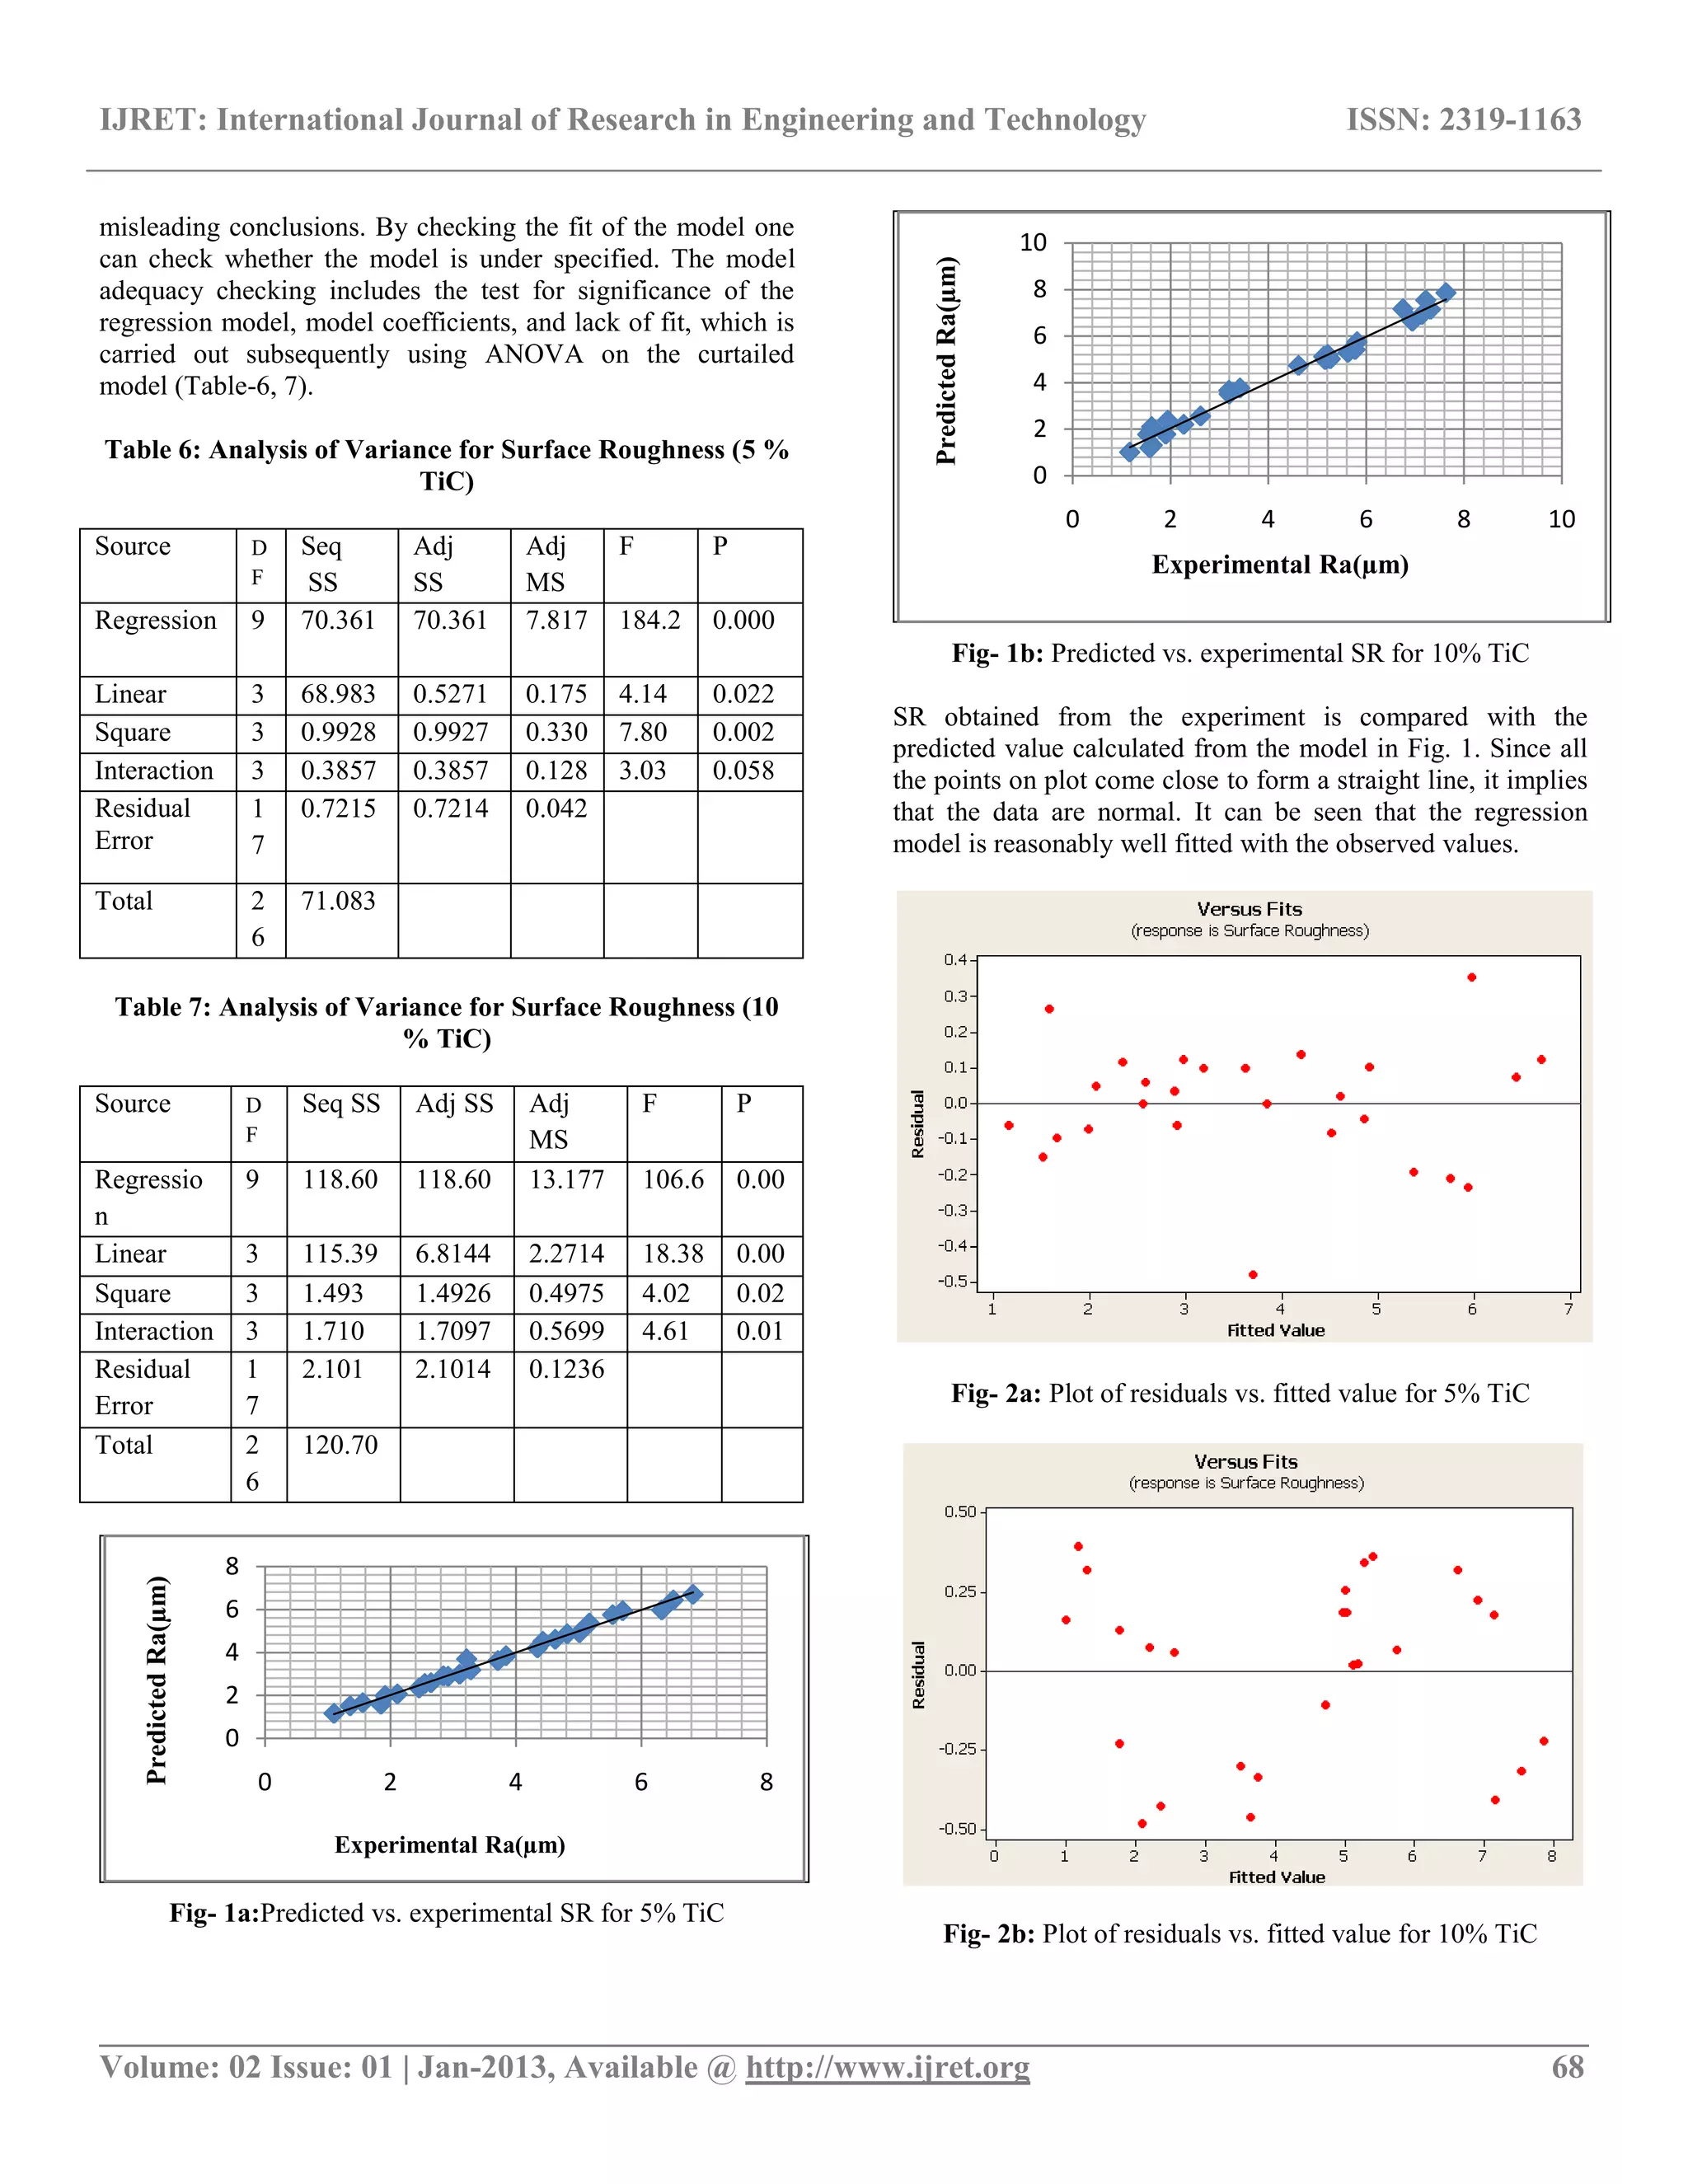
CONCLUSIONS
In this paper, RSM was applied to develop mathematical
models of surface roughness in order to investigate the
influence of machining parameters during finish turning of
6063 Al/TiC metal matrix composite with a PCD insert. The
experimental study has led to the following conclusions.
In majority of results, surface finish of workpiece
having 5 % TiC is better than workpiece having 10 %
TiC.
Surface roughness model: the feed rate provides
primary contribution and influences most
significantly on the surface roughness. The
interaction between feed rate and depth of cut,
quadratic effect of feed rate and interaction effect of
speed and depth of cut provide secondary
contribution to the model.
Contour plots can be used for selecting the cutting
parameters for providing the given desired surface
roughness.
Feed rate is found the most significant effect on
surface roughness. The increase of feed rate increases
the surface roughness.
ACKNOWLEDGEMENTS
The author would like to express their deepest gratitude to
MrVivekshrivastav and MrAnirbanGiri (Ph’d, Assistant
Manager, Aditya Birla Science & Technology Company Ltd)
for providing the test material for research work.
REFERENCES
[1] R.Venkatesh, A.M.Hariharan, N.Muthukrishnan,
“Machinability Studies of Al/SiC/ (20p) MMC by Using PCD
Insert (1300 grade)”Proceedings of the World Congress on
Engineering (2009).
[2] Ram NareshRai, G.L. Datta,M. Chakraborty, A.B.
Chattopadhyay“A study on the machinability behaviour of Al–
TiC compositeprepared by in situ technique” Materials
Science and Engineering (2006) 428:34-40.
[3] J. Paulo Davim, “Diamond tool performance in machining
metal–matrix composites” Journal of Materials Processing
Technology(2002)128:100-105.
[4] Caroline J.E. Andrewesa, Hsi-Yung Fenga,, W.M. Laub
“Machining of an aluminum/SiCcomposite using diamond
inserts” Journal of Materials Processing
Technology(2000)102:25-29.
[5] YanmingQuan, Bangyan Ye, “The effect of machining on
the surface properties of SiC/Al composites” Journal of
Materials Processing Technology (2003) 138:464–467.
[6]Mariam S. El-Gallab, Mateusz P. Sklad b, “Machining of
aluminum/silicon carbideparticulate metal matrix
compositesPart IV. Residual stresses in the machined
workpiece” Journal of Materials Processing Technology
(2004) 152:23-34.
[7]ShibenduShekhar Roy “Design of genetic-fuzzy expert
system for predicting surface finish inultra-precision diamond
turning of metal matrix composite” Journal of Materials
Processing Technology (2006) 173:337-344.
[8]Y.F.Ge, J.H.Xu, H.Yang, S.B.Luo, Y.C.Fu, “Workpiece
surface quality when ultra-precision turning of SiCp/AL
Composites” Journal of material processing technology”
(2008) 203:166-175.
[9]N. Muthukrishnan,M. Murugan,K. PrahladaRao,
“Machinability issues in turning of Al-SiC (10p) metal
matrix composites” International Journal of Advance
Manufacturing Technology (2008) 39:211–218.
[10]A.Pramanik, L.C.Zhang, J.A.Arsecularatne,
“Effectofceramicparticlesonresidualstress,surfaceroughnessan
dchipformation” International
JournalofMachineTools&Manufacture(2008)48:1613–1625.
[11] Rajesh Kumar Bhushan,SudhirKumar,S. Das, “Effect of
machining parameters on surface roughnessand tool wear for
7075 Al alloy SiC composite” International Journal of
Advance Manufacturing Technology (2010) 50:459-469.
[12] D. C. Montgomery. “Design and analysis of
experiments” John willy and Sons Inc, 2001.](https://image.slidesharecdn.com/effectofmachiningparametersonsurfaceroughnessfor6063al-tic510metalmatrixcompositeusingrsm-140801004113-phpapp02/75/Effect-of-machining-parameters-on-surface-roughness-for-6063-al-tic-5-10-metal-matrix-composite-using-rsm-6-2048.jpg)
![IJRET: International Journal of Research in Engineering and Technology ISSN: 2319-1163
__________________________________________________________________________________________
Volume: 02 Issue: 01 | Jan-2013, Available @ http://www.ijret.org 65
EFFECT OF MACHINING PARAMETERS ON SURFACE ROUGHNESS
FOR 6063 AL-TIC (5 & 10 %) METAL MATRIX COMPOSITE USING RSM
P. R. Patel1
, B. B. Patel2
, V. A. Patel3
1 Department of Mechanical Engineering, L. D. College of engineering, Ahmedabad, pragneshpatel27@yahoo.com
2 Department of Mechanical Engineering Sankalchand Patel college of Engg.Visnagar, bbpatel.mech@spcevng.ac.in
3 Department of Mechanical Engineering Sankalchand Patel college of EnggVisnagar, vapatel.mech@spcevng.ac.in
Abstract
Metal matrix Composites are new class of material which offers superior Properties over alloys. Problem associated with MMCs is
that they are very difficult to machine and quality of machining specially surface finish due to the hardness and abrasive nature of
Carbide particles. Characteristics of machined surfaces are known to influence the product performance significantly since they are
directly linked to the ability of the material to withstand stresses, temperature, friction and corrosion. This paper presents an
experimental work on the analysis of machined surface quality on 6063 Al/TiC metal matrix composites with PCD insert in hard
turning leading to Response surface methodology based model to predict the surface roughness.
Index Terms: Metal matrix composite, Surface Roughness, Response surface methodology.
-----------------------------------------------------------------------***-----------------------------------------------------------------------
1. INTRODUCTION
Increasing quantities of metal matrix composites (MMCs) are
being used to replace conventional materials in many
applications, especially in the automobile and recreational
industries. The most popular types of MMCs are aluminum
alloys reinforcing with ceramic particles. These low cost
composites provide higher strength, stiffness and fatigue
resistance with a minimal increase in density over the base
alloy [1]. Al–TiC belongs to the new generation of particulate
reinforced aluminium alloy based metal-matrix composites
(MMCs). Particle reinforced metal-matrix composites are
likely to find high commercial application due to their low
cost, ease of fabrication and improved properties. The
practical applications of Al–TiC metal-matrix composites are
in aerospace, automobile and structural industries [2]. A
continuing problem with MMCs is that they are difficult to
machine, due to the hardness and abrasive nature of the TiC or
other reinforcing particles. The particles used in MMCs are
harder than tungsten carbide (WC), the main constituent of
hard metal and even than most of the cutting tool materials.
Diamond is exception, for instance, which is approximately
three to four times harder than hard metal [3]. That’s why
PCD tool was used as wear resistive tool in order to achieve
desire surface finish.
Caroline J.E. Andrewes, Hsi-Yung Feng, W.M. Lau et al. [4]
were carried out to machine a DuralcanAL/SiC composite
using Kennametal's PCD and CVD diamond inserts. The
present results indicate that crater wear may not be a main
concern to the diamond inserts due to the very low coefficient
of friction and the high thermal conductivity of diamonds.
YanmingQuan, Bangyan Ye et al. [5] investigated the
hardness and residual stress of composites in the surface layer
affected by machining. The results indicate that the work
hardening and residual stress of composites in the machined
surface layer have some peculiarities. Mariam S. El-Gallab,
Mateusz P. Skladet al. [6] developed 3D thermo-mechanical
finite element model of the machined composite workpiece.
The model is used to predict the effect of the different cutting
parameters on the workpiece subsurface damage produced due
to machining. The modelpredicts high localized stresses in the
matrix material around the SiC reinforcement particles,
leading to matrix cracking. ShibenduShekhar Roy et al. [7]
design an expert system using two soft computing tools,
namely fuzzy logic and genetic algorithm, so that the surface
finish in ultra-precision diamond turning of metal matrix
composite can be modeled for set of given cutting parameters,
namely spindle speed, feed rate and depth of cut.
Ultra-precision turning tests on SiCp/2024Al and
SiCp/ZL101A composites were carried out to investigate the
surface quality using single point diamond tools (SPDT) and
polycrystalline diamond (PCD) cutters. Examined by SEM
and AFM, the machined surfaces took on many defects such
as pits, voids, micro cracks, grooves, protuberances, matrix
tearing and so on. It was found that cutting parameters, tool
material and geometries, particle reinforcement’ size and
distribution, reinforcement’ volume fraction and cooling
conditions all had a significant effect on the surface integrity
when ultra-precision turning [8]. N. Muthukrishnan, M.
Murugan& K. PrahladaRao et al. [9] presents the results of an
experimental investigation on the machinability of fabricated
aluminum metal matrix composite (A356/SiC/10p) during
continuous turning of composite rods using medium grade
polycrystalline diamond (PCD 1500) inserts. MMC’s are very
difficult to machine and PCD tools are considered by far, the](https://crownmelresort.com/image.slidesharecdn.com/effectofmachiningparametersonsurfaceroughnessfor6063al-tic510metalmatrixcompositeusingrsm-140801004113-phpapp02/75/Effect-of-machining-parameters-on-surface-roughness-for-6063-al-tic-5-10-metal-matrix-composite-using-rsm-1-2048.jpg)
![IJRET: International Journal of Research in Engineering and Technology ISSN: 2319-1163
__________________________________________________________________________________________
Volume: 02 Issue: 01 | Jan-2013, Available @ http://www.ijret.org 66
best choice for the machining of these materials. A. Pramanik,
L. C. Zhang, J. A. Arsecularatne et al. [10] investigated
experimentally the effects of reinforcement particles on the
machining of MMCs. The major findings are: (a) the surface
residual stresses on the machined MMC are compressive; (b)
the surface roughness is controlled by feed; (c) particle pull-
out influences the roughness when feed is low; (d) particles
facilitate chip breaking and affect the generation of residual
stresses; and (e) the shear and friction angles depend
significantly on feed but are almost independent of speed.
Rajesh Kumar Bhushan&Sudhir Kumar & S. Das et al. [11]
investigated the influence of cutting speed, depth of cut, and
feed rate on surface roughness during machining of 7075 Al
alloy and 10 wt.% SiC particulate metal-matrix composites.
The experiments were conducted on a CNC Turning Machine
using tungsten carbide and polycrystalline diamond (PCD)
inserts. Surface roughness of 7075Al alloy with 10 wt.%SiC
composite during machining by tungsten carbide tool was
found to be lower than PCD.
Not much work to be done in the area of machinability of
composite materials particularly Al–TiC. MMCs in general are
difficult to machine (turning, milling, drilling, threading and
shaping) due to their hardness and abrasive nature of
reinforced particles. The objective of the present work is,
therefore, to evaluate the machining behaviour of these
composites (Al–TiC).
2. EXPERIMENTAL DETAILS
2.1 Workpiece and cutting tool
Table 1 physical and Mechanical properties of 6063Al-TiC
Properties Material
Al alloy 5
% TiC
Al alloy 10
% TiC
Density (Kg/m3) 2632 2734
Hardness (BHN) 95 113
Modulas Elasticity (Gpa) 77 82
Tensile Strength yield
strength (Mpa)
103 127
Tensile Strength Ultm
strength (Mpa)
140 152
% Elongation 3 1
The work material selected for the study was 6063 Al alloy 5
% TiC MMC and 6063 Al alloy 10% TiC MMC of cylinder
bars (36 mm Diameter and 200 mm length). Table 1 show the
physical and mechanical properties of 6063 Al alloy TiC. The
chemical composition of this material kept confidential.
The cutting tool selected for machining of Al-TiC Metal
matrix composites was polycrystalline diamond insert of fine
grade (2000), because it had been found that PCD tool is best
choice for machining of MMCs due to its high wear
resistance. The cutting tool used had PCD insert: ISO coding
DCMW 11T304. The Characteristics of insert are as follows:
Average particles Size - 10μm, Volume fraction of Diamond –
89 to 93 %, Transverse Rapture strength - 2.20 GPa, Knoop
hardness at 3 Kg load - 8378.5 kg/mm2
.
2.2 Experimental procedure
The cutting inserts were clamped on a right-hand tool holder
with ISO designation PCLNR 25×25 M12. The clamping of
the insert on the tool holder resulted in -60
rake angle, -60
clearance angle, and 930
approach angle. The turning tests on
the workpiece were conducted under dry conditions on an
Engine lathe having spindle power of 2 Kw.
The surface roughness of the machined samples was measured
with a surface roughness analyzer (Mitutoyo, surftest set no:
178-923e) with a cut-off length of 0.8mm over three sampling
lengths. The average value of surface roughness (Ra) was used
to quantify the roughness achieved on machined surfaces.
2.3 Design of experiments
In order to investigate the influence of machining conditions
on surface roughness - cutting speed, feed rate and depth of
cut were selected as the input parameters. The RSM was
employed to quantify the relationship between the individual
response factors and the input machining parameters of the
following form:
Y= f (A, B, C)
Where Y is the desired response and F is the response function
or response surface.
RSM is a collection of mathematical and statistical techniques
that are useful for modeling and analysis of problems in which
the response of interest is influenced by several variables and
objective is to optimize this response [12]. In order to design
the experimental plan, full factorial method was chosen to
determine the relationship between four operating variables
namely cutting speed, feed rate and depth of cut. In order to
study the effects of the EDM parameters on the above
mentioned machining criteria, second order polynomial
response surface mathematical models can be developed. In
the general case, the response surface is described by an
equation of the form:
k
i
k
i
r
ji
jiijiiiii xxxxY
1 1
2
2
2
0
Where Y is the corresponding response, ix is the input
variables, ixi
2
and ji xx are the squares and interaction terms,](https://crownmelresort.com/image.slidesharecdn.com/effectofmachiningparametersonsurfaceroughnessfor6063al-tic510metalmatrixcompositeusingrsm-140801004113-phpapp02/75/Effect-of-machining-parameters-on-surface-roughness-for-6063-al-tic-5-10-metal-matrix-composite-using-rsm-2-2048.jpg)


![IJRET: International Journal of Research in Engineering and Technology ISSN: 2319-1163
__________________________________________________________________________________________
Volume: 02 Issue: 01 | Jan-2013, Available @ http://www.ijret.org 70
Fig-7:Effect of Depth of Cut & Feed Rate on SR
Fig-8: Effect of Feed Rate & Cutting Speed on SR
CONCLUSIONS
In this paper, RSM was applied to develop mathematical
models of surface roughness in order to investigate the
influence of machining parameters during finish turning of
6063 Al/TiC metal matrix composite with a PCD insert. The
experimental study has led to the following conclusions.
In majority of results, surface finish of workpiece
having 5 % TiC is better than workpiece having 10 %
TiC.
Surface roughness model: the feed rate provides
primary contribution and influences most
significantly on the surface roughness. The
interaction between feed rate and depth of cut,
quadratic effect of feed rate and interaction effect of
speed and depth of cut provide secondary
contribution to the model.
Contour plots can be used for selecting the cutting
parameters for providing the given desired surface
roughness.
Feed rate is found the most significant effect on
surface roughness. The increase of feed rate increases
the surface roughness.
ACKNOWLEDGEMENTS
The author would like to express their deepest gratitude to
MrVivekshrivastav and MrAnirbanGiri (Ph’d, Assistant
Manager, Aditya Birla Science & Technology Company Ltd)
for providing the test material for research work.
REFERENCES
[1] R.Venkatesh, A.M.Hariharan, N.Muthukrishnan,
“Machinability Studies of Al/SiC/ (20p) MMC by Using PCD
Insert (1300 grade)”Proceedings of the World Congress on
Engineering (2009).
[2] Ram NareshRai, G.L. Datta,M. Chakraborty, A.B.
Chattopadhyay“A study on the machinability behaviour of Al–
TiC compositeprepared by in situ technique” Materials
Science and Engineering (2006) 428:34-40.
[3] J. Paulo Davim, “Diamond tool performance in machining
metal–matrix composites” Journal of Materials Processing
Technology(2002)128:100-105.
[4] Caroline J.E. Andrewesa, Hsi-Yung Fenga,, W.M. Laub
“Machining of an aluminum/SiCcomposite using diamond
inserts” Journal of Materials Processing
Technology(2000)102:25-29.
[5] YanmingQuan, Bangyan Ye, “The effect of machining on
the surface properties of SiC/Al composites” Journal of
Materials Processing Technology (2003) 138:464–467.
[6]Mariam S. El-Gallab, Mateusz P. Sklad b, “Machining of
aluminum/silicon carbideparticulate metal matrix
compositesPart IV. Residual stresses in the machined
workpiece” Journal of Materials Processing Technology
(2004) 152:23-34.
[7]ShibenduShekhar Roy “Design of genetic-fuzzy expert
system for predicting surface finish inultra-precision diamond
turning of metal matrix composite” Journal of Materials
Processing Technology (2006) 173:337-344.
[8]Y.F.Ge, J.H.Xu, H.Yang, S.B.Luo, Y.C.Fu, “Workpiece
surface quality when ultra-precision turning of SiCp/AL
Composites” Journal of material processing technology”
(2008) 203:166-175.
[9]N. Muthukrishnan,M. Murugan,K. PrahladaRao,
“Machinability issues in turning of Al-SiC (10p) metal
matrix composites” International Journal of Advance
Manufacturing Technology (2008) 39:211–218.
[10]A.Pramanik, L.C.Zhang, J.A.Arsecularatne,
“Effectofceramicparticlesonresidualstress,surfaceroughnessan
dchipformation” International
JournalofMachineTools&Manufacture(2008)48:1613–1625.
[11] Rajesh Kumar Bhushan,SudhirKumar,S. Das, “Effect of
machining parameters on surface roughnessand tool wear for
7075 Al alloy SiC composite” International Journal of
Advance Manufacturing Technology (2010) 50:459-469.
[12] D. C. Montgomery. “Design and analysis of
experiments” John willy and Sons Inc, 2001.](https://crownmelresort.com/image.slidesharecdn.com/effectofmachiningparametersonsurfaceroughnessfor6063al-tic510metalmatrixcompositeusingrsm-140801004113-phpapp02/75/Effect-of-machining-parameters-on-surface-roughness-for-6063-al-tic-5-10-metal-matrix-composite-using-rsm-6-2048.jpg)


This paper investigates the effect of machining parameters on surface roughness in 6063 Al-TiC metal matrix composites using response surface methodology (RSM). It details experimental work incorporating polycrystalline diamond tools due to their effectiveness in machining hard materials like MMCs, and provides specific results on how cutting speed, feed rate, and depth of cut influence surface roughness. The findings indicate significant correlations between machining parameters and surface integrity, beneficial for applications in automated and structural industries.


![ANPARA THERMAL POWER STATION[1] sangam.pdf](https://cdn.slidesharecdn.com/ss_thumbnails/anparathermalpowerstation1sangam-251121115219-9261cde4-thumbnail.jpg?width=640&height=640&fit=bounds)


