Download as PDF, PPTX


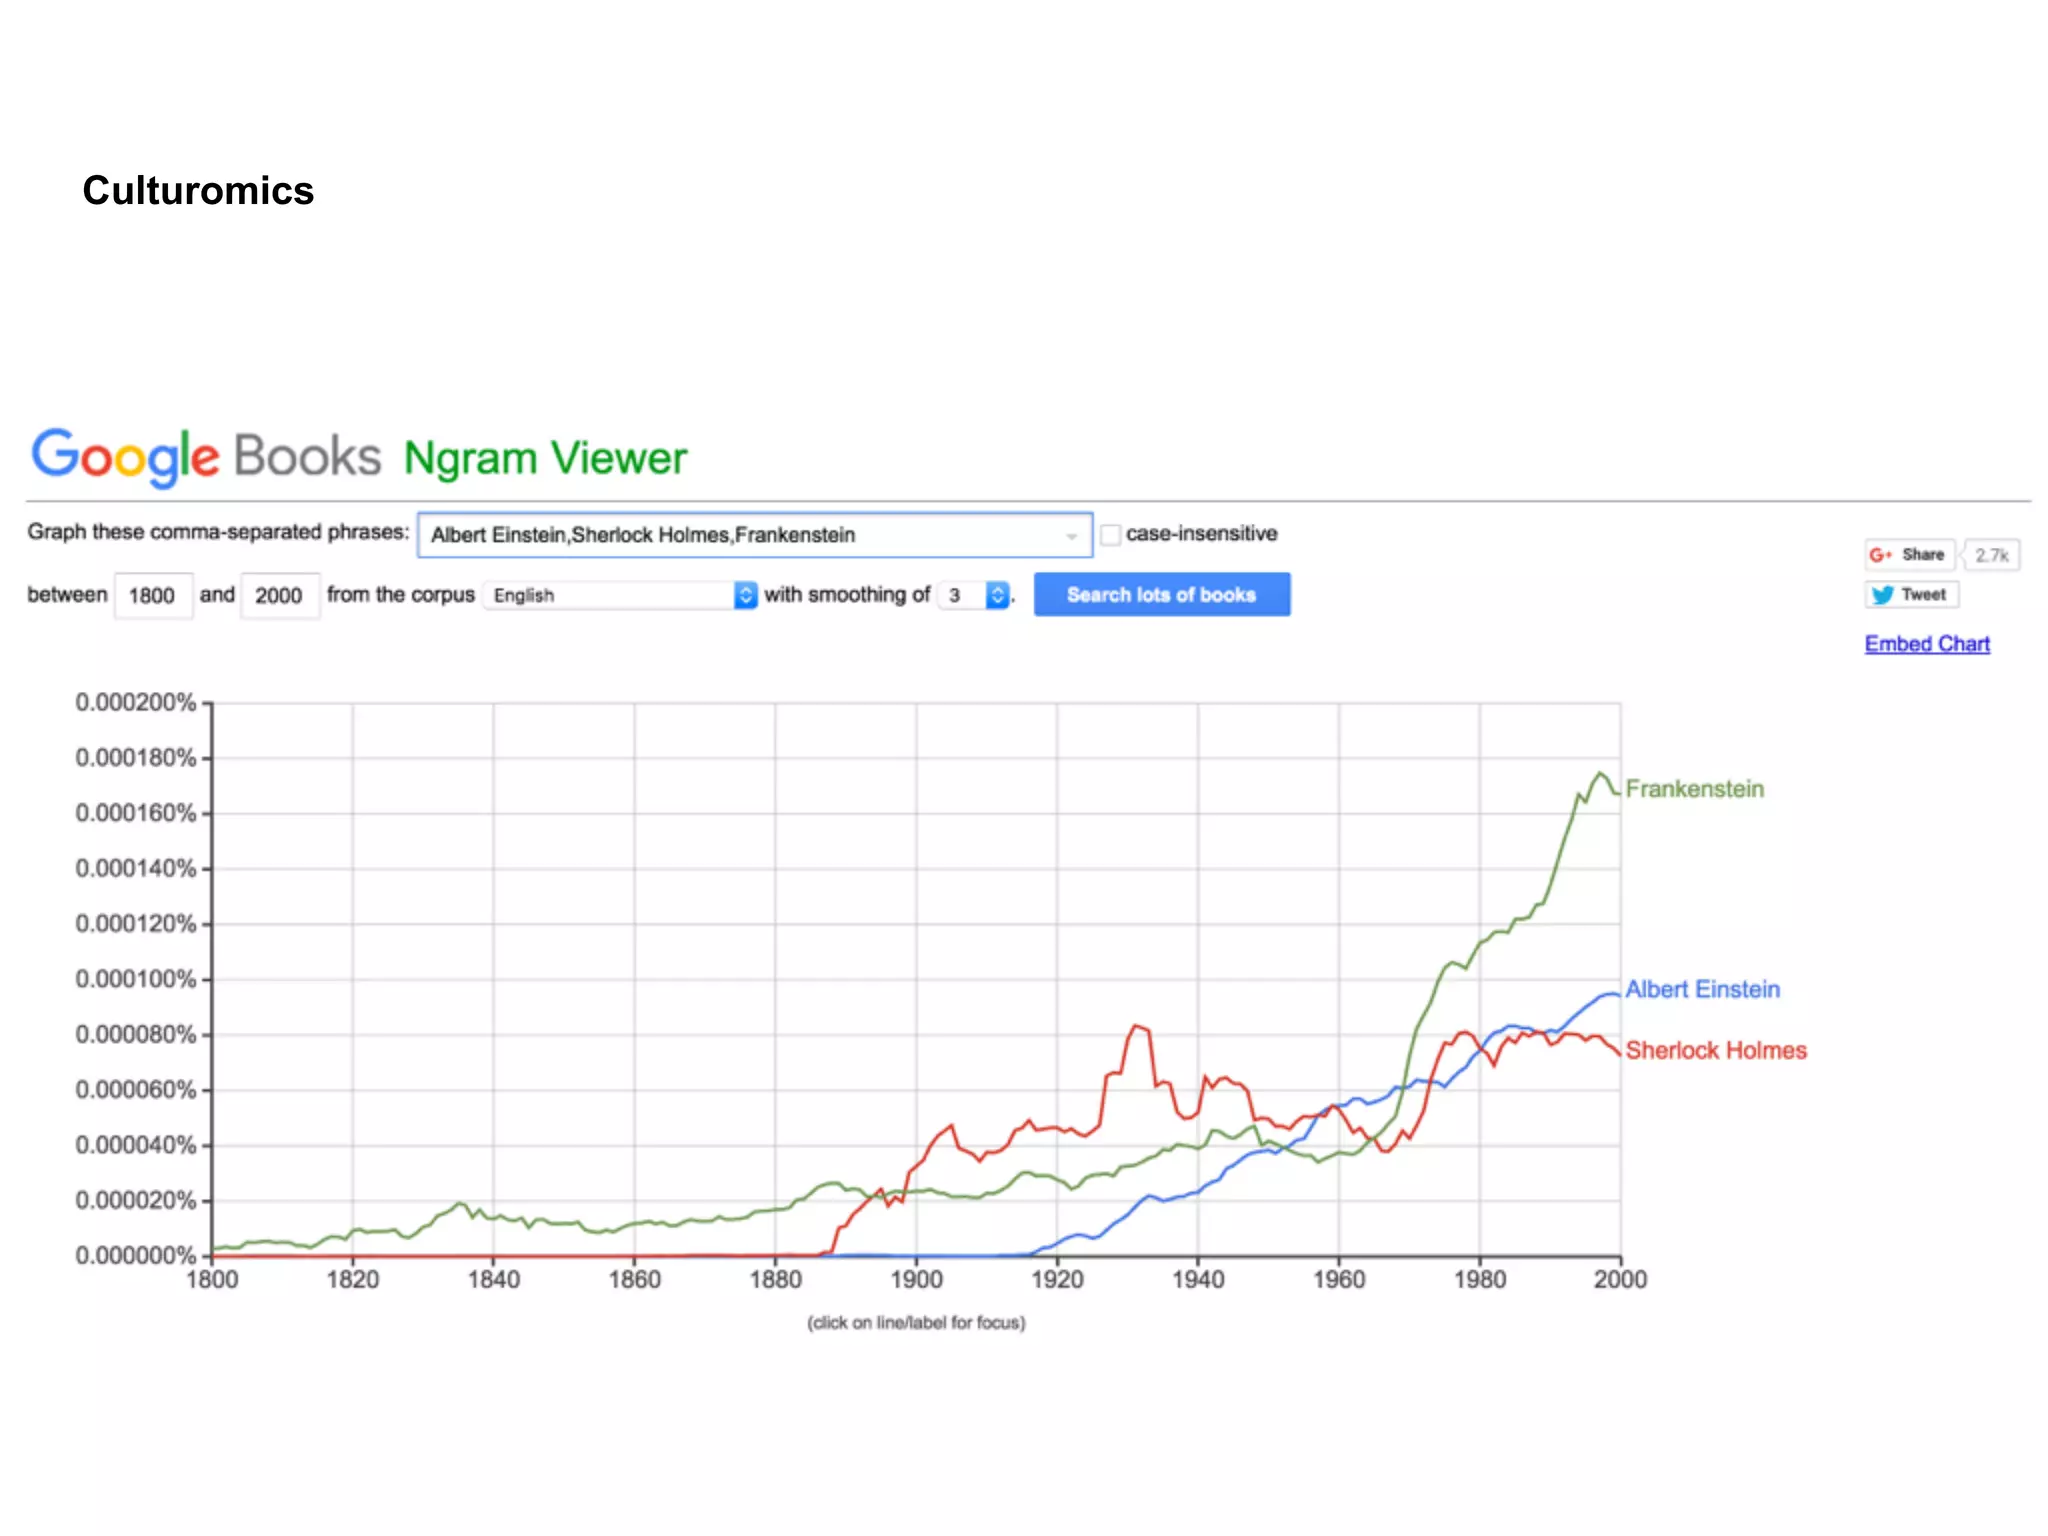

![Data
Journalists
NOTES
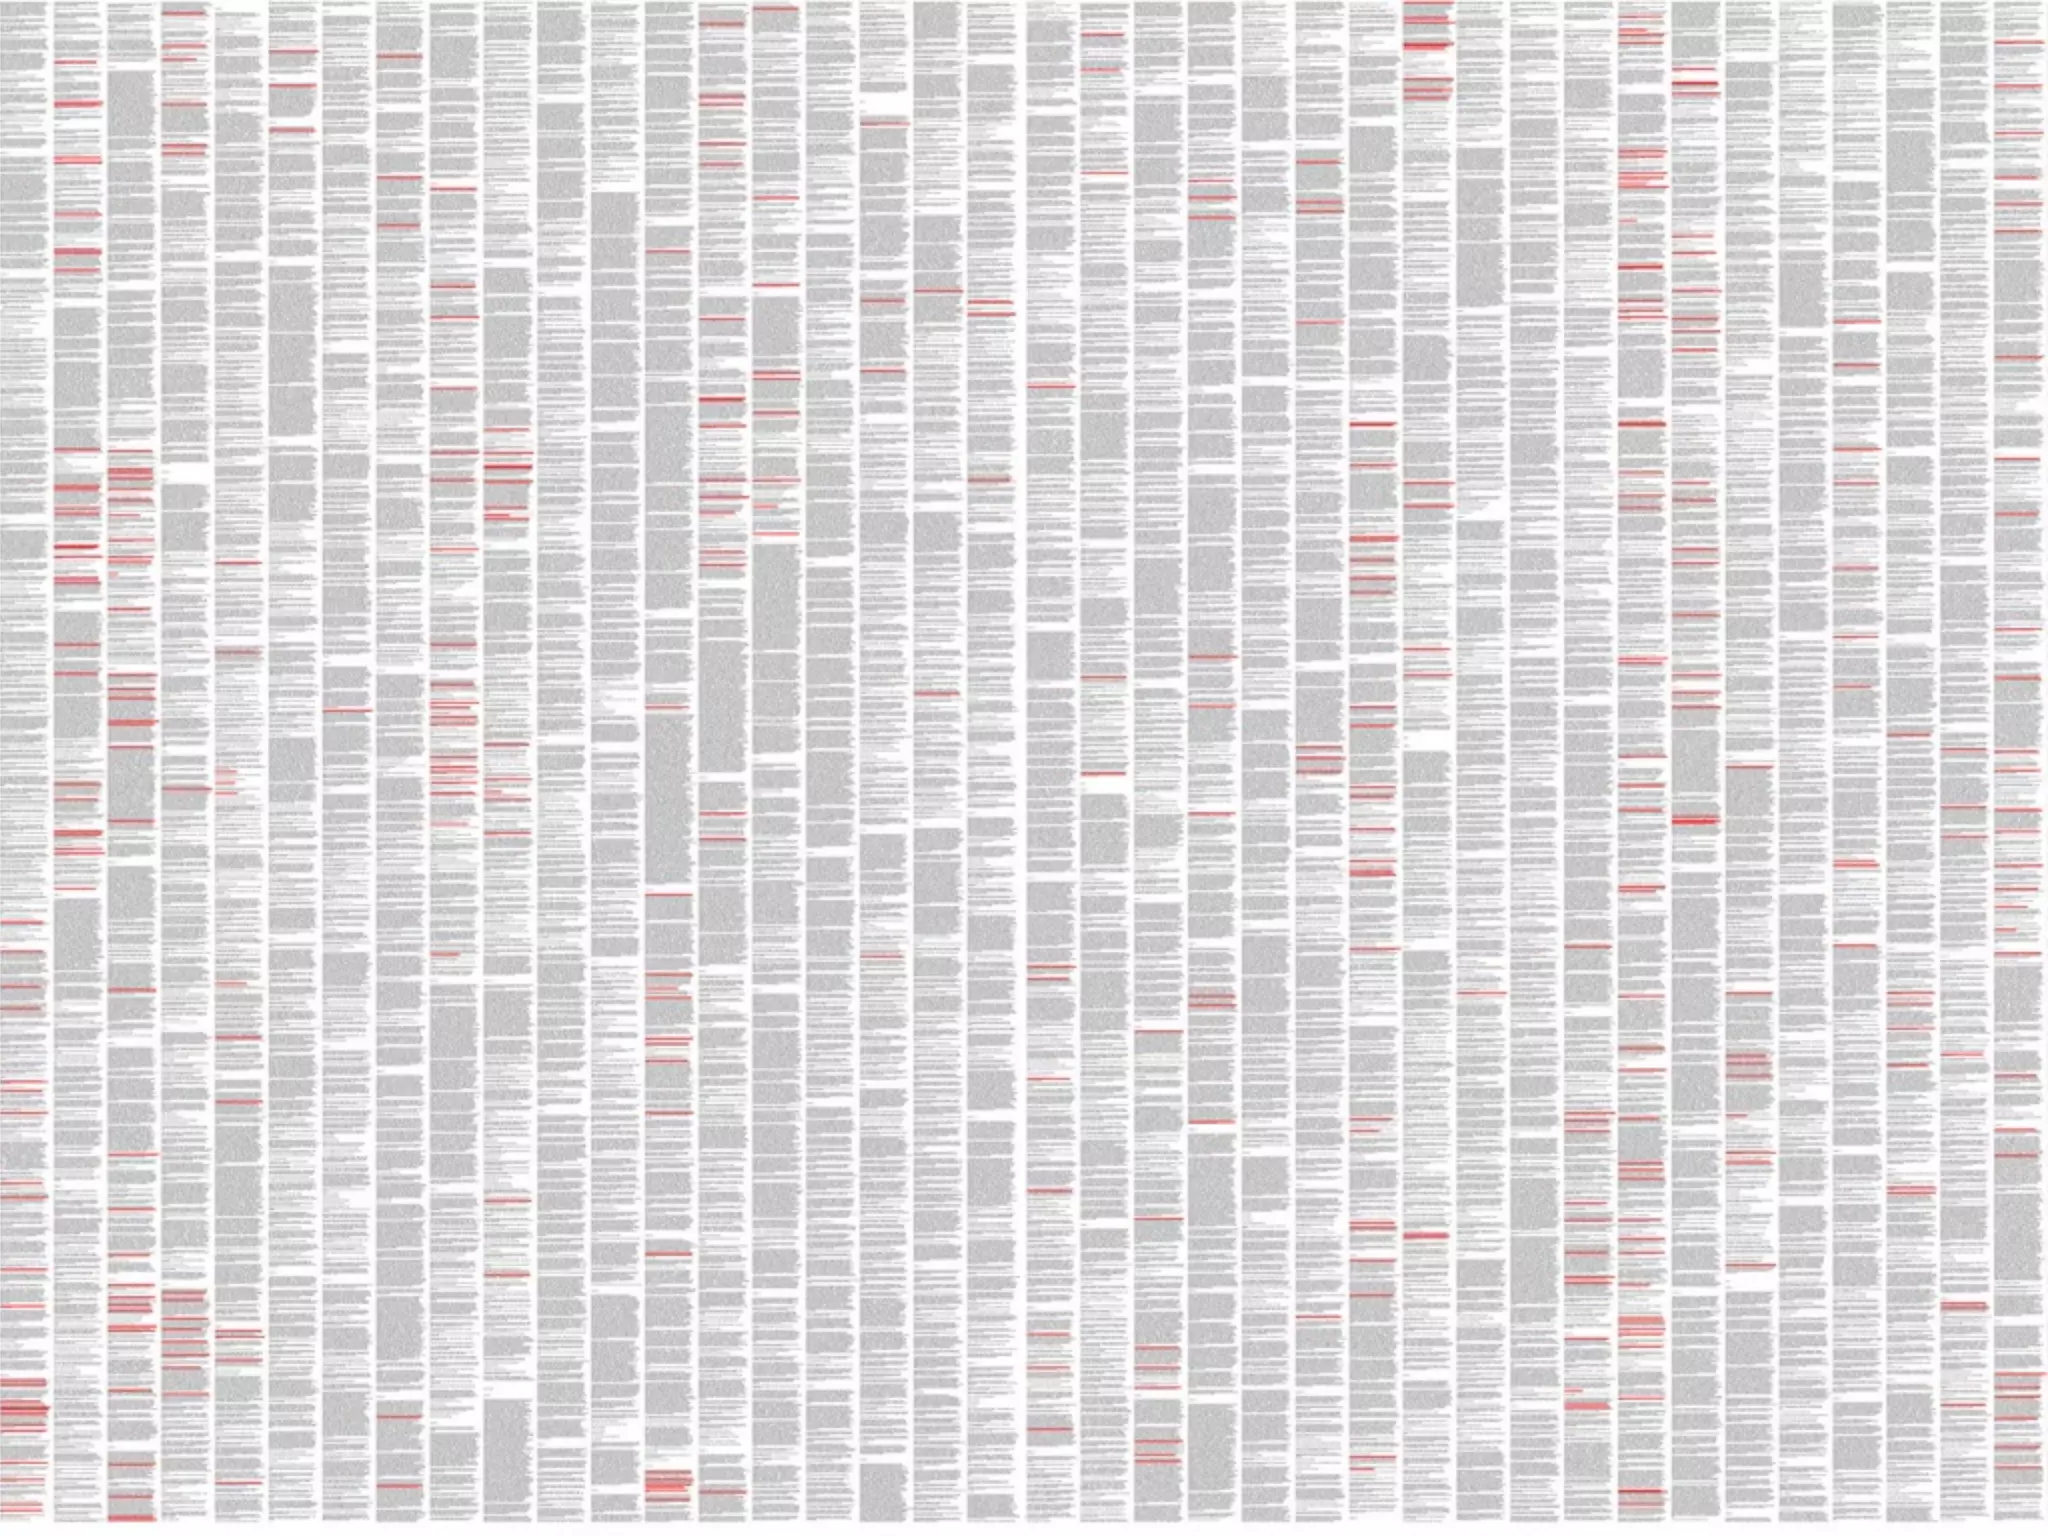
Total spending, 2010/2011
£691.67bn
+0.34%change after
inflation on 2009/10
SOURCES: GUARDIAN DATA RESEARCH, DEPARTMENTAL RESOURCE
ACCOUNTS, INSTITUTE FOR FISCAL STUDIES, PUBLIC EXPENDITURE
STATISTICAL ANALYSES (PESA)
RESEARCH: SIMON ROGERS, AMI SEDGHI, GEMMA TETLOW
GRAPHIC: JENNY RIDLEY, MICHAEL ROBINSON
Public spending by the UK's central government departments, 2010-2011
Cabinet Office
£0.570bn -7.47%
National school of government (NSG) £0.023bn
House of Commons
£0.164bn
Independent Parliamentary
Standards Authority[8] £0.126bn
New department
Office of communications (Ofcom) [7]
from government funding
(rest from licence fees)
£0.122bn -13.1%
UK trade & investment
(UKTI) £0.085bn -12.5%
House of Lords
£0.077bn -22.3%
National Audit Office
£0.069bn +7.9%
Office of fair trading (OFT)
£0.058bn -9.2%
Revenue & customs
Prosecutions office (RCPO)
£0.046bn -1.1%
Serious fraud office (SFO) £0.036bn -12.5%
Charity commission for England and Wales £0.030bn -4.6%
Office of rail regulation (ORR) £0.028bn -11.0%
Electoral commission £0.022bn -2.2%
Government actuary's department (GAD) £0.019bn +17.4%
Postal services commission
(Postcomm) £0.0082bn -2.1%
Attorney general's office (see also LSLO) £0.0049bn -8.7%
HM crown prosecution service
inspectorate £0.0034bn -27.7%
The figures give a picture of major expenditure but exclude local
government spending not controlled by central government. We don't
have room to show everything — some programmes are just too small to
go here, but this gives a flavour of where your tax pounds go. It also
excludes government departments that are predominantly financed
bytheir income, such as the Crown Estate or the Export Credits Guarantee
Department. The totals here add up to more than the total budget,
because some of the smaller government departments are funded via the
larger ones, such as the Parliamentary Counsel Office, funded via the
Cabinet Office.
ALL % CHANGES TAKE ACCOUNT OF INFLATION
[1] Interest paid on the public debt.
[2] Treasury spending in 2008-09 and 2009-10 was dominated by the
impact of interventions in the financial sector — the figure shown here is
gross spending. In fact, in 2010-11 the net effect of financial stability
activities was to yield income to the Treasury. Loans to financial
institutions were repaid to the Treasury in 2010-11 and there was no
further purchase of shares and other assets in the year — so we have
shown the core department spending separately. The increase is due to
the provision for Equitable Life.
[3] The Rural Payments Agency distributes CAP payments — covered by
transfers from EU so do not show up as net spending here.
[4] Benefit spending excludes child benefit, guardians' allowance,
widows’ pensions, statutory paternity pay, statutory
adoption pay — these paid by HMRC, MoD, DBERR respectively.
[5] Excludes spending on family health services. GP running cost
includes salaries, hospitality budgets, home and overseas
accommodation costs.
[6] Totals absent from MoD annual report and supplied separately to
other figures by the department.
[7] The amount of government funding from BIS and DCMS, rest from
licence fees from broadcasters and media organisations.
[8] MPs’ expenses now administered by the Independent Parliamentary
Standards Authority (IPSA).
[9] This includes increase of £5bn in est. liabilities for the UK’s nuclear
legacy over the 100 years. It is NOT allocated for spending in one year.
Excl. this DECC’s total expenditure for 2010/11 is therefore £3.16bn with
£1.7bn of that allocated to the Nuclear Decommissioning Authority
Main pension schemes are forecasts for 2010-11
Debt interest [1]
£43.90bn
+36.2%
Child trust fund
£0.23bn
-28.12%
Tax credits
£28.09bn
+23.08%
Child
benefit
£12.05 bn
-1.9%
HM Revenue
& Customs [8]
£45.78bn
-1.09%
Social justice &
Local government
Environment, sustainability
& housing £0.794bn +5.8%
Rural
affairs
£0.134bn
-14.7%
Heritage
£0.183bn -3.8%
Health & social
services
Children, education,
lifelong learning & skills
£2.19bn +0.8%
Economy & transport
£1.05bn -40.0%
£6.61bn
+5.21%
£4.47bn
-1.73%
£15.87bn
-3.92%
Devolved
spending
Wales
Wales Office (WO)
£0.0050bn -12.1%
£18.76bn
+3.2%
£14.09bn
+11.5%
Higher &
further education
Universities
Further
education
£24.04bn
-11.52%
Department
for Business,
Innovation and
Skills
£4.67bn
-15.8%£3.0bn
-5.4%
£5.86bn
-5.0%
Science
Innovation & enterprise
£1.36bn -16.1%
Free & fair markets
£0.72bn -7.6%
Professional support
£0.38bn -2.2%
Research
councils
Roads
Rail
London £2.77bn+1.3%
Local authority
£1.17bn +0.5%
Supported capital expenditure
(Revenue) £0.975bn +5.0%
Buses £0.771bn -1.8%
Olympics £0.236bn +12.9%
Crossrail £0.220bn
Admin £0.188bn -5.6%
DVLA trading fund £0.187bn -20.4%
Coastguard £0.132bn -11.1%
Aviation, maritime, security & safety £0.129bn -39.7%
Sustainable travel £0.115bn -19.1%
Science, research & support functions £0.042bn -60.2%
Renewable fuels agency £0.001bn +4.0%£12.32bn
-18.3%
Department for Transport
£3.79bn
-18.2%
£2.93bn
-41.1%
UK border agency
£1.70bn -3.4%
Police pensions
£1.44bn -7.2%
Office for security &
counter-terrorism
£0.808bn -3.7%
AME charges £0.399bn +367.2%
Central services £0.204bn -22.6% Area-based grants £0.071bn -14.5%
European solidarity mechanism £0.022bn
Government equalities office £0.012bn -19.4%
Identity & passport service £0.005bn -94.7%
National fraud authority £0.004bn -1.0%
£10.45bn
+-7.69%
Home Office
Crime &
policing
Criminal records bureau £0.001bn +116.5%
£5.6bn
-3.2%
£37.8bn
-7.51%
Neighbourhoods Localism
London
governance
£0.048bn -2.8%
£6.0bn
-38.5%
£25.9bn
-2.5%
Spending by local
& regional government
£3.0bn
+90.8%
Foreign and
Commonwealth Office
£2.25bn -3.0% [6]
Admin & embassies
£1.09bn -3.9%
Peacekeeping grants
£0.408bn +10.7%
UN & other international
organisations £0.294bn -0.2%
BBC World Service £0.265bn -4.3%
British Council £0.189bn -8.7%
Conflict prevention programme
Grants £0.106bn -6.4%
Non-departmental bodies £0.006bn -2.9%
Scotland Office (SO)
£0.0078bn -5.9%
Health &
wellbeing
Local
Government
Finance and
sustainable
growth
Education & lifelong
learning
£2.88bn +0.2%
Scottish teachers' & NHS
pension schemes
£2.52bn -9.2%
Justice £1.95bn +2.6%
Rural affairs & the
Environment £0.517bn -8.1%
Office of the first minister
£0.267bn -2.1%
Admin £0.264bn -6.0%
Crown office and procurator fiscal £0.120bn -2.1%
Scottish parliament corporate body £0.102bn -4.2%
Scottish courts service £0.098bn
Forestry commission (Scotland) £0.096bn -0.2%
£34.88bn
+2.95%
Devolved
spending
Scotland
£12.29bn
+14.4%
£10.52bn
-0.8%
£3.20bn
-8.5%
War pensions
£0.935bn -7.3%
Army
Royal
Navy
Royal
Air
Force
Chief, joint ops
£0.047bn -89.9%
Operations &
peace-keeping
Afghanistan
Iraq
£0.095bn -73.1%
Libya
£0.022bn
Equipment
& support
Central
command
Admin
£2.03bn -8.1%
£22.77bn
+31.7%
£7.29bn
+6.7%
£2.84bn
-1.9%
£2.89bn
+4.7%£3.77bn
-4.1%
£2.31bn
+0.7%
Defence
estates
£4.66bn
+25.0%
£2.63bn
-6.2%
Ministry of
Defence [6]
£39.46bn
-1.95%
Devolved spending
Northern Ireland
£9.05bn
-2.01%
£4.5bn
-1.1%
£2.1bn
-5.1%
Education
Regional development
£1.07bn +30.9%
Employment and learning
£0.837bn -0.02%
Social development
£0.791bn +1.5%
Environment £0.312bn +100.3%Enterprise, trade & investment
£0.273bn -7.8%
Finance and personnel
£0.198bn +5.8%
Culture, arts and leisure £0.173bn -8.6%
Office of the first minister & deputy first minister
£0.090bn -11.1%
Northern Ireland Assembly £0.052bn +15.6%
Agriculture & rural development £0.051bn -79.9%
Other departments £0.022bn -0.6%
Northern Ireland Office (NIO)
£0.039bn +0.9%
Northern Ireland human rights
Commission £0.0016bn -4.0%
Prisons & probation (National
Offender Management Service)Criminal legal aid £1.22bn +7.8%
HM Courts Service £0.999bn +25.3%
Civil legal aid £0.921bn -6.8%
Policy, corporate services &
Associated offices £0.917bn +51.1%
Youth justice board £0.467bn -6.2%
Criminal injuries compensation authority
£0.426bn +312.5%
Tribunals service
£0.279bn -9.8%
Top judicial salaries
£0.143bn -3.6%
Legal services commission administration
£0.136bn -0.1%
Central funds £0.078bn -14.3%
HM courts & tribunals service
£0.012bn -93.8%
Parole board £0.010bn +11.7%
Ministry of Justice
£9.46bn
+1.0%
£4.22bn
-11.0%
Health protection agency
£0.177bn -25.1%
Department
of Health
£105.60bn
+0.28%
NHS
£87.61bn
+1.29%
[5]
Secondary
health care
(hospitals etc)
Primary
healthcare
GP
servicesPrescriptions
Dental
Opthalmic
£0.48bn
-0.7%
Pharmacy
£1.98bn-3.1%
Learning
difficulties
Mental
illness
Maternity
General & acute
A & E
Community
health
Other
contractual
£8.29bn
+1.3%
£7.68bn
-1.6%
£21.37bn
-0.54%
£66.10bn
+2.08%
£38.91bn
+1.9%
£2.58bn
+0.5%
£3.06bn
+6.6%
£8.37bn
+0.7%
£8.41bn
+2.5%
£2.53bn
+2.2%
£2.22bn
+5.3%
£2.82bn
+0.18%
Schools
Department
for
Education
£52.81bn
+1.12%
£58.34bn
-0.24%
Office for standards
In education (Ofsted)
£0.182bn -12.5%
£5.86bn
-13.2 %
£6.03bn
+2.3%
Department for Work
& Pensions [4]
£160.68bn
+0.21%
Benefit spending
in Great Britain
£152.35bn
+0.60%
State pensions
Pension
credit
Income
support
Incapacity benefit &
employment &
support allowance
Other
Council
tax benefit
Jobseeker's
allowance
Winter fuel
payments
Statutory maternity pay
£1.99bn -3.1%
£21.61bn
+5.0%
£17.17bn
+0.7%
£8.18bn
-2.3%
£7.78bn
-9.8%
£7.76bn
+12.7%
£5.86bn
-9.9%
£4.97bn
+2.8%
£4.50bn
-6.8%
£2.75bn
-2.3%
£69.78bn
+1.31%
Disability
living allowance
& attendance
allowance
Housing
benefit
Department for Environment, Food & Rural Affairs [3]
Food standards agency
£0.072bn -41.7%
Water services regulation authority
(Ofwat) £0.017bn -3.4%
Environmental risk and emergencies
£1.021bn -4.6%
Environment agency
£0.832bn +4.2%
Environment £0.865bn -16.3%
Natural England £0.213bn -20.6%
Department £0.267bn -15.9%
Rural payments agency £0.228bn -40.8%
Sustainable consumption & production £0.122bn -40.8%
Farming £0.093bn -12.2%
Rural communities £0.073bn -10.4%
Forestry commission £0.045bn -11.0%
Marine management organisation
£0.032bn +0.9%
Royal botanic gardens, Kew £0.025bn -16.8%
Climate change £0.018bn -23.2%
Sustainable development £0.008bn +2.9%
Food supply £0.003bn -31.2%
£2.69bn
-15.22%
Nuclear
Decommissioning
Authority
Low carbon UK £0.623bn -29.2%
Promoting low carbon technologies
in developing countries £0.279bn +159.5%
Professional support & infrastructure
£0.118bn -7.6%
Historic energy liabilities £0.104bn -106.8%
Energy £0.087bn +3.3%
Coal authority £0.071bn +87.0%
International agreement on
climate change £0.005bn +22.4%
Committee on climate
change £0.004bn +12.2%
£6.93bn
+81.1%
Department of Energy &
Climate Change[9]
See note
£8.06bn
+146.0%
Department for
International Development
Country
programmes
Africa
£1.87bn +10.1%
Sub-Saharan Africa
£1.76bn +11.1%
Americas £0.073bn +8.9%
Asia £1.09bn -2.5%
Europe £0.018bn -16.8%
Pacific £0.003bn +19.6%
Commonwealth &
overseas territories
£1.65bn +14.8%
Overseas territories
£0.059bn +14.7%
World Bank
£0.927bn +60.8%
Debt relief
£0.066bn +24.0% European Commission
£1.27bn +3.8%United Nations
£0.355bn +59.5%
£7.69bn
+12.65%
£3.18bn
-22.1%
Equitable Life payment scheme
£1.49bn
BoE dividend £0.063bn
DMO £0.001bn -2.9%Other functions £0.011bn -2.9%
Banking & gilts registration services £0.011bn -11.0%
UK debt management office (DMO) £0.015bn -9.0%
Coinage £0.034bn +17.9%
Core treasury & group shared services £0.176bn -14.5%
Her Majesty’s Treasury [2]
£1.678bn +870.0%
Department of
Communities
and Local
Government
National savings and investments
£0.162bn -1.1%
Office for Budget Responsibility
£0.0017bn New department
Financial stability
/financial
institutions
£13.79bn
Money in
Money in
Constitution group £0.006bn -34.4%
Security and intelligence services
£1.909bn +1.3%
Cabinet Office £0.206bn +2.3%
Office for civil society £0.192bn -17.6%
General election funding £0.102bn +4.1%
Executive non-departmental bodies £0.030bn -22.7%
Directgov £0.023bn -15.7%
Cabinet Office service concession - DEL £0.011bn +160.2%
Cabinet Office utilisation of provisions £0.003bn +1.5%
Members of the European parliament (MEP) £0.002bn -54.8%
Executive NDPBs (net) £0.002bn -39.9%
Independent offices - civil service commissioners £0.001bn -29.5%
BBC
Lottery grants
Museums & galleries £0.427bn -2.6%
Tate gallery £0.055bn-5.1%
Natural history museum
£0.049bn-7.8%
British museum £0.046bn-6.9%
Victoria & Albert museum
£0.044bn-3.8%
NM Liverpool £0.024bn-1.9%
Olympics
£0.362bn
-12.7 %
Sport £0.193bn-13.4%
Sport England £0.121bn-12.3%
Broadcasting and media £0.151bn+0.9%
S4C £0.100bn-4.5%
Libraries sponsored bodies £0.133bn-3.9%
British library £0.106bn-6.1%
Tourism £0.042bn-14.1%
Ceremonial & heritage £0.025bn+25.0%
Royal parks £0.019bn -11.5%
Department for Culture
Media & Sport
£7.02bn
-0.7%
Arts £0.455bn-1.57%
Arts council £0.438bn-6.0%
£2.96bn
-8.7%
£1.81bn
+0.4%
Principal civil
service pension
scheme
Sure Start (including
childcare & nursery funding)
£2.12bn+10.3%
£7.5bn
£5.1bn
£3.6bn
Teachers'
pension
scheme
£6.9bn
NHS
pension
scheme
Armed forces
pension scheme
£1bn
Northern Ireland executive
pension schemes
Judicial pension scheme
£0.1bn
Investment in
school buildings
Academies
£2.08bn+58.8%
School meals
£0.006bn-55.2%
Free schools
£0.006bn
Learning and skills council
(excluding sixth form funding)
Sixth forms (through
Learning and skills council)
£2.18bn-4.0%
Early years
£2.14bn+9.0%
Admin
£0.25bn
-28.5%
Education, standards,
curriculum & qualifications
£0.63bn-24.5%
Workforce training & development
£1.04bn-6.6%
Children & families
£2.0bn-31.3%
UK atomic energy
authority pension scheme
£0.2bn](https://image.slidesharecdn.com/datajournalismdigitalhumanitiespublish-160930192654/75/What-Can-Data-Journalists-and-Digital-Researchers-Learn-from-Each-Other-23-2048.jpg)


![Data
Journalists
NOTES
Total spending, 2010/2011
£691.67bn
+0.34%change after
inflation on 2009/10
SOURCES: GUARDIAN DATA RESEARCH, DEPARTMENTAL RESOURCE
ACCOUNTS, INSTITUTE FOR FISCAL STUDIES, PUBLIC EXPENDITURE
STATISTICAL ANALYSES (PESA)
RESEARCH: SIMON ROGERS, AMI SEDGHI, GEMMA TETLOW
GRAPHIC: JENNY RIDLEY, MICHAEL ROBINSON
Public spending by the UK's central government departments, 2010-2011
Cabinet Office
£0.570bn -7.47%
National school of government (NSG) £0.023bn
House of Commons
£0.164bn
Independent Parliamentary
Standards Authority[8] £0.126bn
New department
Office of communications (Ofcom) [7]
from government funding
(rest from licence fees)
£0.122bn -13.1%
UK trade & investment
(UKTI) £0.085bn -12.5%
House of Lords
£0.077bn -22.3%
National Audit Office
£0.069bn +7.9%
Office of fair trading (OFT)
£0.058bn -9.2%
Revenue & customs
Prosecutions office (RCPO)
£0.046bn -1.1%
Serious fraud office (SFO) £0.036bn -12.5%
Charity commission for England and Wales £0.030bn -4.6%
Office of rail regulation (ORR) £0.028bn -11.0%
Electoral commission £0.022bn -2.2%
Government actuary's department (GAD) £0.019bn +17.4%
Postal services commission
(Postcomm) £0.0082bn -2.1%
Attorney general's office (see also LSLO) £0.0049bn -8.7%
HM crown prosecution service
inspectorate £0.0034bn -27.7%
The figures give a picture of major expenditure but exclude local
government spending not controlled by central government. We don't
have room to show everything — some programmes are just too small to
go here, but this gives a flavour of where your tax pounds go. It also
excludes government departments that are predominantly financed
bytheir income, such as the Crown Estate or the Export Credits Guarantee
Department. The totals here add up to more than the total budget,
because some of the smaller government departments are funded via the
larger ones, such as the Parliamentary Counsel Office, funded via the
Cabinet Office.
ALL % CHANGES TAKE ACCOUNT OF INFLATION
[1] Interest paid on the public debt.
[2] Treasury spending in 2008-09 and 2009-10 was dominated by the
impact of interventions in the financial sector — the figure shown here is
gross spending. In fact, in 2010-11 the net effect of financial stability
activities was to yield income to the Treasury. Loans to financial
institutions were repaid to the Treasury in 2010-11 and there was no
further purchase of shares and other assets in the year — so we have
shown the core department spending separately. The increase is due to
the provision for Equitable Life.
[3] The Rural Payments Agency distributes CAP payments — covered by
transfers from EU so do not show up as net spending here.
[4] Benefit spending excludes child benefit, guardians' allowance,
widows’ pensions, statutory paternity pay, statutory
adoption pay — these paid by HMRC, MoD, DBERR respectively.
[5] Excludes spending on family health services. GP running cost
includes salaries, hospitality budgets, home and overseas
accommodation costs.
[6] Totals absent from MoD annual report and supplied separately to
other figures by the department.
[7] The amount of government funding from BIS and DCMS, rest from
licence fees from broadcasters and media organisations.
[8] MPs’ expenses now administered by the Independent Parliamentary
Standards Authority (IPSA).
[9] This includes increase of £5bn in est. liabilities for the UK’s nuclear
legacy over the 100 years. It is NOT allocated for spending in one year.
Excl. this DECC’s total expenditure for 2010/11 is therefore £3.16bn with
£1.7bn of that allocated to the Nuclear Decommissioning Authority
Main pension schemes are forecasts for 2010-11
Debt interest [1]
£43.90bn
+36.2%
Child trust fund
£0.23bn
-28.12%
Tax credits
£28.09bn
+23.08%
Child
benefit
£12.05 bn
-1.9%
HM Revenue
& Customs [8]
£45.78bn
-1.09%
Social justice &
Local government
Environment, sustainability
& housing £0.794bn +5.8%
Rural
affairs
£0.134bn
-14.7%
Heritage
£0.183bn -3.8%
Health & social
services
Children, education,
lifelong learning & skills
£2.19bn +0.8%
Economy & transport
£1.05bn -40.0%
£6.61bn
+5.21%
£4.47bn
-1.73%
£15.87bn
-3.92%
Devolved
spending
Wales
Wales Office (WO)
£0.0050bn -12.1%
£18.76bn
+3.2%
£14.09bn
+11.5%
Higher &
further education
Universities
Further
education
£24.04bn
-11.52%
Department
for Business,
Innovation and
Skills
£4.67bn
-15.8%£3.0bn
-5.4%
£5.86bn
-5.0%
Science
Innovation & enterprise
£1.36bn -16.1%
Free & fair markets
£0.72bn -7.6%
Professional support
£0.38bn -2.2%
Research
councils
Roads
Rail
London £2.77bn+1.3%
Local authority
£1.17bn +0.5%
Supported capital expenditure
(Revenue) £0.975bn +5.0%
Buses £0.771bn -1.8%
Olympics £0.236bn +12.9%
Crossrail £0.220bn
Admin £0.188bn -5.6%
DVLA trading fund £0.187bn -20.4%
Coastguard £0.132bn -11.1%
Aviation, maritime, security & safety £0.129bn -39.7%
Sustainable travel £0.115bn -19.1%
Science, research & support functions £0.042bn -60.2%
Renewable fuels agency £0.001bn +4.0%£12.32bn
-18.3%
Department for Transport
£3.79bn
-18.2%
£2.93bn
-41.1%
UK border agency
£1.70bn -3.4%
Police pensions
£1.44bn -7.2%
Office for security &
counter-terrorism
£0.808bn -3.7%
AME charges £0.399bn +367.2%
Central services £0.204bn -22.6% Area-based grants £0.071bn -14.5%
European solidarity mechanism £0.022bn
Government equalities office £0.012bn -19.4%
Identity & passport service £0.005bn -94.7%
National fraud authority £0.004bn -1.0%
£10.45bn
+-7.69%
Home Office
Crime &
policing
Criminal records bureau £0.001bn +116.5%
£5.6bn
-3.2%
£37.8bn
-7.51%
Neighbourhoods Localism
London
governance
£0.048bn -2.8%
£6.0bn
-38.5%
£25.9bn
-2.5%
Spending by local
& regional government
£3.0bn
+90.8%
Foreign and
Commonwealth Office
£2.25bn -3.0% [6]
Admin & embassies
£1.09bn -3.9%
Peacekeeping grants
£0.408bn +10.7%
UN & other international
organisations £0.294bn -0.2%
BBC World Service £0.265bn -4.3%
British Council £0.189bn -8.7%
Conflict prevention programme
Grants £0.106bn -6.4%
Non-departmental bodies £0.006bn -2.9%
Scotland Office (SO)
£0.0078bn -5.9%
Health &
wellbeing
Local
Government
Finance and
sustainable
growth
Education & lifelong
learning
£2.88bn +0.2%
Scottish teachers' & NHS
pension schemes
£2.52bn -9.2%
Justice £1.95bn +2.6%
Rural affairs & the
Environment £0.517bn -8.1%
Office of the first minister
£0.267bn -2.1%
Admin £0.264bn -6.0%
Crown office and procurator fiscal £0.120bn -2.1%
Scottish parliament corporate body £0.102bn -4.2%
Scottish courts service £0.098bn
Forestry commission (Scotland) £0.096bn -0.2%
£34.88bn
+2.95%
Devolved
spending
Scotland
£12.29bn
+14.4%
£10.52bn
-0.8%
£3.20bn
-8.5%
War pensions
£0.935bn -7.3%
Army
Royal
Navy
Royal
Air
Force
Chief, joint ops
£0.047bn -89.9%
Operations &
peace-keeping
Afghanistan
Iraq
£0.095bn -73.1%
Libya
£0.022bn
Equipment
& support
Central
command
Admin
£2.03bn -8.1%
£22.77bn
+31.7%
£7.29bn
+6.7%
£2.84bn
-1.9%
£2.89bn
+4.7%£3.77bn
-4.1%
£2.31bn
+0.7%
Defence
estates
£4.66bn
+25.0%
£2.63bn
-6.2%
Ministry of
Defence [6]
£39.46bn
-1.95%
Devolved spending
Northern Ireland
£9.05bn
-2.01%
£4.5bn
-1.1%
£2.1bn
-5.1%
Education
Regional development
£1.07bn +30.9%
Employment and learning
£0.837bn -0.02%
Social development
£0.791bn +1.5%
Environment £0.312bn +100.3%Enterprise, trade & investment
£0.273bn -7.8%
Finance and personnel
£0.198bn +5.8%
Culture, arts and leisure £0.173bn -8.6%
Office of the first minister & deputy first minister
£0.090bn -11.1%
Northern Ireland Assembly £0.052bn +15.6%
Agriculture & rural development £0.051bn -79.9%
Other departments £0.022bn -0.6%
Northern Ireland Office (NIO)
£0.039bn +0.9%
Northern Ireland human rights
Commission £0.0016bn -4.0%
Prisons & probation (National
Offender Management Service)Criminal legal aid £1.22bn +7.8%
HM Courts Service £0.999bn +25.3%
Civil legal aid £0.921bn -6.8%
Policy, corporate services &
Associated offices £0.917bn +51.1%
Youth justice board £0.467bn -6.2%
Criminal injuries compensation authority
£0.426bn +312.5%
Tribunals service
£0.279bn -9.8%
Top judicial salaries
£0.143bn -3.6%
Legal services commission administration
£0.136bn -0.1%
Central funds £0.078bn -14.3%
HM courts & tribunals service
£0.012bn -93.8%
Parole board £0.010bn +11.7%
Ministry of Justice
£9.46bn
+1.0%
£4.22bn
-11.0%
Health protection agency
£0.177bn -25.1%
Department
of Health
£105.60bn
+0.28%
NHS
£87.61bn
+1.29%
[5]
Secondary
health care
(hospitals etc)
Primary
healthcare
GP
servicesPrescriptions
Dental
Opthalmic
£0.48bn
-0.7%
Pharmacy
£1.98bn-3.1%
Learning
difficulties
Mental
illness
Maternity
General & acute
A & E
Community
health
Other
contractual
£8.29bn
+1.3%
£7.68bn
-1.6%
£21.37bn
-0.54%
£66.10bn
+2.08%
£38.91bn
+1.9%
£2.58bn
+0.5%
£3.06bn
+6.6%
£8.37bn
+0.7%
£8.41bn
+2.5%
£2.53bn
+2.2%
£2.22bn
+5.3%
£2.82bn
+0.18%
Schools
Department
for
Education
£52.81bn
+1.12%
£58.34bn
-0.24%
Office for standards
In education (Ofsted)
£0.182bn -12.5%
£5.86bn
-13.2 %
£6.03bn
+2.3%
Department for Work
& Pensions [4]
£160.68bn
+0.21%
Benefit spending
in Great Britain
£152.35bn
+0.60%
State pensions
Pension
credit
Income
support
Incapacity benefit &
employment &
support allowance
Other
Council
tax benefit
Jobseeker's
allowance
Winter fuel
payments
Statutory maternity pay
£1.99bn -3.1%
£21.61bn
+5.0%
£17.17bn
+0.7%
£8.18bn
-2.3%
£7.78bn
-9.8%
£7.76bn
+12.7%
£5.86bn
-9.9%
£4.97bn
+2.8%
£4.50bn
-6.8%
£2.75bn
-2.3%
£69.78bn
+1.31%
Disability
living allowance
& attendance
allowance
Housing
benefit
Department for Environment, Food & Rural Affairs [3]
Food standards agency
£0.072bn -41.7%
Water services regulation authority
(Ofwat) £0.017bn -3.4%
Environmental risk and emergencies
£1.021bn -4.6%
Environment agency
£0.832bn +4.2%
Environment £0.865bn -16.3%
Natural England £0.213bn -20.6%
Department £0.267bn -15.9%
Rural payments agency £0.228bn -40.8%
Sustainable consumption & production £0.122bn -40.8%
Farming £0.093bn -12.2%
Rural communities £0.073bn -10.4%
Forestry commission £0.045bn -11.0%
Marine management organisation
£0.032bn +0.9%
Royal botanic gardens, Kew £0.025bn -16.8%
Climate change £0.018bn -23.2%
Sustainable development £0.008bn +2.9%
Food supply £0.003bn -31.2%
£2.69bn
-15.22%
Nuclear
Decommissioning
Authority
Low carbon UK £0.623bn -29.2%
Promoting low carbon technologies
in developing countries £0.279bn +159.5%
Professional support & infrastructure
£0.118bn -7.6%
Historic energy liabilities £0.104bn -106.8%
Energy £0.087bn +3.3%
Coal authority £0.071bn +87.0%
International agreement on
climate change £0.005bn +22.4%
Committee on climate
change £0.004bn +12.2%
£6.93bn
+81.1%
Department of Energy &
Climate Change[9]
See note
£8.06bn
+146.0%
Department for
International Development
Country
programmes
Africa
£1.87bn +10.1%
Sub-Saharan Africa
£1.76bn +11.1%
Americas £0.073bn +8.9%
Asia £1.09bn -2.5%
Europe £0.018bn -16.8%
Pacific £0.003bn +19.6%
Commonwealth &
overseas territories
£1.65bn +14.8%
Overseas territories
£0.059bn +14.7%
World Bank
£0.927bn +60.8%
Debt relief
£0.066bn +24.0% European Commission
£1.27bn +3.8%United Nations
£0.355bn +59.5%
£7.69bn
+12.65%
£3.18bn
-22.1%
Equitable Life payment scheme
£1.49bn
BoE dividend £0.063bn
DMO £0.001bn -2.9%Other functions £0.011bn -2.9%
Banking & gilts registration services £0.011bn -11.0%
UK debt management office (DMO) £0.015bn -9.0%
Coinage £0.034bn +17.9%
Core treasury & group shared services £0.176bn -14.5%
Her Majesty’s Treasury [2]
£1.678bn +870.0%
Department of
Communities
and Local
Government
National savings and investments
£0.162bn -1.1%
Office for Budget Responsibility
£0.0017bn New department
Financial stability
/financial
institutions
£13.79bn
Money in
Money in
Constitution group £0.006bn -34.4%
Security and intelligence services
£1.909bn +1.3%
Cabinet Office £0.206bn +2.3%
Office for civil society £0.192bn -17.6%
General election funding £0.102bn +4.1%
Executive non-departmental bodies £0.030bn -22.7%
Directgov £0.023bn -15.7%
Cabinet Office service concession - DEL £0.011bn +160.2%
Cabinet Office utilisation of provisions £0.003bn +1.5%
Members of the European parliament (MEP) £0.002bn -54.8%
Executive NDPBs (net) £0.002bn -39.9%
Independent offices - civil service commissioners £0.001bn -29.5%
BBC
Lottery grants
Museums & galleries £0.427bn -2.6%
Tate gallery £0.055bn-5.1%
Natural history museum
£0.049bn-7.8%
British museum £0.046bn-6.9%
Victoria & Albert museum
£0.044bn-3.8%
NM Liverpool £0.024bn-1.9%
Olympics
£0.362bn
-12.7 %
Sport £0.193bn-13.4%
Sport England £0.121bn-12.3%
Broadcasting and media £0.151bn+0.9%
S4C £0.100bn-4.5%
Libraries sponsored bodies £0.133bn-3.9%
British library £0.106bn-6.1%
Tourism £0.042bn-14.1%
Ceremonial & heritage £0.025bn+25.0%
Royal parks £0.019bn -11.5%
Department for Culture
Media & Sport
£7.02bn
-0.7%
Arts £0.455bn-1.57%
Arts council £0.438bn-6.0%
£2.96bn
-8.7%
£1.81bn
+0.4%
Principal civil
service pension
scheme
Sure Start (including
childcare & nursery funding)
£2.12bn+10.3%
£7.5bn
£5.1bn
£3.6bn
Teachers'
pension
scheme
£6.9bn
NHS
pension
scheme
Armed forces
pension scheme
£1bn
Northern Ireland executive
pension schemes
Judicial pension scheme
£0.1bn
Investment in
school buildings
Academies
£2.08bn+58.8%
School meals
£0.006bn-55.2%
Free schools
£0.006bn
Learning and skills council
(excluding sixth form funding)
Sixth forms (through
Learning and skills council)
£2.18bn-4.0%
Early years
£2.14bn+9.0%
Admin
£0.25bn
-28.5%
Education, standards,
curriculum & qualifications
£0.63bn-24.5%
Workforce training & development
£1.04bn-6.6%
Children & families
£2.0bn-31.3%
UK atomic energy
authority pension scheme
£0.2bn](https://crownmelresort.com/image.slidesharecdn.com/datajournalismdigitalhumanitiespublish-160930192654/75/What-Can-Data-Journalists-and-Digital-Researchers-Learn-from-Each-Other-23-2048.jpg)


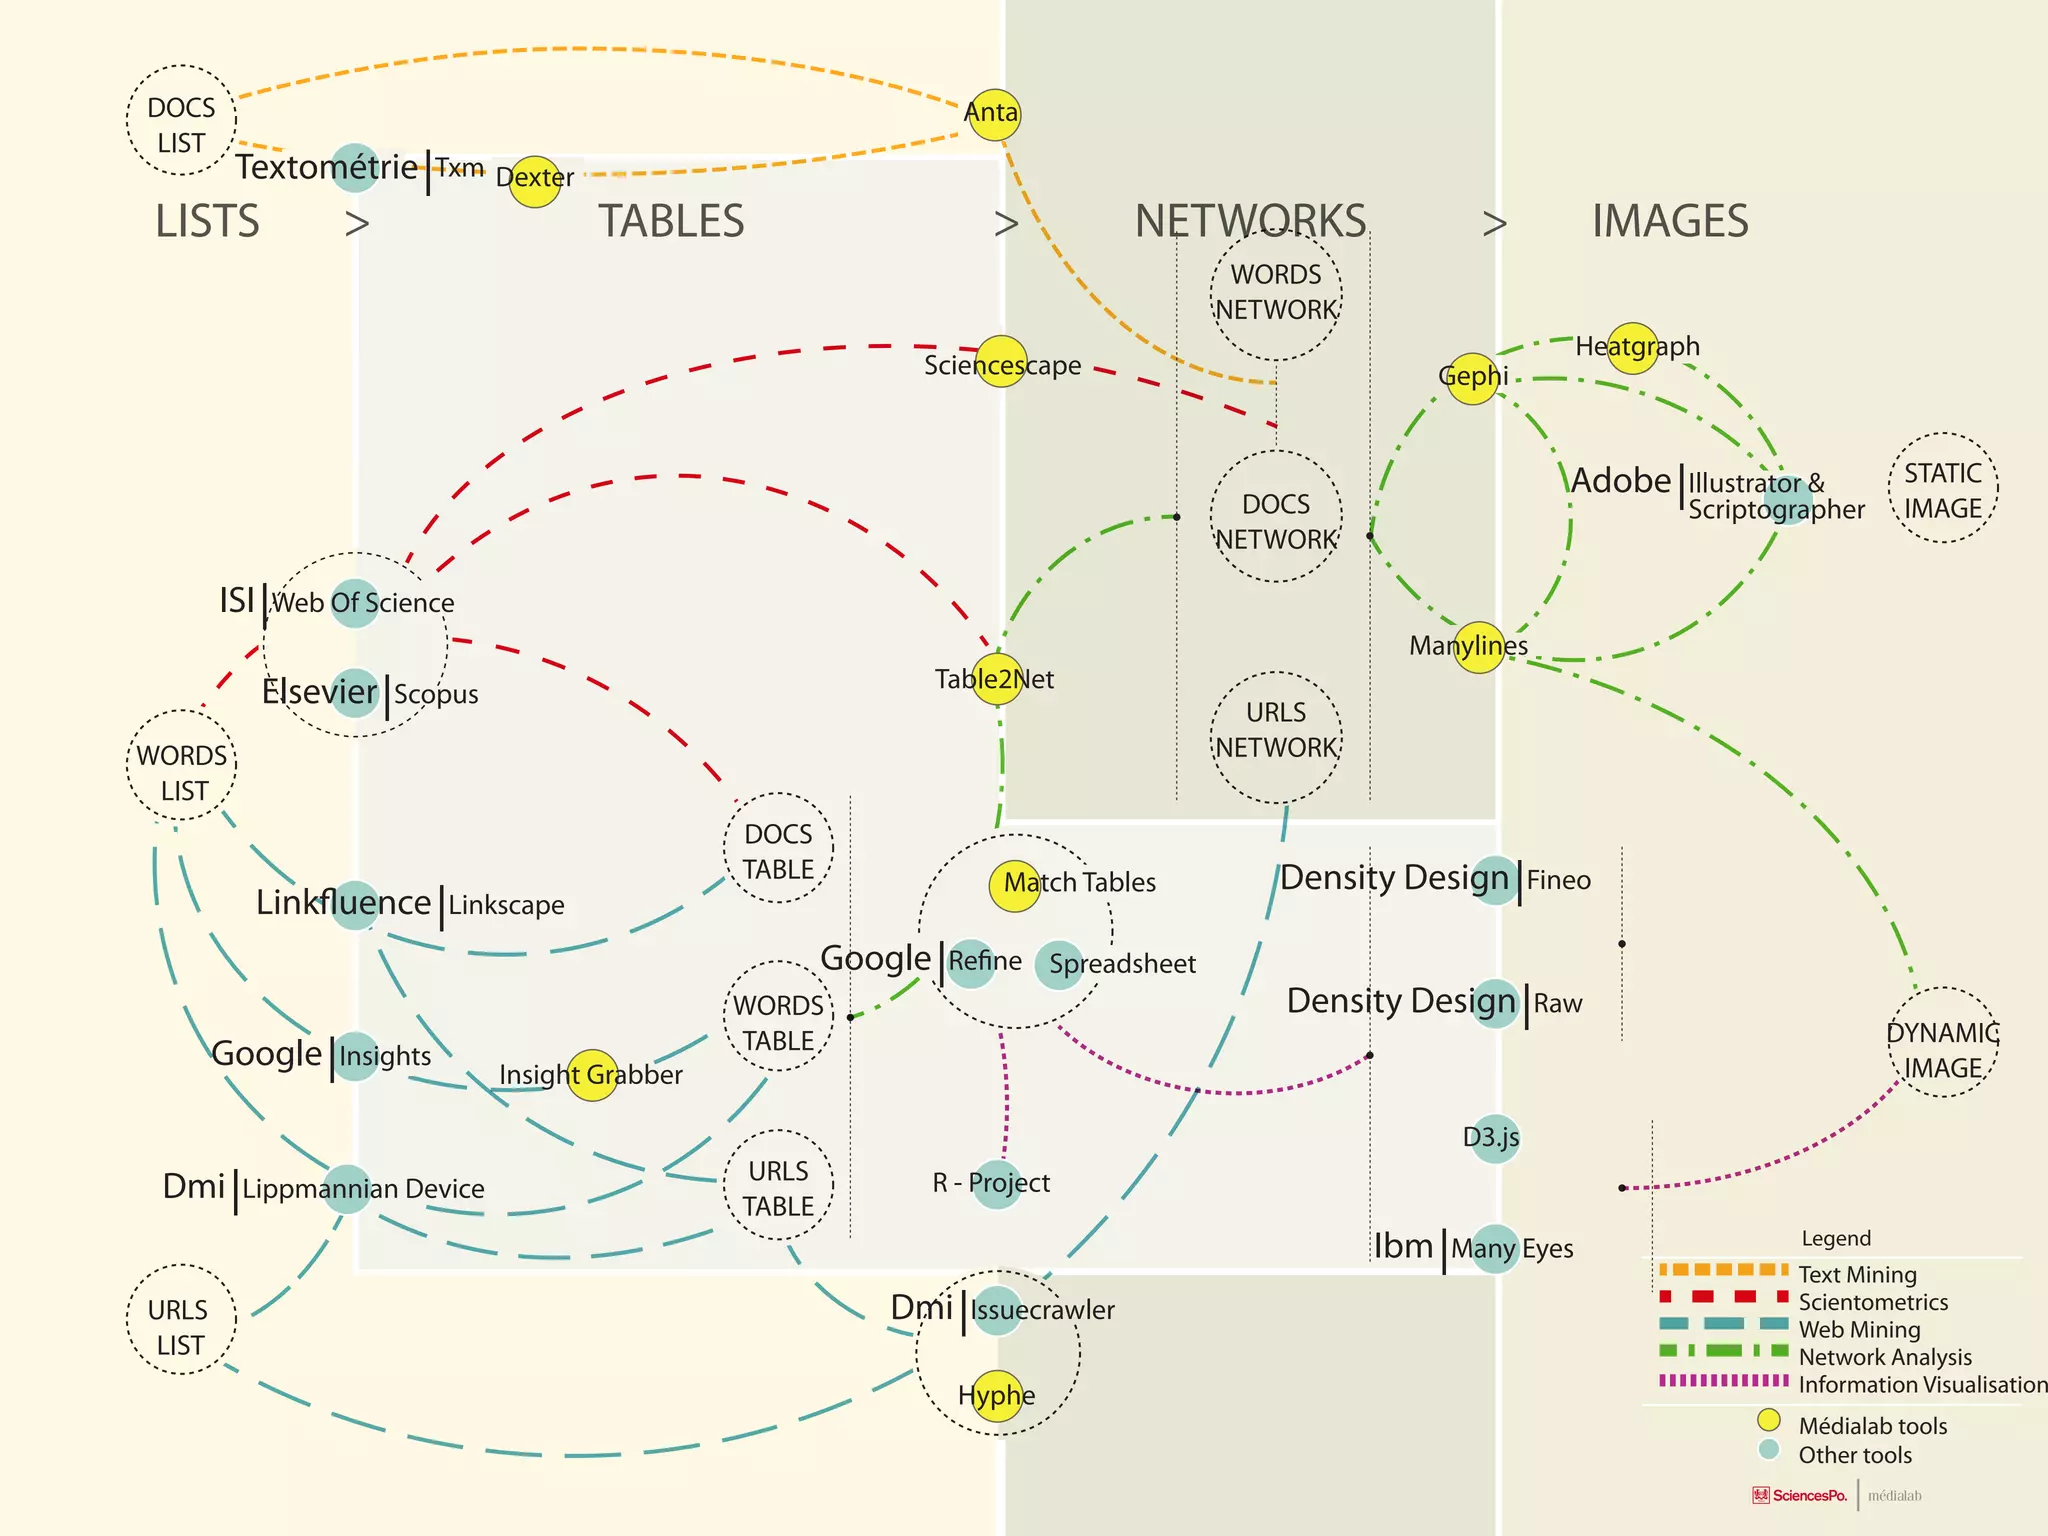
The document discusses the relationship between data journalism and digital research, outlining the similarities and potential collaborations between these two fields. It highlights various tools and methods used in data journalism and digital research, emphasizing the diversity of data work. Additionally, the document provides insights into public spending by the UK government and the financial aspects of various departments.


