Visual Communication
• GIFs
•Screenshots
• Screen recordings
• Infographics
• Videos
• Data visualization
• Slideshows
• Photos
4.
Pictures – Thingsto Consider
Aesthetics:
• High-resolution photos
• Or at least, good quality
• Pleasing to the eye
• Complementary colours
• Especially in data vis
5.
Pictures – Thingsto Consider
Is it visible?
• Large enough to see without
zooming in
Is it placed appropriately?
• Centered in essays or reports
• On the right side in presentations
6.
Using Figures inReports
The use of figures or graphics in a report requires:
• A relevant figure or graphic that enhances the context
• A caption to describe it
• A reference to the figure and its meaning in the report’s text
The research report requires at least 1 relevant graphic
or figure incorporated in the text.
7.
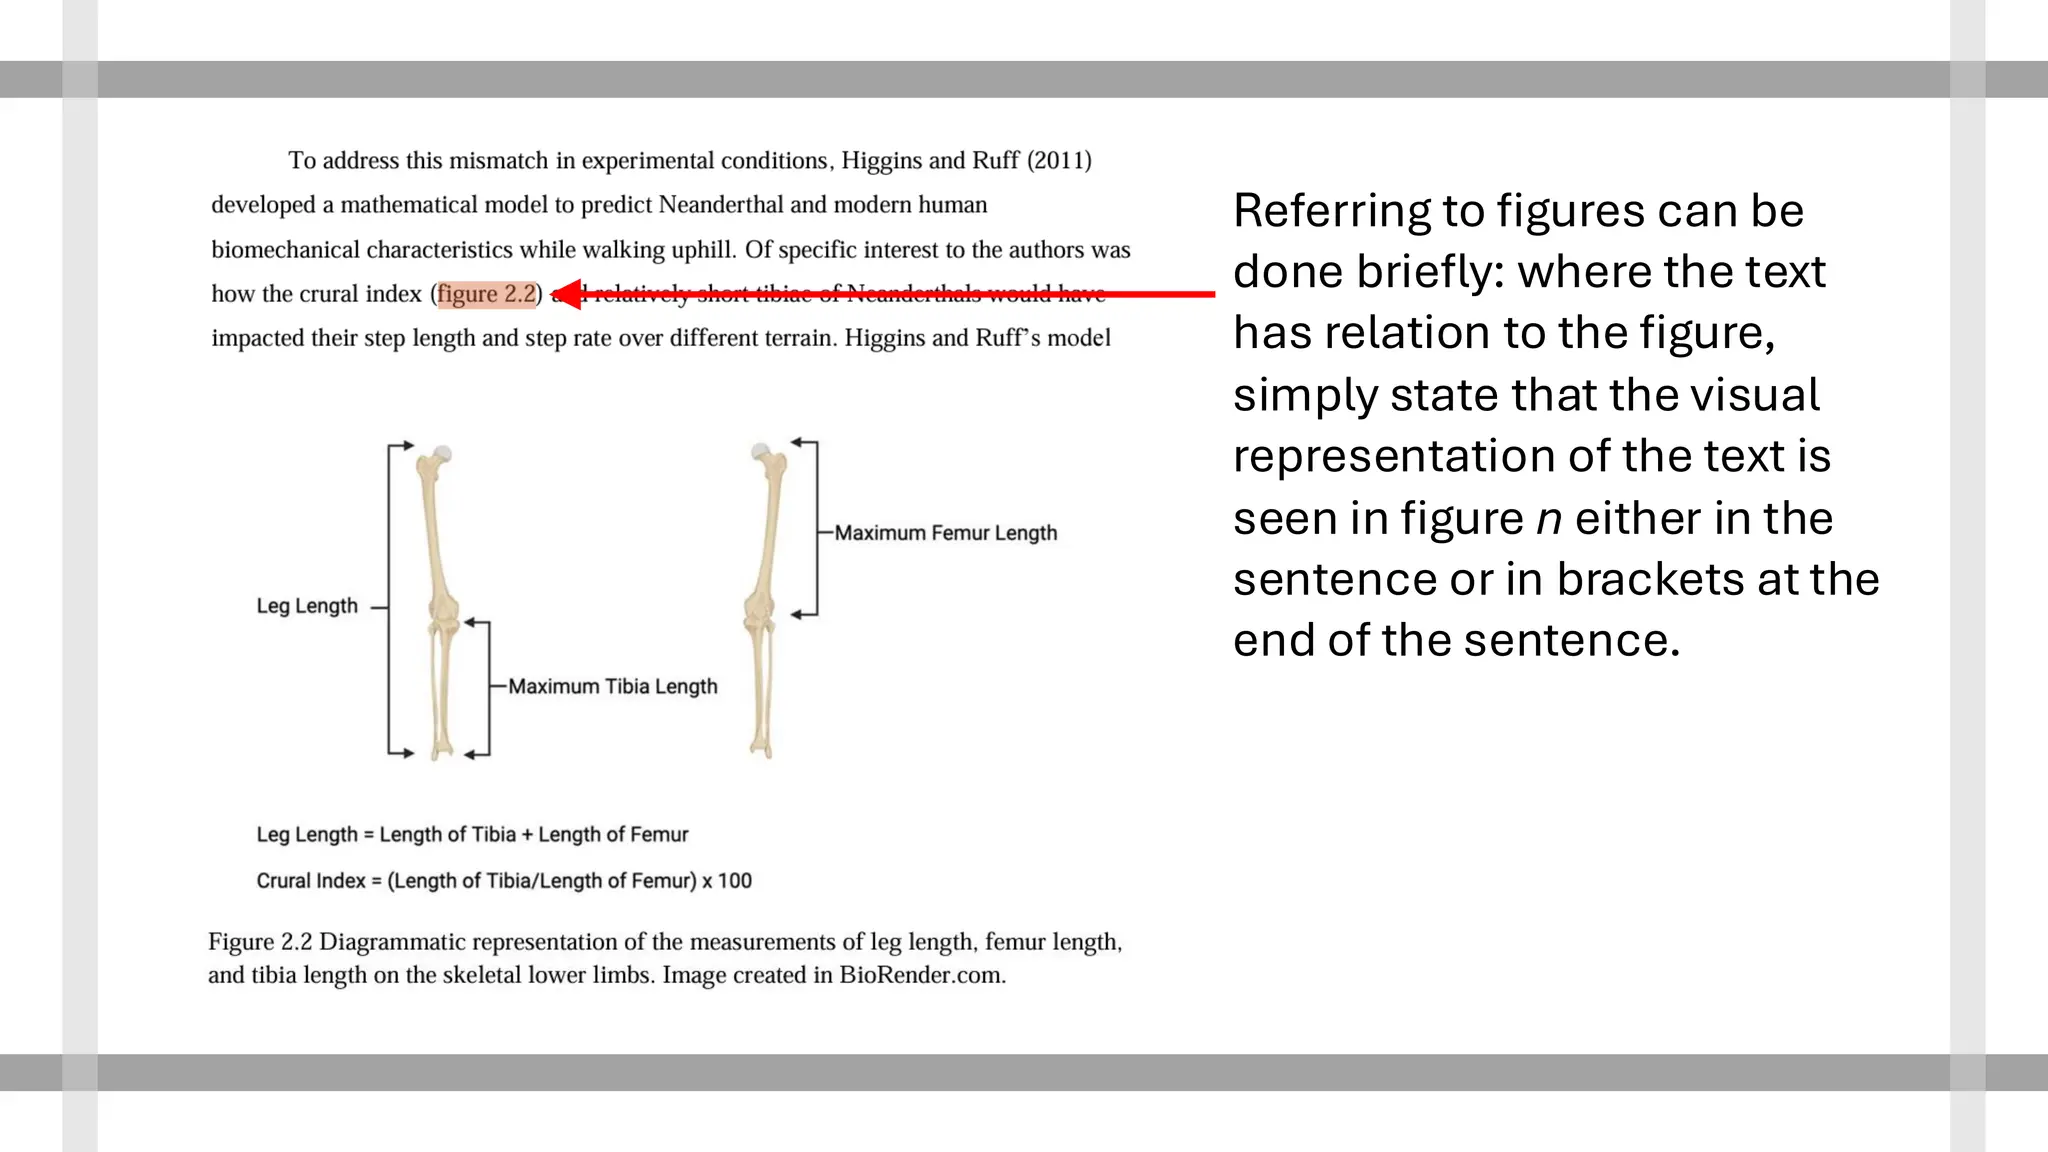
Referring to figurescan be
done briefly: where the text
has relation to the figure,
simply state that the visual
representation of the text is
seen in figure n either in the
sentence or in brackets at the
end of the sentence.
8.
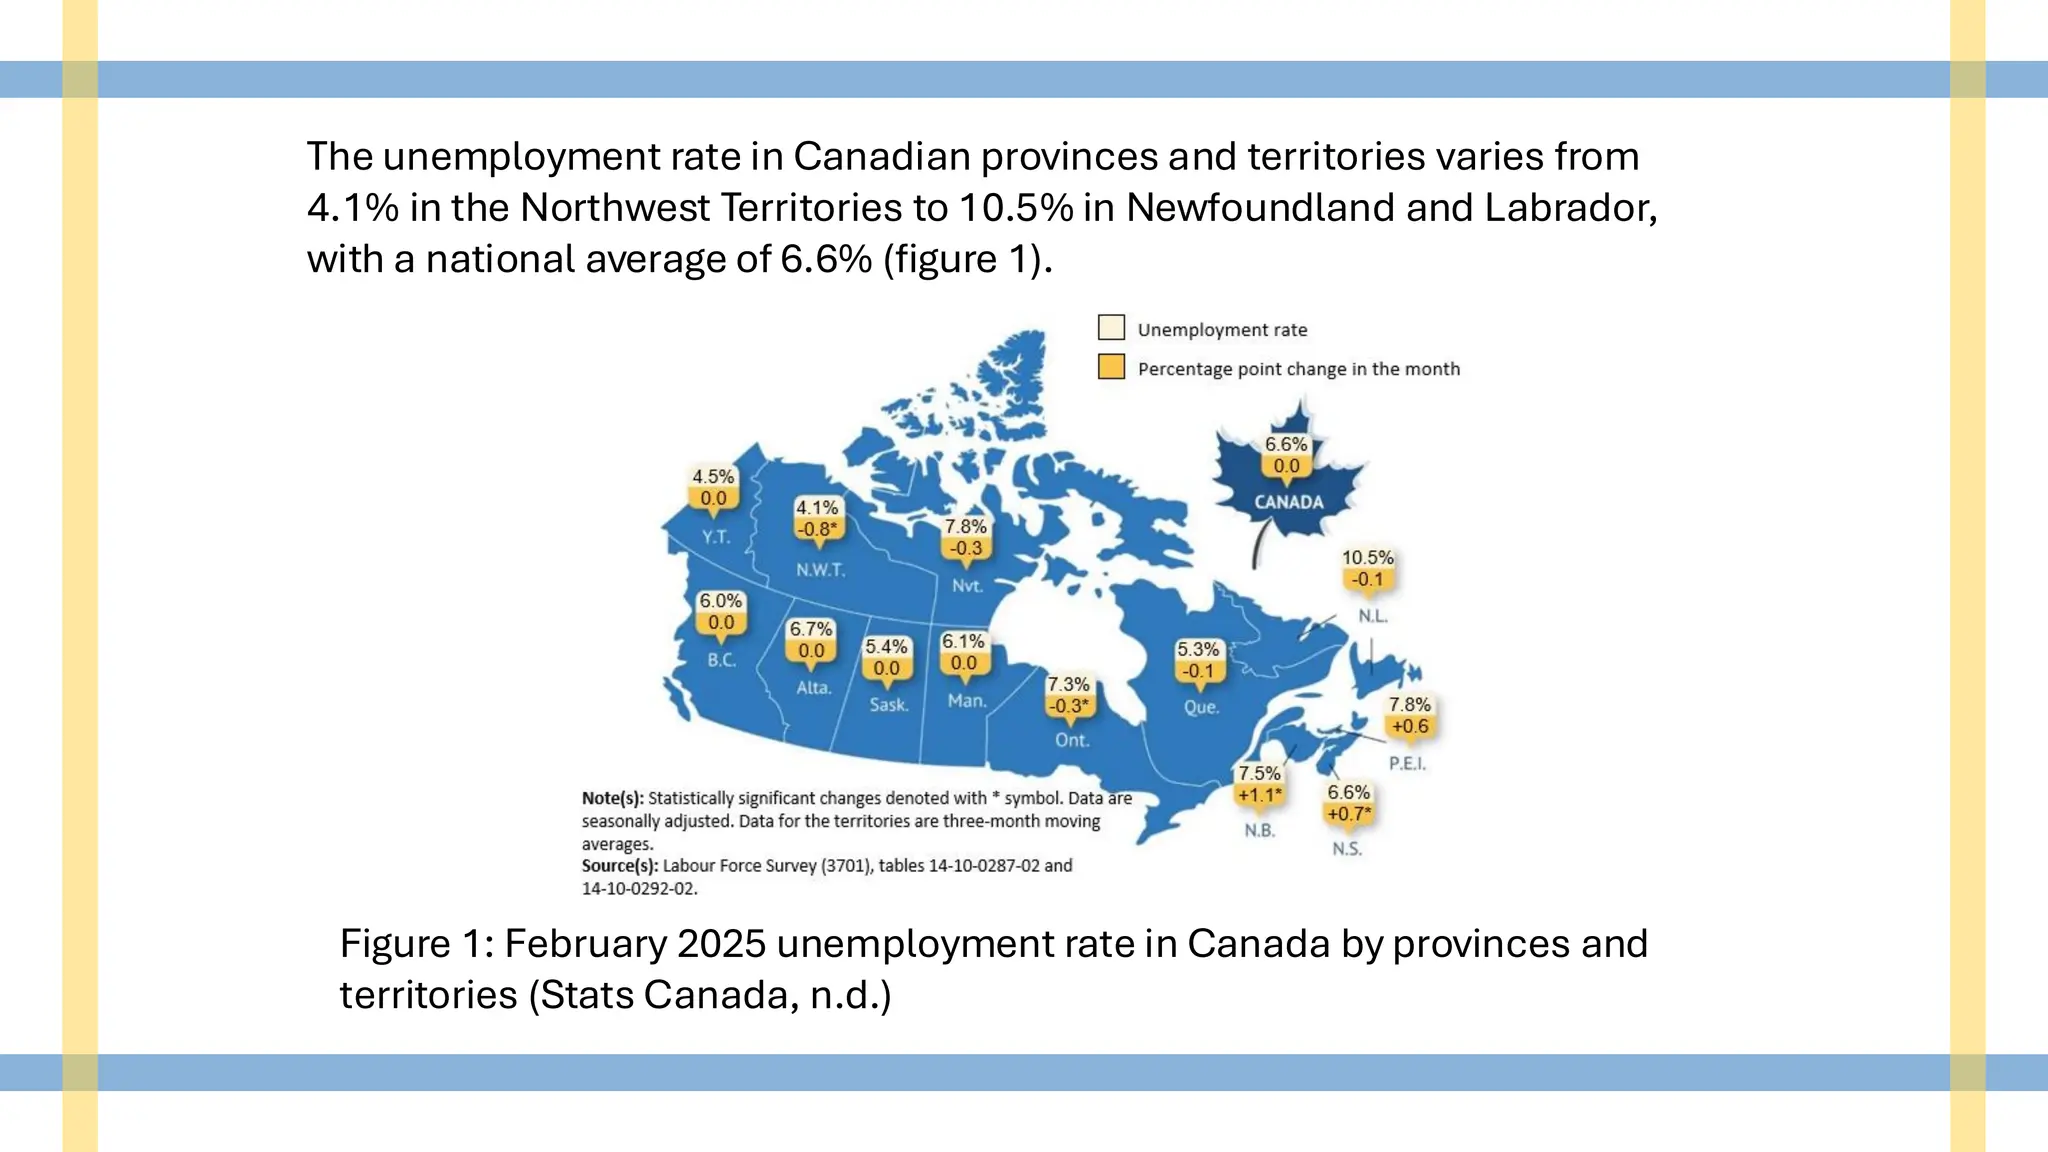
Figure 1: February2025 unemployment rate in Canada by provinces and
territories (Stats Canada, n.d.)
The unemployment rate in Canadian provinces and territories varies from
4.1% in the Northwest Territories to 10.5% in Newfoundland and Labrador,
with a national average of 6.6% (figure 1).
9.
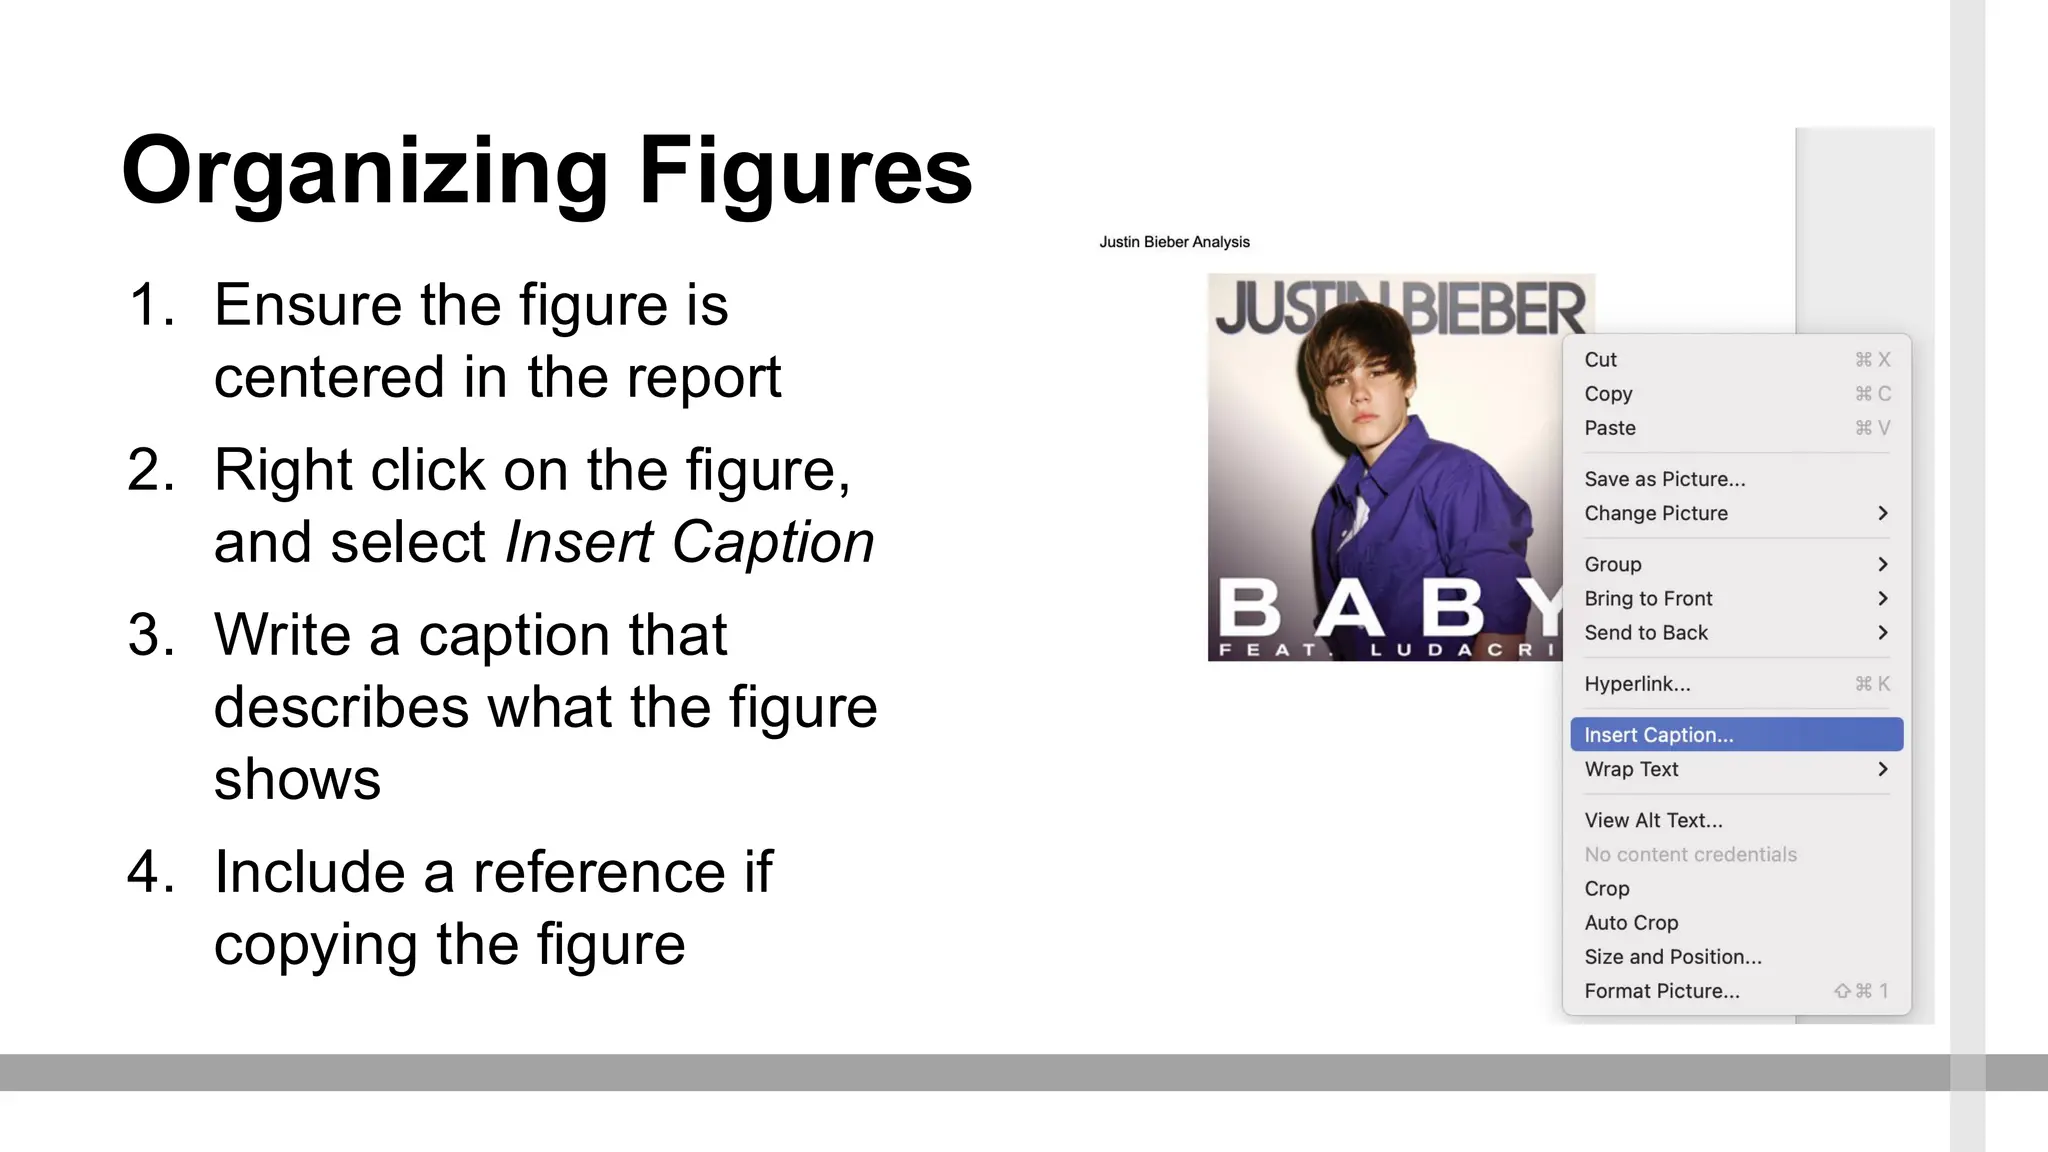
Organizing Figures
1. Ensurethe figure is
centered in the report
2. Right click on the figure,
and select Insert Caption
3. Write a caption that
describes what the figure
shows
4. Include a reference if
copying the figure
10.
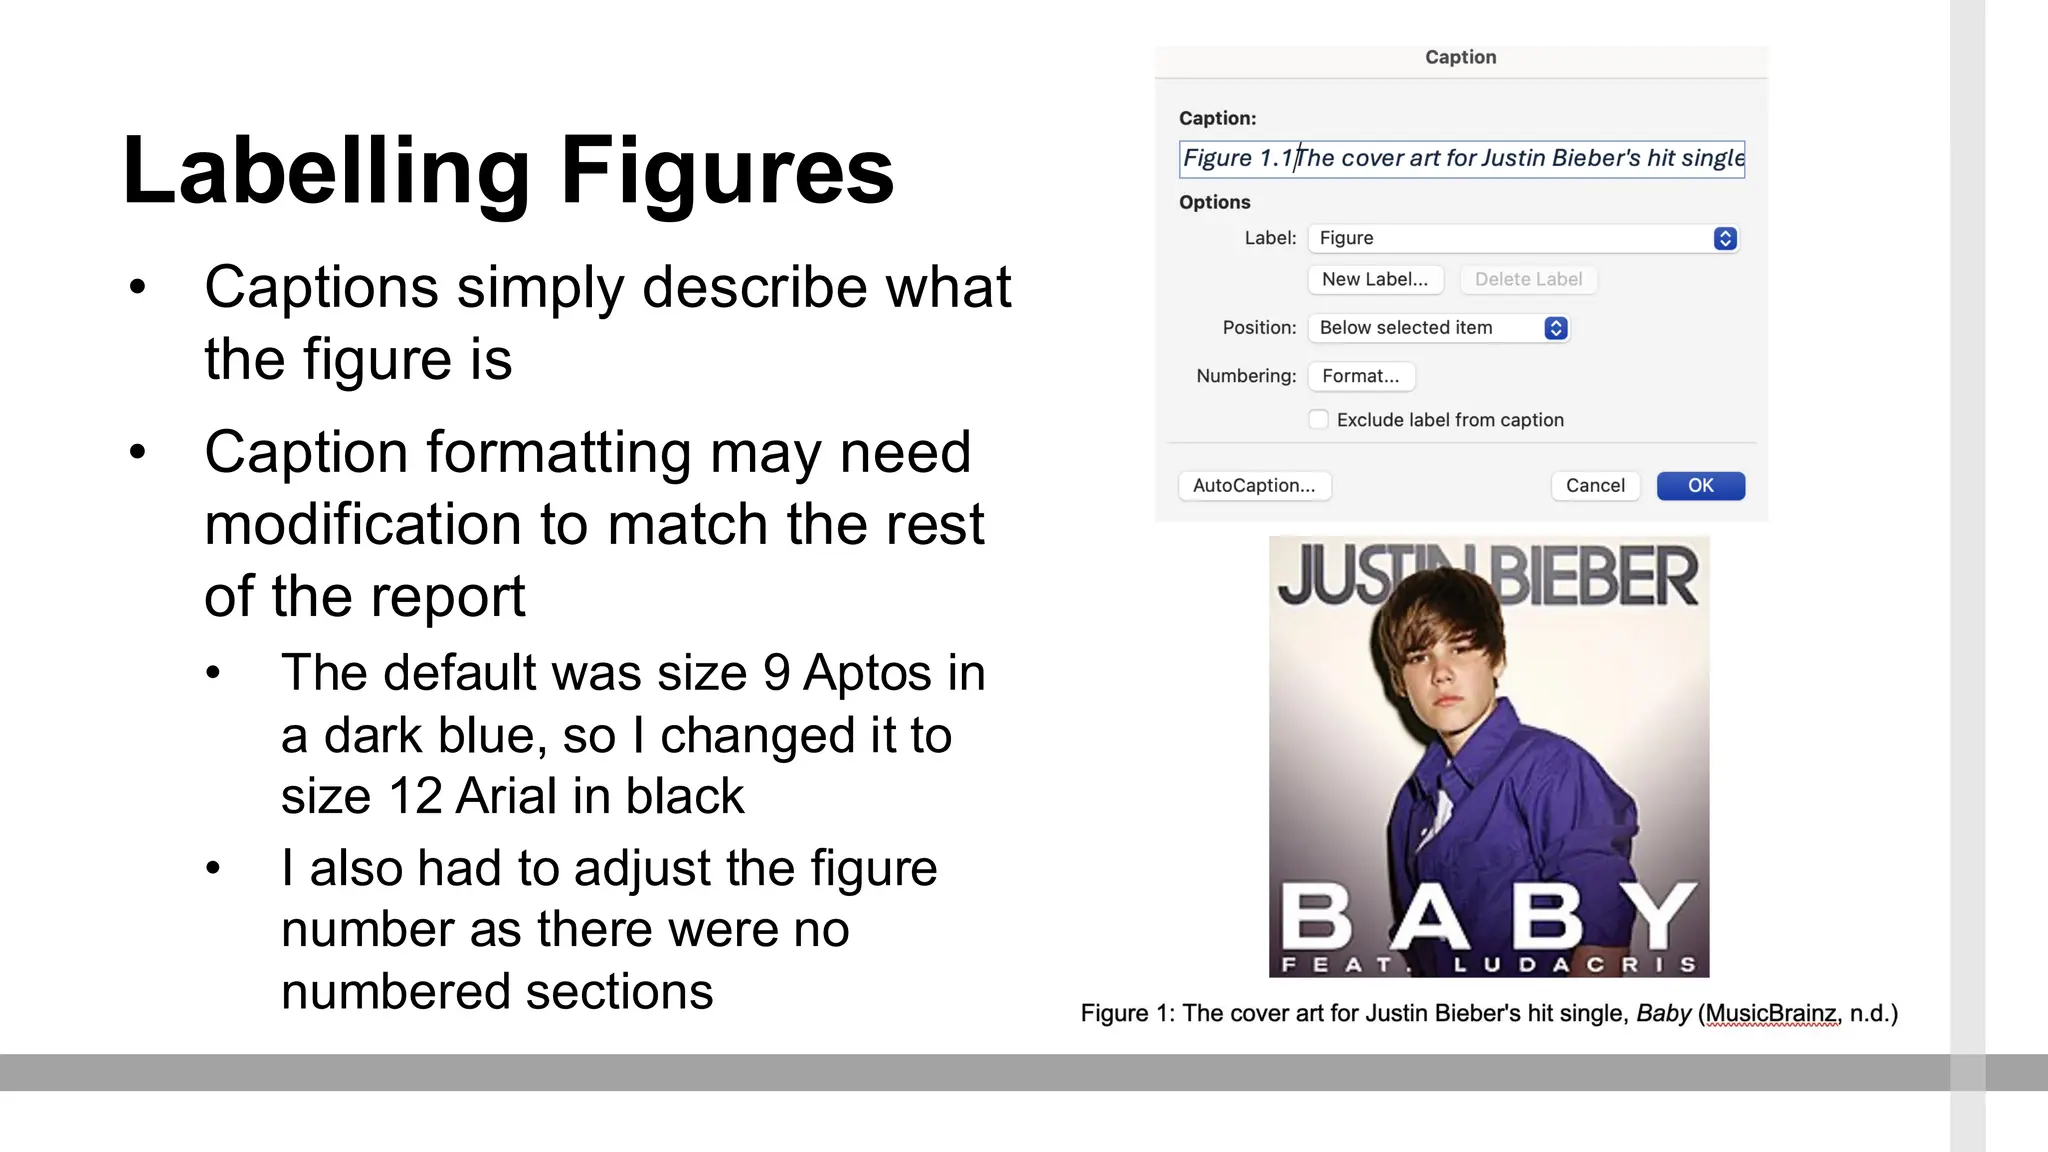
Labelling Figures
• Captionssimply describe what
the figure is
• Caption formatting may need
modification to match the rest
of the report
• The default was size 9 Aptos in
a dark blue, so I changed it to
size 12 Arial in black
• I also had to adjust the figure
number as there were no
numbered sections