Download as PDF, PPTX


![Code Check: BAD Code
9
dat_dropship<- read.csv("~/Projects/STB_dropships_Apr2015_csv.csv", colClasses = "character")
dat_dropship_march <- read.csv("~/Projects/STB_dropships_Mar2015_cvs.csv", colClasses =
"character")
dat_dropship_feb <- read.csv("~/Projects/STB_dropships_Feb2015_cvs.csv", colClasses =
"character")
dat_dropship_jan<- read.csv("~/Projects/STB_dropships_Jan2015_csv.csv", colClasses =
"character")
dat_pass <- read.csv("~/Projects/AprilRepairSTBlatest_circuit.csv", colClasses = "character")
dat_all_Apr_June <- read.csv("~/Projects/Apr-Jun2015STBRepair_allBItables.csv", colClasses =
"character")
dat_pass_Apr_June<-dat_all_Apr_June
# dat_pass_Apr_June<-subset(dat_all_Apr_June,dat_all_Apr_June$FIRST_TEST_RESULT_IND=="FAIL")
##All STBs Repair return type
dat_Repair_Apr_June<-subset(dat_all_Apr_June,dat_all_Apr_June$RETURN_TYPE=="Repair")
dat_Repair_Apr_June_US<-dat_Repair_Apr_June[grep("^US",
dat_Repair_Apr_June$RETURN_LOCATION),]
dat_Repair_Apr_June_US<-
subset(dat_Repair_Apr_June_US,dat_Repair_Apr_June_US$RETURN_AGENT!="V000000")
dat_Repair_Apr_June_US<-
subset(dat_Repair_Apr_June_US,dat_Repair_Apr_June_US$RETURN_AGENT!="AUTOSYNC")
dat_Repair_Apr_June_US<-
subset(dat_Repair_Apr_June_US,dat_Repair_Apr_June_US$RETURN_AGENT!="UNDOC")
Repair_Apr_Jun_Loc_all<-split(dat_Repair_Apr_June,dat_Repair_Apr_June$RETURN_LOCATION)
Locs_Repair_Apr_Jun<-sapply(Repair_Apr_Jun_Loc_all, nrow)
Repair_Apr_Jun_Loc<-split(dat_Repair_Apr_June_US,
paste(dat_Repair_Apr_June_US$RETURN_LOCATION,dat_Repair_Apr_June_US$RETURN_AGENT))
Locs_Agent_Repair_Apr_Jun<-sapply(Repair_Apr_Jun_Loc, nrow)](https://image.slidesharecdn.com/nathenhinson-170817193914/75/Software-Engineering-for-Data-Scientists-9-2048.jpg)


![Code Check: BAD Code
9
dat_dropship<- read.csv("~/Projects/STB_dropships_Apr2015_csv.csv", colClasses = "character")
dat_dropship_march <- read.csv("~/Projects/STB_dropships_Mar2015_cvs.csv", colClasses =
"character")
dat_dropship_feb <- read.csv("~/Projects/STB_dropships_Feb2015_cvs.csv", colClasses =
"character")
dat_dropship_jan<- read.csv("~/Projects/STB_dropships_Jan2015_csv.csv", colClasses =
"character")
dat_pass <- read.csv("~/Projects/AprilRepairSTBlatest_circuit.csv", colClasses = "character")
dat_all_Apr_June <- read.csv("~/Projects/Apr-Jun2015STBRepair_allBItables.csv", colClasses =
"character")
dat_pass_Apr_June<-dat_all_Apr_June
# dat_pass_Apr_June<-subset(dat_all_Apr_June,dat_all_Apr_June$FIRST_TEST_RESULT_IND=="FAIL")
##All STBs Repair return type
dat_Repair_Apr_June<-subset(dat_all_Apr_June,dat_all_Apr_June$RETURN_TYPE=="Repair")
dat_Repair_Apr_June_US<-dat_Repair_Apr_June[grep("^US",
dat_Repair_Apr_June$RETURN_LOCATION),]
dat_Repair_Apr_June_US<-
subset(dat_Repair_Apr_June_US,dat_Repair_Apr_June_US$RETURN_AGENT!="V000000")
dat_Repair_Apr_June_US<-
subset(dat_Repair_Apr_June_US,dat_Repair_Apr_June_US$RETURN_AGENT!="AUTOSYNC")
dat_Repair_Apr_June_US<-
subset(dat_Repair_Apr_June_US,dat_Repair_Apr_June_US$RETURN_AGENT!="UNDOC")
Repair_Apr_Jun_Loc_all<-split(dat_Repair_Apr_June,dat_Repair_Apr_June$RETURN_LOCATION)
Locs_Repair_Apr_Jun<-sapply(Repair_Apr_Jun_Loc_all, nrow)
Repair_Apr_Jun_Loc<-split(dat_Repair_Apr_June_US,
paste(dat_Repair_Apr_June_US$RETURN_LOCATION,dat_Repair_Apr_June_US$RETURN_AGENT))
Locs_Agent_Repair_Apr_Jun<-sapply(Repair_Apr_Jun_Loc, nrow)](https://crownmelresort.com/image.slidesharecdn.com/nathenhinson-170817193914/75/Software-Engineering-for-Data-Scientists-9-2048.jpg)


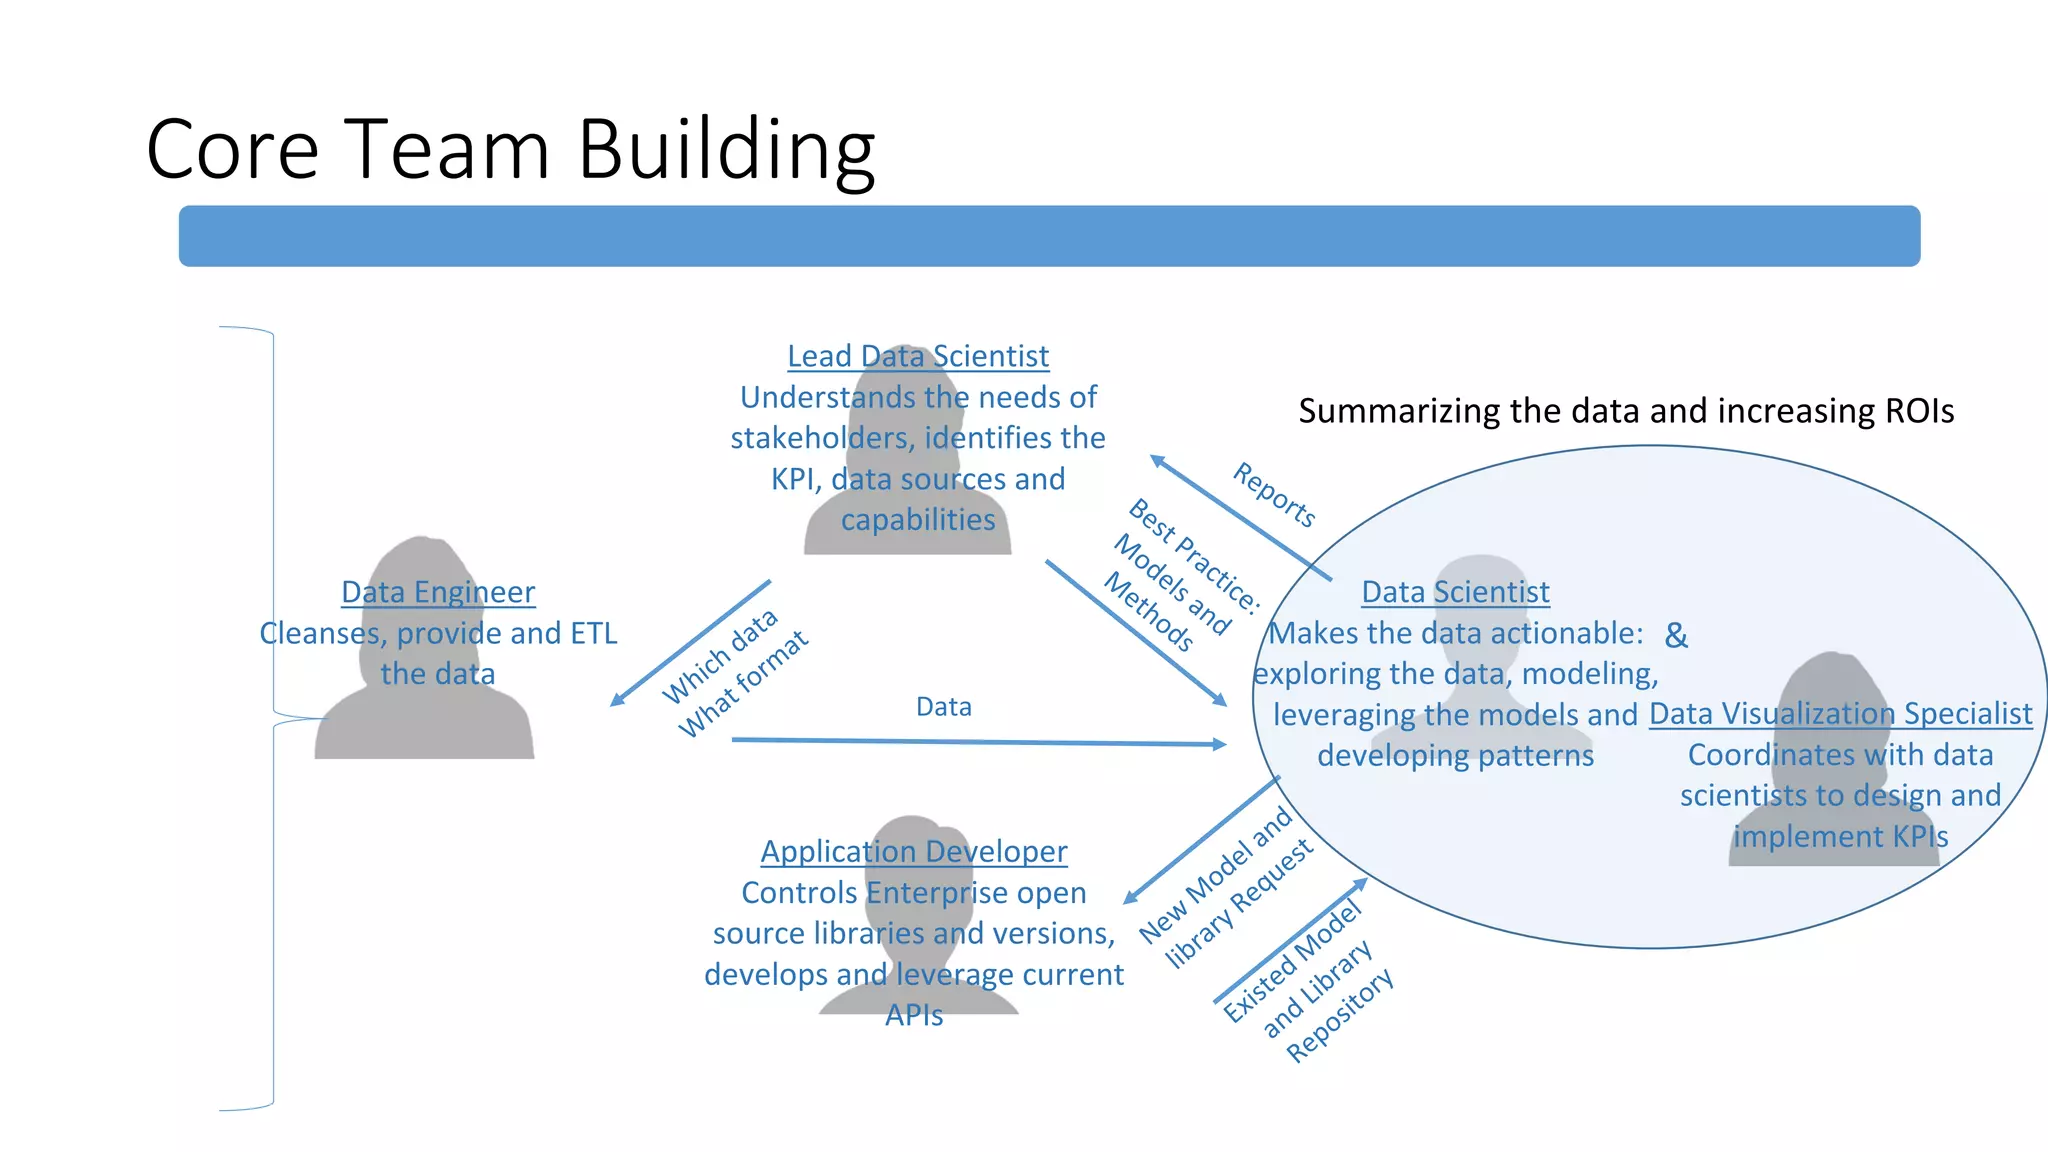
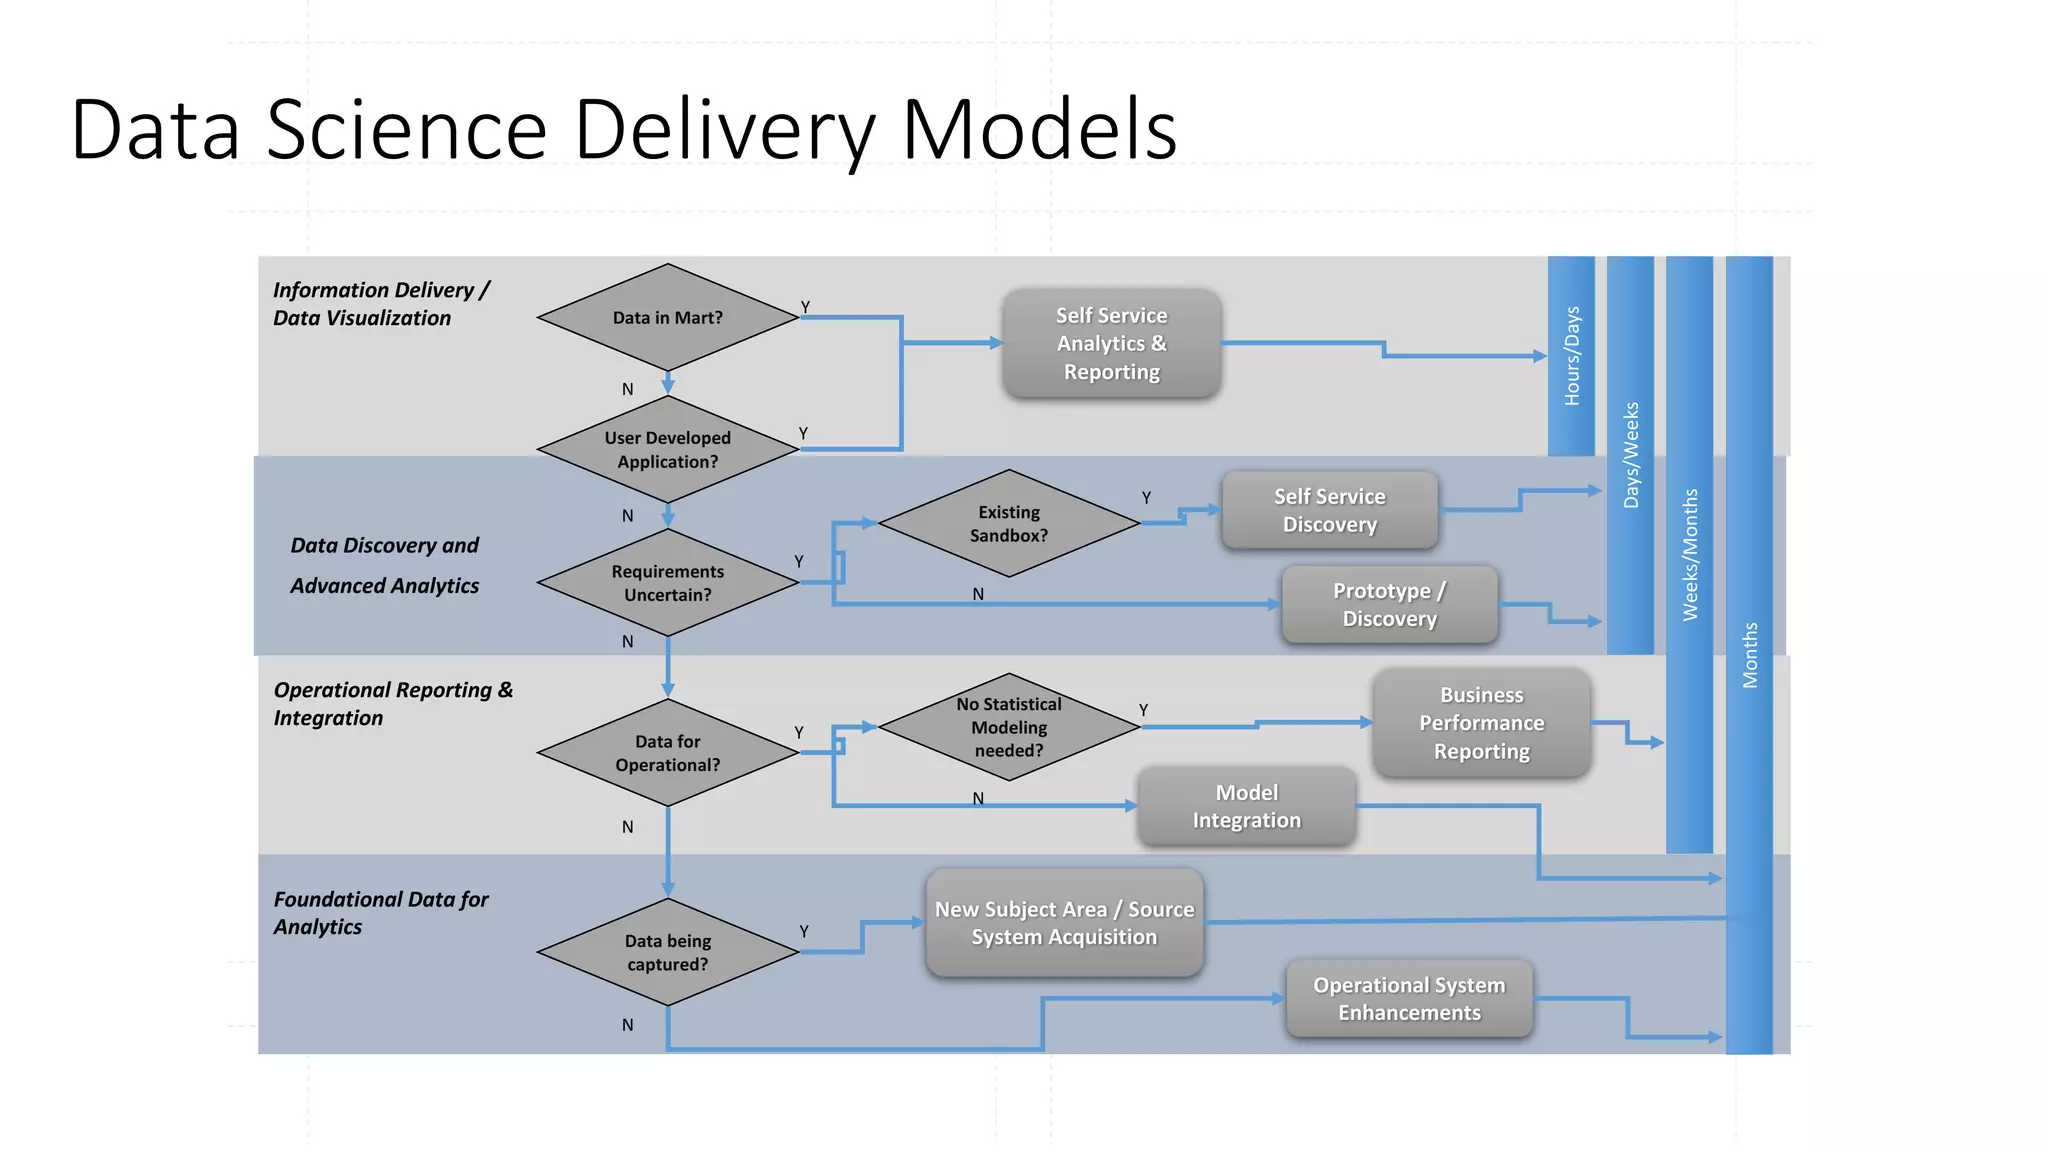
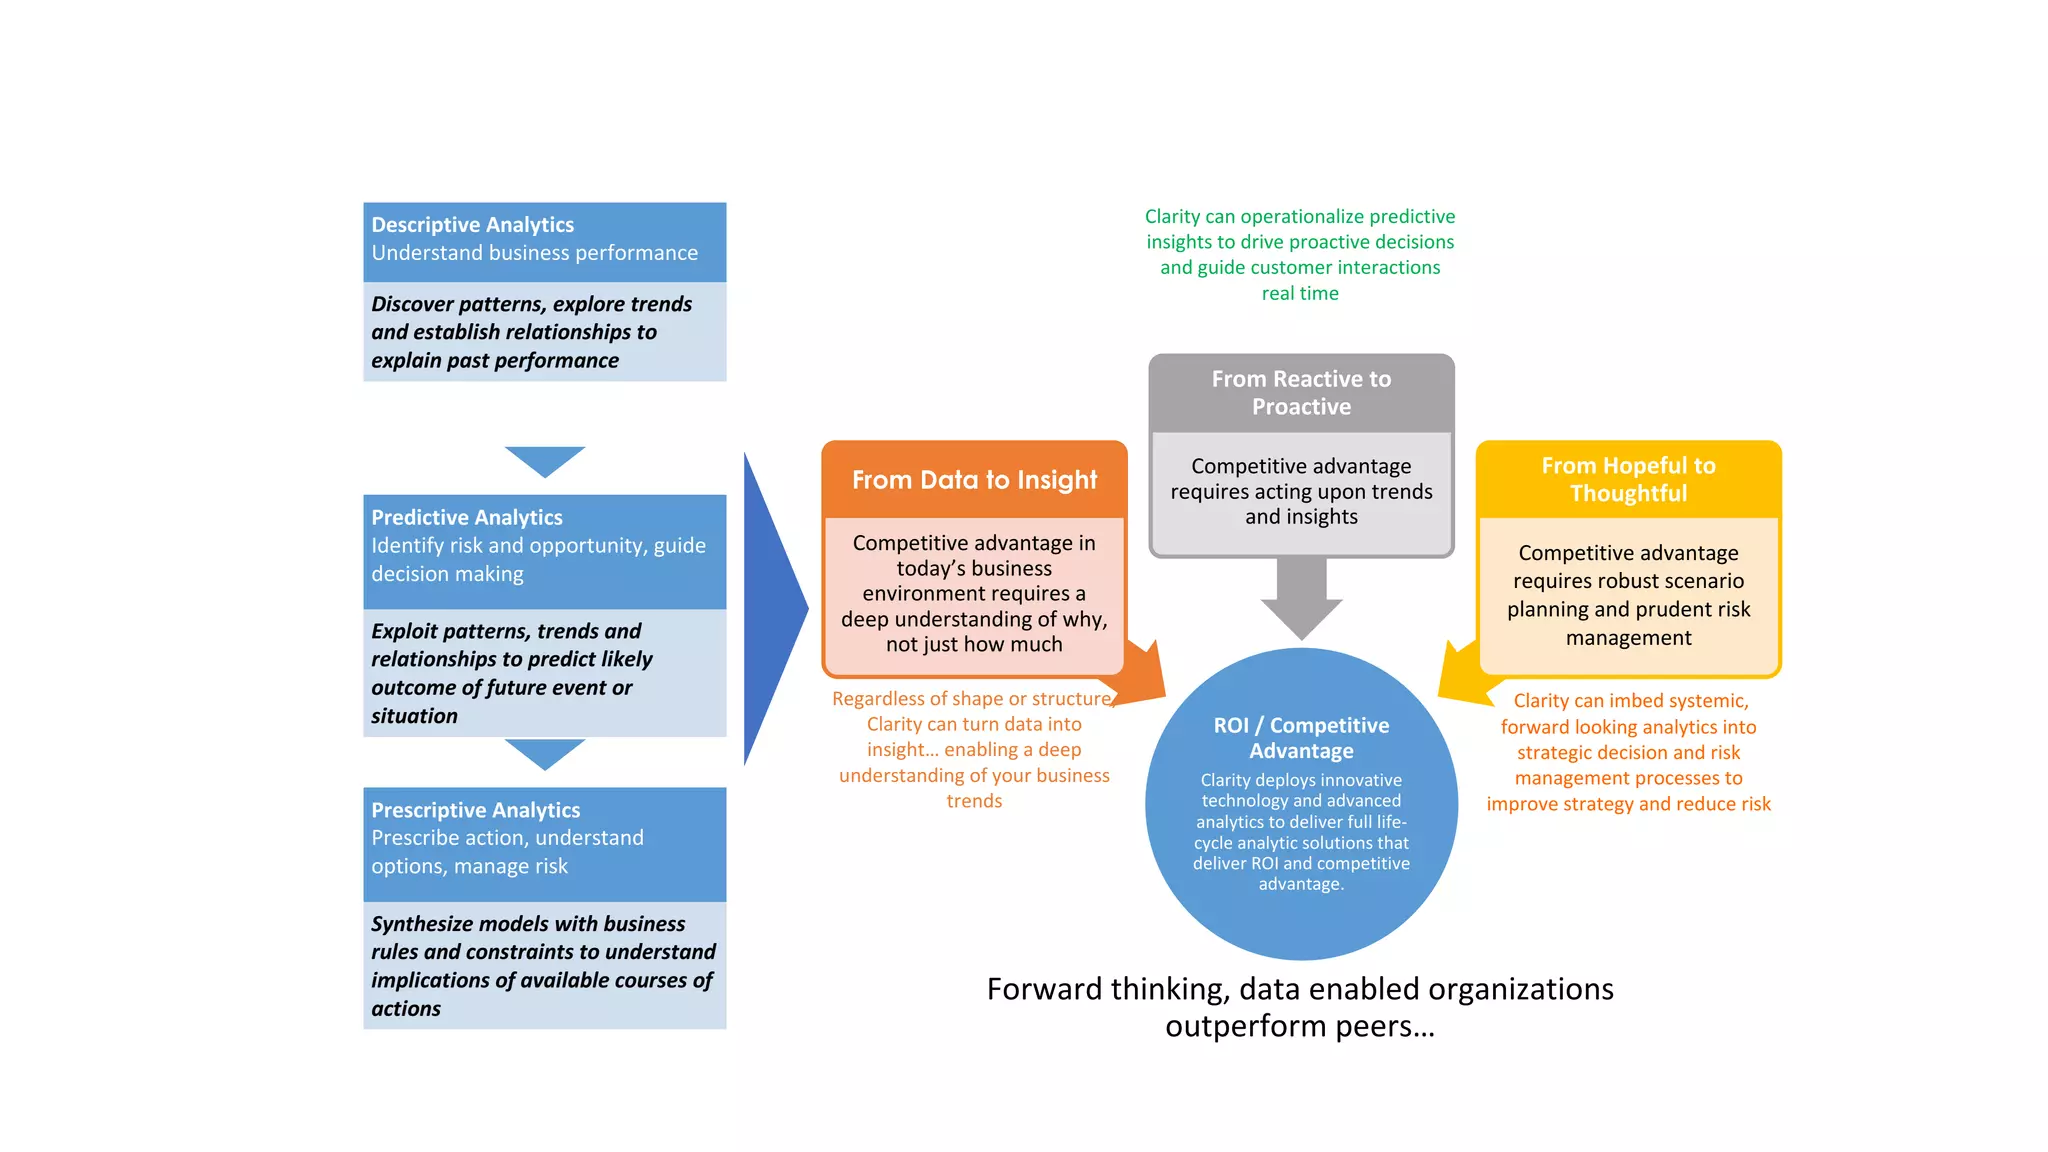
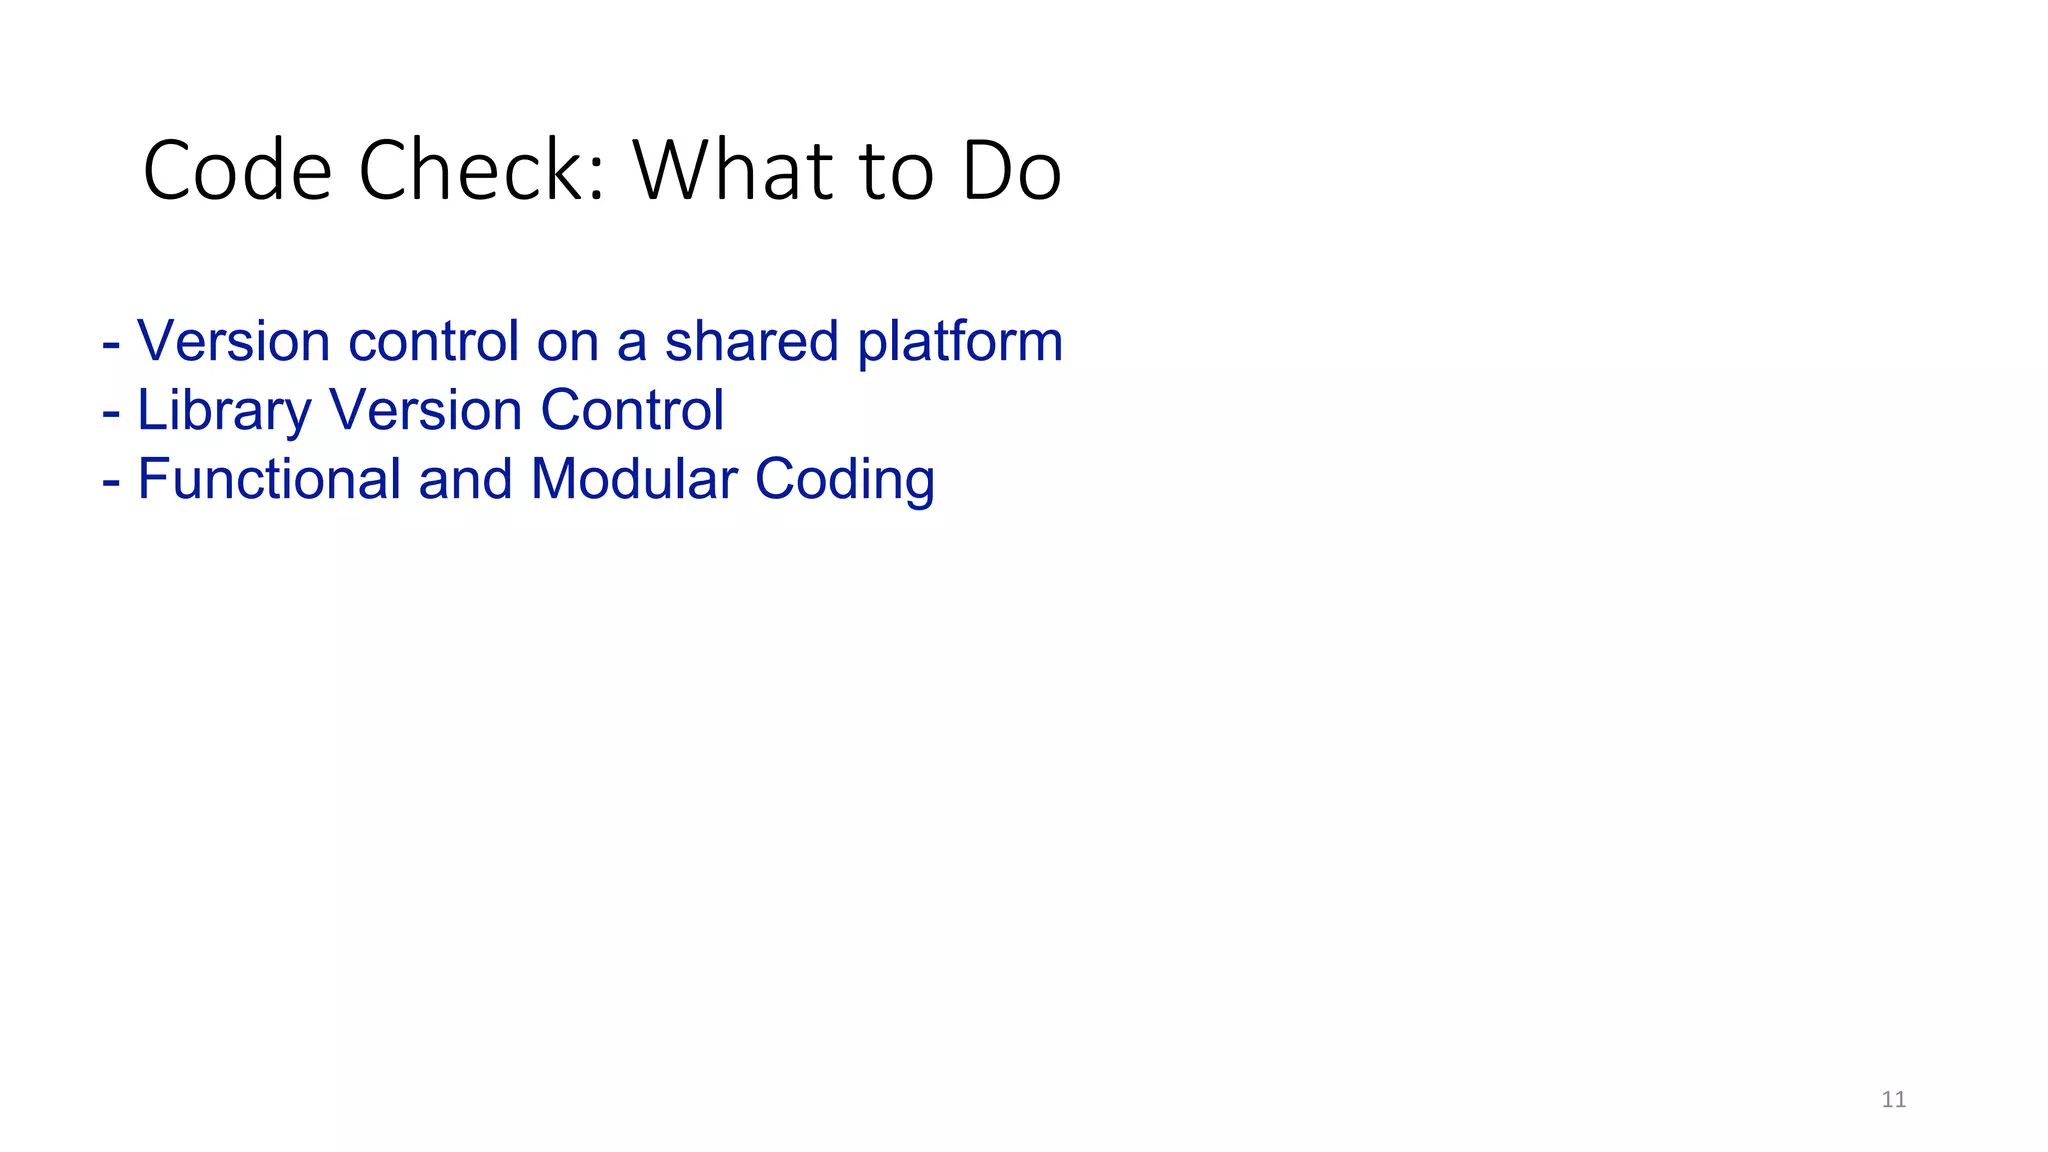
The document outlines the roles and processes in data science, focusing on the collaboration between data engineers, scientists, and application developers to extract actionable insights from data. It highlights the importance of a structured approach to analytics and the implementation of advanced technologies to drive decision-making and competitive advantage. Additionally, it emphasizes the necessity of version control and coding standards to maintain a robust and manageable data infrastructure.