Download to read offline
![Draft version November 11, 2024
Typeset using L
A
TEX twocolumn style in AASTeX631
Sites of Planet Formation in Binary Systems. II. Double the Disks in DF Tau
Taylor Kutra ,1
Lisa Prato ,1
Benjamin M Tofflemire ,2, ∗
Rachel Akeson ,3
G. H. Schaefer ,4
Shih-Yun Tang ,5, 1
Dominique Segura-Cox ,2
Christopher M. Johns-Krull ,5
Adam Kraus ,2
Sean Andrews ,6
and Eric L. N. Jensen 7
1Lowell Observatory, Flagstaff, AZ 86001 USA
2Department of Astronomy, The University of Texas at Austin, Austin, TX 78712, USA
3IPAC/Caltech, Pasadena, CA, 91125, USA
4The CHARA Array of Georgia State University, Mount Wilson Observatory, Mount Wilson, CA 91023, USA
5Physics & Astronomy Department, Rice University, 6100 Main St., Houston, TX 77005, USA
6Center for Astrophysics, Harvard & Smithsonian, 60 Garden Street, Cambridge, MA 02138, USA
7Dept. of Physics & Astronomy, Swarthmore College, 500 College Ave., Swarthmore, PA 19081, USA
ABSTRACT
This article presents the latest results of our ALMA program to study circumstellar disk character-
istics as a function of orbital and stellar properties in a sample of young binary star systems known
to host at least one disk. Optical and infrared observations of the eccentric, ∼48-year period binary
DF Tau indicated the presence of only one disk around the brighter component. However, our 1.3mm
ALMA thermal continuum maps show two nearly-equal brightness components in this system. We
present these observations within the context of updated stellar and orbital properties which indicate
that the inner disk of the secondary is absent. Because the two stars likely formed together, with the
same composition, in the same environment, and at the same time, we expect their disks to be co-eval.
However the absence of an inner disk around the secondary suggests uneven dissipation. We consider
several processes which have the potential to accelerate inner disk evolution. Rapid inner disk dissi-
pation has important implications for planet formation, particularly in the terrestrial-planet-forming
region.
1. INTRODUCTION
A comprehensive paradigm for planet formation re-
quires a fundamental understanding of the conditions,
process, and timescale for circumstellar disk evolution.
Although advancements in theory (see review by Pas-
cucci et al. 2023) and observations, such as ALMA
(Barenfeld et al. 2016; Güdel et al. 2018) or JWST (Ba-
jaj et al. 2024), have brought about new insights, puz-
zling challenges remain. For example, what triggers the
onset of disk dissipation, what is the source of the α
viscosity in the disk, and what sustains the persistence
of some primordial disks for 5–10 Myr (Herczeg et al.
2023)?
Young binary systems offer a unique opportunity to
study both the fragility and robustness of circumstel-
lar disks because membership in a binary system dic-
Corresponding author: Taylor Kutra
tkutra@lowell.edu
∗ 51 Pegasi b Fellow
tates that tidal truncation by the companion (e.g., Arty-
mowicz & Lubow 1994) limits the disk’s outer radii.
Thus disks in binaries have determinate maximum sizes.
Given the dynamical complexity, it is unsurprising that
circumstellar disks in binaries with orbital separations of
≲ 100 AU are smaller, less massive (Jensen et al. 1996;
Harris et al. 2012; Barenfeld et al. 2019), and shorter-
lived (Cieza et al. 2009; Kraus et al. 2012; Cheetham
et al. 2015; Barenfeld et al. 2019) than disks around
more widely spaced or single stars (e.g., Akeson et al.
2019).
Yet despite these seemingly bleak prospects for disk
longevity and potential planet formation, in some cases
the circumstellar disks in close binary systems persist.
Furthermore, planet formation can proceed in close bi-
nary systems, as exemplified by γ Cephei b (Hatzes et al.
2003), GJ 86b (Queloz et al. 2000) and HD 196885 Ab
(Correia et al. 2008), albeit less frequently (Kraus et al.
2016). Clearly circumstellar disk evolution is not reg-
ulated entirely by membership in a close binary; other
processes and influences are at work. This is demon-
arXiv:2411.05203v1
[astro-ph.SR]
7
Nov
2024](https://image.slidesharecdn.com/2411-250122110401-5b94341d/75/Sites-of-Planet-Formation-in-Binary-Systems-II-Double-the-Disks-in-DF-Tau-1-2048.jpg)
![2 Kutra et al.
strated by the large range in age at which circumstellar
disks dissipate (e.g., Haisch et al. 2001; Williams & Cieza
2011). In addition to the binary environment, other fac-
tors drive disk dissipation: by studying the stellar, or-
bital, and disk properties in young binaries, we can use
these nominally coeval systems to explore these factors,
interpreting the evolution of all primordial disks through
this lens.
Using this paradigm, we investigate the young (1-2
Myr) visual binary, DF Tau. It is composed of two
roughly equal mass M2 stars on a 48 year orbit in the
Taurus star forming region (Allen et al. 2017). The pro-
jected orbital separation is only ∼ 100 mas, correspond-
ing to a physical separation of ∼ 14 AU at a distance
of 142 pc (Krolikowski et al. 2021). Both the A and B
components were designated as classical T Tauri stars
(CTTSs) by Hartigan & Kenyon (2003) and White &
Ghez (2001) based on accretion signatures (i.e., the Hα
equivalent width, UV excess, [O I] molecular emission,
and veiling at 6100Ȧ).
White & Ghez (2001) found a much weaker ultraviolet
(UV) excess for the DF Tau secondary, ∆U = 0.85 mag,
compared to that of the primary, ∆U = 2.43 mag. Their
criterion for the presence of a disk is ∆U = 0.8 mag;
however, the uncertainty in the U-band magnitude is
∼ 30% (0.29 mag), indicating a marginal UV CTTS
assignation for DF Tau B.
Allen et al. (2017) presented component-resolved,
near-infrared (NIR) spectroscopy and photometry of the
DF Tau binary and concluded that for DF Tau A, the
NIR colors, IR veiling, and optical/NIR colors were all
consistent with the presence of an accreting circum-
stellar disk. However, they found little variability and
no indication of accretion or significant amounts of cir-
cumstellar material around the secondary and cautioned
that the disk signatures seen for DF Tau B in Hartigan &
Kenyon (2003) could have been the result of contamina-
tion from the disk of DF Tau A, given that the angular
separation at the time of observation was close to the
resolution limit of the Hartigan & Kenyon (2003) HST
STIS observations.
DF Tau is part of our young, small-separation binary
sample observed with ALMA in Cycle 7 (PI Tofflemire).
Targets were selected for this program on the basis of
their relatively complete orbital solutions. As demon-
strated in our recent study of the FO Tau binary (Tof-
flemire et al. 2024), our goal is to understand the disk
dissipation process in the context of the binaries’ stellar
and orbital properties. This work is also a component
of our larger exploration of the spectroscopic and pho-
tometric properties of the individual components in a
sample of close to 100 young binary systems (e.g., Kel-
logg et al. 2017; Allen et al. 2017; Sullivan et al. 2019;
Prato 2023).
In this contribution we focus on our new ALMA obser-
vations, reanalyze the DF Tau NIR component spectra,
including measurements of the stars’ surface averaged
magnetic fields, and update the orbital solution with our
most recent adaptive optics (AO) observations. Given
the precise orbital solution, stellar parameters that sug-
gest similar component temperatures and masses, and
clear evidence for an inner disk around the primary with
only marginal evidence for an inner disk surrounding the
secondary star, DF Tau is a key target for understanding
the onset of disk dissipation.
In section 2 we describe our observations and data re-
duction from ALMA, Keck, TESS/K2, and the Lowell
0.7-m and 1.1m telescopes and we present our analysis
of the multi-wavelength dataset in Section 3. In Section
4 we discuss our results in terms of the disk and binary
interaction, the stellar spin and obliquity and possible
origins for the differences contributing to disk dissipa-
tion in DF Tau. We summarise our work and list main
conclusions in Section 5.
2. OBSERVATIONS AND DATA REDUCTION
2.1. ALMA
Our Cycle 7 observations of DF Tau (project code
2019.1.01739.S) mirror those of Tofflemire et al. (2024).
We used Band 6 receivers in dual polarization mode and
sampled continuum emission over three spectral win-
dows centered on 231.6, 244.0, and 245.9 GHz each with
a bandwidth of 1.875 GHz and 31.25 MHz resolution.
In order to resolve the Keplerian rotation profile of the
disk, we chose a fourth spectral window that covers the
12
CO J = 2−1 transition at 230.538 GHz for the source’s
heliocentric velocity (16.4 km/s, Kounkel et al. 2019)
Observations were taken in compact (short baselines,
SB) and extended (long baselines, LB) array configura-
tions to ensure both high angular resolution and sensi-
tivity to extended emission. The compact configuration
(∼C6 configuration), with baselines between 14 m and
3.6 km, achieved an angular resolution and maximum
recoverable scale of 0.1” and 2.1”, respectively. Observa-
tions took place on 18 July 2021 UTC for 332.640 s using
the compact configuration. The extended configuration
(∼ C8 configuration), with baselines between 40m and
11.6 km, achieved an angular resolution of 0.031” and a
maximum recoverable scale of 0.67”. The observations
for this configuration took place on 24 August 2021 UTC
for 2830.464 s in the extended configuration. The mini-
mum and maximum angular scales covered by both the
compact and extended configuration translate to ∼ 4.6
to 100 AU at the distance of Taurus (∼ 140 pc Kenyon](https://image.slidesharecdn.com/2411-250122110401-5b94341d/75/Sites-of-Planet-Formation-in-Binary-Systems-II-Double-the-Disks-in-DF-Tau-2-2048.jpg)
![Double the Disks in DF Tau 7
59480 59490 59500 59510 59520
0.75
1.00
1.25
Normalized
Flux
TESS
57820 57840 57860 57880 57900
0.75
1.00
1.25
1.50
Normalized
Flux
K2
58000 58500 59000 59500 60000
MJD [JD - 2400000.5]
1.0
2.0
3.0
Normalized
Flux
Lowell
0 5 10 15 20 25
Period [days]
0.0
0.1
0.2
Power
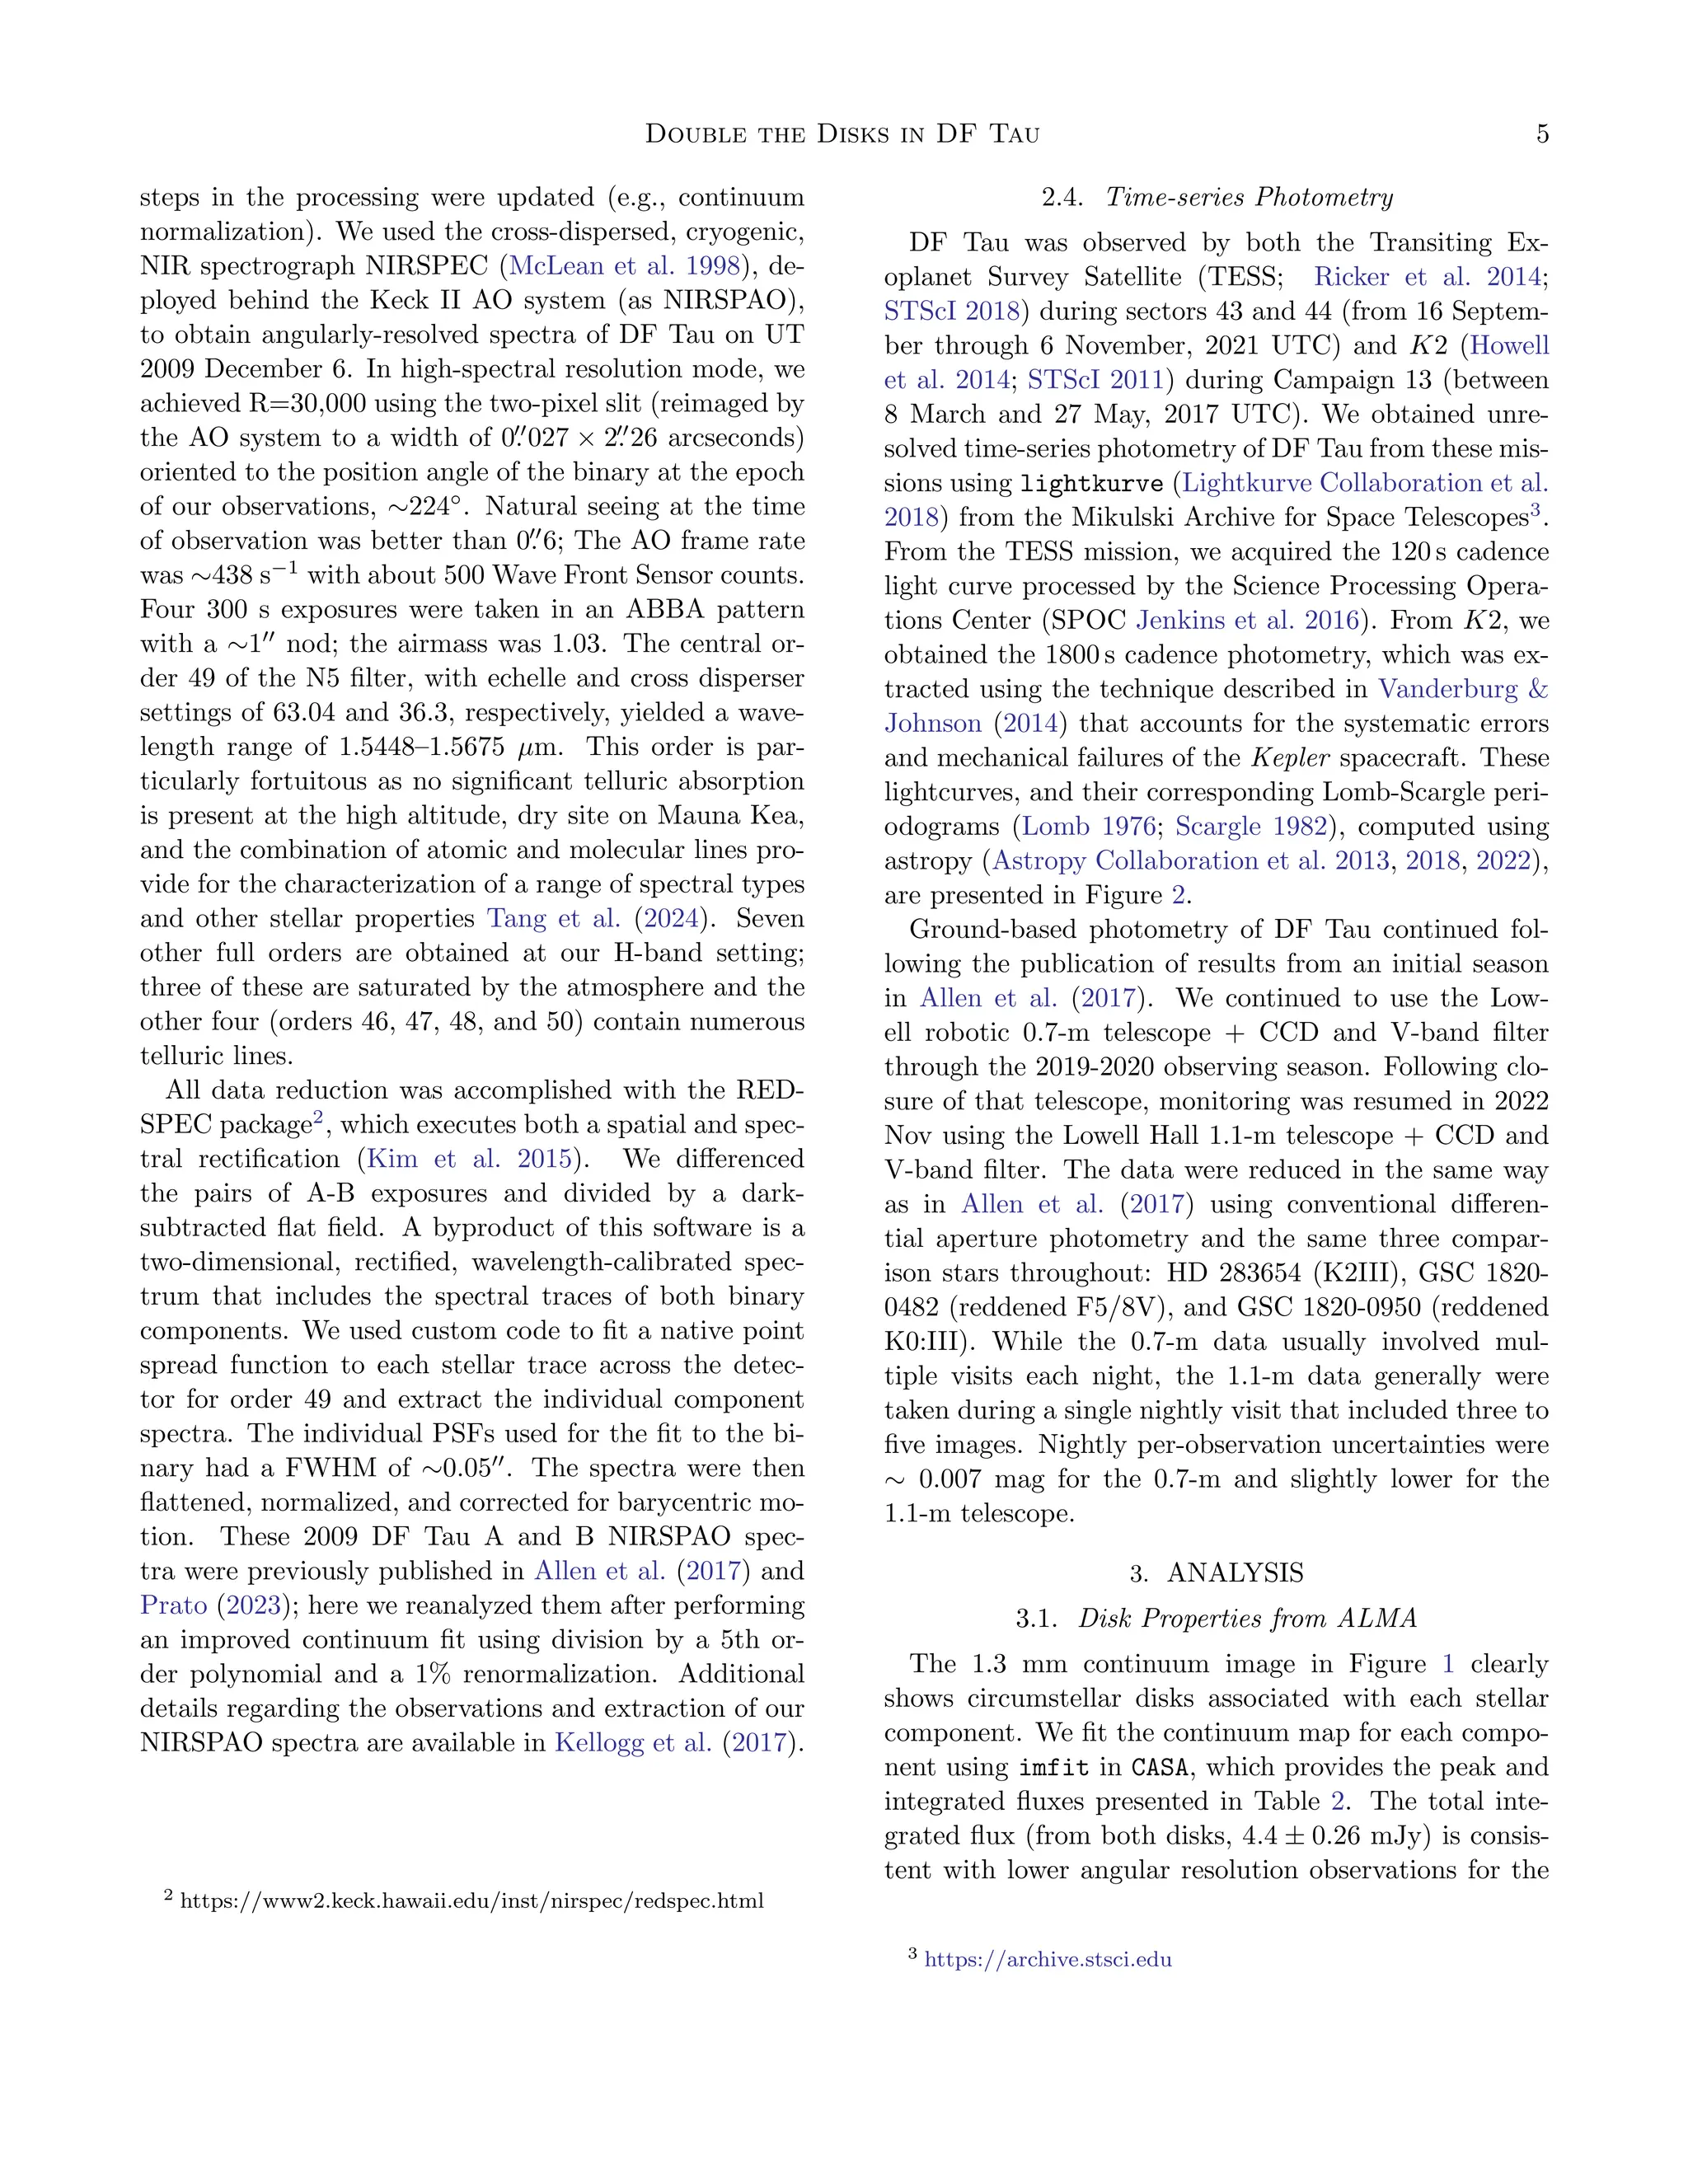
Figure 2. Lightcurves from TESS, K2 and the Lowell
0.7/1.1 m telescopes (top three panels, respectively) and re-
sulting periodograms (bottom panel) for the blended DF Tau
system. Maximum rotation periods for the observed v sin i,
assuming alignment between stellar obliquity and disk incli-
nation, and theoretical predictions of stellar radii (the 2 Myr
tracks from Feiden 2016), are indicated by shaded regions in
red and yellow for the primary and secondary, respectively.
There is no significant power at these periods and therefore
the variability in the light curve is dominated by stochastic
accretion and/or other processes in the inner disk of the pri-
mary.
The orbital coverage of DF Tau now spans over 36
years. We computed an updated orbital fit by combin-
ing the binary positions in Table 1 with measurements
previously published in the literature (Chen et al. 1990;
Ghez et al. 1995; Simon et al. 1996; Thiebaut et al. 1995;
White Ghez 2001; Balega et al. 2002, 2004, 2007;
Shakhovskoj et al. 2006; Schaefer et al. 2003, 2006, 2014;
Table 2. Derived Properties for DF Tau
Parameter DF Tau A DF Tau B
Orbital Parameters
P [yr] 48.1 ± 2.1
T0 [JY] 1977.7 ± 2.7
e 0.196 ± 0.024
a [mas] 97.0 ± 3.2
i [◦
] 54.3 ± 2.4
Ω [◦
] 38.4 ± 2.5
ω [◦
] 310.6 ± 9.2
Mtot ( d
D )3
M⊙ 1.15 ± 0.03 ± 0.48a
Stellar Properties
Teff [K] 3638 ± 109 3433 ± 84
log g 3.7 ± 0.2 3.9 ± 0.2
v sin i[ km/ s] 16.4 ± 2.1 46.2 ± 2.8
Veiling at 15600Å 1.4 ± 0.2 0.3 ± 0.2
RV [ km/ s] 19.9 ± 1.1 15.5 ± 2.0
B[kG] 2.5 ± 0.7 2.6 ± 0.9
JD 2455171.91488
Disk Properties
1.3mm F [mJy] 2.5 ± 0.19 1.9 ± 0.18
1.3mm Peak I [mJy/beam] 1.5 ± 0.08 1.3 ± 0.08
Mdust[M⊕] 1.4 ± 0.10 1.17 ± 1.11
idisk[◦
] 41+13
−7 46±9
PAdisk[◦
] 40+20
−10 40+8
−14
Rc[ AU] 3.7+0.3
−0.2 3.6+0.8
−0.6
a Based on a distance estimate of 142.68 pc to the D4-North
subgroup in Taurus (Krolikowski et al. 2021). The first
uncertainty in Mtot is propagated from the uncertainties
in the orbital parameters P and a while the second sys-
tematic uncertainty is derived from propagating the ± 20
pc standard deviation of distances to individual stars in
the subgroup.
Allen et al. 2017). We used the IDL orbit fitting library4
to compute a visual orbit using the Newton-Raphson
method to linearize the equations of orbital motion and
minimize the χ2
. The period (P), time of periastron
passage (T0), eccentricity (e), angular semimajor axis
(a), inclination (i), position angle of the line of nodes
(Ω), and the angle between the node and periastron (ω)
are fitted for and results are presented in Table 2. The
uncertainties in the orbital parameters were computed
from a Monte Carlo bootstrap technique. This process
involved randomly selecting position measurements from
the sample with repetition (some measurements were
repeated, others were left out), adding Gaussian uncer-
tainties to the selected sample, and re-fitting orbit. We
performed 1,000 bootstrap iterations and computed un-
certainties in the orbital parameters from the standard
deviation of the resulting distributions. The orbital mo-
4 http://www.chara.gsu.edu/analysis-software/orbfit-lib](https://image.slidesharecdn.com/2411-250122110401-5b94341d/75/Sites-of-Planet-Formation-in-Binary-Systems-II-Double-the-Disks-in-DF-Tau-7-2048.jpg)
![8 Kutra et al.
0 5000 10000
uv Distance (k )
0
2
4
Vis
(mJy) Real
0 5000 10000
uv Distance (k )
2
1
0
1
Imaginary
Model
Data
0.2 0.0 0.2
Data
0.2 0.0 0.2
Model
0.2 0.0 0.2
[-3,3]
Residual
Figure 3. Continuum visibility fitting. Results are shown for spectral window 1. Left Panels: Data and model for the real
and imaginary visibilities as a function of uv-distance. Right Panels: Maps of the data, model, and residuals. Contours in
the residual image are set at −3σ and 3σ in dashed and solid lines, respectively. The residuals are largely ±3σ.
tion of DF Tau B relative to A and the best fitting orbit
are plotted in Figure 4.
The total system mass can be computed from Ke-
pler’s Third Law, assuming that the distance is known.
For example, the Gaia distance changed from 124.5 pc
in DR2 to 182.4 pc in DR3 with a Renormalized Unit
Weight Error (RUWE) of 21.9 (Bailer-Jones et al. 2018,
2021). The high RUWE is likely due to the binarity of
the source and a more reliable distance will be obtained
when the final solution that includes the astrometric or-
bital motion is available. However, the variability of DF
Tau A (Allen et al. 2017) might impact the interpreta-
tion of the photo-center motion. In the meantime, we
adopted the distance of 142.68 ± 20 pc to the D4-North
subgroup where DF Tau resides (Krolikowski et al. 2021)
to derive a total mass of MA+B = 1.15±0.48M⊙, where
uncertainties propagated from the orbital parameters
P and a (±0.03M⊙) and the distance (±0.48M⊙) are
added in quadrature.
3.3. Stellar Properties from NIR Component
Spectroscopy
We used the NextGen atmospheric models (Allard
Hauschildt 1995) with the Synthmag spectral synthe-
sis code of Kochukhov et al. (2010) to produce a grid
of H-band order 49 (1.5440 − 1.5675 µm) model spec-
tra at solar metallicity that encompasses a large range
of late-type dwarf star properties: Teff of 3000–6000 K,
surface-averaged magnetic field strength, B, of 0–6 kG,
and surface gravity, log(g), of 3.0−5.5. Models are com-
puted at intervals of 100 K in Teff and 0.5 dex in log(g)
for magnetic field strengths of 0, 2, 4, and 6 kG. Labo-
ratory atomic transition data from the Vienna Atomic
Line Database 3 (VALD 3, Ryabchikova et al. 2015)
were calibrated against the spectrum of 61 Cyg B and
the Solar spectrum (Livingston Wallace 1991) and
used to synthesize the model spectra following the pro-
cedure of Johns-Krull et al. (1999); Johns-Krull (2007).
We excluded lines which appeared in the solar and 61
Figure 4. Orbital motion of DF Tau B relative to A based
on the AO imaging and measurements from the literature.
The solid blue line shows the best fitting orbit while the grey
lines show 100 orbits selected at random from the posterior
distribution.
Cyg B calibration spectra but not in the VALD list,
and vice versa. Furthermore, we adjusted the van der
Waals broadening constants and line oscillator strengths
in the model spectra to best match the observed cali-
brator lines in the Sun and 61 Cyg B to improve the
accuracy of the synthesized spectra.
From this grid of model spectra, we can linearly inter-
polate to create model spectra with any desired stellar
parameters spanned by the grid. We determined the
best-fit stellar parameters using the emcee implementa-
tion of the MCMC method. To identify an appropriate
initial guess, we used the stellar parameters estimated
by Prato (2023). We also applied the line equivalent
width ratio method of Tang et al. (2024) to obtain ini-
tial temperature estimates of ∼3690 K and ∼3630 K for](https://image.slidesharecdn.com/2411-250122110401-5b94341d/75/Sites-of-Planet-Formation-in-Binary-Systems-II-Double-the-Disks-in-DF-Tau-8-2048.jpg)
![Double the Disks in DF Tau 9
the primary and secondary, respectively. However, we
suspect this is a temperature overestimate for the sec-
ondary, given the line blending that results from this
star’s high v sin i. Finally, we adopt a wide range of
uniform priors for all stellar parameters.
With our set of initial guesses and priors, we ran emcee
with 32 walkers and iterated for 8000 steps, which allows
for a chain length that is sufficiently longer than the
autocorrelation time. We then trimmed the first 2000
steps before extracting model parameters. Our best-fit
models are shown in Figure 5 and the associated model
parameters are listed in Table 2.
The primary and secondary of DF Tau are almost stel-
lar twins, with similar effective temperatures, surface
gravities, and surface-averaged magnetic field strengths.
The large differences for the two stars lie in their veiling
and v sin i values. The lack of veiling led Allen et al.
(2017) to conclude that either the disk around the sec-
ondary had dissipated or the inner disk was absent. This
is supported by the lack of accretion signatures in Fig-
ure 5, e.g., Br 16 H line emission. Examination of other
H-band spectral orders shows no trace of other Brackett
series lines (e.g., Br 11 in order 45 or Br 13 in order 47).
Given our independent measurements for stellar effec-
tive temperatures from the spectra and a combined dy-
namical mass from the orbit, we can also compare mass
estimates from evolutionary models. Using the (Feiden
2016) stellar evolution models, the stellar masses which
correspond to stellar effective temperatures of 3638 K
and 3433 K are 0.56M⊙ and 0.42M⊙, respectively. This
is consistent with our estimate measured total mass of
the system, 1.15 ± 0.48M⊕. We can also compare the
model-derived flux ratio to that determined in Table 1.
Feiden (2016) models give logarithmic luminosities of
−0.33 and −0.48, for the primary and secondary respec-
tively, which corresponds to a flux ratio of 0.69, in rough
agreement with the ratios in Table 1.
3.4. Stellar Variability and Rotation Properties from
Time Series Photometry
Peaks with significant power in periodograms are used
to determine stellar rotation periods, leveraging the light
curve modulation caused by spots rotating in and out of
view (e.g., Rebull et al. 2020). For DF Tau, both the
space-based and ground-based lightcurves appear to be
dominated by stochastic variability (Figure 2). The pe-
riodogram of the TESS lightcurve reveals two significant
peaks at 10.4 and 5.5 days. The periodogram of the K2
lightcurve has peaks at 10.3 and 6.6 days; however there
is significantly more power at 15.2 and 21.8 days. The
periodogram of six seasons’ worth of ground-based pho-
15450 15500 15550 15600 15650
Wavelength [Ȧ]
0.0
0.2
0.4
0.6
0.8
1.0
Normalized
Flux
Figure 5. Spatially resolved and continuum normalized
spectra of DF Tau A (top) and B (bottom, separated by
an offset) in black. 50 randomly selected model spectra from
the trimmed MCMC chain are overplotted in blue.
tometry has low power peaks at approximately 8 and 14
days.
Allen et al. (2017) analyzed one season of ground-
based photometry and found a peak in the periodogram
at 10.4 days, but they did not find significant power at
periods of 5.5 or greater than 10.4 days. It is not clear
that any of these light curves are reliably tracking the
stellar rotation period, given the implied stellar radius.
For example, when a suspected rotation period, iden-
tified in the periodograms derived from TESS, K2, or
ground-based light curves, is combined with a v sin i, de-
termined from the primary star H-band spectrum (e.g.,
Section 2.2), we can obtain a lower bound on the stellar
radius:
R∗ ≥ 0.0196
Prot
1 day
!
v sin i
1 km/s
!
R⊙. (3)
For a measured v sin i of 13 ± 4km/s and Prot = 10.4
days, Allen et al. (2017) found a stellar radius limit for
the primary star of ≥ 2.68±0.82R⊙. Using our updated
v sin i of 16.4 ± 2.1 km/ s, a 10.4 day period implies a
radius of ≥ 3.4 ± 0.4R⊙, implying an age well below 1
Myr for the models of Feiden (2016). For the secondary
star with v sin i of 46.2 ± 2.8km/s, the derived radii are
unphysically large for rotation periods greater than ∼3
days.
To estimate these limits on the radii above, Equation
3 assumed a maximum stellar rotation axis inclination
of 90 degrees. Another estimate of the stellar radii can
be achieved by assuming the star is aligned with the
disks or the orbit of the binary (i.e., an inclination of
i = 34 − 55◦
). For DF Tau A, with assumed age of ∼2
Myr and Teff ∼ 3650 K, models of Feiden (2016, which
include stellar magntic fields) predict a stellar radius of](https://image.slidesharecdn.com/2411-250122110401-5b94341d/75/Sites-of-Planet-Formation-in-Binary-Systems-II-Double-the-Disks-in-DF-Tau-9-2048.jpg)
![18 Kutra et al.
58000 58500 59000 59500 60000
MJD [JD - 2400000.5]
1
2
3
Normalized
Flux
0.0
0.5
Power
0.0
0.5
Power
5 10 15 20 25
Period [days]
0.0
0.5
Power
5 10 15 20 25
Period [days]
Figure 8. Seasonal variation of the DF Tau periodogram using ground-based photometry obtained with the Lowell robotic
0.7m telescope and the Lowell Hall 1.1m telescope.
APPENDIX
A. SEASONAL VARIATION OF THE PERIODOGRAM
To support our claim that the variation in the light curves of DF Tau is dominated by stochastic accretion, we
analyzed the 7-year-long ground-based light curve of DF Tau separated by year (Figure 8). The strength of the ∼ 10-
and ∼ 5-day signals varies, and at some epochs disappears entirely (e.g., in the periodograms from the seasons around
58000 and 60000 MJD).](https://image.slidesharecdn.com/2411-250122110401-5b94341d/75/Sites-of-Planet-Formation-in-Binary-Systems-II-Double-the-Disks-in-DF-Tau-18-2048.jpg)
![Draft version November 11, 2024
Typeset using L
A
TEX twocolumn style in AASTeX631
Sites of Planet Formation in Binary Systems. II. Double the Disks in DF Tau
Taylor Kutra ,1
Lisa Prato ,1
Benjamin M Tofflemire ,2, ∗
Rachel Akeson ,3
G. H. Schaefer ,4
Shih-Yun Tang ,5, 1
Dominique Segura-Cox ,2
Christopher M. Johns-Krull ,5
Adam Kraus ,2
Sean Andrews ,6
and Eric L. N. Jensen 7
1Lowell Observatory, Flagstaff, AZ 86001 USA
2Department of Astronomy, The University of Texas at Austin, Austin, TX 78712, USA
3IPAC/Caltech, Pasadena, CA, 91125, USA
4The CHARA Array of Georgia State University, Mount Wilson Observatory, Mount Wilson, CA 91023, USA
5Physics & Astronomy Department, Rice University, 6100 Main St., Houston, TX 77005, USA
6Center for Astrophysics, Harvard & Smithsonian, 60 Garden Street, Cambridge, MA 02138, USA
7Dept. of Physics & Astronomy, Swarthmore College, 500 College Ave., Swarthmore, PA 19081, USA
ABSTRACT
This article presents the latest results of our ALMA program to study circumstellar disk character-
istics as a function of orbital and stellar properties in a sample of young binary star systems known
to host at least one disk. Optical and infrared observations of the eccentric, ∼48-year period binary
DF Tau indicated the presence of only one disk around the brighter component. However, our 1.3mm
ALMA thermal continuum maps show two nearly-equal brightness components in this system. We
present these observations within the context of updated stellar and orbital properties which indicate
that the inner disk of the secondary is absent. Because the two stars likely formed together, with the
same composition, in the same environment, and at the same time, we expect their disks to be co-eval.
However the absence of an inner disk around the secondary suggests uneven dissipation. We consider
several processes which have the potential to accelerate inner disk evolution. Rapid inner disk dissi-
pation has important implications for planet formation, particularly in the terrestrial-planet-forming
region.
1. INTRODUCTION
A comprehensive paradigm for planet formation re-
quires a fundamental understanding of the conditions,
process, and timescale for circumstellar disk evolution.
Although advancements in theory (see review by Pas-
cucci et al. 2023) and observations, such as ALMA
(Barenfeld et al. 2016; Güdel et al. 2018) or JWST (Ba-
jaj et al. 2024), have brought about new insights, puz-
zling challenges remain. For example, what triggers the
onset of disk dissipation, what is the source of the α
viscosity in the disk, and what sustains the persistence
of some primordial disks for 5–10 Myr (Herczeg et al.
2023)?
Young binary systems offer a unique opportunity to
study both the fragility and robustness of circumstel-
lar disks because membership in a binary system dic-
Corresponding author: Taylor Kutra
tkutra@lowell.edu
∗ 51 Pegasi b Fellow
tates that tidal truncation by the companion (e.g., Arty-
mowicz & Lubow 1994) limits the disk’s outer radii.
Thus disks in binaries have determinate maximum sizes.
Given the dynamical complexity, it is unsurprising that
circumstellar disks in binaries with orbital separations of
≲ 100 AU are smaller, less massive (Jensen et al. 1996;
Harris et al. 2012; Barenfeld et al. 2019), and shorter-
lived (Cieza et al. 2009; Kraus et al. 2012; Cheetham
et al. 2015; Barenfeld et al. 2019) than disks around
more widely spaced or single stars (e.g., Akeson et al.
2019).
Yet despite these seemingly bleak prospects for disk
longevity and potential planet formation, in some cases
the circumstellar disks in close binary systems persist.
Furthermore, planet formation can proceed in close bi-
nary systems, as exemplified by γ Cephei b (Hatzes et al.
2003), GJ 86b (Queloz et al. 2000) and HD 196885 Ab
(Correia et al. 2008), albeit less frequently (Kraus et al.
2016). Clearly circumstellar disk evolution is not reg-
ulated entirely by membership in a close binary; other
processes and influences are at work. This is demon-
arXiv:2411.05203v1
[astro-ph.SR]
7
Nov
2024](https://crownmelresort.com/image.slidesharecdn.com/2411-250122110401-5b94341d/75/Sites-of-Planet-Formation-in-Binary-Systems-II-Double-the-Disks-in-DF-Tau-1-2048.jpg)
![2 Kutra et al.
strated by the large range in age at which circumstellar
disks dissipate (e.g., Haisch et al. 2001; Williams & Cieza
2011). In addition to the binary environment, other fac-
tors drive disk dissipation: by studying the stellar, or-
bital, and disk properties in young binaries, we can use
these nominally coeval systems to explore these factors,
interpreting the evolution of all primordial disks through
this lens.
Using this paradigm, we investigate the young (1-2
Myr) visual binary, DF Tau. It is composed of two
roughly equal mass M2 stars on a 48 year orbit in the
Taurus star forming region (Allen et al. 2017). The pro-
jected orbital separation is only ∼ 100 mas, correspond-
ing to a physical separation of ∼ 14 AU at a distance
of 142 pc (Krolikowski et al. 2021). Both the A and B
components were designated as classical T Tauri stars
(CTTSs) by Hartigan & Kenyon (2003) and White &
Ghez (2001) based on accretion signatures (i.e., the Hα
equivalent width, UV excess, [O I] molecular emission,
and veiling at 6100Ȧ).
White & Ghez (2001) found a much weaker ultraviolet
(UV) excess for the DF Tau secondary, ∆U = 0.85 mag,
compared to that of the primary, ∆U = 2.43 mag. Their
criterion for the presence of a disk is ∆U = 0.8 mag;
however, the uncertainty in the U-band magnitude is
∼ 30% (0.29 mag), indicating a marginal UV CTTS
assignation for DF Tau B.
Allen et al. (2017) presented component-resolved,
near-infrared (NIR) spectroscopy and photometry of the
DF Tau binary and concluded that for DF Tau A, the
NIR colors, IR veiling, and optical/NIR colors were all
consistent with the presence of an accreting circum-
stellar disk. However, they found little variability and
no indication of accretion or significant amounts of cir-
cumstellar material around the secondary and cautioned
that the disk signatures seen for DF Tau B in Hartigan &
Kenyon (2003) could have been the result of contamina-
tion from the disk of DF Tau A, given that the angular
separation at the time of observation was close to the
resolution limit of the Hartigan & Kenyon (2003) HST
STIS observations.
DF Tau is part of our young, small-separation binary
sample observed with ALMA in Cycle 7 (PI Tofflemire).
Targets were selected for this program on the basis of
their relatively complete orbital solutions. As demon-
strated in our recent study of the FO Tau binary (Tof-
flemire et al. 2024), our goal is to understand the disk
dissipation process in the context of the binaries’ stellar
and orbital properties. This work is also a component
of our larger exploration of the spectroscopic and pho-
tometric properties of the individual components in a
sample of close to 100 young binary systems (e.g., Kel-
logg et al. 2017; Allen et al. 2017; Sullivan et al. 2019;
Prato 2023).
In this contribution we focus on our new ALMA obser-
vations, reanalyze the DF Tau NIR component spectra,
including measurements of the stars’ surface averaged
magnetic fields, and update the orbital solution with our
most recent adaptive optics (AO) observations. Given
the precise orbital solution, stellar parameters that sug-
gest similar component temperatures and masses, and
clear evidence for an inner disk around the primary with
only marginal evidence for an inner disk surrounding the
secondary star, DF Tau is a key target for understanding
the onset of disk dissipation.
In section 2 we describe our observations and data re-
duction from ALMA, Keck, TESS/K2, and the Lowell
0.7-m and 1.1m telescopes and we present our analysis
of the multi-wavelength dataset in Section 3. In Section
4 we discuss our results in terms of the disk and binary
interaction, the stellar spin and obliquity and possible
origins for the differences contributing to disk dissipa-
tion in DF Tau. We summarise our work and list main
conclusions in Section 5.
2. OBSERVATIONS AND DATA REDUCTION
2.1. ALMA
Our Cycle 7 observations of DF Tau (project code
2019.1.01739.S) mirror those of Tofflemire et al. (2024).
We used Band 6 receivers in dual polarization mode and
sampled continuum emission over three spectral win-
dows centered on 231.6, 244.0, and 245.9 GHz each with
a bandwidth of 1.875 GHz and 31.25 MHz resolution.
In order to resolve the Keplerian rotation profile of the
disk, we chose a fourth spectral window that covers the
12
CO J = 2−1 transition at 230.538 GHz for the source’s
heliocentric velocity (16.4 km/s, Kounkel et al. 2019)
Observations were taken in compact (short baselines,
SB) and extended (long baselines, LB) array configura-
tions to ensure both high angular resolution and sensi-
tivity to extended emission. The compact configuration
(∼C6 configuration), with baselines between 14 m and
3.6 km, achieved an angular resolution and maximum
recoverable scale of 0.1” and 2.1”, respectively. Observa-
tions took place on 18 July 2021 UTC for 332.640 s using
the compact configuration. The extended configuration
(∼ C8 configuration), with baselines between 40m and
11.6 km, achieved an angular resolution of 0.031” and a
maximum recoverable scale of 0.67”. The observations
for this configuration took place on 24 August 2021 UTC
for 2830.464 s in the extended configuration. The mini-
mum and maximum angular scales covered by both the
compact and extended configuration translate to ∼ 4.6
to 100 AU at the distance of Taurus (∼ 140 pc Kenyon](https://crownmelresort.com/image.slidesharecdn.com/2411-250122110401-5b94341d/75/Sites-of-Planet-Formation-in-Binary-Systems-II-Double-the-Disks-in-DF-Tau-2-2048.jpg)


![Double the Disks in DF Tau 7
59480 59490 59500 59510 59520
0.75
1.00
1.25
Normalized
Flux
TESS
57820 57840 57860 57880 57900
0.75
1.00
1.25
1.50
Normalized
Flux
K2
58000 58500 59000 59500 60000
MJD [JD - 2400000.5]
1.0
2.0
3.0
Normalized
Flux
Lowell
0 5 10 15 20 25
Period [days]
0.0
0.1
0.2
Power
Figure 2. Lightcurves from TESS, K2 and the Lowell
0.7/1.1 m telescopes (top three panels, respectively) and re-
sulting periodograms (bottom panel) for the blended DF Tau
system. Maximum rotation periods for the observed v sin i,
assuming alignment between stellar obliquity and disk incli-
nation, and theoretical predictions of stellar radii (the 2 Myr
tracks from Feiden 2016), are indicated by shaded regions in
red and yellow for the primary and secondary, respectively.
There is no significant power at these periods and therefore
the variability in the light curve is dominated by stochastic
accretion and/or other processes in the inner disk of the pri-
mary.
The orbital coverage of DF Tau now spans over 36
years. We computed an updated orbital fit by combin-
ing the binary positions in Table 1 with measurements
previously published in the literature (Chen et al. 1990;
Ghez et al. 1995; Simon et al. 1996; Thiebaut et al. 1995;
White Ghez 2001; Balega et al. 2002, 2004, 2007;
Shakhovskoj et al. 2006; Schaefer et al. 2003, 2006, 2014;
Table 2. Derived Properties for DF Tau
Parameter DF Tau A DF Tau B
Orbital Parameters
P [yr] 48.1 ± 2.1
T0 [JY] 1977.7 ± 2.7
e 0.196 ± 0.024
a [mas] 97.0 ± 3.2
i [◦
] 54.3 ± 2.4
Ω [◦
] 38.4 ± 2.5
ω [◦
] 310.6 ± 9.2
Mtot ( d
D )3
M⊙ 1.15 ± 0.03 ± 0.48a
Stellar Properties
Teff [K] 3638 ± 109 3433 ± 84
log g 3.7 ± 0.2 3.9 ± 0.2
v sin i[ km/ s] 16.4 ± 2.1 46.2 ± 2.8
Veiling at 15600Å 1.4 ± 0.2 0.3 ± 0.2
RV [ km/ s] 19.9 ± 1.1 15.5 ± 2.0
B[kG] 2.5 ± 0.7 2.6 ± 0.9
JD 2455171.91488
Disk Properties
1.3mm F [mJy] 2.5 ± 0.19 1.9 ± 0.18
1.3mm Peak I [mJy/beam] 1.5 ± 0.08 1.3 ± 0.08
Mdust[M⊕] 1.4 ± 0.10 1.17 ± 1.11
idisk[◦
] 41+13
−7 46±9
PAdisk[◦
] 40+20
−10 40+8
−14
Rc[ AU] 3.7+0.3
−0.2 3.6+0.8
−0.6
a Based on a distance estimate of 142.68 pc to the D4-North
subgroup in Taurus (Krolikowski et al. 2021). The first
uncertainty in Mtot is propagated from the uncertainties
in the orbital parameters P and a while the second sys-
tematic uncertainty is derived from propagating the ± 20
pc standard deviation of distances to individual stars in
the subgroup.
Allen et al. 2017). We used the IDL orbit fitting library4
to compute a visual orbit using the Newton-Raphson
method to linearize the equations of orbital motion and
minimize the χ2
. The period (P), time of periastron
passage (T0), eccentricity (e), angular semimajor axis
(a), inclination (i), position angle of the line of nodes
(Ω), and the angle between the node and periastron (ω)
are fitted for and results are presented in Table 2. The
uncertainties in the orbital parameters were computed
from a Monte Carlo bootstrap technique. This process
involved randomly selecting position measurements from
the sample with repetition (some measurements were
repeated, others were left out), adding Gaussian uncer-
tainties to the selected sample, and re-fitting orbit. We
performed 1,000 bootstrap iterations and computed un-
certainties in the orbital parameters from the standard
deviation of the resulting distributions. The orbital mo-
4 http://www.chara.gsu.edu/analysis-software/orbfit-lib](https://crownmelresort.com/image.slidesharecdn.com/2411-250122110401-5b94341d/75/Sites-of-Planet-Formation-in-Binary-Systems-II-Double-the-Disks-in-DF-Tau-7-2048.jpg)
![8 Kutra et al.
0 5000 10000
uv Distance (k )
0
2
4
Vis
(mJy) Real
0 5000 10000
uv Distance (k )
2
1
0
1
Imaginary
Model
Data
0.2 0.0 0.2
Data
0.2 0.0 0.2
Model
0.2 0.0 0.2
[-3,3]
Residual
Figure 3. Continuum visibility fitting. Results are shown for spectral window 1. Left Panels: Data and model for the real
and imaginary visibilities as a function of uv-distance. Right Panels: Maps of the data, model, and residuals. Contours in
the residual image are set at −3σ and 3σ in dashed and solid lines, respectively. The residuals are largely ±3σ.
tion of DF Tau B relative to A and the best fitting orbit
are plotted in Figure 4.
The total system mass can be computed from Ke-
pler’s Third Law, assuming that the distance is known.
For example, the Gaia distance changed from 124.5 pc
in DR2 to 182.4 pc in DR3 with a Renormalized Unit
Weight Error (RUWE) of 21.9 (Bailer-Jones et al. 2018,
2021). The high RUWE is likely due to the binarity of
the source and a more reliable distance will be obtained
when the final solution that includes the astrometric or-
bital motion is available. However, the variability of DF
Tau A (Allen et al. 2017) might impact the interpreta-
tion of the photo-center motion. In the meantime, we
adopted the distance of 142.68 ± 20 pc to the D4-North
subgroup where DF Tau resides (Krolikowski et al. 2021)
to derive a total mass of MA+B = 1.15±0.48M⊙, where
uncertainties propagated from the orbital parameters
P and a (±0.03M⊙) and the distance (±0.48M⊙) are
added in quadrature.
3.3. Stellar Properties from NIR Component
Spectroscopy
We used the NextGen atmospheric models (Allard
Hauschildt 1995) with the Synthmag spectral synthe-
sis code of Kochukhov et al. (2010) to produce a grid
of H-band order 49 (1.5440 − 1.5675 µm) model spec-
tra at solar metallicity that encompasses a large range
of late-type dwarf star properties: Teff of 3000–6000 K,
surface-averaged magnetic field strength, B, of 0–6 kG,
and surface gravity, log(g), of 3.0−5.5. Models are com-
puted at intervals of 100 K in Teff and 0.5 dex in log(g)
for magnetic field strengths of 0, 2, 4, and 6 kG. Labo-
ratory atomic transition data from the Vienna Atomic
Line Database 3 (VALD 3, Ryabchikova et al. 2015)
were calibrated against the spectrum of 61 Cyg B and
the Solar spectrum (Livingston Wallace 1991) and
used to synthesize the model spectra following the pro-
cedure of Johns-Krull et al. (1999); Johns-Krull (2007).
We excluded lines which appeared in the solar and 61
Figure 4. Orbital motion of DF Tau B relative to A based
on the AO imaging and measurements from the literature.
The solid blue line shows the best fitting orbit while the grey
lines show 100 orbits selected at random from the posterior
distribution.
Cyg B calibration spectra but not in the VALD list,
and vice versa. Furthermore, we adjusted the van der
Waals broadening constants and line oscillator strengths
in the model spectra to best match the observed cali-
brator lines in the Sun and 61 Cyg B to improve the
accuracy of the synthesized spectra.
From this grid of model spectra, we can linearly inter-
polate to create model spectra with any desired stellar
parameters spanned by the grid. We determined the
best-fit stellar parameters using the emcee implementa-
tion of the MCMC method. To identify an appropriate
initial guess, we used the stellar parameters estimated
by Prato (2023). We also applied the line equivalent
width ratio method of Tang et al. (2024) to obtain ini-
tial temperature estimates of ∼3690 K and ∼3630 K for](https://crownmelresort.com/image.slidesharecdn.com/2411-250122110401-5b94341d/75/Sites-of-Planet-Formation-in-Binary-Systems-II-Double-the-Disks-in-DF-Tau-8-2048.jpg)
![Double the Disks in DF Tau 9
the primary and secondary, respectively. However, we
suspect this is a temperature overestimate for the sec-
ondary, given the line blending that results from this
star’s high v sin i. Finally, we adopt a wide range of
uniform priors for all stellar parameters.
With our set of initial guesses and priors, we ran emcee
with 32 walkers and iterated for 8000 steps, which allows
for a chain length that is sufficiently longer than the
autocorrelation time. We then trimmed the first 2000
steps before extracting model parameters. Our best-fit
models are shown in Figure 5 and the associated model
parameters are listed in Table 2.
The primary and secondary of DF Tau are almost stel-
lar twins, with similar effective temperatures, surface
gravities, and surface-averaged magnetic field strengths.
The large differences for the two stars lie in their veiling
and v sin i values. The lack of veiling led Allen et al.
(2017) to conclude that either the disk around the sec-
ondary had dissipated or the inner disk was absent. This
is supported by the lack of accretion signatures in Fig-
ure 5, e.g., Br 16 H line emission. Examination of other
H-band spectral orders shows no trace of other Brackett
series lines (e.g., Br 11 in order 45 or Br 13 in order 47).
Given our independent measurements for stellar effec-
tive temperatures from the spectra and a combined dy-
namical mass from the orbit, we can also compare mass
estimates from evolutionary models. Using the (Feiden
2016) stellar evolution models, the stellar masses which
correspond to stellar effective temperatures of 3638 K
and 3433 K are 0.56M⊙ and 0.42M⊙, respectively. This
is consistent with our estimate measured total mass of
the system, 1.15 ± 0.48M⊕. We can also compare the
model-derived flux ratio to that determined in Table 1.
Feiden (2016) models give logarithmic luminosities of
−0.33 and −0.48, for the primary and secondary respec-
tively, which corresponds to a flux ratio of 0.69, in rough
agreement with the ratios in Table 1.
3.4. Stellar Variability and Rotation Properties from
Time Series Photometry
Peaks with significant power in periodograms are used
to determine stellar rotation periods, leveraging the light
curve modulation caused by spots rotating in and out of
view (e.g., Rebull et al. 2020). For DF Tau, both the
space-based and ground-based lightcurves appear to be
dominated by stochastic variability (Figure 2). The pe-
riodogram of the TESS lightcurve reveals two significant
peaks at 10.4 and 5.5 days. The periodogram of the K2
lightcurve has peaks at 10.3 and 6.6 days; however there
is significantly more power at 15.2 and 21.8 days. The
periodogram of six seasons’ worth of ground-based pho-
15450 15500 15550 15600 15650
Wavelength [Ȧ]
0.0
0.2
0.4
0.6
0.8
1.0
Normalized
Flux
Figure 5. Spatially resolved and continuum normalized
spectra of DF Tau A (top) and B (bottom, separated by
an offset) in black. 50 randomly selected model spectra from
the trimmed MCMC chain are overplotted in blue.
tometry has low power peaks at approximately 8 and 14
days.
Allen et al. (2017) analyzed one season of ground-
based photometry and found a peak in the periodogram
at 10.4 days, but they did not find significant power at
periods of 5.5 or greater than 10.4 days. It is not clear
that any of these light curves are reliably tracking the
stellar rotation period, given the implied stellar radius.
For example, when a suspected rotation period, iden-
tified in the periodograms derived from TESS, K2, or
ground-based light curves, is combined with a v sin i, de-
termined from the primary star H-band spectrum (e.g.,
Section 2.2), we can obtain a lower bound on the stellar
radius:
R∗ ≥ 0.0196
Prot
1 day
!
v sin i
1 km/s
!
R⊙. (3)
For a measured v sin i of 13 ± 4km/s and Prot = 10.4
days, Allen et al. (2017) found a stellar radius limit for
the primary star of ≥ 2.68±0.82R⊙. Using our updated
v sin i of 16.4 ± 2.1 km/ s, a 10.4 day period implies a
radius of ≥ 3.4 ± 0.4R⊙, implying an age well below 1
Myr for the models of Feiden (2016). For the secondary
star with v sin i of 46.2 ± 2.8km/s, the derived radii are
unphysically large for rotation periods greater than ∼3
days.
To estimate these limits on the radii above, Equation
3 assumed a maximum stellar rotation axis inclination
of 90 degrees. Another estimate of the stellar radii can
be achieved by assuming the star is aligned with the
disks or the orbit of the binary (i.e., an inclination of
i = 34 − 55◦
). For DF Tau A, with assumed age of ∼2
Myr and Teff ∼ 3650 K, models of Feiden (2016, which
include stellar magntic fields) predict a stellar radius of](https://crownmelresort.com/image.slidesharecdn.com/2411-250122110401-5b94341d/75/Sites-of-Planet-Formation-in-Binary-Systems-II-Double-the-Disks-in-DF-Tau-9-2048.jpg)


![18 Kutra et al.
58000 58500 59000 59500 60000
MJD [JD - 2400000.5]
1
2
3
Normalized
Flux
0.0
0.5
Power
0.0
0.5
Power
5 10 15 20 25
Period [days]
0.0
0.5
Power
5 10 15 20 25
Period [days]
Figure 8. Seasonal variation of the DF Tau periodogram using ground-based photometry obtained with the Lowell robotic
0.7m telescope and the Lowell Hall 1.1m telescope.
APPENDIX
A. SEASONAL VARIATION OF THE PERIODOGRAM
To support our claim that the variation in the light curves of DF Tau is dominated by stochastic accretion, we
analyzed the 7-year-long ground-based light curve of DF Tau separated by year (Figure 8). The strength of the ∼ 10-
and ∼ 5-day signals varies, and at some epochs disappears entirely (e.g., in the periodograms from the seasons around
58000 and 60000 MJD).](https://crownmelresort.com/image.slidesharecdn.com/2411-250122110401-5b94341d/75/Sites-of-Planet-Formation-in-Binary-Systems-II-Double-the-Disks-in-DF-Tau-18-2048.jpg)

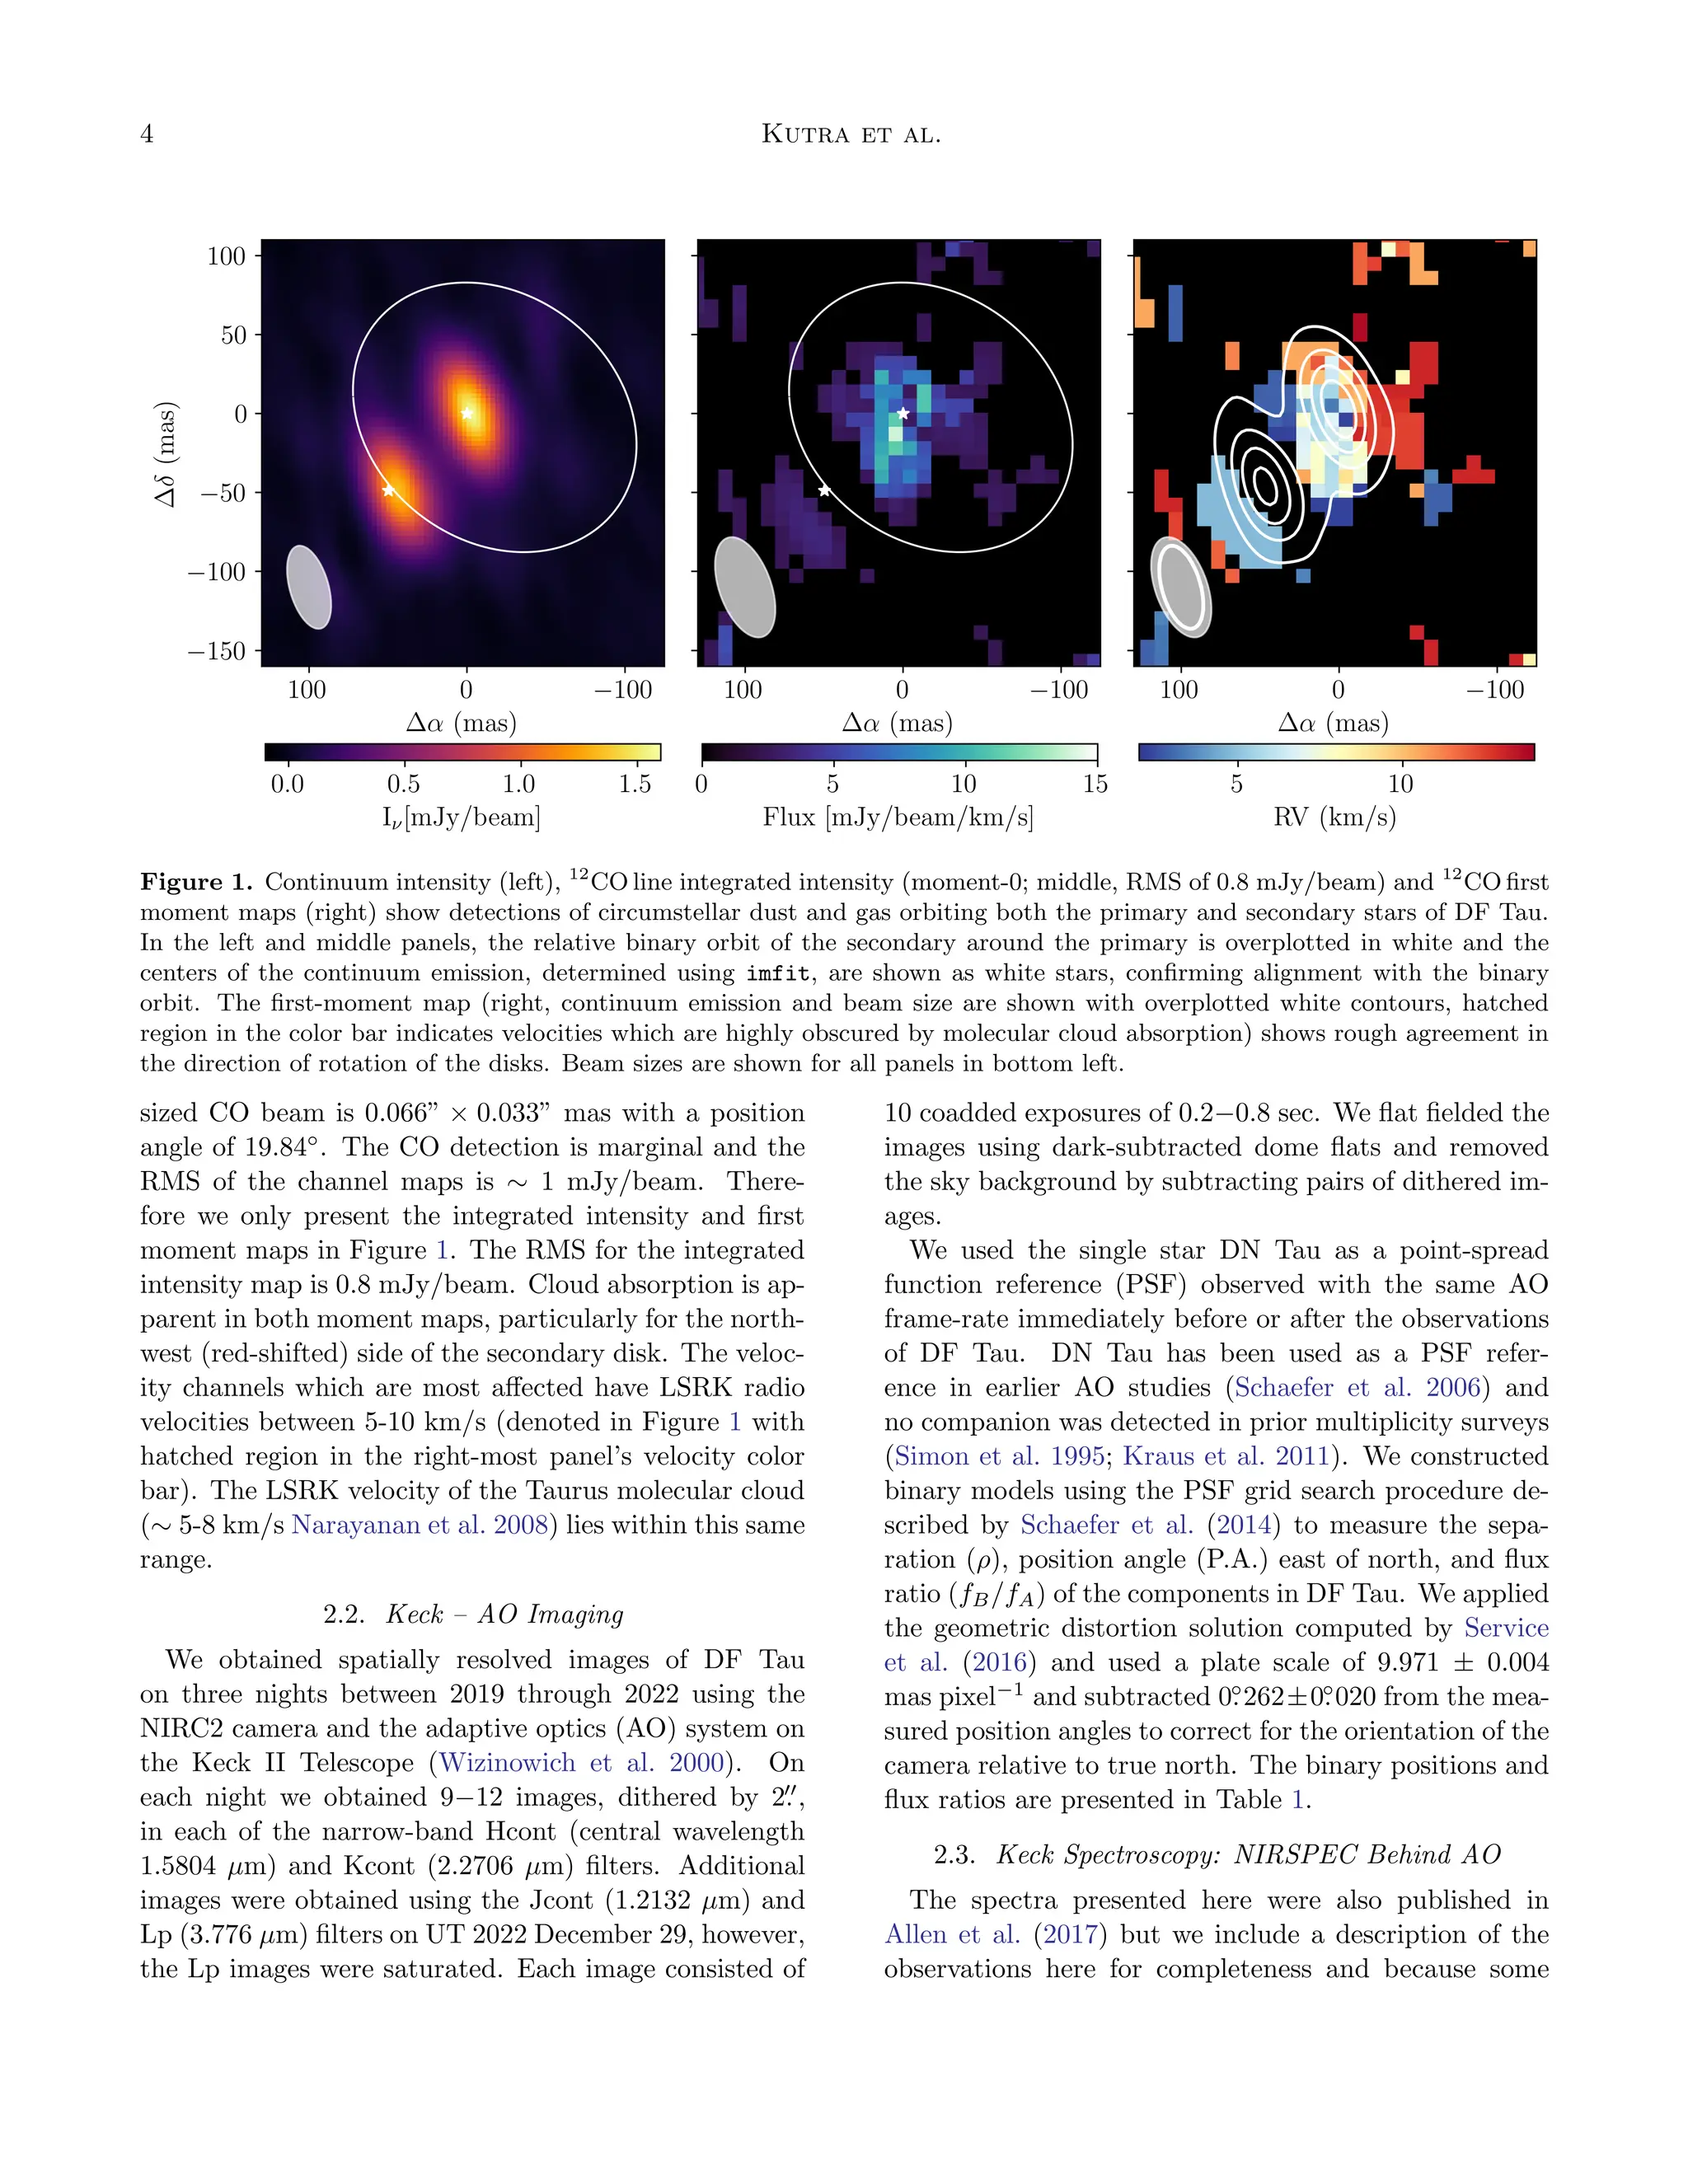
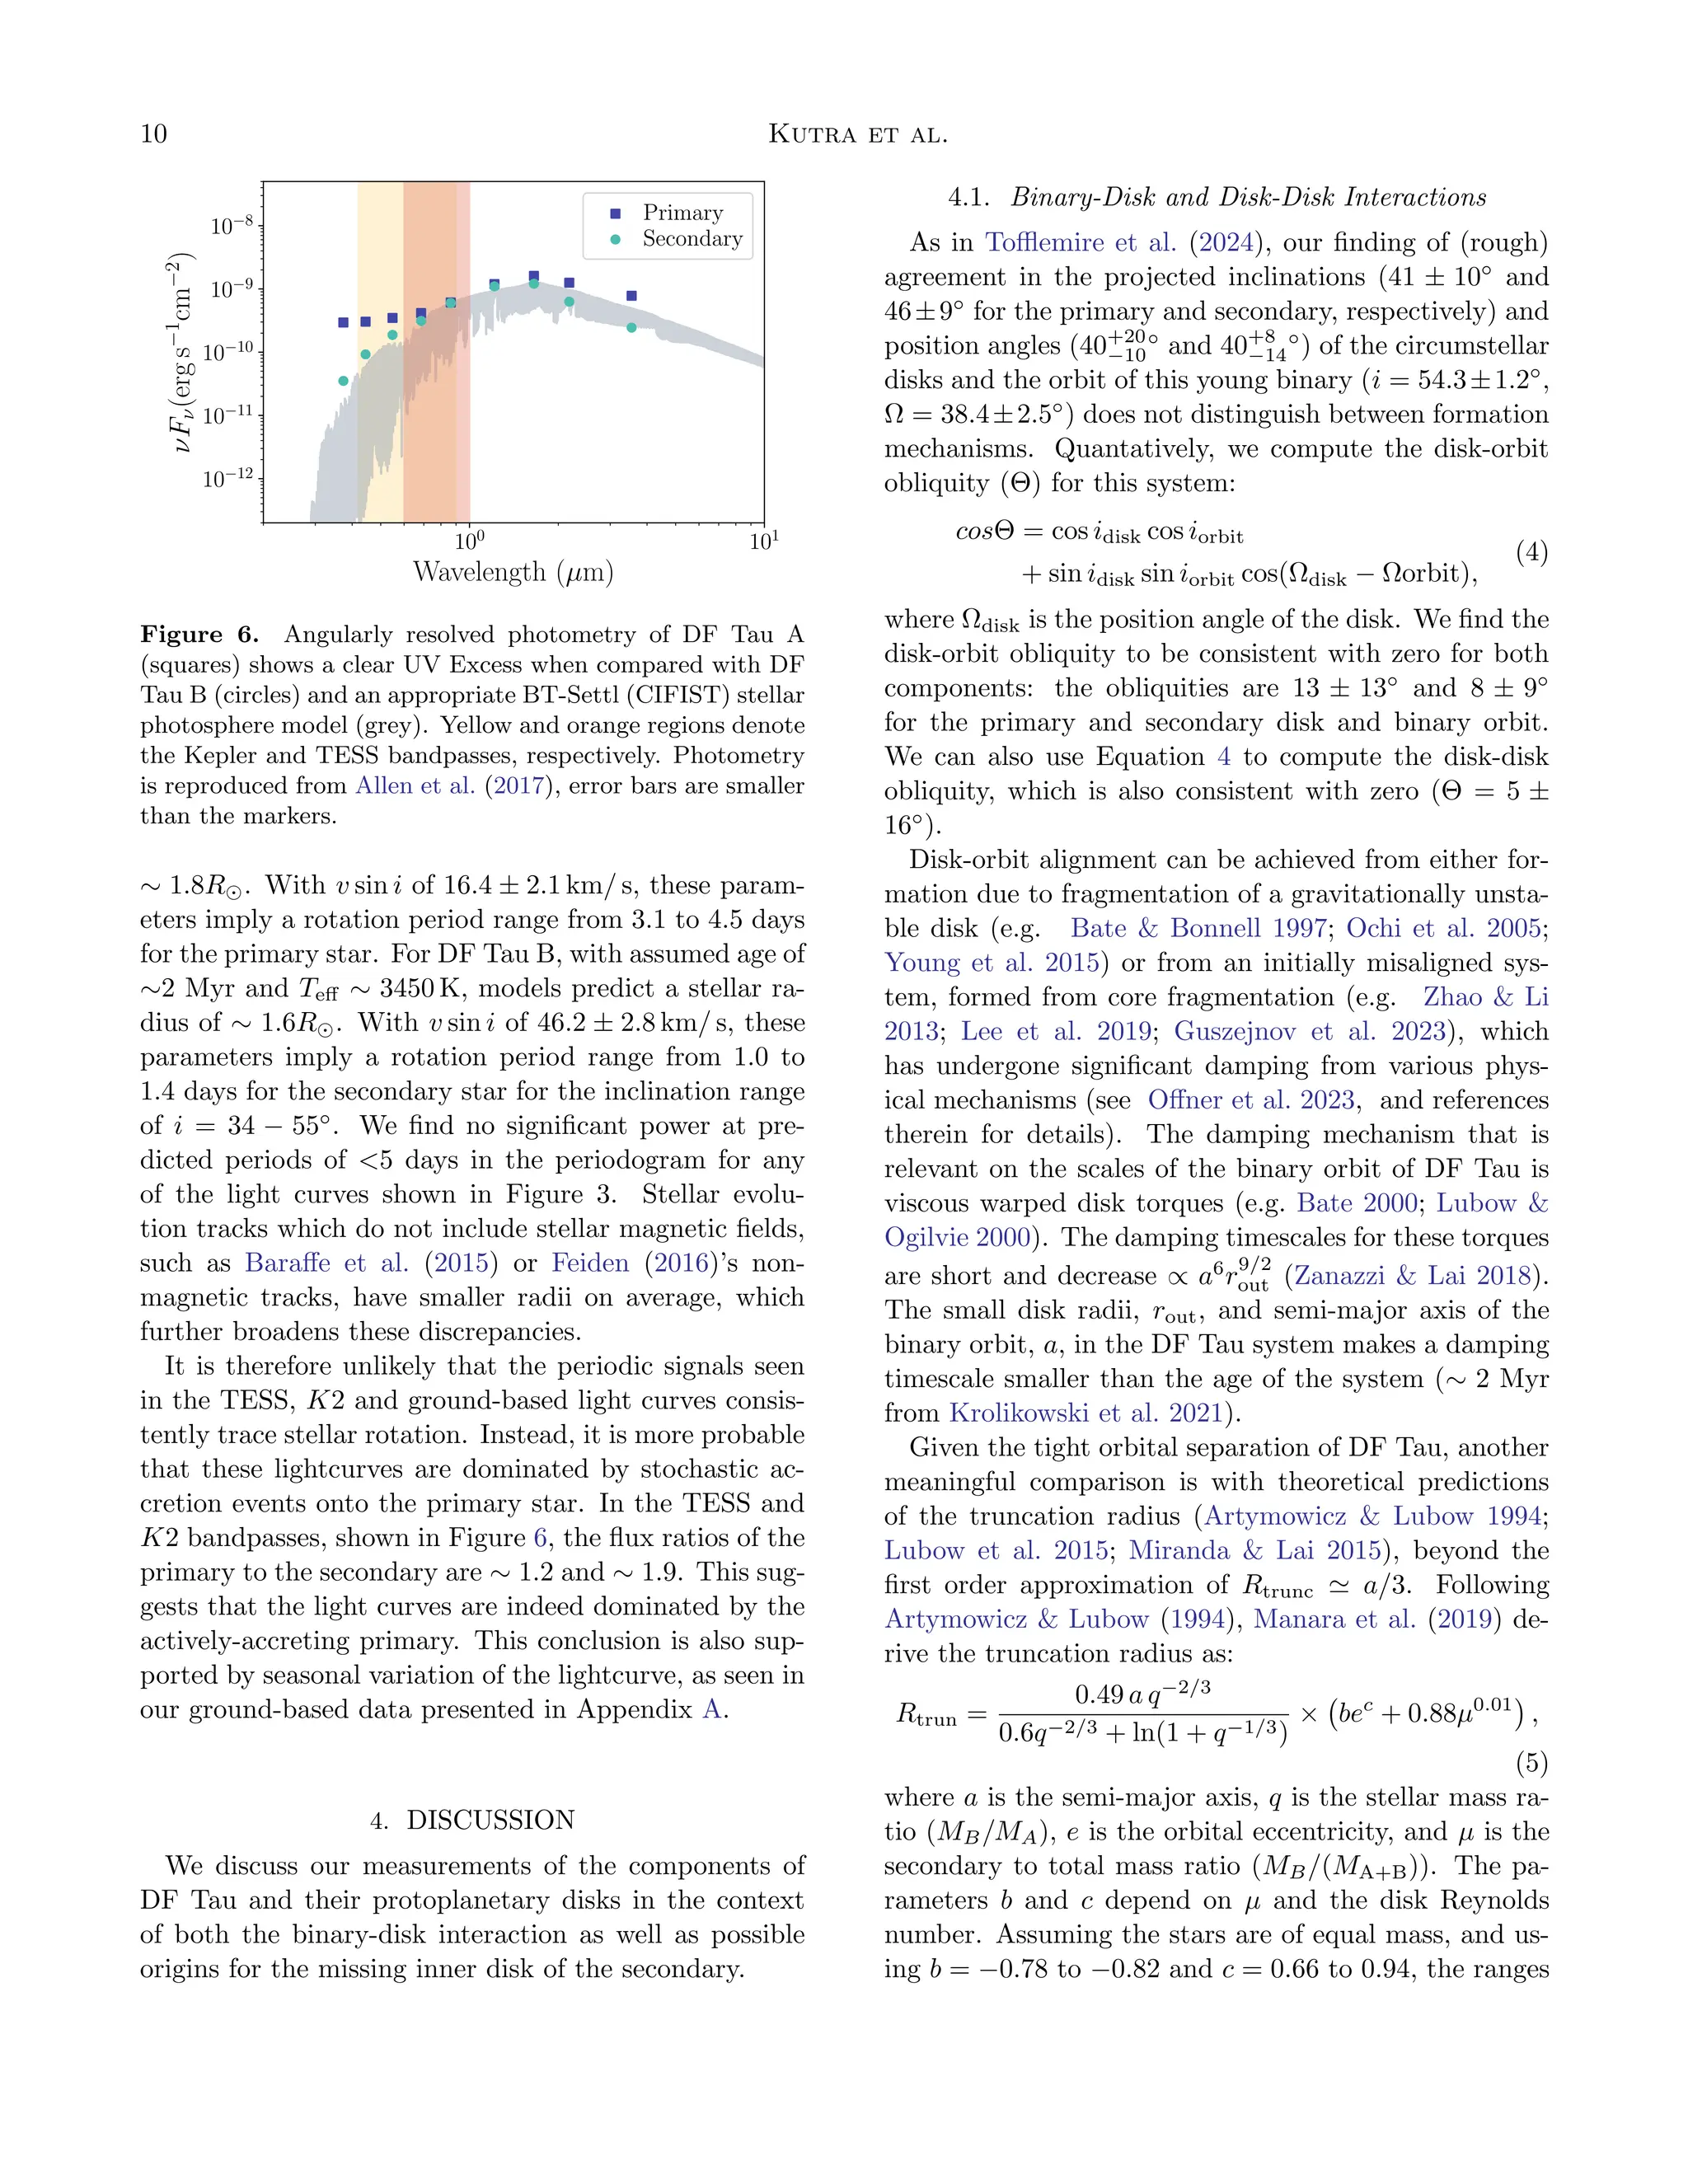
This document discusses recent findings from an ALMA program studying circumstellar disks in young binary star systems, particularly focusing on the binary DF Tau. Observations reveal one disk around the primary star, while the secondary star appears to lack an inner disk, suggesting differences in disk evolution between the two components. The results have important implications for understanding planet formation in binary systems and explore the factors driving disk dissipation.


