Downloaded 13 times
![: Interactive plotting in Julia
Spencer Lyon
November 18, 2016
NOTE: You are viewing a static export of an interactive web-based slide deck. Some
items in the slides did not export properly to the pdf. To see a live version of the slides
visit
In [1]:
PlotlyJS.jl
http://spencerlyon.com/presentations/
using PlotlyJS
Plotly javascript loaded.
To load again call
init_notebook(true)](https://image.slidesharecdn.com/plotconslides-161210002611/75/PLOTCON-NYC-PlotlyJS-jl-Interactive-plotting-in-Julia-1-2048.jpg)


![In [2]: f(x, y) = "Two arguments: $(x) and $(y)"
f("hello", "plotcon")
Out[2]: "Two arguments: hello and plotcon"](https://image.slidesharecdn.com/plotconslides-161210002611/75/PLOTCON-NYC-PlotlyJS-jl-Interactive-plotting-in-Julia-6-2048.jpg)
![In [3]:
In [4]:
In [5]:
In [6]:
f(x::Number, y) = "First arg is a number ($(x)), second isn't ($(y))"
# still old method
f("hello", "plotcon")
# new method
f(2, "plotcon")
# Generics
# also new method, but this time with floating point first argument
f(2.0, "plotcon")
Out[3]: f (generic function with 2 methods)
Out[4]: "Two arguments: hello and plotcon"
Out[5]: "First arg is a number (2), second isn't (plotcon)"
Out[6]: "First arg is a number (2.0), second isn't (plotcon)"](https://image.slidesharecdn.com/plotconslides-161210002611/75/PLOTCON-NYC-PlotlyJS-jl-Interactive-plotting-in-Julia-7-2048.jpg)
![In [7]:
In [8]:
In [9]:
# longer function syntax
function f(x::Number, y::Number)
"Two numbers: ($(x), $(y))"
end
# newest method
f(2.0, 2)
# unsigned 8 bit int and BigInt
f(0x81, big(4))
Out[7]: f (generic function with 3 methods)
Out[8]: "Two numbers: (2.0, 2)"
Out[9]: "Two numbers: (129, 4)"](https://image.slidesharecdn.com/plotconslides-161210002611/75/PLOTCON-NYC-PlotlyJS-jl-Interactive-plotting-in-Julia-8-2048.jpg)

![Faithful plotly.js api layer
plotly.js visualzations are described as a JSON object:
Let's look at how we can build these traces and a Layout in Julia
{
// Overall chart attributes
"layout": {
"title": "x²"
},
"data": [
// JSON array of 'traces'
{
// Example trace
"type": "scatter",
"y": [1, 4.0, 9.0],
"marker": {
"symbol": "square"
}
}
]
}](https://image.slidesharecdn.com/plotconslides-161210002611/75/PLOTCON-NYC-PlotlyJS-jl-Interactive-plotting-in-Julia-12-2048.jpg)
![By Hand
JSON is naturally represented as Julia Dict
Example from above:
Building nested Dicts in Julia isn't convenient
Need to spell out Dict
Need to add lots of quotes (similar to raw json)
Also need => to separate keys/values
Dict(
"layout" => Dict(
"title" => "x²"
),
"data" => [
Dict(
"type" => "scatter",
"y" => [1, 4.0, 9.0],
"marker" => Dict(
"symbol" => "square"
)
)
]
)](https://image.slidesharecdn.com/plotconslides-161210002611/75/PLOTCON-NYC-PlotlyJS-jl-Interactive-plotting-in-Julia-13-2048.jpg)
![With PlotlyJS.jl
PlotlyJS.jl eases this burden for Julia programmers
In [10]: plot(scatter(y=[1.0, 4.0, 9.0], marker_symbol="square"),
Layout(title="x²"))
Out[10]:
0 0.5 1 1.5 2
1
2
3
4
5
6
7
8
9
x²](https://image.slidesharecdn.com/plotconslides-161210002611/75/PLOTCON-NYC-PlotlyJS-jl-Interactive-plotting-in-Julia-14-2048.jpg)
![Traces
Let's take a closer look at building trace
Construct traces using the trace type as a function and setting keyword
arguments
Example trace from above:
In [11]:
Notice the syntax marker_symbol.
This sets a nested json atrribute {"marker": {"symbol": "square"}}
See the json
In [12]:
my_trace = scatter(y=[1.0, 4.0, 9.0], marker_symbol="square")
print(json(my_trace, 2))
Out[11]: scatter with fields marker, type, and y
{
"y": [
1.0,
4.0,
9.0
],
"type": "scatter",
"marker": {
"symbol": "square"
}
}](https://image.slidesharecdn.com/plotconslides-161210002611/75/PLOTCON-NYC-PlotlyJS-jl-Interactive-plotting-in-Julia-15-2048.jpg)
![More Examples
In [13]:
In [14]:
# nesting works at more than one level
trace1 = scatter(y=rand(10), marker_color="red",
marker_line_width=2.0)
trace2 = contour(x=1:5, y=1:10, z=randn(5, 10))
trace3 = bar(x=1:10, y=rand(1:10, 10), name="mybar")
print(json(trace1, 2))
Out[13]: bar with fields name, type, x, and y
{
"y": [
0.8168546843804745,
0.1967457511182984,
0.5148182283741638,
0.31298671217983753,
0.10559144576552915,
0.6834355544280886,
0.7503355447535949,
0.33011457537607636,
0.05938681725632655,
0.858053689412962
],
"type": "scatter",
"marker": {
"line": {
"width": 2.0
},
"color": "red"
}
}](https://image.slidesharecdn.com/plotconslides-161210002611/75/PLOTCON-NYC-PlotlyJS-jl-Interactive-plotting-in-Julia-16-2048.jpg)

![Layout
Build a layout by constructing a Layout object:
In [15]:
The same underscore magic applies
Also notice the attr function. This allows you to create groups of nested
attributes.
foo=attr(x=1, y=2) produces {"foo": {"x": 1, "y": 2}}
It is an alternative to foo_x=1, foo_y=2
attr can be used when building traces also
layout = Layout(xaxis=attr(range=[0, 10],
title="assets"),
yaxis_title="consumption",
title="??")
Out[15]: layout with fields margin, title, xaxis, and yaxis](https://image.slidesharecdn.com/plotconslides-161210002611/75/PLOTCON-NYC-PlotlyJS-jl-Interactive-plotting-in-Julia-18-2048.jpg)
![In [16]: print(json(layout, 2))
{
"yaxis": {
"title": "consumption"
},
"xaxis": {
"range": [
0,
10
],
"title": "assets"
},
"title": "??",
"margin": {
"r": 50,
"l": 50,
"b": 50,
"t": 60
}
}](https://image.slidesharecdn.com/plotconslides-161210002611/75/PLOTCON-NYC-PlotlyJS-jl-Interactive-plotting-in-Julia-19-2048.jpg)
![To actually display a plot, we tie one or more traces together with a layout by calling the
plot function:
In [17]: plot(trace1, layout)
Out[17]:
0 2 4 6 8 10
0.1
0.2
0.3
0.4
0.5
0.6
0.7
0.8
0.9
??
assets
consumption](https://image.slidesharecdn.com/plotconslides-161210002611/75/PLOTCON-NYC-PlotlyJS-jl-Interactive-plotting-in-Julia-20-2048.jpg)
![In [18]: # layout optional
plot(trace2)
Out[18]:](https://image.slidesharecdn.com/plotconslides-161210002611/75/PLOTCON-NYC-PlotlyJS-jl-Interactive-plotting-in-Julia-21-2048.jpg)
![In [19]: # more than one trace
plot([trace1, trace3], layout)
Out[19]:](https://image.slidesharecdn.com/plotconslides-161210002611/75/PLOTCON-NYC-PlotlyJS-jl-Interactive-plotting-in-Julia-22-2048.jpg)
![Convenience API
The plot function has a number of other methods that try to make it a bit easier to
construct simple plots (remember multiple dispatch? :) )
In [20]: methods(plot)
Out[20]: 13 methods for generic function plot:
plot{T<:Number,T2<:Number}(x::AbstractArray{T,1},
y::AbstractArray{T2,2}) at
plot{T<:Number,T2<:Number}(x::AbstractArray{T,1},
y::AbstractArray{T2,2}, l::PlotlyJS.Layout; style, kwargs...) at
plot{T<:Number,T2<:Number}(x::AbstractArray{T,2},
y::AbstractArray{T2,2}) at
plot{T<:Number,T2<:Number}(x::AbstractArray{T,2},
y::AbstractArray{T2,2}, l::PlotlyJS.Layout; style, kwargs...) at
/Users/sglyon/.julia/v0.5/PlotlyJS/src/convenience_api.jl:31
/Users/sglyon/.julia/v0.5/PlotlyJS/src/convenience_api.jl:31
/Users/sglyon/.julia/v0.5/PlotlyJS/src/convenience_api.jl:40
/Users/sglyon/.julia/v0.5/PlotlyJS/src/convenience_api.jl:40](https://image.slidesharecdn.com/plotconslides-161210002611/75/PLOTCON-NYC-PlotlyJS-jl-Interactive-plotting-in-Julia-23-2048.jpg)
![Let's see a few of them in action
In [21]: x = linspace(-5, 5, 50)
y1 = sin(x)
y2 = cos(x)
plot(x, y1)
Out[21]:
−4 −2 0 2 4
−1
−0.5
0
0.5
1](https://image.slidesharecdn.com/plotconslides-161210002611/75/PLOTCON-NYC-PlotlyJS-jl-Interactive-plotting-in-Julia-24-2048.jpg)
![In [22]: # x optional and set attributes with keywords
plot(y1, marker_color="red", mode="markers")
Out[22]:
0 10 20 30 40 50
−1
−0.5
0
0.5
1](https://image.slidesharecdn.com/plotconslides-161210002611/75/PLOTCON-NYC-PlotlyJS-jl-Interactive-plotting-in-Julia-25-2048.jpg)
![In [23]: # columns become traces
plot(x, [y1 y2], kind="bar")
Out[23]:](https://image.slidesharecdn.com/plotconslides-161210002611/75/PLOTCON-NYC-PlotlyJS-jl-Interactive-plotting-in-Julia-26-2048.jpg)
![In [24]: # can pass layout
plot(x, [y1 y2], Layout(title="My sinusoids"))
Out[24]:
−4 −2 0 2 4
−1
−0.5
0
0.5
1
My sinusoids
trace 0
trace 1](https://image.slidesharecdn.com/plotconslides-161210002611/75/PLOTCON-NYC-PlotlyJS-jl-Interactive-plotting-in-Julia-27-2048.jpg)
![In [25]: # can plot functions
plot([sin, _ -> cos(exp(sin(2*_)))], -6, 6, Layout(title="My sinusoids"),
marker_symbol="square", mode="markers+lines", kind="bar")
Out[25]:](https://image.slidesharecdn.com/plotconslides-161210002611/75/PLOTCON-NYC-PlotlyJS-jl-Interactive-plotting-in-Julia-28-2048.jpg)
![Subplots
Declarative APIs for subplots can be verbose
PlotlyJS.jl tries to make this easier for you
Suppose you have creates 4 plots using plot:
You can combine them into subplots using familiar (h|v|hv)cat syntax:
p1 = plot(...)
p2 = plot(...)
p3 = plot(...)
p4 = plot(...)
[p1 p2] # 1 row 2 cols
[p1 p2 p3] # 1 row 3 cols
[p1, p2] # 2 rows 1 col
[p1 p2; p3 p4] # 2 rows 2 cols](https://image.slidesharecdn.com/plotconslides-161210002611/75/PLOTCON-NYC-PlotlyJS-jl-Interactive-plotting-in-Julia-29-2048.jpg)
![Example
In [26]: rand_plot(n) = plot(scatter(x=collect(1:n), y=randn(n)))
p1, p2, p3, p4 = [rand_plot(i) for i in [10, 20, 30, 40]];](https://image.slidesharecdn.com/plotconslides-161210002611/75/PLOTCON-NYC-PlotlyJS-jl-Interactive-plotting-in-Julia-30-2048.jpg)
![In [27]: # 2 columns, 1 row
[p1 p2]
Out[27]:
5 10
−1
−0.5
0
0.5
1
1.5
5 10 15 20
−2
−1.5
−1
−0.5
0
0.5
1
1.5
2
trace 0
trace 1](https://image.slidesharecdn.com/plotconslides-161210002611/75/PLOTCON-NYC-PlotlyJS-jl-Interactive-plotting-in-Julia-31-2048.jpg)
![In [28]: # 3 columns, 1 row
[p1 p2 p3]
Out[28]:
5 10
−1
−0.5
0
0.5
1
1.5
5 10 15 20
−2
−1.5
−1
−0.5
0
0.5
1
1.5
2
10 20 30
−2
−1.5
−1
−0.5
0
0.5
1
trace 0
trace 1
trace 2](https://image.slidesharecdn.com/plotconslides-161210002611/75/PLOTCON-NYC-PlotlyJS-jl-Interactive-plotting-in-Julia-32-2048.jpg)
![In [29]: # two rows
[p1, p2]
Out[29]:
2 4 6 8 10
−1
0
1
5 10 15 20
−2
−1
0
1
2
trace 0
trace 1](https://image.slidesharecdn.com/plotconslides-161210002611/75/PLOTCON-NYC-PlotlyJS-jl-Interactive-plotting-in-Julia-33-2048.jpg)
![In [30]: # two rows and columns
p = [p1 p2; p3 p4]
Out[30]:
5 10
−1
0
1
5 10 15 20
−2
−1
0
1
2
10 20 30
−2
−1
0
1
10 20 30 40
−2
−1
0
1
2
trace 0
trace 1
trace 2
trace 3](https://image.slidesharecdn.com/plotconslides-161210002611/75/PLOTCON-NYC-PlotlyJS-jl-Interactive-plotting-in-Julia-34-2048.jpg)
![... under the hood
We can inspect the json to see what we've been saved from
In [31]: print(json(p))
{"layout":{"xaxis4":{"domain":[0.55,1.0],"anchor":"y4"},"xaxis3":{"domain":[0.0,0.45],"anchor":"y3"},"yaxis2":{"
domain":[0.575,1.0],"anchor":"x2"},"yaxis1":{"domain":[0.575,1.0],"anchor":"x1"},"xaxis1":{"domain":[0.0,0.4
5],"anchor":"y1"},"margin":{"r":50,"l":50,"b":50,"t":60},"xaxis2":{"domain":[0.55,1.0],"anchor":"y2"},"yaxis4":{"
domain":[5.551115123125783e-17,0.42500000000000004],"anchor":"x4"},"yaxis3":{"domain":[5.551115123
125783e-17,0.42500000000000004],"anchor":"x3"}},"data":[{"yaxis":"y1","y":[0.4802673556774336,1.49489
51444362697,-0.07045549774812956,0.7875701715665517,1.19154169230362,-0.019984297282311308
,-1.2188104610632033,1.4889777636767583,0.1937548662633838,0.9467644161632363],"type":"scatter
","xaxis":"x1","x":[1,2,3,4,5,6,7,8,9,10]},{"yaxis":"y2","y":[0.8116890547201712,0.026305587394362537,-1.9
037677467854397,0.5179875294705465,1.132848386254002,-1.1211047904365008,-0.09732503991256
072,-0.797064674081989,-0.5957822490328146,-1.5401700868810337,-0.8094006419764531,1.473379
0412159211,1.8303960585896535,0.5451000885288673,-0.8508167149855682,0.5592069782568302,-0.
5819292461464338,0.08366492698814007,-1.2171127224168015,-1.1731942880984414],"type":"scatter"
,"xaxis":"x2","x":[1,2,3,4,5,6,7,8,9,10,11,12,13,14,15,16,17,18,19,20]},{"yaxis":"y3","y":[0.445644268361460
15,0.43568978674287906,-2.2957964903407775,-1.5588172083692364,-0.5175404777486905,-0.68798
65409420531,-1.3614114948496532,-0.26860396772198347,-0.4550258510176642,-0.66615874133325
51,-0.6568459806232246,-0.655160517941339,-1.0584839635045593,-0.9661978451654369,0.0558816
3077019386,0.4473040023028272,-0.4180878888519696,-0.670930203698033,-1.5680157591455446,-0
.12061123763796747,0.422381416839956,-1.912905533601873,-0.7864305169890853,0.362836708603
15104,1.1179292892139105,0.24868455953112426,0.8826378694420977,0.7852575028904395,-0.7092
479652592288,-0.7193948586827139],"type":"scatter","xaxis":"x3","x":[1,2,3,4,5,6,7,8,9,10,11,12,13,14,15,
16,17,18,19,20,21,22,23,24,25,26,27,28,29,30]},{"yaxis":"y4","y":[-1.1744007569318526,-0.777333601105
0302,1.4579909852349564,0.645916605678359,0.05423891204909586,-0.5428595063217369,0.788054
5251999888,-0.14699104765892224,-0.3646094249332061,-0.4594704011787981,2.051735462555251,-
0.10082715474940011,-1.1039826364944816,-0.6379899490941968,2.1124562929284965,1.553274330
113308,-0.03180412490346881,0.5406670948650817,0.2738357386022979,-0.15275395057926666,-0.6
982546882702967,-0.30727020052937565,0.214317134550011,-0.5067747133088952,0.0099432180881
08437,-1.3286282576286048,-0.7921663785646528,-1.920398068028969,-0.37936872456340026,0.042
28943262867289,-0.9117834367846034,1.7365583749057234,-0.35923210966846647,-1.097482170333](https://image.slidesharecdn.com/plotconslides-161210002611/75/PLOTCON-NYC-PlotlyJS-jl-Interactive-plotting-in-Julia-35-2048.jpg)
![In [32]:
In [33]:
In [34]:
In [35]:
In [36]:
myplot = rand_plot(10)
restyle!(myplot, marker_color="ForestGreen")
relayout!(myplot, title="This is my title")
addtraces!(myplot, trace1)
prependtraces!(myplot, 1, x=[[0.1, 0.2, 0.3, 1]], y=[rand(4)])
Out[32]:
2 4 6 8 10
−1.5
−1
−0.5
0
0.5
1
1.5](https://image.slidesharecdn.com/plotconslides-161210002611/75/PLOTCON-NYC-PlotlyJS-jl-Interactive-plotting-in-Julia-37-2048.jpg)
![Interact.jl
We can leverage Interact.jl to put have IPython widgets interact with our plots
In [38]: using Interact](https://image.slidesharecdn.com/plotconslides-161210002611/75/PLOTCON-NYC-PlotlyJS-jl-Interactive-plotting-in-Julia-38-2048.jpg)
![In [39]: x = linspace(-4, 4, 70)
p = plot(x, sin(x), Layout(xaxis_range=(-5, 5),
yaxis_range=(-1.1, 1.1)))
display(p)
colors = ["red", "green", "blue", "orange"]
modes = ["markers", "lines", "markers+lines"]
φs = linspace(-2, 2, 100)
ωs = linspace(-π, π, 100)
@manipulate for c in colors, m in modes, φ in φs, ω in ωs
y = sin.(ω*x + φ)
restyle!(p, y=(y,), marker_color=c, mode=m)
end
−4 −2 0 2 4
−1
−0.5
0
0.5
1](https://image.slidesharecdn.com/plotconslides-161210002611/75/PLOTCON-NYC-PlotlyJS-jl-Interactive-plotting-in-Julia-39-2048.jpg)


![Using Syles
There are two main ways to use a Style:
Global mode: call the use_style!(::Style)
Plot by plot mode: All methods of the plot and Plot functions accept a keyword
argument style::Style that sets the style for that plot only.
In [43]: use_style!(:ggplot)
simpleplot(;kw...) = plot([sin, cos], -6, 6; kw...)
simpleplot()
Out[43]:
−0.5
0
0.5
1 sin
cos](https://image.slidesharecdn.com/plotconslides-161210002611/75/PLOTCON-NYC-PlotlyJS-jl-Interactive-plotting-in-Julia-48-2048.jpg)
![In [44]: simpleplot(style=style(:seaborn))
Out[44]:
−6 −4 −2 0 2 4 6
−1
−0.5
0
0.5
1
sin
cos](https://image.slidesharecdn.com/plotconslides-161210002611/75/PLOTCON-NYC-PlotlyJS-jl-Interactive-plotting-in-Julia-49-2048.jpg)
![In [45]: simpleplot(style=style(:fivethirtyeight))
Out[45]:
−6 −4 −2 0 2 4 6
−1
−0.5
0
0.5
1 sin
cos](https://image.slidesharecdn.com/plotconslides-161210002611/75/PLOTCON-NYC-PlotlyJS-jl-Interactive-plotting-in-Julia-50-2048.jpg)
![In [46]: simpleplot(style=style(:tomorrow_night_eighties))
Out[46]:
−6 −4 −2 0 2 4 6
−1
−0.5
0
0.5
1 sin
cos](https://image.slidesharecdn.com/plotconslides-161210002611/75/PLOTCON-NYC-PlotlyJS-jl-Interactive-plotting-in-Julia-51-2048.jpg)
![In [47]:
In [ ]:
simpleplot()
Out[47]:
−6 −4 −2 0 2 4 6
−1
−0.5
0
0.5
1 sin
cos](https://image.slidesharecdn.com/plotconslides-161210002611/75/PLOTCON-NYC-PlotlyJS-jl-Interactive-plotting-in-Julia-52-2048.jpg)
![: Interactive plotting in Julia
Spencer Lyon
November 18, 2016
NOTE: You are viewing a static export of an interactive web-based slide deck. Some
items in the slides did not export properly to the pdf. To see a live version of the slides
visit
In [1]:
PlotlyJS.jl
http://spencerlyon.com/presentations/
using PlotlyJS
Plotly javascript loaded.
To load again call
init_notebook(true)](https://crownmelresort.com/image.slidesharecdn.com/plotconslides-161210002611/75/PLOTCON-NYC-PlotlyJS-jl-Interactive-plotting-in-Julia-1-2048.jpg)


![In [2]: f(x, y) = "Two arguments: $(x) and $(y)"
f("hello", "plotcon")
Out[2]: "Two arguments: hello and plotcon"](https://crownmelresort.com/image.slidesharecdn.com/plotconslides-161210002611/75/PLOTCON-NYC-PlotlyJS-jl-Interactive-plotting-in-Julia-6-2048.jpg)
![In [3]:
In [4]:
In [5]:
In [6]:
f(x::Number, y) = "First arg is a number ($(x)), second isn't ($(y))"
# still old method
f("hello", "plotcon")
# new method
f(2, "plotcon")
# Generics
# also new method, but this time with floating point first argument
f(2.0, "plotcon")
Out[3]: f (generic function with 2 methods)
Out[4]: "Two arguments: hello and plotcon"
Out[5]: "First arg is a number (2), second isn't (plotcon)"
Out[6]: "First arg is a number (2.0), second isn't (plotcon)"](https://crownmelresort.com/image.slidesharecdn.com/plotconslides-161210002611/75/PLOTCON-NYC-PlotlyJS-jl-Interactive-plotting-in-Julia-7-2048.jpg)
![In [7]:
In [8]:
In [9]:
# longer function syntax
function f(x::Number, y::Number)
"Two numbers: ($(x), $(y))"
end
# newest method
f(2.0, 2)
# unsigned 8 bit int and BigInt
f(0x81, big(4))
Out[7]: f (generic function with 3 methods)
Out[8]: "Two numbers: (2.0, 2)"
Out[9]: "Two numbers: (129, 4)"](https://crownmelresort.com/image.slidesharecdn.com/plotconslides-161210002611/75/PLOTCON-NYC-PlotlyJS-jl-Interactive-plotting-in-Julia-8-2048.jpg)


![Faithful plotly.js api layer
plotly.js visualzations are described as a JSON object:
Let's look at how we can build these traces and a Layout in Julia
{
// Overall chart attributes
"layout": {
"title": "x²"
},
"data": [
// JSON array of 'traces'
{
// Example trace
"type": "scatter",
"y": [1, 4.0, 9.0],
"marker": {
"symbol": "square"
}
}
]
}](https://crownmelresort.com/image.slidesharecdn.com/plotconslides-161210002611/75/PLOTCON-NYC-PlotlyJS-jl-Interactive-plotting-in-Julia-12-2048.jpg)
![By Hand
JSON is naturally represented as Julia Dict
Example from above:
Building nested Dicts in Julia isn't convenient
Need to spell out Dict
Need to add lots of quotes (similar to raw json)
Also need => to separate keys/values
Dict(
"layout" => Dict(
"title" => "x²"
),
"data" => [
Dict(
"type" => "scatter",
"y" => [1, 4.0, 9.0],
"marker" => Dict(
"symbol" => "square"
)
)
]
)](https://crownmelresort.com/image.slidesharecdn.com/plotconslides-161210002611/75/PLOTCON-NYC-PlotlyJS-jl-Interactive-plotting-in-Julia-13-2048.jpg)
![With PlotlyJS.jl
PlotlyJS.jl eases this burden for Julia programmers
In [10]: plot(scatter(y=[1.0, 4.0, 9.0], marker_symbol="square"),
Layout(title="x²"))
Out[10]:
0 0.5 1 1.5 2
1
2
3
4
5
6
7
8
9
x²](https://crownmelresort.com/image.slidesharecdn.com/plotconslides-161210002611/75/PLOTCON-NYC-PlotlyJS-jl-Interactive-plotting-in-Julia-14-2048.jpg)
![Traces
Let's take a closer look at building trace
Construct traces using the trace type as a function and setting keyword
arguments
Example trace from above:
In [11]:
Notice the syntax marker_symbol.
This sets a nested json atrribute {"marker": {"symbol": "square"}}
See the json
In [12]:
my_trace = scatter(y=[1.0, 4.0, 9.0], marker_symbol="square")
print(json(my_trace, 2))
Out[11]: scatter with fields marker, type, and y
{
"y": [
1.0,
4.0,
9.0
],
"type": "scatter",
"marker": {
"symbol": "square"
}
}](https://crownmelresort.com/image.slidesharecdn.com/plotconslides-161210002611/75/PLOTCON-NYC-PlotlyJS-jl-Interactive-plotting-in-Julia-15-2048.jpg)
![More Examples
In [13]:
In [14]:
# nesting works at more than one level
trace1 = scatter(y=rand(10), marker_color="red",
marker_line_width=2.0)
trace2 = contour(x=1:5, y=1:10, z=randn(5, 10))
trace3 = bar(x=1:10, y=rand(1:10, 10), name="mybar")
print(json(trace1, 2))
Out[13]: bar with fields name, type, x, and y
{
"y": [
0.8168546843804745,
0.1967457511182984,
0.5148182283741638,
0.31298671217983753,
0.10559144576552915,
0.6834355544280886,
0.7503355447535949,
0.33011457537607636,
0.05938681725632655,
0.858053689412962
],
"type": "scatter",
"marker": {
"line": {
"width": 2.0
},
"color": "red"
}
}](https://crownmelresort.com/image.slidesharecdn.com/plotconslides-161210002611/75/PLOTCON-NYC-PlotlyJS-jl-Interactive-plotting-in-Julia-16-2048.jpg)

![Layout
Build a layout by constructing a Layout object:
In [15]:
The same underscore magic applies
Also notice the attr function. This allows you to create groups of nested
attributes.
foo=attr(x=1, y=2) produces {"foo": {"x": 1, "y": 2}}
It is an alternative to foo_x=1, foo_y=2
attr can be used when building traces also
layout = Layout(xaxis=attr(range=[0, 10],
title="assets"),
yaxis_title="consumption",
title="??")
Out[15]: layout with fields margin, title, xaxis, and yaxis](https://crownmelresort.com/image.slidesharecdn.com/plotconslides-161210002611/75/PLOTCON-NYC-PlotlyJS-jl-Interactive-plotting-in-Julia-18-2048.jpg)
![In [16]: print(json(layout, 2))
{
"yaxis": {
"title": "consumption"
},
"xaxis": {
"range": [
0,
10
],
"title": "assets"
},
"title": "??",
"margin": {
"r": 50,
"l": 50,
"b": 50,
"t": 60
}
}](https://crownmelresort.com/image.slidesharecdn.com/plotconslides-161210002611/75/PLOTCON-NYC-PlotlyJS-jl-Interactive-plotting-in-Julia-19-2048.jpg)
![To actually display a plot, we tie one or more traces together with a layout by calling the
plot function:
In [17]: plot(trace1, layout)
Out[17]:
0 2 4 6 8 10
0.1
0.2
0.3
0.4
0.5
0.6
0.7
0.8
0.9
??
assets
consumption](https://crownmelresort.com/image.slidesharecdn.com/plotconslides-161210002611/75/PLOTCON-NYC-PlotlyJS-jl-Interactive-plotting-in-Julia-20-2048.jpg)
![In [18]: # layout optional
plot(trace2)
Out[18]:](https://crownmelresort.com/image.slidesharecdn.com/plotconslides-161210002611/75/PLOTCON-NYC-PlotlyJS-jl-Interactive-plotting-in-Julia-21-2048.jpg)
![In [19]: # more than one trace
plot([trace1, trace3], layout)
Out[19]:](https://crownmelresort.com/image.slidesharecdn.com/plotconslides-161210002611/75/PLOTCON-NYC-PlotlyJS-jl-Interactive-plotting-in-Julia-22-2048.jpg)
![Convenience API
The plot function has a number of other methods that try to make it a bit easier to
construct simple plots (remember multiple dispatch? :) )
In [20]: methods(plot)
Out[20]: 13 methods for generic function plot:
plot{T<:Number,T2<:Number}(x::AbstractArray{T,1},
y::AbstractArray{T2,2}) at
plot{T<:Number,T2<:Number}(x::AbstractArray{T,1},
y::AbstractArray{T2,2}, l::PlotlyJS.Layout; style, kwargs...) at
plot{T<:Number,T2<:Number}(x::AbstractArray{T,2},
y::AbstractArray{T2,2}) at
plot{T<:Number,T2<:Number}(x::AbstractArray{T,2},
y::AbstractArray{T2,2}, l::PlotlyJS.Layout; style, kwargs...) at
/Users/sglyon/.julia/v0.5/PlotlyJS/src/convenience_api.jl:31
/Users/sglyon/.julia/v0.5/PlotlyJS/src/convenience_api.jl:31
/Users/sglyon/.julia/v0.5/PlotlyJS/src/convenience_api.jl:40
/Users/sglyon/.julia/v0.5/PlotlyJS/src/convenience_api.jl:40](https://crownmelresort.com/image.slidesharecdn.com/plotconslides-161210002611/75/PLOTCON-NYC-PlotlyJS-jl-Interactive-plotting-in-Julia-23-2048.jpg)
![Let's see a few of them in action
In [21]: x = linspace(-5, 5, 50)
y1 = sin(x)
y2 = cos(x)
plot(x, y1)
Out[21]:
−4 −2 0 2 4
−1
−0.5
0
0.5
1](https://crownmelresort.com/image.slidesharecdn.com/plotconslides-161210002611/75/PLOTCON-NYC-PlotlyJS-jl-Interactive-plotting-in-Julia-24-2048.jpg)
![In [22]: # x optional and set attributes with keywords
plot(y1, marker_color="red", mode="markers")
Out[22]:
0 10 20 30 40 50
−1
−0.5
0
0.5
1](https://crownmelresort.com/image.slidesharecdn.com/plotconslides-161210002611/75/PLOTCON-NYC-PlotlyJS-jl-Interactive-plotting-in-Julia-25-2048.jpg)
![In [23]: # columns become traces
plot(x, [y1 y2], kind="bar")
Out[23]:](https://crownmelresort.com/image.slidesharecdn.com/plotconslides-161210002611/75/PLOTCON-NYC-PlotlyJS-jl-Interactive-plotting-in-Julia-26-2048.jpg)
![In [24]: # can pass layout
plot(x, [y1 y2], Layout(title="My sinusoids"))
Out[24]:
−4 −2 0 2 4
−1
−0.5
0
0.5
1
My sinusoids
trace 0
trace 1](https://crownmelresort.com/image.slidesharecdn.com/plotconslides-161210002611/75/PLOTCON-NYC-PlotlyJS-jl-Interactive-plotting-in-Julia-27-2048.jpg)
![In [25]: # can plot functions
plot([sin, _ -> cos(exp(sin(2*_)))], -6, 6, Layout(title="My sinusoids"),
marker_symbol="square", mode="markers+lines", kind="bar")
Out[25]:](https://crownmelresort.com/image.slidesharecdn.com/plotconslides-161210002611/75/PLOTCON-NYC-PlotlyJS-jl-Interactive-plotting-in-Julia-28-2048.jpg)
![Subplots
Declarative APIs for subplots can be verbose
PlotlyJS.jl tries to make this easier for you
Suppose you have creates 4 plots using plot:
You can combine them into subplots using familiar (h|v|hv)cat syntax:
p1 = plot(...)
p2 = plot(...)
p3 = plot(...)
p4 = plot(...)
[p1 p2] # 1 row 2 cols
[p1 p2 p3] # 1 row 3 cols
[p1, p2] # 2 rows 1 col
[p1 p2; p3 p4] # 2 rows 2 cols](https://crownmelresort.com/image.slidesharecdn.com/plotconslides-161210002611/75/PLOTCON-NYC-PlotlyJS-jl-Interactive-plotting-in-Julia-29-2048.jpg)
![Example
In [26]: rand_plot(n) = plot(scatter(x=collect(1:n), y=randn(n)))
p1, p2, p3, p4 = [rand_plot(i) for i in [10, 20, 30, 40]];](https://crownmelresort.com/image.slidesharecdn.com/plotconslides-161210002611/75/PLOTCON-NYC-PlotlyJS-jl-Interactive-plotting-in-Julia-30-2048.jpg)
![In [27]: # 2 columns, 1 row
[p1 p2]
Out[27]:
5 10
−1
−0.5
0
0.5
1
1.5
5 10 15 20
−2
−1.5
−1
−0.5
0
0.5
1
1.5
2
trace 0
trace 1](https://crownmelresort.com/image.slidesharecdn.com/plotconslides-161210002611/75/PLOTCON-NYC-PlotlyJS-jl-Interactive-plotting-in-Julia-31-2048.jpg)
![In [28]: # 3 columns, 1 row
[p1 p2 p3]
Out[28]:
5 10
−1
−0.5
0
0.5
1
1.5
5 10 15 20
−2
−1.5
−1
−0.5
0
0.5
1
1.5
2
10 20 30
−2
−1.5
−1
−0.5
0
0.5
1
trace 0
trace 1
trace 2](https://crownmelresort.com/image.slidesharecdn.com/plotconslides-161210002611/75/PLOTCON-NYC-PlotlyJS-jl-Interactive-plotting-in-Julia-32-2048.jpg)
![In [29]: # two rows
[p1, p2]
Out[29]:
2 4 6 8 10
−1
0
1
5 10 15 20
−2
−1
0
1
2
trace 0
trace 1](https://crownmelresort.com/image.slidesharecdn.com/plotconslides-161210002611/75/PLOTCON-NYC-PlotlyJS-jl-Interactive-plotting-in-Julia-33-2048.jpg)
![In [30]: # two rows and columns
p = [p1 p2; p3 p4]
Out[30]:
5 10
−1
0
1
5 10 15 20
−2
−1
0
1
2
10 20 30
−2
−1
0
1
10 20 30 40
−2
−1
0
1
2
trace 0
trace 1
trace 2
trace 3](https://crownmelresort.com/image.slidesharecdn.com/plotconslides-161210002611/75/PLOTCON-NYC-PlotlyJS-jl-Interactive-plotting-in-Julia-34-2048.jpg)
![... under the hood
We can inspect the json to see what we've been saved from
In [31]: print(json(p))
{"layout":{"xaxis4":{"domain":[0.55,1.0],"anchor":"y4"},"xaxis3":{"domain":[0.0,0.45],"anchor":"y3"},"yaxis2":{"
domain":[0.575,1.0],"anchor":"x2"},"yaxis1":{"domain":[0.575,1.0],"anchor":"x1"},"xaxis1":{"domain":[0.0,0.4
5],"anchor":"y1"},"margin":{"r":50,"l":50,"b":50,"t":60},"xaxis2":{"domain":[0.55,1.0],"anchor":"y2"},"yaxis4":{"
domain":[5.551115123125783e-17,0.42500000000000004],"anchor":"x4"},"yaxis3":{"domain":[5.551115123
125783e-17,0.42500000000000004],"anchor":"x3"}},"data":[{"yaxis":"y1","y":[0.4802673556774336,1.49489
51444362697,-0.07045549774812956,0.7875701715665517,1.19154169230362,-0.019984297282311308
,-1.2188104610632033,1.4889777636767583,0.1937548662633838,0.9467644161632363],"type":"scatter
","xaxis":"x1","x":[1,2,3,4,5,6,7,8,9,10]},{"yaxis":"y2","y":[0.8116890547201712,0.026305587394362537,-1.9
037677467854397,0.5179875294705465,1.132848386254002,-1.1211047904365008,-0.09732503991256
072,-0.797064674081989,-0.5957822490328146,-1.5401700868810337,-0.8094006419764531,1.473379
0412159211,1.8303960585896535,0.5451000885288673,-0.8508167149855682,0.5592069782568302,-0.
5819292461464338,0.08366492698814007,-1.2171127224168015,-1.1731942880984414],"type":"scatter"
,"xaxis":"x2","x":[1,2,3,4,5,6,7,8,9,10,11,12,13,14,15,16,17,18,19,20]},{"yaxis":"y3","y":[0.445644268361460
15,0.43568978674287906,-2.2957964903407775,-1.5588172083692364,-0.5175404777486905,-0.68798
65409420531,-1.3614114948496532,-0.26860396772198347,-0.4550258510176642,-0.66615874133325
51,-0.6568459806232246,-0.655160517941339,-1.0584839635045593,-0.9661978451654369,0.0558816
3077019386,0.4473040023028272,-0.4180878888519696,-0.670930203698033,-1.5680157591455446,-0
.12061123763796747,0.422381416839956,-1.912905533601873,-0.7864305169890853,0.362836708603
15104,1.1179292892139105,0.24868455953112426,0.8826378694420977,0.7852575028904395,-0.7092
479652592288,-0.7193948586827139],"type":"scatter","xaxis":"x3","x":[1,2,3,4,5,6,7,8,9,10,11,12,13,14,15,
16,17,18,19,20,21,22,23,24,25,26,27,28,29,30]},{"yaxis":"y4","y":[-1.1744007569318526,-0.777333601105
0302,1.4579909852349564,0.645916605678359,0.05423891204909586,-0.5428595063217369,0.788054
5251999888,-0.14699104765892224,-0.3646094249332061,-0.4594704011787981,2.051735462555251,-
0.10082715474940011,-1.1039826364944816,-0.6379899490941968,2.1124562929284965,1.553274330
113308,-0.03180412490346881,0.5406670948650817,0.2738357386022979,-0.15275395057926666,-0.6
982546882702967,-0.30727020052937565,0.214317134550011,-0.5067747133088952,0.0099432180881
08437,-1.3286282576286048,-0.7921663785646528,-1.920398068028969,-0.37936872456340026,0.042
28943262867289,-0.9117834367846034,1.7365583749057234,-0.35923210966846647,-1.097482170333](https://crownmelresort.com/image.slidesharecdn.com/plotconslides-161210002611/75/PLOTCON-NYC-PlotlyJS-jl-Interactive-plotting-in-Julia-35-2048.jpg)

![In [32]:
In [33]:
In [34]:
In [35]:
In [36]:
myplot = rand_plot(10)
restyle!(myplot, marker_color="ForestGreen")
relayout!(myplot, title="This is my title")
addtraces!(myplot, trace1)
prependtraces!(myplot, 1, x=[[0.1, 0.2, 0.3, 1]], y=[rand(4)])
Out[32]:
2 4 6 8 10
−1.5
−1
−0.5
0
0.5
1
1.5](https://crownmelresort.com/image.slidesharecdn.com/plotconslides-161210002611/75/PLOTCON-NYC-PlotlyJS-jl-Interactive-plotting-in-Julia-37-2048.jpg)
![Interact.jl
We can leverage Interact.jl to put have IPython widgets interact with our plots
In [38]: using Interact](https://crownmelresort.com/image.slidesharecdn.com/plotconslides-161210002611/75/PLOTCON-NYC-PlotlyJS-jl-Interactive-plotting-in-Julia-38-2048.jpg)
![In [39]: x = linspace(-4, 4, 70)
p = plot(x, sin(x), Layout(xaxis_range=(-5, 5),
yaxis_range=(-1.1, 1.1)))
display(p)
colors = ["red", "green", "blue", "orange"]
modes = ["markers", "lines", "markers+lines"]
φs = linspace(-2, 2, 100)
ωs = linspace(-π, π, 100)
@manipulate for c in colors, m in modes, φ in φs, ω in ωs
y = sin.(ω*x + φ)
restyle!(p, y=(y,), marker_color=c, mode=m)
end
−4 −2 0 2 4
−1
−0.5
0
0.5
1](https://crownmelresort.com/image.slidesharecdn.com/plotconslides-161210002611/75/PLOTCON-NYC-PlotlyJS-jl-Interactive-plotting-in-Julia-39-2048.jpg)


![Using Syles
There are two main ways to use a Style:
Global mode: call the use_style!(::Style)
Plot by plot mode: All methods of the plot and Plot functions accept a keyword
argument style::Style that sets the style for that plot only.
In [43]: use_style!(:ggplot)
simpleplot(;kw...) = plot([sin, cos], -6, 6; kw...)
simpleplot()
Out[43]:
−0.5
0
0.5
1 sin
cos](https://crownmelresort.com/image.slidesharecdn.com/plotconslides-161210002611/75/PLOTCON-NYC-PlotlyJS-jl-Interactive-plotting-in-Julia-48-2048.jpg)
![In [44]: simpleplot(style=style(:seaborn))
Out[44]:
−6 −4 −2 0 2 4 6
−1
−0.5
0
0.5
1
sin
cos](https://crownmelresort.com/image.slidesharecdn.com/plotconslides-161210002611/75/PLOTCON-NYC-PlotlyJS-jl-Interactive-plotting-in-Julia-49-2048.jpg)
![In [45]: simpleplot(style=style(:fivethirtyeight))
Out[45]:
−6 −4 −2 0 2 4 6
−1
−0.5
0
0.5
1 sin
cos](https://crownmelresort.com/image.slidesharecdn.com/plotconslides-161210002611/75/PLOTCON-NYC-PlotlyJS-jl-Interactive-plotting-in-Julia-50-2048.jpg)
![In [46]: simpleplot(style=style(:tomorrow_night_eighties))
Out[46]:
−6 −4 −2 0 2 4 6
−1
−0.5
0
0.5
1 sin
cos](https://crownmelresort.com/image.slidesharecdn.com/plotconslides-161210002611/75/PLOTCON-NYC-PlotlyJS-jl-Interactive-plotting-in-Julia-51-2048.jpg)
![In [47]:
In [ ]:
simpleplot()
Out[47]:
−6 −4 −2 0 2 4 6
−1
−0.5
0
0.5
1 sin
cos](https://crownmelresort.com/image.slidesharecdn.com/plotconslides-161210002611/75/PLOTCON-NYC-PlotlyJS-jl-Interactive-plotting-in-Julia-52-2048.jpg)

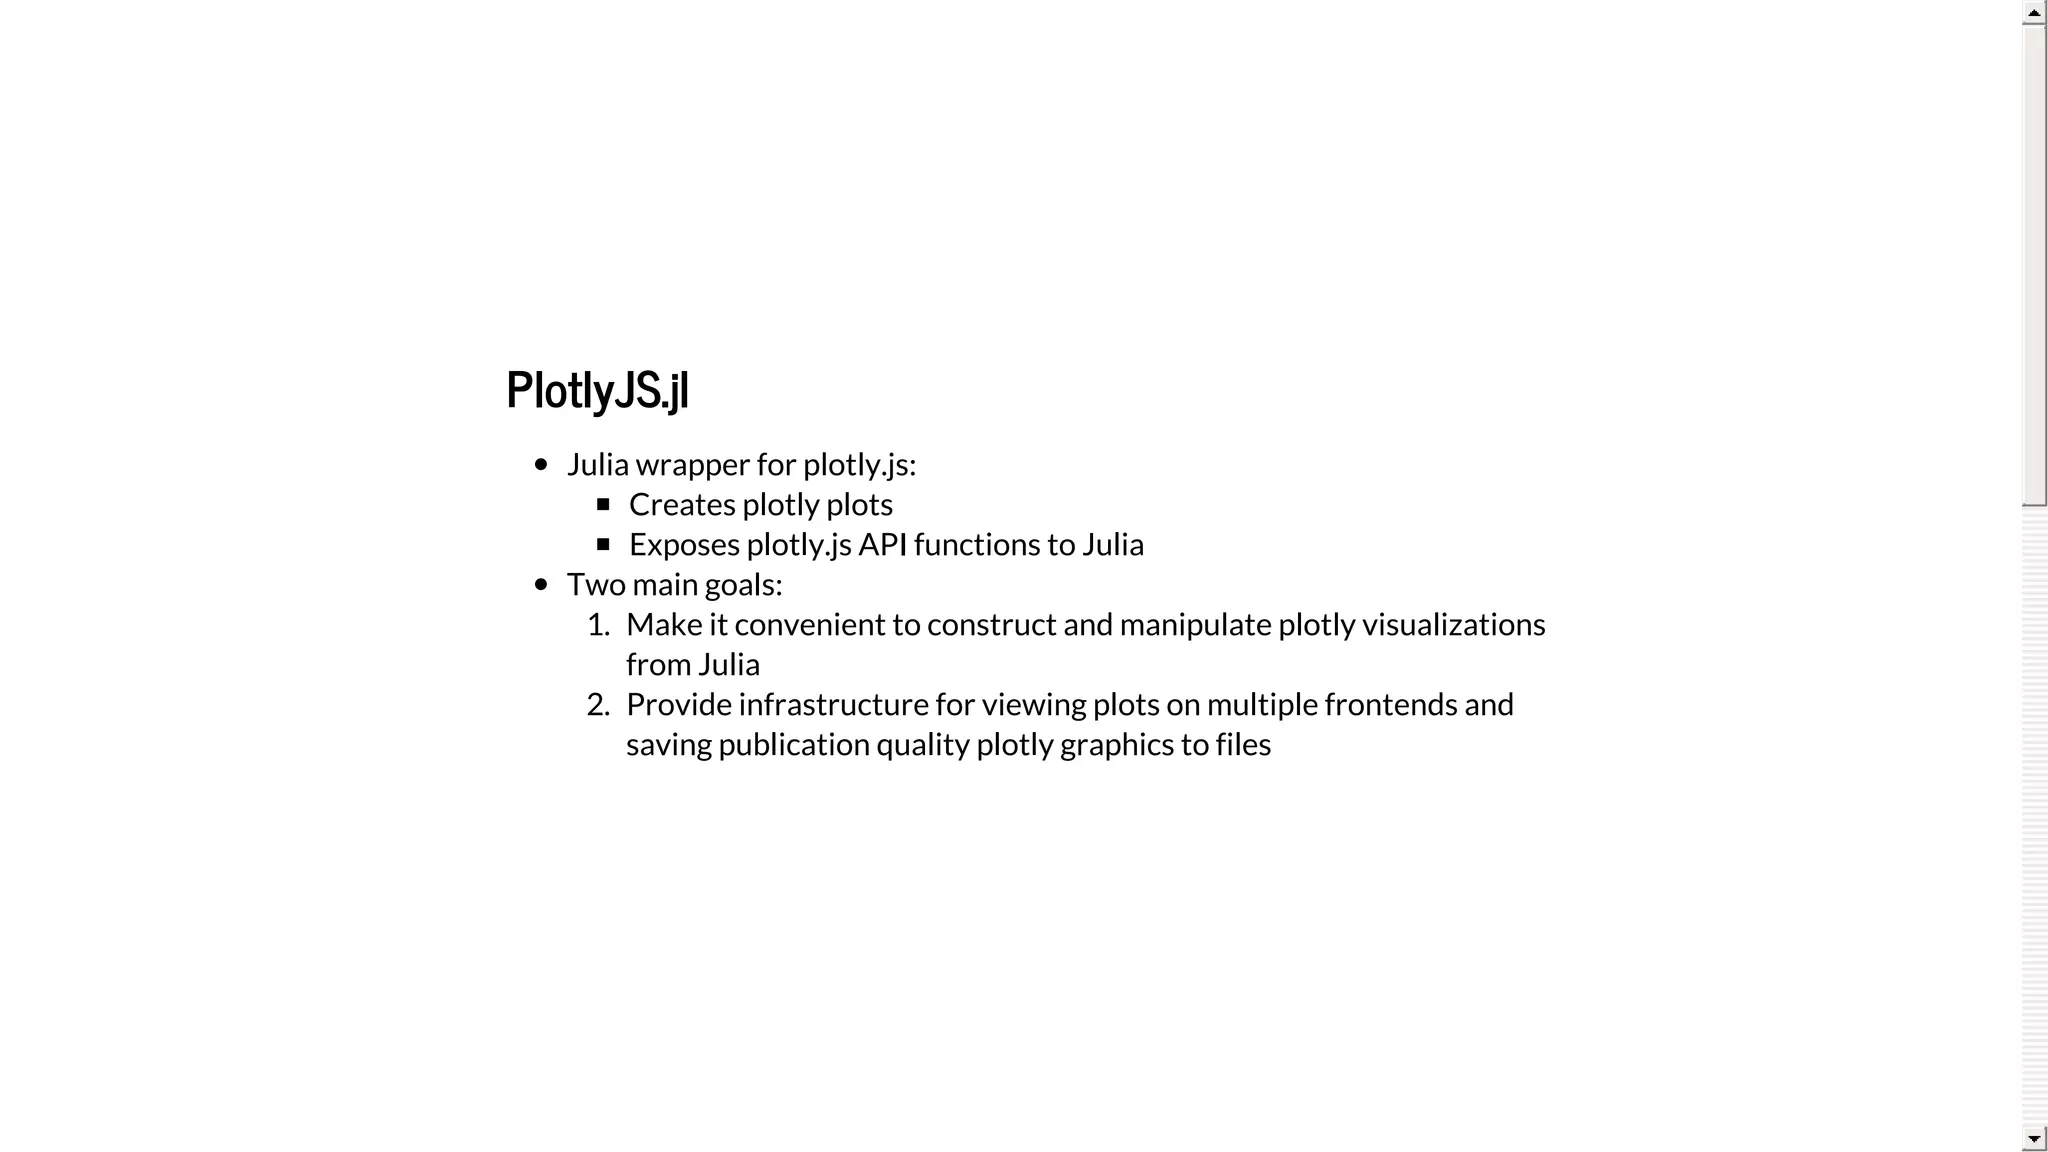
PlotlyJS.jl is a Julia wrapper for the interactive JavaScript plotting library plotly.js. It provides two main layers: 1) a faithful representation of the plotly.js API to allow constructing plots and visualizations programmatically in JSON format, and 2) convenience functions and syntax to make common plotting tasks more natural in Julia, such as plotting data with a single function call or combining multiple plots into subplots. The library aims to make interactive visualization easy and publication-quality from Julia.