Download as PDF, PPTX


![Ye Olde BPF
Berkeley Packet Filter
# tcpdump host 127.0.0.1 and port 22 -d
(000) ldh [12]
(001) jeq #0x800 jt 2 jf 18
(002) ld [26]
(003) jeq #0x7f000001 jt 6 jf 4
(004) ld [30]
(005) jeq #0x7f000001 jt 6 jf 18
(006) ldb [23]
(007) jeq #0x84 jt 10 jf 8
(008) jeq #0x6 jt 10 jf 9
(009) jeq #0x11 jt 10 jf 18
(010) ldh [20]
(011) jset #0x1fff jt 18 jf 12
(012) ldxb 4*([14]&0xf)
(013) ldh [x + 14]
[...]
User-defined bytecode
executed by an in-kernel
sandboxed virtual machine
Steven McCanne and Van Jacobson, 1993
2 x 32-bit registers
& scratch memory
Optimizes packet filter
performance](https://image.slidesharecdn.com/oss2017bpfsuperpowers-170913225212/75/OSSNA-2017-Performance-Analysis-Superpowers-with-Linux-BPF-10-2048.jpg)

![bcc Installation
• https://github.com/iovisor/bcc/blob/master/INSTALL.md
• eg, Ubuntu Xenial:
– Also available as an Ubuntu snap
– Ubuntu 16.04 is good, 16.10 better: more tools work
• Installs many tools
– In /usr/share/bcc/tools, and …/tools/old for older kernels
# echo "deb [trusted=yes] https://repo.iovisor.org/apt/xenial xenial-nightly main" |
sudo tee /etc/apt/sources.list.d/iovisor.list
# sudo apt-get update
# sudo apt-get install bcc-tools](https://image.slidesharecdn.com/oss2017bpfsuperpowers-170913225212/75/OSSNA-2017-Performance-Analysis-Superpowers-with-Linux-BPF-27-2048.jpg)
![Discover short-lived process issues using execsnoop
# execsnoop -t
TIME(s) PCOMM PID PPID RET ARGS
0.031 dirname 23832 23808 0 /usr/bin/dirname /apps/tomcat/bin/catalina.sh
0.888 run 23833 2344 0 ./run
0.889 run 23833 2344 -2 /command/bash
0.889 run 23833 2344 -2 /usr/local/bin/bash
0.889 run 23833 2344 -2 /usr/local/sbin/bash
0.889 bash 23833 2344 0 /bin/bash
0.894 svstat 23835 23834 0 /command/svstat /service/nflx-httpd
0.894 perl 23836 23834 0 /usr/bin/perl -e $l=<>;$l=~/(d+) sec/;print $1||0;
0.899 ps 23838 23837 0 /bin/ps --ppid 1 -o pid,cmd,args
0.900 grep 23839 23837 0 /bin/grep org.apache.catalina
0.900 sed 23840 23837 0 /bin/sed s/^ *//;
0.900 cut 23841 23837 0 /usr/bin/cut -d -f 1
0.901 xargs 23842 23837 0 /usr/bin/xargs
0.912 xargs 23843 23842 -2 /command/echo
0.912 xargs 23843 23842 -2 /usr/local/bin/echo
0.912 xargs 23843 23842 -2 /usr/local/sbin/echo
0.912 echo 23843 23842 0 /bin/echo
[...]
Efficient: only traces exec()](https://image.slidesharecdn.com/oss2017bpfsuperpowers-170913225212/75/OSSNA-2017-Performance-Analysis-Superpowers-with-Linux-BPF-29-2048.jpg)
![Discover short-lived process issues using execsnoop
# execsnoop -t
TIME(s) PCOMM PID PPID RET ARGS
0.031 dirname 23832 23808 0 /usr/bin/dirname /apps/tomcat/bin/catalina.sh
0.888 run 23833 2344 0 ./run
0.889 run 23833 2344 -2 /command/bash
0.889 run 23833 2344 -2 /usr/local/bin/bash
0.889 run 23833 2344 -2 /usr/local/sbin/bash
0.889 bash 23833 2344 0 /bin/bash
0.894 svstat 23835 23834 0 /command/svstat /service/nflx-httpd
0.894 perl 23836 23834 0 /usr/bin/perl -e $l=<>;$l=~/(d+) sec/;print $1||0;
0.899 ps 23838 23837 0 /bin/ps --ppid 1 -o pid,cmd,args
0.900 grep 23839 23837 0 /bin/grep org.apache.catalina
0.900 sed 23840 23837 0 /bin/sed s/^ *//;
0.900 cut 23841 23837 0 /usr/bin/cut -d -f 1
0.901 xargs 23842 23837 0 /usr/bin/xargs
0.912 xargs 23843 23842 -2 /command/echo
0.912 xargs 23843 23842 -2 /usr/local/bin/echo
0.912 xargs 23843 23842 -2 /usr/local/sbin/echo
0.912 echo 23843 23842 0 /bin/echo
[...]
Efficient: only traces exec()](https://image.slidesharecdn.com/oss2017bpfsuperpowers-170913225212/75/OSSNA-2017-Performance-Analysis-Superpowers-with-Linux-BPF-30-2048.jpg)
![Exonerate or confirm storage latency outliers with ext4slower
# /usr/share/bcc/tools/ext4slower 1
Tracing ext4 operations slower than 1 ms
TIME COMM PID T BYTES OFF_KB LAT(ms) FILENAME
17:31:42 postdrop 15523 S 0 0 2.32 5630D406E4
17:31:42 cleanup 15524 S 0 0 1.89 57BB7406EC
17:32:09 titus-log-ship 19735 S 0 0 1.94 slurper_checkpoint.db
17:35:37 dhclient 1061 S 0 0 3.32 dhclient.eth0.leases
17:35:39 systemd-journa 504 S 0 0 26.62 system.journal
17:35:39 systemd-journa 504 S 0 0 1.56 system.journal
17:35:39 systemd-journa 504 S 0 0 1.73 system.journal
17:35:45 postdrop 16187 S 0 0 2.41 C0369406E4
17:35:45 cleanup 16188 S 0 0 6.52 C1B90406EC
[…]
Tracing at the file system is a more reliable and complete indicator than measuring disk I/O latency
Also: btrfsslower, xfsslower, zfsslower](https://image.slidesharecdn.com/oss2017bpfsuperpowers-170913225212/75/OSSNA-2017-Performance-Analysis-Superpowers-with-Linux-BPF-31-2048.jpg)
![Exonerate or confirm storage latency outliers with ext4slower
# /usr/share/bcc/tools/ext4slower 1
Tracing ext4 operations slower than 1 ms
TIME COMM PID T BYTES OFF_KB LAT(ms) FILENAME
17:31:42 postdrop 15523 S 0 0 2.32 5630D406E4
17:31:42 cleanup 15524 S 0 0 1.89 57BB7406EC
17:32:09 titus-log-ship 19735 S 0 0 1.94 slurper_checkpoint.db
17:35:37 dhclient 1061 S 0 0 3.32 dhclient.eth0.leases
17:35:39 systemd-journa 504 S 0 0 26.62 system.journal
17:35:39 systemd-journa 504 S 0 0 1.56 system.journal
17:35:39 systemd-journa 504 S 0 0 1.73 system.journal
17:35:45 postdrop 16187 S 0 0 2.41 C0369406E4
17:35:45 cleanup 16188 S 0 0 6.52 C1B90406EC
[…]
Tracing at the file system is a more reliable and complete indicator than measuring disk I/O latency
Also: btrfsslower, xfsslower, zfsslower](https://image.slidesharecdn.com/oss2017bpfsuperpowers-170913225212/75/OSSNA-2017-Performance-Analysis-Superpowers-with-Linux-BPF-32-2048.jpg)
![Identify multimodal disk I/O latency and outliers with biolatency
# biolatency -mT 10
Tracing block device I/O... Hit Ctrl-C to end.
19:19:04
msecs : count distribution
0 -> 1 : 238 |********* |
2 -> 3 : 424 |***************** |
4 -> 7 : 834 |********************************* |
8 -> 15 : 506 |******************** |
16 -> 31 : 986 |****************************************|
32 -> 63 : 97 |*** |
64 -> 127 : 7 | |
128 -> 255 : 27 |* |
19:19:14
msecs : count distribution
0 -> 1 : 427 |******************* |
2 -> 3 : 424 |****************** |
[…]
Average latency (iostat/sar) may not be represen[[ve with mul[ple modes or outliers
The "count" column is
summarized in-kernel](https://image.slidesharecdn.com/oss2017bpfsuperpowers-170913225212/75/OSSNA-2017-Performance-Analysis-Superpowers-with-Linux-BPF-33-2048.jpg)
![Identify multimodal disk I/O latency and outliers with biolatency
# biolatency -mT 10
Tracing block device I/O... Hit Ctrl-C to end.
19:19:04
msecs : count distribution
0 -> 1 : 238 |********* |
2 -> 3 : 424 |***************** |
4 -> 7 : 834 |********************************* |
8 -> 15 : 506 |******************** |
16 -> 31 : 986 |****************************************|
32 -> 63 : 97 |*** |
64 -> 127 : 7 | |
128 -> 255 : 27 |* |
19:19:14
msecs : count distribution
0 -> 1 : 427 |******************* |
2 -> 3 : 424 |****************** |
[…]
Average latency (iostat/sar) may not be represen[[ve with mul[ple modes or outliers
The "count" column is
summarized in-kernel](https://image.slidesharecdn.com/oss2017bpfsuperpowers-170913225212/75/OSSNA-2017-Performance-Analysis-Superpowers-with-Linux-BPF-34-2048.jpg)
![Efficiently trace TCP sessions with PID and bytes using tcplife
# /usr/share/bcc/tools/tcplife
PID COMM LADDR LPORT RADDR RPORT TX_KB RX_KB MS
2509 java 100.82.34.63 8078 100.82.130.159 12410 0 0 5.44
2509 java 100.82.34.63 8078 100.82.78.215 55564 0 0 135.32
2509 java 100.82.34.63 60778 100.82.207.252 7001 0 13 15126.87
2509 java 100.82.34.63 38884 100.82.208.178 7001 0 0 15568.25
2509 java 127.0.0.1 4243 127.0.0.1 42166 0 0 0.61
2509 java 127.0.0.1 42166 127.0.0.1 4243 0 0 0.67
12030 upload-mes 127.0.0.1 34020 127.0.0.1 8078 11 0 3.38
2509 java 127.0.0.1 8078 127.0.0.1 34020 0 11 3.41
12030 upload-mes 127.0.0.1 21196 127.0.0.1 7101 0 0 12.61
3964 mesos-slav 127.0.0.1 7101 127.0.0.1 21196 0 0 12.64
12021 upload-sys 127.0.0.1 34022 127.0.0.1 8078 372 0 15.28
2509 java 127.0.0.1 8078 127.0.0.1 34022 0 372 15.31
2235 dockerd 100.82.34.63 13730 100.82.136.233 7002 0 4 18.50
2235 dockerd 100.82.34.63 34314 100.82.64.53 7002 0 8 56.73
[...]
Dynamic tracing of TCP set state only; does not trace send/receive
Also see: tcpconnect, tcpaccept, tcpretrans](https://image.slidesharecdn.com/oss2017bpfsuperpowers-170913225212/75/OSSNA-2017-Performance-Analysis-Superpowers-with-Linux-BPF-35-2048.jpg)
![Efficiently trace TCP sessions with PID and bytes using tcplife
# /usr/share/bcc/tools/tcplife
PID COMM LADDR LPORT RADDR RPORT TX_KB RX_KB MS
2509 java 100.82.34.63 8078 100.82.130.159 12410 0 0 5.44
2509 java 100.82.34.63 8078 100.82.78.215 55564 0 0 135.32
2509 java 100.82.34.63 60778 100.82.207.252 7001 0 13 15126.87
2509 java 100.82.34.63 38884 100.82.208.178 7001 0 0 15568.25
2509 java 127.0.0.1 4243 127.0.0.1 42166 0 0 0.61
2509 java 127.0.0.1 42166 127.0.0.1 4243 0 0 0.67
12030 upload-mes 127.0.0.1 34020 127.0.0.1 8078 11 0 3.38
2509 java 127.0.0.1 8078 127.0.0.1 34020 0 11 3.41
12030 upload-mes 127.0.0.1 21196 127.0.0.1 7101 0 0 12.61
3964 mesos-slav 127.0.0.1 7101 127.0.0.1 21196 0 0 12.64
12021 upload-sys 127.0.0.1 34022 127.0.0.1 8078 372 0 15.28
2509 java 127.0.0.1 8078 127.0.0.1 34022 0 372 15.31
2235 dockerd 100.82.34.63 13730 100.82.136.233 7002 0 4 18.50
2235 dockerd 100.82.34.63 34314 100.82.64.53 7002 0 8 56.73
[...]
Dynamic tracing of TCP set state only; does not trace send/receive
Also see: tcpconnect, tcpaccept, tcpretrans](https://image.slidesharecdn.com/oss2017bpfsuperpowers-170913225212/75/OSSNA-2017-Performance-Analysis-Superpowers-with-Linux-BPF-36-2048.jpg)
![Identify DNS latency issues system wide with gethostlatency
# /usr/share/bcc/tools/gethostlatency
TIME PID COMM LATms HOST
18:56:36 5055 mesos-slave 0.01 100.82.166.217
18:56:40 5590 java 3.53 ec2-…-79.compute-1.amazonaws.com
18:56:51 5055 mesos-slave 0.01 100.82.166.217
18:56:53 30166 ncat 0.21 localhost
18:56:56 6661 java 2.19 atlas-alert-….prod.netflix.net
18:56:59 5589 java 1.50 ec2-…-207.compute-1.amazonaws.com
18:57:03 5370 java 0.04 localhost
18:57:03 30259 sudo 0.07 titusagent-mainvpc-m…3465
18:57:06 5055 mesos-slave 0.01 100.82.166.217
18:57:10 5590 java 3.10 ec2-…-79.compute-1.amazonaws.com
18:57:21 5055 mesos-slave 0.01 100.82.166.217
18:57:29 5589 java 52.36 ec2-…-207.compute-1.amazonaws.com
18:57:36 5055 mesos-slave 0.01 100.82.166.217
18:57:40 5590 java 1.83 ec2-…-79.compute-1.amazonaws.com
18:57:51 5055 mesos-slave 0.01 100.82.166.217
[…]
Instruments using user-level dynamic tracing of getaddrinfo(), gethostbyname(), etc.](https://image.slidesharecdn.com/oss2017bpfsuperpowers-170913225212/75/OSSNA-2017-Performance-Analysis-Superpowers-with-Linux-BPF-37-2048.jpg)
![Identify DNS latency issues system wide with gethostlatency
# /usr/share/bcc/tools/gethostlatency
TIME PID COMM LATms HOST
18:56:36 5055 mesos-slave 0.01 100.82.166.217
18:56:40 5590 java 3.53 ec2-…-79.compute-1.amazonaws.com
18:56:51 5055 mesos-slave 0.01 100.82.166.217
18:56:53 30166 ncat 0.21 localhost
18:56:56 6661 java 2.19 atlas-alert-….prod.netflix.net
18:56:59 5589 java 1.50 ec2-…-207.compute-1.amazonaws.com
18:57:03 5370 java 0.04 localhost
18:57:03 30259 sudo 0.07 titusagent-mainvpc-m…3465
18:57:06 5055 mesos-slave 0.01 100.82.166.217
18:57:10 5590 java 3.10 ec2-…-79.compute-1.amazonaws.com
18:57:21 5055 mesos-slave 0.01 100.82.166.217
18:57:29 5589 java 52.36 ec2-…-207.compute-1.amazonaws.com
18:57:36 5055 mesos-slave 0.01 100.82.166.217
18:57:40 5590 java 1.83 ec2-…-79.compute-1.amazonaws.com
18:57:51 5055 mesos-slave 0.01 100.82.166.217
[…]
Instruments using user-level dynamic tracing of getaddrinfo(), gethostbyname(), etc.](https://image.slidesharecdn.com/oss2017bpfsuperpowers-170913225212/75/OSSNA-2017-Performance-Analysis-Superpowers-with-Linux-BPF-38-2048.jpg)
![Examine CPU scheduler latency as a histogram with runqlat
# /usr/share/bcc/tools/runqlat 10
Tracing run queue latency... Hit Ctrl-C to end.
usecs : count distribution
0 -> 1 : 2810 |* |
2 -> 3 : 5248 |** |
4 -> 7 : 12369 |****** |
8 -> 15 : 71312 |****************************************|
16 -> 31 : 55705 |******************************* |
32 -> 63 : 11775 |****** |
64 -> 127 : 6230 |*** |
128 -> 255 : 2758 |* |
256 -> 511 : 549 | |
512 -> 1023 : 46 | |
1024 -> 2047 : 11 | |
2048 -> 4095 : 4 | |
4096 -> 8191 : 5 | |
[…]
As efficient as possible: scheduler calls can become frequent](https://image.slidesharecdn.com/oss2017bpfsuperpowers-170913225212/75/OSSNA-2017-Performance-Analysis-Superpowers-with-Linux-BPF-39-2048.jpg)
![Examine CPU scheduler latency as a histogram with runqlat
# /usr/share/bcc/tools/runqlat 10
Tracing run queue latency... Hit Ctrl-C to end.
usecs : count distribution
0 -> 1 : 2810 |* |
2 -> 3 : 5248 |** |
4 -> 7 : 12369 |****** |
8 -> 15 : 71312 |****************************************|
16 -> 31 : 55705 |******************************* |
32 -> 63 : 11775 |****** |
64 -> 127 : 6230 |*** |
128 -> 255 : 2758 |* |
256 -> 511 : 549 | |
512 -> 1023 : 46 | |
1024 -> 2047 : 11 | |
2048 -> 4095 : 4 | |
4096 -> 8191 : 5 | |
[…]
As efficient as possible: scheduler calls can become frequent](https://image.slidesharecdn.com/oss2017bpfsuperpowers-170913225212/75/OSSNA-2017-Performance-Analysis-Superpowers-with-Linux-BPF-40-2048.jpg)
![Construct programmatic one-liners with trace
# trace 'sys_read (arg3 > 20000) "read %d bytes", arg3'
TIME PID COMM FUNC -
05:18:23 4490 dd sys_read read 1048576 bytes
05:18:23 4490 dd sys_read read 1048576 bytes
05:18:23 4490 dd sys_read read 1048576 bytes
^C
argdist by Sasha Goldshtein
# trace -h
[...]
trace –K blk_account_io_start
Trace this kernel function, and print info with a kernel stack trace
trace 'do_sys_open "%s", arg2'
Trace the open syscall and print the filename being opened
trace 'sys_read (arg3 > 20000) "read %d bytes", arg3'
Trace the read syscall and print a message for reads >20000 bytes
trace r::do_sys_return
Trace the return from the open syscall
trace 'c:open (arg2 == 42) "%s %d", arg1, arg2'
Trace the open() call from libc only if the flags (arg2) argument is 42
[...]
e.g. reads over 20000 bytes:](https://image.slidesharecdn.com/oss2017bpfsuperpowers-170913225212/75/OSSNA-2017-Performance-Analysis-Superpowers-with-Linux-BPF-41-2048.jpg)
![Create in-kernel summaries with argdist
# argdist -H 'p::tcp_cleanup_rbuf(struct sock *sk, int copied):int:copied'
[15:34:45]
copied : count distribution
0 -> 1 : 15088 |********************************** |
2 -> 3 : 0 | |
4 -> 7 : 0 | |
8 -> 15 : 0 | |
16 -> 31 : 0 | |
32 -> 63 : 0 | |
64 -> 127 : 4786 |*********** |
128 -> 255 : 1 | |
256 -> 511 : 1 | |
512 -> 1023 : 4 | |
1024 -> 2047 : 11 | |
2048 -> 4095 : 5 | |
4096 -> 8191 : 27 | |
8192 -> 16383 : 105 | |
16384 -> 32767 : 0 | |
argdist by Sasha Goldshtein
e.g. histogram of tcp_cleanup_rbuf() copied:](https://image.slidesharecdn.com/oss2017bpfsuperpowers-170913225212/75/OSSNA-2017-Performance-Analysis-Superpowers-with-Linux-BPF-42-2048.jpg)


![ply
• A new BPF-based language and tracer for Linux
– Created by Tobias Waldekranz
– https://github.com/iovisor/ply https://wkz.github.io/ply/
– Promising, was in development
# ply -c 'kprobe:do_sys_open { printf("opened: %sn", mem(arg(1), "128s")); }'
1 probe active
opened: /sys/kernel/debug/tracing/events/enable
opened: /etc/ld.so.cache
opened: /lib/x86_64-linux-gnu/libselinux.so.1
opened: /lib/x86_64-linux-gnu/libc.so.6
opened: /proc/filesystems
opened: /usr/lib/locale/locale-archive
opened: .
[...]](https://image.slidesharecdn.com/oss2017bpfsuperpowers-170913225212/75/OSSNA-2017-Performance-Analysis-Superpowers-with-Linux-BPF-57-2048.jpg)
![ply programs are concise, such as measuring read latency
# ply -A -c 'kprobe:SyS_read { @start[tid()] = nsecs(); }
kretprobe:SyS_read /@start[tid()]/ { @ns.quantize(nsecs() - @start[tid()]);
@start[tid()] = nil; }'
2 probes active
^Cde-activating probes
[...]
@ns:
[ 512, 1k) 3 |######## |
[ 1k, 2k) 7 |################### |
[ 2k, 4k) 12 |################################|
[ 4k, 8k) 3 |######## |
[ 8k, 16k) 2 |##### |
[ 16k, 32k) 0 | |
[ 32k, 64k) 0 | |
[ 64k, 128k) 3 |######## |
[128k, 256k) 1 |### |
[256k, 512k) 1 |### |
[512k, 1M) 2 |##### |
[...]](https://image.slidesharecdn.com/oss2017bpfsuperpowers-170913225212/75/OSSNA-2017-Performance-Analysis-Superpowers-with-Linux-BPF-58-2048.jpg)
![bpftrace
• Another new BPF-based language and tracer for Linux
– Created by Alastair Robertson
– https://github.com/ajor/bpftrace
– In active development
# bpftrace -e 'kprobe:sys_open { printf("opened: %sn", str(arg0)); }'
Attaching 1 probe...
opened: /sys/devices/system/cpu/online
opened: /proc/1956/stat
opened: /proc/1241/stat
opened: /proc/net/dev
opened: /proc/net/if_inet6
opened: /sys/class/net/eth0/device/vendor
opened: /proc/sys/net/ipv4/neigh/eth0/retrans_time_ms
[...]](https://image.slidesharecdn.com/oss2017bpfsuperpowers-170913225212/75/OSSNA-2017-Performance-Analysis-Superpowers-with-Linux-BPF-59-2048.jpg)
![bpftrace programs are concise, such as measuring read latency
# bpftrace -e 'kprobe:SyS_read { @start[tid] = nsecs; } kretprobe:SyS_read /@start[tid]/
{ @ns = quantize(nsecs - @start[tid]); @start[tid] = delete(); }'
Attaching 2 probes...
^C
@ns:
[0, 1] 0 | |
[2, 4) 0 | |
[4, 8) 0 | |
[8, 16) 0 | |
[16, 32) 0 | |
[32, 64) 0 | |
[64, 128) 0 | |
[128, 256) 0 | |
[256, 512) 0 | |
[512, 1k) 0 | |
[1k, 2k) 6 |@@@@@ |
[2k, 4k) 20 |@@@@@@@@@@@@@@@@@@@ |
[4k, 8k) 4 |@@@ |
[8k, 16k) 14 |@@@@@@@@@@@@@ |
[16k, 32k) 53 |@@@@@@@@@@@@@@@@@@@@@@@@@@@@@@@@@@@@@@@@@@@@@@@@@@@@|
[32k, 64k) 2 |@ |](https://image.slidesharecdn.com/oss2017bpfsuperpowers-170913225212/75/OSSNA-2017-Performance-Analysis-Superpowers-with-Linux-BPF-60-2048.jpg)


![Ye Olde BPF
Berkeley Packet Filter
# tcpdump host 127.0.0.1 and port 22 -d
(000) ldh [12]
(001) jeq #0x800 jt 2 jf 18
(002) ld [26]
(003) jeq #0x7f000001 jt 6 jf 4
(004) ld [30]
(005) jeq #0x7f000001 jt 6 jf 18
(006) ldb [23]
(007) jeq #0x84 jt 10 jf 8
(008) jeq #0x6 jt 10 jf 9
(009) jeq #0x11 jt 10 jf 18
(010) ldh [20]
(011) jset #0x1fff jt 18 jf 12
(012) ldxb 4*([14]&0xf)
(013) ldh [x + 14]
[...]
User-defined bytecode
executed by an in-kernel
sandboxed virtual machine
Steven McCanne and Van Jacobson, 1993
2 x 32-bit registers
& scratch memory
Optimizes packet filter
performance](https://crownmelresort.com/image.slidesharecdn.com/oss2017bpfsuperpowers-170913225212/75/OSSNA-2017-Performance-Analysis-Superpowers-with-Linux-BPF-10-2048.jpg)


![bcc Installation
• https://github.com/iovisor/bcc/blob/master/INSTALL.md
• eg, Ubuntu Xenial:
– Also available as an Ubuntu snap
– Ubuntu 16.04 is good, 16.10 better: more tools work
• Installs many tools
– In /usr/share/bcc/tools, and …/tools/old for older kernels
# echo "deb [trusted=yes] https://repo.iovisor.org/apt/xenial xenial-nightly main" |
sudo tee /etc/apt/sources.list.d/iovisor.list
# sudo apt-get update
# sudo apt-get install bcc-tools](https://crownmelresort.com/image.slidesharecdn.com/oss2017bpfsuperpowers-170913225212/75/OSSNA-2017-Performance-Analysis-Superpowers-with-Linux-BPF-27-2048.jpg)

![Discover short-lived process issues using execsnoop
# execsnoop -t
TIME(s) PCOMM PID PPID RET ARGS
0.031 dirname 23832 23808 0 /usr/bin/dirname /apps/tomcat/bin/catalina.sh
0.888 run 23833 2344 0 ./run
0.889 run 23833 2344 -2 /command/bash
0.889 run 23833 2344 -2 /usr/local/bin/bash
0.889 run 23833 2344 -2 /usr/local/sbin/bash
0.889 bash 23833 2344 0 /bin/bash
0.894 svstat 23835 23834 0 /command/svstat /service/nflx-httpd
0.894 perl 23836 23834 0 /usr/bin/perl -e $l=<>;$l=~/(d+) sec/;print $1||0;
0.899 ps 23838 23837 0 /bin/ps --ppid 1 -o pid,cmd,args
0.900 grep 23839 23837 0 /bin/grep org.apache.catalina
0.900 sed 23840 23837 0 /bin/sed s/^ *//;
0.900 cut 23841 23837 0 /usr/bin/cut -d -f 1
0.901 xargs 23842 23837 0 /usr/bin/xargs
0.912 xargs 23843 23842 -2 /command/echo
0.912 xargs 23843 23842 -2 /usr/local/bin/echo
0.912 xargs 23843 23842 -2 /usr/local/sbin/echo
0.912 echo 23843 23842 0 /bin/echo
[...]
Efficient: only traces exec()](https://crownmelresort.com/image.slidesharecdn.com/oss2017bpfsuperpowers-170913225212/75/OSSNA-2017-Performance-Analysis-Superpowers-with-Linux-BPF-29-2048.jpg)
![Discover short-lived process issues using execsnoop
# execsnoop -t
TIME(s) PCOMM PID PPID RET ARGS
0.031 dirname 23832 23808 0 /usr/bin/dirname /apps/tomcat/bin/catalina.sh
0.888 run 23833 2344 0 ./run
0.889 run 23833 2344 -2 /command/bash
0.889 run 23833 2344 -2 /usr/local/bin/bash
0.889 run 23833 2344 -2 /usr/local/sbin/bash
0.889 bash 23833 2344 0 /bin/bash
0.894 svstat 23835 23834 0 /command/svstat /service/nflx-httpd
0.894 perl 23836 23834 0 /usr/bin/perl -e $l=<>;$l=~/(d+) sec/;print $1||0;
0.899 ps 23838 23837 0 /bin/ps --ppid 1 -o pid,cmd,args
0.900 grep 23839 23837 0 /bin/grep org.apache.catalina
0.900 sed 23840 23837 0 /bin/sed s/^ *//;
0.900 cut 23841 23837 0 /usr/bin/cut -d -f 1
0.901 xargs 23842 23837 0 /usr/bin/xargs
0.912 xargs 23843 23842 -2 /command/echo
0.912 xargs 23843 23842 -2 /usr/local/bin/echo
0.912 xargs 23843 23842 -2 /usr/local/sbin/echo
0.912 echo 23843 23842 0 /bin/echo
[...]
Efficient: only traces exec()](https://crownmelresort.com/image.slidesharecdn.com/oss2017bpfsuperpowers-170913225212/75/OSSNA-2017-Performance-Analysis-Superpowers-with-Linux-BPF-30-2048.jpg)
![Exonerate or confirm storage latency outliers with ext4slower
# /usr/share/bcc/tools/ext4slower 1
Tracing ext4 operations slower than 1 ms
TIME COMM PID T BYTES OFF_KB LAT(ms) FILENAME
17:31:42 postdrop 15523 S 0 0 2.32 5630D406E4
17:31:42 cleanup 15524 S 0 0 1.89 57BB7406EC
17:32:09 titus-log-ship 19735 S 0 0 1.94 slurper_checkpoint.db
17:35:37 dhclient 1061 S 0 0 3.32 dhclient.eth0.leases
17:35:39 systemd-journa 504 S 0 0 26.62 system.journal
17:35:39 systemd-journa 504 S 0 0 1.56 system.journal
17:35:39 systemd-journa 504 S 0 0 1.73 system.journal
17:35:45 postdrop 16187 S 0 0 2.41 C0369406E4
17:35:45 cleanup 16188 S 0 0 6.52 C1B90406EC
[…]
Tracing at the file system is a more reliable and complete indicator than measuring disk I/O latency
Also: btrfsslower, xfsslower, zfsslower](https://crownmelresort.com/image.slidesharecdn.com/oss2017bpfsuperpowers-170913225212/75/OSSNA-2017-Performance-Analysis-Superpowers-with-Linux-BPF-31-2048.jpg)
![Exonerate or confirm storage latency outliers with ext4slower
# /usr/share/bcc/tools/ext4slower 1
Tracing ext4 operations slower than 1 ms
TIME COMM PID T BYTES OFF_KB LAT(ms) FILENAME
17:31:42 postdrop 15523 S 0 0 2.32 5630D406E4
17:31:42 cleanup 15524 S 0 0 1.89 57BB7406EC
17:32:09 titus-log-ship 19735 S 0 0 1.94 slurper_checkpoint.db
17:35:37 dhclient 1061 S 0 0 3.32 dhclient.eth0.leases
17:35:39 systemd-journa 504 S 0 0 26.62 system.journal
17:35:39 systemd-journa 504 S 0 0 1.56 system.journal
17:35:39 systemd-journa 504 S 0 0 1.73 system.journal
17:35:45 postdrop 16187 S 0 0 2.41 C0369406E4
17:35:45 cleanup 16188 S 0 0 6.52 C1B90406EC
[…]
Tracing at the file system is a more reliable and complete indicator than measuring disk I/O latency
Also: btrfsslower, xfsslower, zfsslower](https://crownmelresort.com/image.slidesharecdn.com/oss2017bpfsuperpowers-170913225212/75/OSSNA-2017-Performance-Analysis-Superpowers-with-Linux-BPF-32-2048.jpg)
![Identify multimodal disk I/O latency and outliers with biolatency
# biolatency -mT 10
Tracing block device I/O... Hit Ctrl-C to end.
19:19:04
msecs : count distribution
0 -> 1 : 238 |********* |
2 -> 3 : 424 |***************** |
4 -> 7 : 834 |********************************* |
8 -> 15 : 506 |******************** |
16 -> 31 : 986 |****************************************|
32 -> 63 : 97 |*** |
64 -> 127 : 7 | |
128 -> 255 : 27 |* |
19:19:14
msecs : count distribution
0 -> 1 : 427 |******************* |
2 -> 3 : 424 |****************** |
[…]
Average latency (iostat/sar) may not be represen[[ve with mul[ple modes or outliers
The "count" column is
summarized in-kernel](https://crownmelresort.com/image.slidesharecdn.com/oss2017bpfsuperpowers-170913225212/75/OSSNA-2017-Performance-Analysis-Superpowers-with-Linux-BPF-33-2048.jpg)
![Identify multimodal disk I/O latency and outliers with biolatency
# biolatency -mT 10
Tracing block device I/O... Hit Ctrl-C to end.
19:19:04
msecs : count distribution
0 -> 1 : 238 |********* |
2 -> 3 : 424 |***************** |
4 -> 7 : 834 |********************************* |
8 -> 15 : 506 |******************** |
16 -> 31 : 986 |****************************************|
32 -> 63 : 97 |*** |
64 -> 127 : 7 | |
128 -> 255 : 27 |* |
19:19:14
msecs : count distribution
0 -> 1 : 427 |******************* |
2 -> 3 : 424 |****************** |
[…]
Average latency (iostat/sar) may not be represen[[ve with mul[ple modes or outliers
The "count" column is
summarized in-kernel](https://crownmelresort.com/image.slidesharecdn.com/oss2017bpfsuperpowers-170913225212/75/OSSNA-2017-Performance-Analysis-Superpowers-with-Linux-BPF-34-2048.jpg)
![Efficiently trace TCP sessions with PID and bytes using tcplife
# /usr/share/bcc/tools/tcplife
PID COMM LADDR LPORT RADDR RPORT TX_KB RX_KB MS
2509 java 100.82.34.63 8078 100.82.130.159 12410 0 0 5.44
2509 java 100.82.34.63 8078 100.82.78.215 55564 0 0 135.32
2509 java 100.82.34.63 60778 100.82.207.252 7001 0 13 15126.87
2509 java 100.82.34.63 38884 100.82.208.178 7001 0 0 15568.25
2509 java 127.0.0.1 4243 127.0.0.1 42166 0 0 0.61
2509 java 127.0.0.1 42166 127.0.0.1 4243 0 0 0.67
12030 upload-mes 127.0.0.1 34020 127.0.0.1 8078 11 0 3.38
2509 java 127.0.0.1 8078 127.0.0.1 34020 0 11 3.41
12030 upload-mes 127.0.0.1 21196 127.0.0.1 7101 0 0 12.61
3964 mesos-slav 127.0.0.1 7101 127.0.0.1 21196 0 0 12.64
12021 upload-sys 127.0.0.1 34022 127.0.0.1 8078 372 0 15.28
2509 java 127.0.0.1 8078 127.0.0.1 34022 0 372 15.31
2235 dockerd 100.82.34.63 13730 100.82.136.233 7002 0 4 18.50
2235 dockerd 100.82.34.63 34314 100.82.64.53 7002 0 8 56.73
[...]
Dynamic tracing of TCP set state only; does not trace send/receive
Also see: tcpconnect, tcpaccept, tcpretrans](https://crownmelresort.com/image.slidesharecdn.com/oss2017bpfsuperpowers-170913225212/75/OSSNA-2017-Performance-Analysis-Superpowers-with-Linux-BPF-35-2048.jpg)
![Efficiently trace TCP sessions with PID and bytes using tcplife
# /usr/share/bcc/tools/tcplife
PID COMM LADDR LPORT RADDR RPORT TX_KB RX_KB MS
2509 java 100.82.34.63 8078 100.82.130.159 12410 0 0 5.44
2509 java 100.82.34.63 8078 100.82.78.215 55564 0 0 135.32
2509 java 100.82.34.63 60778 100.82.207.252 7001 0 13 15126.87
2509 java 100.82.34.63 38884 100.82.208.178 7001 0 0 15568.25
2509 java 127.0.0.1 4243 127.0.0.1 42166 0 0 0.61
2509 java 127.0.0.1 42166 127.0.0.1 4243 0 0 0.67
12030 upload-mes 127.0.0.1 34020 127.0.0.1 8078 11 0 3.38
2509 java 127.0.0.1 8078 127.0.0.1 34020 0 11 3.41
12030 upload-mes 127.0.0.1 21196 127.0.0.1 7101 0 0 12.61
3964 mesos-slav 127.0.0.1 7101 127.0.0.1 21196 0 0 12.64
12021 upload-sys 127.0.0.1 34022 127.0.0.1 8078 372 0 15.28
2509 java 127.0.0.1 8078 127.0.0.1 34022 0 372 15.31
2235 dockerd 100.82.34.63 13730 100.82.136.233 7002 0 4 18.50
2235 dockerd 100.82.34.63 34314 100.82.64.53 7002 0 8 56.73
[...]
Dynamic tracing of TCP set state only; does not trace send/receive
Also see: tcpconnect, tcpaccept, tcpretrans](https://crownmelresort.com/image.slidesharecdn.com/oss2017bpfsuperpowers-170913225212/75/OSSNA-2017-Performance-Analysis-Superpowers-with-Linux-BPF-36-2048.jpg)
![Identify DNS latency issues system wide with gethostlatency
# /usr/share/bcc/tools/gethostlatency
TIME PID COMM LATms HOST
18:56:36 5055 mesos-slave 0.01 100.82.166.217
18:56:40 5590 java 3.53 ec2-…-79.compute-1.amazonaws.com
18:56:51 5055 mesos-slave 0.01 100.82.166.217
18:56:53 30166 ncat 0.21 localhost
18:56:56 6661 java 2.19 atlas-alert-….prod.netflix.net
18:56:59 5589 java 1.50 ec2-…-207.compute-1.amazonaws.com
18:57:03 5370 java 0.04 localhost
18:57:03 30259 sudo 0.07 titusagent-mainvpc-m…3465
18:57:06 5055 mesos-slave 0.01 100.82.166.217
18:57:10 5590 java 3.10 ec2-…-79.compute-1.amazonaws.com
18:57:21 5055 mesos-slave 0.01 100.82.166.217
18:57:29 5589 java 52.36 ec2-…-207.compute-1.amazonaws.com
18:57:36 5055 mesos-slave 0.01 100.82.166.217
18:57:40 5590 java 1.83 ec2-…-79.compute-1.amazonaws.com
18:57:51 5055 mesos-slave 0.01 100.82.166.217
[…]
Instruments using user-level dynamic tracing of getaddrinfo(), gethostbyname(), etc.](https://crownmelresort.com/image.slidesharecdn.com/oss2017bpfsuperpowers-170913225212/75/OSSNA-2017-Performance-Analysis-Superpowers-with-Linux-BPF-37-2048.jpg)
![Identify DNS latency issues system wide with gethostlatency
# /usr/share/bcc/tools/gethostlatency
TIME PID COMM LATms HOST
18:56:36 5055 mesos-slave 0.01 100.82.166.217
18:56:40 5590 java 3.53 ec2-…-79.compute-1.amazonaws.com
18:56:51 5055 mesos-slave 0.01 100.82.166.217
18:56:53 30166 ncat 0.21 localhost
18:56:56 6661 java 2.19 atlas-alert-….prod.netflix.net
18:56:59 5589 java 1.50 ec2-…-207.compute-1.amazonaws.com
18:57:03 5370 java 0.04 localhost
18:57:03 30259 sudo 0.07 titusagent-mainvpc-m…3465
18:57:06 5055 mesos-slave 0.01 100.82.166.217
18:57:10 5590 java 3.10 ec2-…-79.compute-1.amazonaws.com
18:57:21 5055 mesos-slave 0.01 100.82.166.217
18:57:29 5589 java 52.36 ec2-…-207.compute-1.amazonaws.com
18:57:36 5055 mesos-slave 0.01 100.82.166.217
18:57:40 5590 java 1.83 ec2-…-79.compute-1.amazonaws.com
18:57:51 5055 mesos-slave 0.01 100.82.166.217
[…]
Instruments using user-level dynamic tracing of getaddrinfo(), gethostbyname(), etc.](https://crownmelresort.com/image.slidesharecdn.com/oss2017bpfsuperpowers-170913225212/75/OSSNA-2017-Performance-Analysis-Superpowers-with-Linux-BPF-38-2048.jpg)
![Examine CPU scheduler latency as a histogram with runqlat
# /usr/share/bcc/tools/runqlat 10
Tracing run queue latency... Hit Ctrl-C to end.
usecs : count distribution
0 -> 1 : 2810 |* |
2 -> 3 : 5248 |** |
4 -> 7 : 12369 |****** |
8 -> 15 : 71312 |****************************************|
16 -> 31 : 55705 |******************************* |
32 -> 63 : 11775 |****** |
64 -> 127 : 6230 |*** |
128 -> 255 : 2758 |* |
256 -> 511 : 549 | |
512 -> 1023 : 46 | |
1024 -> 2047 : 11 | |
2048 -> 4095 : 4 | |
4096 -> 8191 : 5 | |
[…]
As efficient as possible: scheduler calls can become frequent](https://crownmelresort.com/image.slidesharecdn.com/oss2017bpfsuperpowers-170913225212/75/OSSNA-2017-Performance-Analysis-Superpowers-with-Linux-BPF-39-2048.jpg)
![Examine CPU scheduler latency as a histogram with runqlat
# /usr/share/bcc/tools/runqlat 10
Tracing run queue latency... Hit Ctrl-C to end.
usecs : count distribution
0 -> 1 : 2810 |* |
2 -> 3 : 5248 |** |
4 -> 7 : 12369 |****** |
8 -> 15 : 71312 |****************************************|
16 -> 31 : 55705 |******************************* |
32 -> 63 : 11775 |****** |
64 -> 127 : 6230 |*** |
128 -> 255 : 2758 |* |
256 -> 511 : 549 | |
512 -> 1023 : 46 | |
1024 -> 2047 : 11 | |
2048 -> 4095 : 4 | |
4096 -> 8191 : 5 | |
[…]
As efficient as possible: scheduler calls can become frequent](https://crownmelresort.com/image.slidesharecdn.com/oss2017bpfsuperpowers-170913225212/75/OSSNA-2017-Performance-Analysis-Superpowers-with-Linux-BPF-40-2048.jpg)
![Construct programmatic one-liners with trace
# trace 'sys_read (arg3 > 20000) "read %d bytes", arg3'
TIME PID COMM FUNC -
05:18:23 4490 dd sys_read read 1048576 bytes
05:18:23 4490 dd sys_read read 1048576 bytes
05:18:23 4490 dd sys_read read 1048576 bytes
^C
argdist by Sasha Goldshtein
# trace -h
[...]
trace –K blk_account_io_start
Trace this kernel function, and print info with a kernel stack trace
trace 'do_sys_open "%s", arg2'
Trace the open syscall and print the filename being opened
trace 'sys_read (arg3 > 20000) "read %d bytes", arg3'
Trace the read syscall and print a message for reads >20000 bytes
trace r::do_sys_return
Trace the return from the open syscall
trace 'c:open (arg2 == 42) "%s %d", arg1, arg2'
Trace the open() call from libc only if the flags (arg2) argument is 42
[...]
e.g. reads over 20000 bytes:](https://crownmelresort.com/image.slidesharecdn.com/oss2017bpfsuperpowers-170913225212/75/OSSNA-2017-Performance-Analysis-Superpowers-with-Linux-BPF-41-2048.jpg)
![Create in-kernel summaries with argdist
# argdist -H 'p::tcp_cleanup_rbuf(struct sock *sk, int copied):int:copied'
[15:34:45]
copied : count distribution
0 -> 1 : 15088 |********************************** |
2 -> 3 : 0 | |
4 -> 7 : 0 | |
8 -> 15 : 0 | |
16 -> 31 : 0 | |
32 -> 63 : 0 | |
64 -> 127 : 4786 |*********** |
128 -> 255 : 1 | |
256 -> 511 : 1 | |
512 -> 1023 : 4 | |
1024 -> 2047 : 11 | |
2048 -> 4095 : 5 | |
4096 -> 8191 : 27 | |
8192 -> 16383 : 105 | |
16384 -> 32767 : 0 | |
argdist by Sasha Goldshtein
e.g. histogram of tcp_cleanup_rbuf() copied:](https://crownmelresort.com/image.slidesharecdn.com/oss2017bpfsuperpowers-170913225212/75/OSSNA-2017-Performance-Analysis-Superpowers-with-Linux-BPF-42-2048.jpg)


![ply
• A new BPF-based language and tracer for Linux
– Created by Tobias Waldekranz
– https://github.com/iovisor/ply https://wkz.github.io/ply/
– Promising, was in development
# ply -c 'kprobe:do_sys_open { printf("opened: %sn", mem(arg(1), "128s")); }'
1 probe active
opened: /sys/kernel/debug/tracing/events/enable
opened: /etc/ld.so.cache
opened: /lib/x86_64-linux-gnu/libselinux.so.1
opened: /lib/x86_64-linux-gnu/libc.so.6
opened: /proc/filesystems
opened: /usr/lib/locale/locale-archive
opened: .
[...]](https://crownmelresort.com/image.slidesharecdn.com/oss2017bpfsuperpowers-170913225212/75/OSSNA-2017-Performance-Analysis-Superpowers-with-Linux-BPF-57-2048.jpg)
![ply programs are concise, such as measuring read latency
# ply -A -c 'kprobe:SyS_read { @start[tid()] = nsecs(); }
kretprobe:SyS_read /@start[tid()]/ { @ns.quantize(nsecs() - @start[tid()]);
@start[tid()] = nil; }'
2 probes active
^Cde-activating probes
[...]
@ns:
[ 512, 1k) 3 |######## |
[ 1k, 2k) 7 |################### |
[ 2k, 4k) 12 |################################|
[ 4k, 8k) 3 |######## |
[ 8k, 16k) 2 |##### |
[ 16k, 32k) 0 | |
[ 32k, 64k) 0 | |
[ 64k, 128k) 3 |######## |
[128k, 256k) 1 |### |
[256k, 512k) 1 |### |
[512k, 1M) 2 |##### |
[...]](https://crownmelresort.com/image.slidesharecdn.com/oss2017bpfsuperpowers-170913225212/75/OSSNA-2017-Performance-Analysis-Superpowers-with-Linux-BPF-58-2048.jpg)
![bpftrace
• Another new BPF-based language and tracer for Linux
– Created by Alastair Robertson
– https://github.com/ajor/bpftrace
– In active development
# bpftrace -e 'kprobe:sys_open { printf("opened: %sn", str(arg0)); }'
Attaching 1 probe...
opened: /sys/devices/system/cpu/online
opened: /proc/1956/stat
opened: /proc/1241/stat
opened: /proc/net/dev
opened: /proc/net/if_inet6
opened: /sys/class/net/eth0/device/vendor
opened: /proc/sys/net/ipv4/neigh/eth0/retrans_time_ms
[...]](https://crownmelresort.com/image.slidesharecdn.com/oss2017bpfsuperpowers-170913225212/75/OSSNA-2017-Performance-Analysis-Superpowers-with-Linux-BPF-59-2048.jpg)
![bpftrace programs are concise, such as measuring read latency
# bpftrace -e 'kprobe:SyS_read { @start[tid] = nsecs; } kretprobe:SyS_read /@start[tid]/
{ @ns = quantize(nsecs - @start[tid]); @start[tid] = delete(); }'
Attaching 2 probes...
^C
@ns:
[0, 1] 0 | |
[2, 4) 0 | |
[4, 8) 0 | |
[8, 16) 0 | |
[16, 32) 0 | |
[32, 64) 0 | |
[64, 128) 0 | |
[128, 256) 0 | |
[256, 512) 0 | |
[512, 1k) 0 | |
[1k, 2k) 6 |@@@@@ |
[2k, 4k) 20 |@@@@@@@@@@@@@@@@@@@ |
[4k, 8k) 4 |@@@ |
[8k, 16k) 14 |@@@@@@@@@@@@@ |
[16k, 32k) 53 |@@@@@@@@@@@@@@@@@@@@@@@@@@@@@@@@@@@@@@@@@@@@@@@@@@@@|
[32k, 64k) 2 |@ |](https://crownmelresort.com/image.slidesharecdn.com/oss2017bpfsuperpowers-170913225212/75/OSSNA-2017-Performance-Analysis-Superpowers-with-Linux-BPF-60-2048.jpg)


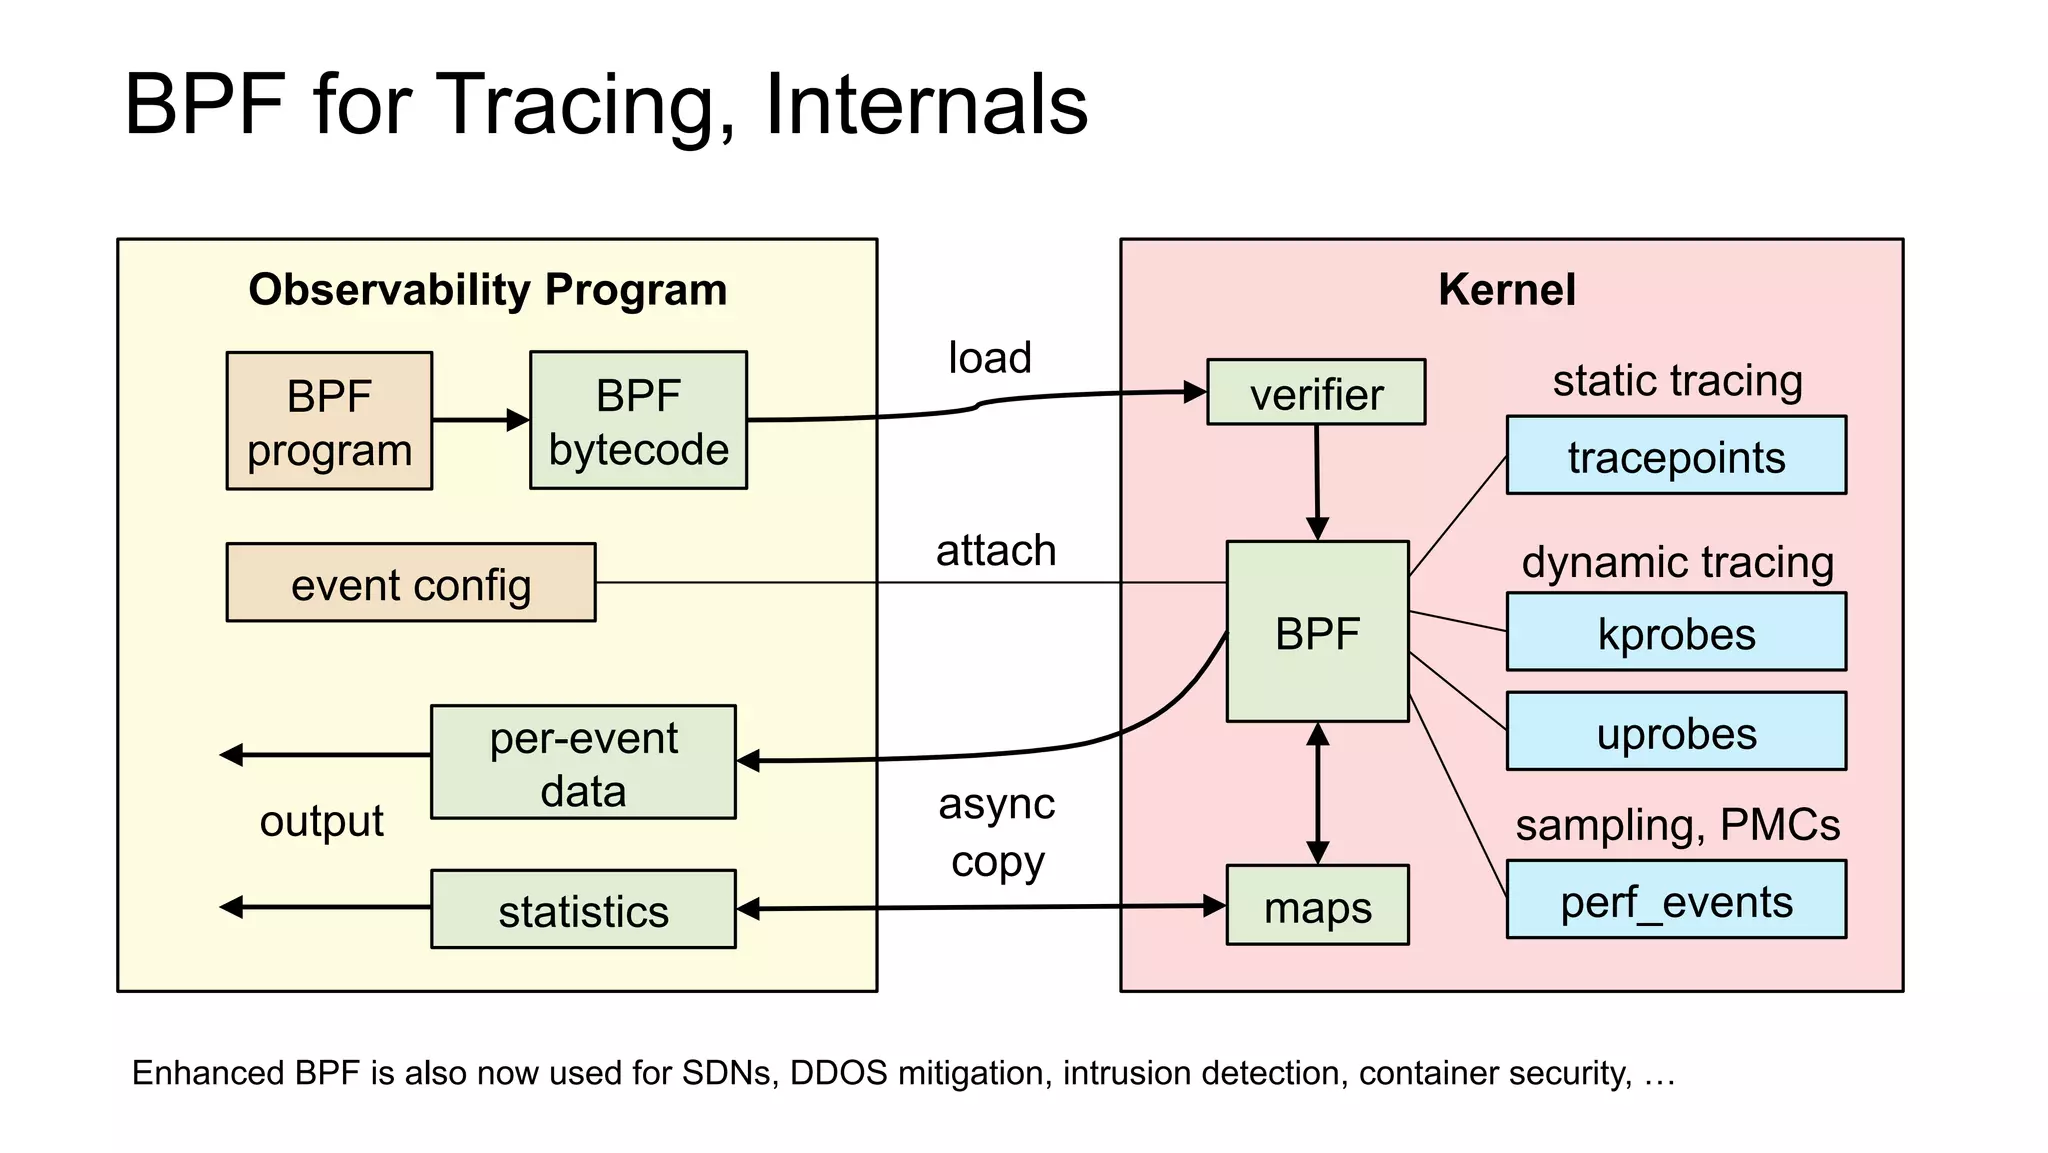
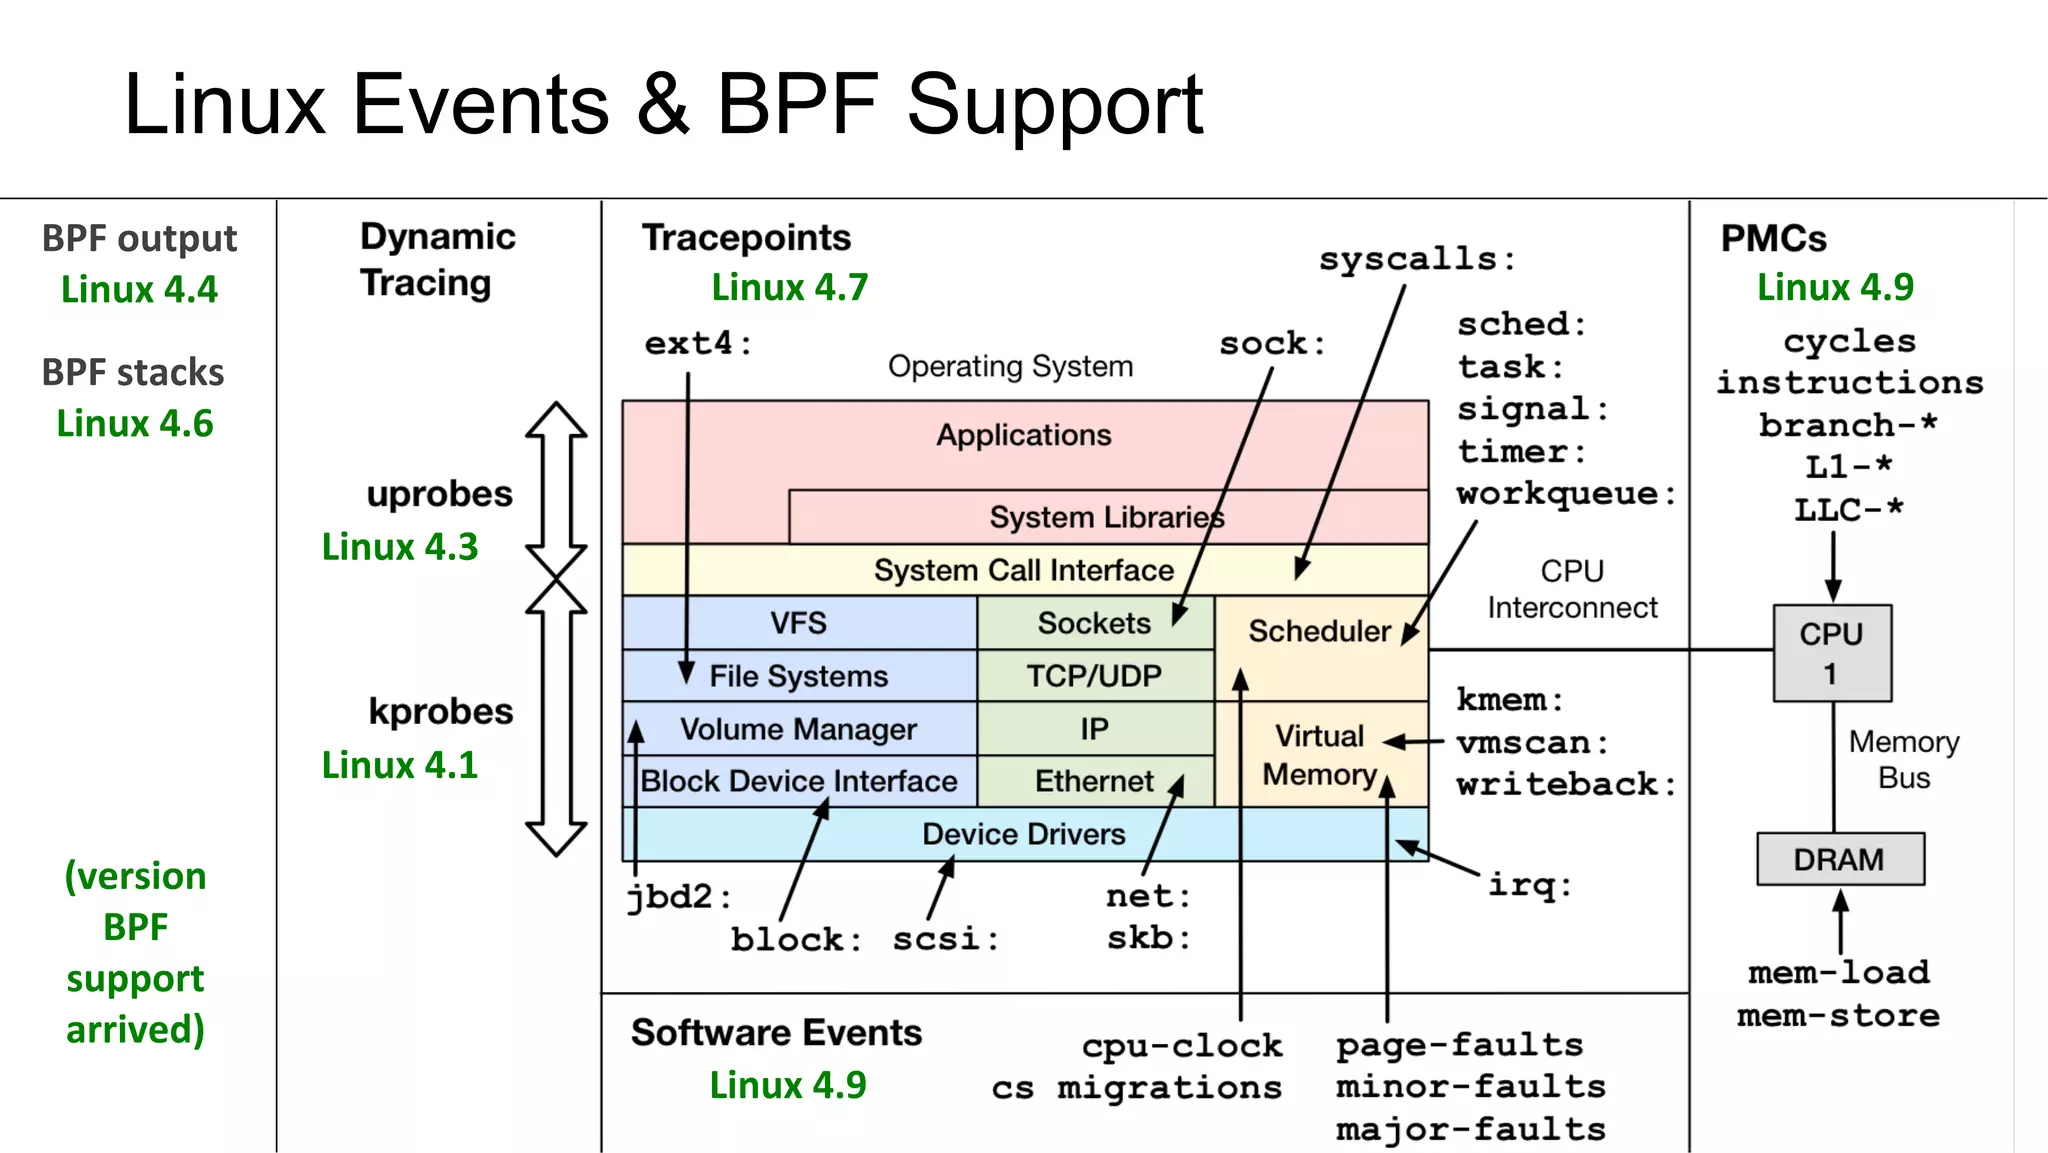
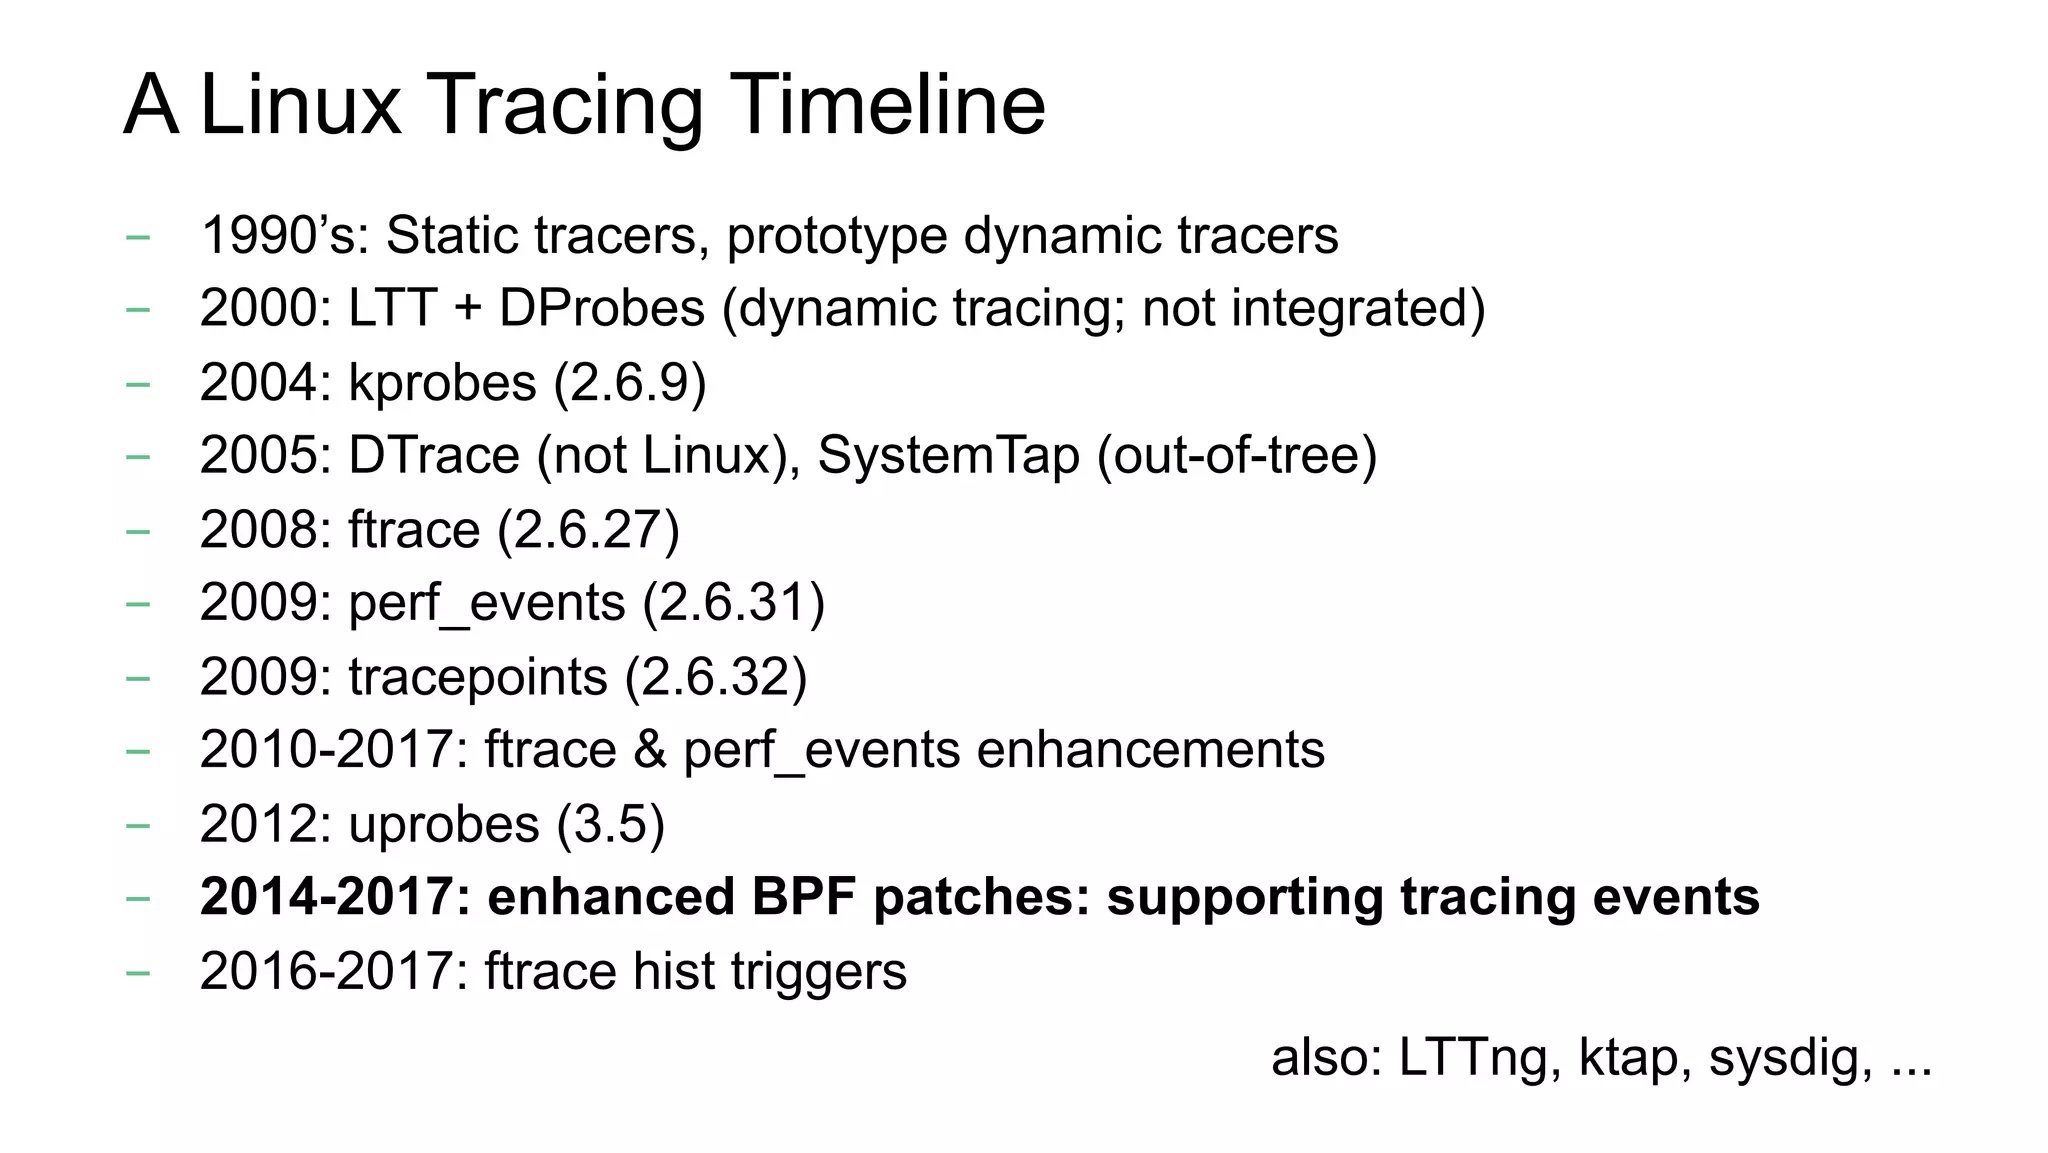
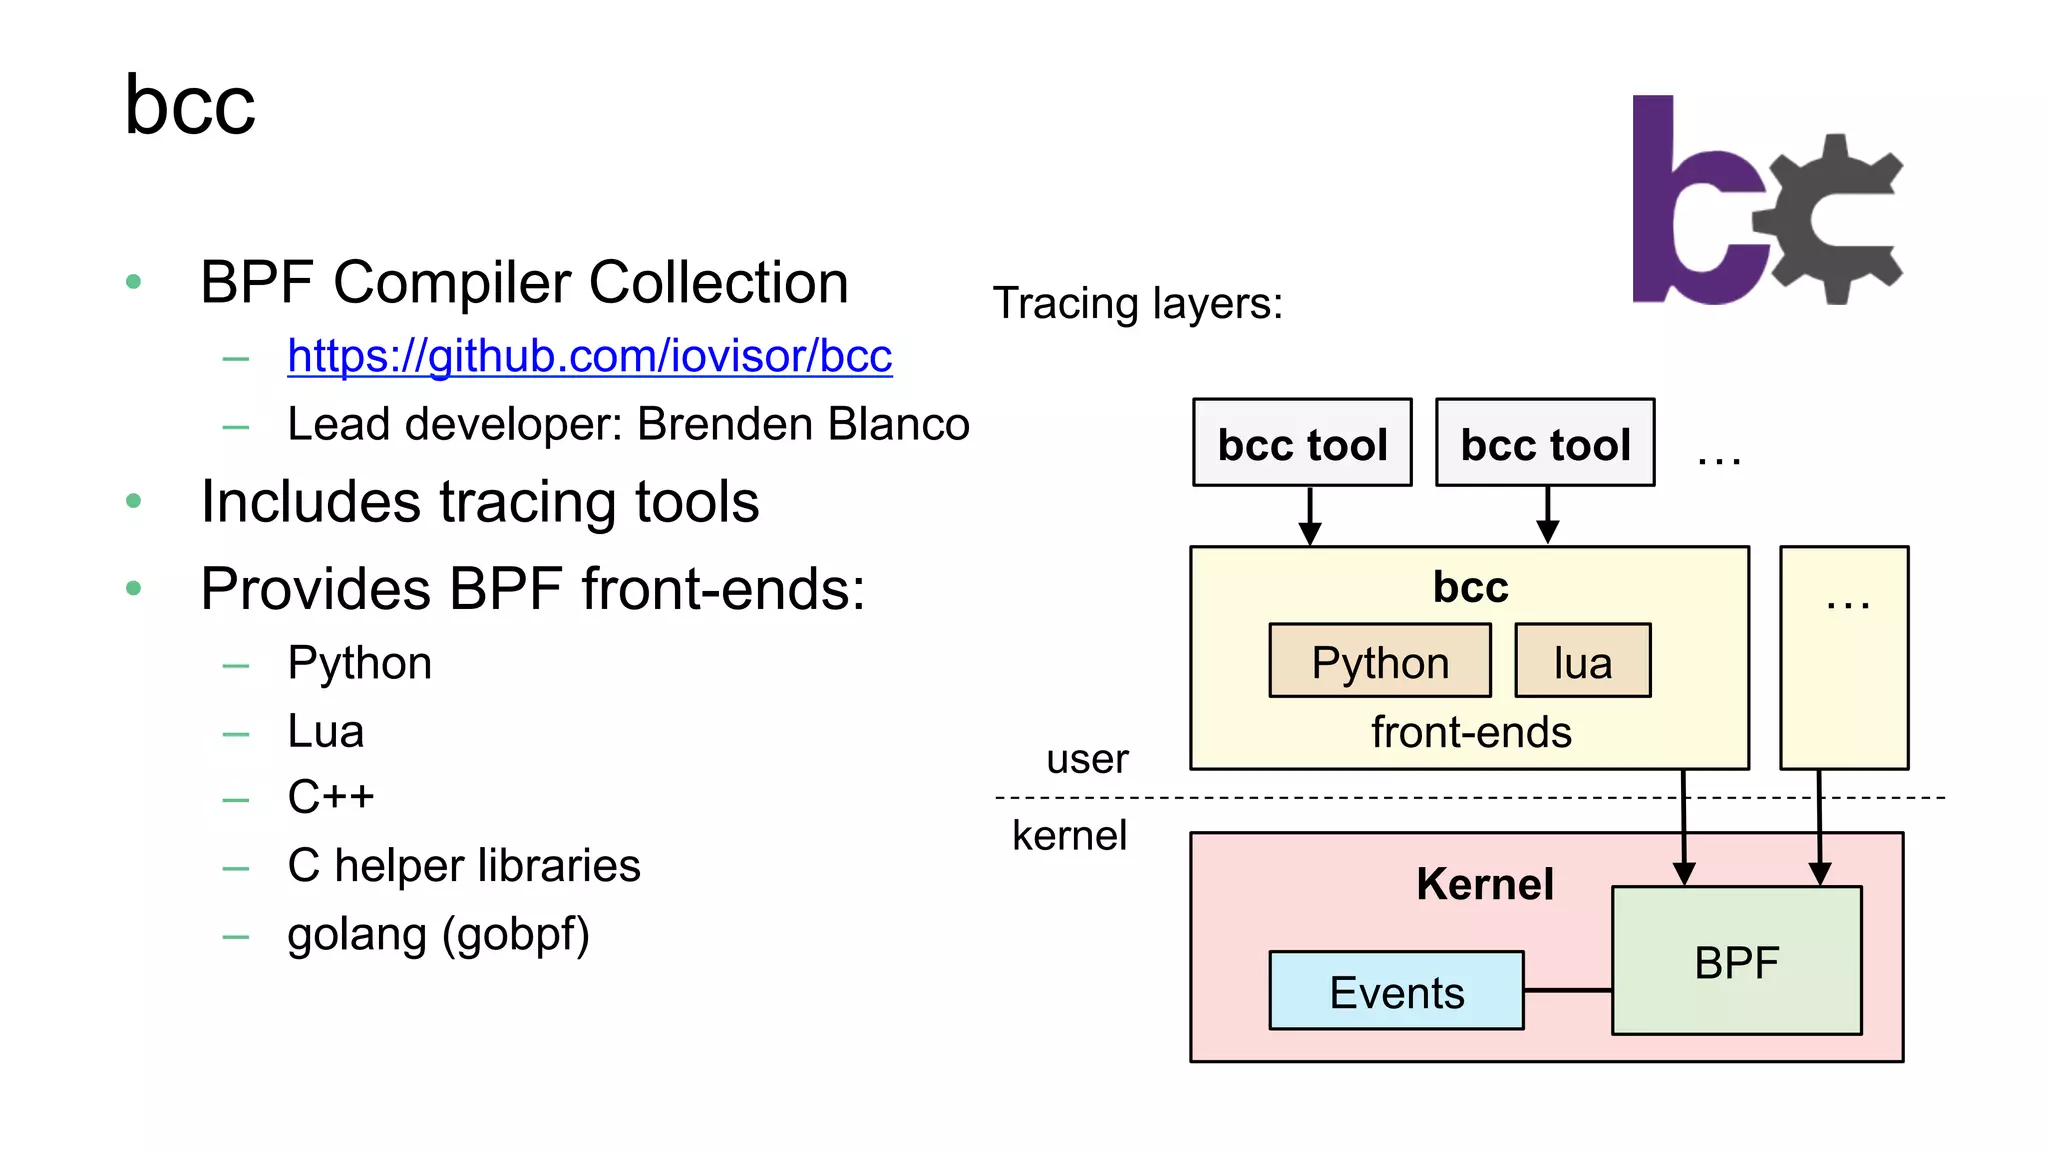
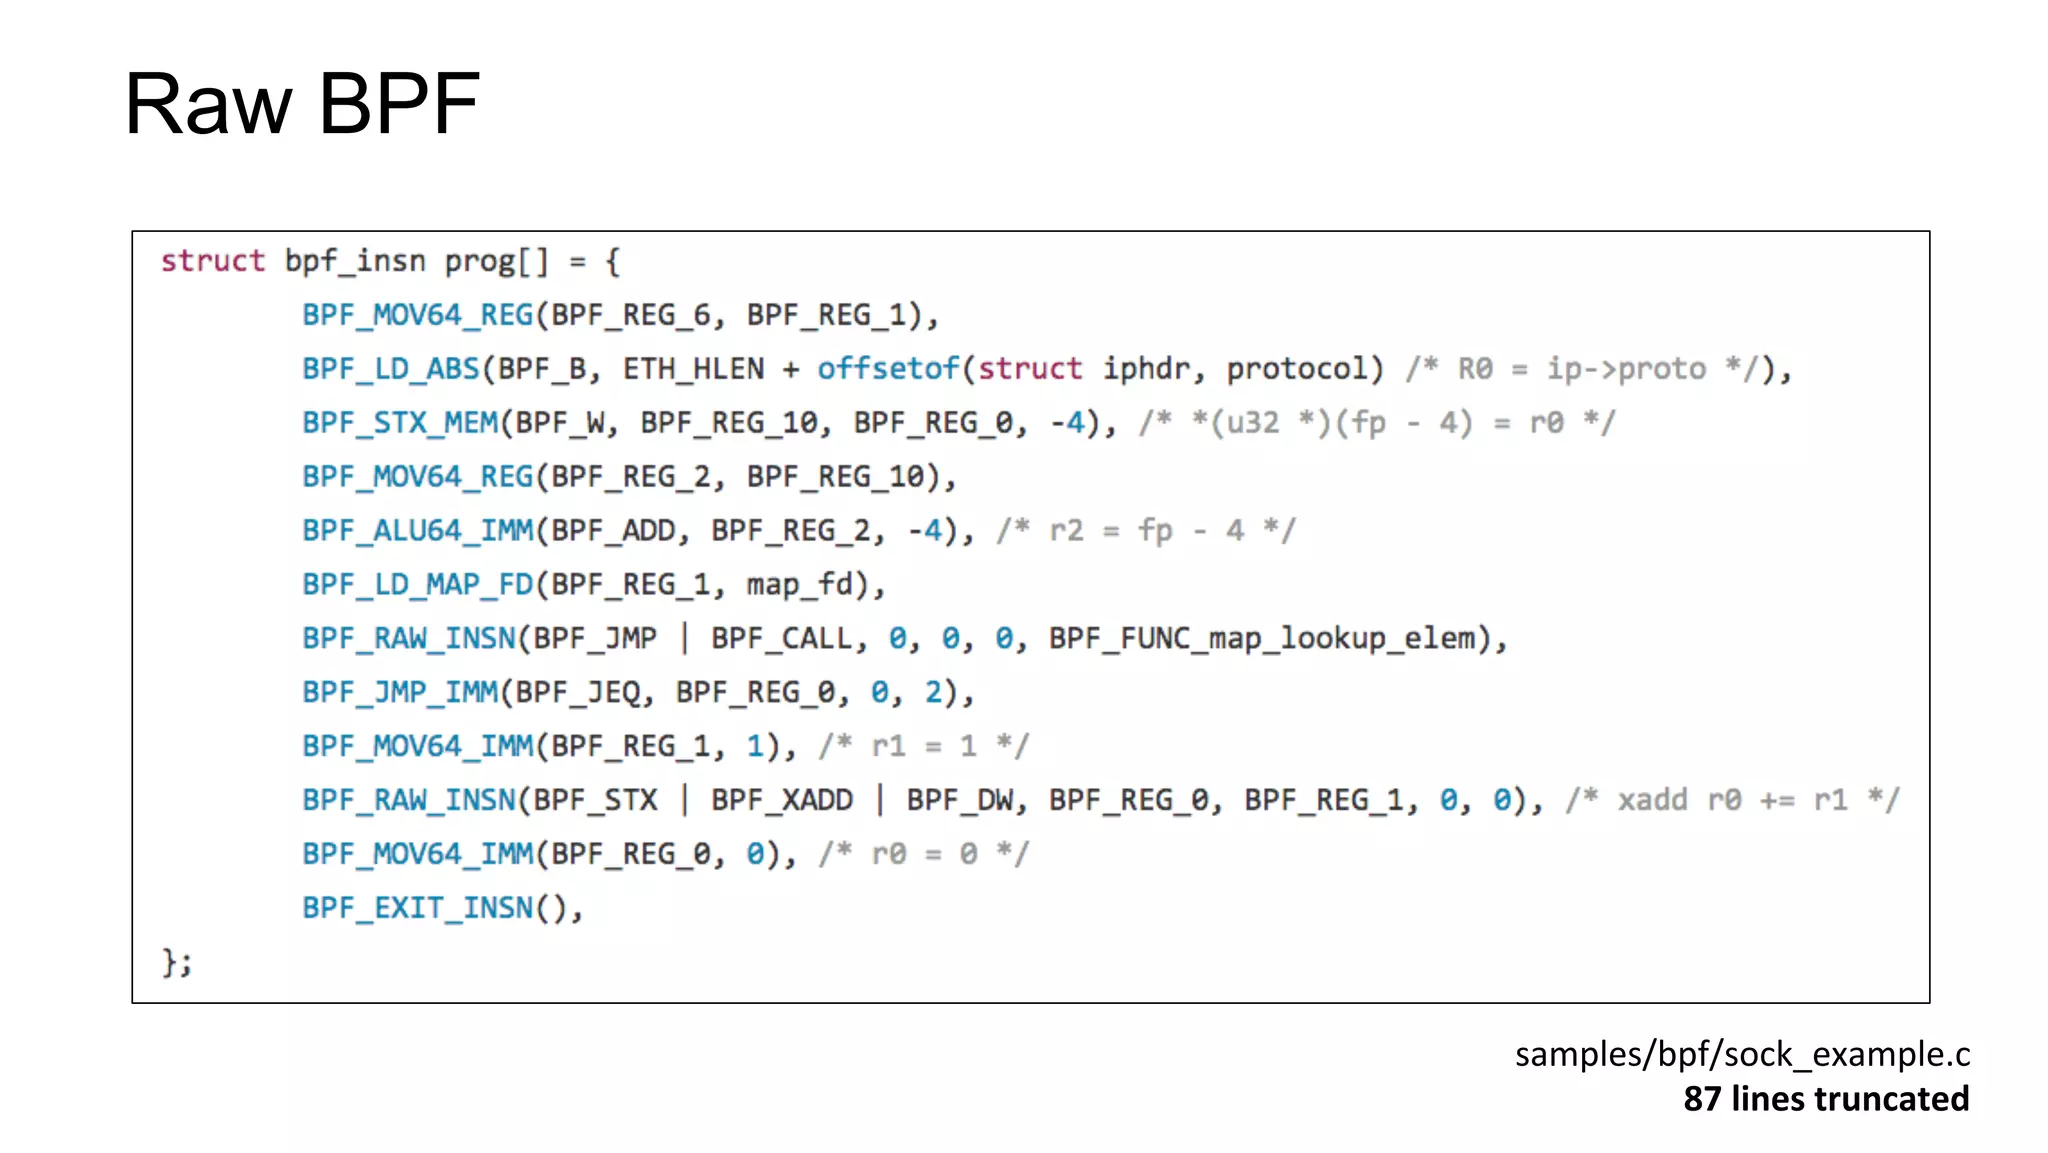
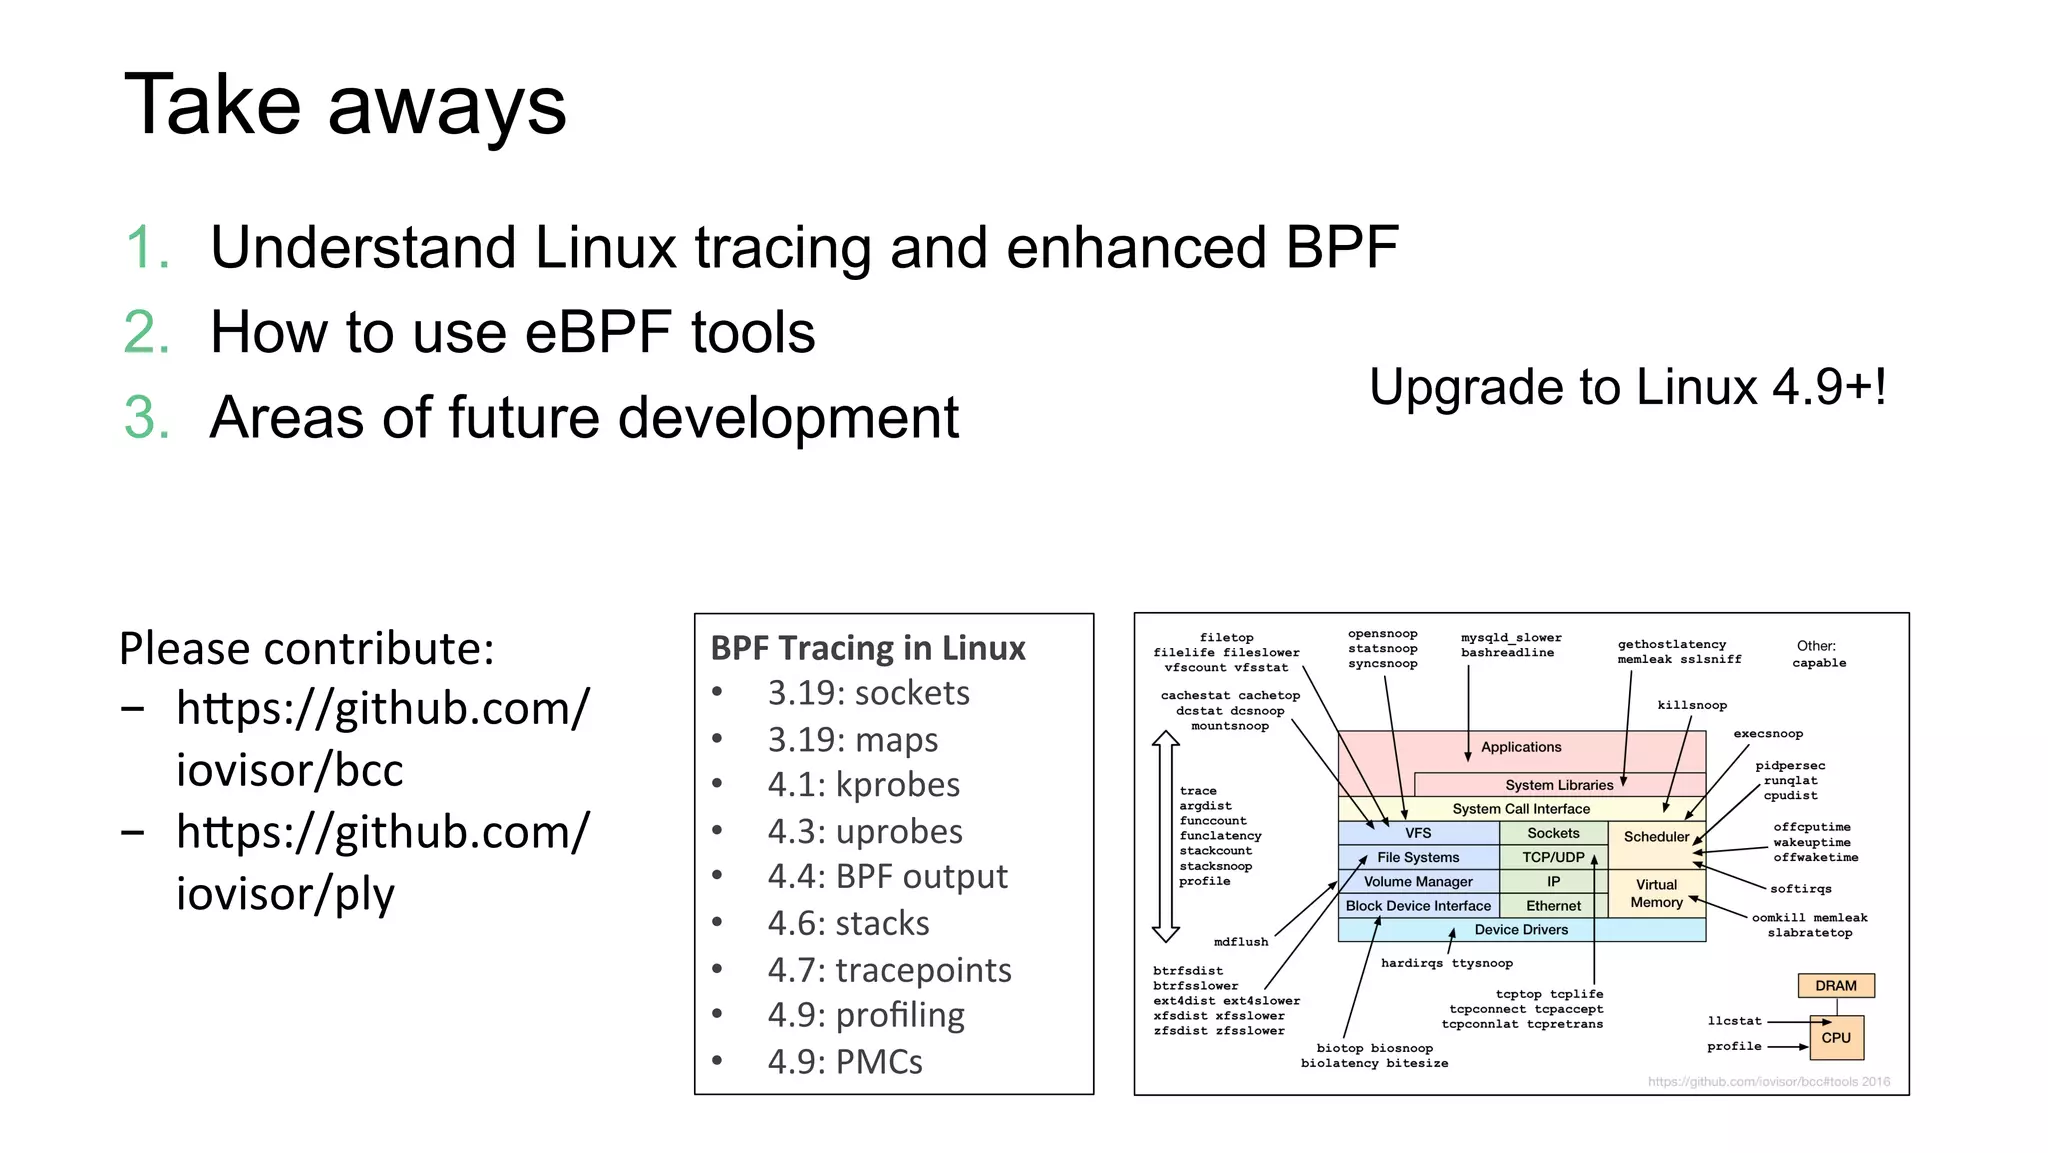
The document presents an overview of the performance analysis capabilities of Linux's eBPF (enhanced Berkeley Packet Filter) introduced by Brendan Gregg in September 2017. It covers various aspects such as the history of eBPF and tracing tools, including BCC (BPF Compiler Collection) and its applications in performance monitoring, latency analysis, and dynamic tracing of network and file system operations. Key takeaways include the understanding of Linux tracing, usage of BPF tools, and insights into future development areas.