Download as PDF, PPTX

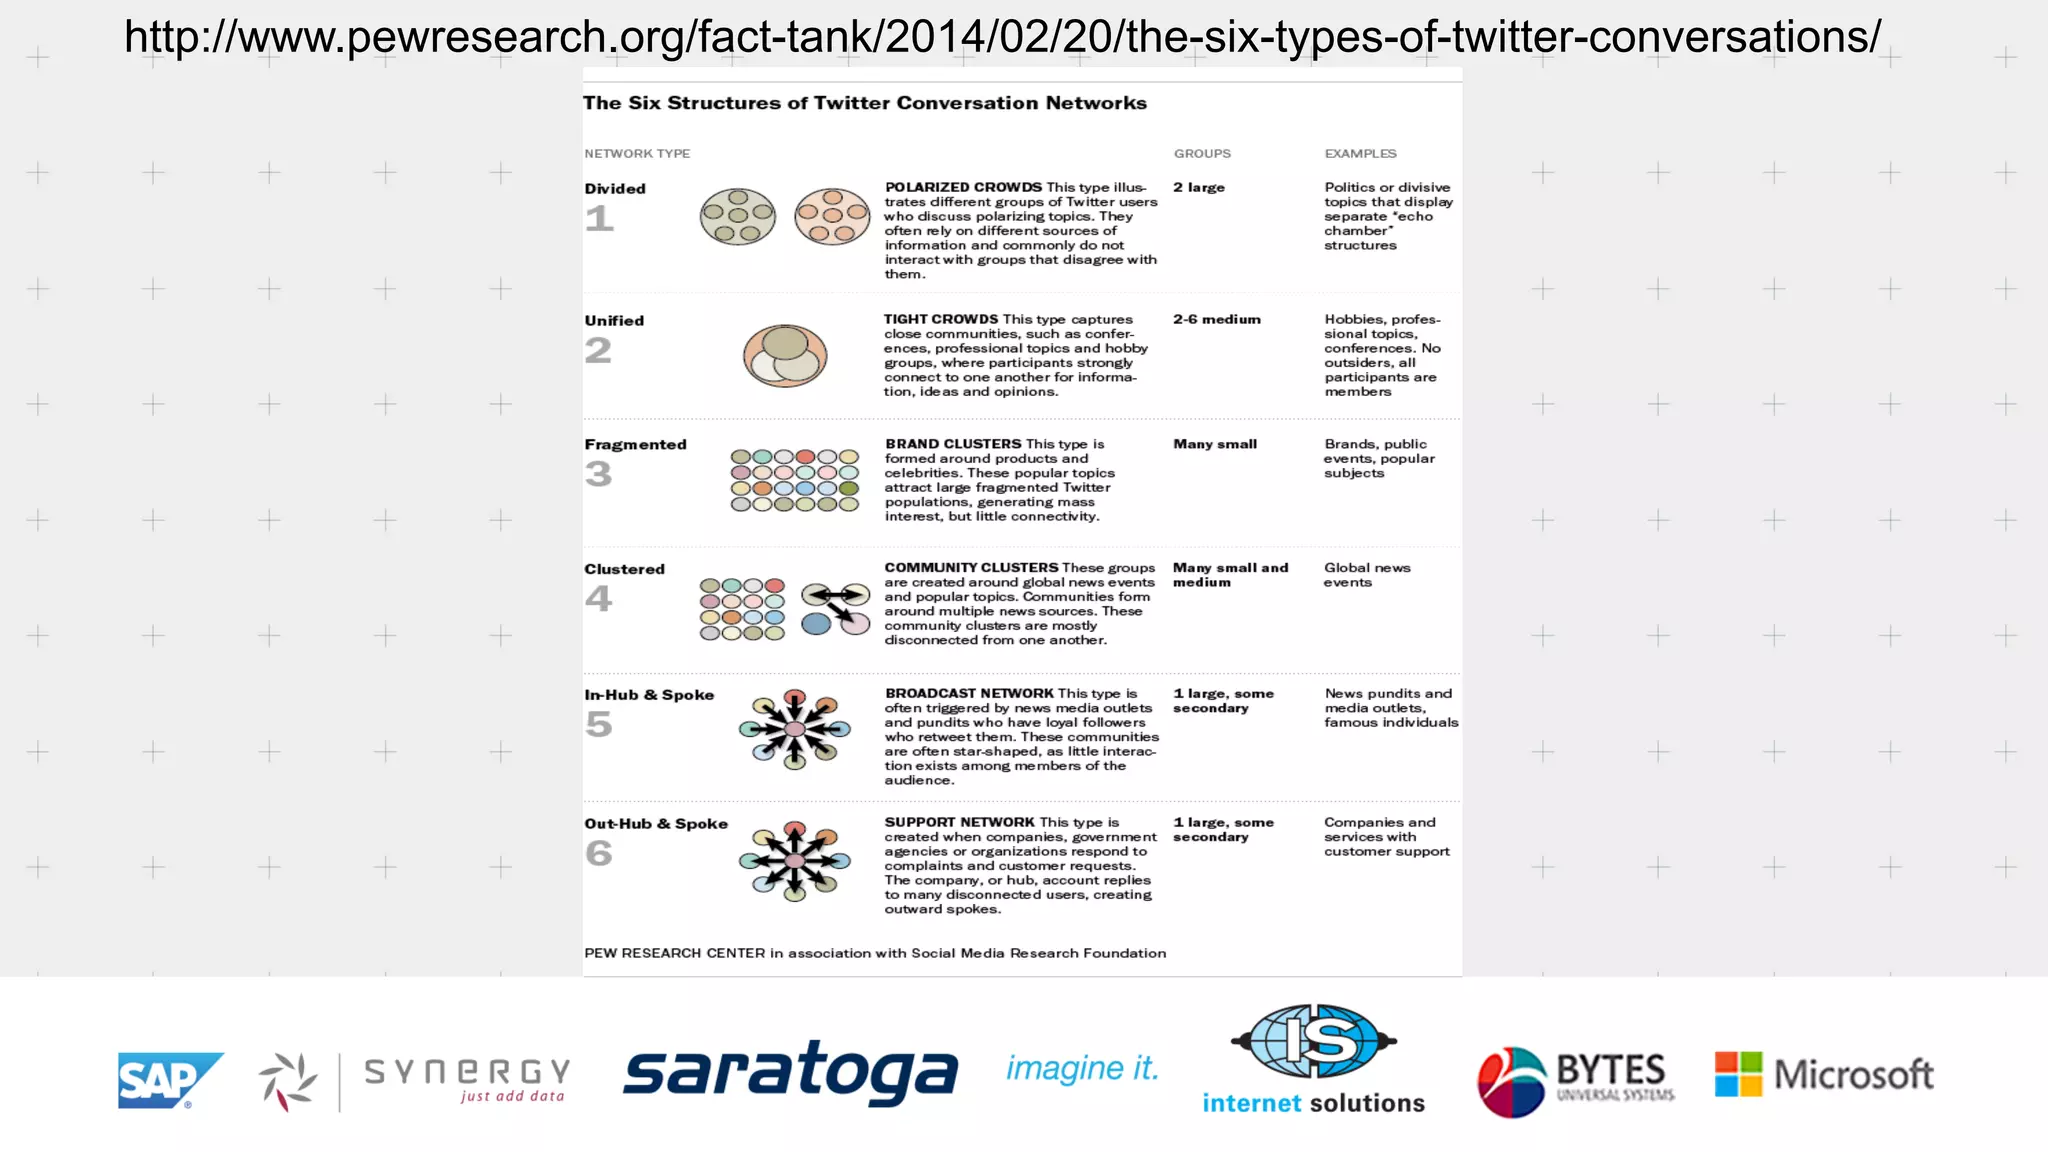
![[Divided]
Polarized Crowds
[Unified]
Tight Crowd
[Fragmented]
Brand Clusters
[Clustered]
Community Clusters
[In-Hub & Spoke]
Broadcast Network
[Out-Hub & Spoke]
Support Network
6 kinds of Twitter social media networks](https://image.slidesharecdn.com/marcsmith-141205004530-conversion-gate01/75/Marc-Smith-Charting-Collections-of-Connections-in-Social-Media-Creating-Maps-and-Measures-with-NodeXL-28-2048.jpg)
![[Divided]
Polarized Crowds
[Unified]
Tight Crowd
[Fragmented]
Brand Clusters
[Clustered]
Community Clusters
[In-Hub & Spoke]
Broadcast Network
[Out-Hub & Spoke]
Support Network
6 kinds of Twitter social media networks](https://image.slidesharecdn.com/marcsmith-141205004530-conversion-gate01/75/Marc-Smith-Charting-Collections-of-Connections-in-Social-Media-Creating-Maps-and-Measures-with-NodeXL-29-2048.jpg)
![[Divided]
Polarized Crowds
[Unified]
Tight Crowd
[Fragmented]
Brand Clusters
[Clustered]
Community Clusters
[In-Hub & Spoke]
Broadcast Network
[Out-Hub & Spoke]
Support Network
6 kinds of Twitter social media networks](https://image.slidesharecdn.com/marcsmith-141205004530-conversion-gate01/75/Marc-Smith-Charting-Collections-of-Connections-in-Social-Media-Creating-Maps-and-Measures-with-NodeXL-39-2048.jpg)
![[Divided]
Polarized
Crowds
[Unified]
Tight
Crowd
[Fragmented]
Brand
Clusters
[Clustered]
Communi8es
[In-‐Hub
&
Spoke]
Broadcast
[Out-‐Hub
&
Spoke]
Support
[Low probability]
Find bridge users.
Encourage shared
material.
[Low probability]
Get message out to
disconnected
communities.
[Possible transition]
Draw in new participants.
[Possible transition]
Regularly create content.
[Possible transition]
Reply to multiple users.
[Undesirable transition]
Remove bridges,
highlight divisions.
[Low probability]
Get message out to
disconnected
communities.
[High probability]
Draw in new participants.
[Possible transition]
Regularly create content.
[Possible transition]
Reply to multiple users.
[Undesirable transition]
Increase density of
connections in two
groups.
[Low probability]
Dramatically increase
density of connections.
[High probability]
Increase retention, build
connections.
[Possible transition]
Regularly create content.
[Possible transition]
Reply to multiple users.
[Undesirable transition]
Increase density of
connections in two
groups.
[Low probability]
Dramatically increase
density of connections.
[Undesirable transition]
Increase population,
reduce connections.
[Possible transition]
Regularly create content.
[Possible transition]
Reply to multiple users.
[Undesirable transition]
Increase density of
connections in two
groups.
[Low probability]
Dramatically increase
density of connections.
[Low probability]
Get message out to
disconnected
communities.
[Possible transition]
Increase retention, build
connections.
[High probability]
Increase reply rate, reply
to multiple users.
[Undesirable transition]
Increase density of
connections in two
groups.
[Low probability]
Dramatically increase
density of connections.
[Possible transition]
Get message out to
disconnected
communities.
[High probability]
Increase retention, build
connections.
[High probability]
Increase publication of
new content and
regularly create content.](https://image.slidesharecdn.com/marcsmith-141205004530-conversion-gate01/75/Marc-Smith-Charting-Collections-of-Connections-in-Social-Media-Creating-Maps-and-Measures-with-NodeXL-49-2048.jpg)


![[Divided]
Polarized Crowds
[Unified]
Tight Crowd
[Fragmented]
Brand Clusters
[Clustered]
Community Clusters
[In-Hub & Spoke]
Broadcast Network
[Out-Hub & Spoke]
Support Network
6 kinds of Twitter social media networks](https://crownmelresort.com/image.slidesharecdn.com/marcsmith-141205004530-conversion-gate01/75/Marc-Smith-Charting-Collections-of-Connections-in-Social-Media-Creating-Maps-and-Measures-with-NodeXL-28-2048.jpg)
![[Divided]
Polarized Crowds
[Unified]
Tight Crowd
[Fragmented]
Brand Clusters
[Clustered]
Community Clusters
[In-Hub & Spoke]
Broadcast Network
[Out-Hub & Spoke]
Support Network
6 kinds of Twitter social media networks](https://crownmelresort.com/image.slidesharecdn.com/marcsmith-141205004530-conversion-gate01/75/Marc-Smith-Charting-Collections-of-Connections-in-Social-Media-Creating-Maps-and-Measures-with-NodeXL-29-2048.jpg)


![[Divided]
Polarized Crowds
[Unified]
Tight Crowd
[Fragmented]
Brand Clusters
[Clustered]
Community Clusters
[In-Hub & Spoke]
Broadcast Network
[Out-Hub & Spoke]
Support Network
6 kinds of Twitter social media networks](https://crownmelresort.com/image.slidesharecdn.com/marcsmith-141205004530-conversion-gate01/75/Marc-Smith-Charting-Collections-of-Connections-in-Social-Media-Creating-Maps-and-Measures-with-NodeXL-39-2048.jpg)


![[Divided]
Polarized
Crowds
[Unified]
Tight
Crowd
[Fragmented]
Brand
Clusters
[Clustered]
Communi8es
[In-‐Hub
&
Spoke]
Broadcast
[Out-‐Hub
&
Spoke]
Support
[Low probability]
Find bridge users.
Encourage shared
material.
[Low probability]
Get message out to
disconnected
communities.
[Possible transition]
Draw in new participants.
[Possible transition]
Regularly create content.
[Possible transition]
Reply to multiple users.
[Undesirable transition]
Remove bridges,
highlight divisions.
[Low probability]
Get message out to
disconnected
communities.
[High probability]
Draw in new participants.
[Possible transition]
Regularly create content.
[Possible transition]
Reply to multiple users.
[Undesirable transition]
Increase density of
connections in two
groups.
[Low probability]
Dramatically increase
density of connections.
[High probability]
Increase retention, build
connections.
[Possible transition]
Regularly create content.
[Possible transition]
Reply to multiple users.
[Undesirable transition]
Increase density of
connections in two
groups.
[Low probability]
Dramatically increase
density of connections.
[Undesirable transition]
Increase population,
reduce connections.
[Possible transition]
Regularly create content.
[Possible transition]
Reply to multiple users.
[Undesirable transition]
Increase density of
connections in two
groups.
[Low probability]
Dramatically increase
density of connections.
[Low probability]
Get message out to
disconnected
communities.
[Possible transition]
Increase retention, build
connections.
[High probability]
Increase reply rate, reply
to multiple users.
[Undesirable transition]
Increase density of
connections in two
groups.
[Low probability]
Dramatically increase
density of connections.
[Possible transition]
Get message out to
disconnected
communities.
[High probability]
Increase retention, build
connections.
[High probability]
Increase publication of
new content and
regularly create content.](https://crownmelresort.com/image.slidesharecdn.com/marcsmith-141205004530-conversion-gate01/75/Marc-Smith-Charting-Collections-of-Connections-in-Social-Media-Creating-Maps-and-Measures-with-NodeXL-49-2048.jpg)


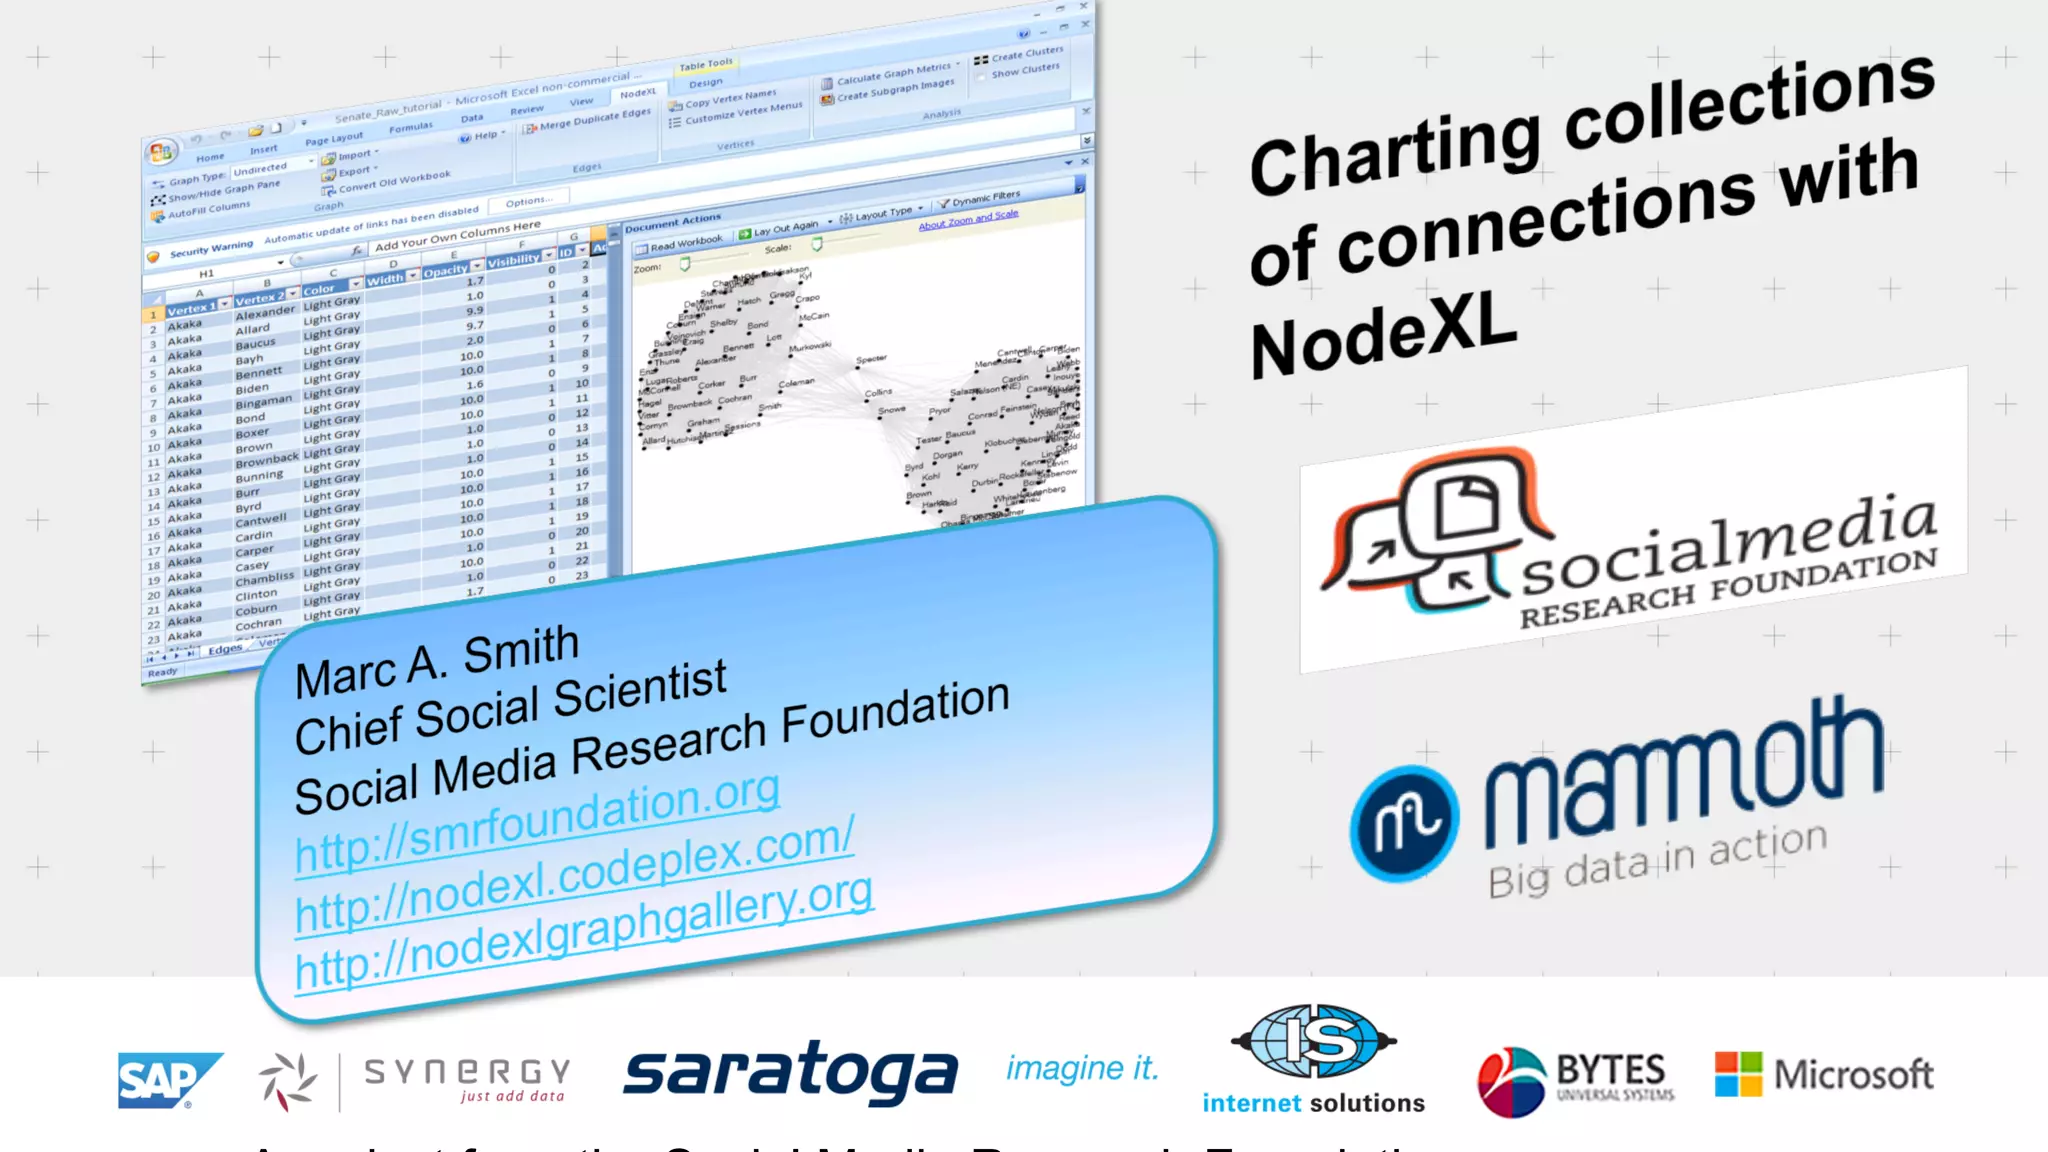
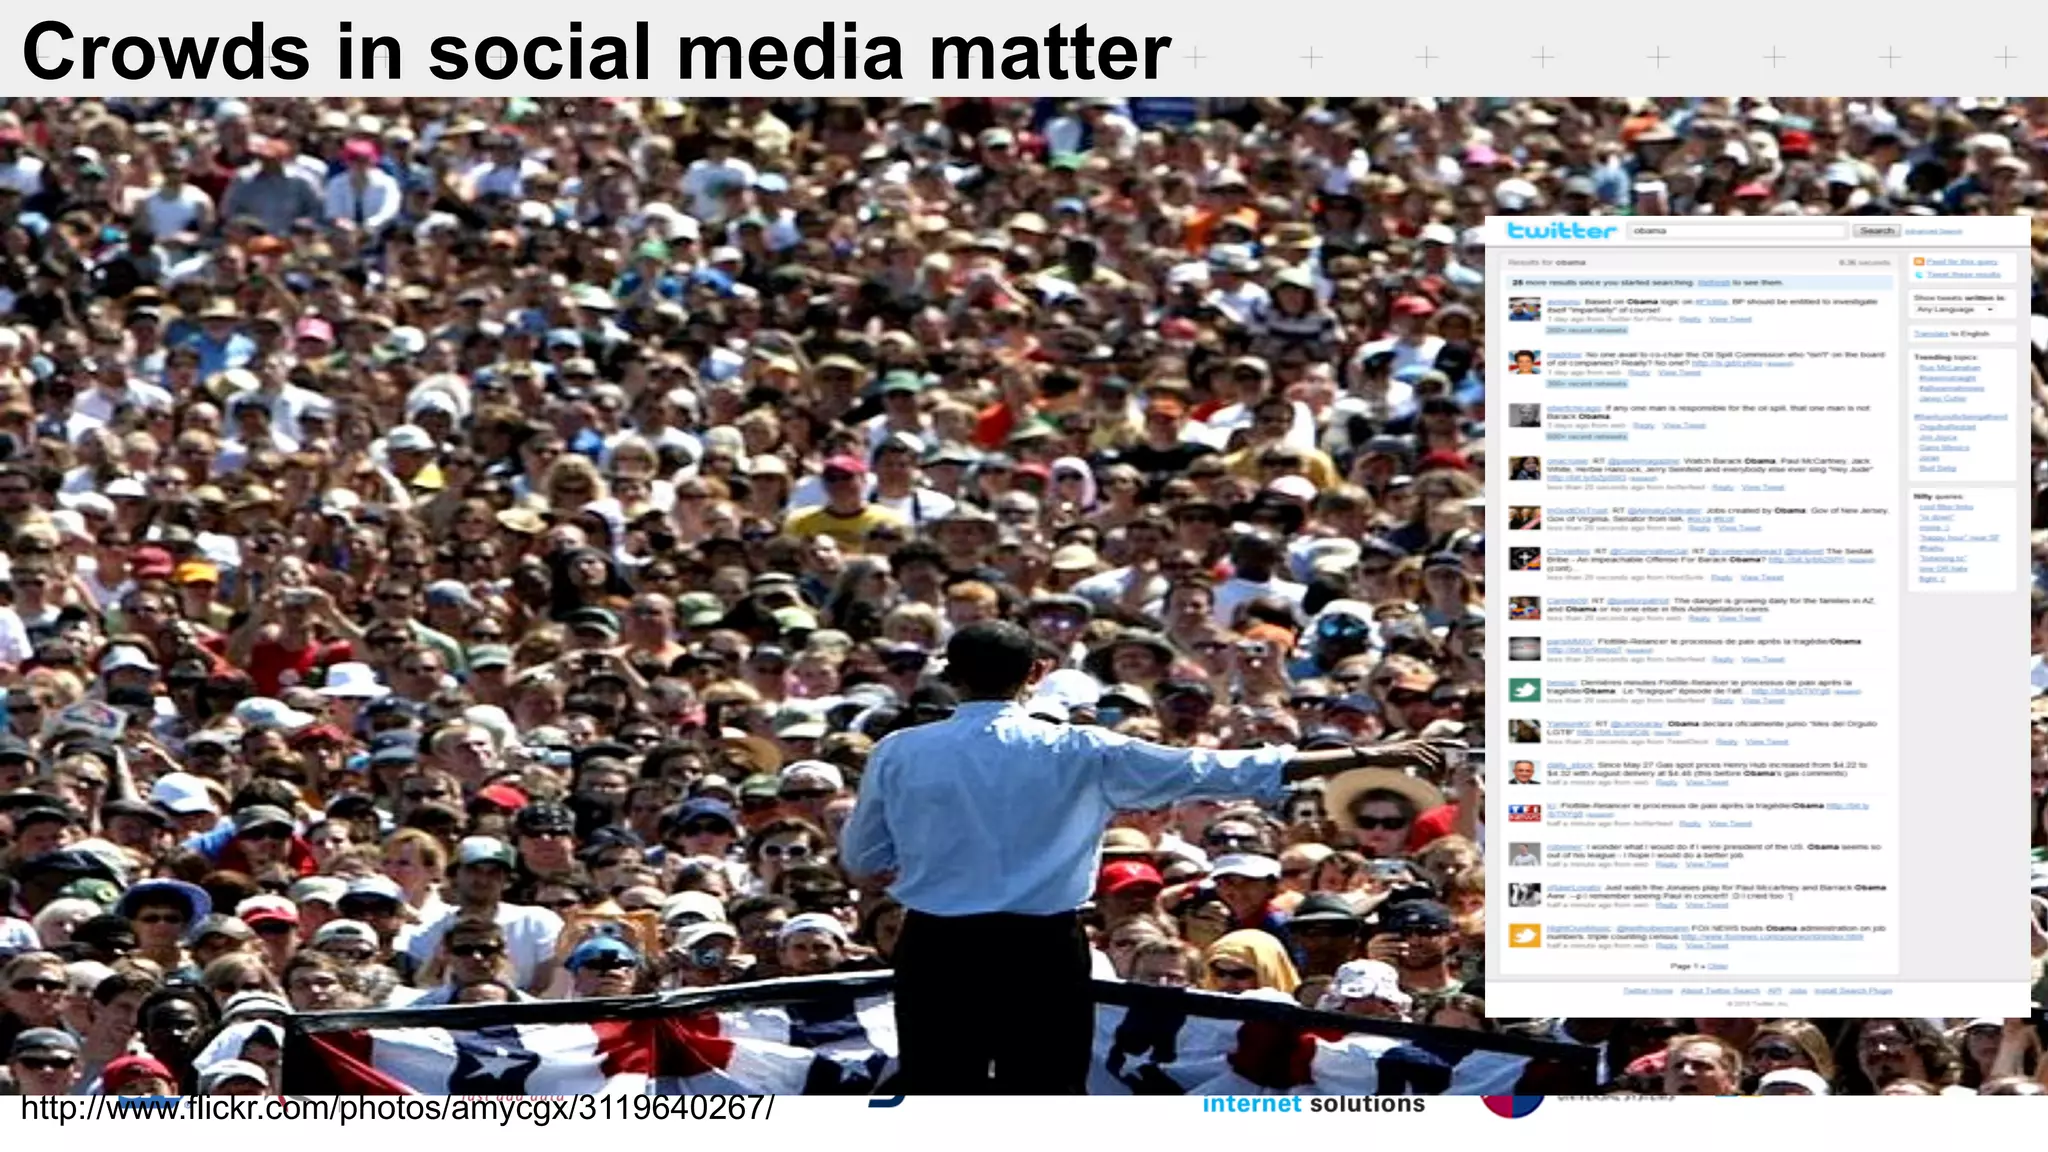
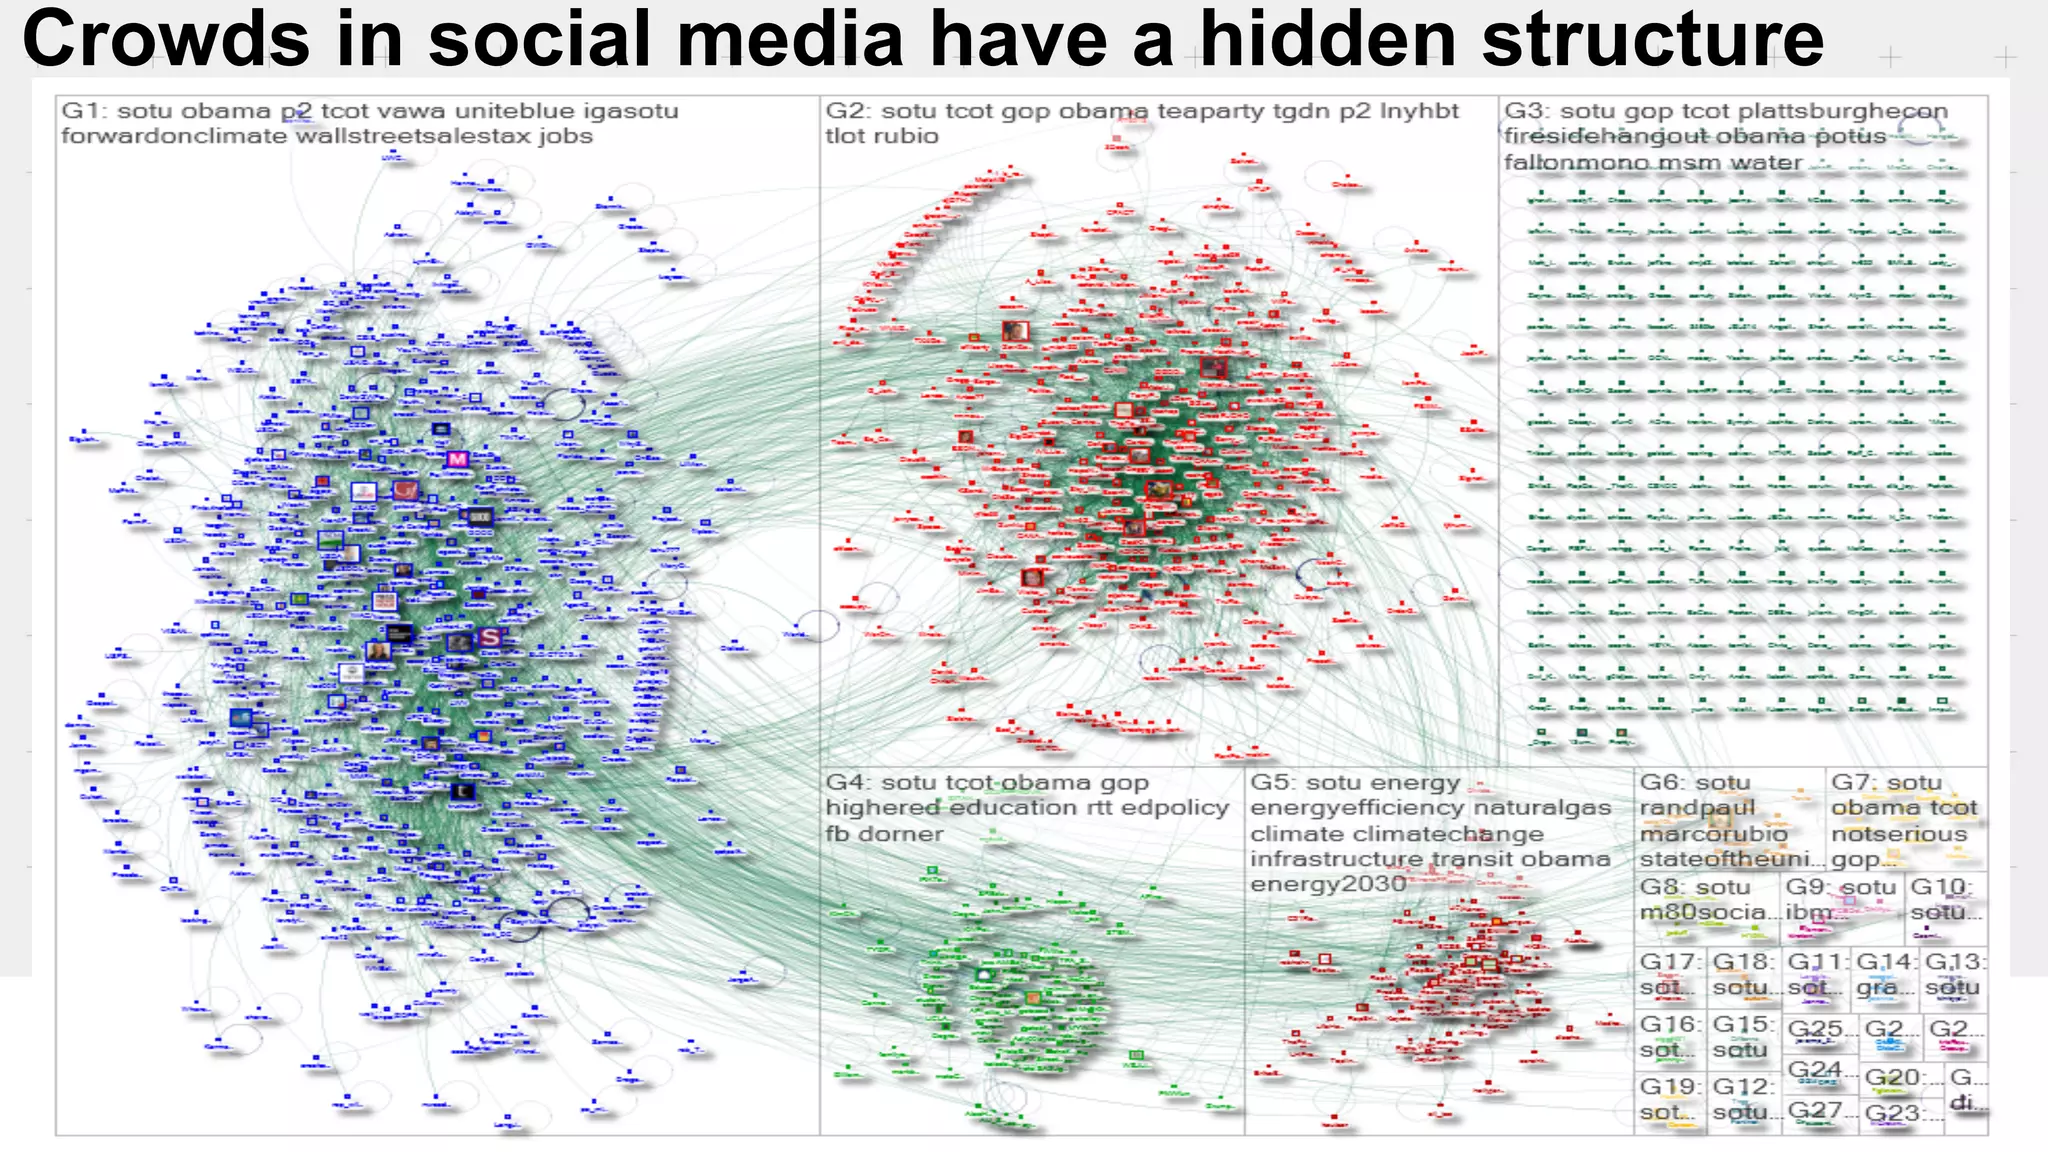
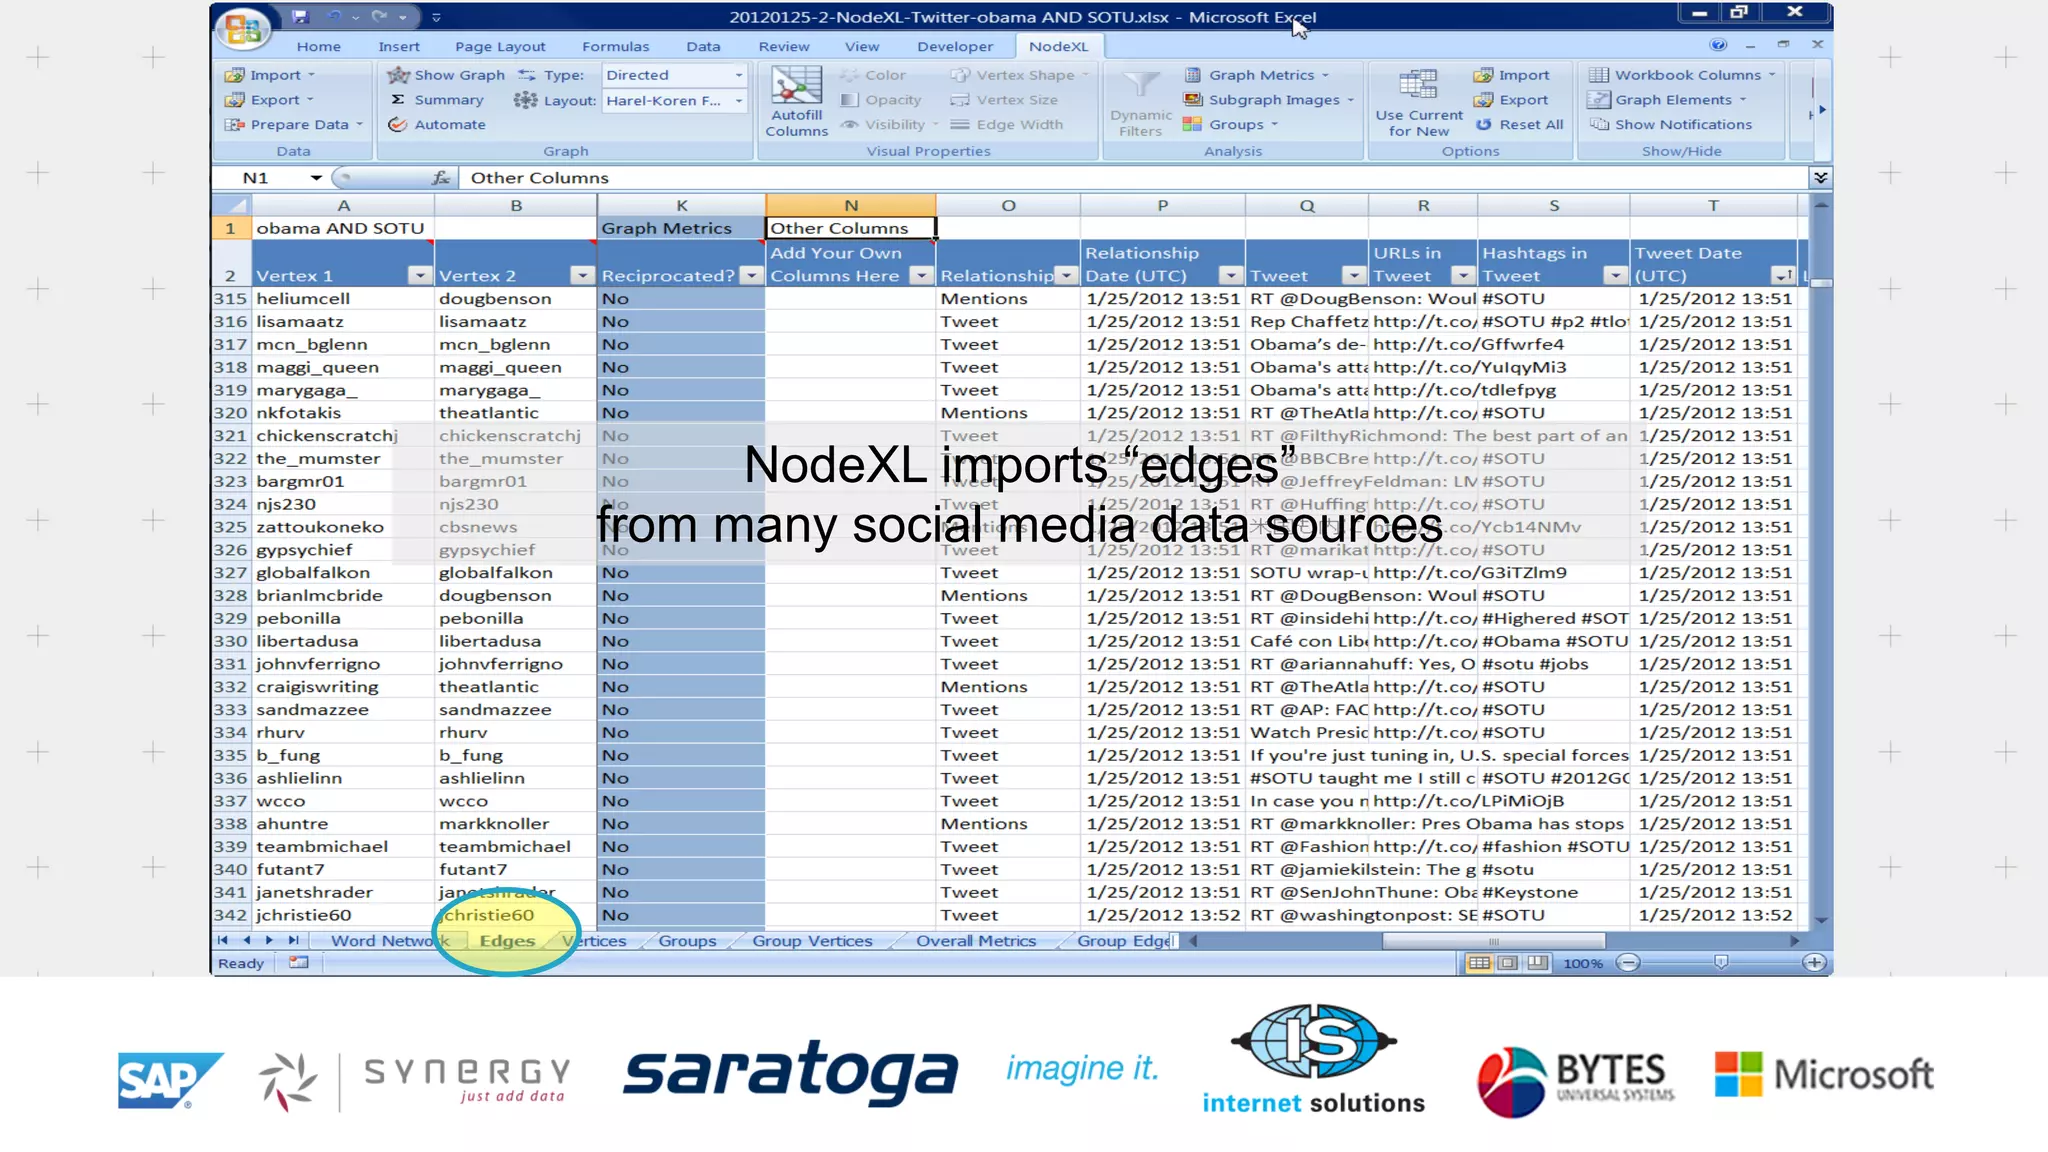
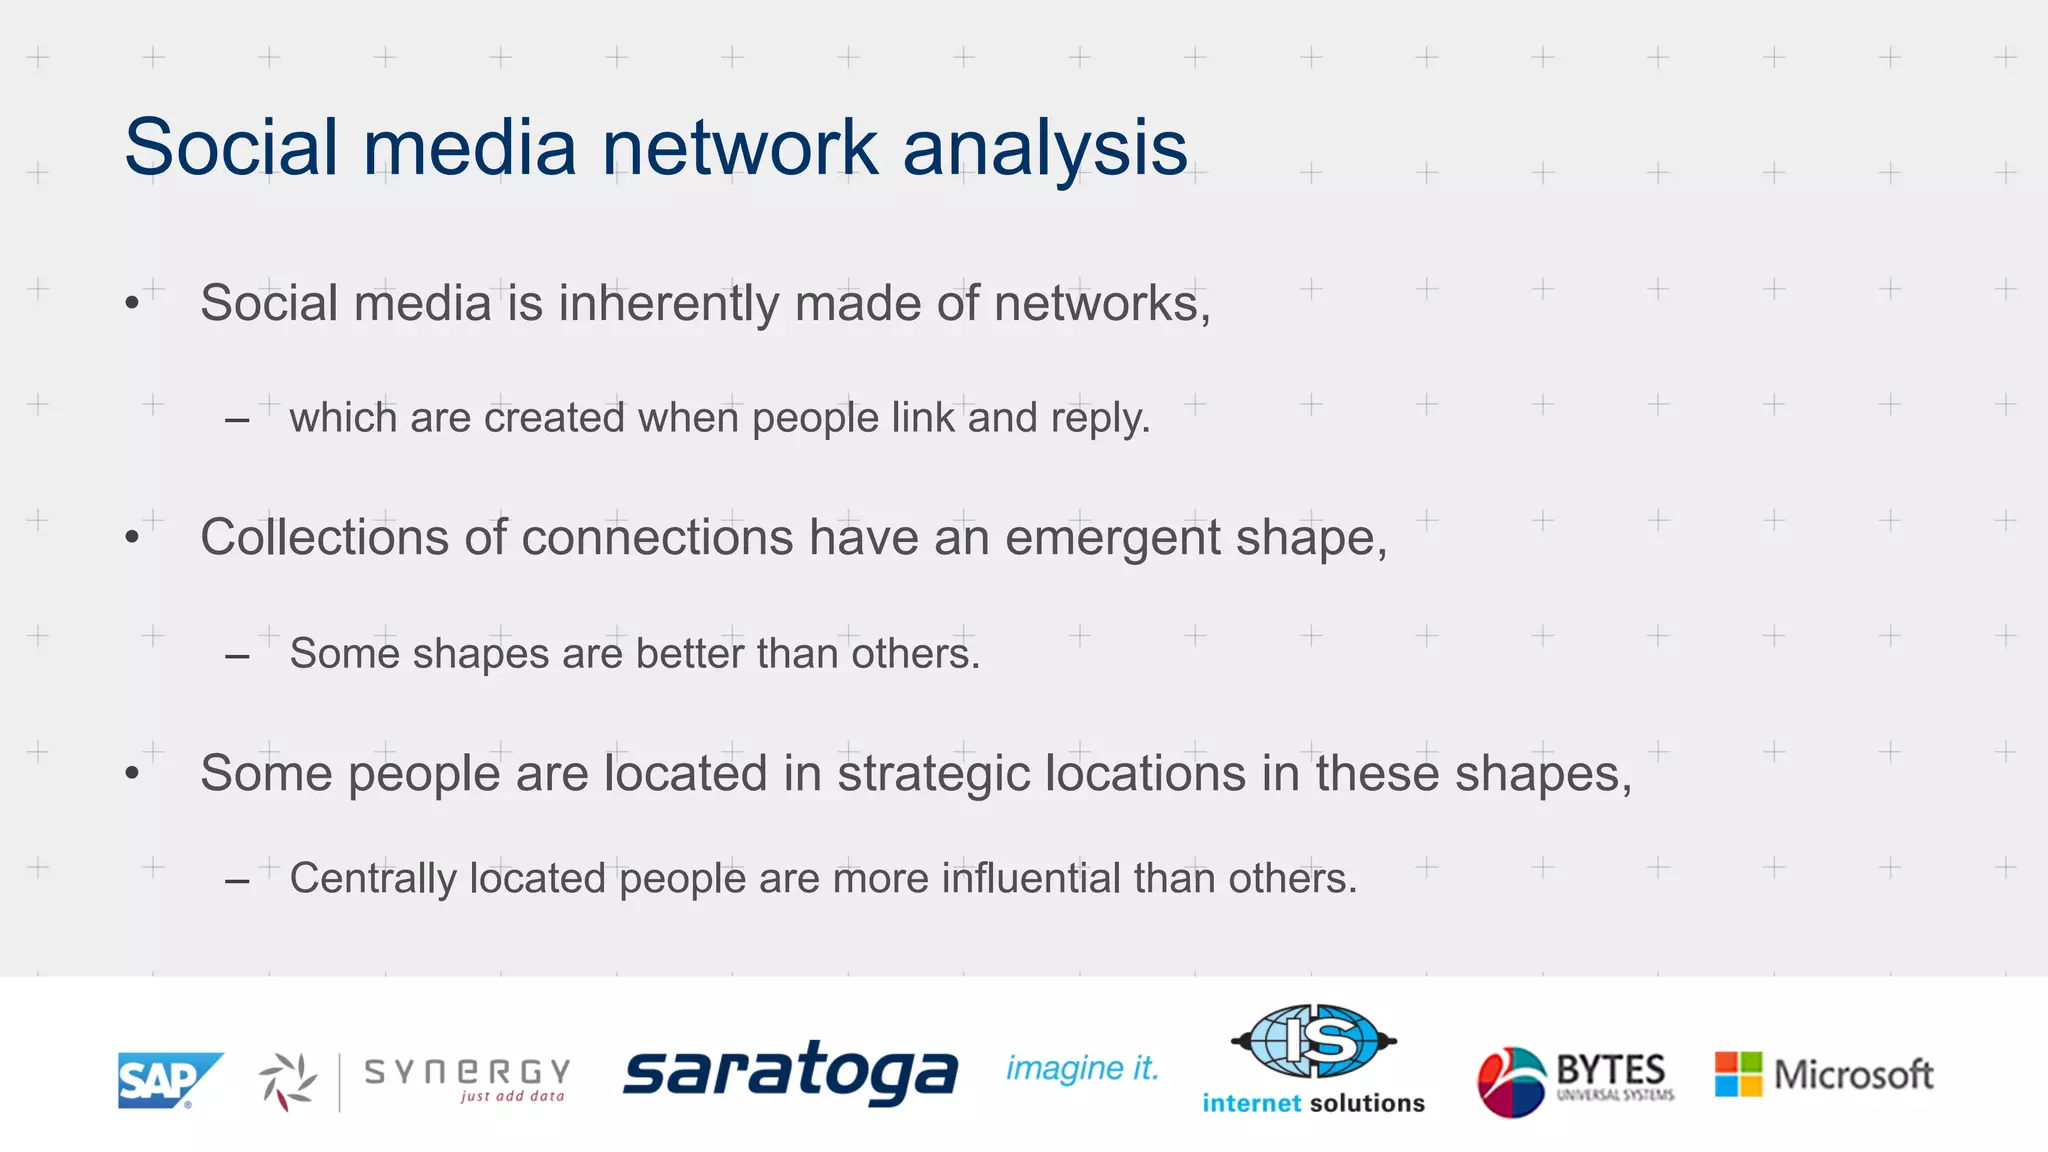
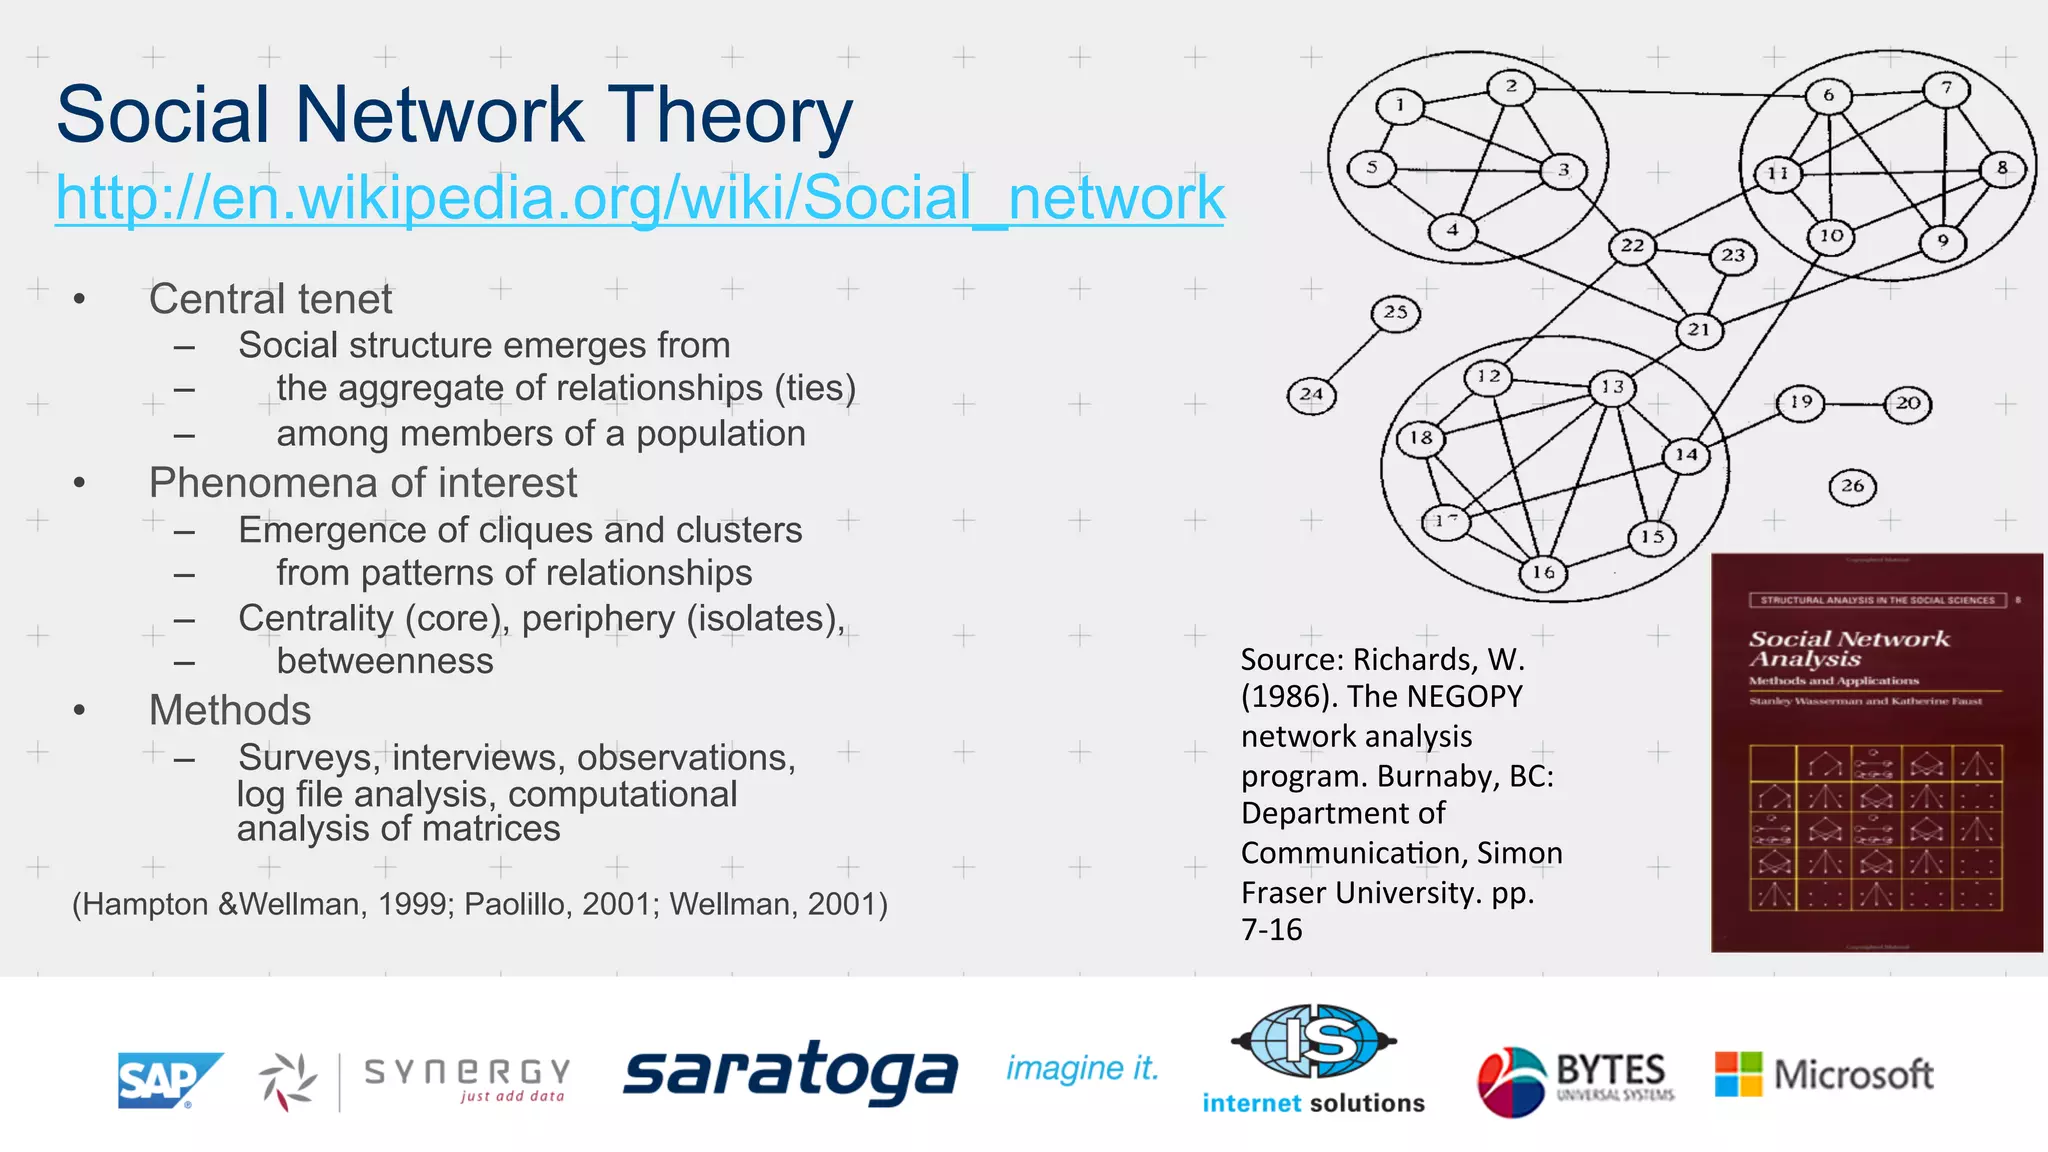
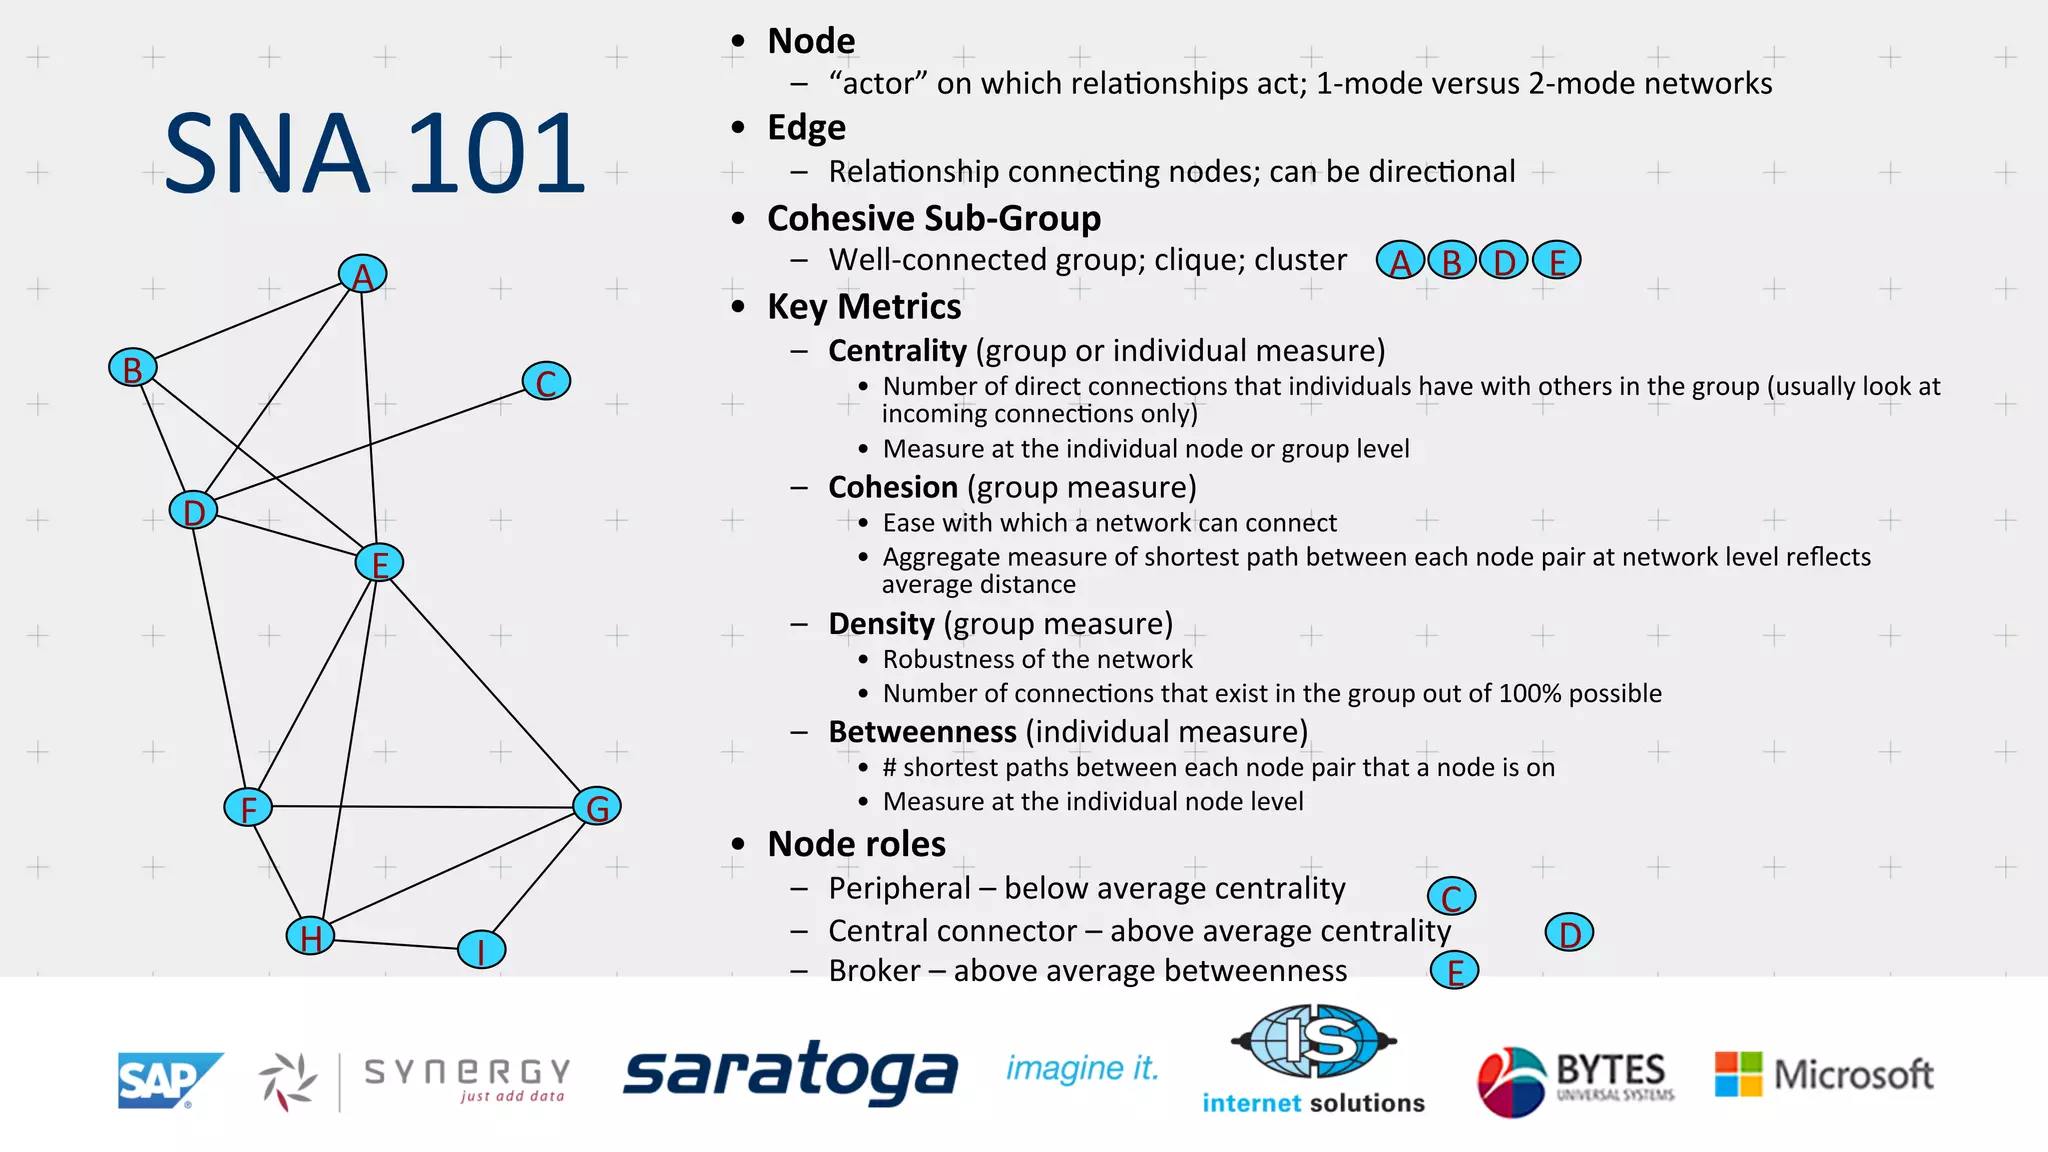
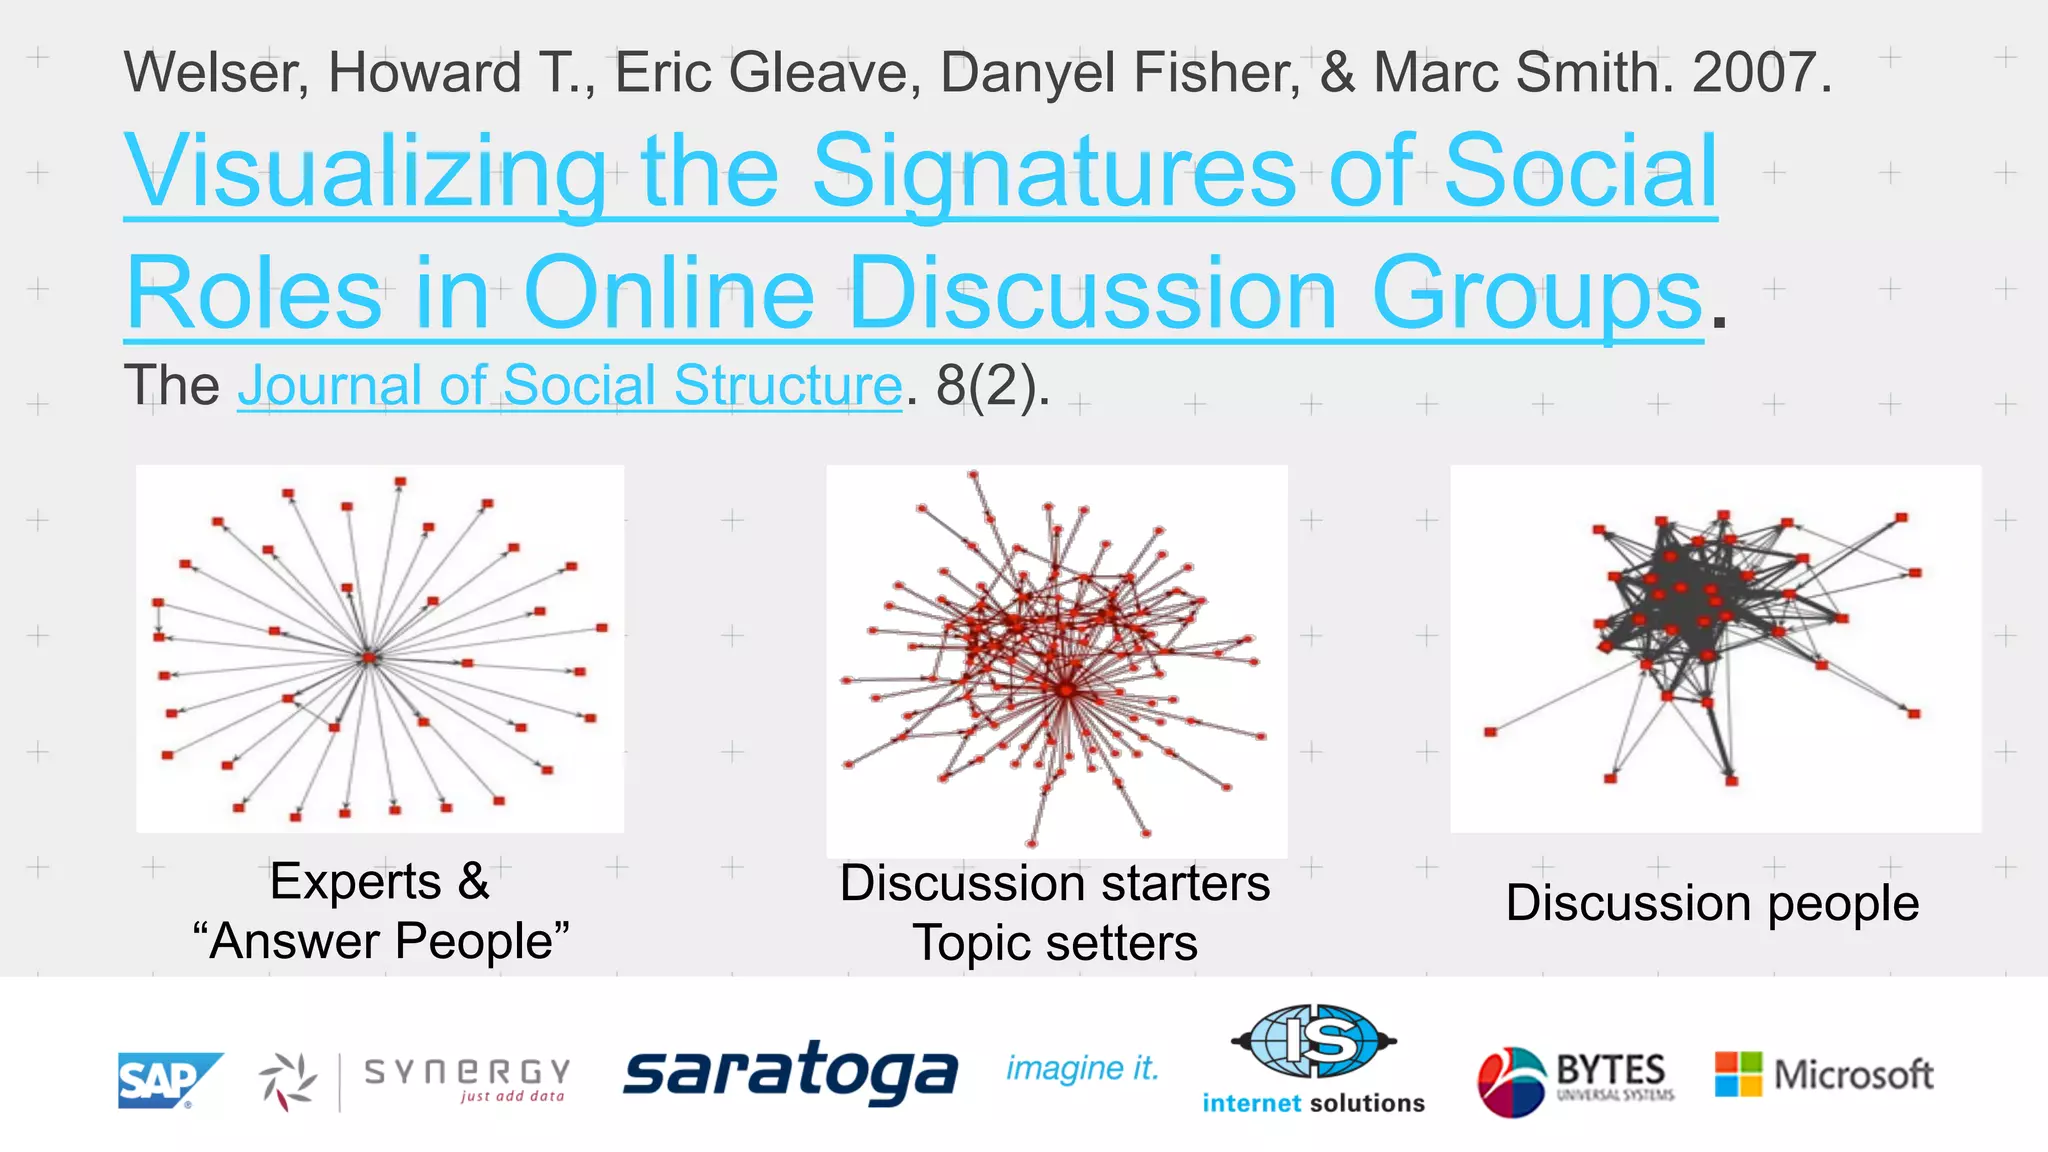
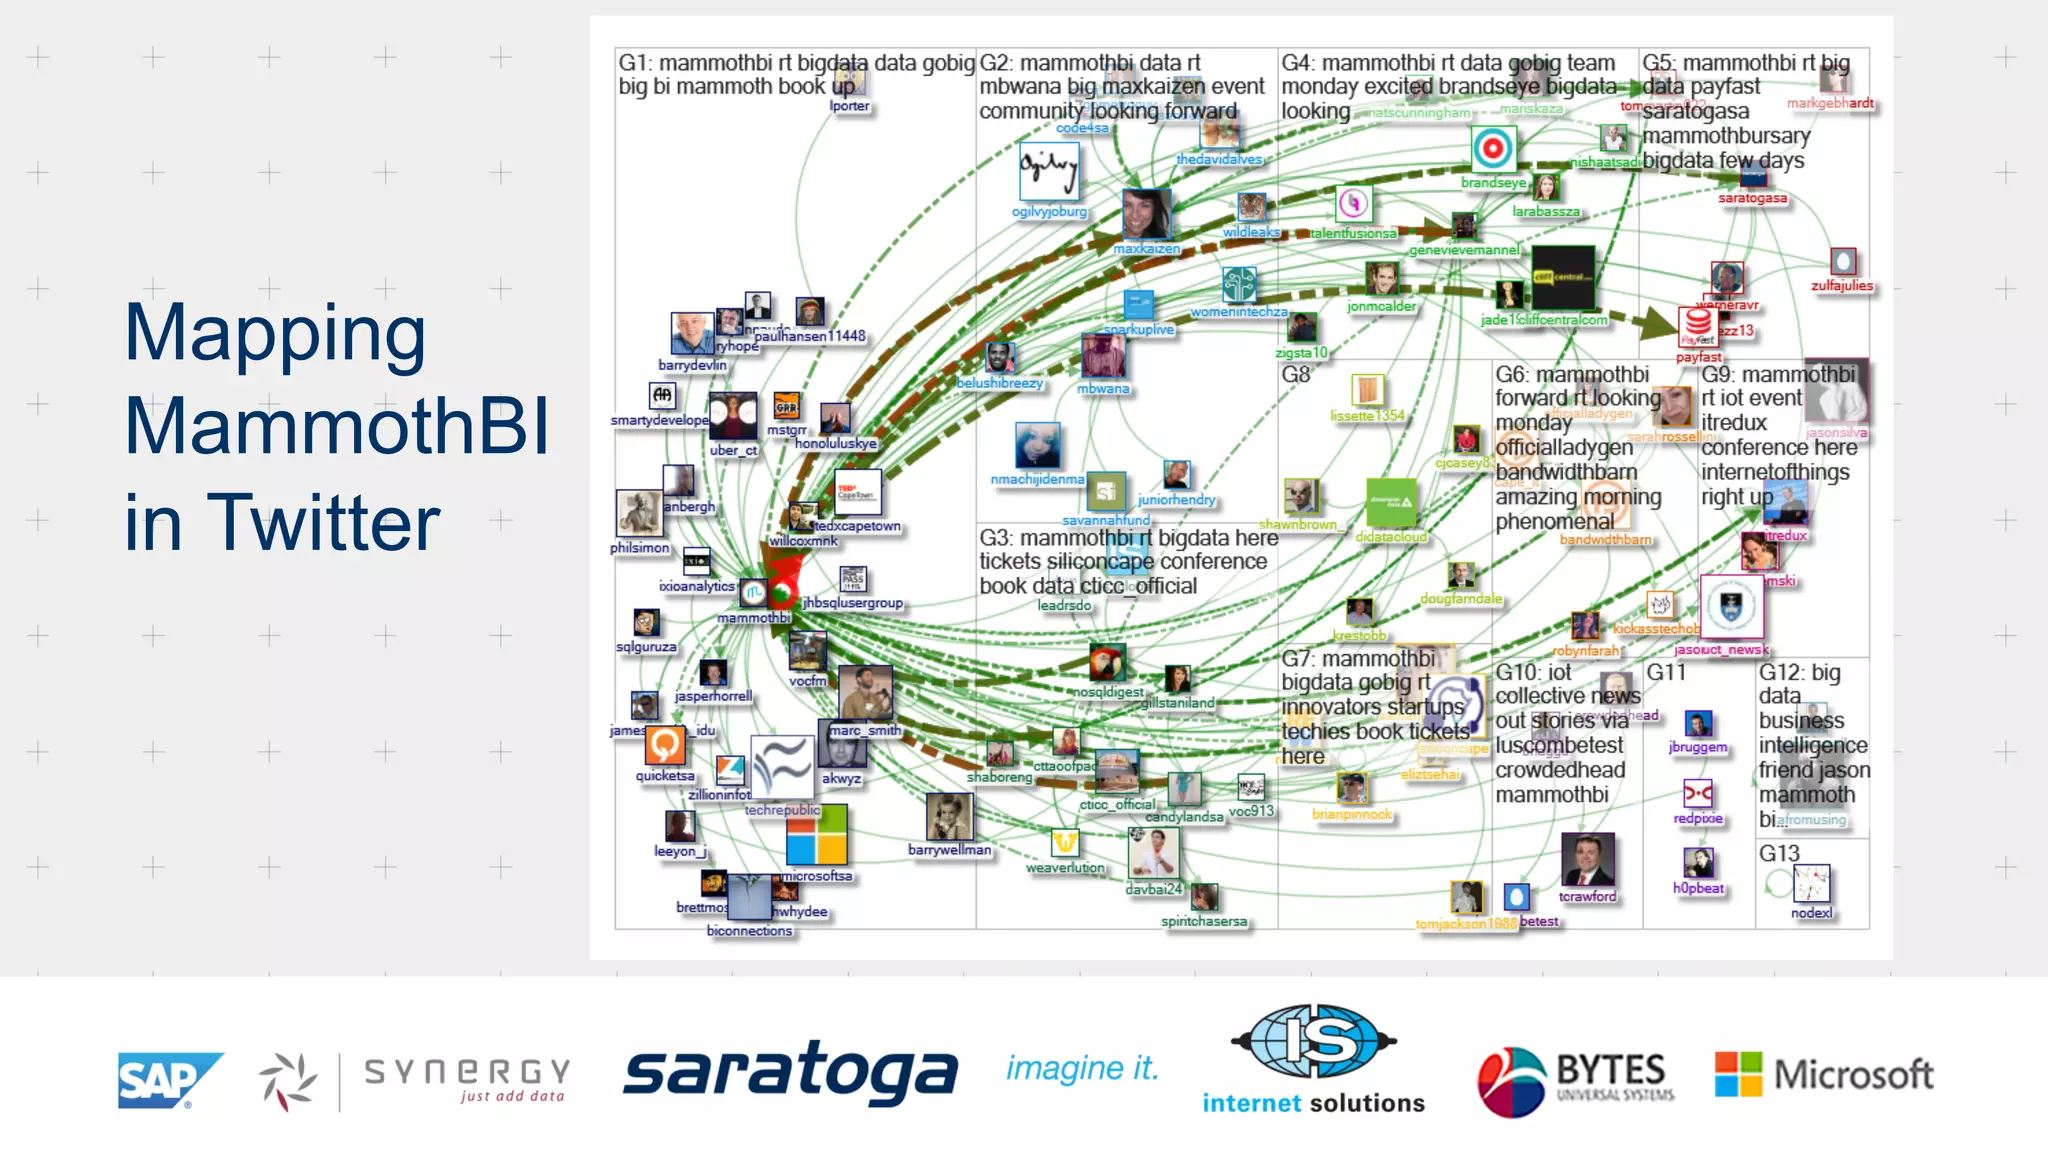
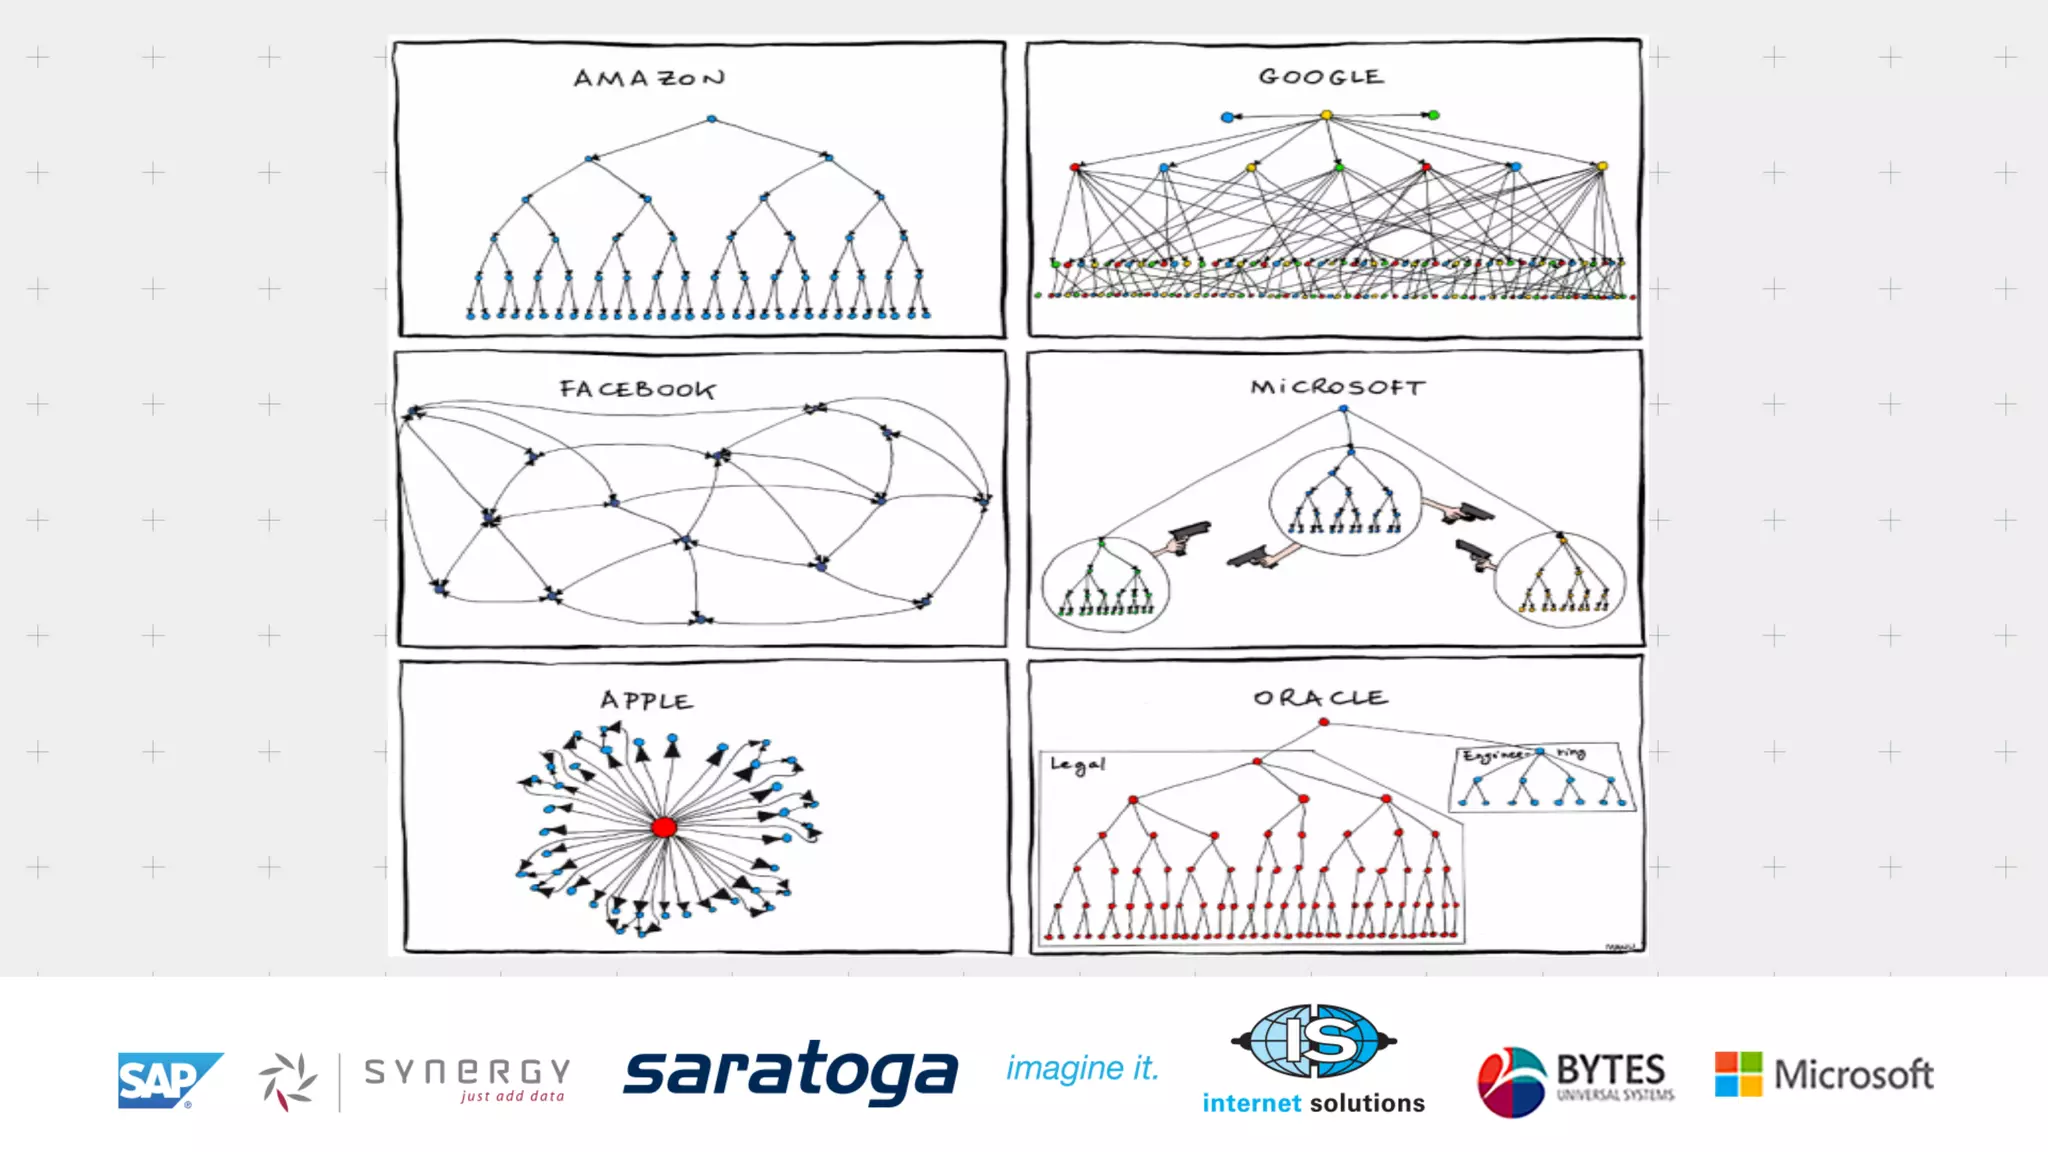
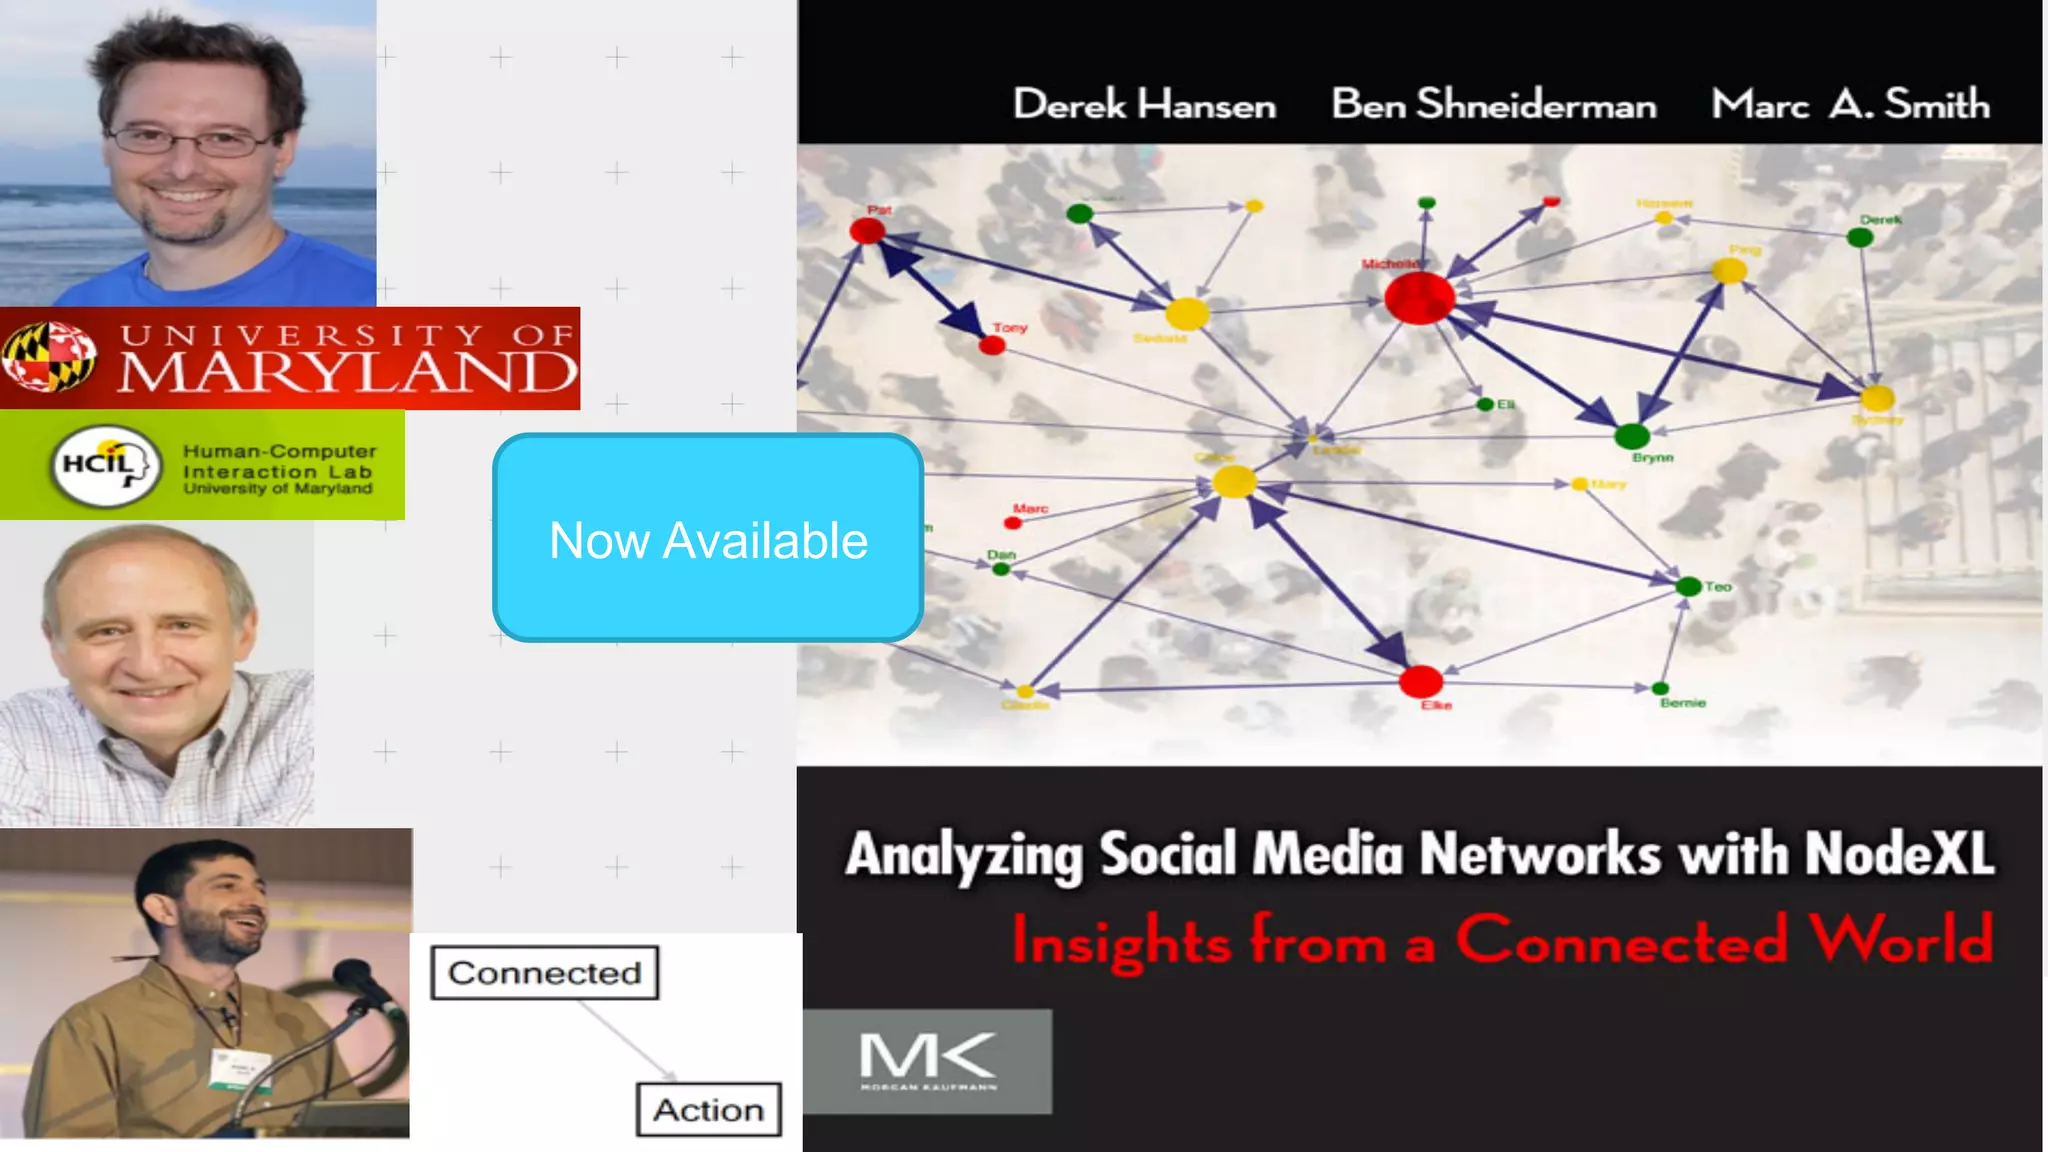
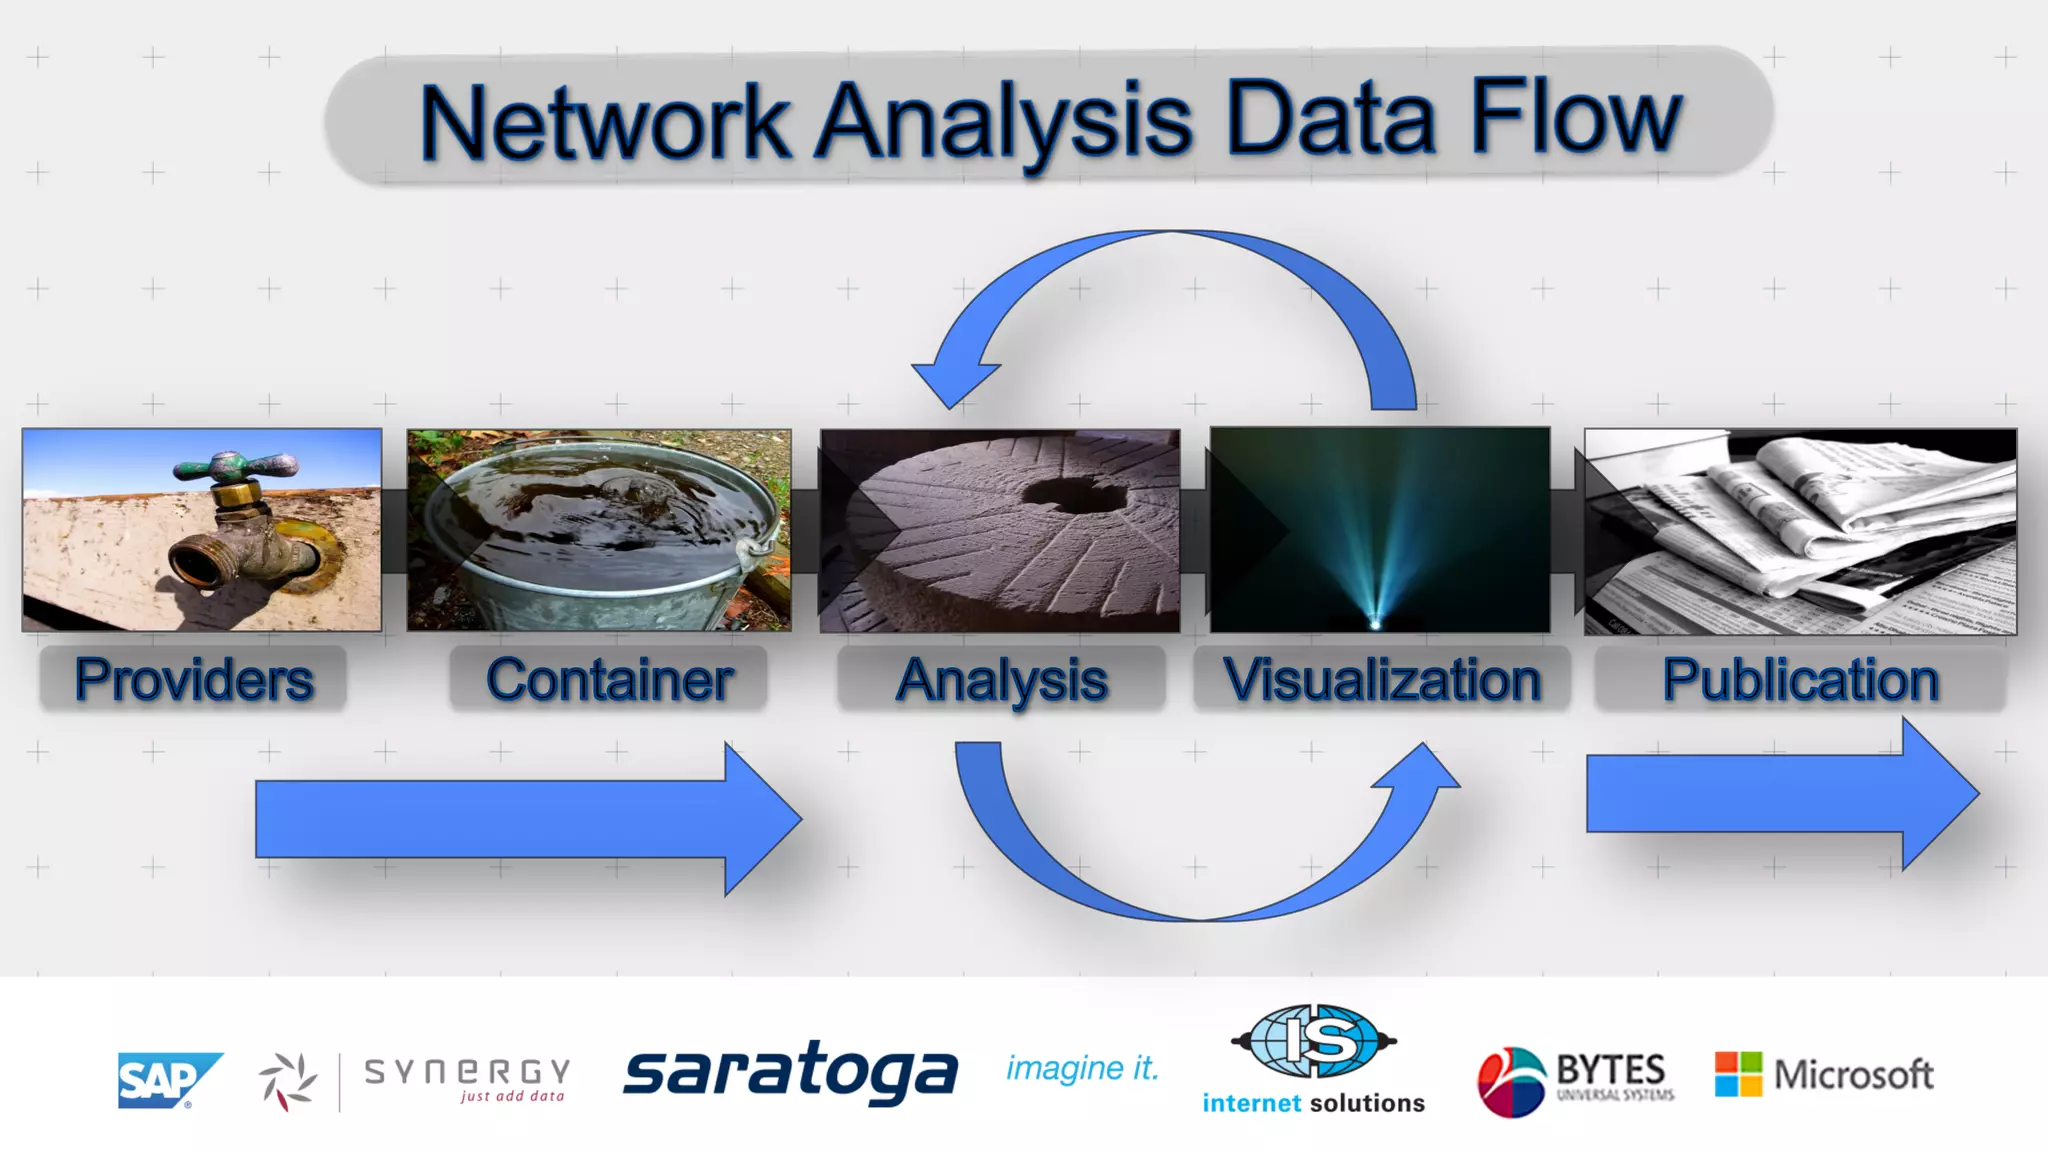
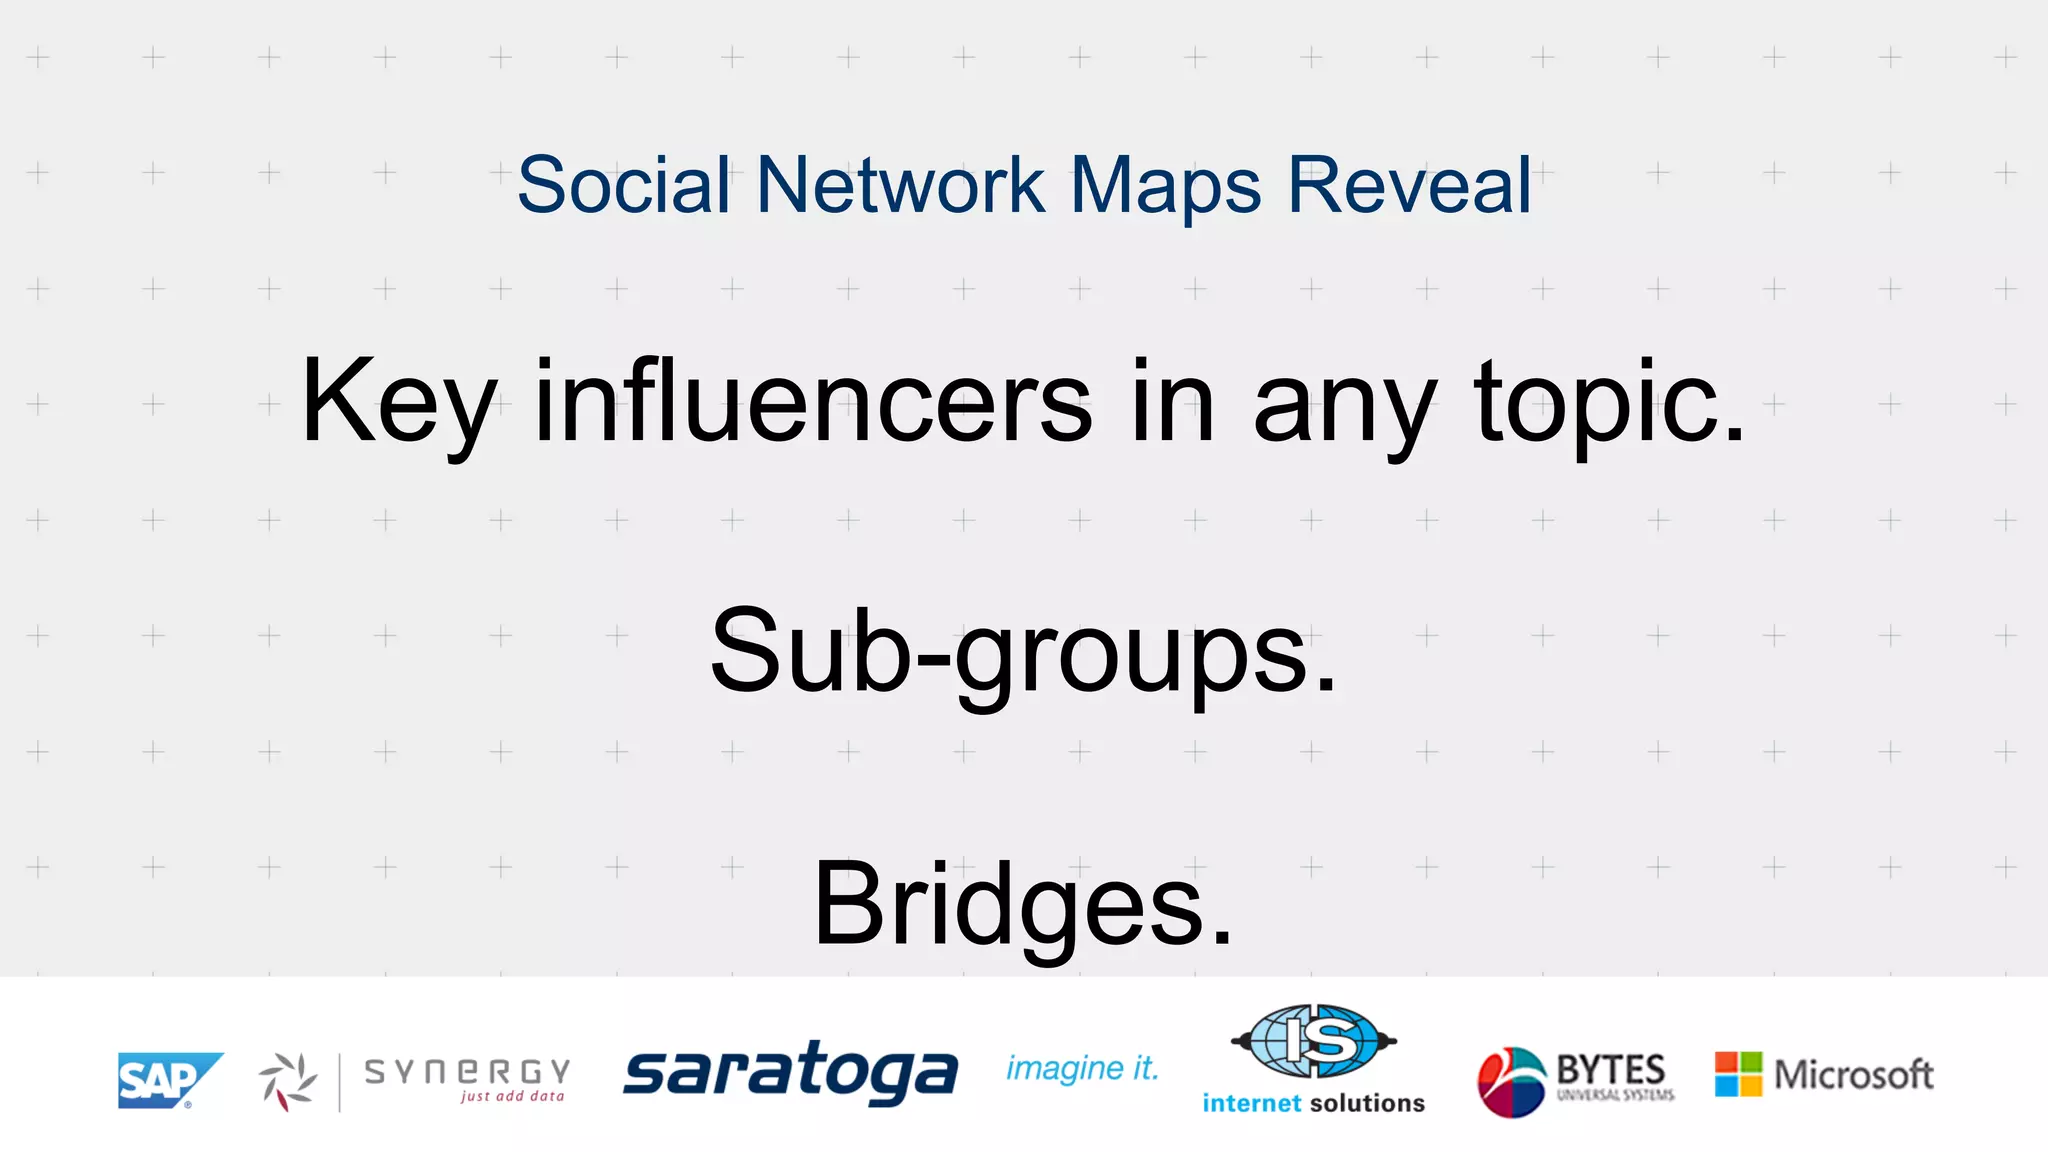
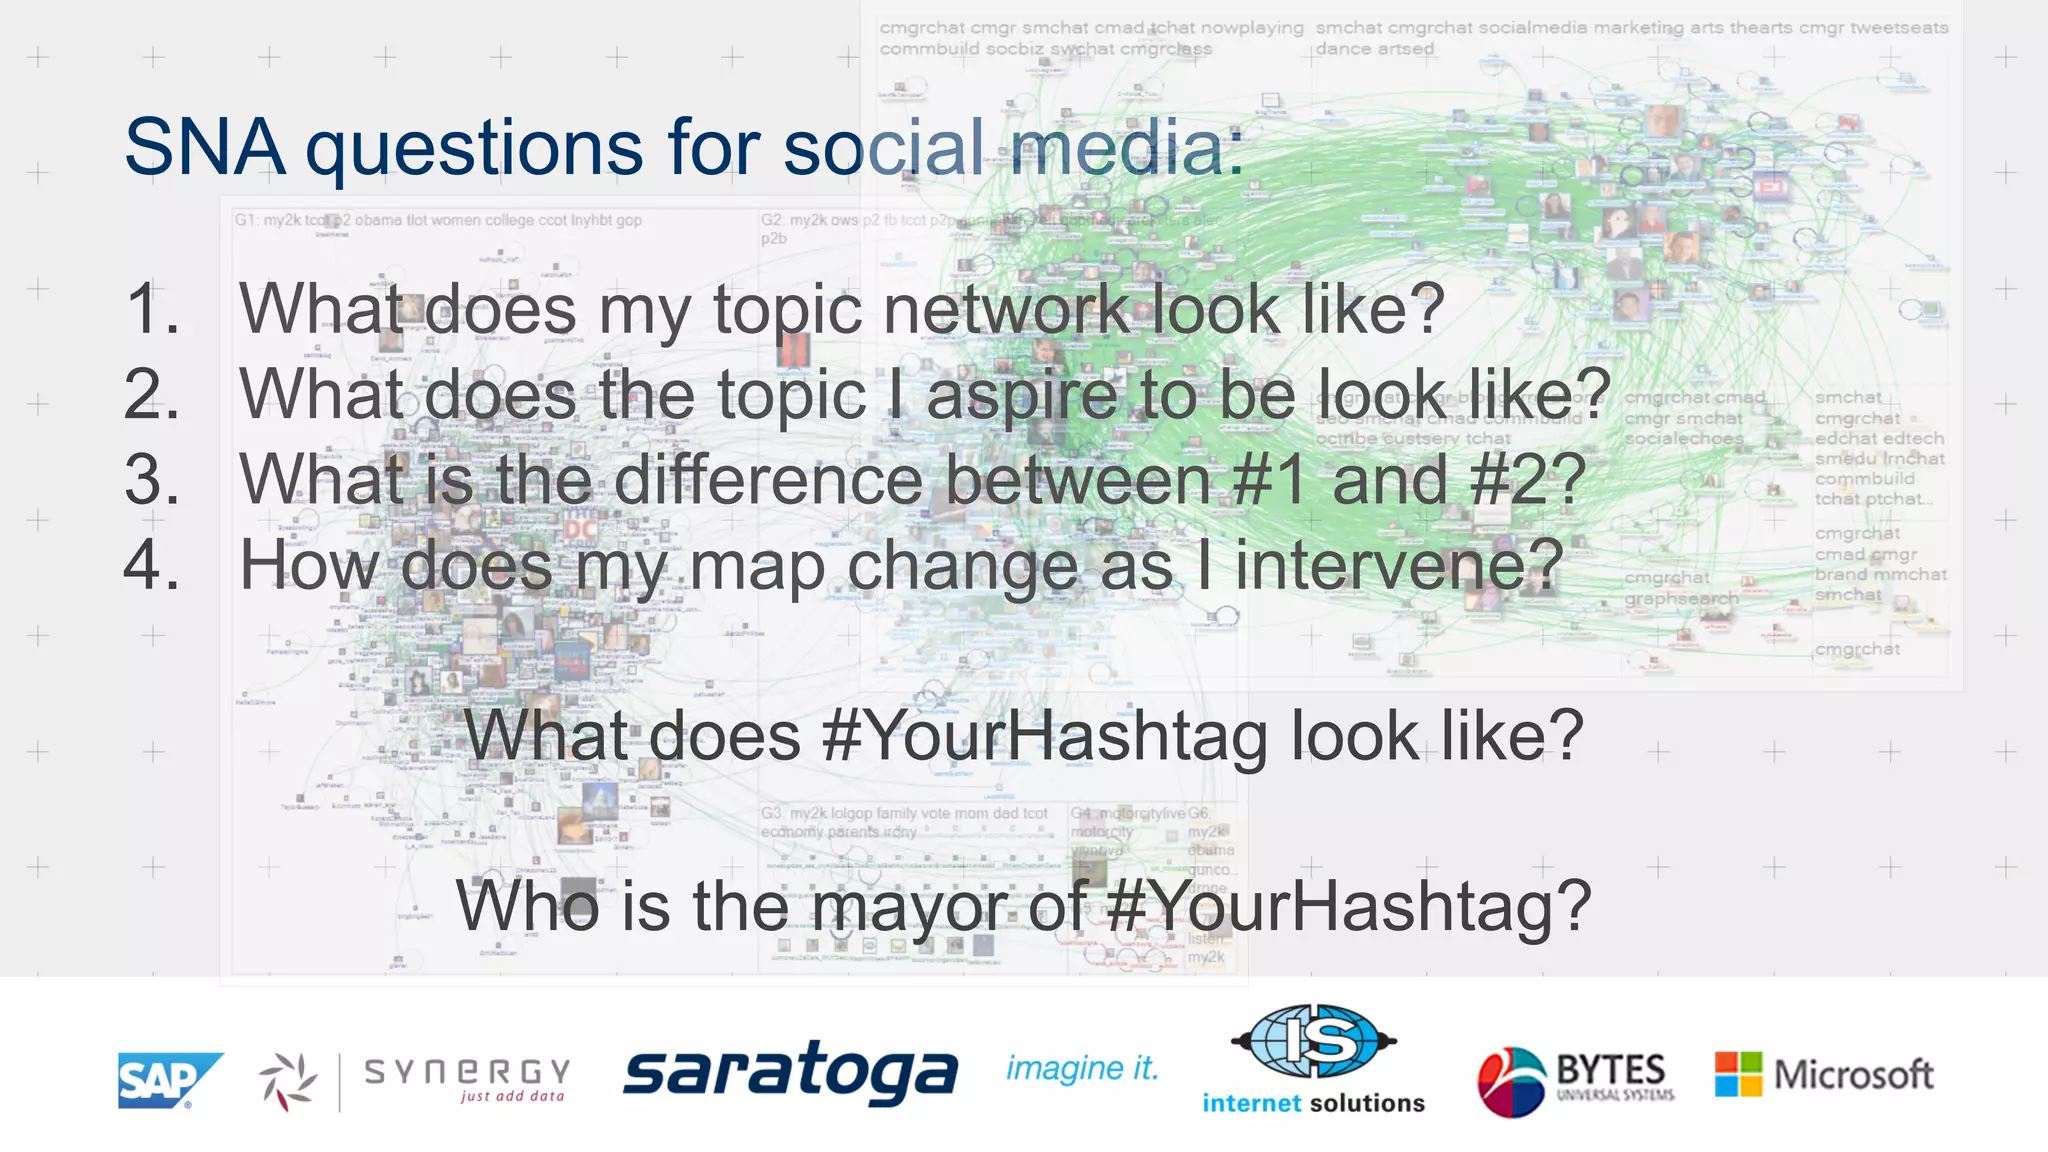
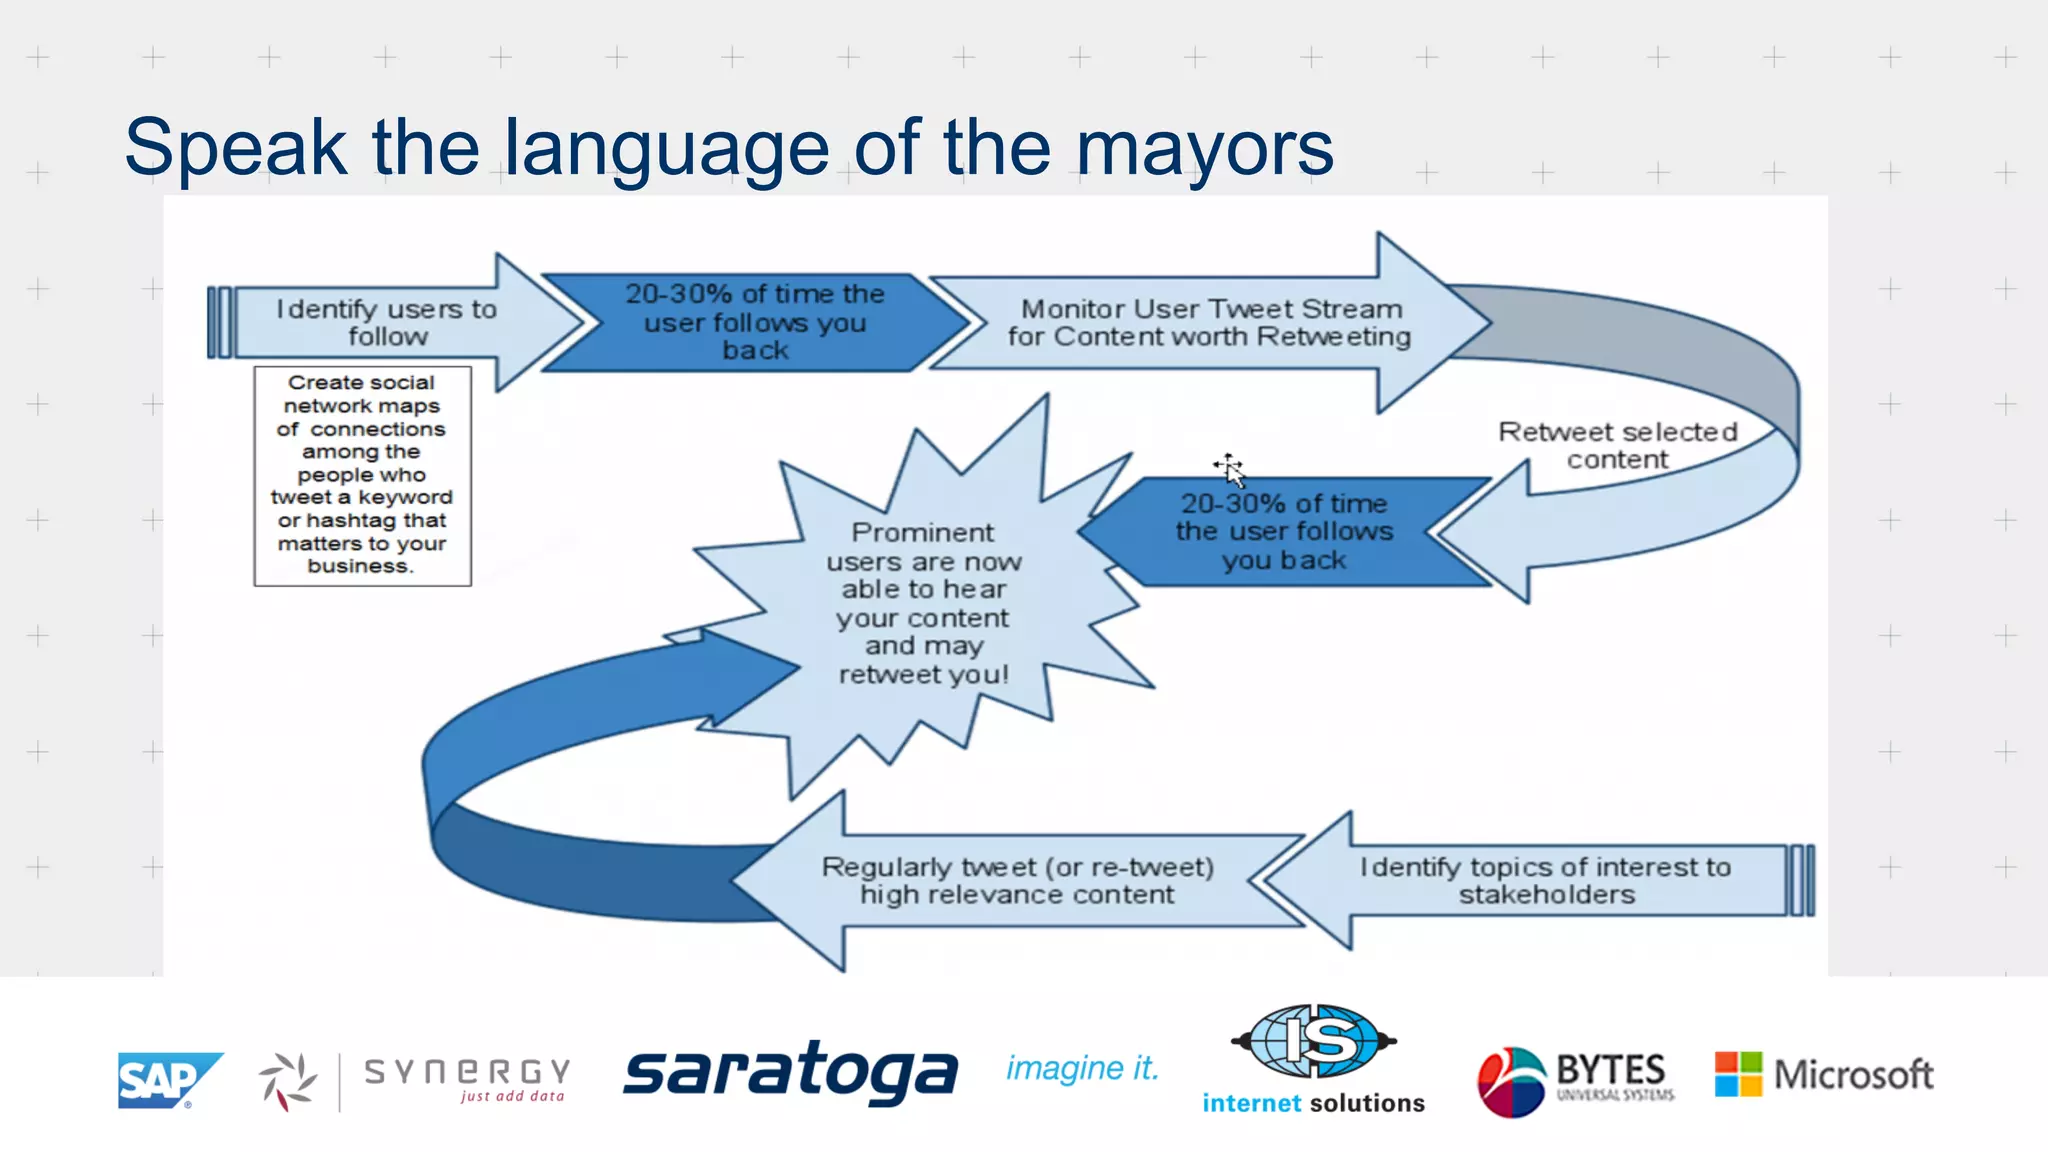
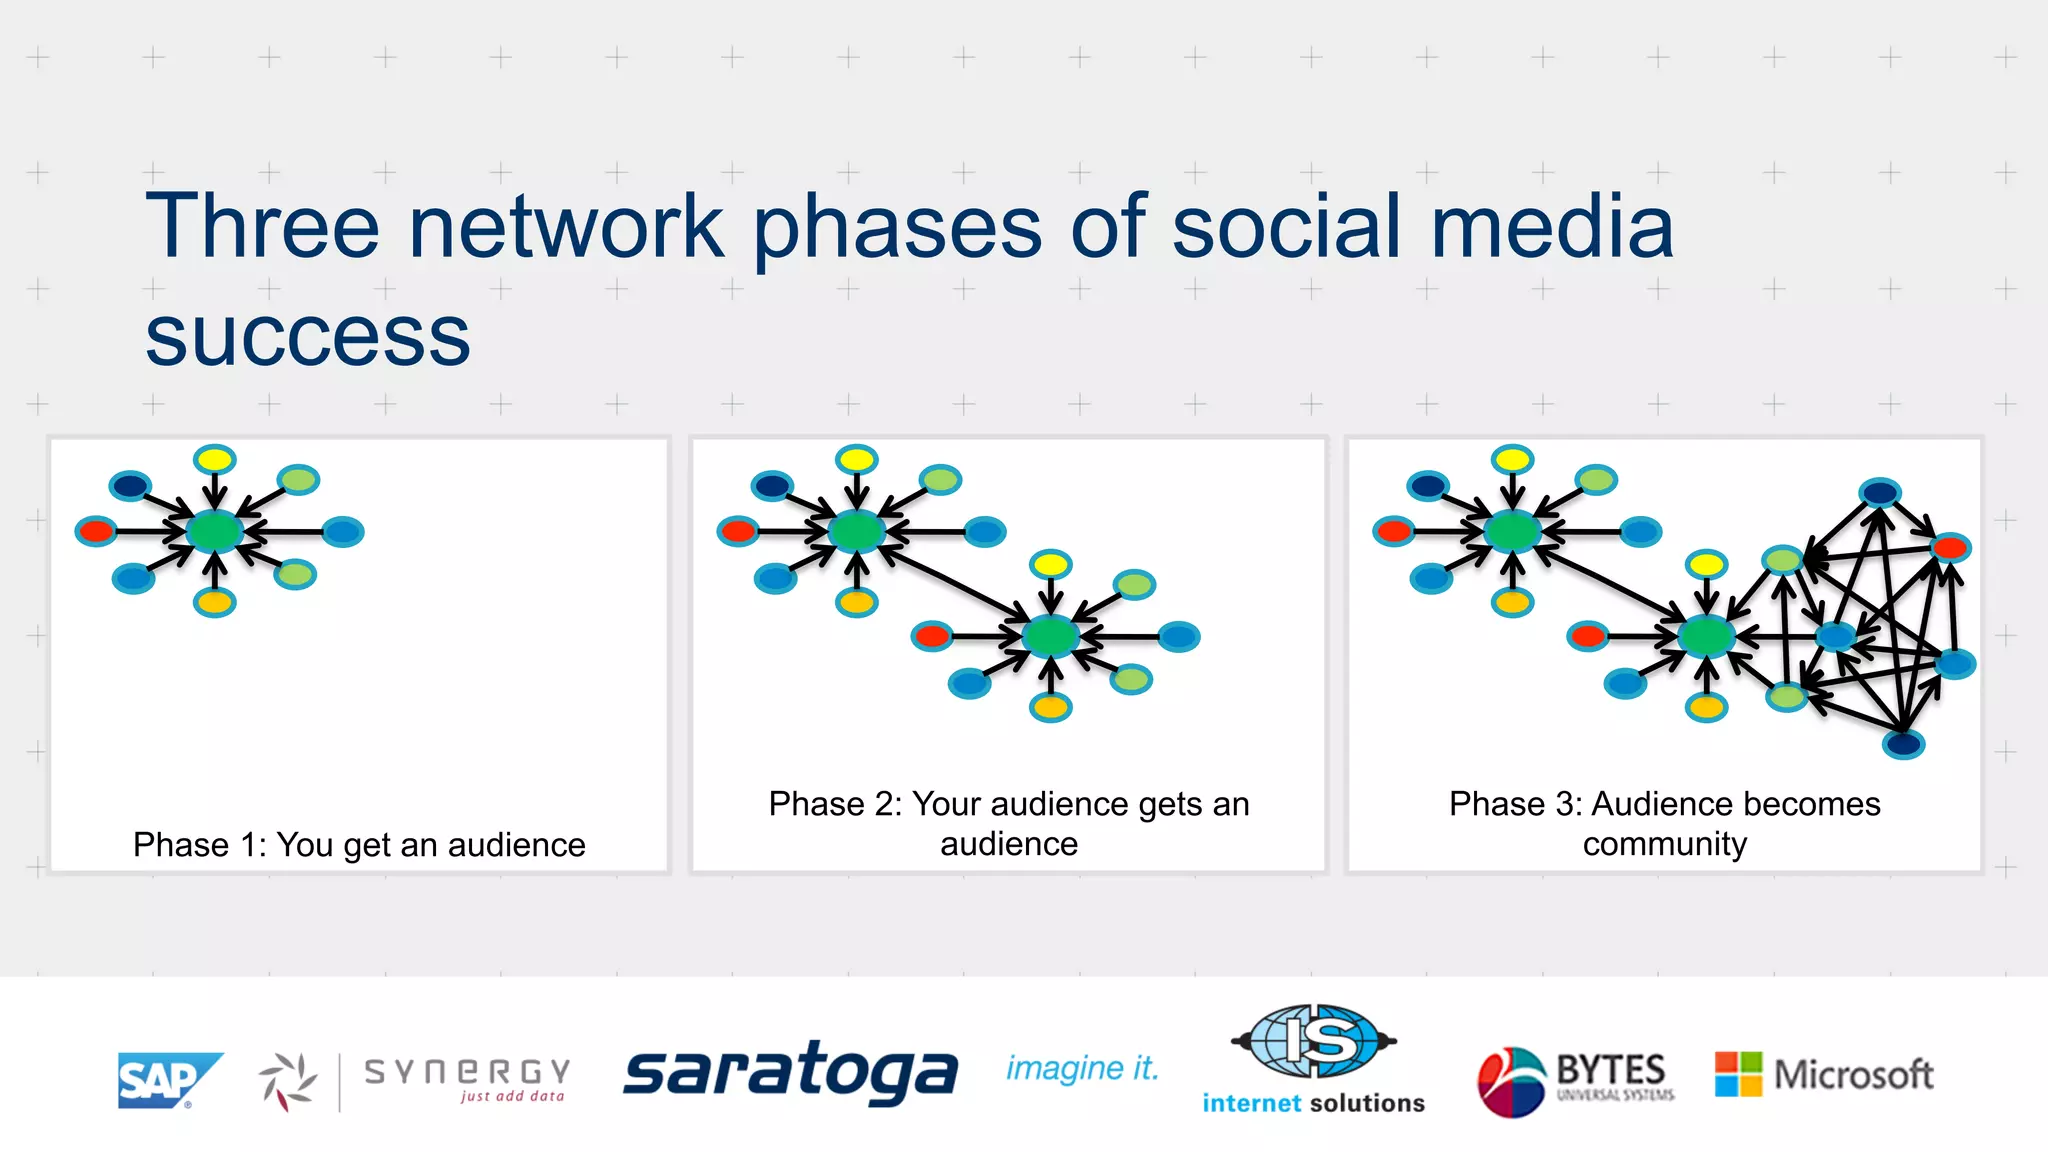
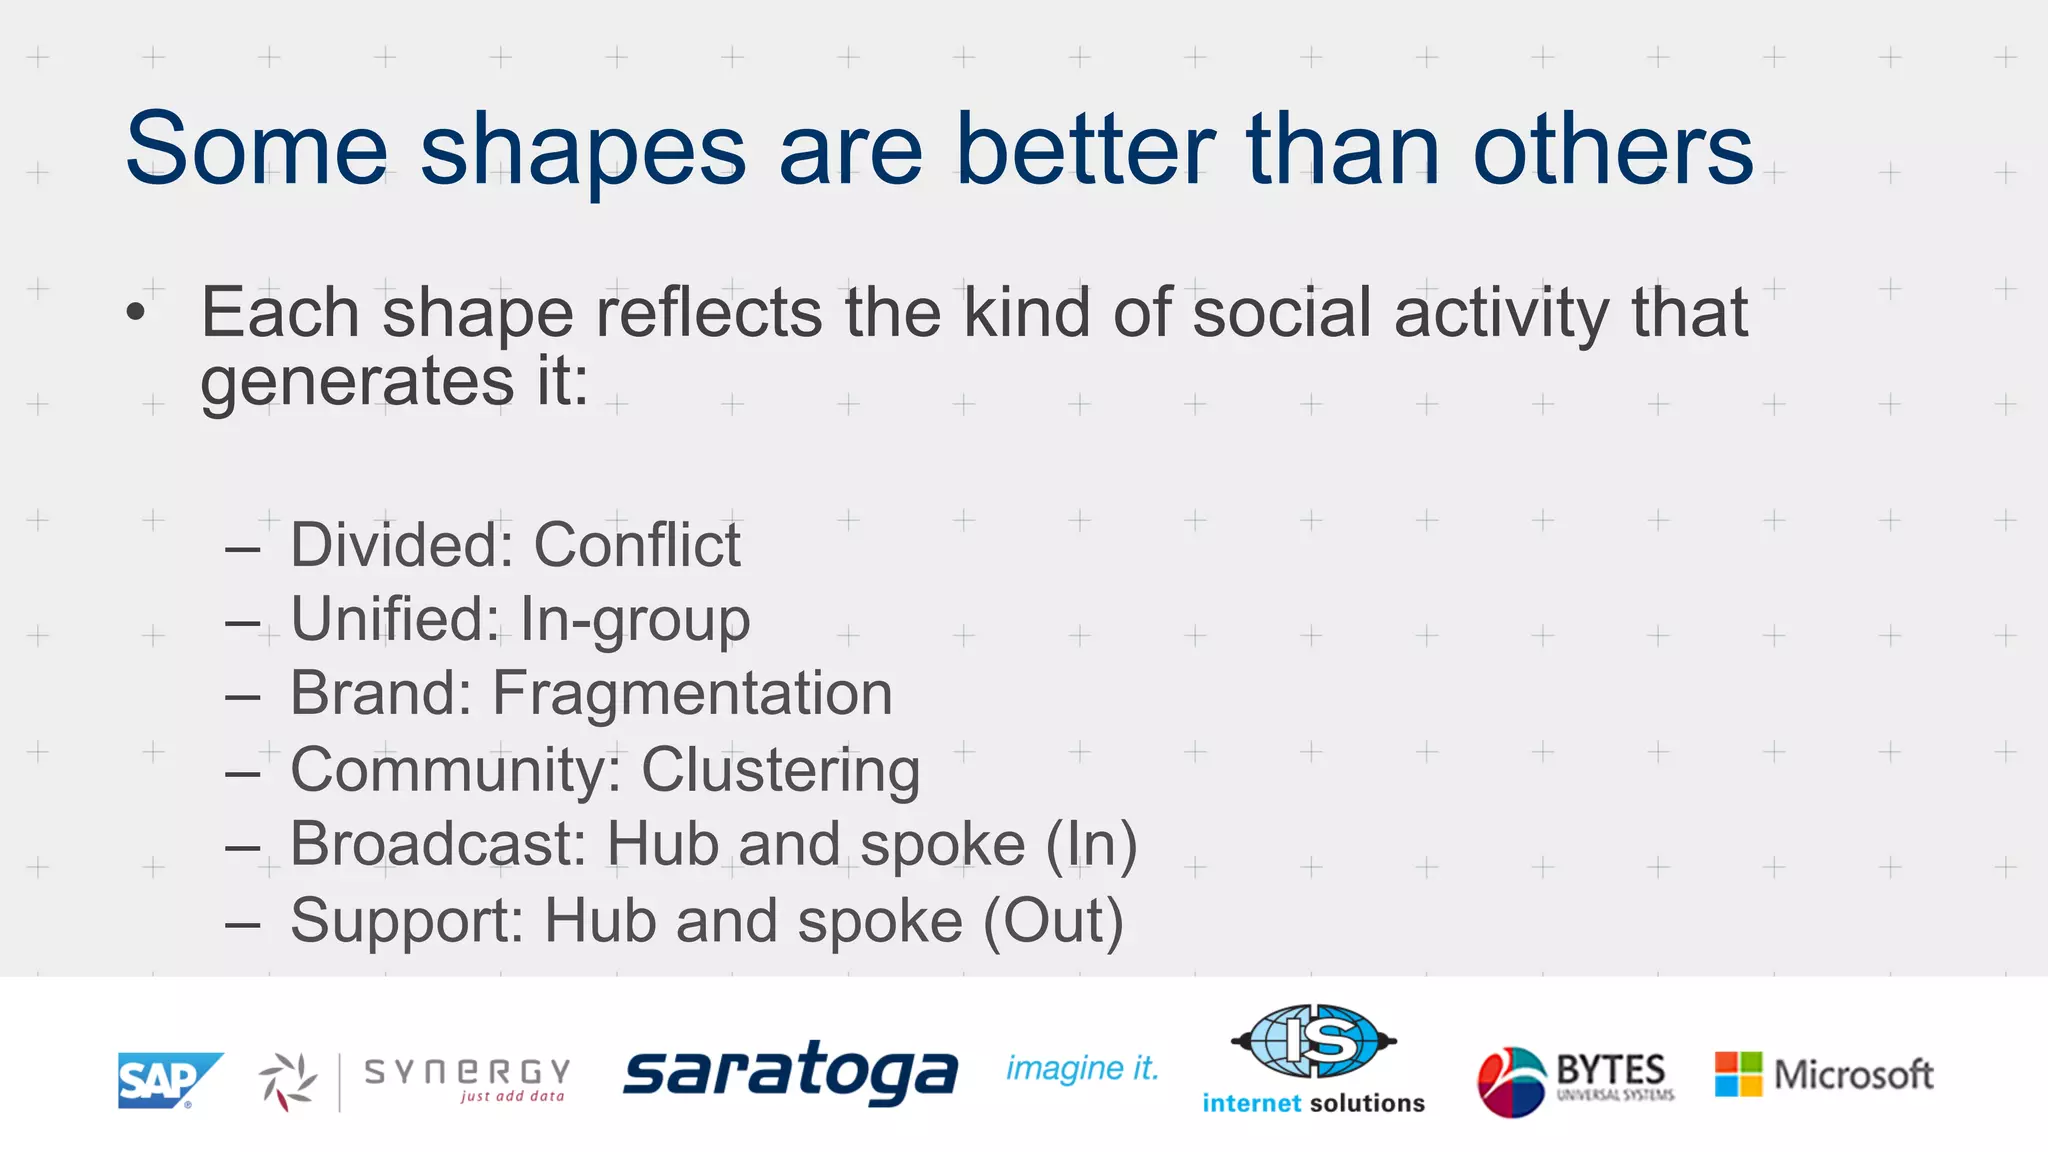
Marc Smith discusses social network analysis of social media data. He outlines six types of social media networks: polarized crowds, tight crowds, brand clusters, community clusters, broadcast networks, and support networks. Each network type reflects different social dynamics. Smith advocates using social network mapping tools like NodeXL to analyze topics on social media to identify influential users, subgroups, and opportunities for shaping conversations.


![[Redis Released]- FalkorDB - Redis + Graph Agentic Memory’s Secret Sauce](https://cdn.slidesharecdn.com/ss_thumbnails/redisreleased-falkordbslidedeck-1125-251115194922-e1c0046b-thumbnail.jpg?width=640&height=640&fit=bounds)


