Download as PDF, PPTX

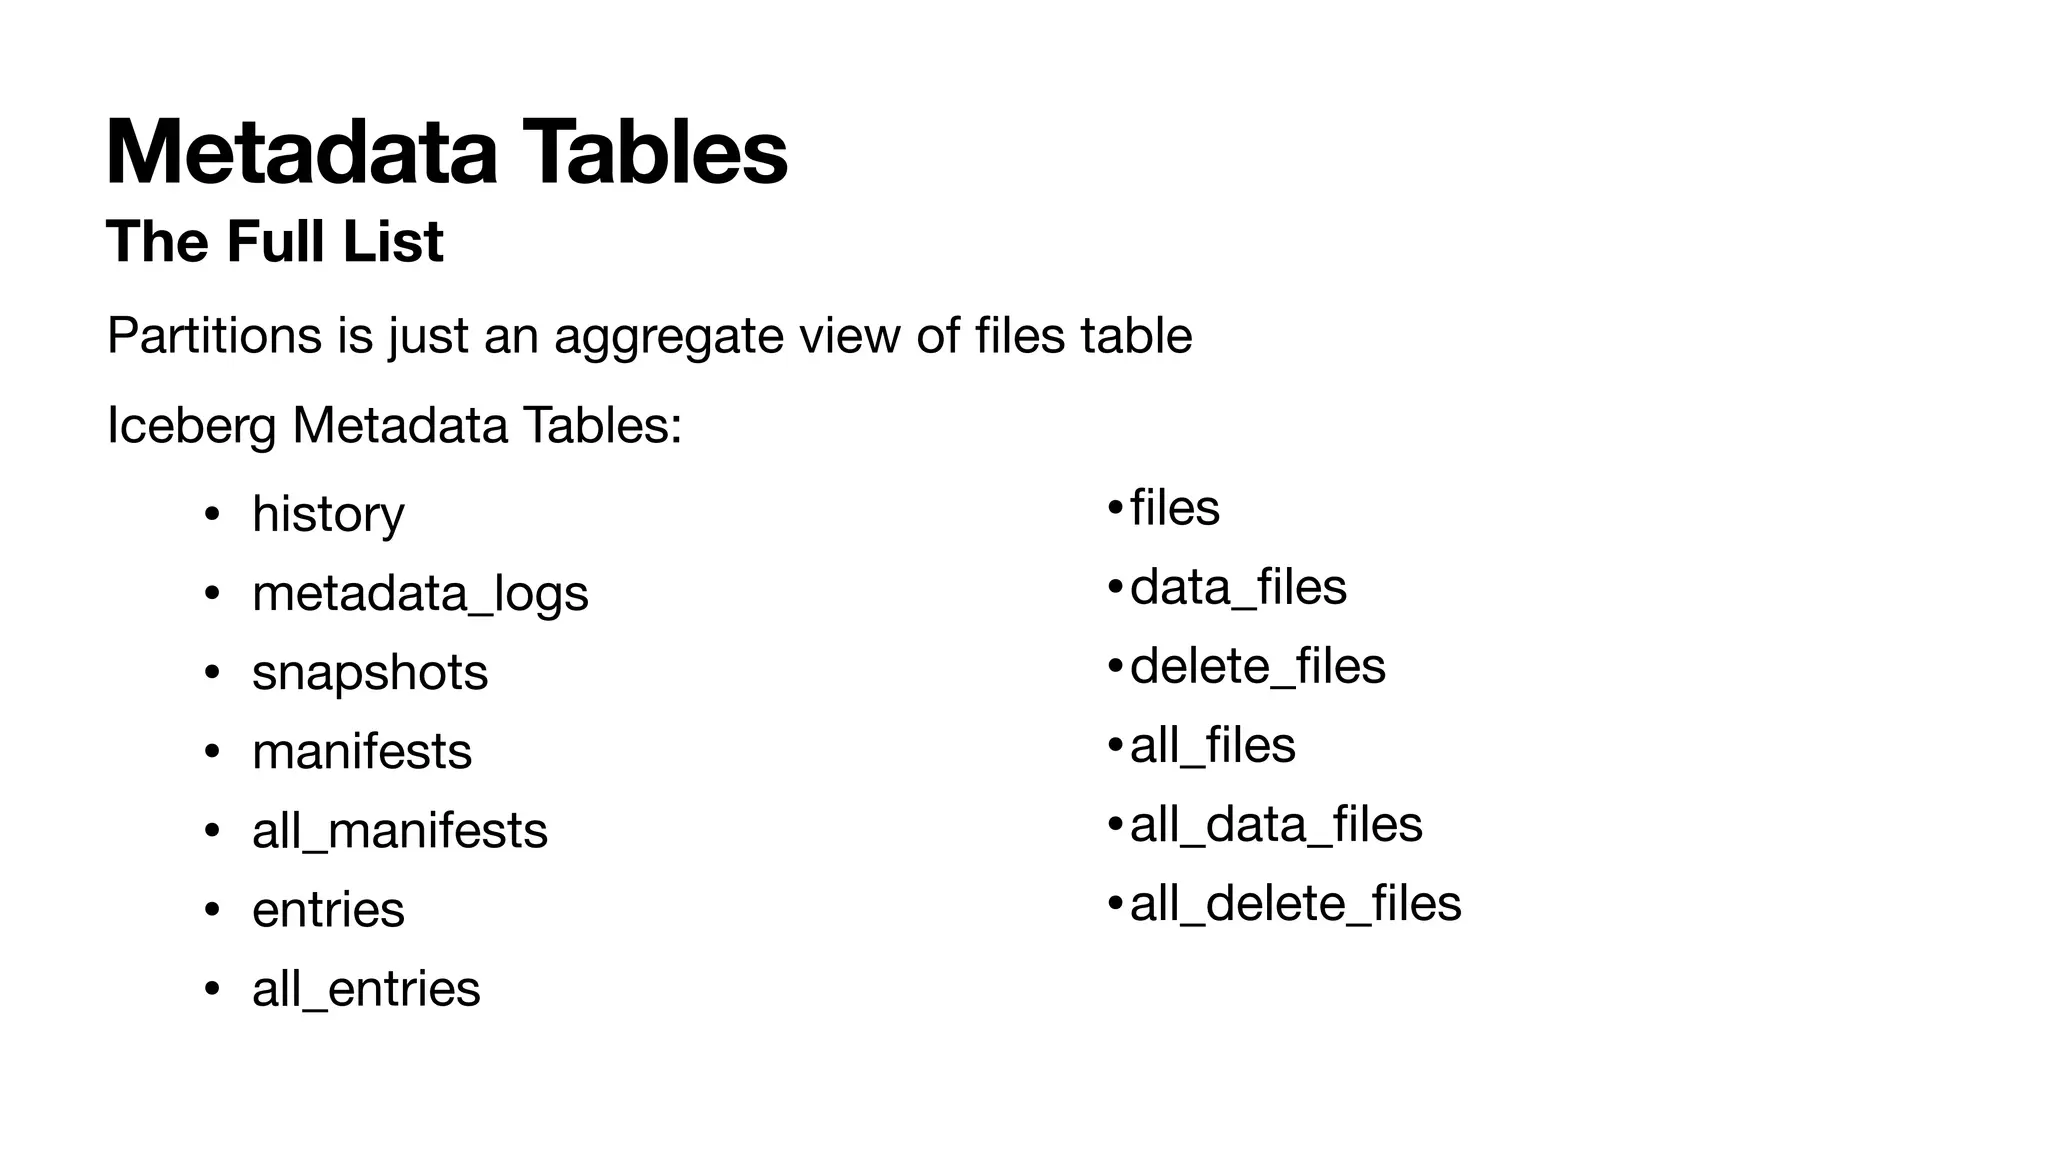
![Beyond Iceberg
• Measuring a system data completeness and latency is typically hard, but becomes do-able in Iceberg
• Incoming Dataset from Flink:
• (data string, event_time timestamp) partitioned by hour (event_time)
// Data Latency with custom UDF for calcuating time di
ff
erence.
// Will be easier with readable_metrics column
SELECT max(di
ff
(entries.data_
fi
le.lower_bounds[1], hour(snapshots.committed_at)) AS max_latency
FROM db.table.entries JOIN db.table.snapshots
ON entries.snapshot_id = snapshots.snapshot_id
GROUP BY entries.data_
fi
le.partition;
// Data Completeness
SELECT record_count AS received, partition
FROM db.table.partitions;
Use Case: Ingest Monitoring](https://image.slidesharecdn.com/02hoicebergsbestsecret-240925183022-7695fb64/75/Icebergs-Best-Secret-A-Guide-to-Metadata-Tables-20-2048.jpg)
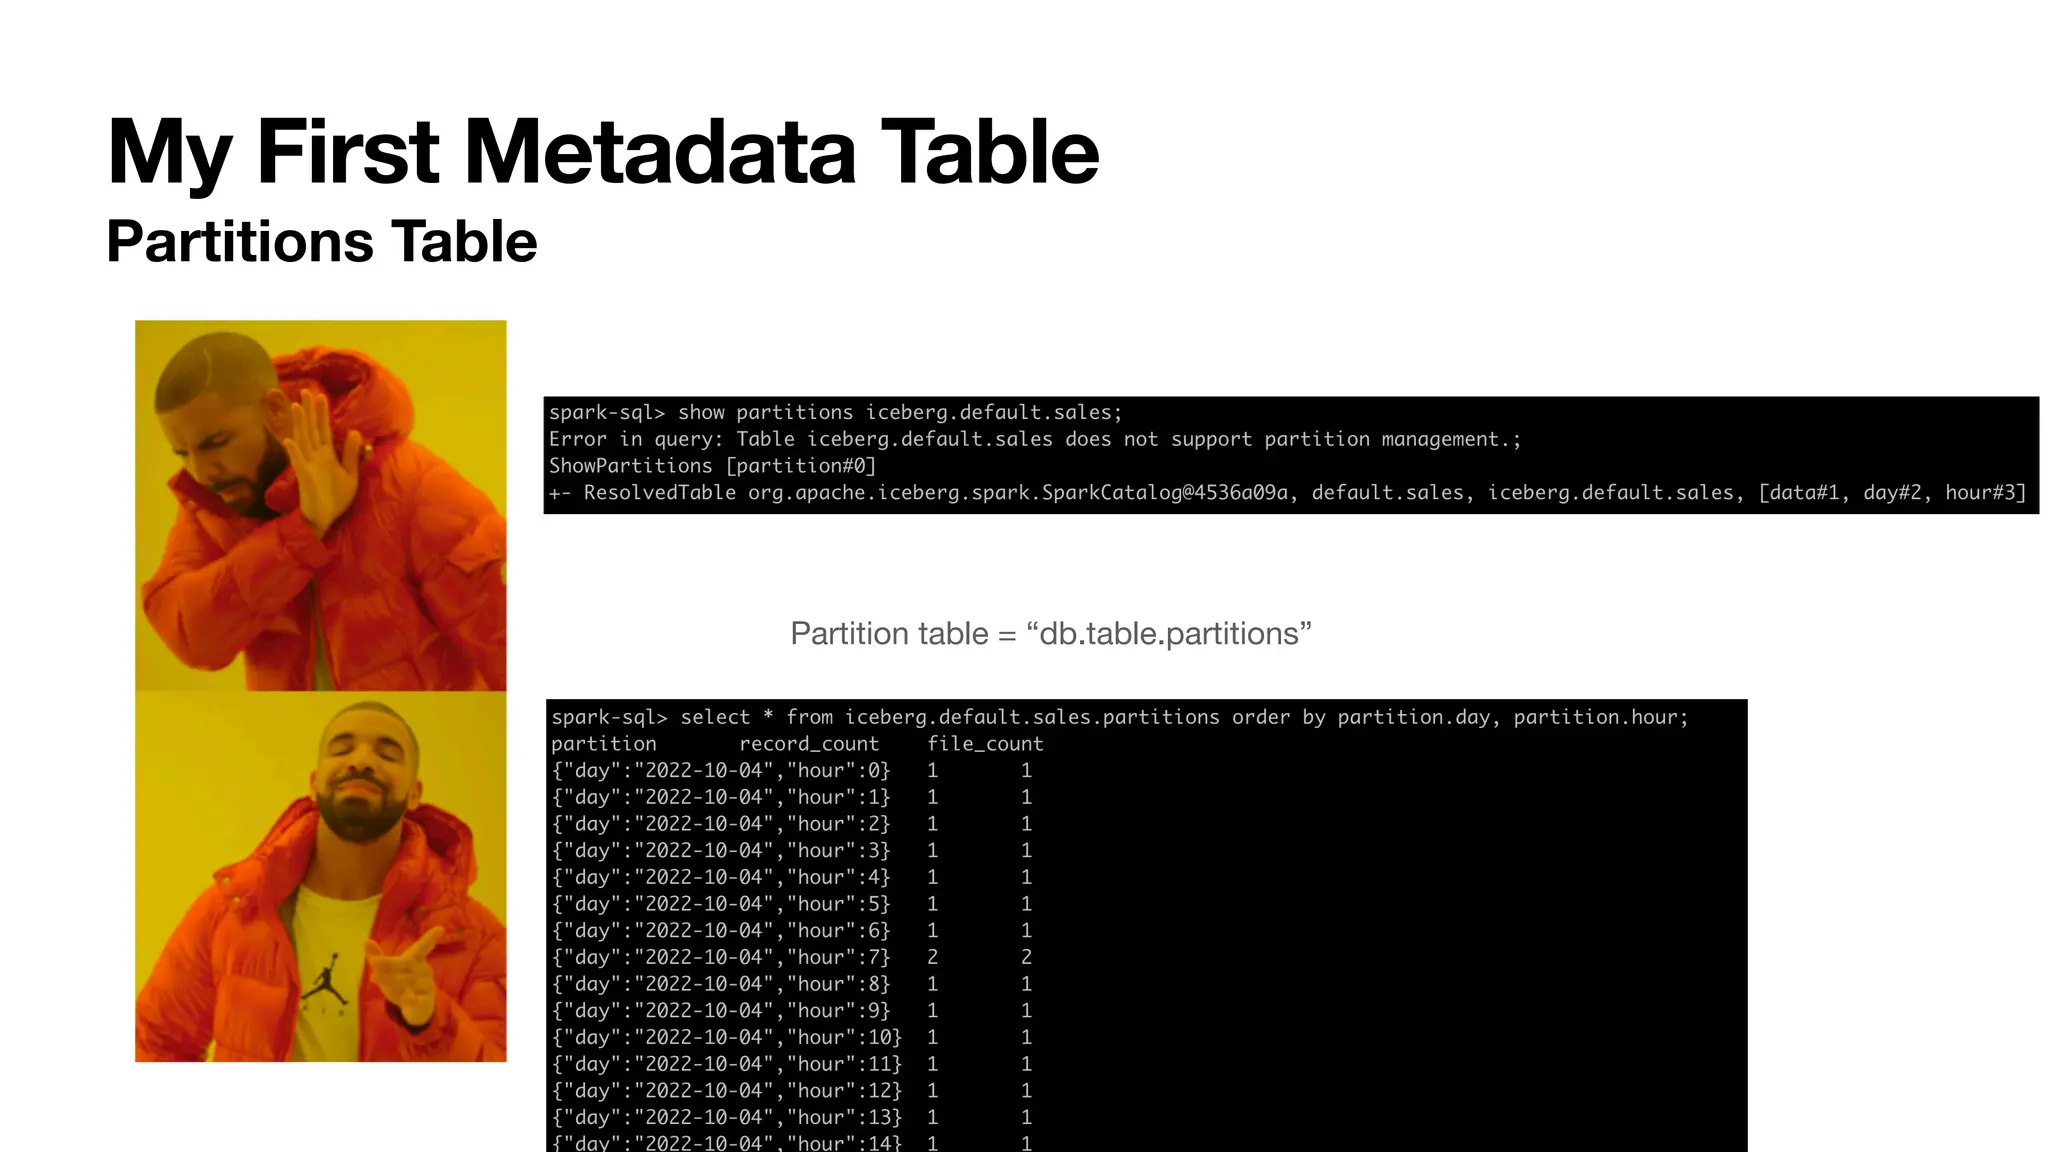
![Beyond Iceberg
Use Case: Data Quality Alerts
• Iceberg keeps interesting metrics per data
fi
le of every column:
• column_sizes
• value_counts
• null_values
• nan_values
• lower_bounds
• upper_bounds
• Can create alerts for partitions with nan_values
Select partition, (sum(to_int(
fi
les.nan_values[0])) AS nan_values
FROM db.table.
fi
les
GROUP BY
fi
les.partition](https://image.slidesharecdn.com/02hoicebergsbestsecret-240925183022-7695fb64/75/Icebergs-Best-Secret-A-Guide-to-Metadata-Tables-21-2048.jpg)


![Beyond Iceberg
• Measuring a system data completeness and latency is typically hard, but becomes do-able in Iceberg
• Incoming Dataset from Flink:
• (data string, event_time timestamp) partitioned by hour (event_time)
// Data Latency with custom UDF for calcuating time di
ff
erence.
// Will be easier with readable_metrics column
SELECT max(di
ff
(entries.data_
fi
le.lower_bounds[1], hour(snapshots.committed_at)) AS max_latency
FROM db.table.entries JOIN db.table.snapshots
ON entries.snapshot_id = snapshots.snapshot_id
GROUP BY entries.data_
fi
le.partition;
// Data Completeness
SELECT record_count AS received, partition
FROM db.table.partitions;
Use Case: Ingest Monitoring](https://crownmelresort.com/image.slidesharecdn.com/02hoicebergsbestsecret-240925183022-7695fb64/75/Icebergs-Best-Secret-A-Guide-to-Metadata-Tables-20-2048.jpg)
![Beyond Iceberg
Use Case: Data Quality Alerts
• Iceberg keeps interesting metrics per data
fi
le of every column:
• column_sizes
• value_counts
• null_values
• nan_values
• lower_bounds
• upper_bounds
• Can create alerts for partitions with nan_values
Select partition, (sum(to_int(
fi
les.nan_values[0])) AS nan_values
FROM db.table.
fi
les
GROUP BY
fi
les.partition](https://crownmelresort.com/image.slidesharecdn.com/02hoicebergsbestsecret-240925183022-7695fb64/75/Icebergs-Best-Secret-A-Guide-to-Metadata-Tables-21-2048.jpg)


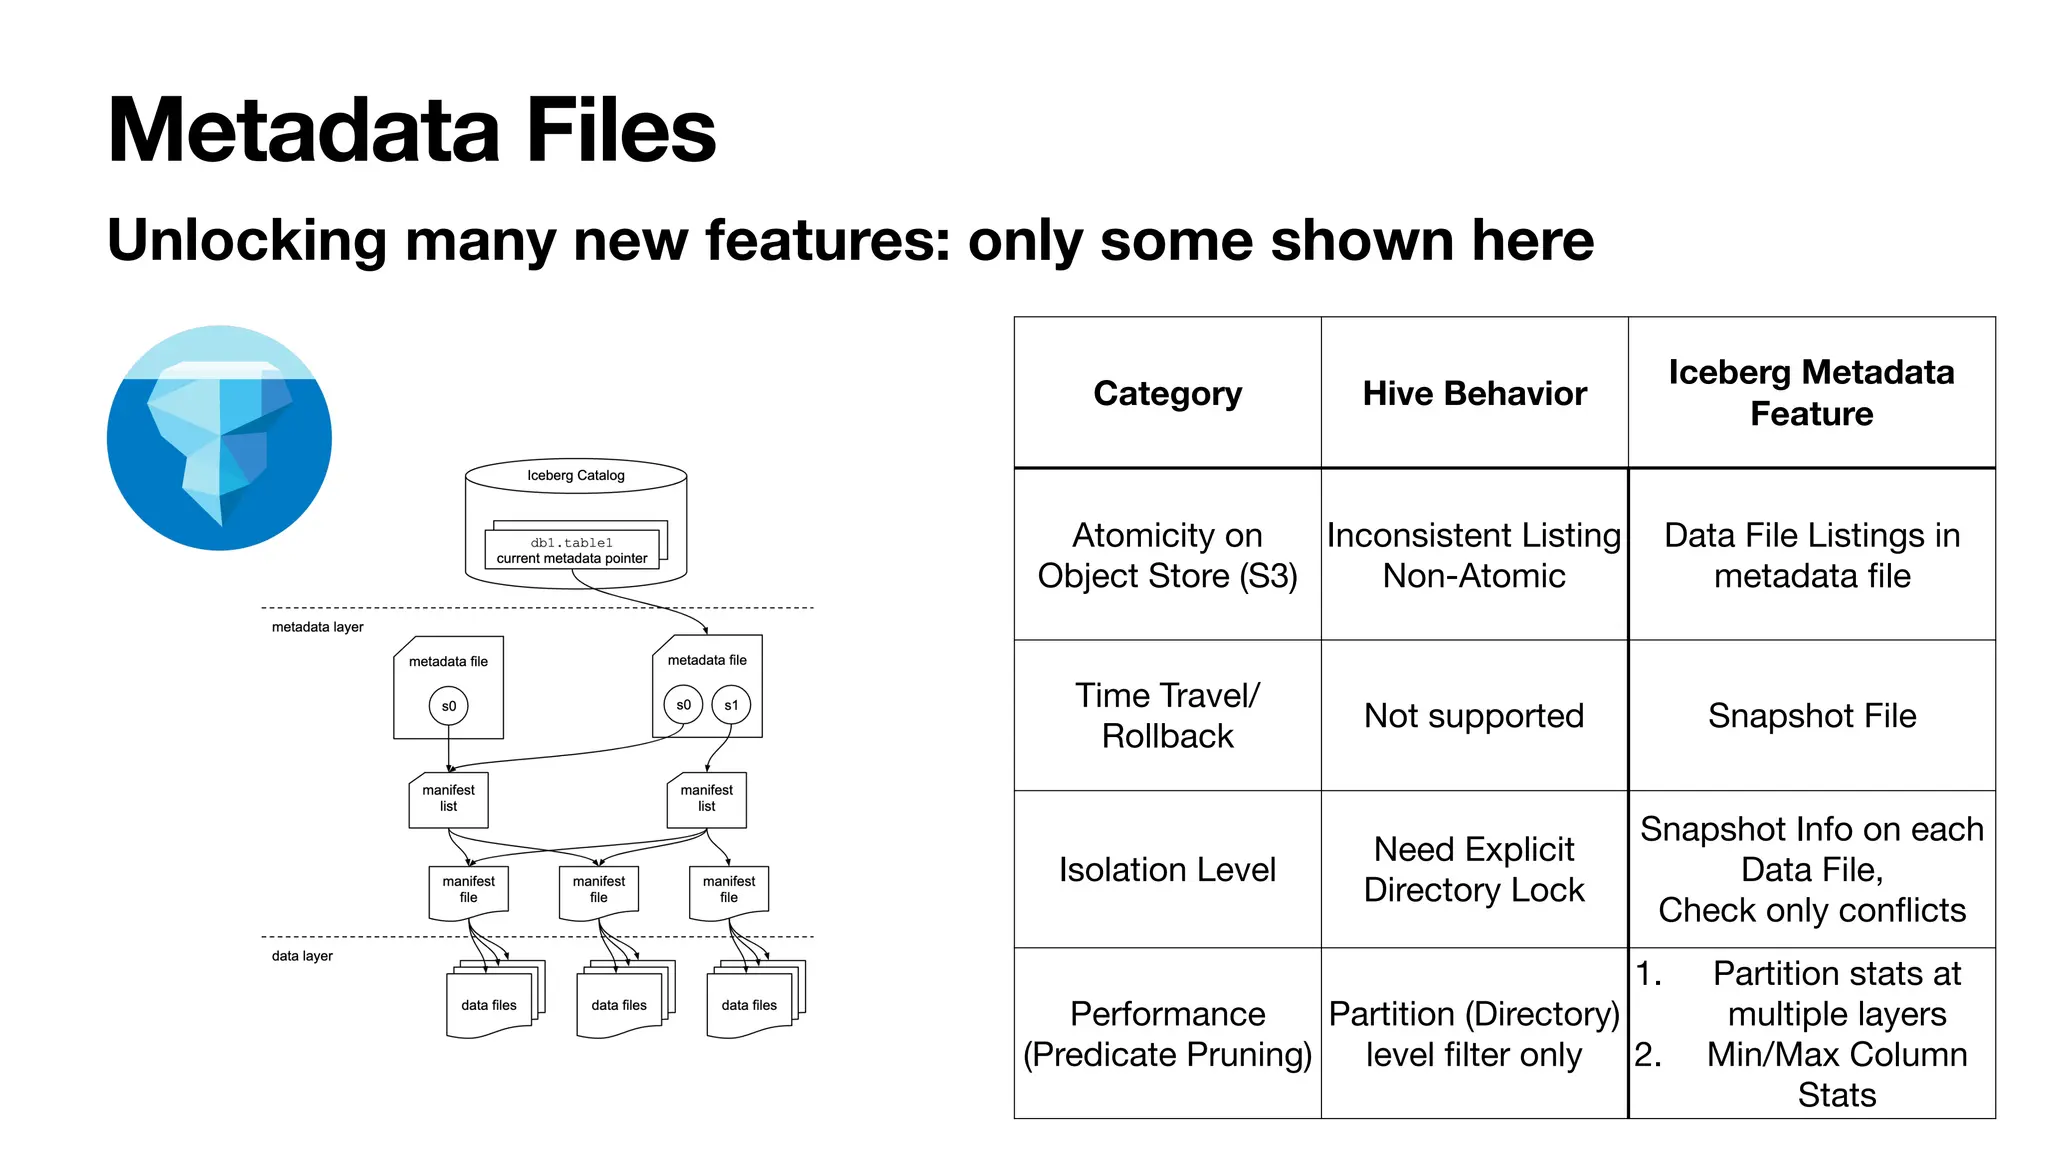
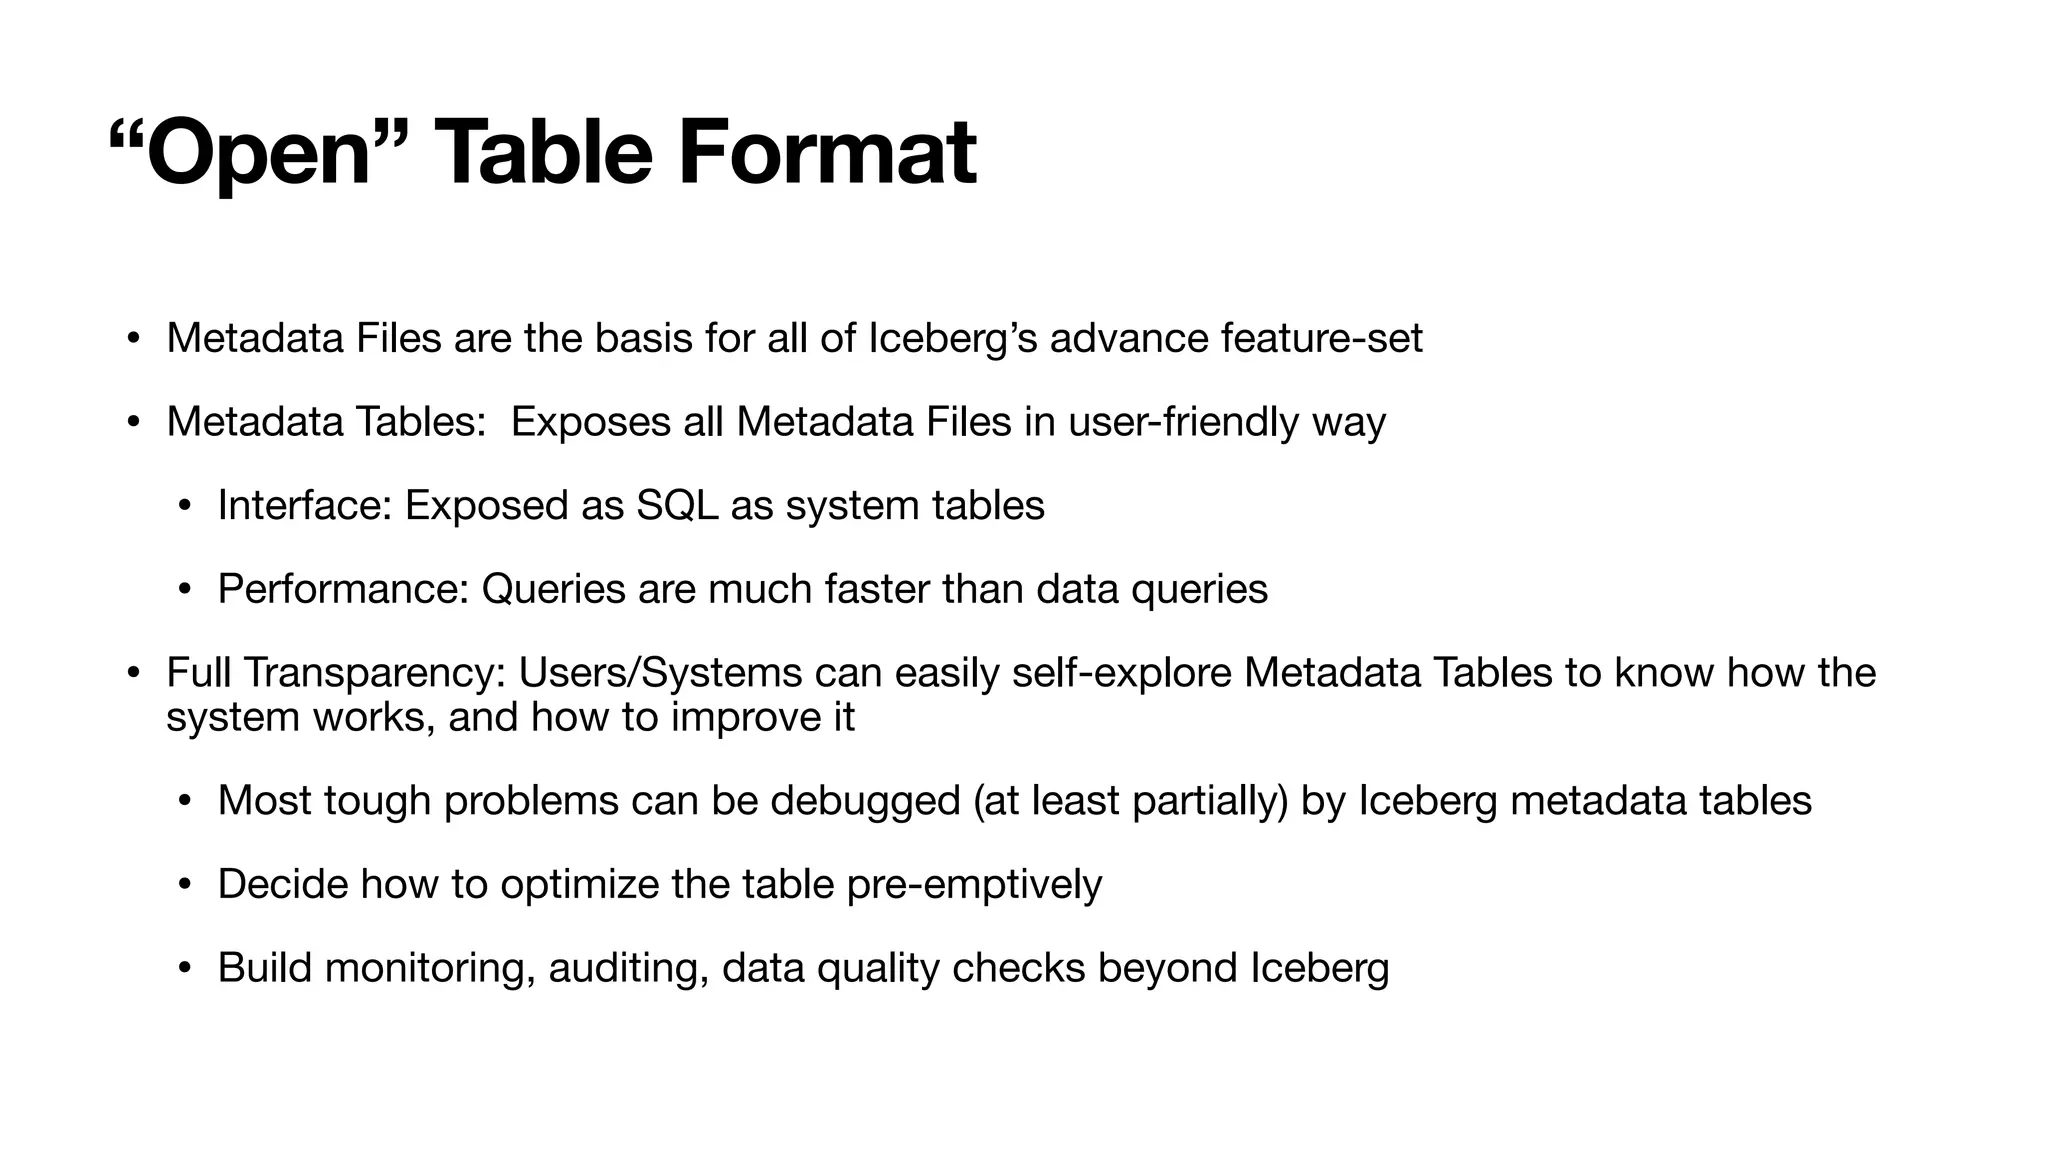
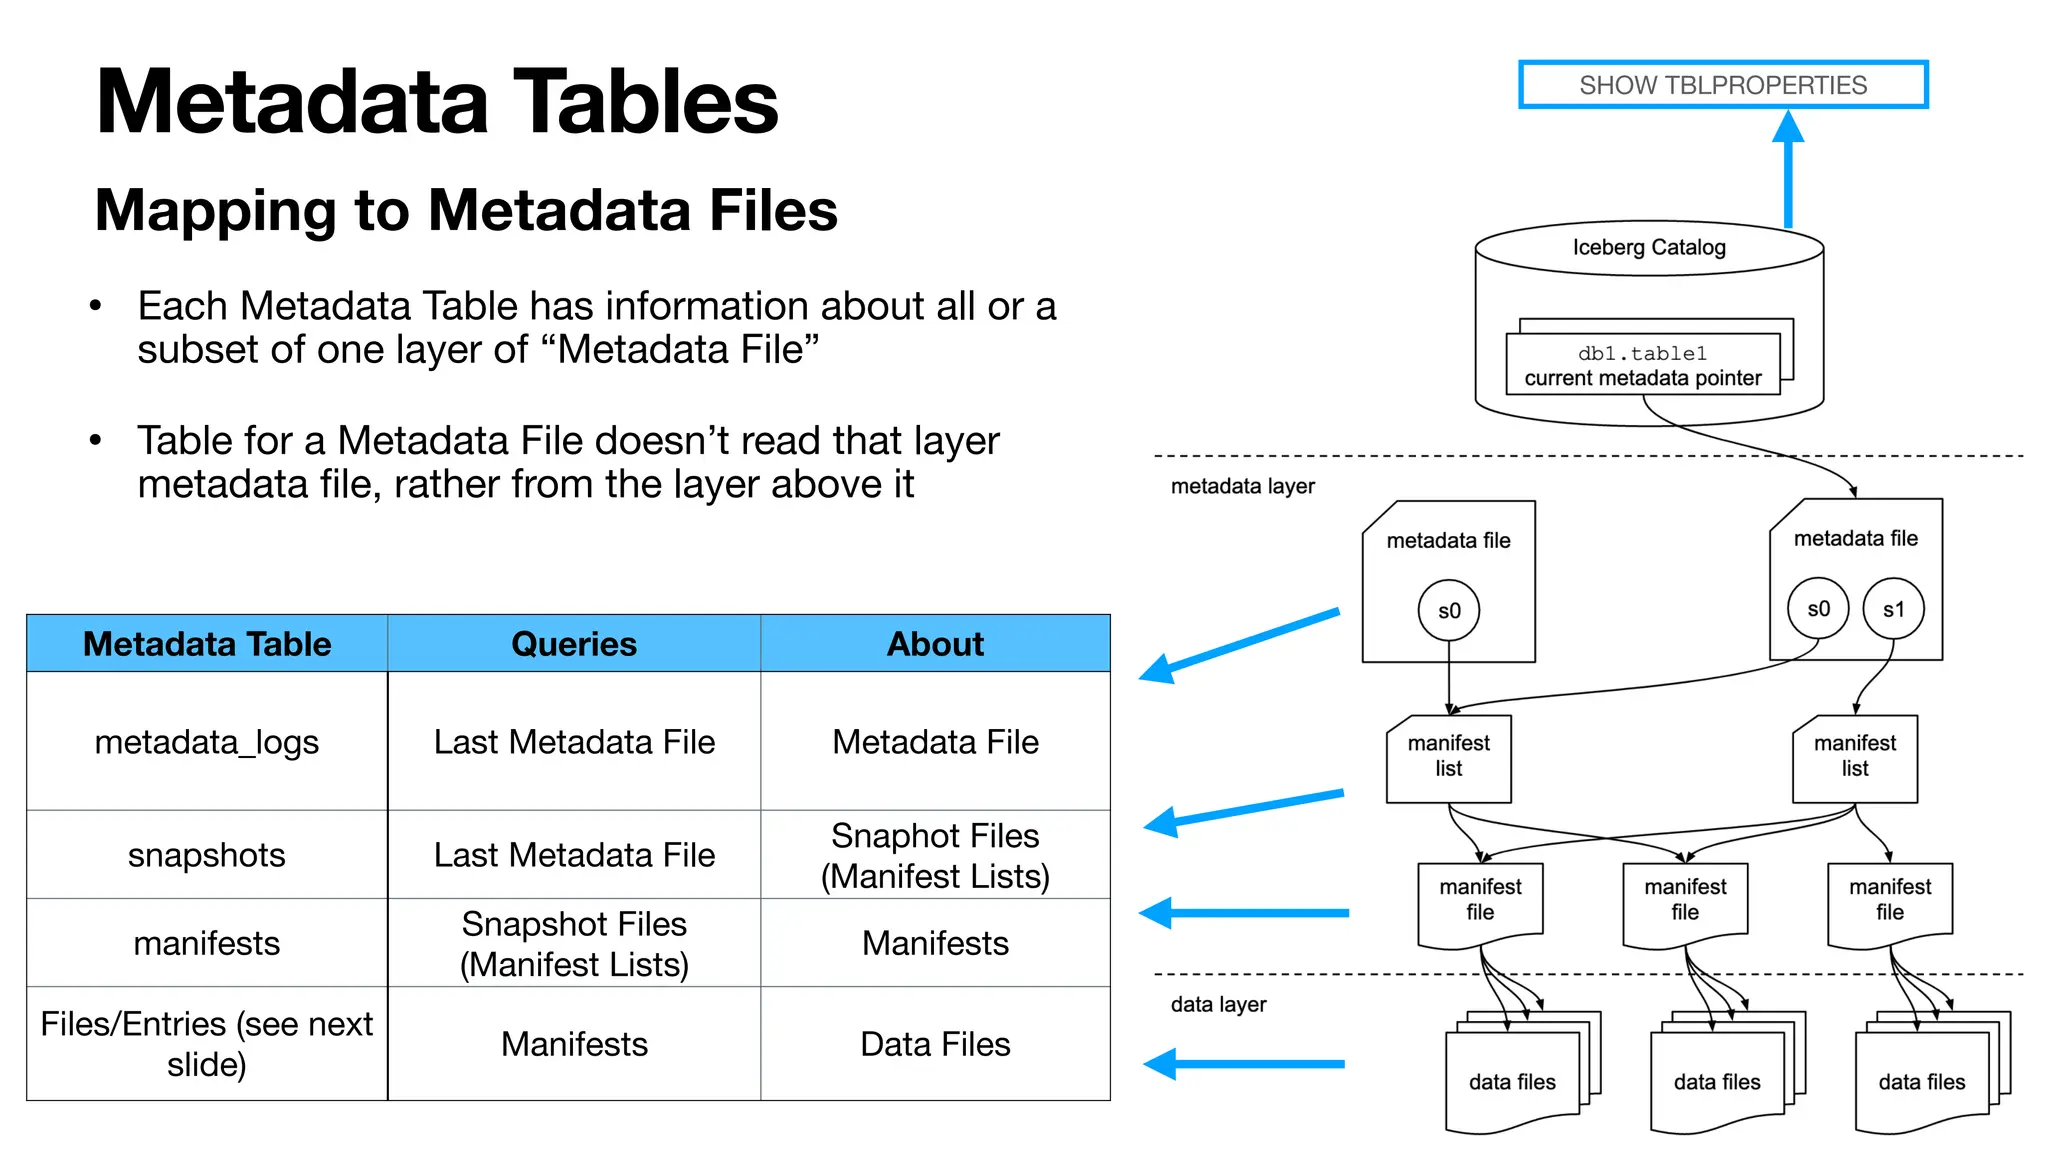
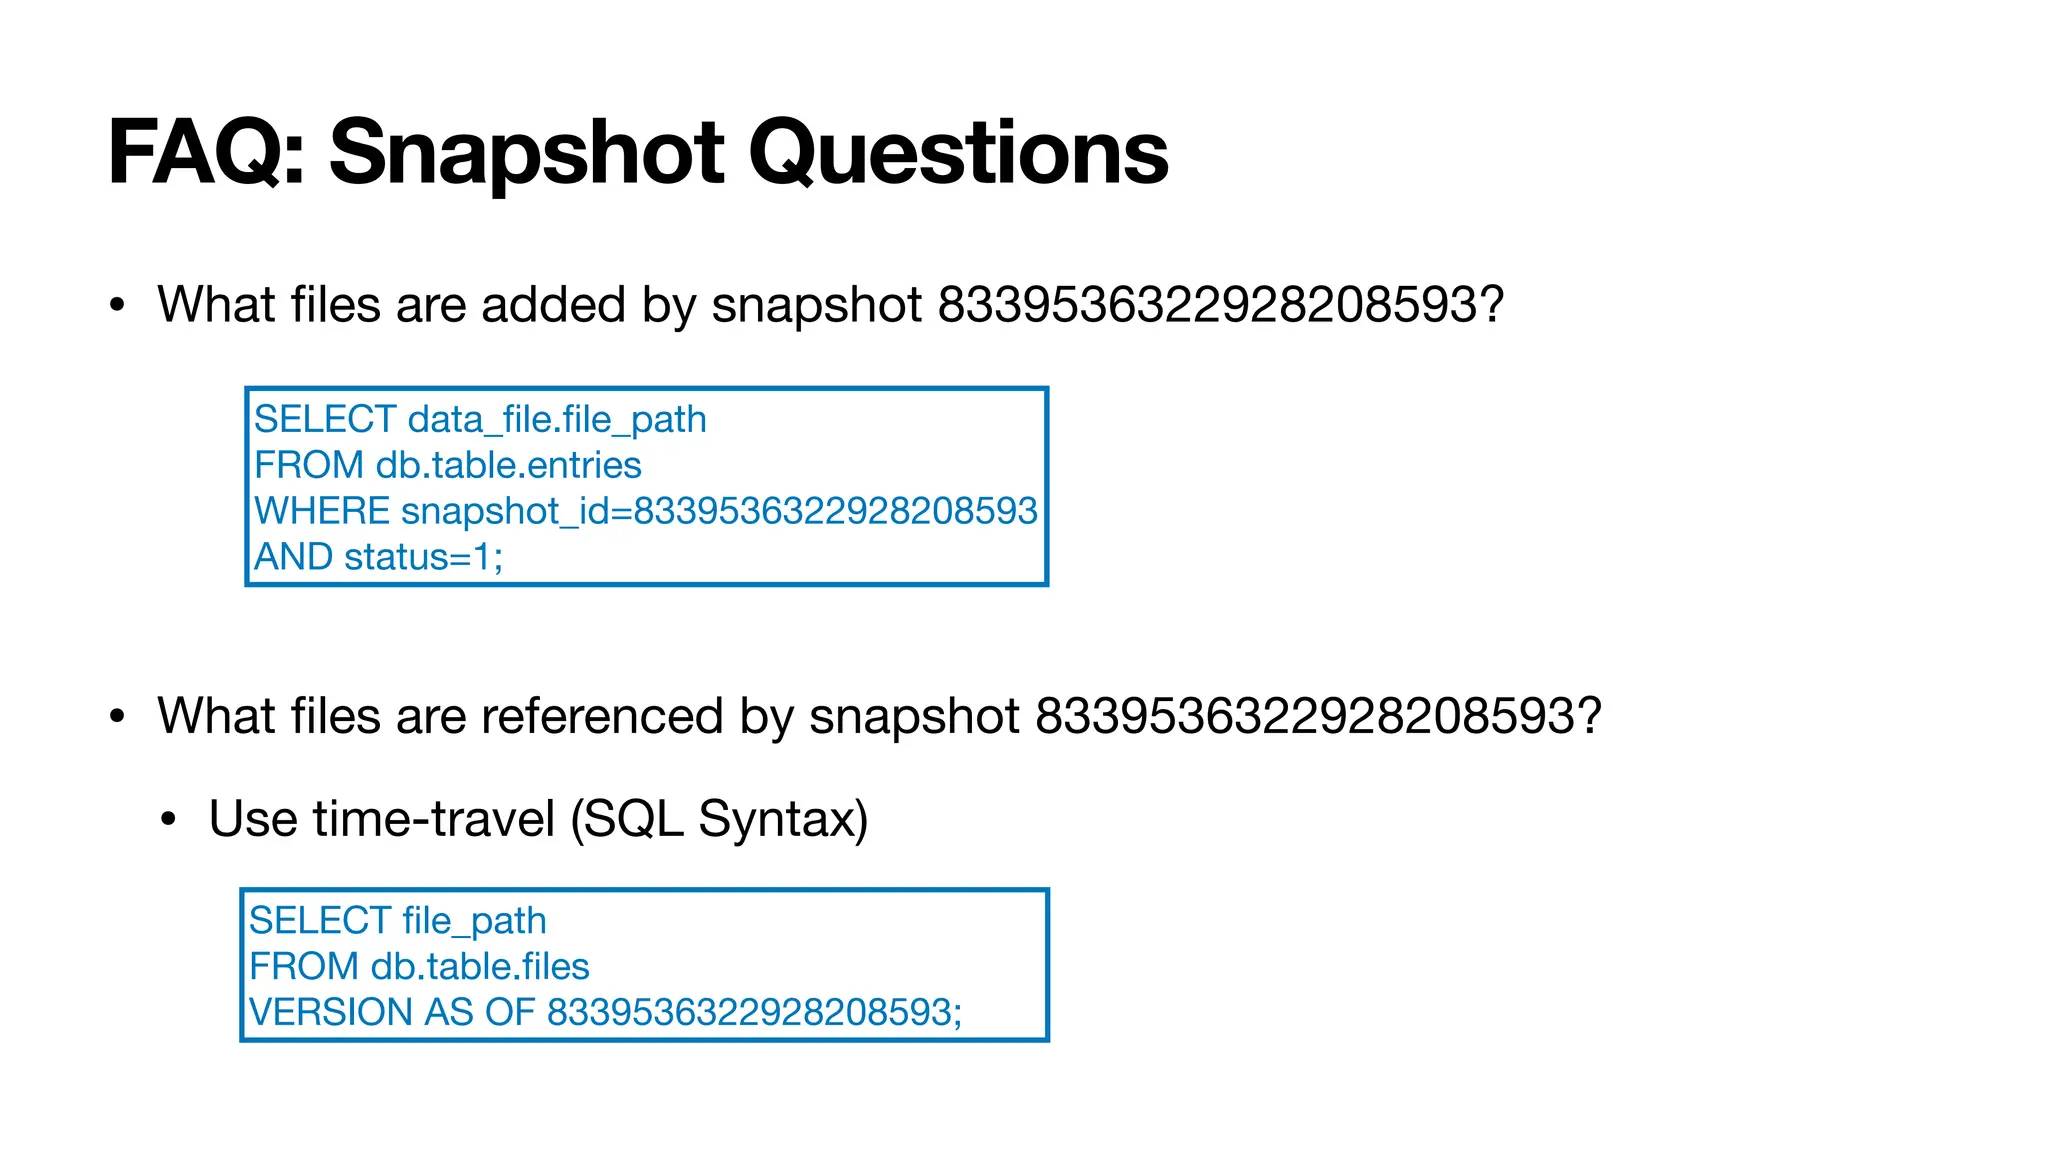
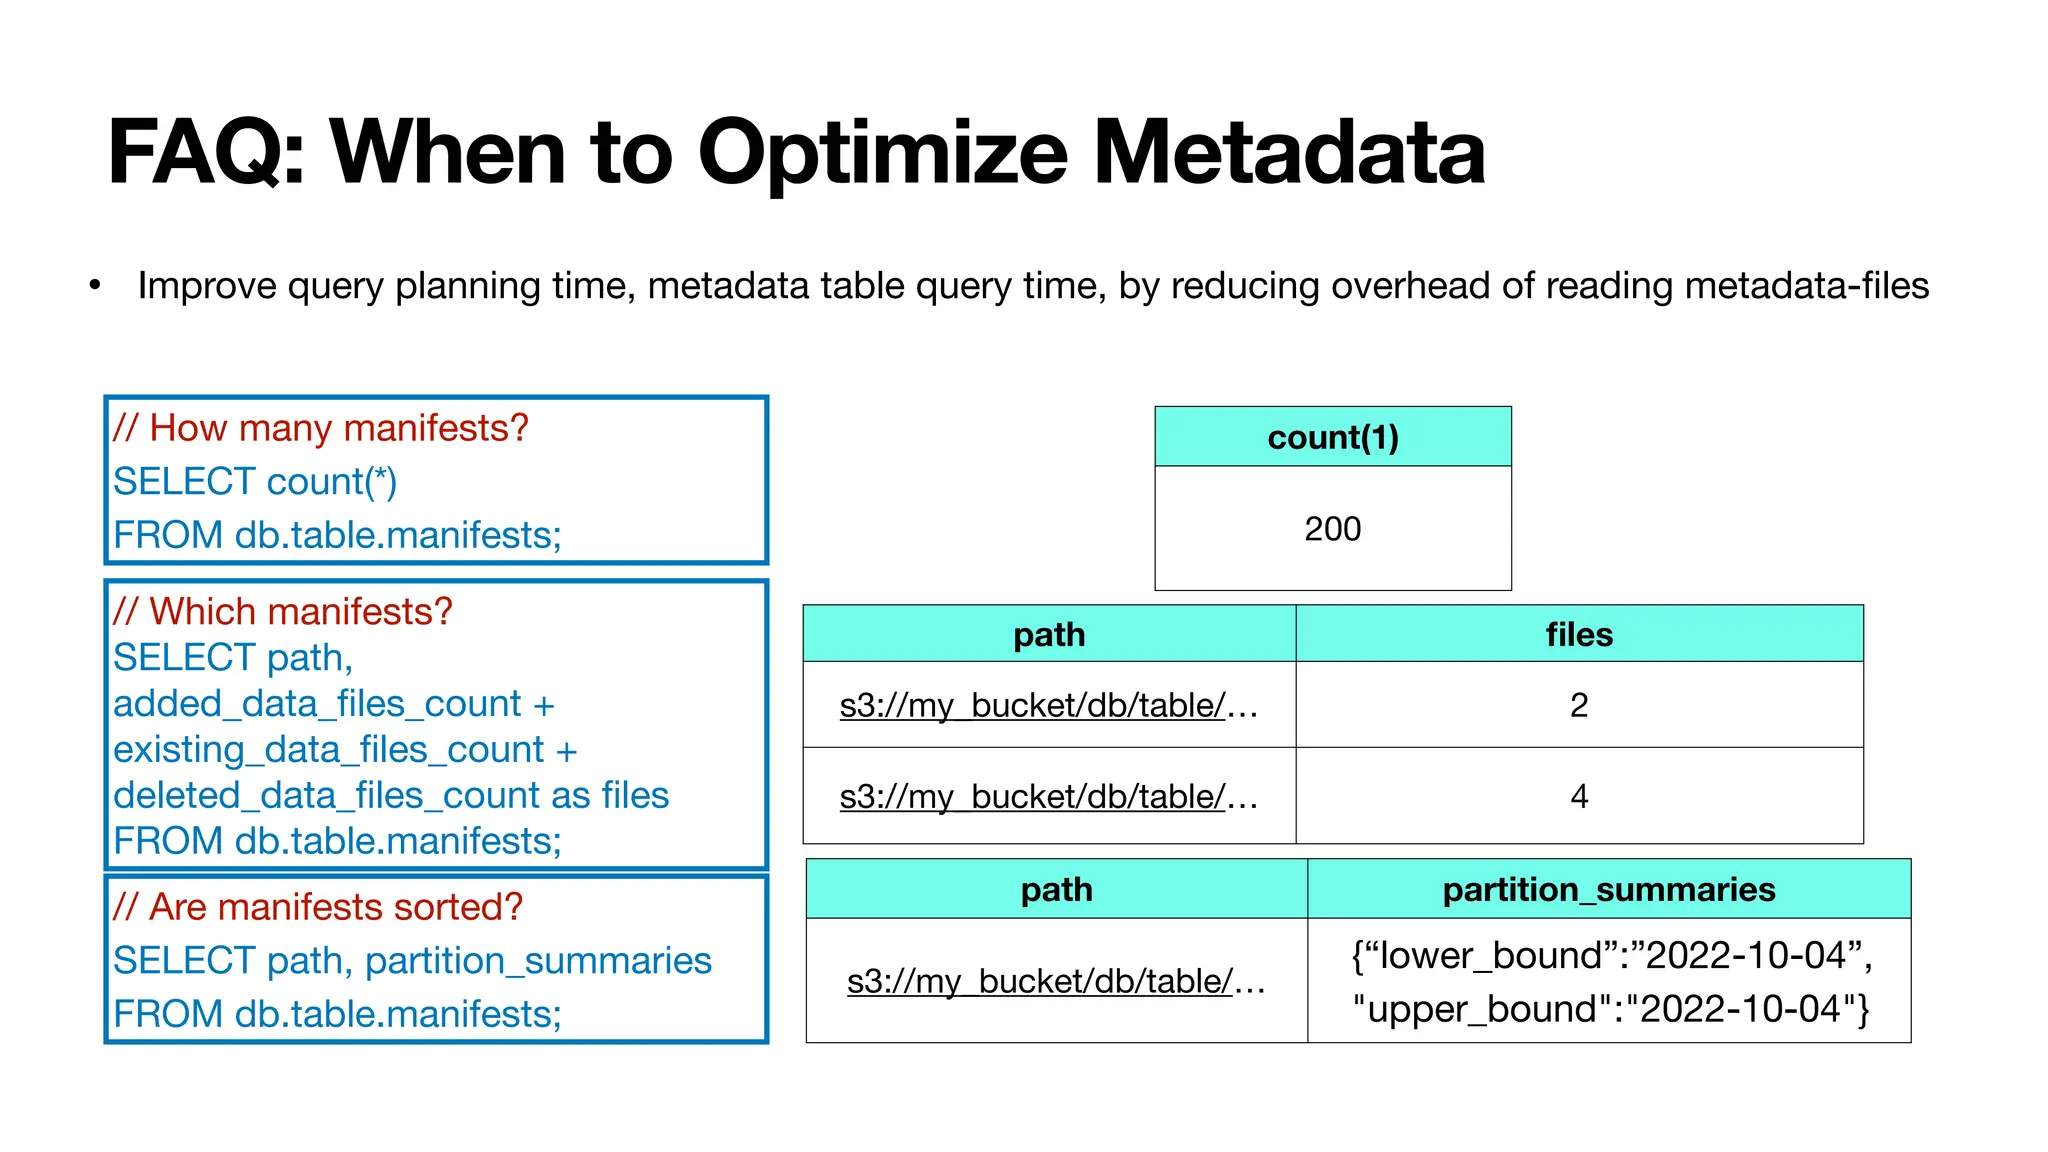
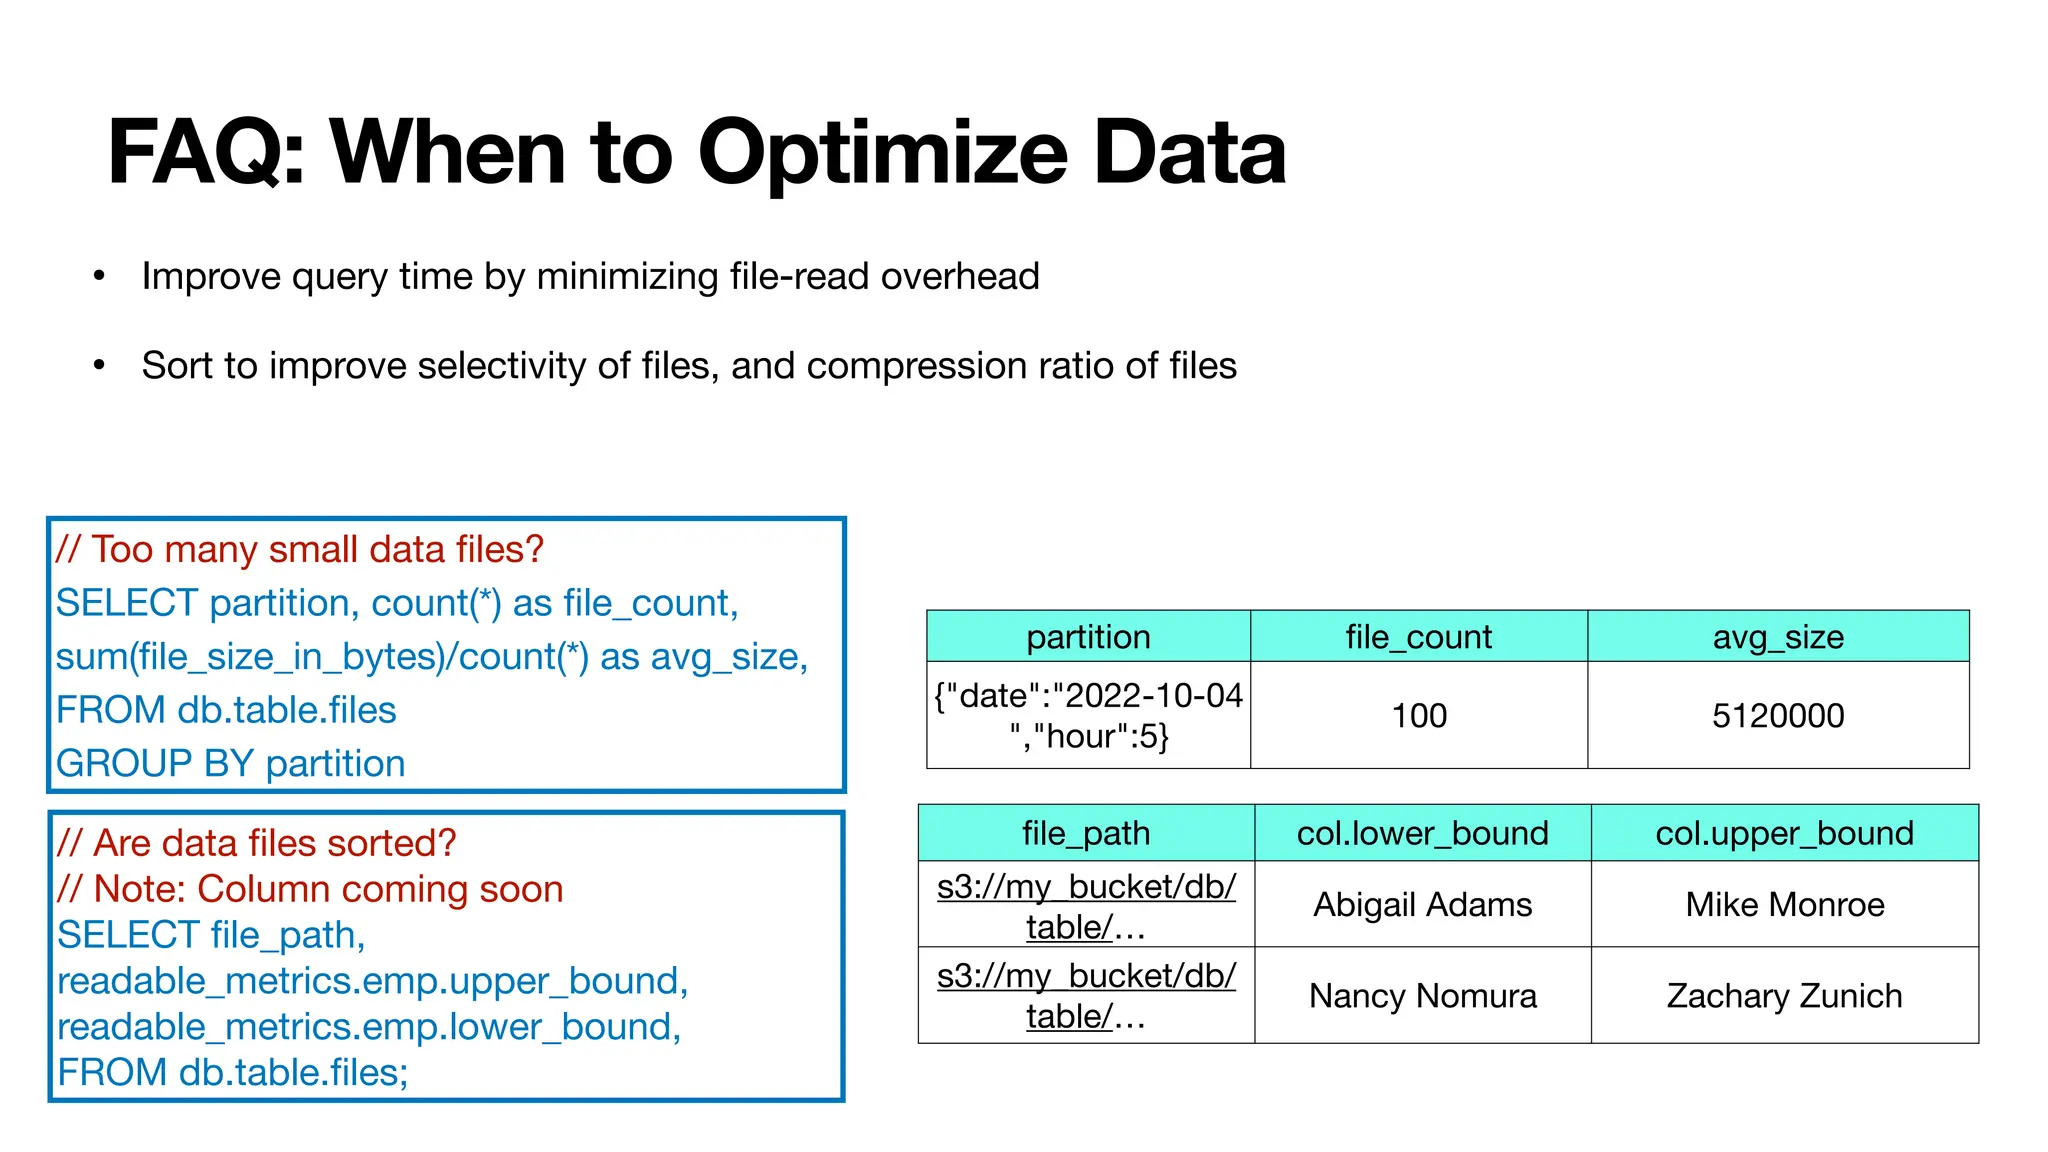
Apache Iceberg is a data management platform that improves upon Hive's capabilities by utilizing a series of metadata tables for better organization and querying of datasets. It allows for various advanced features such as time travel and atomic operations on object stores, significantly enhancing performance and user transparency. The document outlines Iceberg's structure, metadata file interactions, and provides FAQs related to maintenance, optimization, and data quality management.


![[D3T1S03] Amazon DynamoDB design puzzlers](https://cdn.slidesharecdn.com/ss_thumbnails/d3t1s03amazondynamodbdesignpuzzlers-240702042912-ad6df881-thumbnail.jpg?width=640&height=640&fit=bounds)


