Downloaded 19 times


![Vectors
Try: c(3,5,7)
Try: c(‘s’,’a’,’a’,’d’)
Try: 3:7
Try: seq(3,7)
Try: seq(3,7,0.25)
Try: 7:3
Try: name <-c(‘s’,’a’,’a’,’d’)’
Try: name [3]
Try: name [3] <- ‘d’
Try: name [4] <- ‘e’
Try: name](https://image.slidesharecdn.com/csse2014rworkshoptaed1-140526000456-phpapp01/75/R-Intro-Workshop-9-2048.jpg)
![Vectors Names
Try: ranks <- 1:3
Try: names (ranks) <- c(“1st”,”2nd”,”3rd”, )
Try: ranks
Try: ranks [first]
Try: ranks [3] <-4
Try: scoRes <- c(450,578,502)
Try: barplot(scoRes)
Try: names(scoRes) <- c(“Bob”, “Marry”, “Jane”)
Try: barplot (1:200)](https://image.slidesharecdn.com/csse2014rworkshoptaed1-140526000456-phpapp01/75/R-Intro-Workshop-10-2048.jpg)
![Access Values
Try: print(seats)
Try: seats[2,3]
Try: seats[2,]
Try: seats[1,]
Try: seats[,3]
Try: seats[,5:9]](https://image.slidesharecdn.com/csse2014rworkshoptaed1-140526000456-phpapp01/75/R-Intro-Workshop-12-2048.jpg)
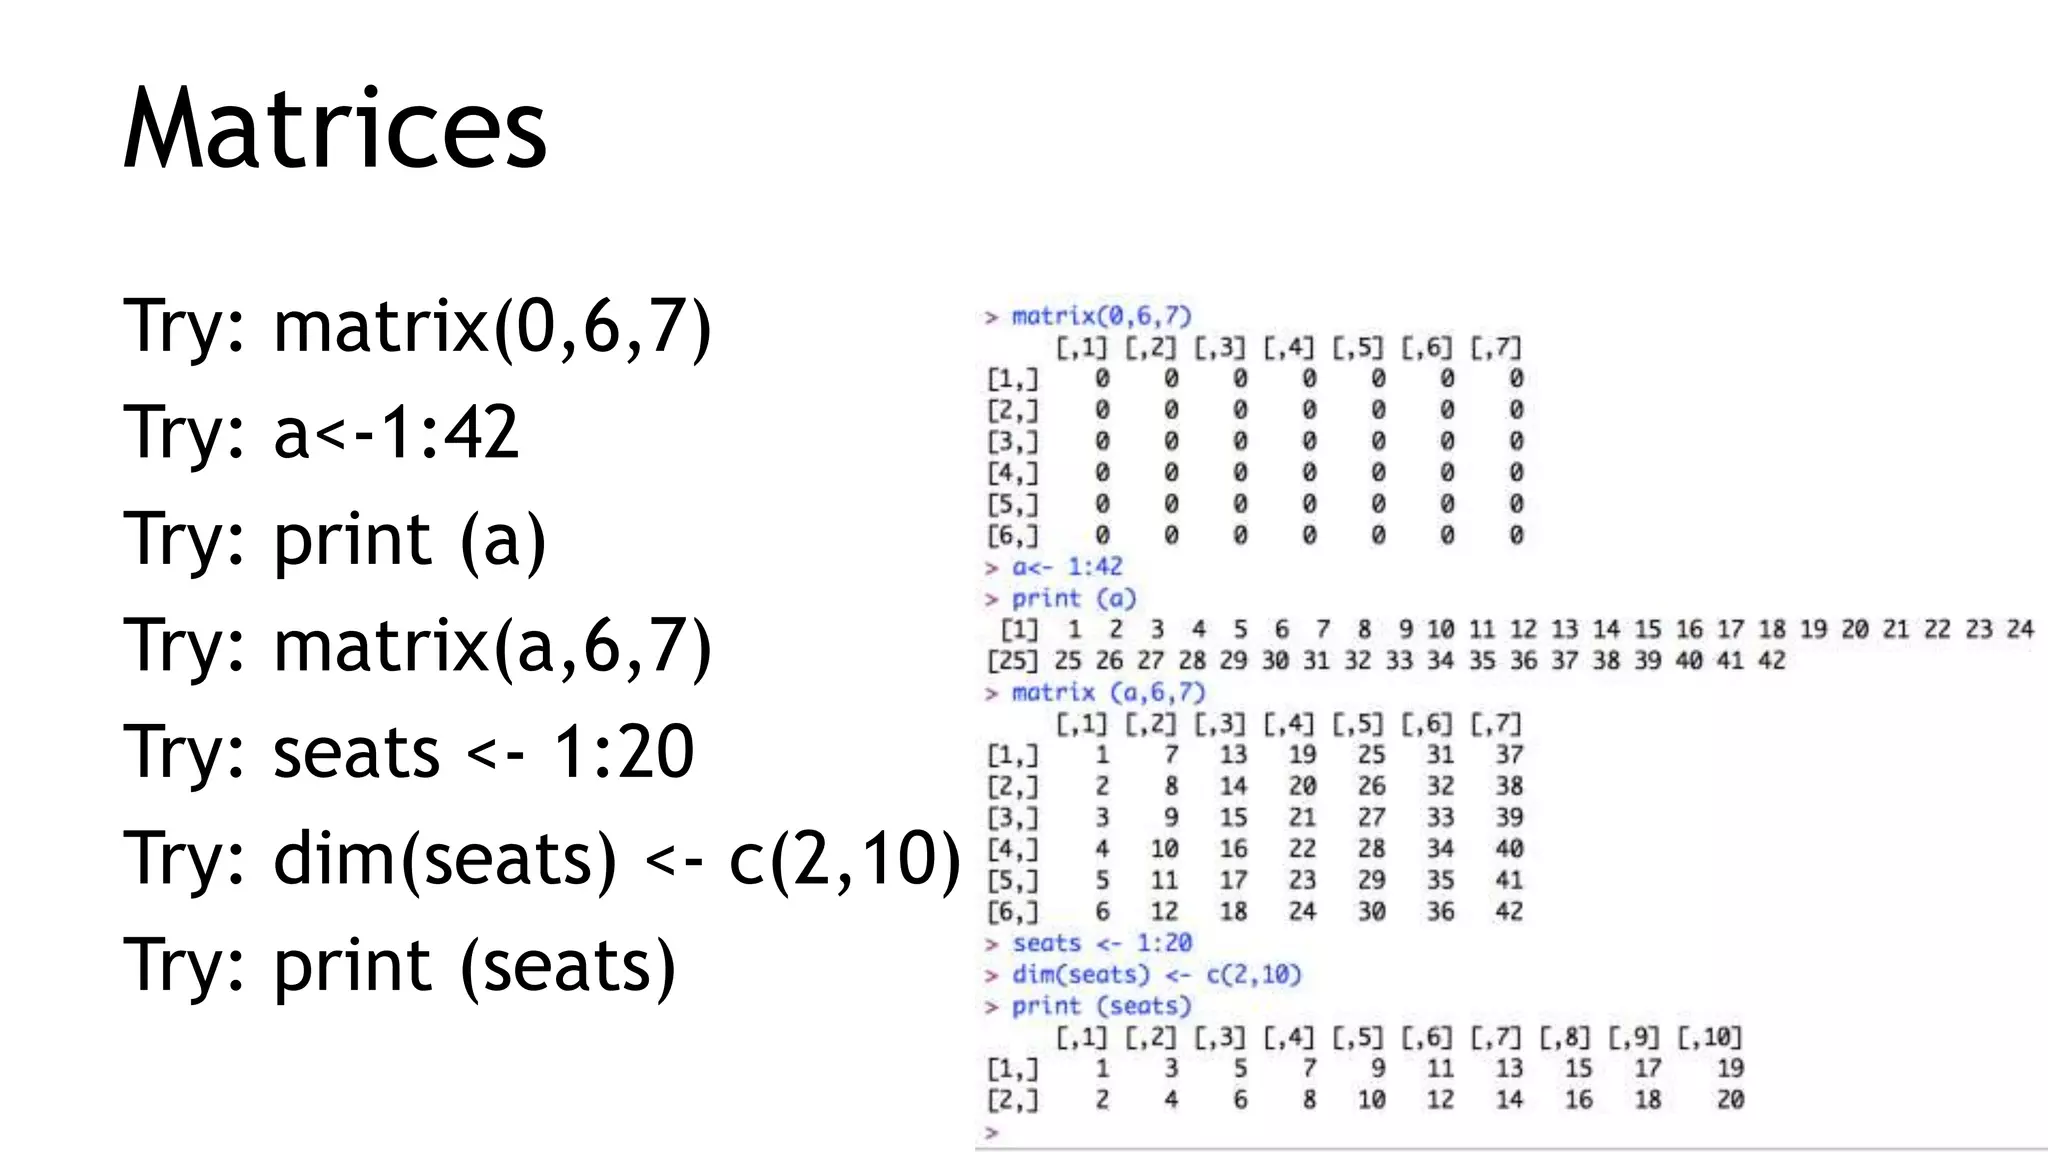
![Matrix
Try: MATD <-matrix(1:6,2)
Try: MATE <-matrix(c(rep(1,3), rep(2,3)), 2, byrow=T)
Try: MATE+MATD
Try: MATD+10
Try: MATD-10
Try: MATD+10
Try: MATD
Try: MATE-MATE
Try: MATD-MATE
Try: solve(MATD[,2:3])
Try: t(MATE)
Try: MATD %*% t(MATE)
Try: MATD*100
Try: MATD/MATE](https://image.slidesharecdn.com/csse2014rworkshoptaed1-140526000456-phpapp01/75/R-Intro-Workshop-13-2048.jpg)


![Vectors
Try: c(3,5,7)
Try: c(‘s’,’a’,’a’,’d’)
Try: 3:7
Try: seq(3,7)
Try: seq(3,7,0.25)
Try: 7:3
Try: name <-c(‘s’,’a’,’a’,’d’)’
Try: name [3]
Try: name [3] <- ‘d’
Try: name [4] <- ‘e’
Try: name](https://crownmelresort.com/image.slidesharecdn.com/csse2014rworkshoptaed1-140526000456-phpapp01/75/R-Intro-Workshop-9-2048.jpg)
![Vectors Names
Try: ranks <- 1:3
Try: names (ranks) <- c(“1st”,”2nd”,”3rd”, )
Try: ranks
Try: ranks [first]
Try: ranks [3] <-4
Try: scoRes <- c(450,578,502)
Try: barplot(scoRes)
Try: names(scoRes) <- c(“Bob”, “Marry”, “Jane”)
Try: barplot (1:200)](https://crownmelresort.com/image.slidesharecdn.com/csse2014rworkshoptaed1-140526000456-phpapp01/75/R-Intro-Workshop-10-2048.jpg)

![Access Values
Try: print(seats)
Try: seats[2,3]
Try: seats[2,]
Try: seats[1,]
Try: seats[,3]
Try: seats[,5:9]](https://crownmelresort.com/image.slidesharecdn.com/csse2014rworkshoptaed1-140526000456-phpapp01/75/R-Intro-Workshop-12-2048.jpg)
![Matrix
Try: MATD <-matrix(1:6,2)
Try: MATE <-matrix(c(rep(1,3), rep(2,3)), 2, byrow=T)
Try: MATE+MATD
Try: MATD+10
Try: MATD-10
Try: MATD+10
Try: MATD
Try: MATE-MATE
Try: MATD-MATE
Try: solve(MATD[,2:3])
Try: t(MATE)
Try: MATD %*% t(MATE)
Try: MATD*100
Try: MATD/MATE](https://crownmelresort.com/image.slidesharecdn.com/csse2014rworkshoptaed1-140526000456-phpapp01/75/R-Intro-Workshop-13-2048.jpg)


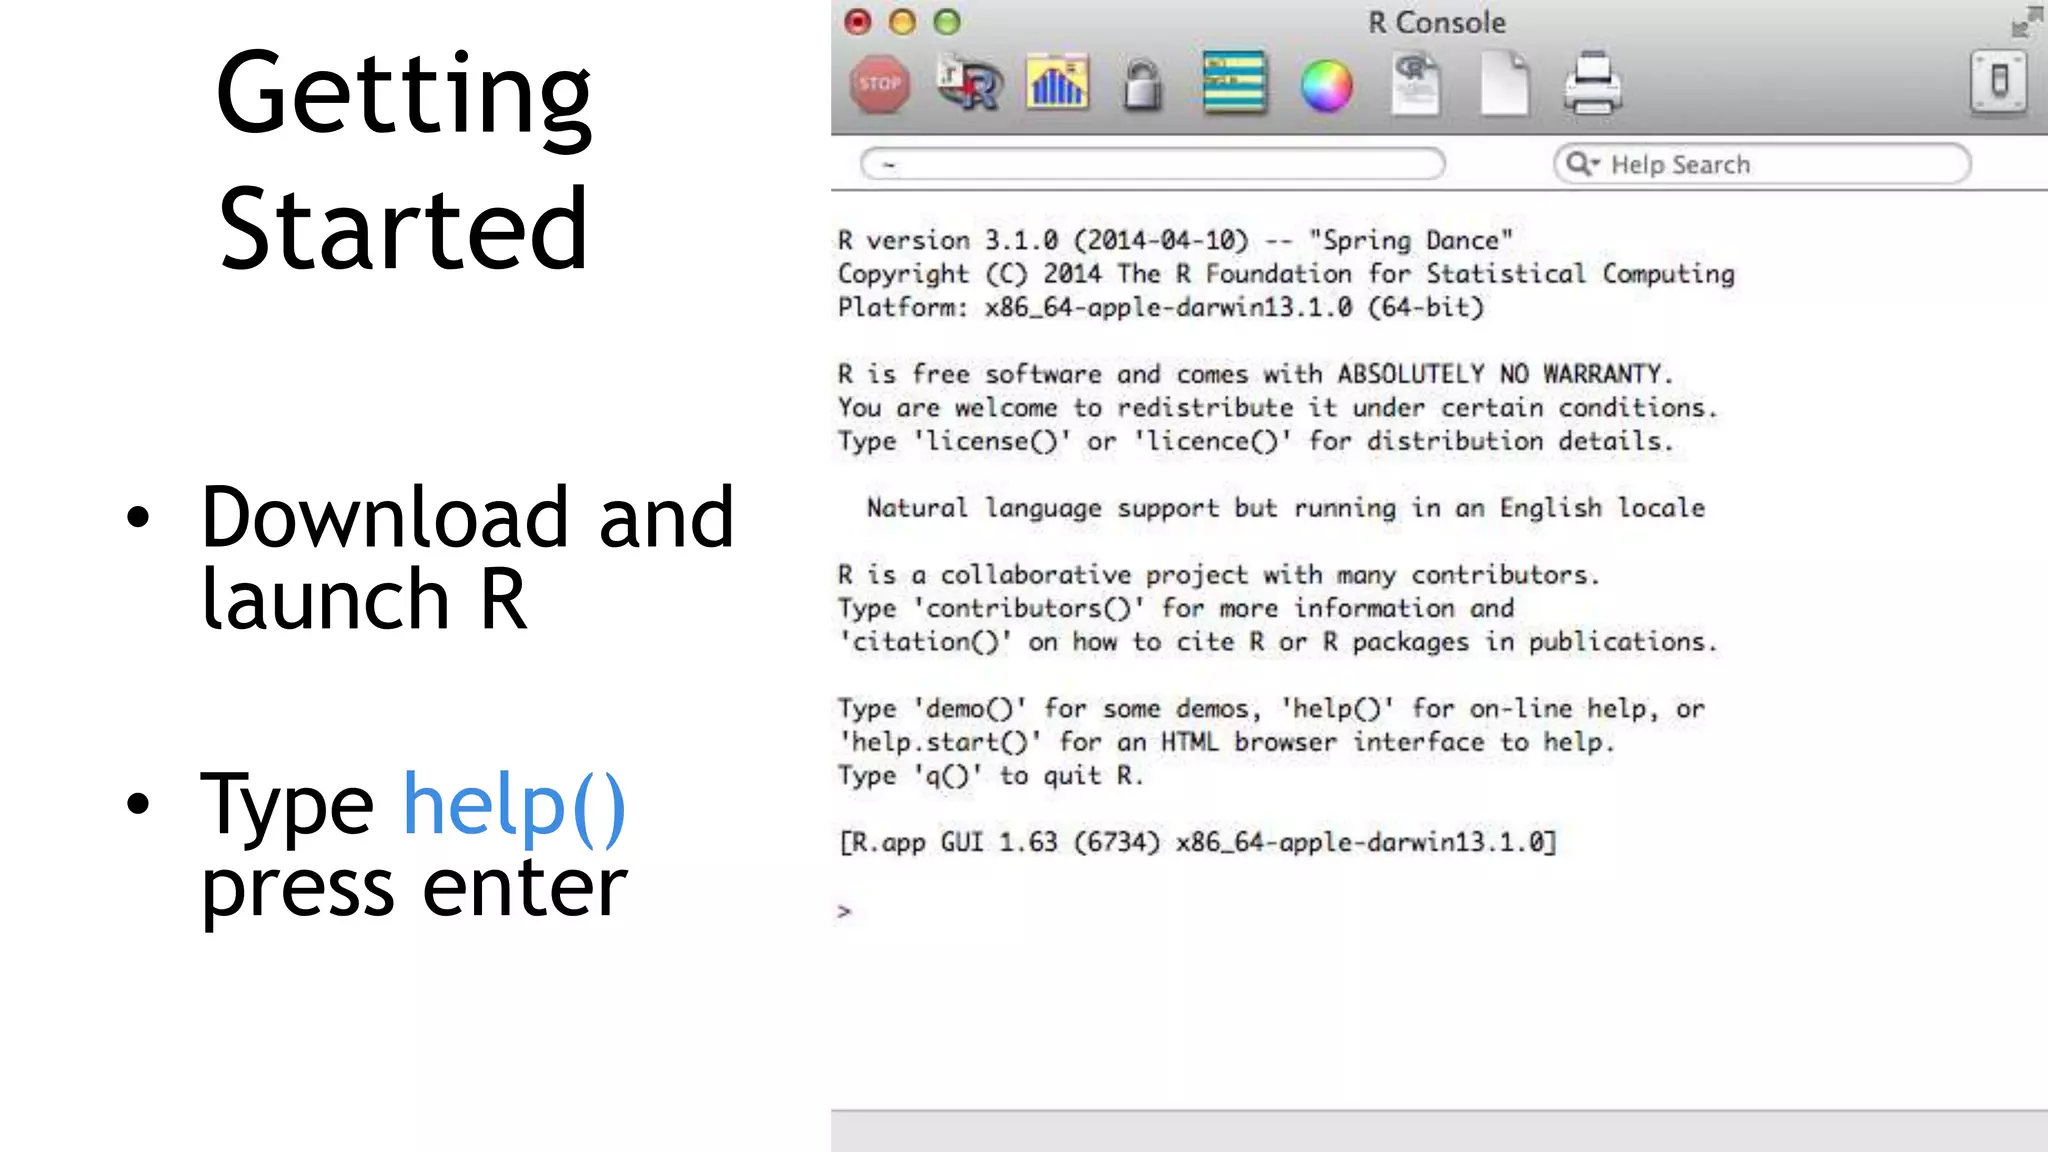
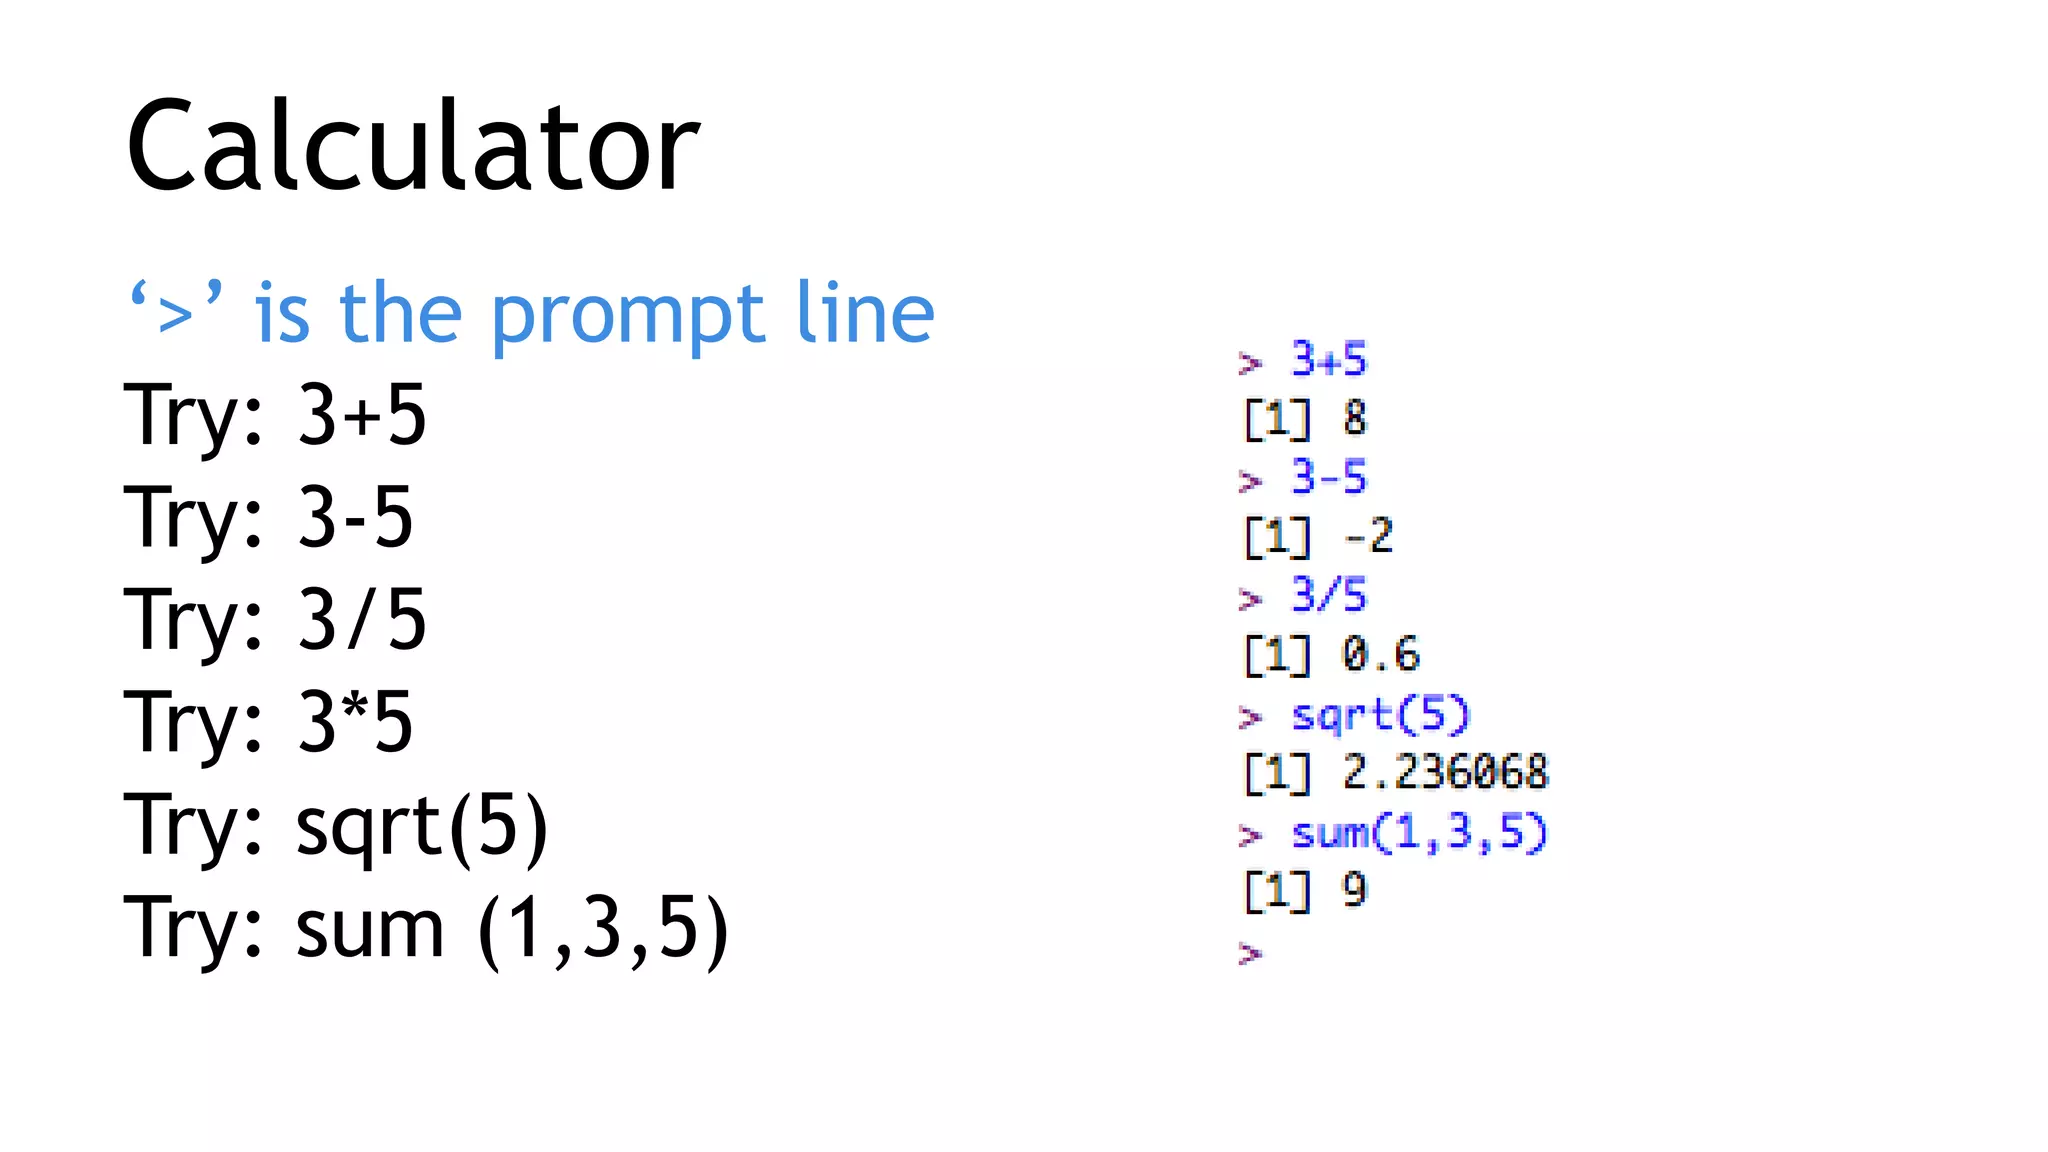
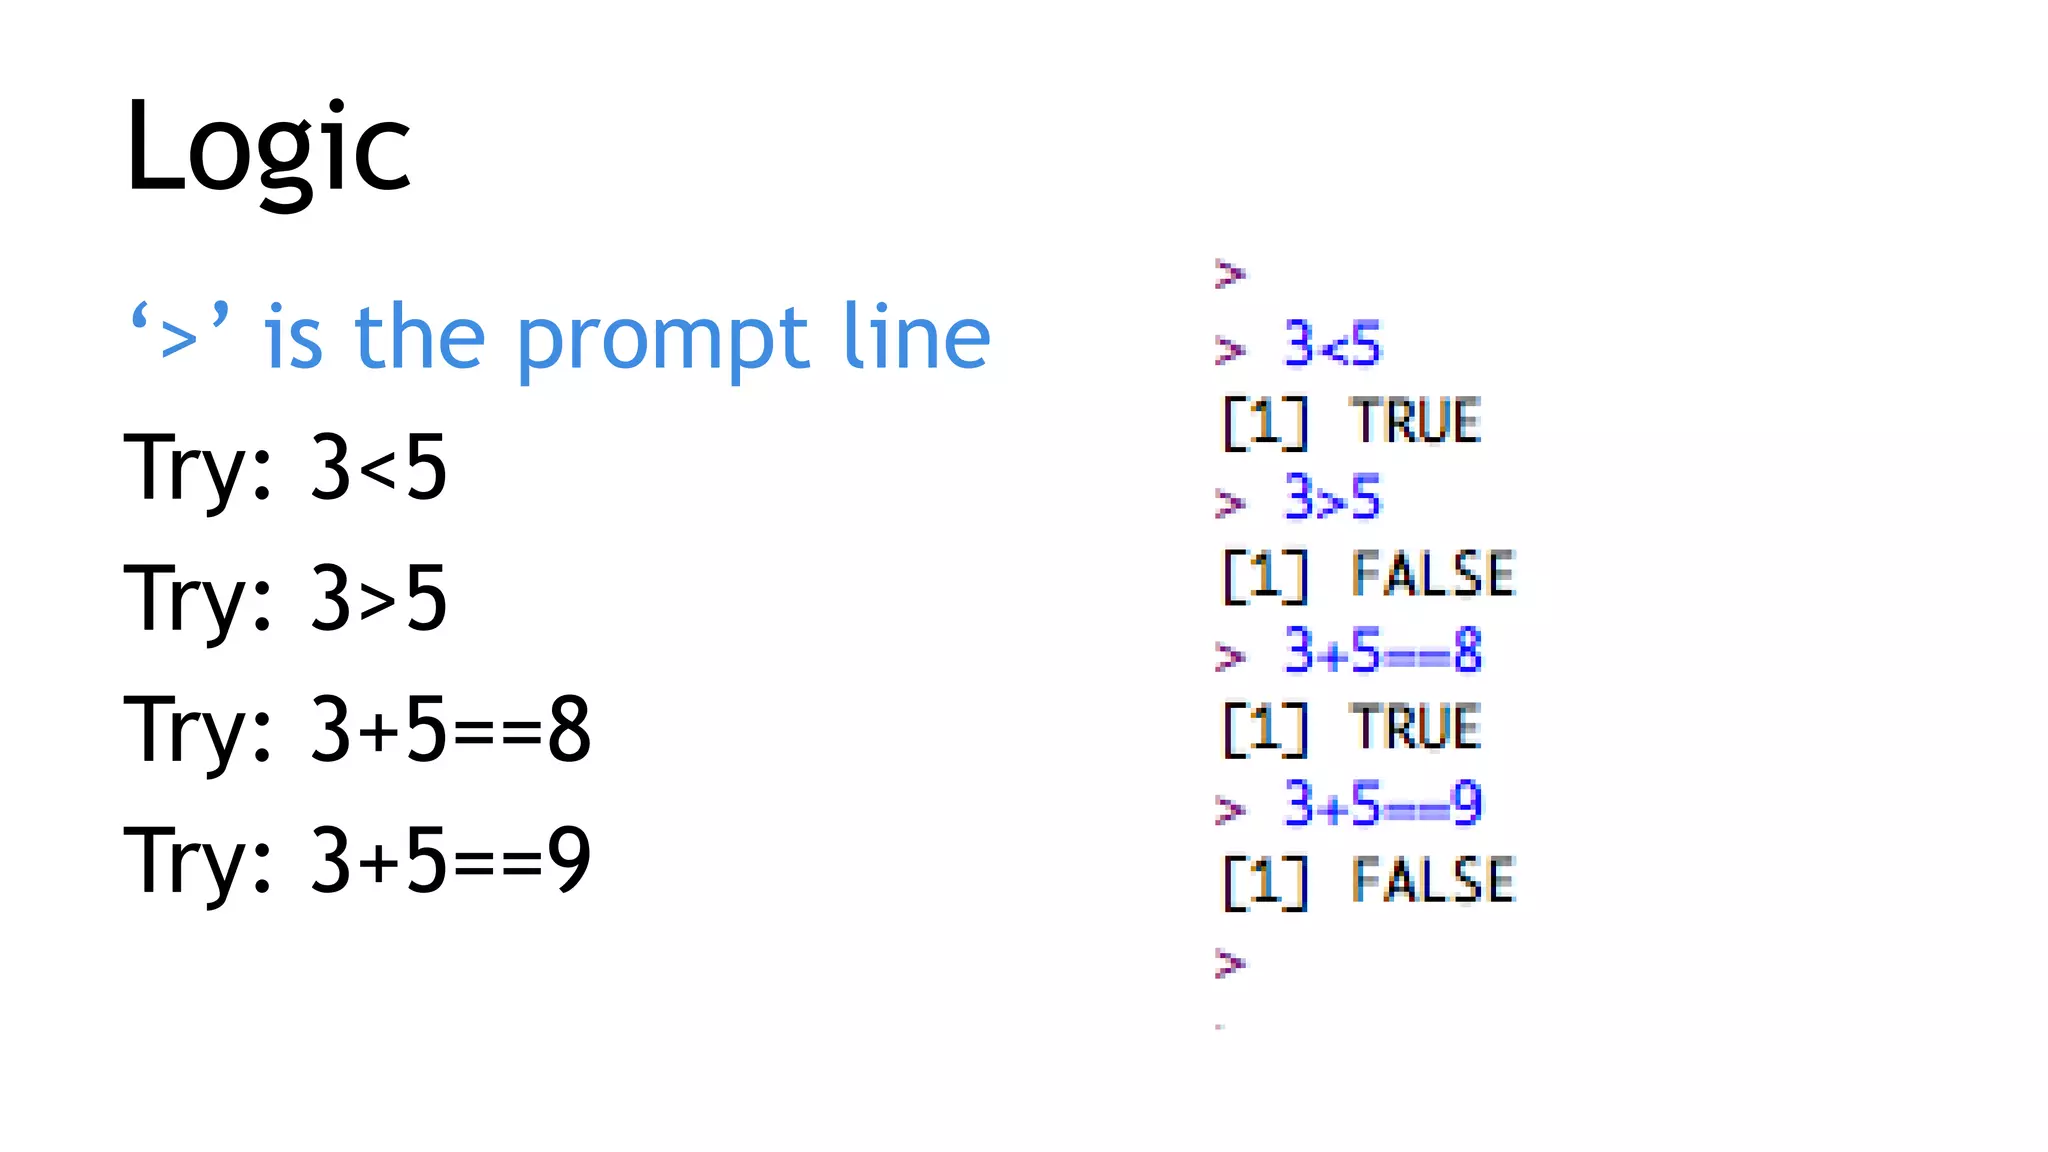
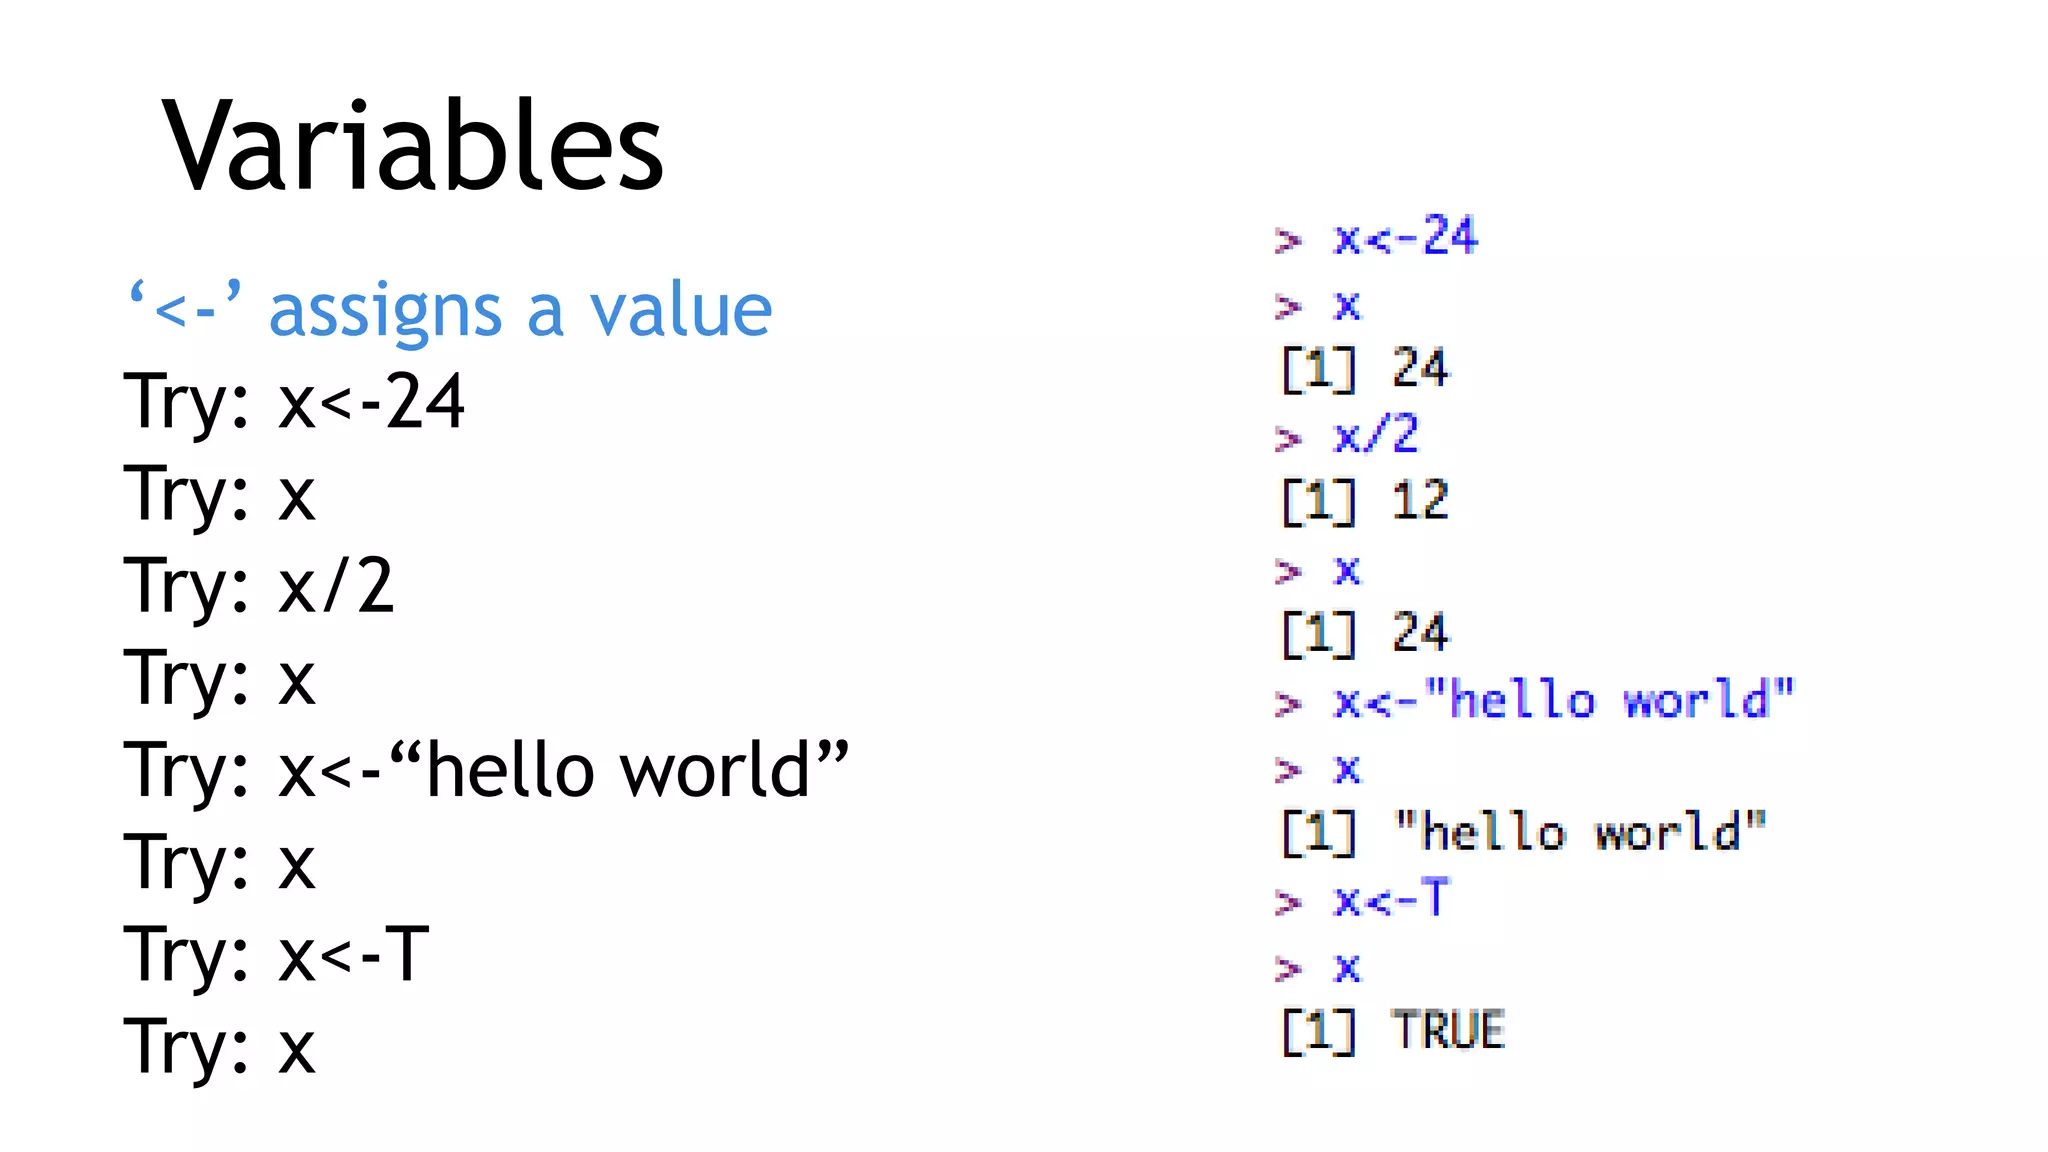
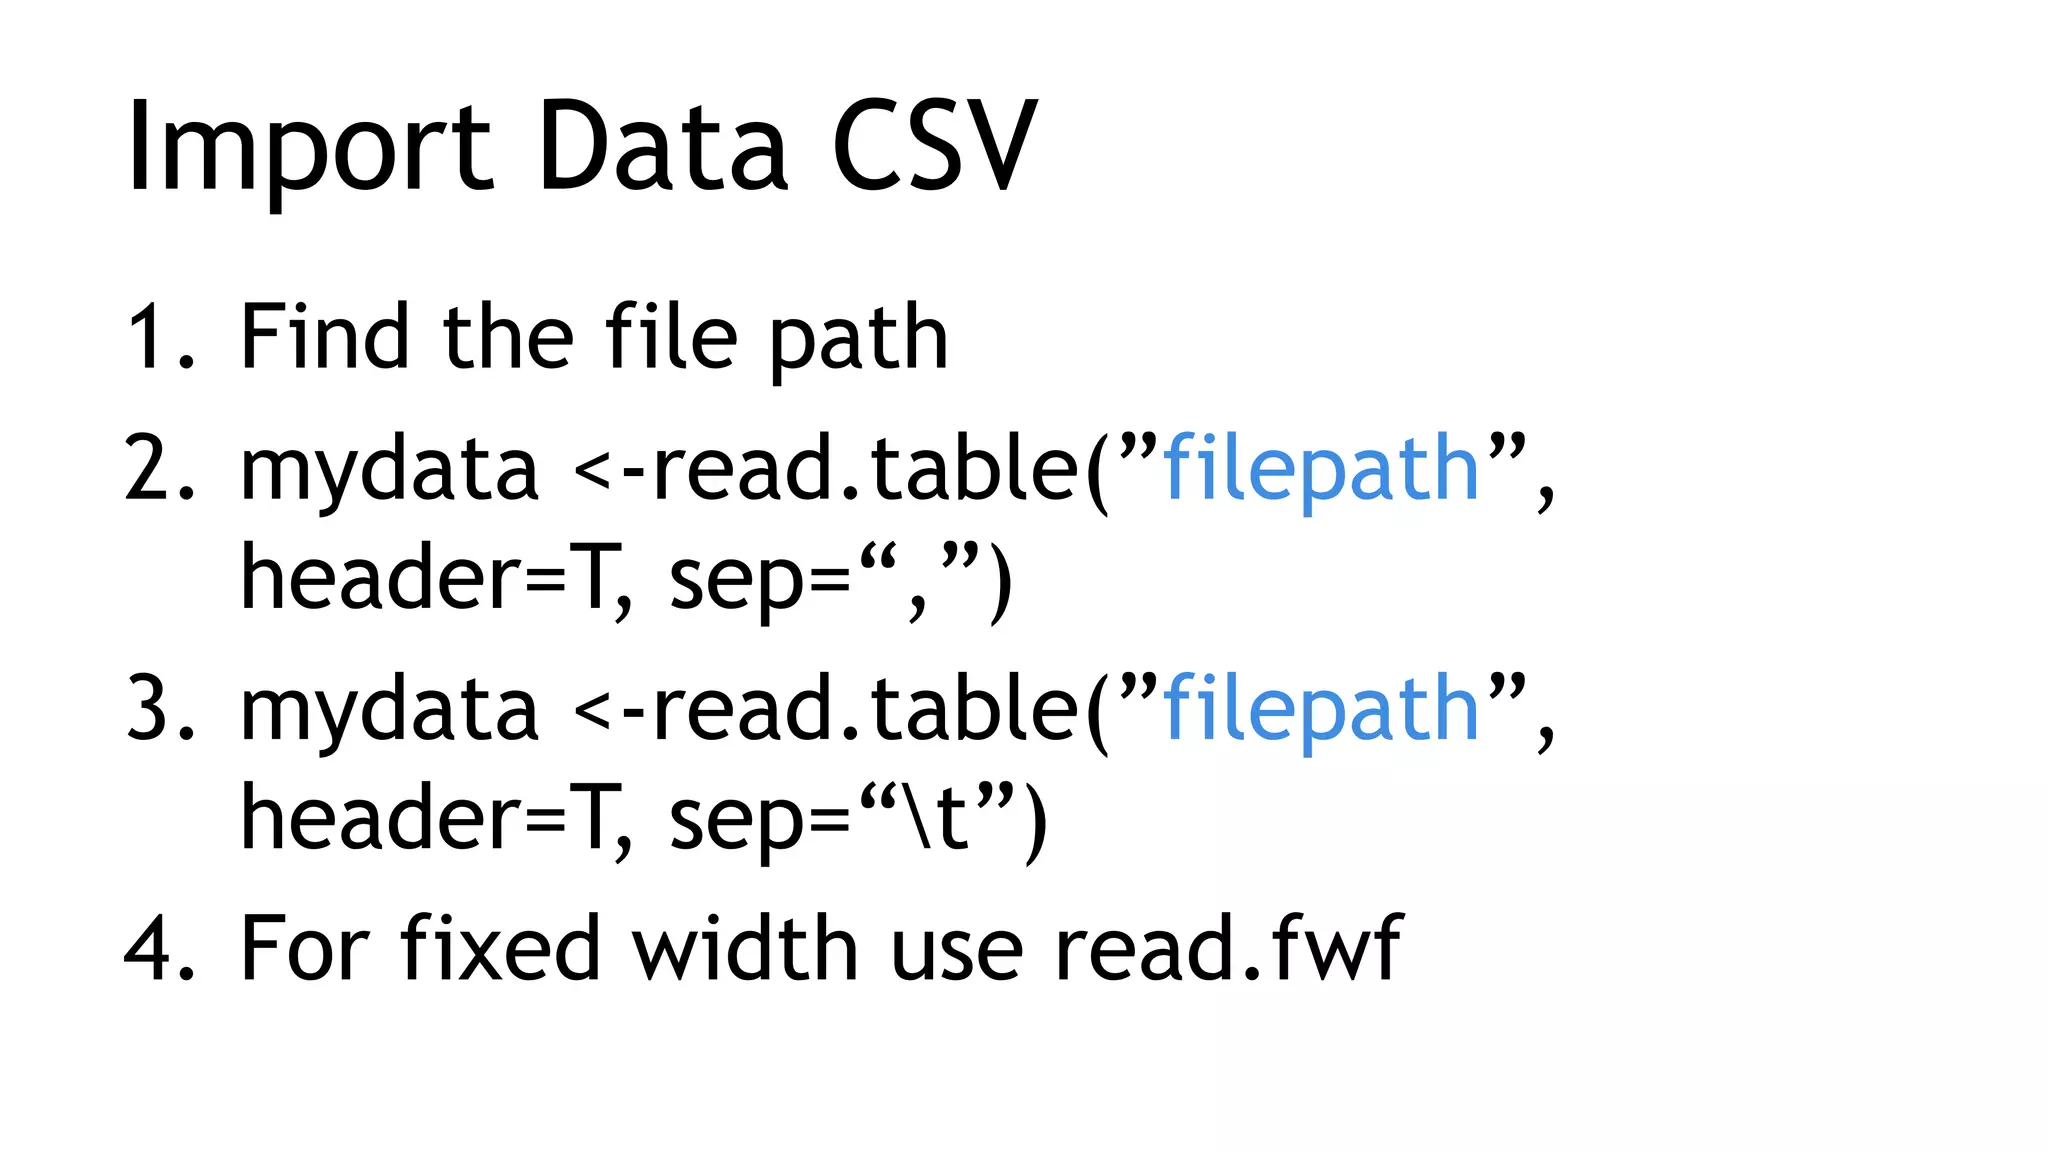
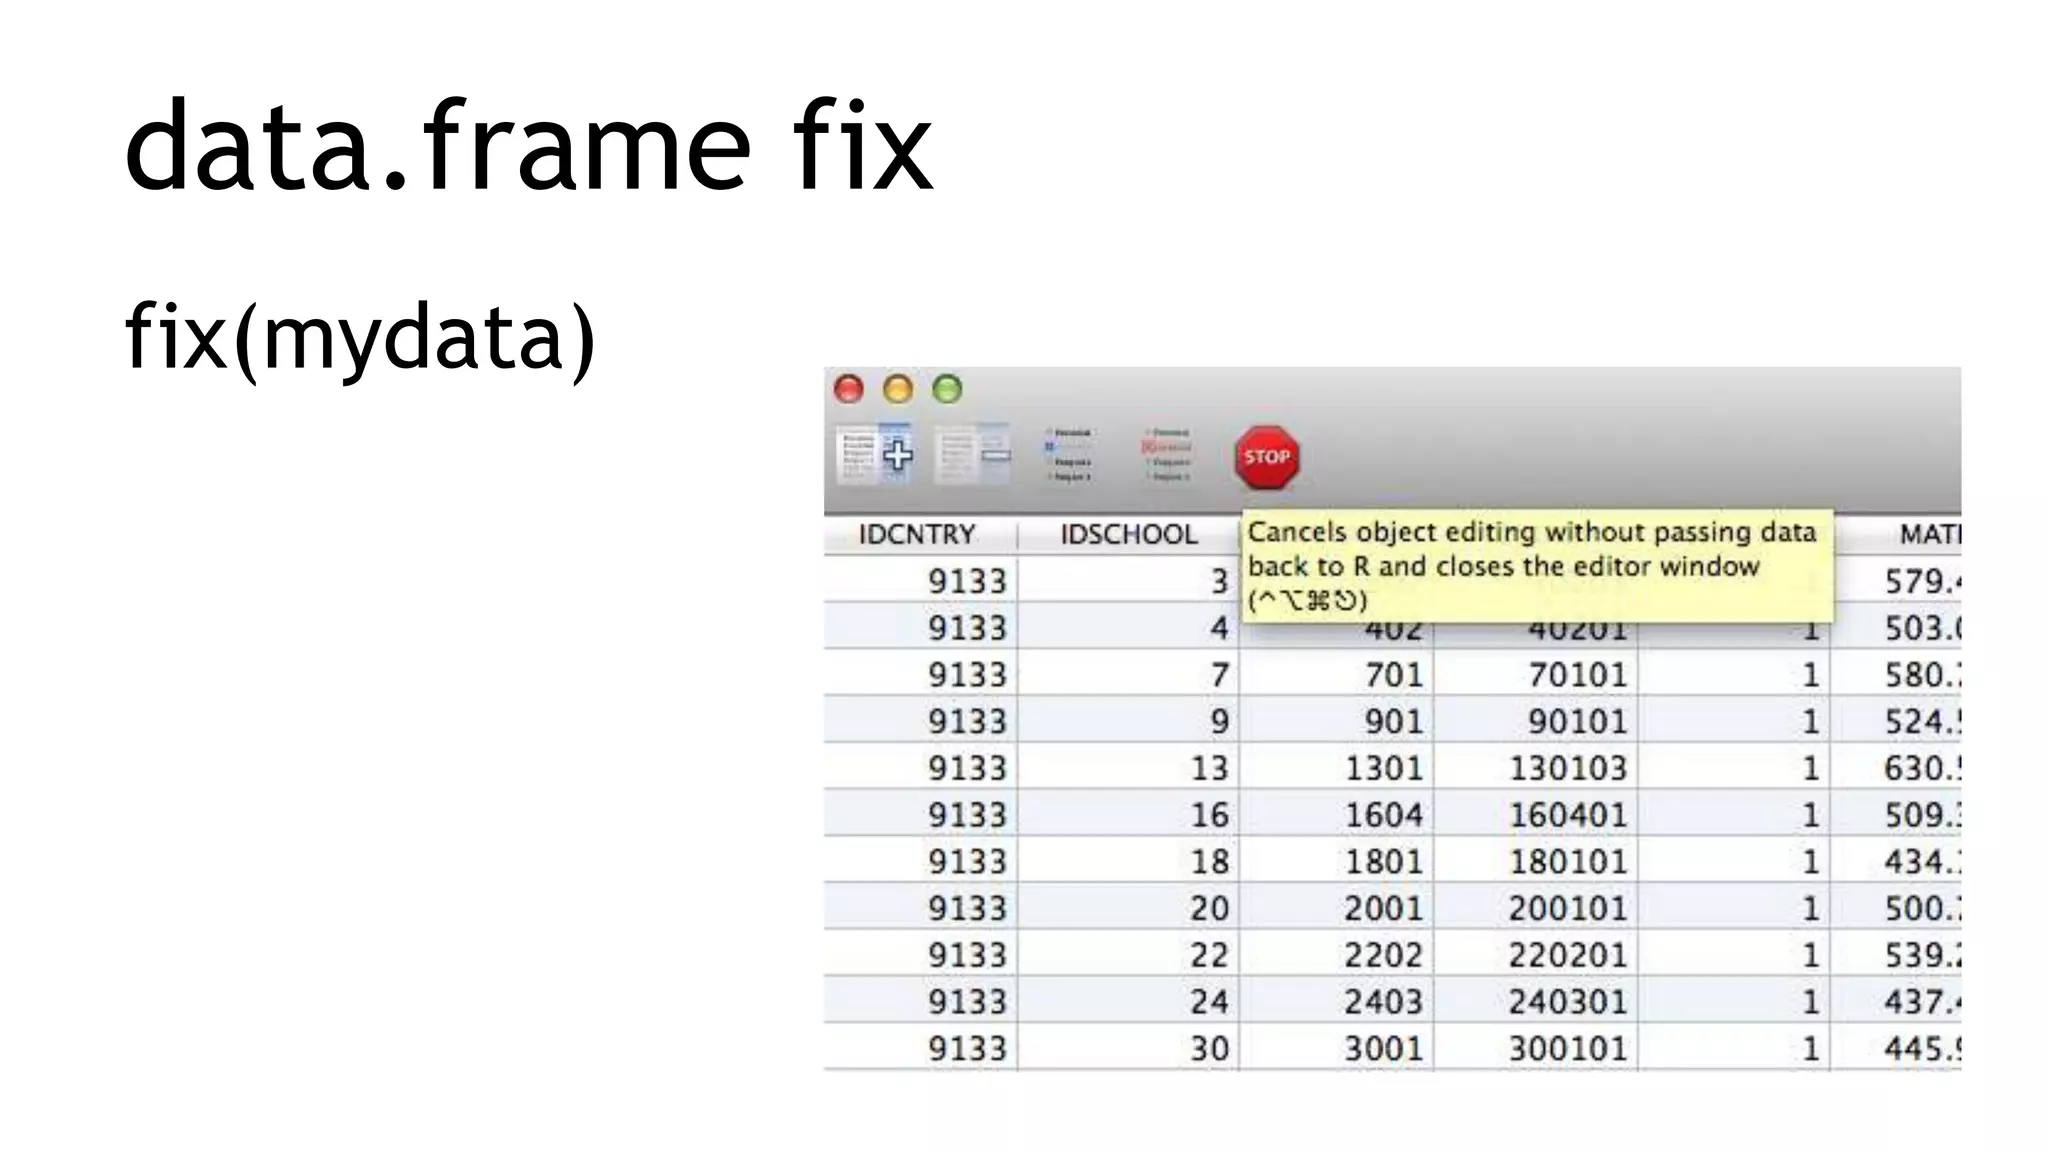
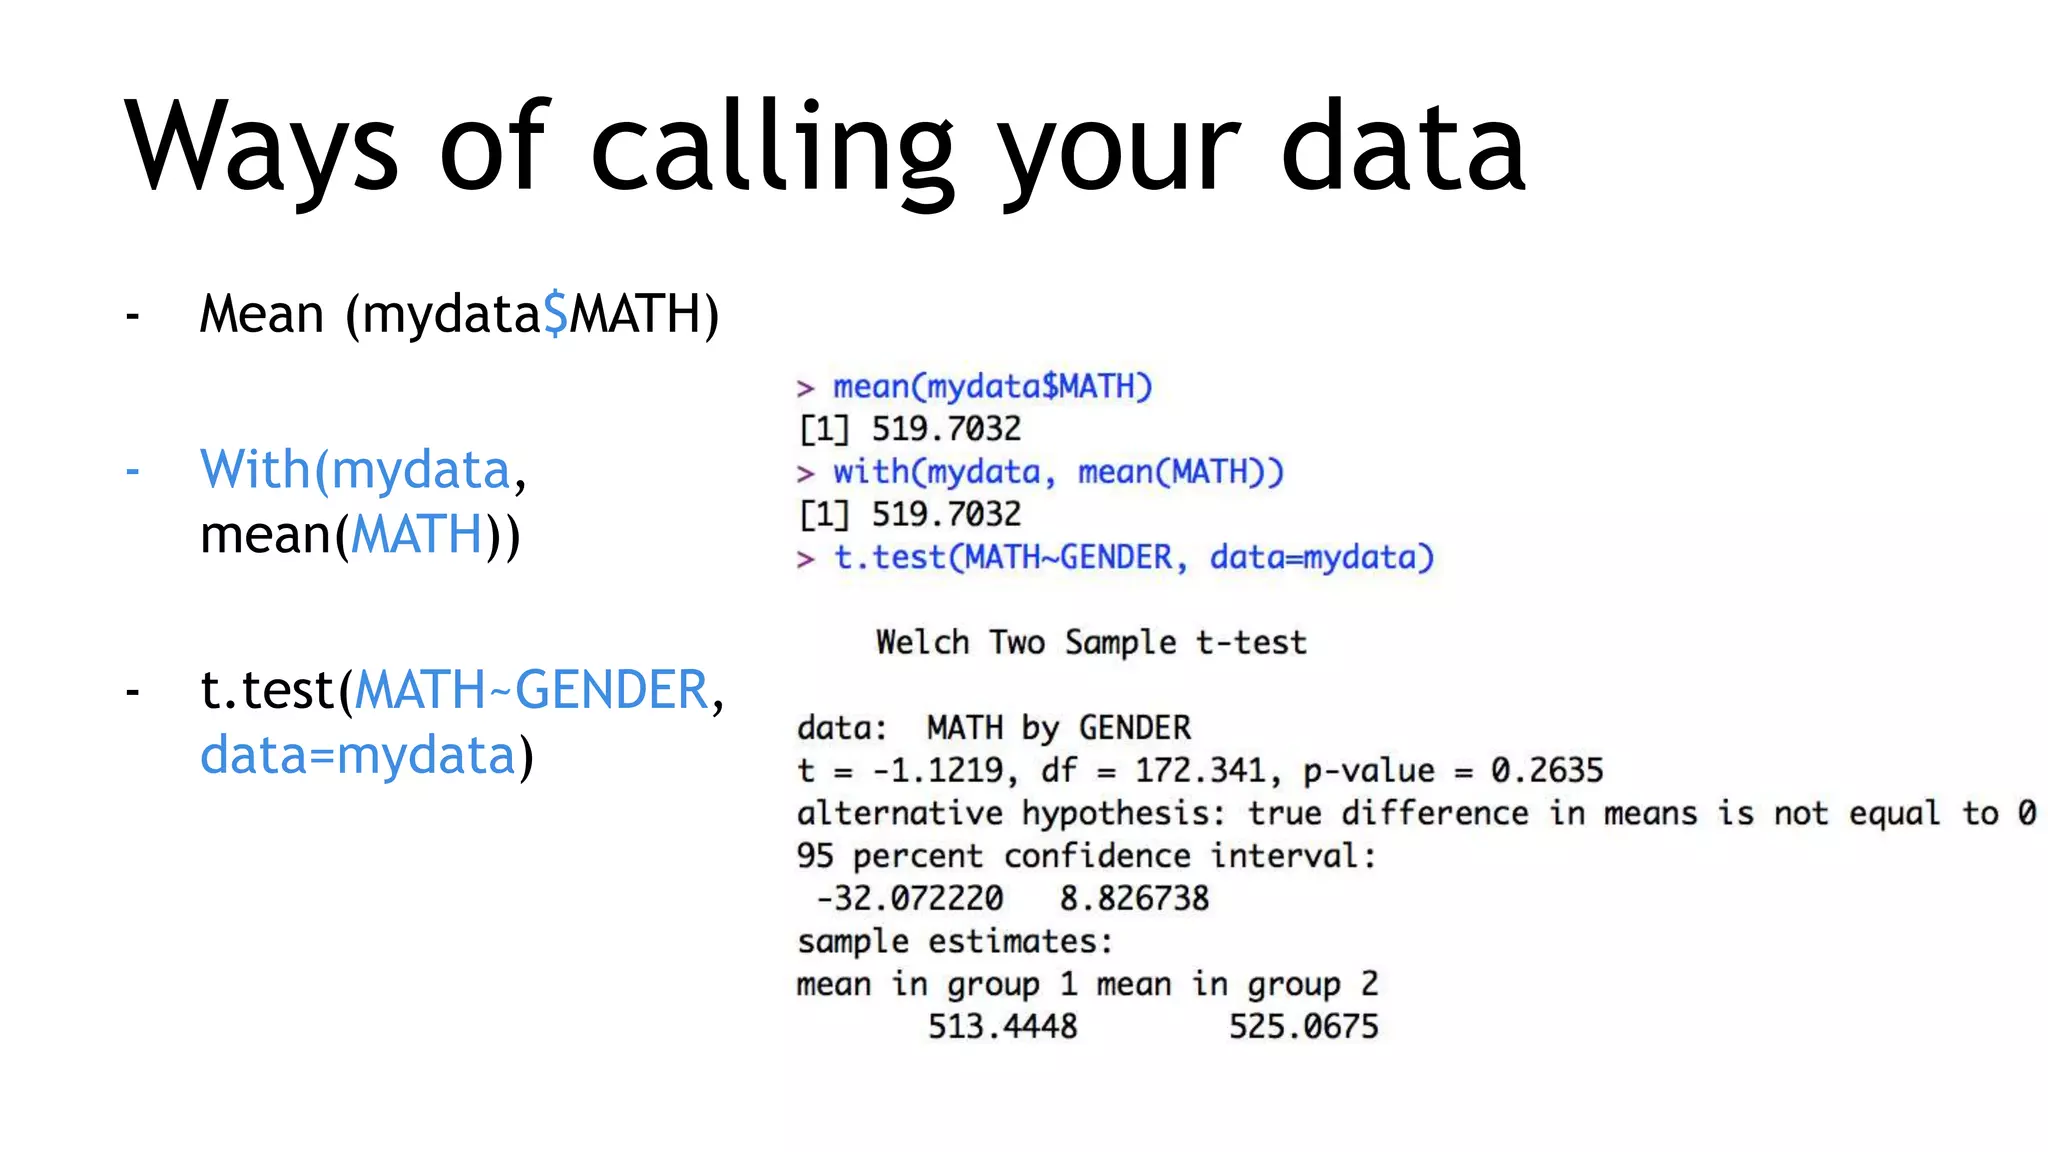
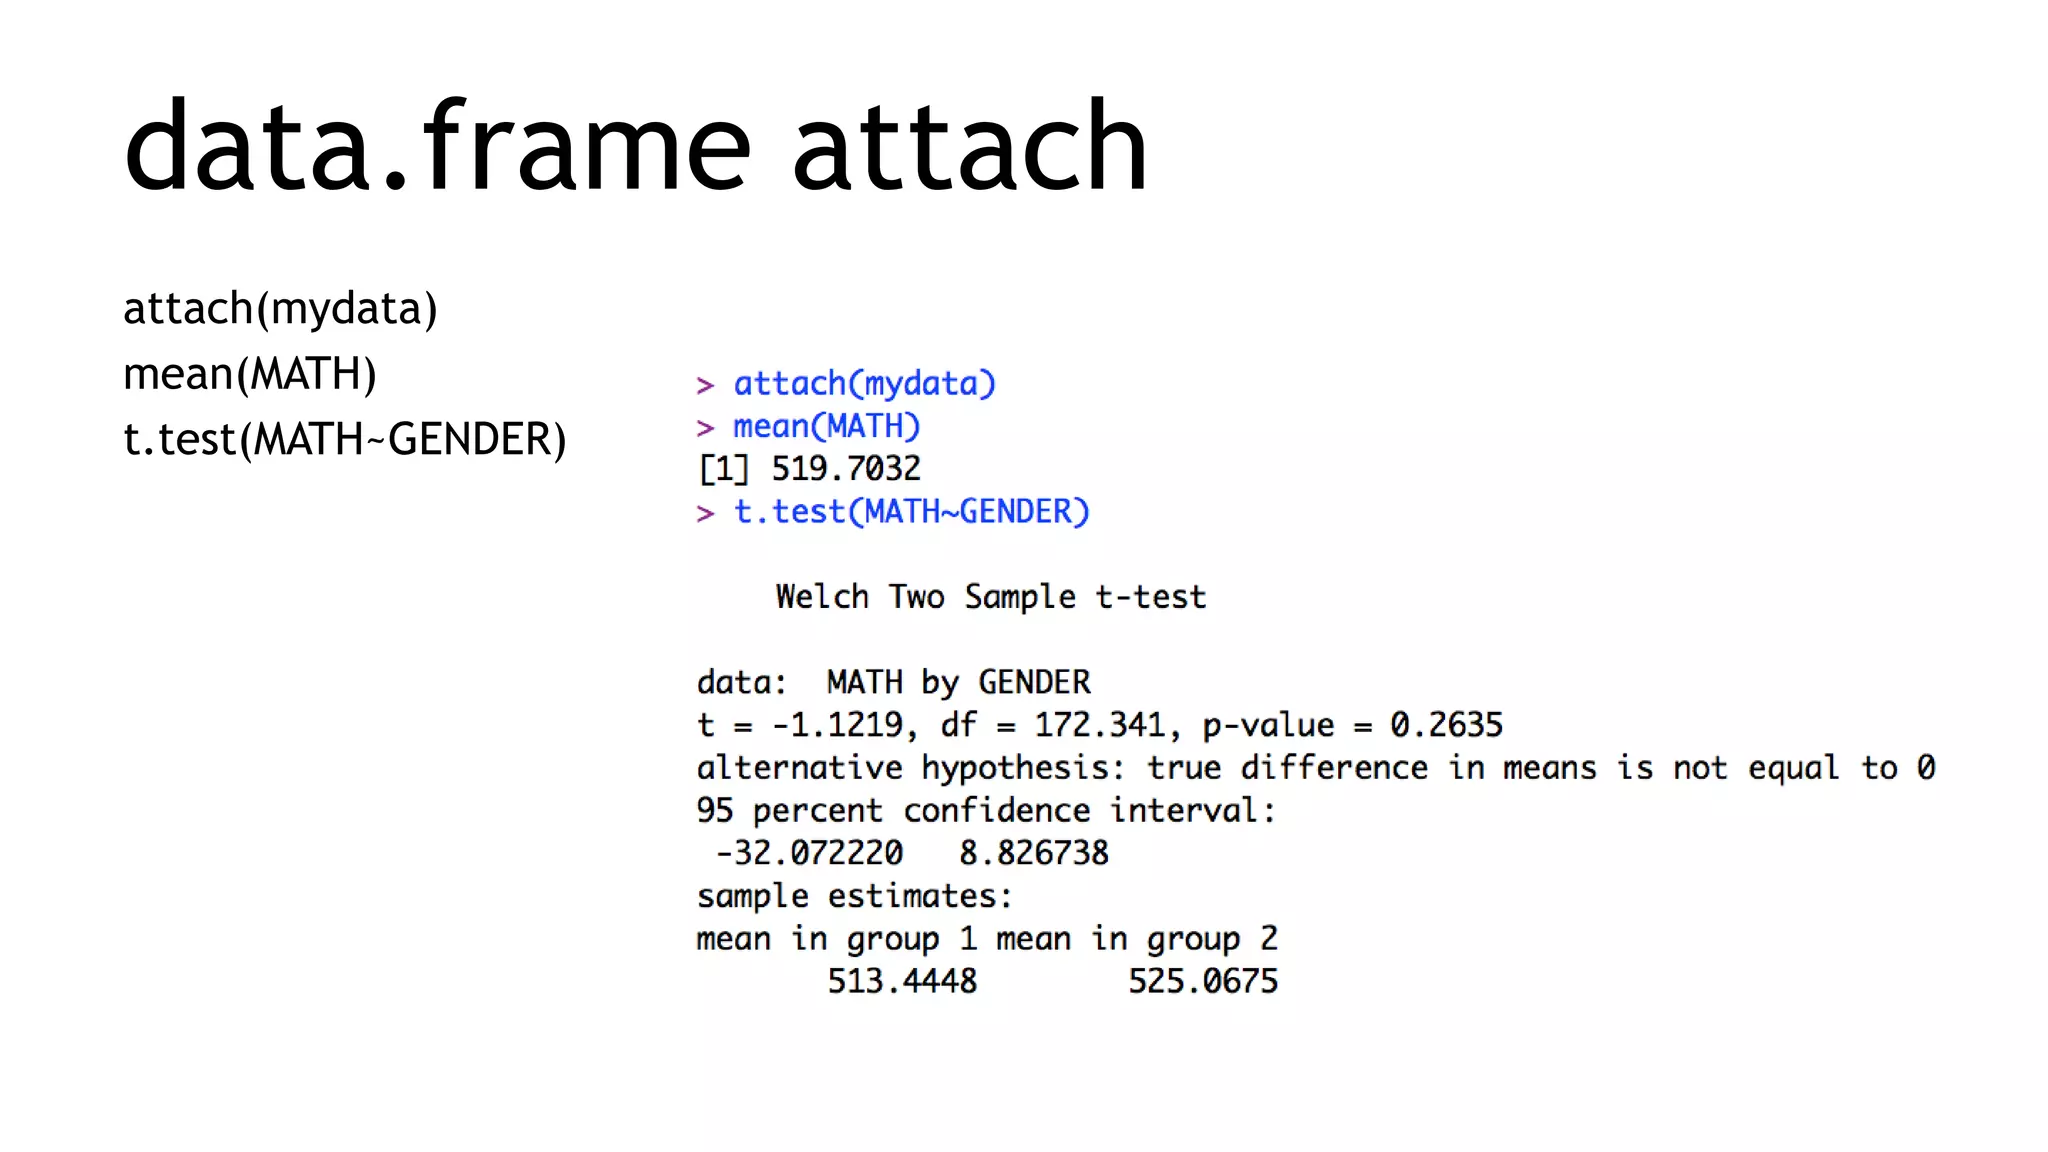
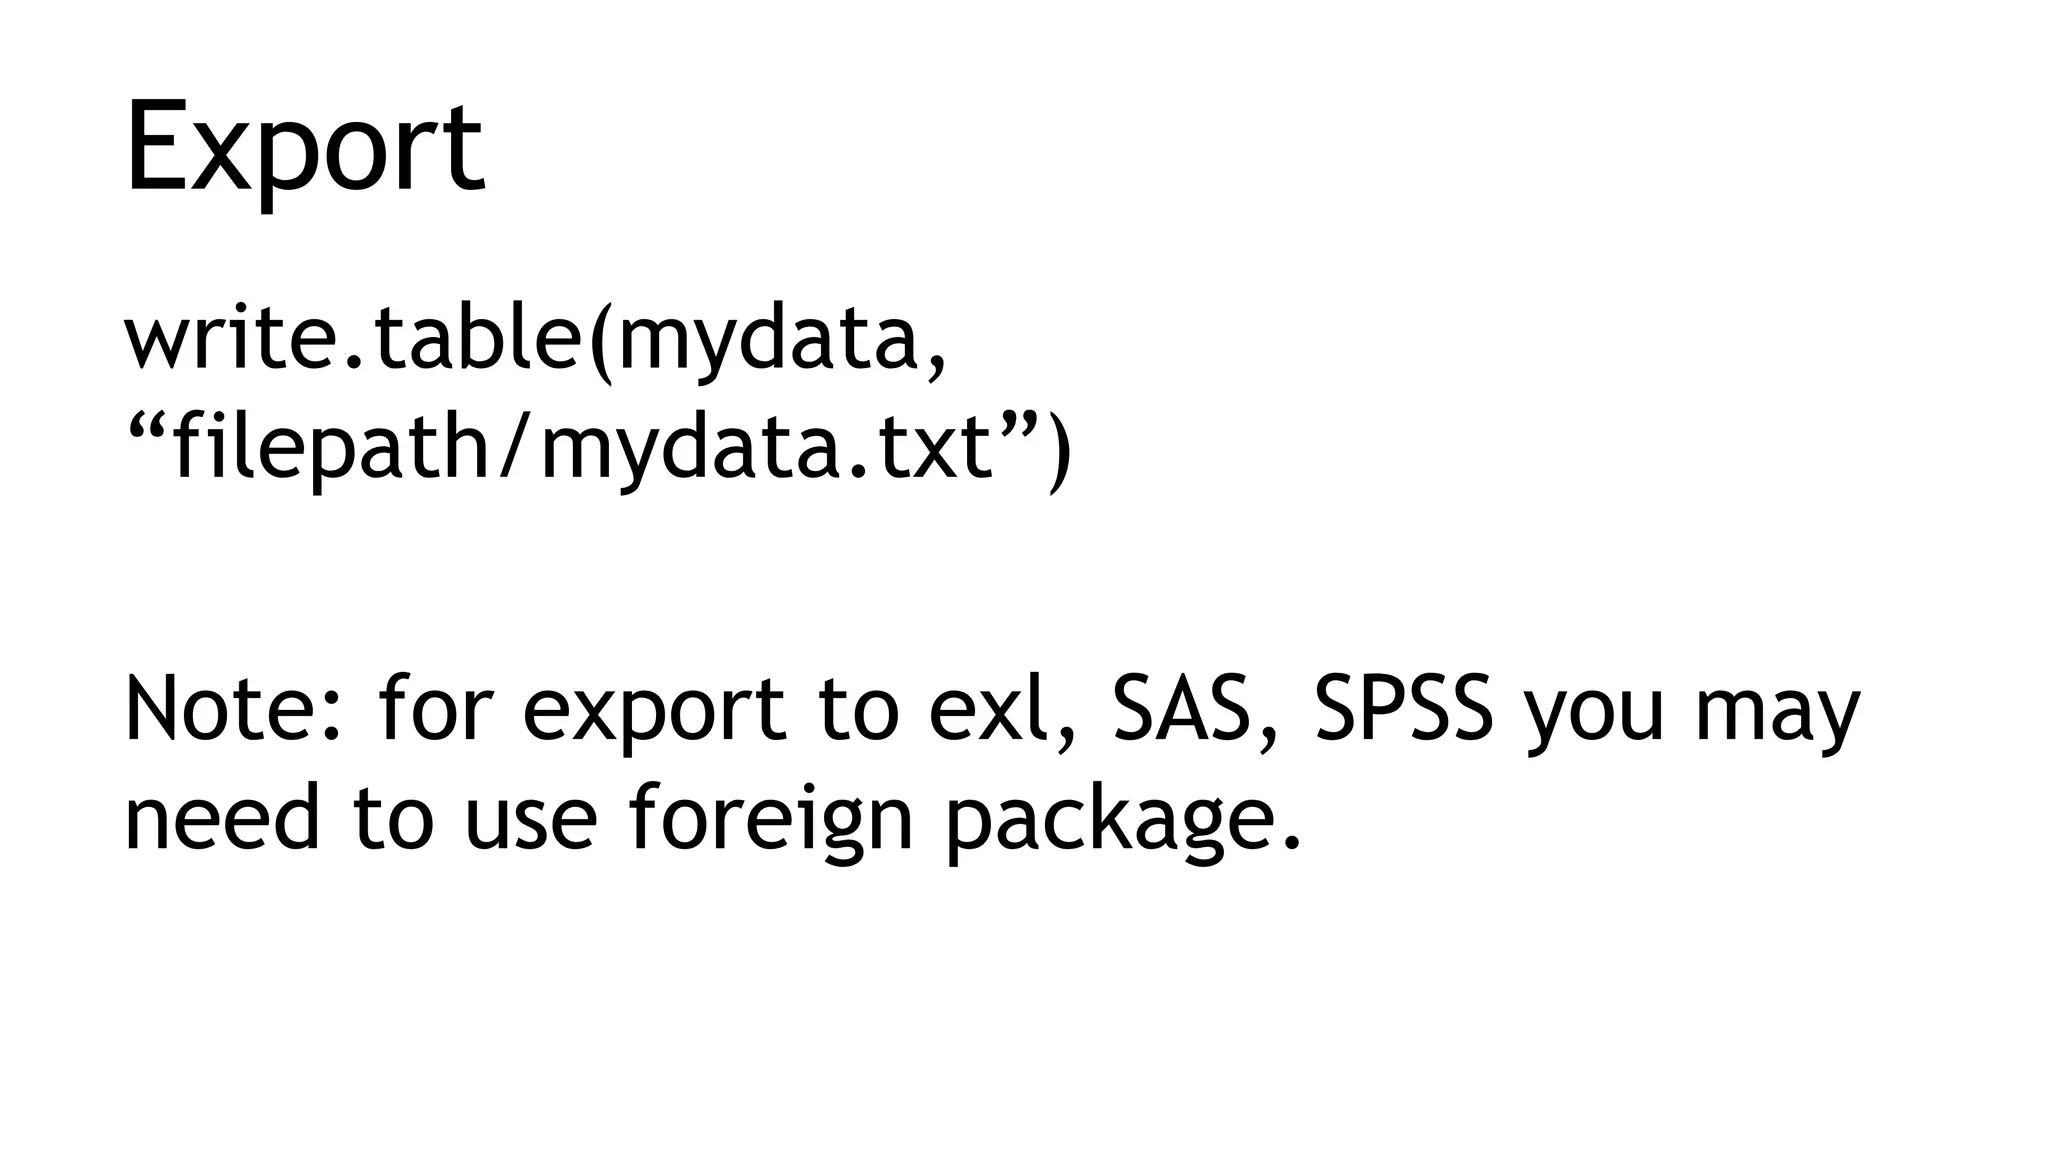
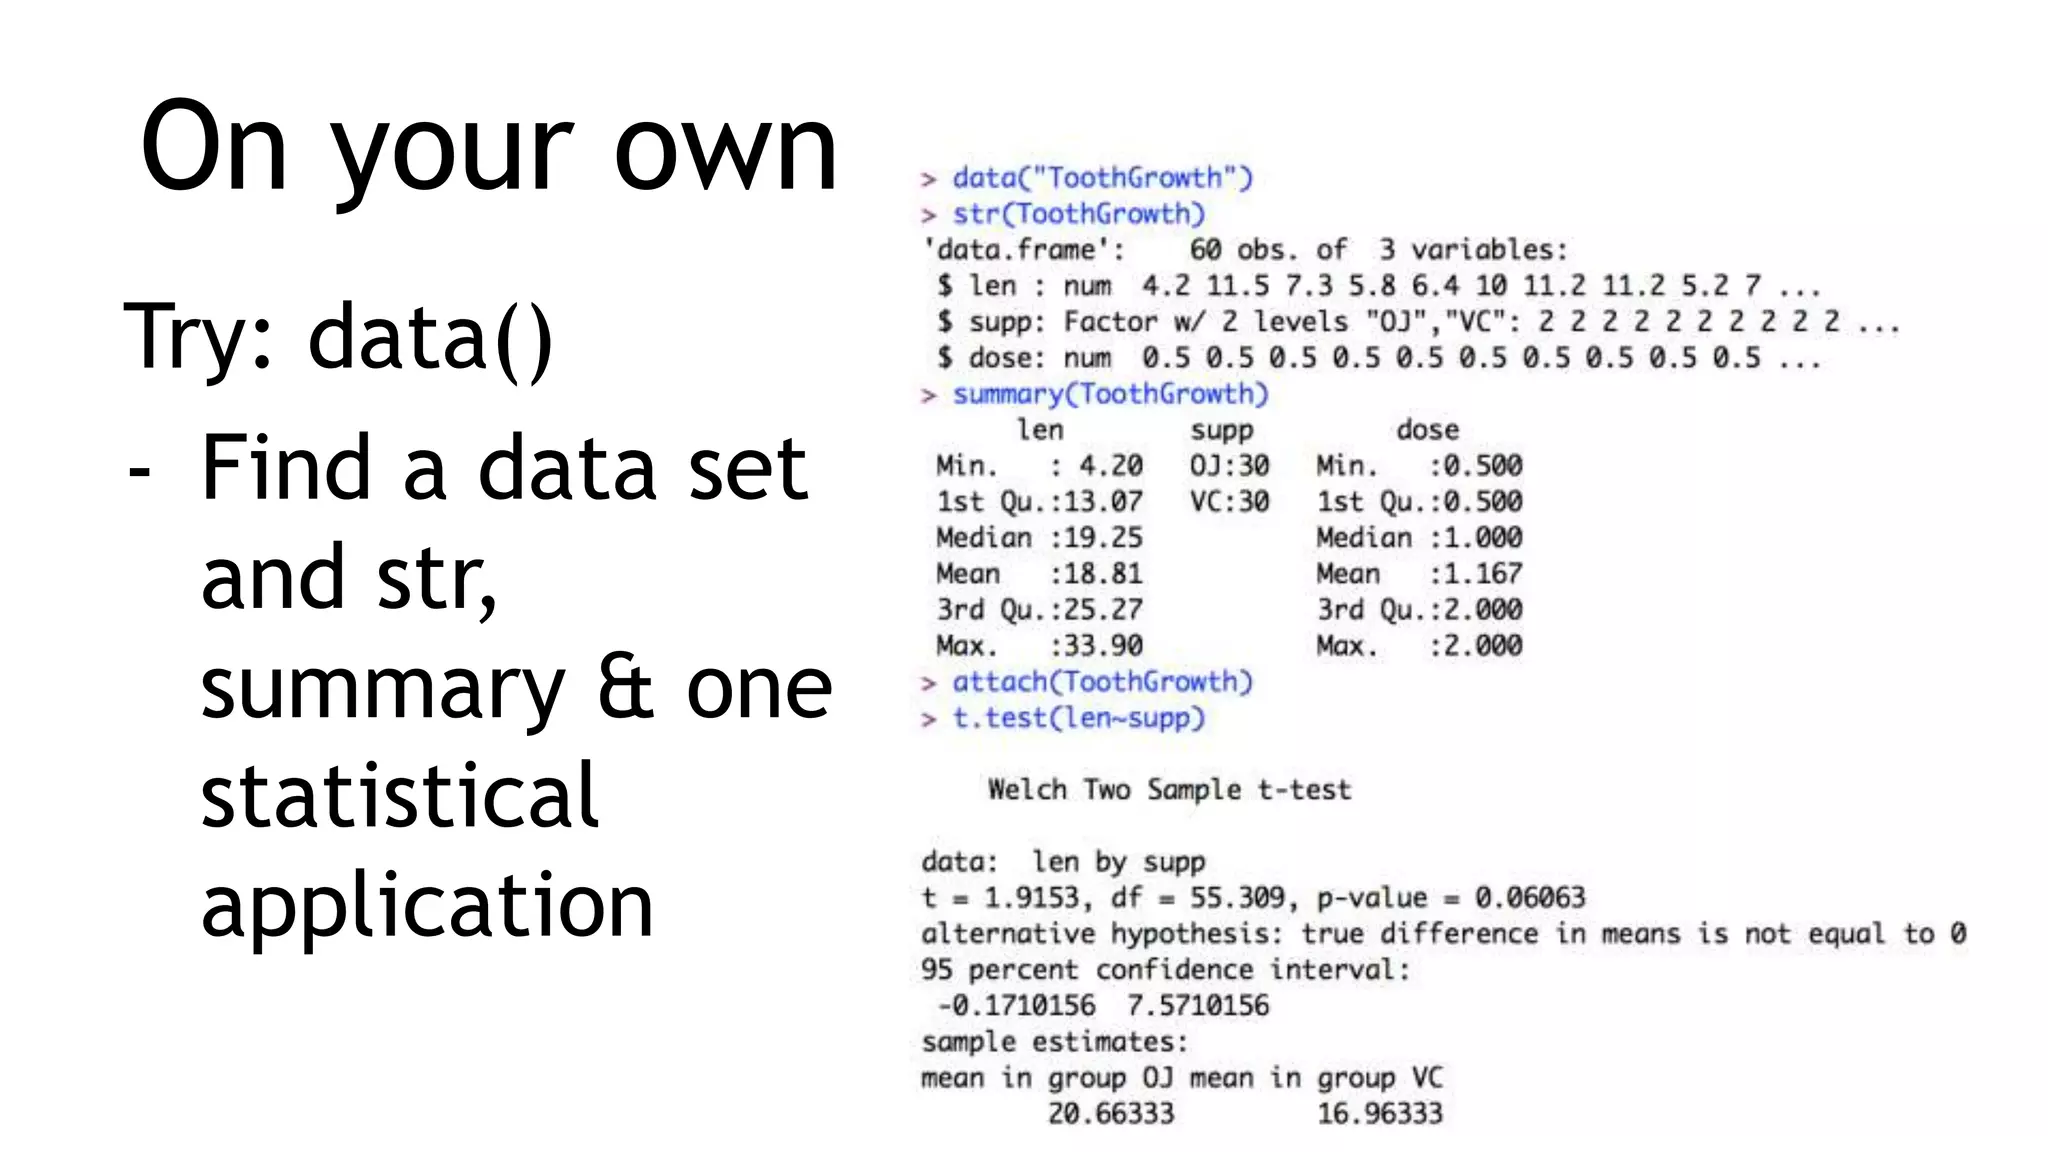
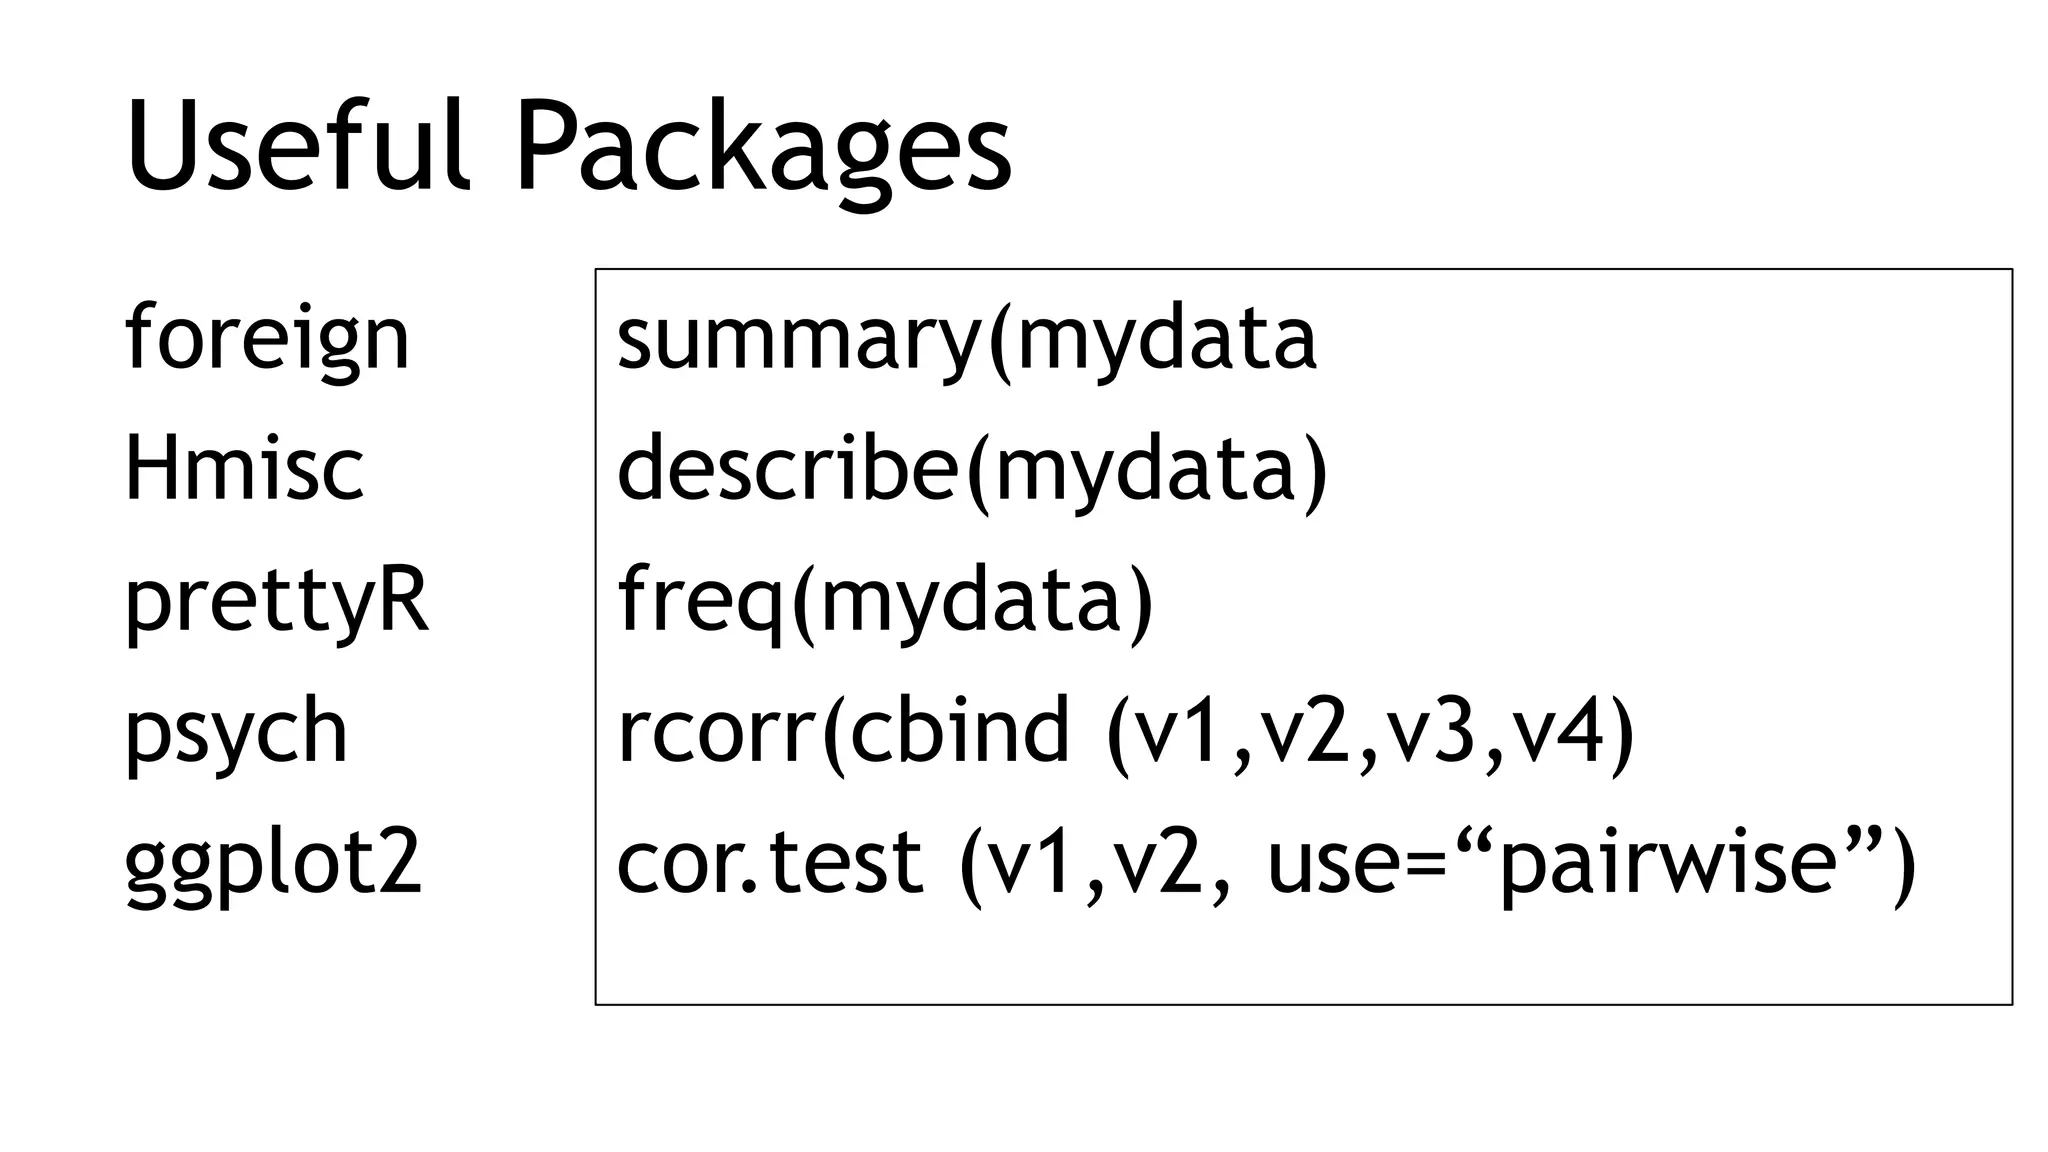
This document provides an introduction to using R for statistical analysis. It outlines how to get started with R, perform basic calculations and logic, work with variables, vectors, matrices and factors. It also demonstrates how to import and export data, call data within R, and describes some useful R packages. Examples are provided for each concept to help users get hands-on experience with the R programming language.