Download as PDF, PPTX


![Exercises
Finding the value in a vector that is closest to a specified value
closest<-function(xv,sv){
xv[which(abs(xv-sv)==min(abs(xv-sv)))]
}
Calculate a trimmed mean of x which ignores both the
smallest and largest values
trimmed.mean <- function (x) {
mean(x[-c(which(x==min(x)),which(x==max(x)))])
}](https://image.slidesharecdn.com/parti-introductiontorprogramming-110630064850-phpapp02/75/Introduction-to-R-programming-32-2048.jpg)
![lists
person <- list()
person$name <- "Alberto”
person$age <- 37
person$nationality <- "Spain“
class(persona)
[1] "list"
> persona
$name
[1] "Alberto"
$age
[1] 37
$nationality
[1] "Spain"
names(persona)
[1] “name" “age" "nationality"](https://image.slidesharecdn.com/parti-introductiontorprogramming-110630064850-phpapp02/75/Introduction-to-R-programming-37-2048.jpg)
![Strings
phrase<-"the quick brown fox jumps over the lazy dog"
letras <- table(strsplit(phrase,split=character(0)))
numwords<-1+table(strsplit(phrase,split=character(0)))[1]
words <- unlist(strsplit(phrase,split=" "))
words[grep("o",words)]
"fox" %in% unlist(strsplit(phrase,split=" "))
unlist(strsplit(phrase,,split=" ")) %in% c("fox","dog")](https://image.slidesharecdn.com/parti-introductiontorprogramming-110630064850-phpapp02/75/Introduction-to-R-programming-38-2048.jpg)
![Strings
nchar(words)
paste(words[1],words[2])
toupper(words)](https://image.slidesharecdn.com/parti-introductiontorprogramming-110630064850-phpapp02/75/Introduction-to-R-programming-39-2048.jpg)
![Regular expressions
grep("^t", words)
words[grep("^t", words)]
words[grep("s$", words)]
gsub("o","O",words)
regexp()](https://image.slidesharecdn.com/parti-introductiontorprogramming-110630064850-phpapp02/75/Introduction-to-R-programming-40-2048.jpg)
![Dataframes
lista <- data.frame()
lista[1,1] = "Alberto"
lista[1,2] = 37
lista[2,1] = "Ana"
lista[2,2] = 23
names(lista) <- c("Ana", "Edad")](https://image.slidesharecdn.com/parti-introductiontorprogramming-110630064850-phpapp02/75/Introduction-to-R-programming-41-2048.jpg)
![Missing values
NA (is.na)
x<-c(1:8,NA)
mean(x)
mean(x,na.rm=T)
which(is.na(x))
as.vector(na.omit(x))
x[!is.na(x)]](https://image.slidesharecdn.com/parti-introductiontorprogramming-110630064850-phpapp02/75/Introduction-to-R-programming-42-2048.jpg)
![Avoid loops
x<-runif(10000000)
system.time(max(x))
pc<-proc.time()
cmax<-x[1]
for (i in 2:length(x)) {
if(x[i]>cmax) cmax<-x[i]
}
proc.time()-pc](https://image.slidesharecdn.com/parti-introductiontorprogramming-110630064850-phpapp02/75/Introduction-to-R-programming-48-2048.jpg)


![Exercises
Finding the value in a vector that is closest to a specified value
closest<-function(xv,sv){
xv[which(abs(xv-sv)==min(abs(xv-sv)))]
}
Calculate a trimmed mean of x which ignores both the
smallest and largest values
trimmed.mean <- function (x) {
mean(x[-c(which(x==min(x)),which(x==max(x)))])
}](https://crownmelresort.com/image.slidesharecdn.com/parti-introductiontorprogramming-110630064850-phpapp02/75/Introduction-to-R-programming-32-2048.jpg)


![lists
person <- list()
person$name <- "Alberto”
person$age <- 37
person$nationality <- "Spain“
class(persona)
[1] "list"
> persona
$name
[1] "Alberto"
$age
[1] 37
$nationality
[1] "Spain"
names(persona)
[1] “name" “age" "nationality"](https://crownmelresort.com/image.slidesharecdn.com/parti-introductiontorprogramming-110630064850-phpapp02/75/Introduction-to-R-programming-37-2048.jpg)
![Strings
phrase<-"the quick brown fox jumps over the lazy dog"
letras <- table(strsplit(phrase,split=character(0)))
numwords<-1+table(strsplit(phrase,split=character(0)))[1]
words <- unlist(strsplit(phrase,split=" "))
words[grep("o",words)]
"fox" %in% unlist(strsplit(phrase,split=" "))
unlist(strsplit(phrase,,split=" ")) %in% c("fox","dog")](https://crownmelresort.com/image.slidesharecdn.com/parti-introductiontorprogramming-110630064850-phpapp02/75/Introduction-to-R-programming-38-2048.jpg)
![Strings
nchar(words)
paste(words[1],words[2])
toupper(words)](https://crownmelresort.com/image.slidesharecdn.com/parti-introductiontorprogramming-110630064850-phpapp02/75/Introduction-to-R-programming-39-2048.jpg)
![Regular expressions
grep("^t", words)
words[grep("^t", words)]
words[grep("s$", words)]
gsub("o","O",words)
regexp()](https://crownmelresort.com/image.slidesharecdn.com/parti-introductiontorprogramming-110630064850-phpapp02/75/Introduction-to-R-programming-40-2048.jpg)
![Dataframes
lista <- data.frame()
lista[1,1] = "Alberto"
lista[1,2] = 37
lista[2,1] = "Ana"
lista[2,2] = 23
names(lista) <- c("Ana", "Edad")](https://crownmelresort.com/image.slidesharecdn.com/parti-introductiontorprogramming-110630064850-phpapp02/75/Introduction-to-R-programming-41-2048.jpg)
![Missing values
NA (is.na)
x<-c(1:8,NA)
mean(x)
mean(x,na.rm=T)
which(is.na(x))
as.vector(na.omit(x))
x[!is.na(x)]](https://crownmelresort.com/image.slidesharecdn.com/parti-introductiontorprogramming-110630064850-phpapp02/75/Introduction-to-R-programming-42-2048.jpg)


![Avoid loops
x<-runif(10000000)
system.time(max(x))
pc<-proc.time()
cmax<-x[1]
for (i in 2:length(x)) {
if(x[i]>cmax) cmax<-x[i]
}
proc.time()-pc](https://crownmelresort.com/image.slidesharecdn.com/parti-introductiontorprogramming-110630064850-phpapp02/75/Introduction-to-R-programming-48-2048.jpg)


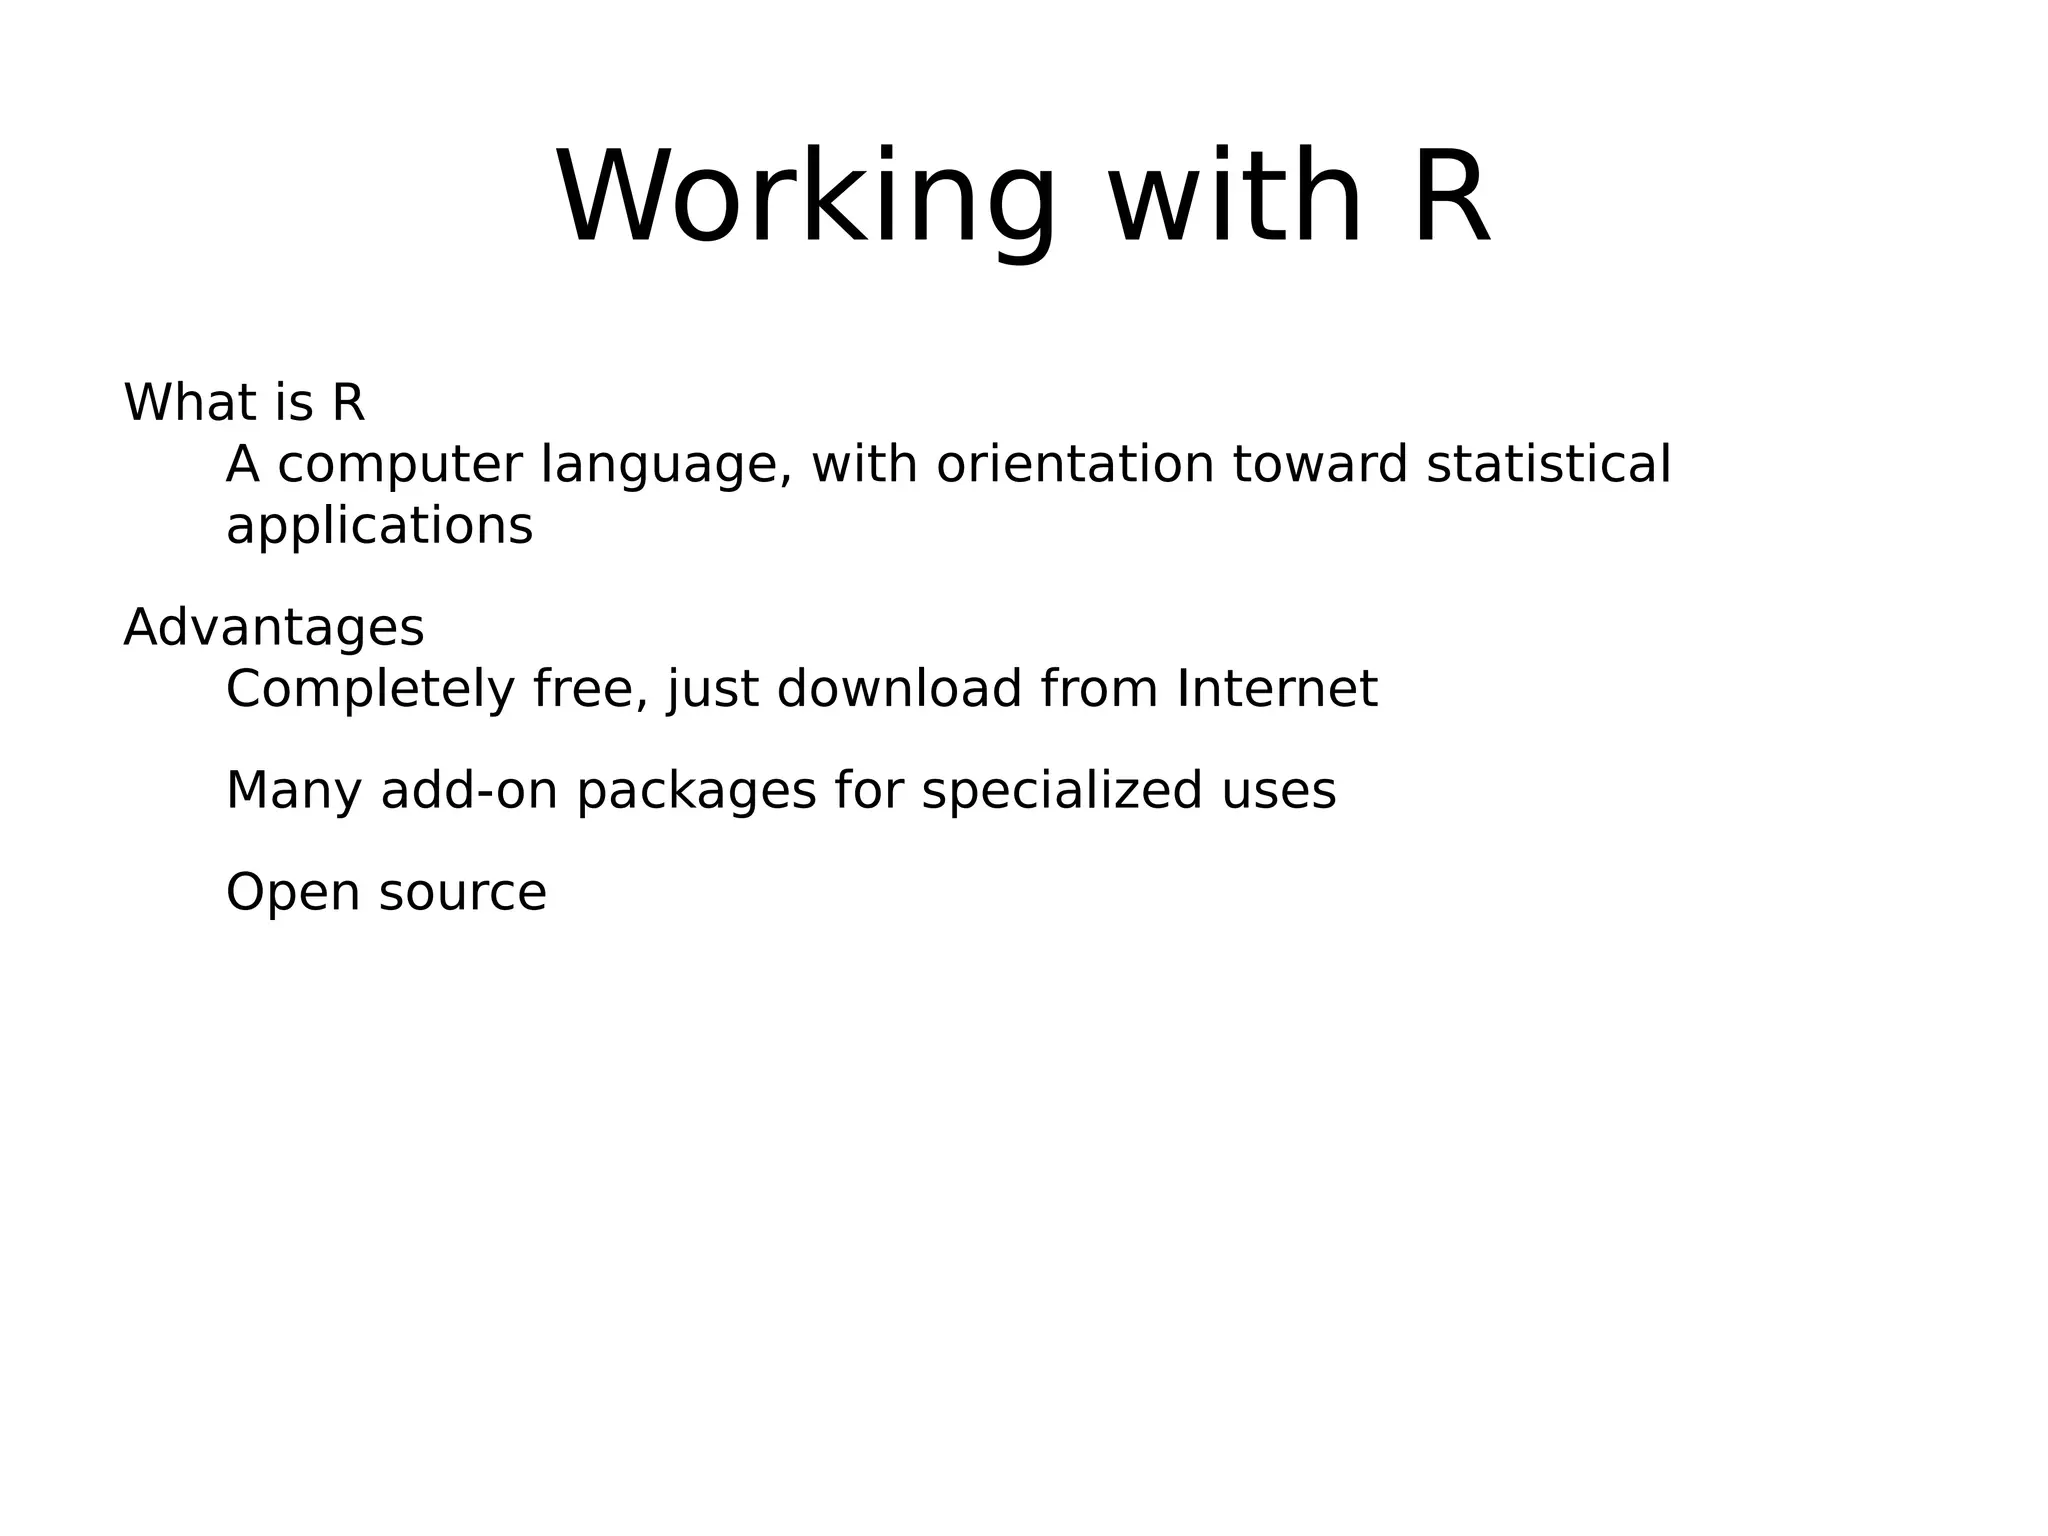
R is a free and open-source programming language for statistical analysis and graphics. It allows users to import, clean, transform, visualize and model data. Key features of R include its large collection of statistical and graphical techniques, ability to easily extend its functionality through user-contributed packages, and open-source nature which allows for free use and development. The document provides instructions on installing R, getting started with the R interface and commands, and an overview of common functions and operations for data analysis, visualization and statistics.
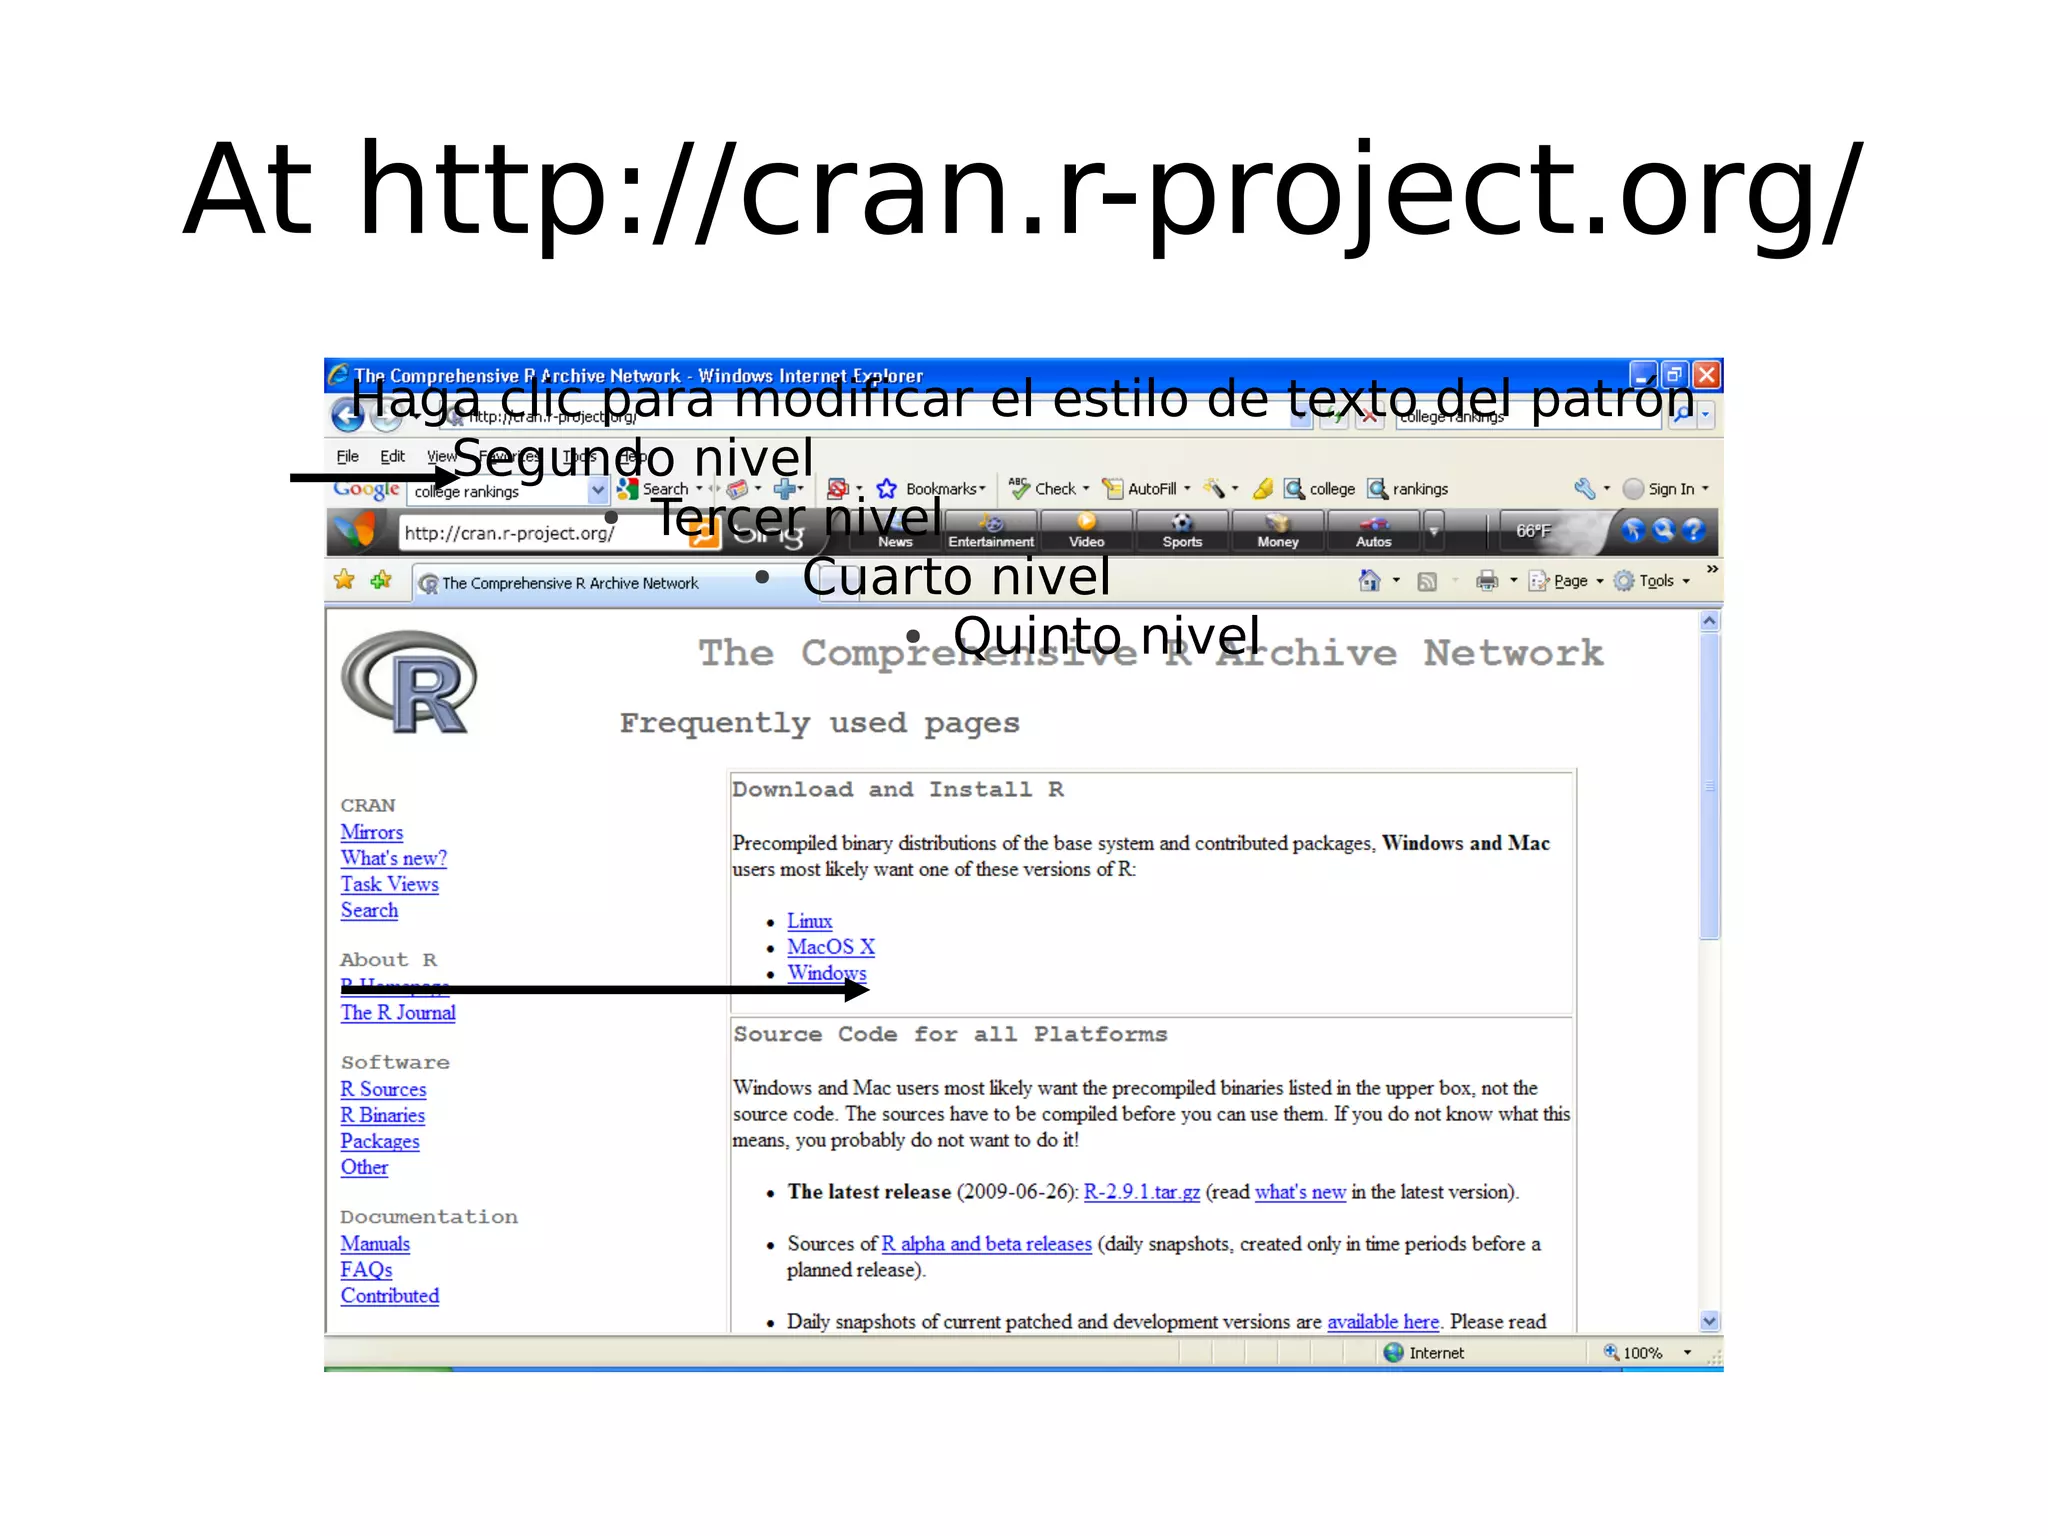
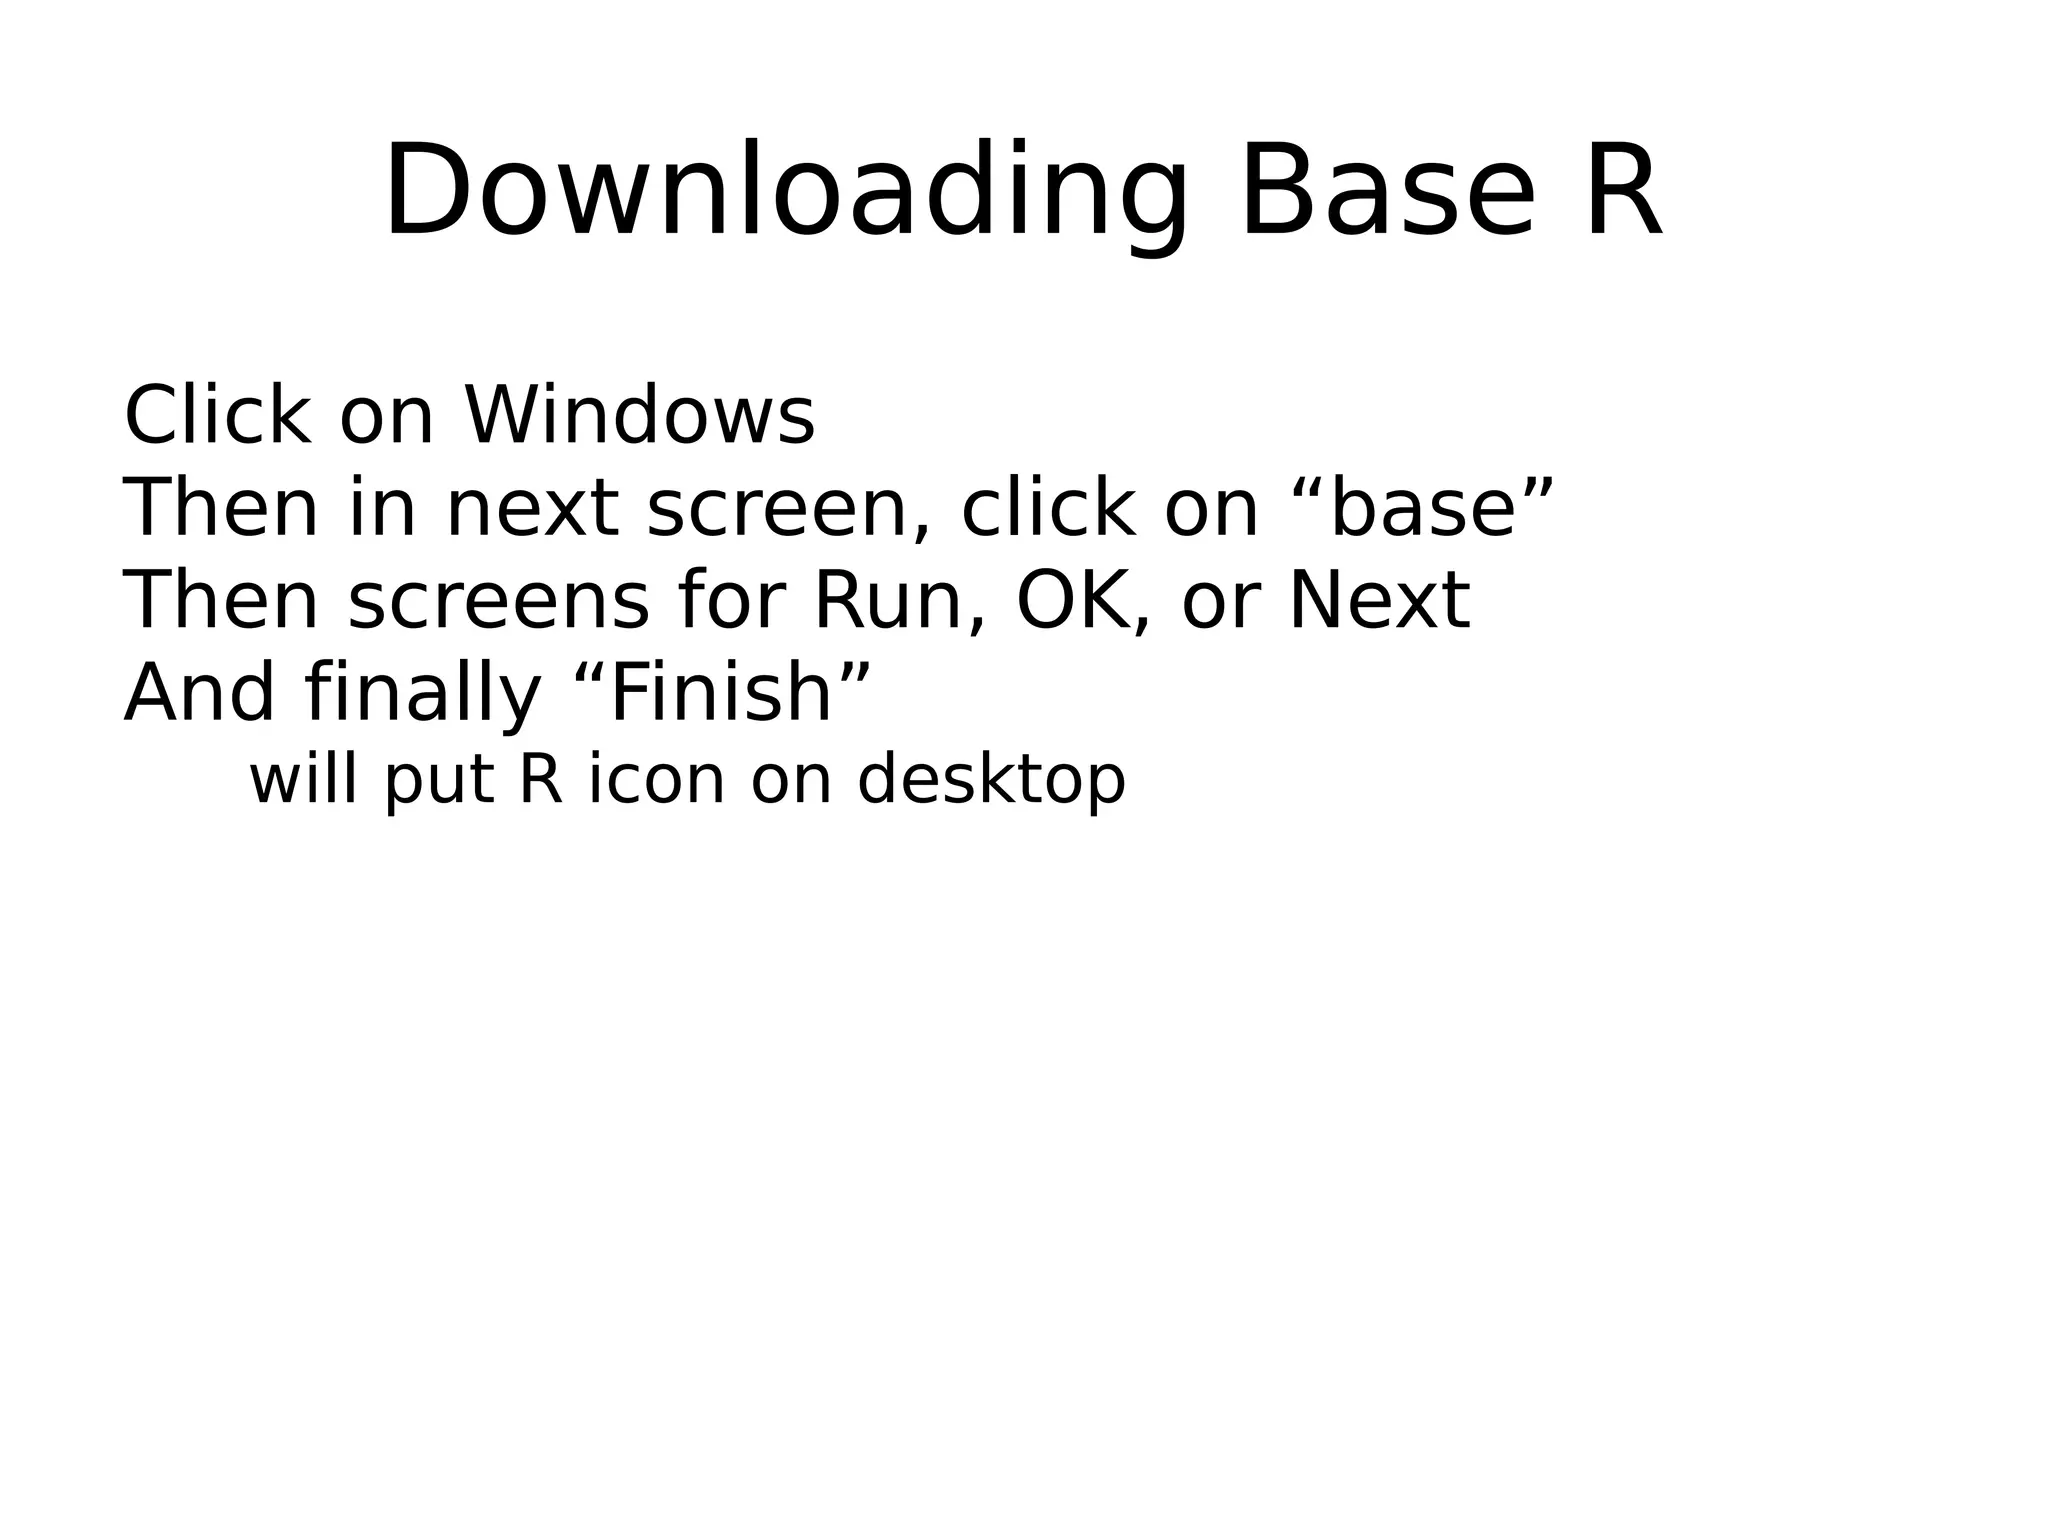
Introduction to R as a statistical language, its advantages, installation steps, and finding resources online.
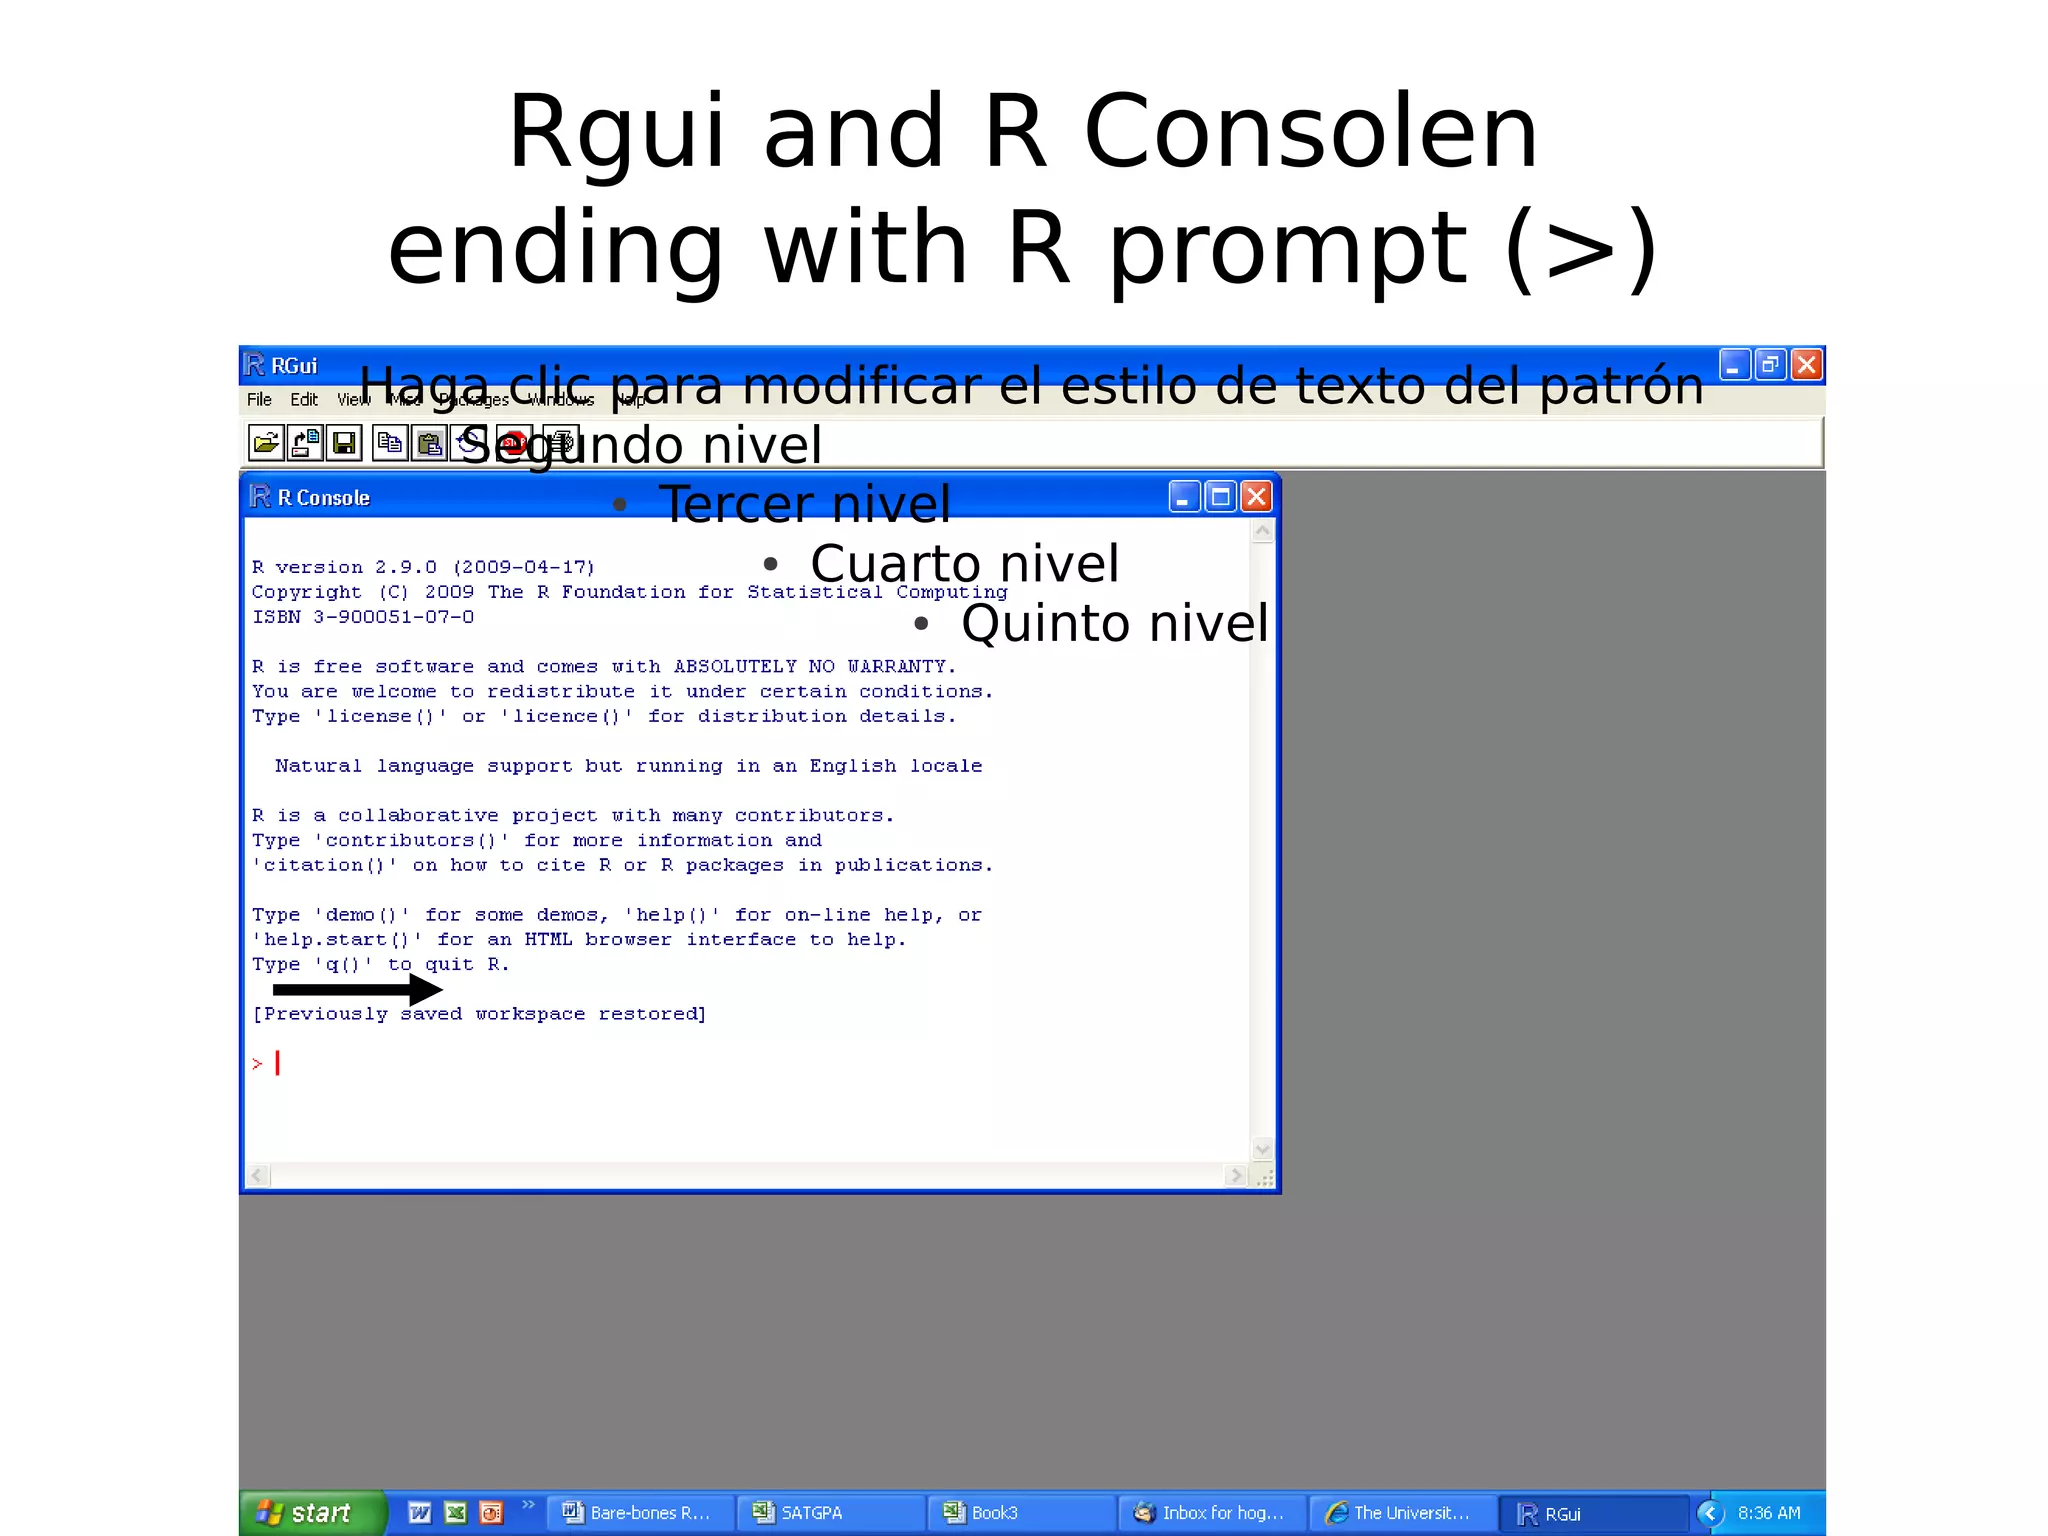
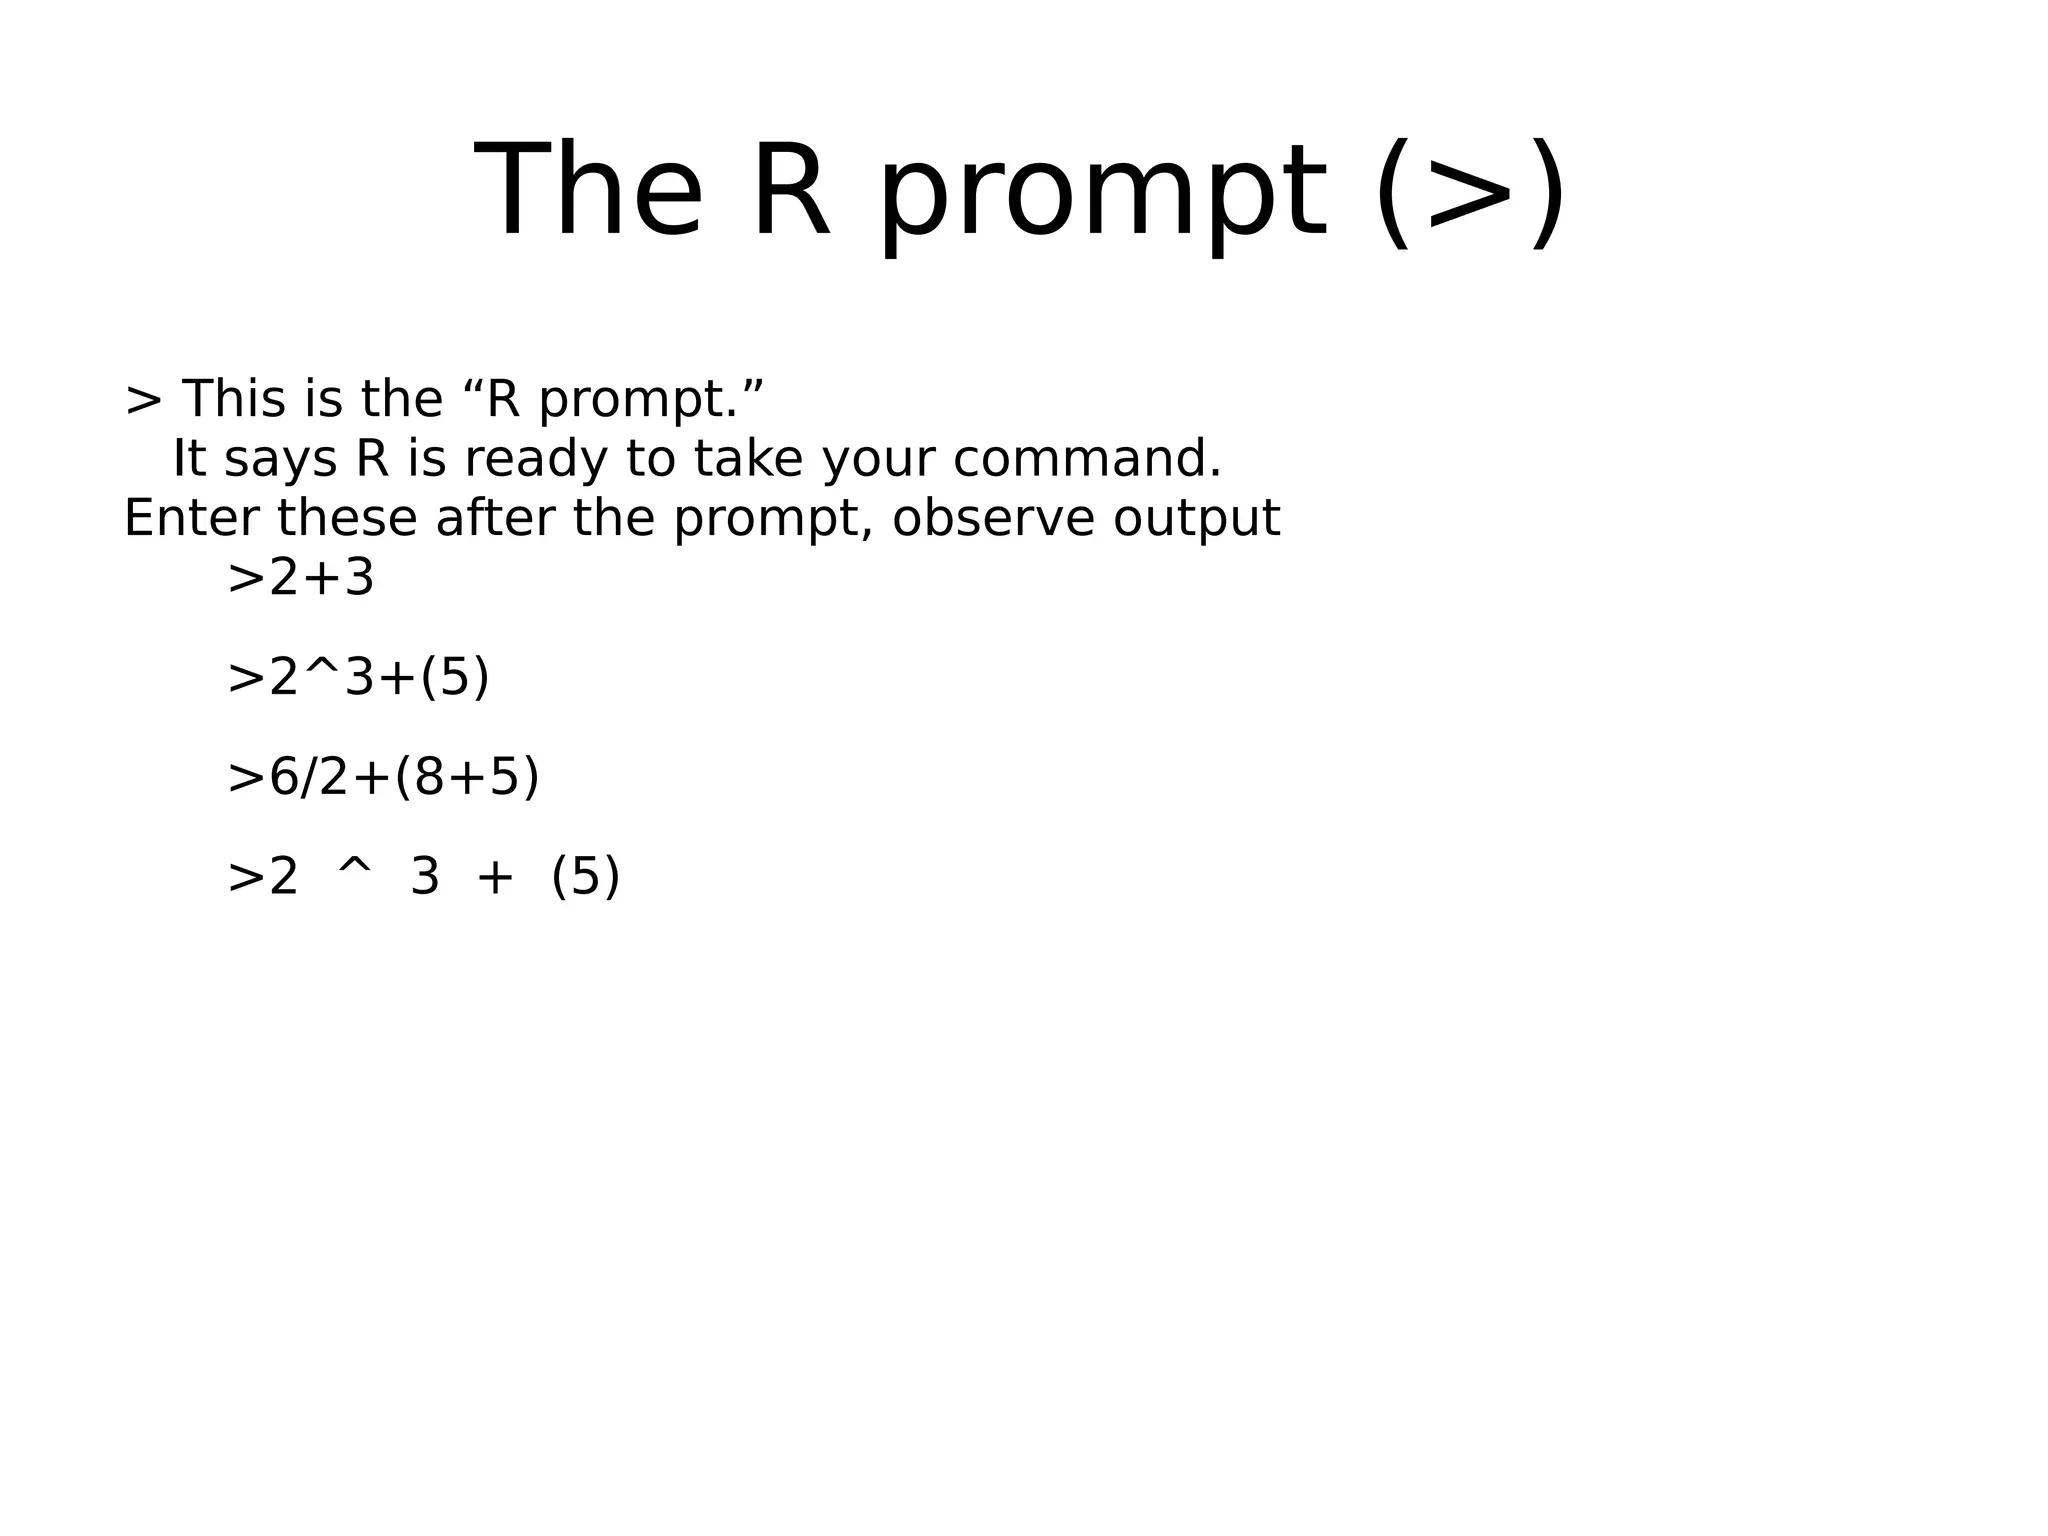
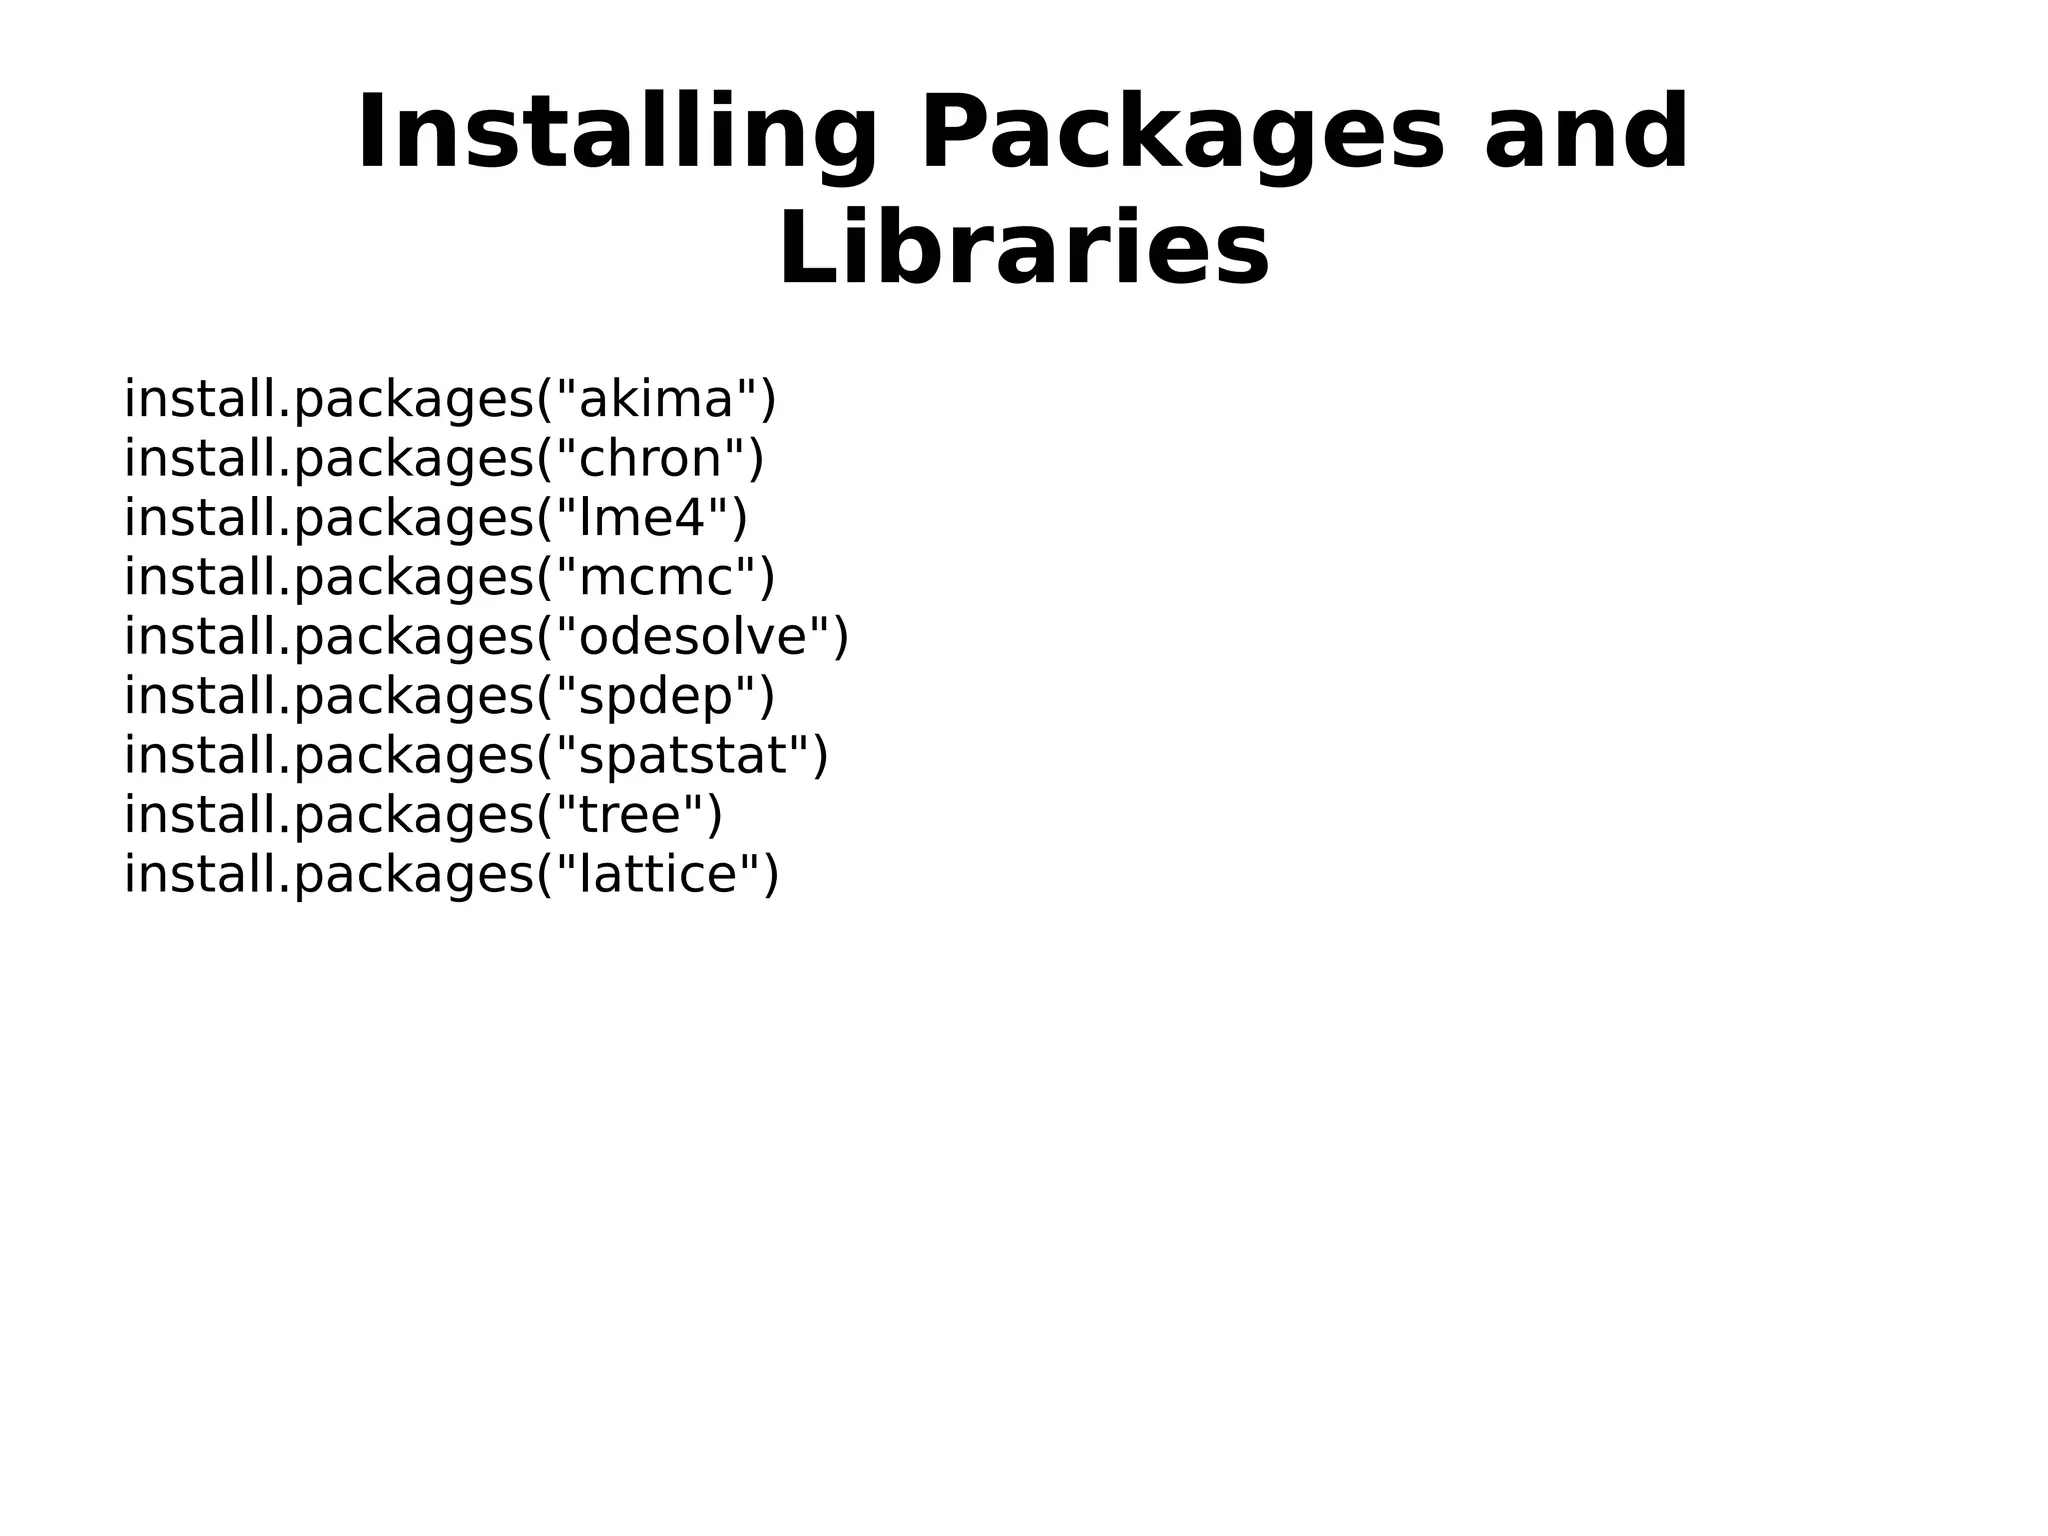
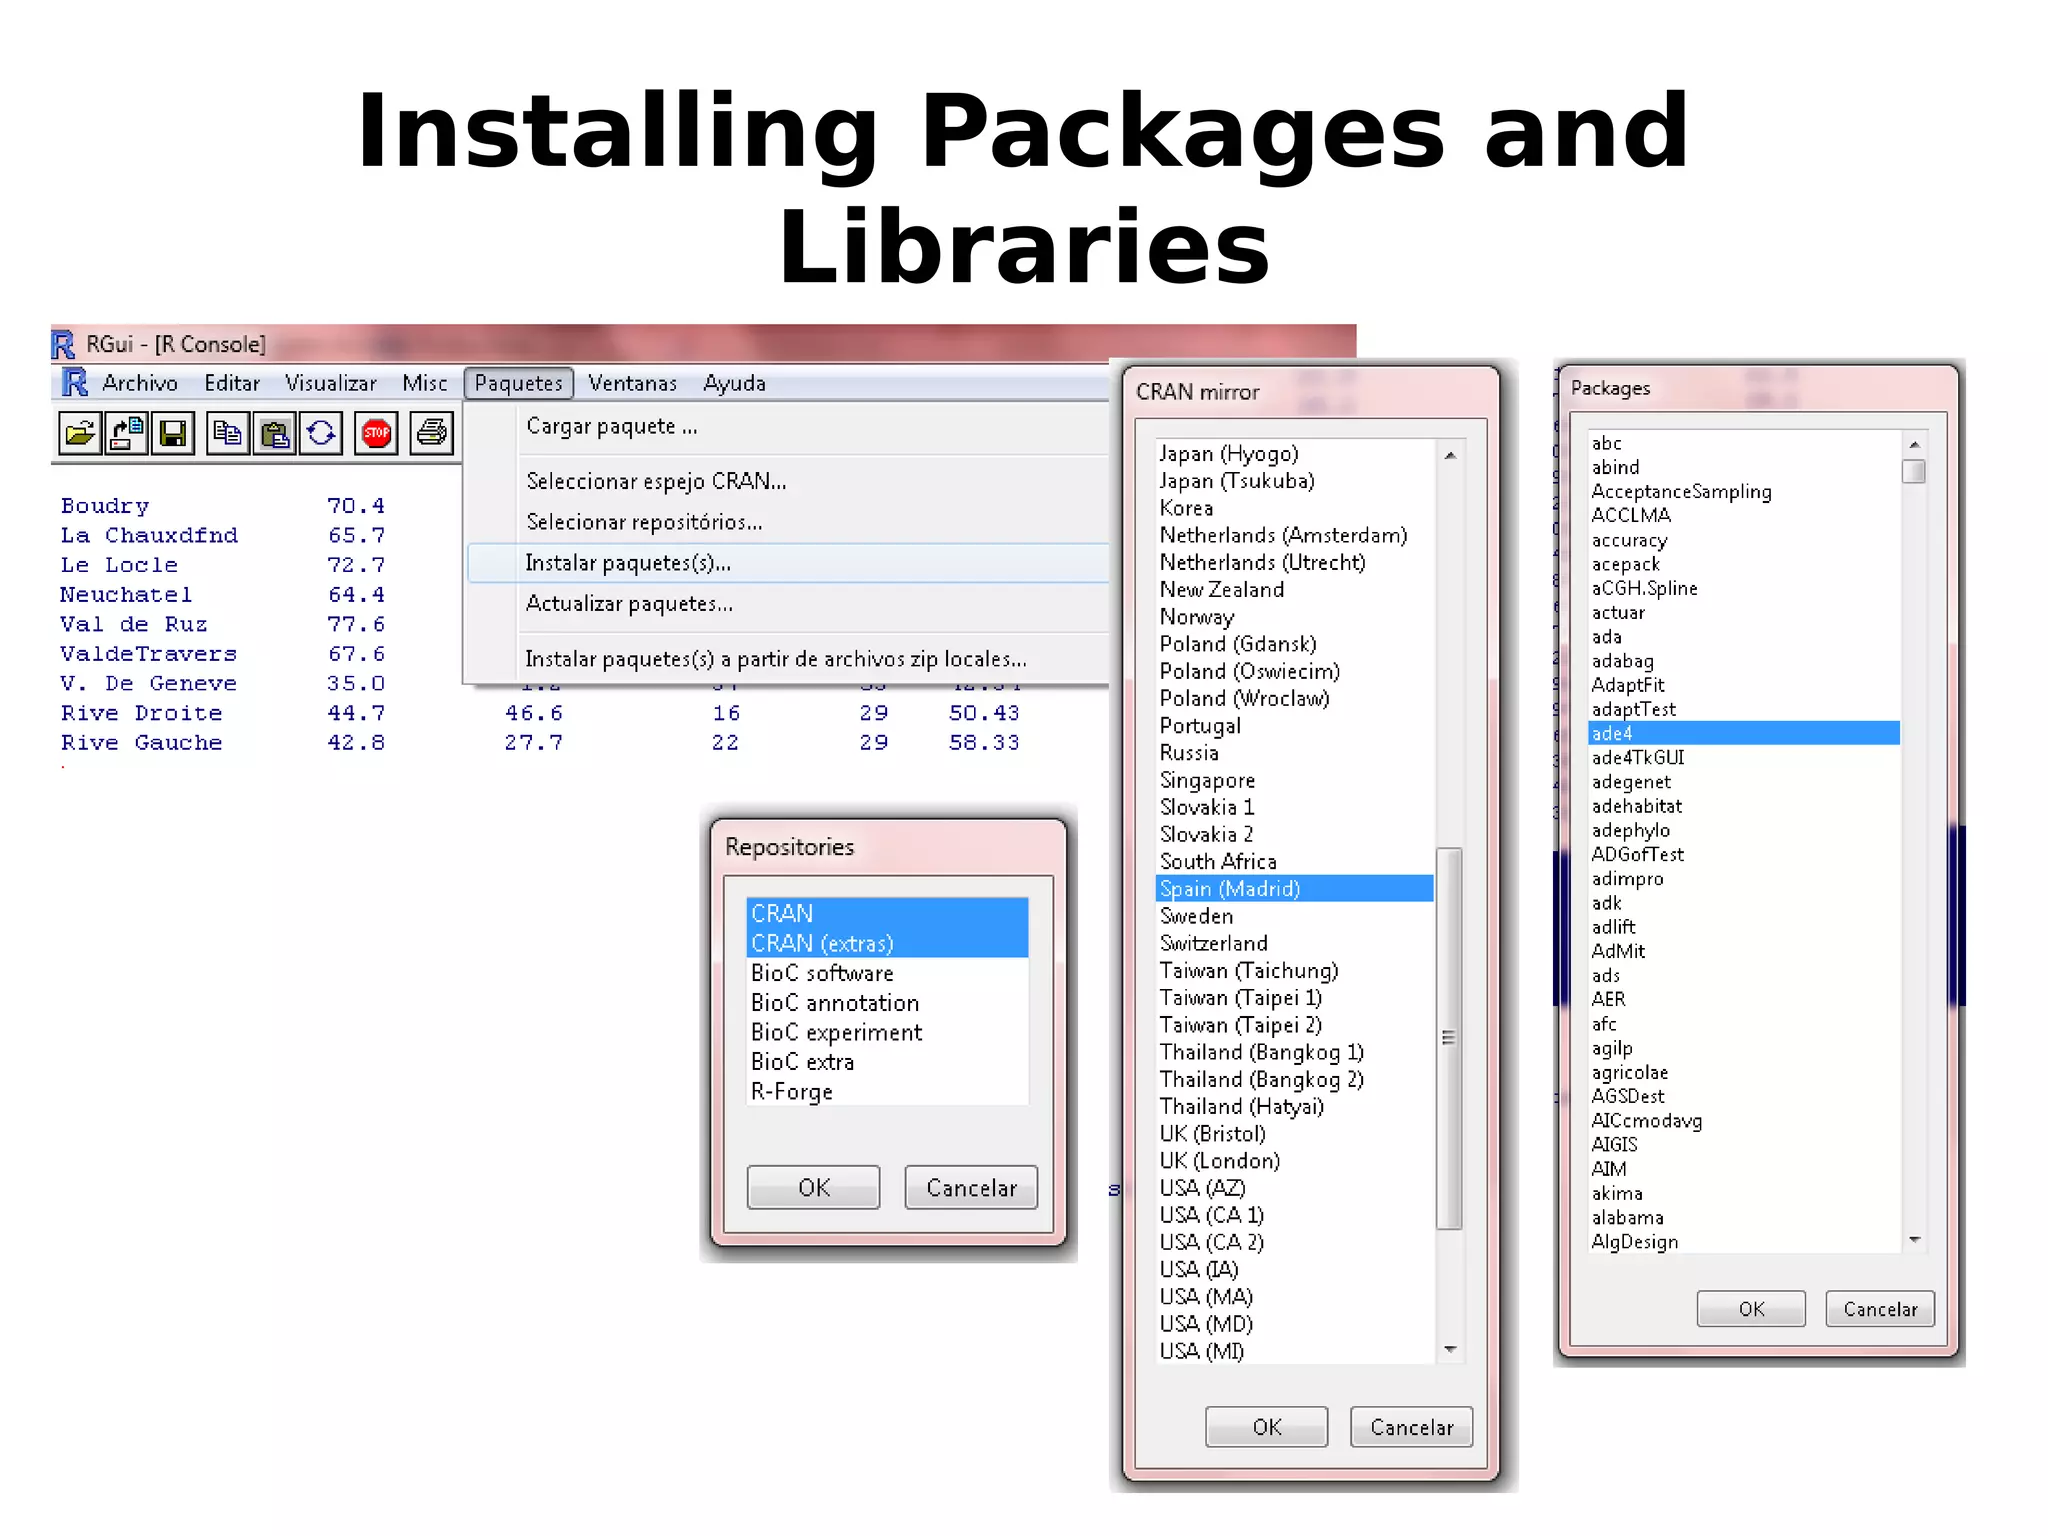
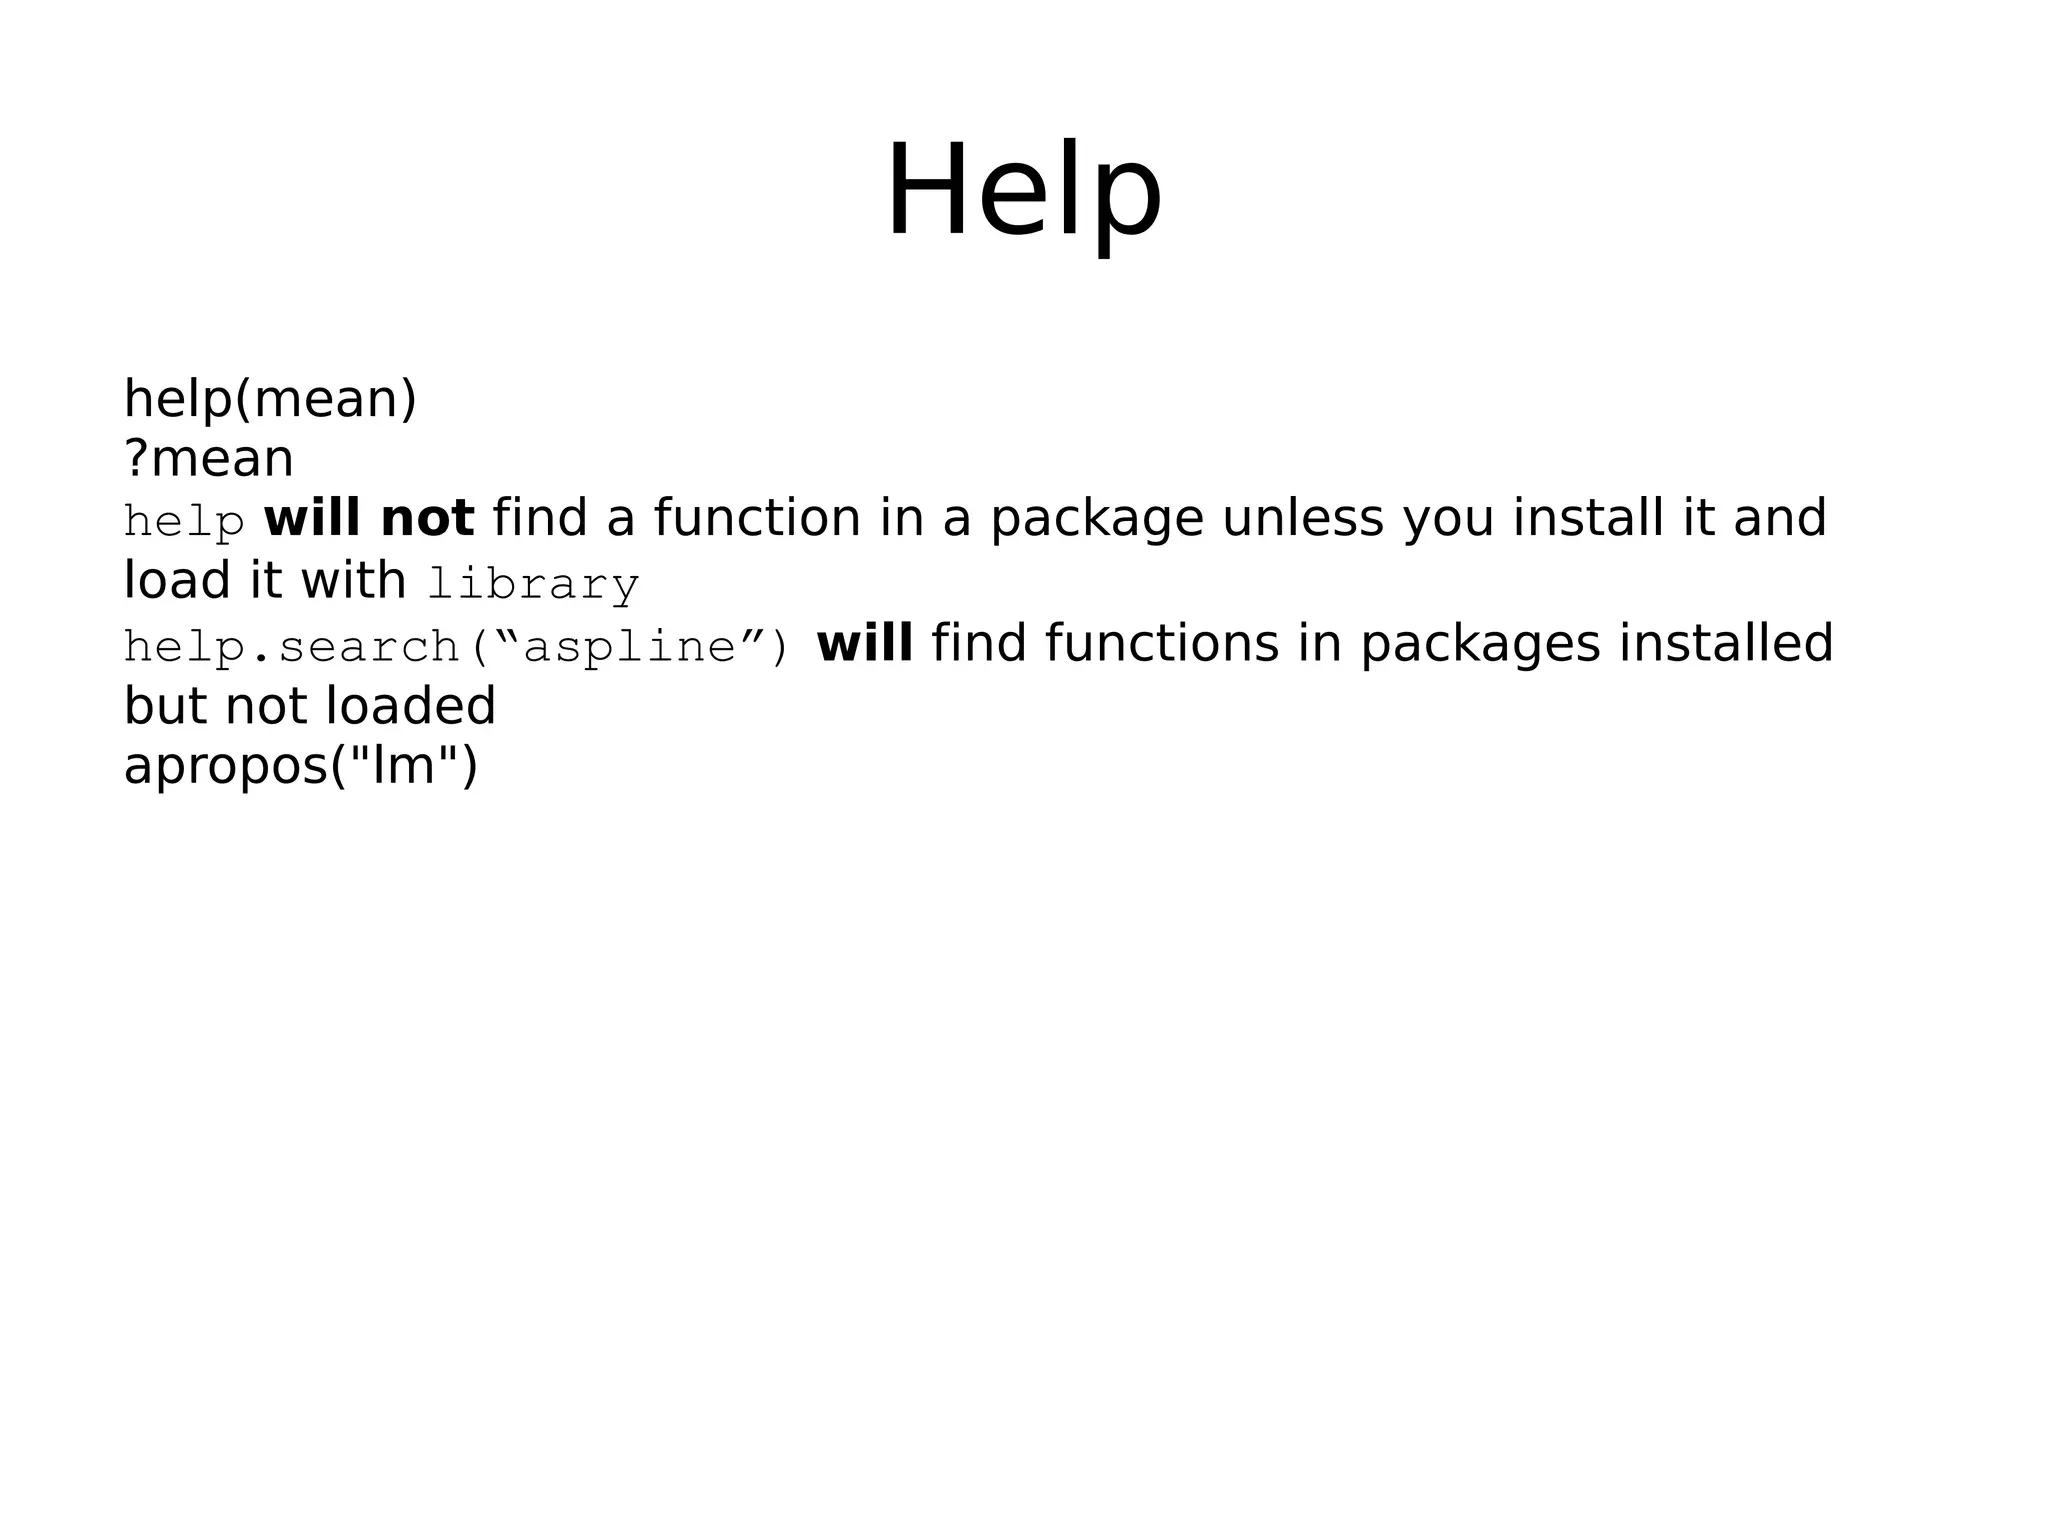
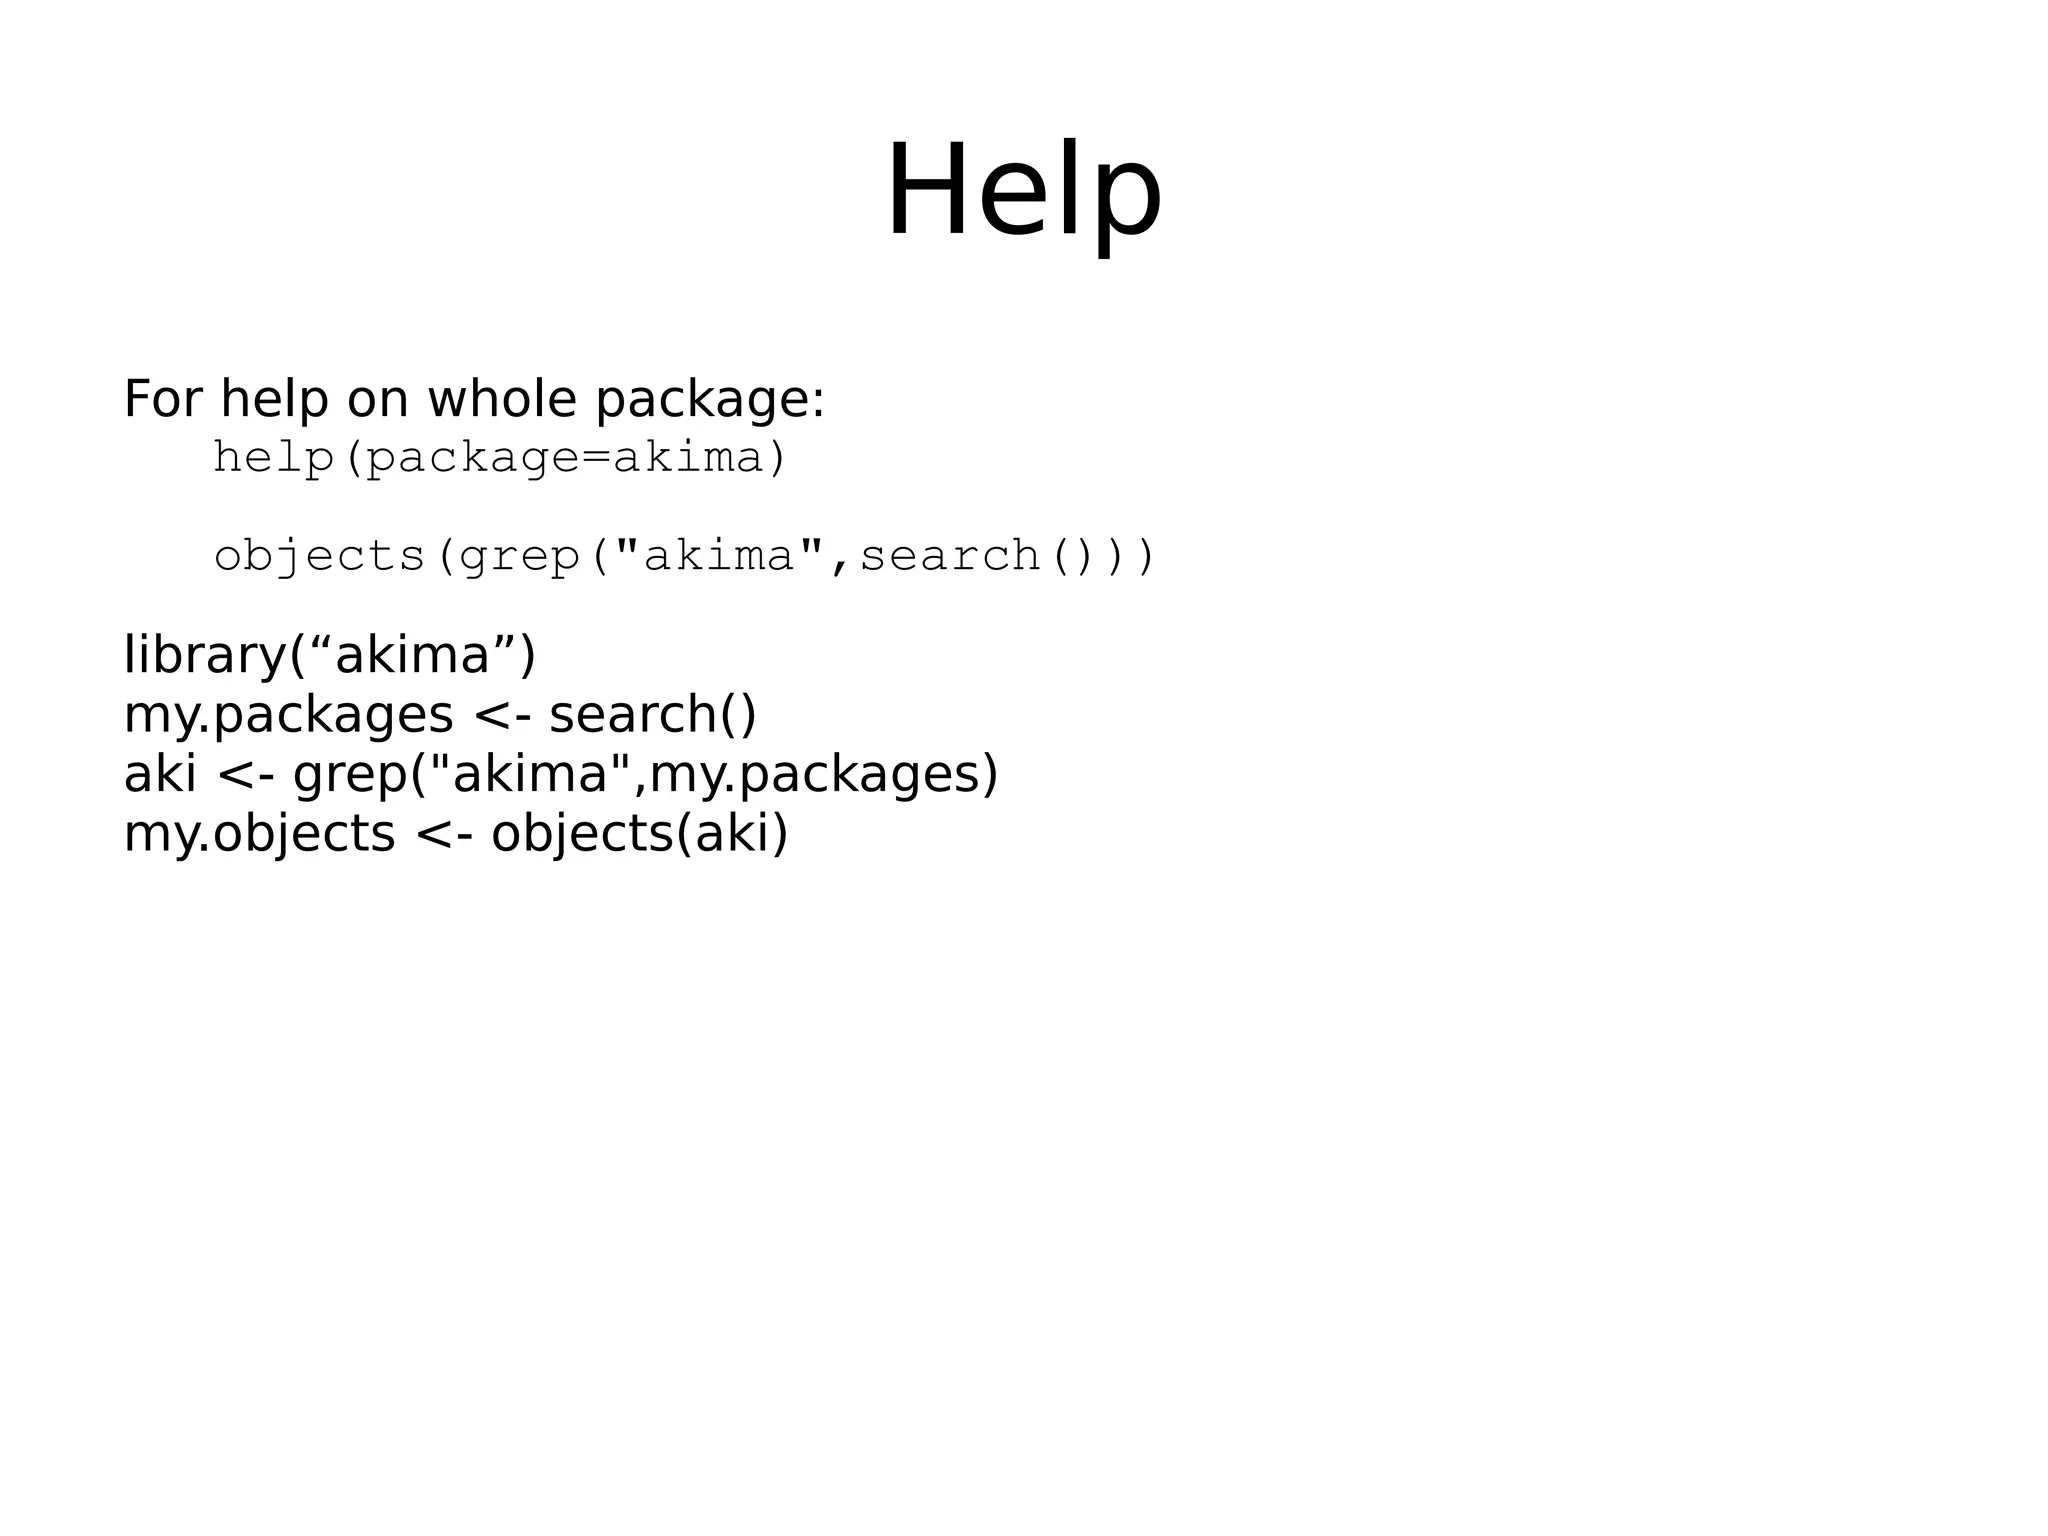
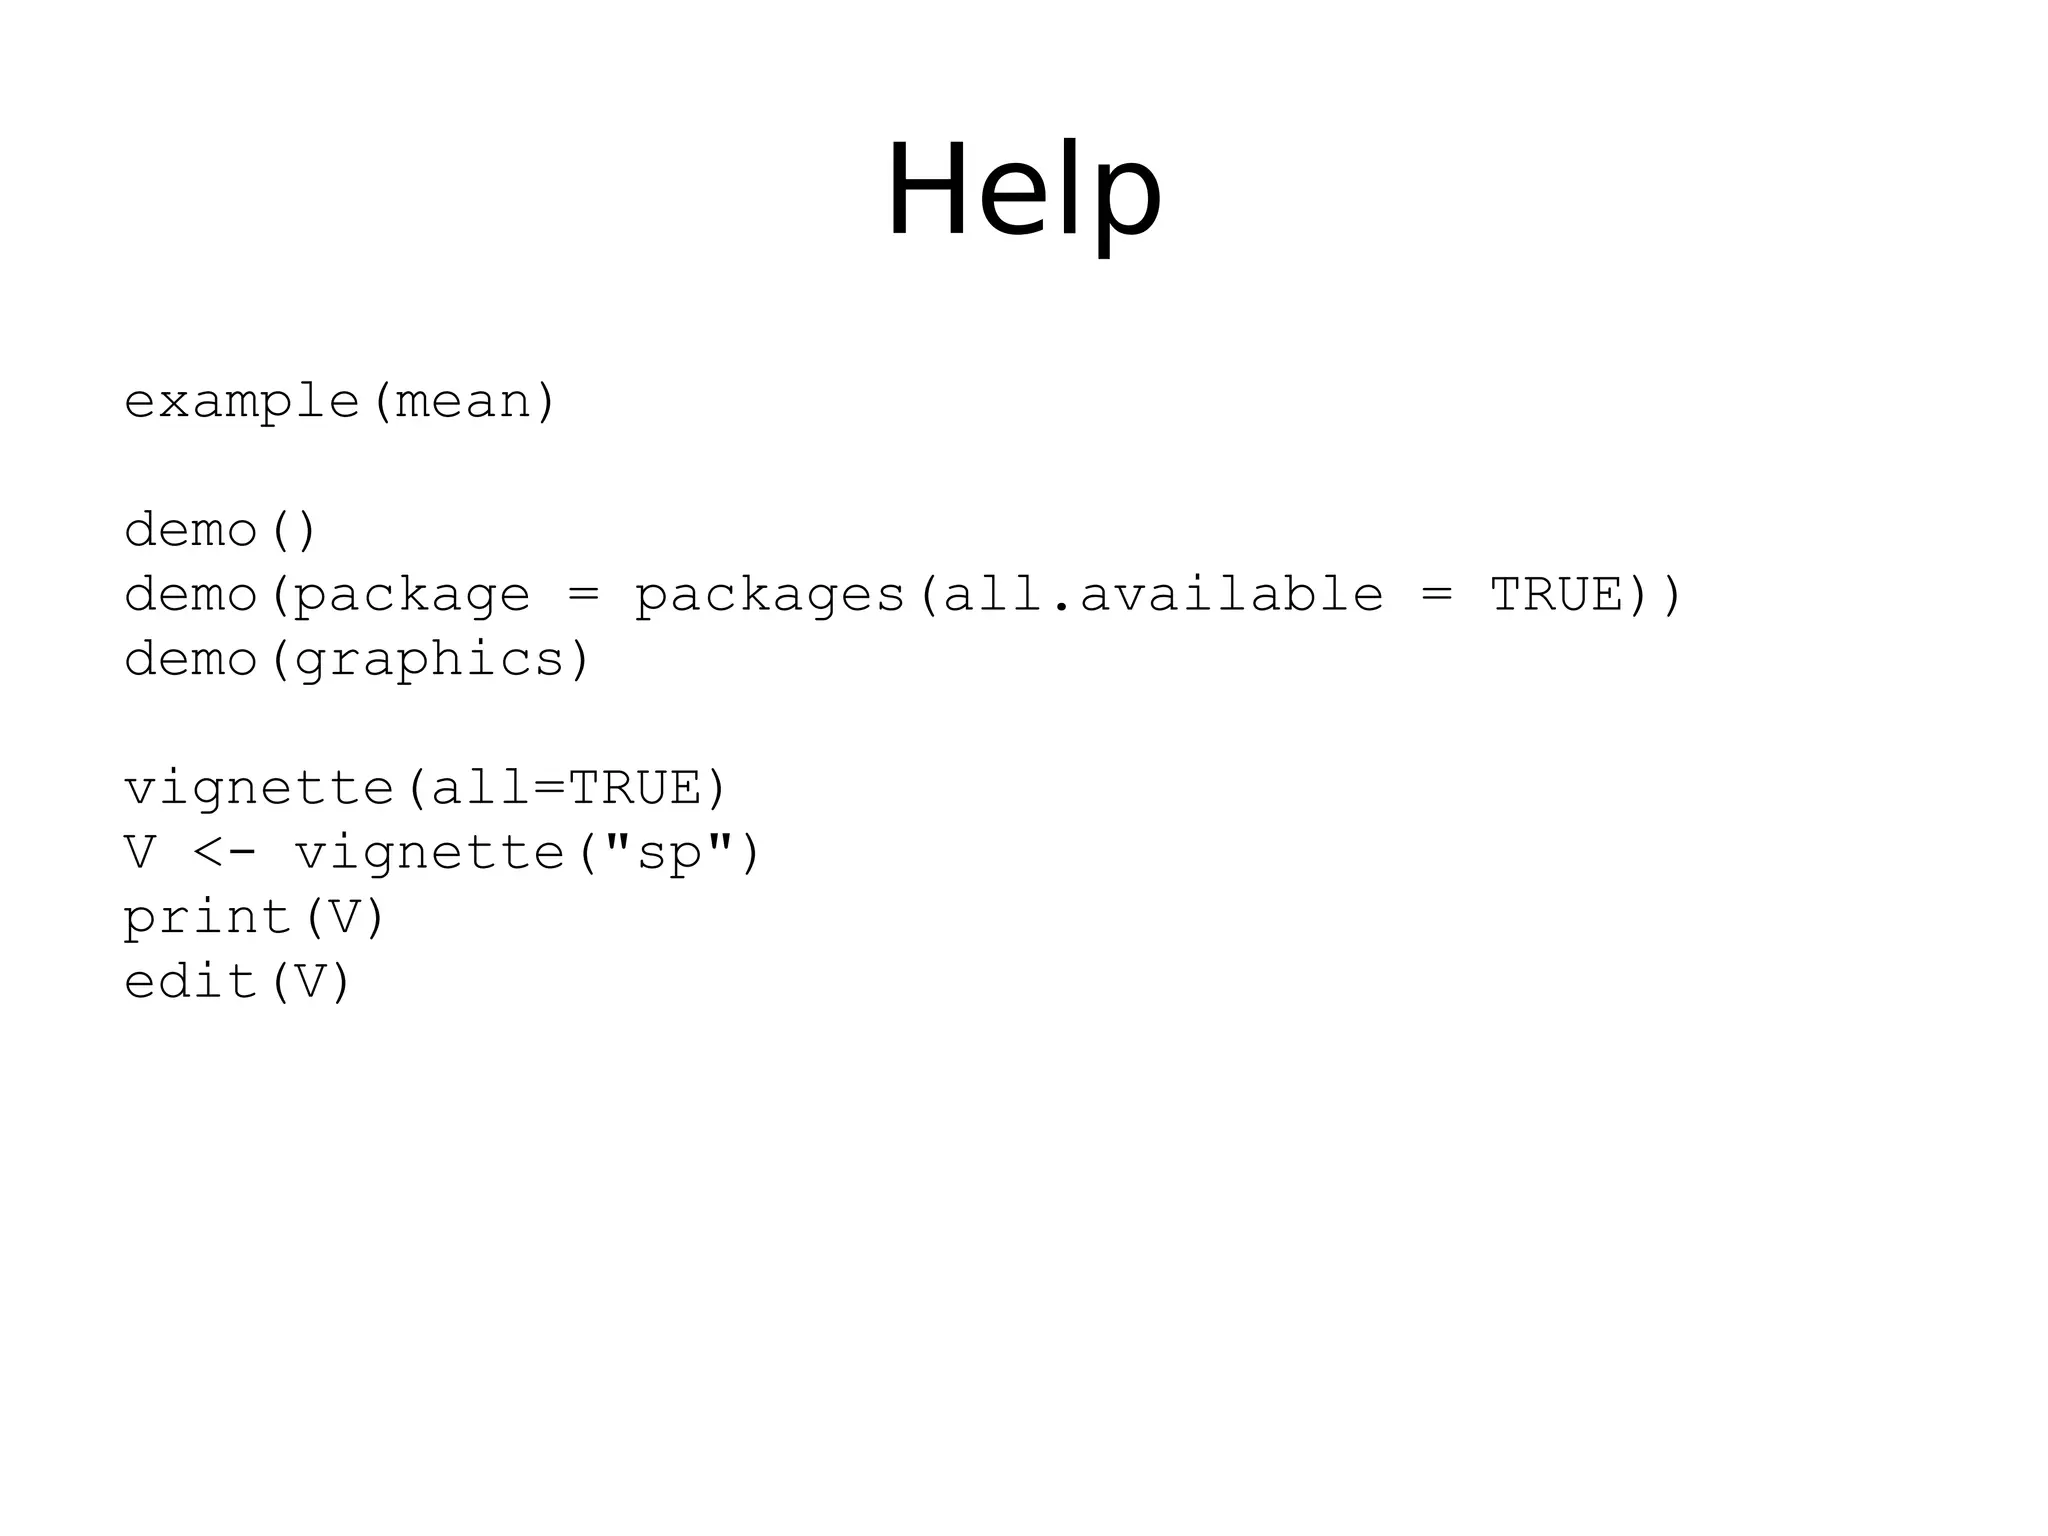
Commands in R, how to use R prompt, install packages, and seek help with functions.
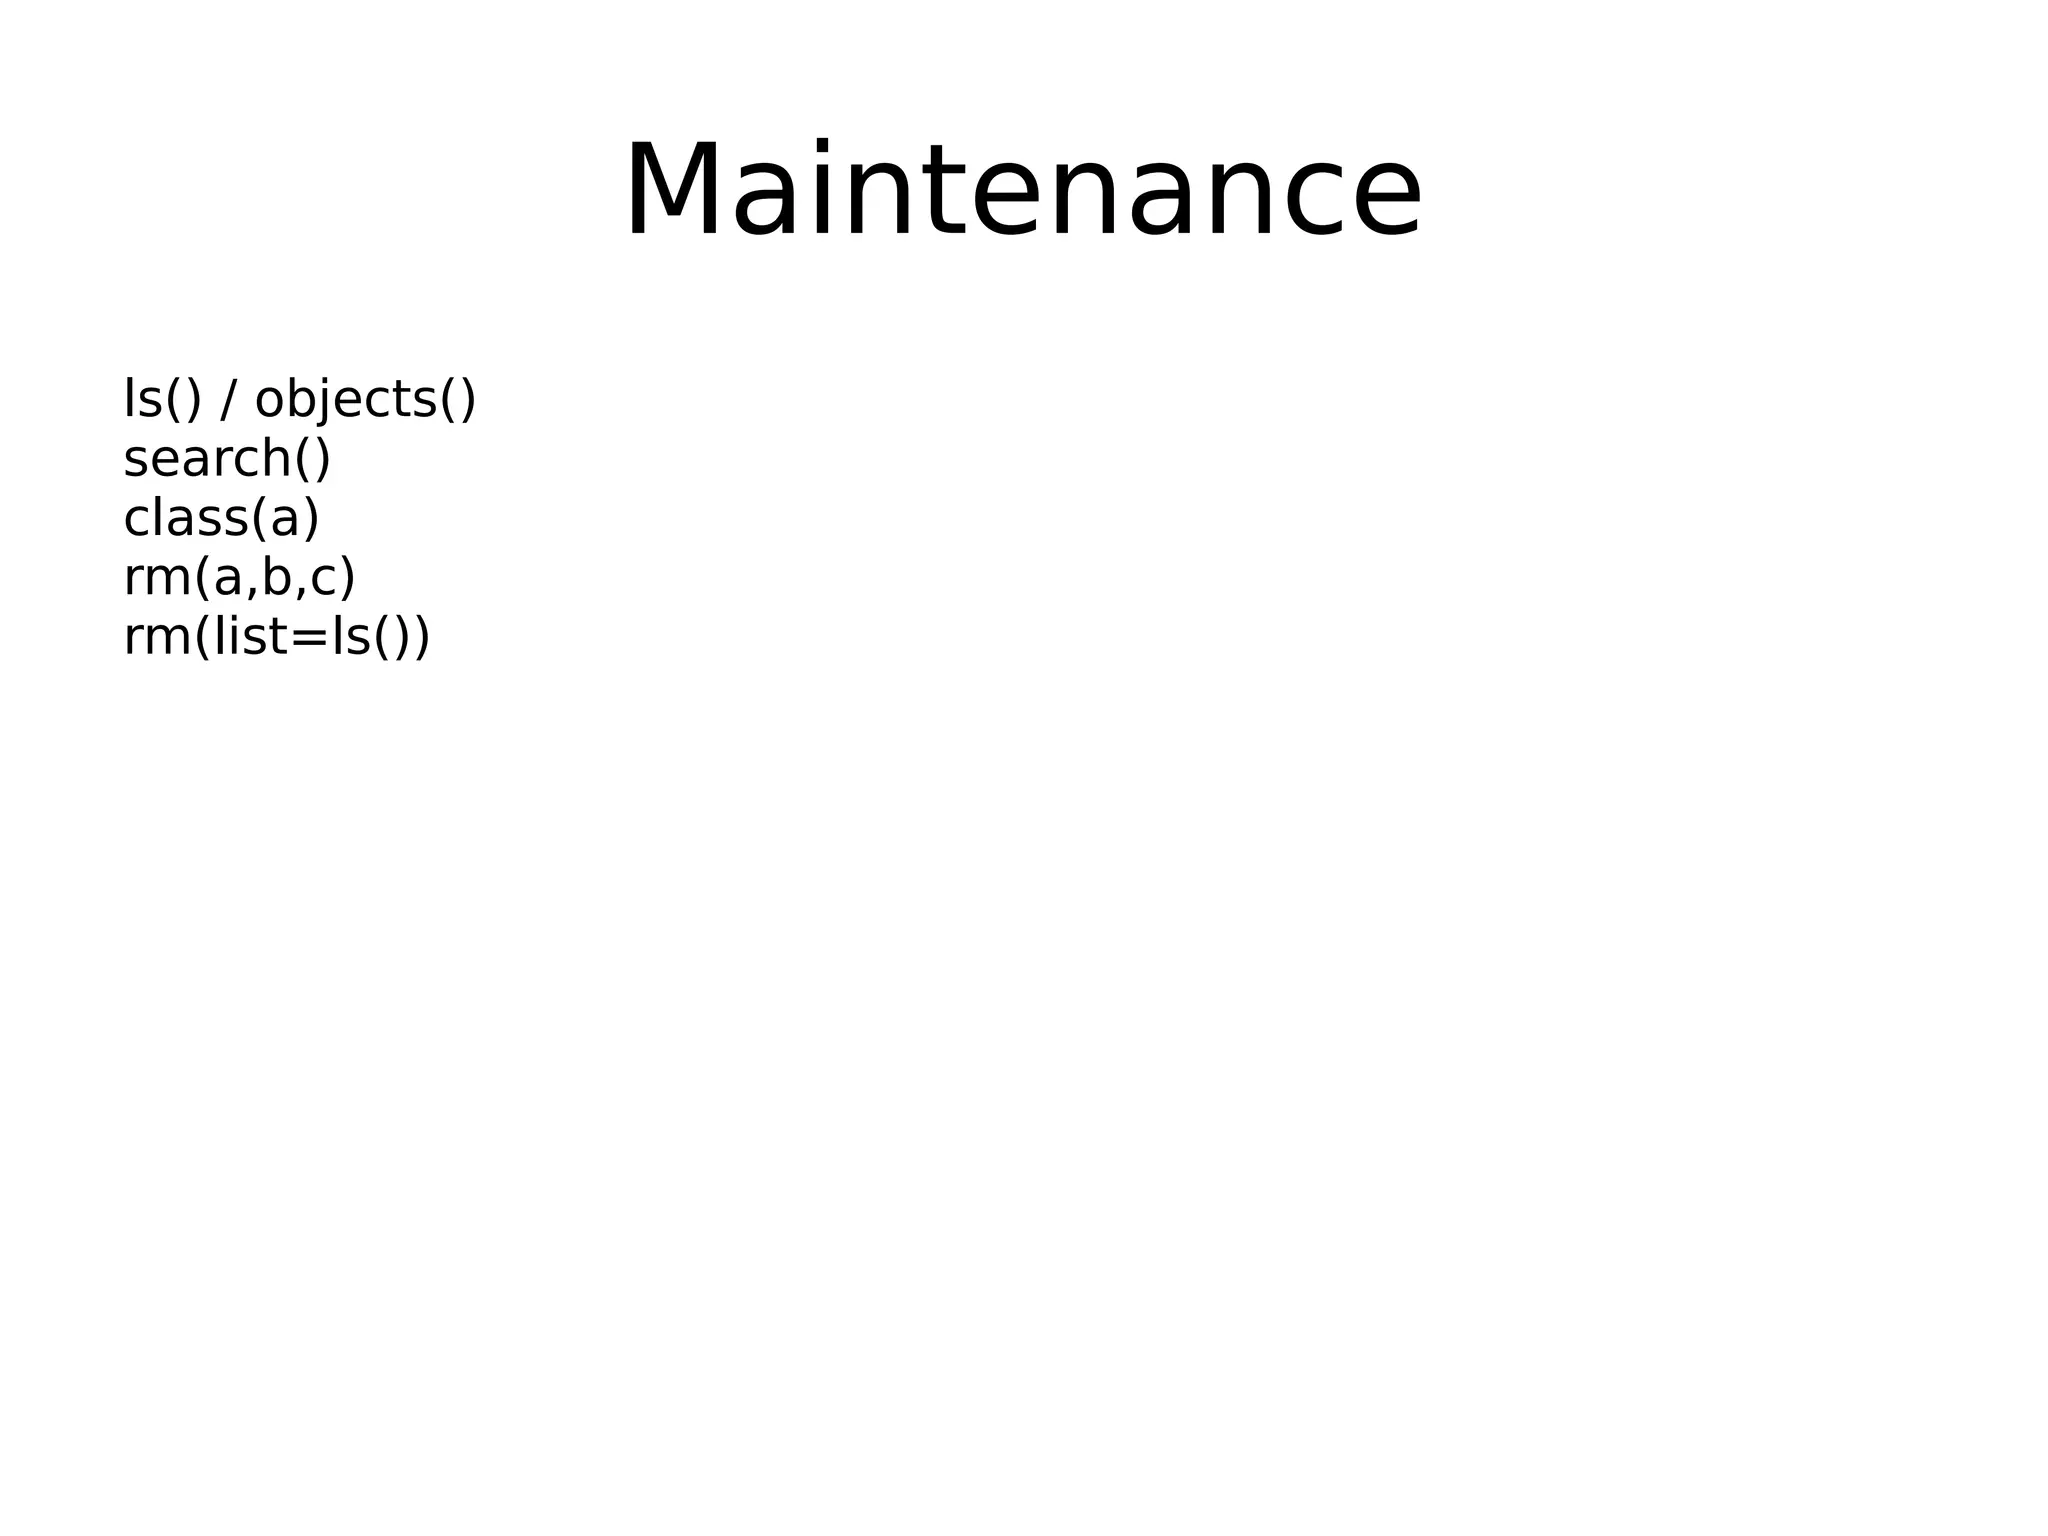
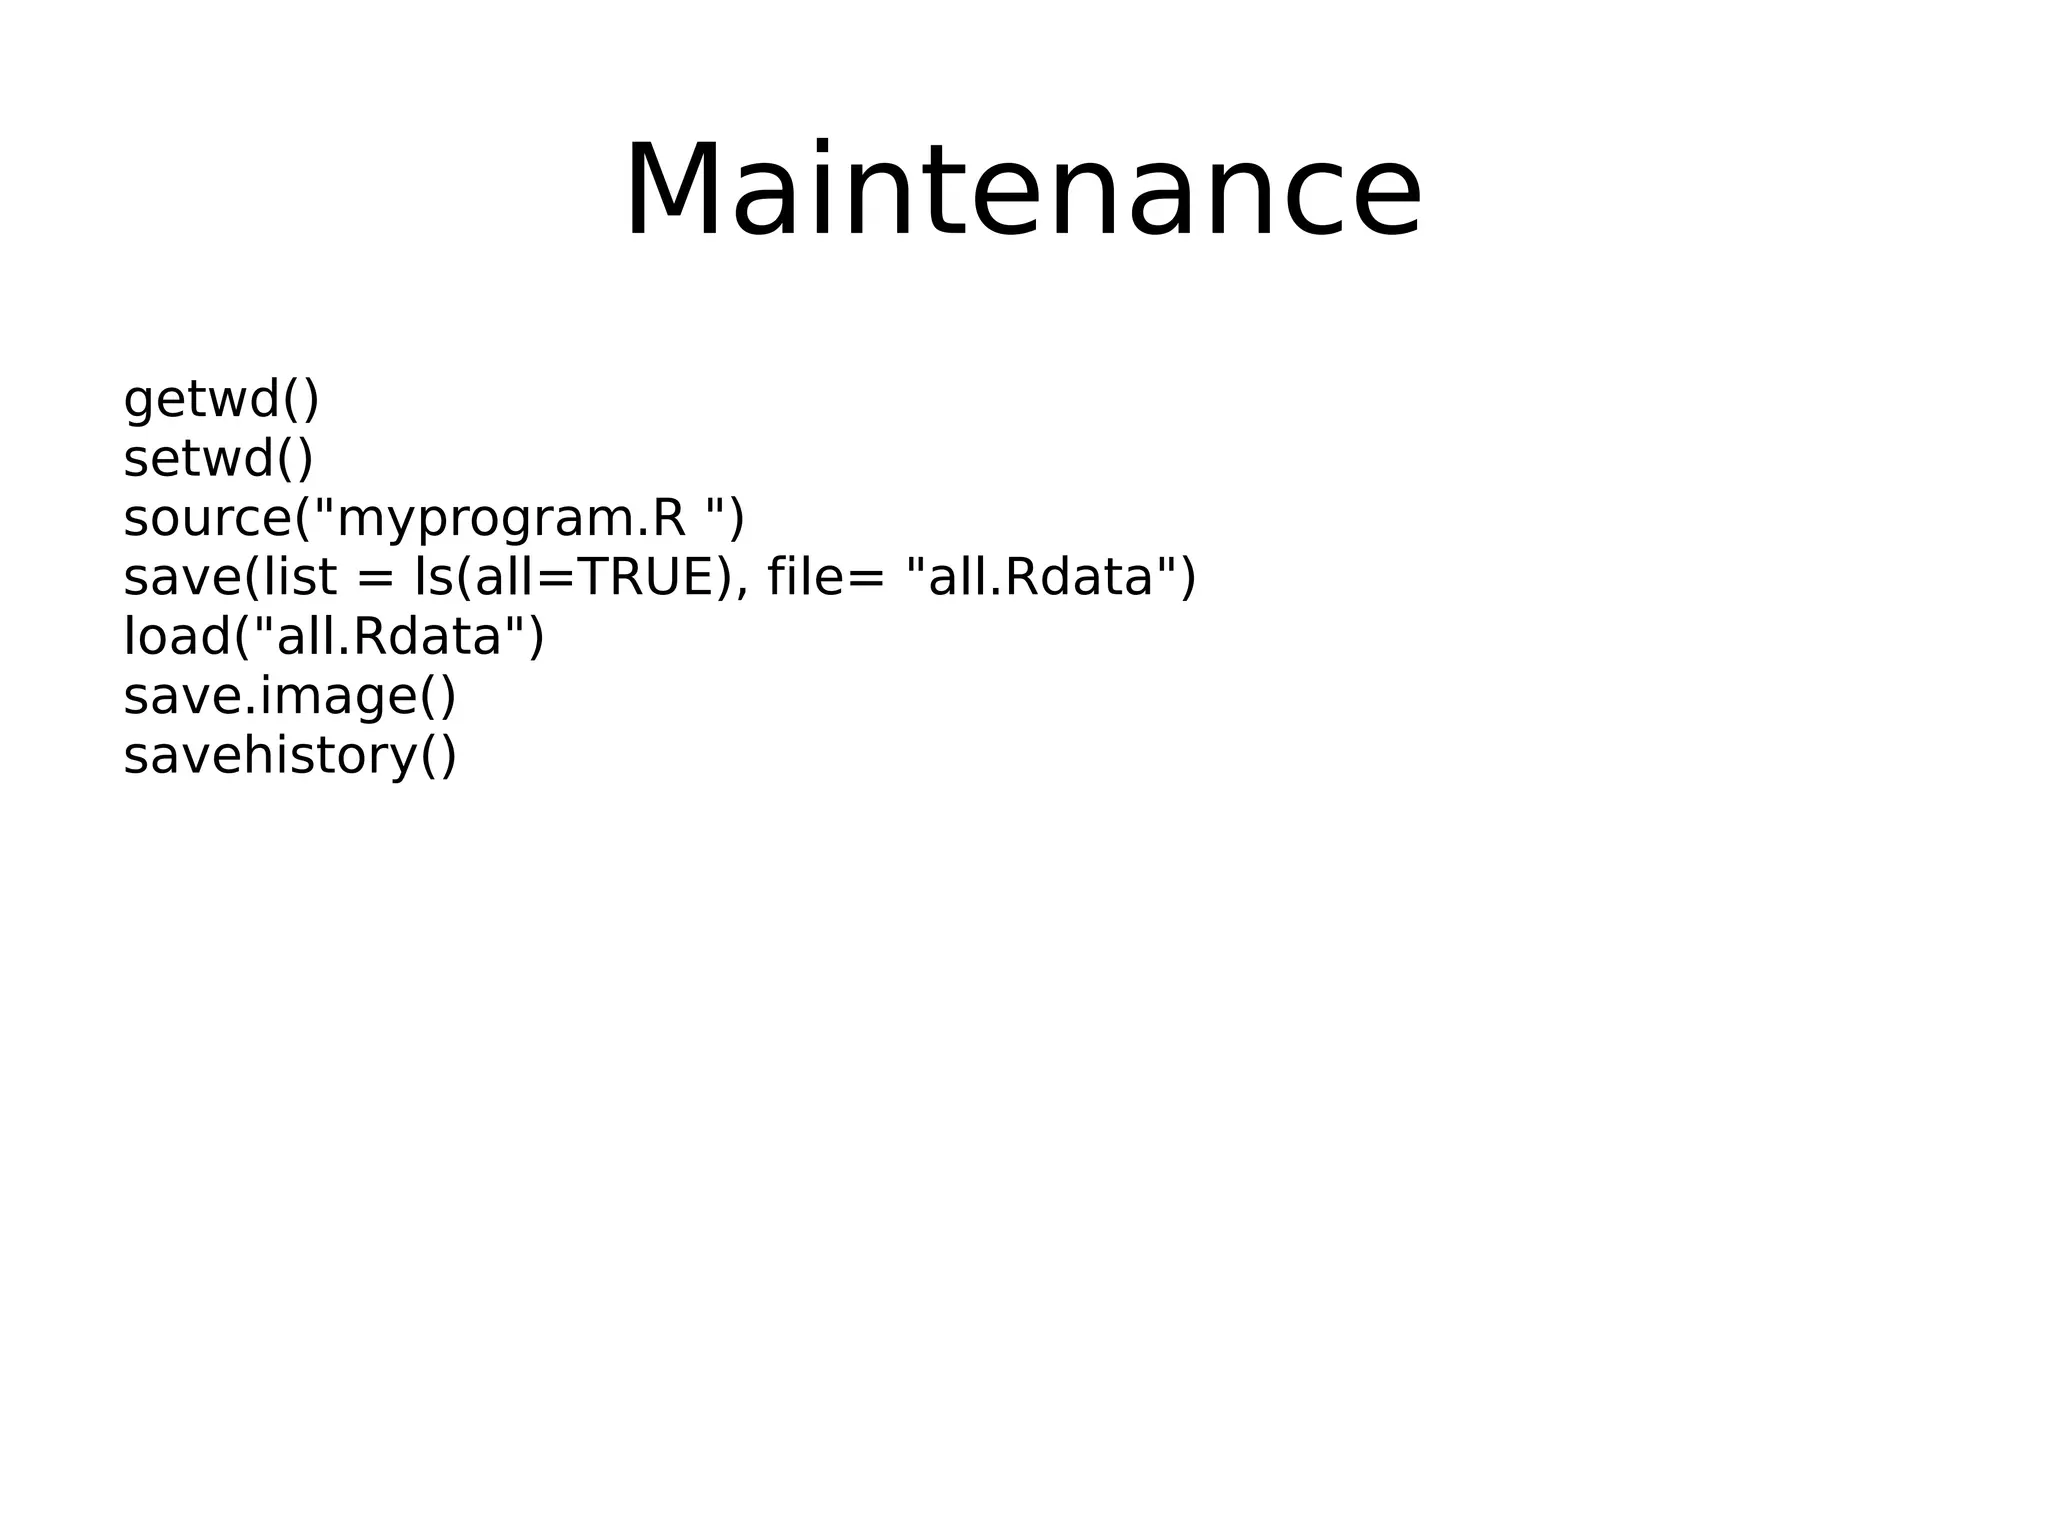
Data maintenance in R, citation in research, and resources for support.
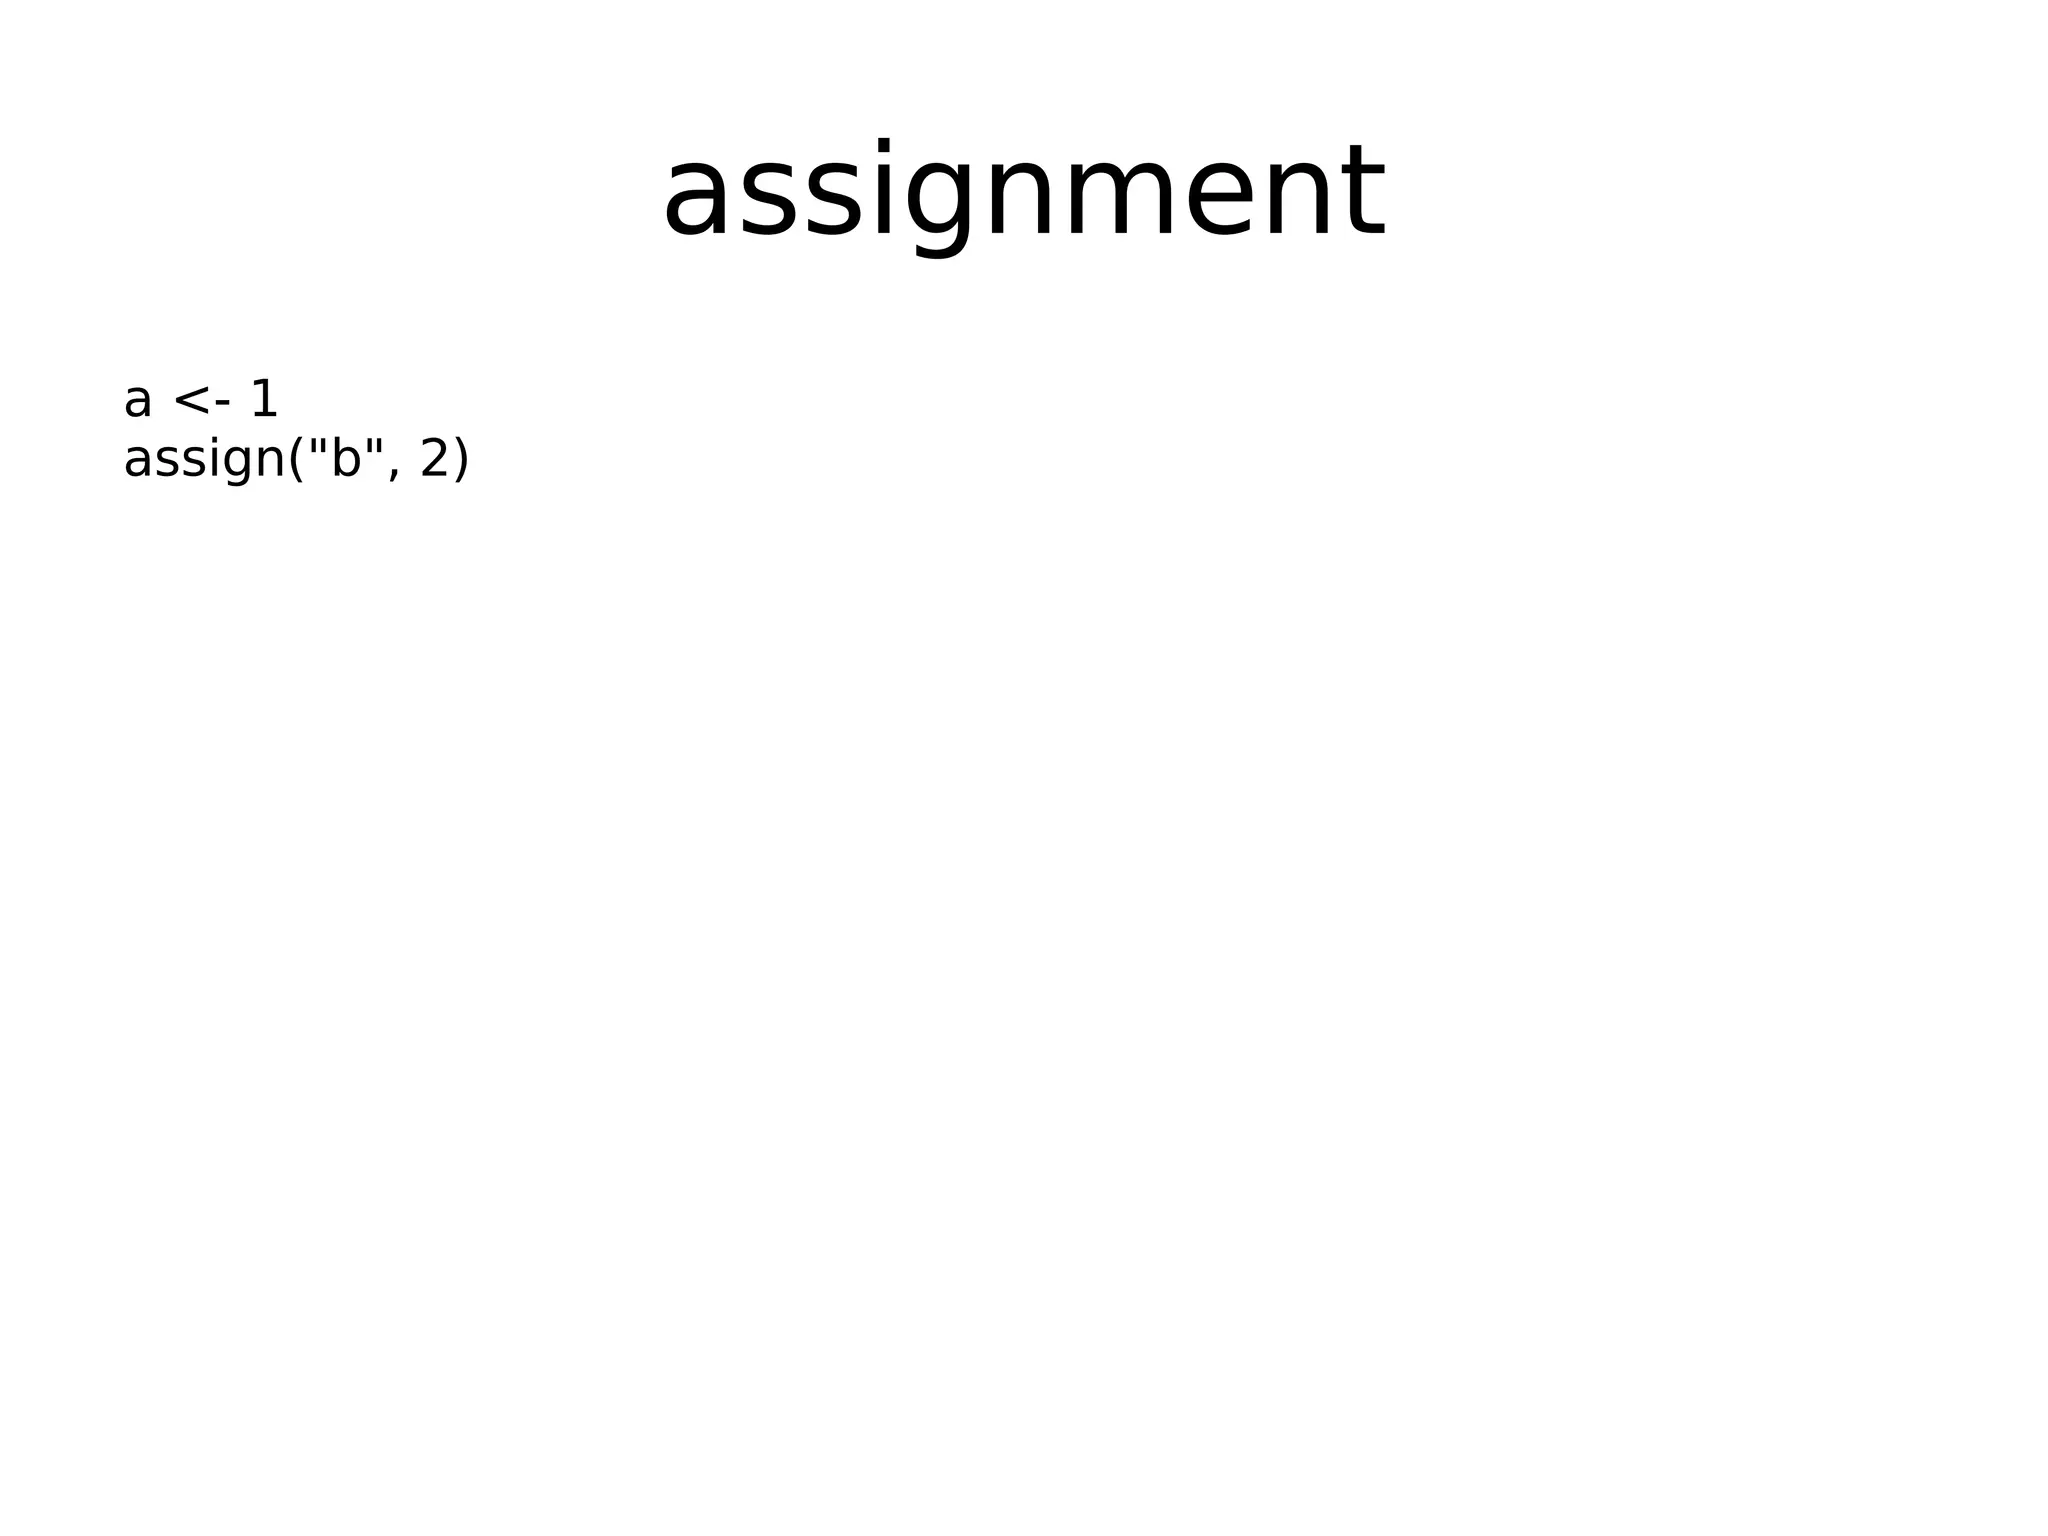
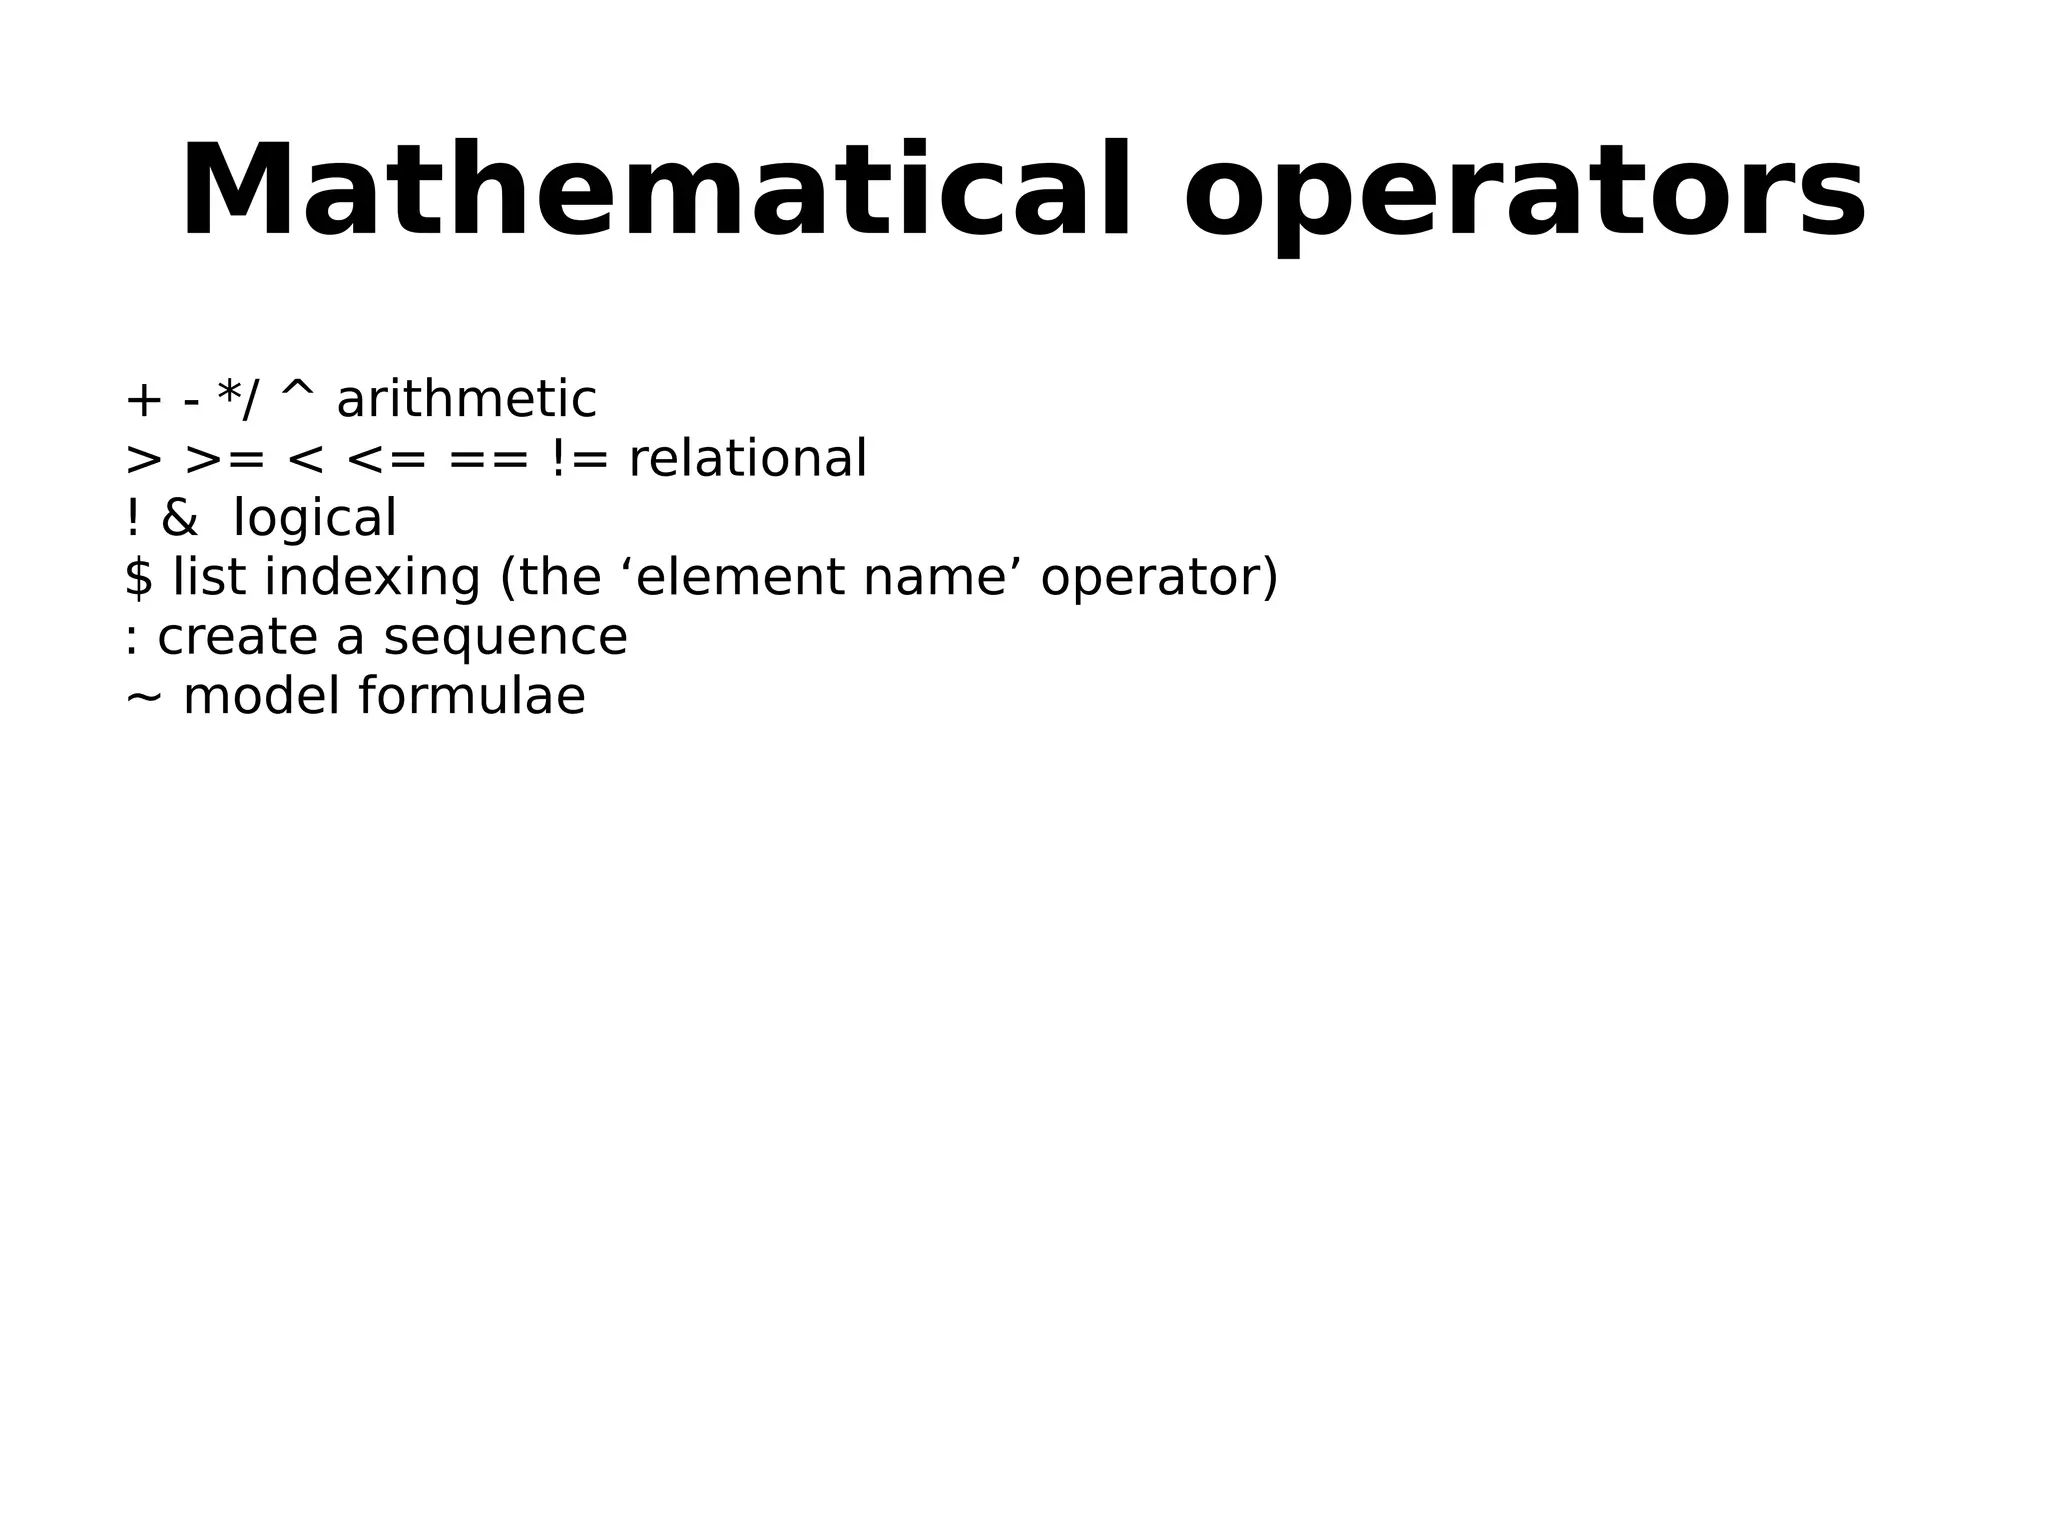
Fundamental concepts of R including code, commands, assignment, and various operators.
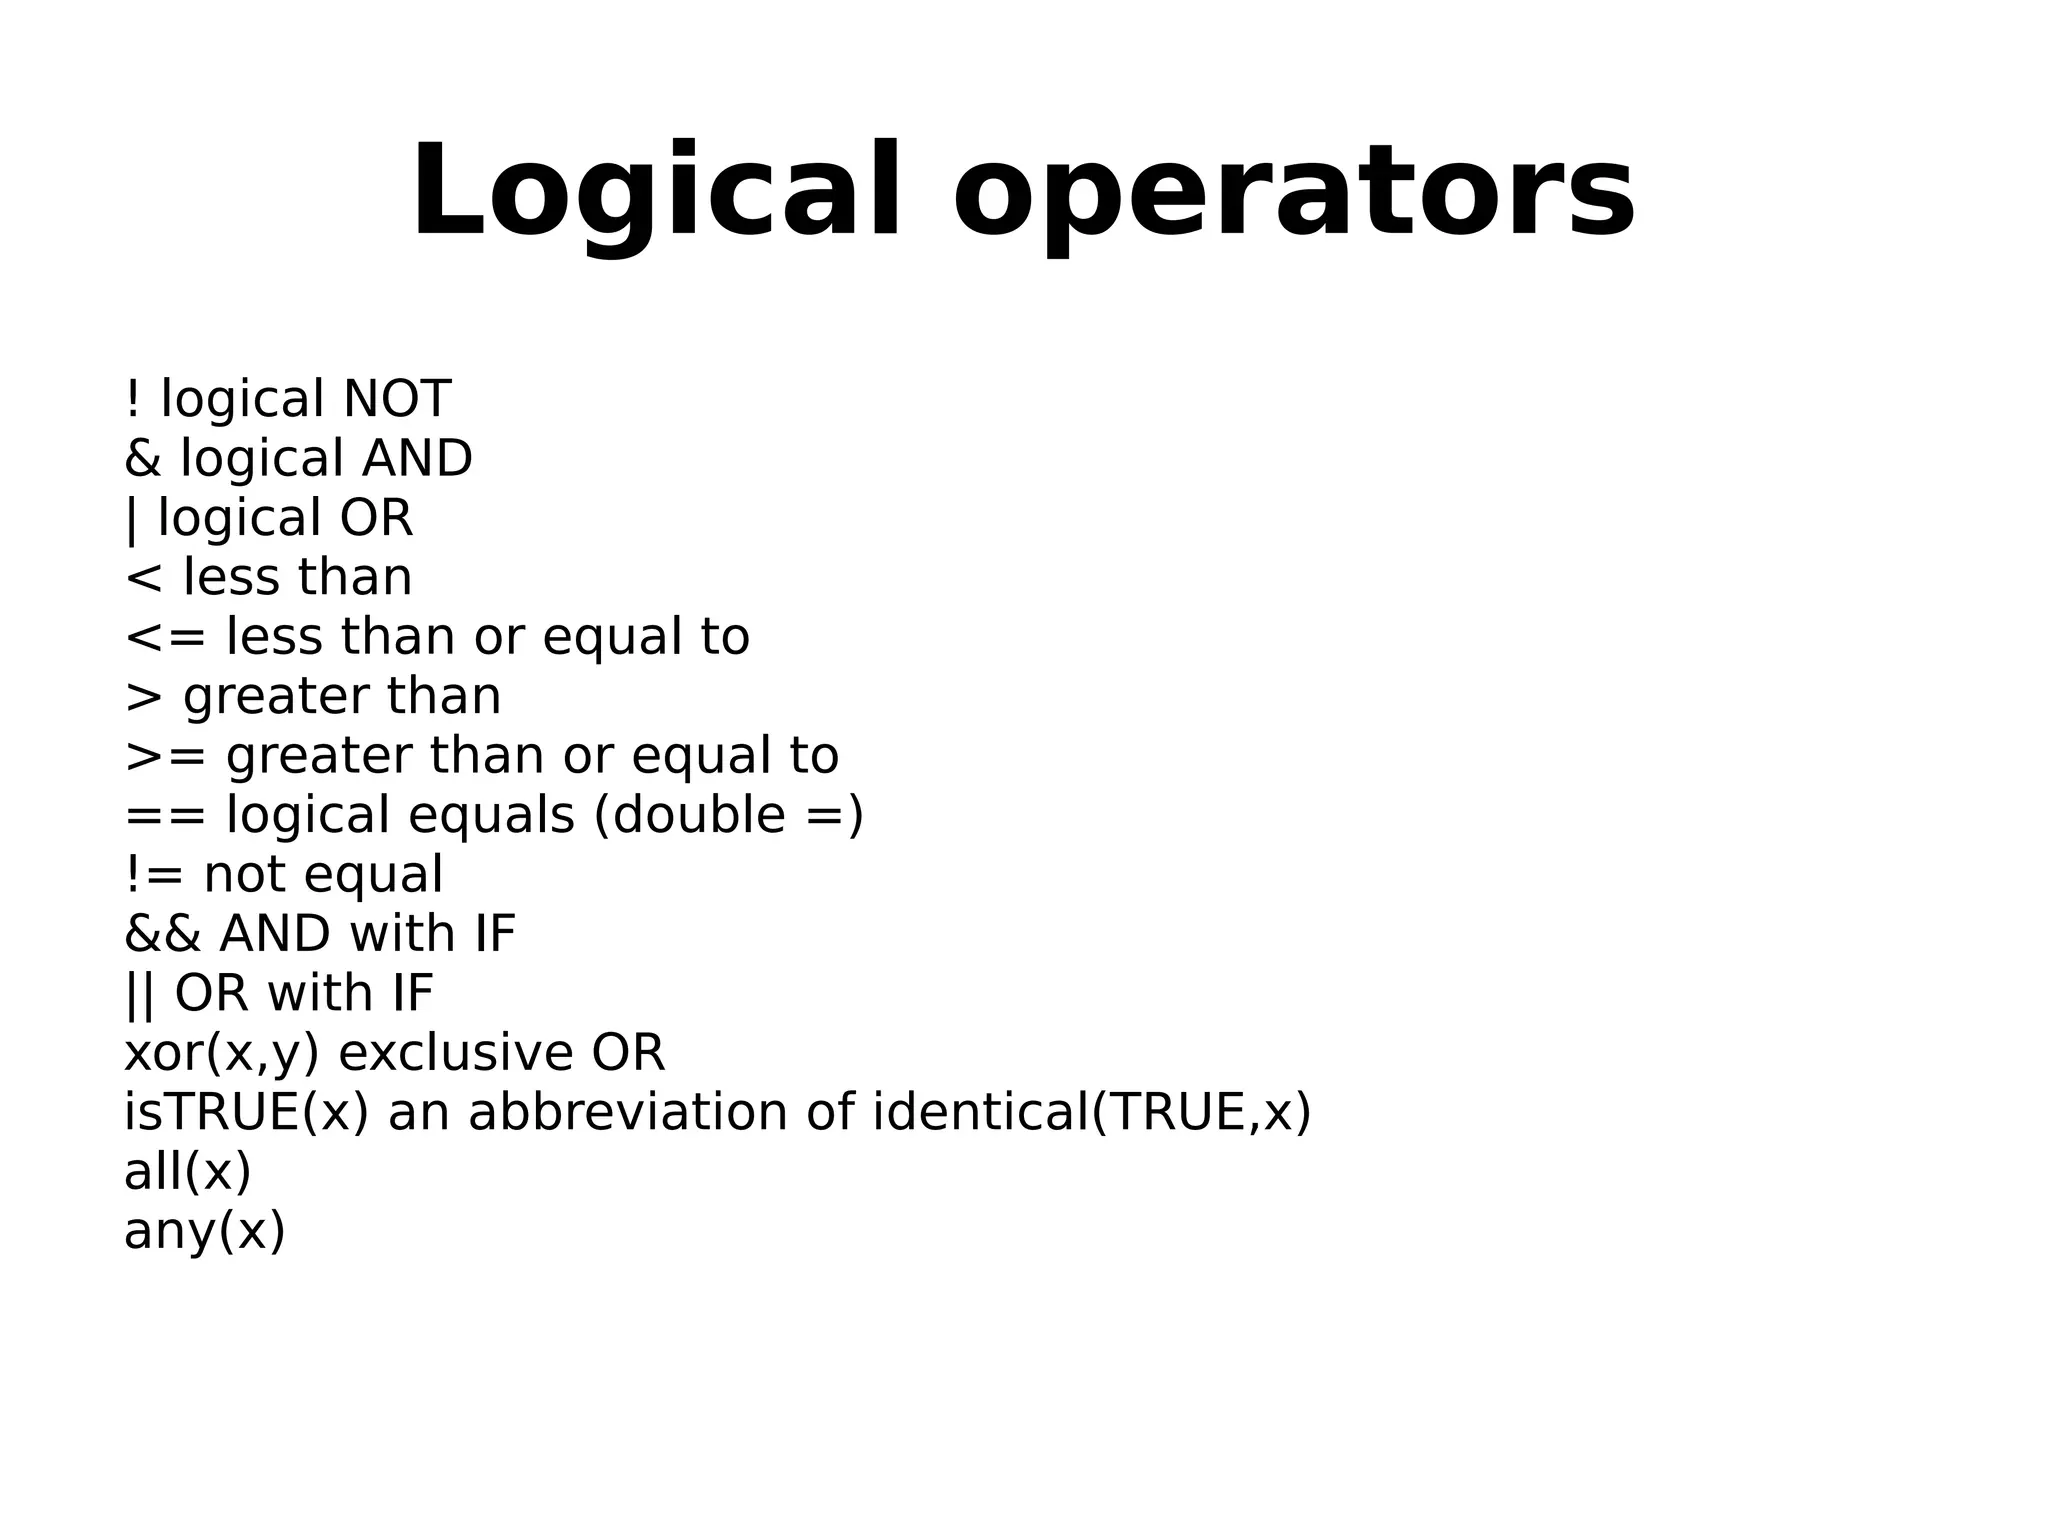
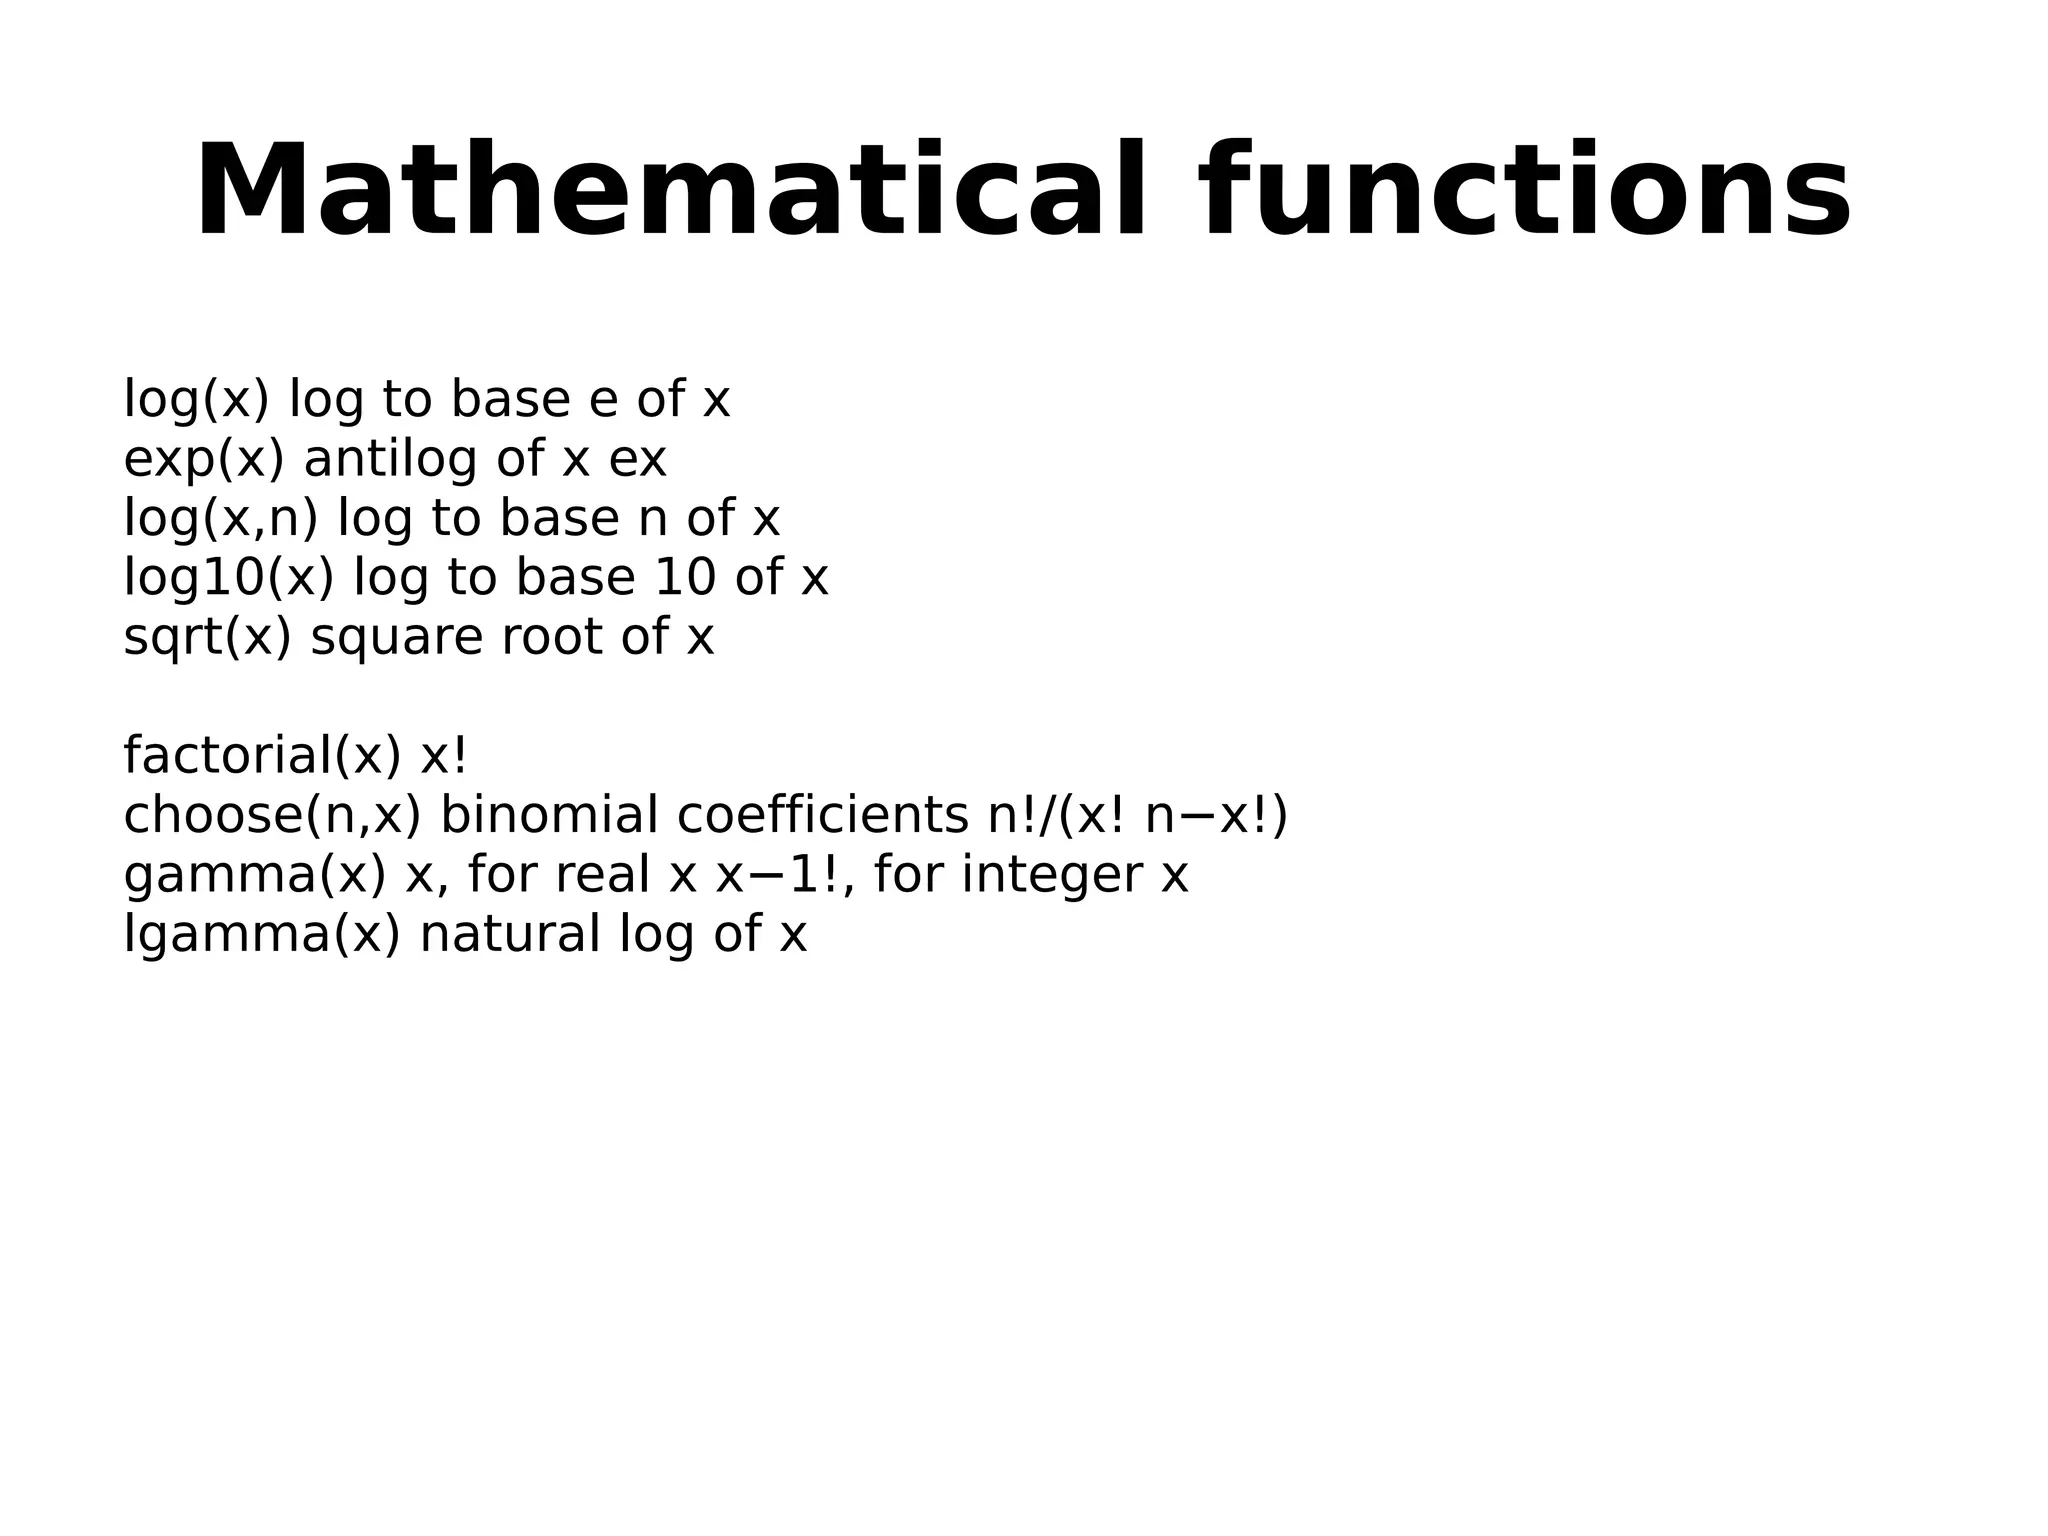
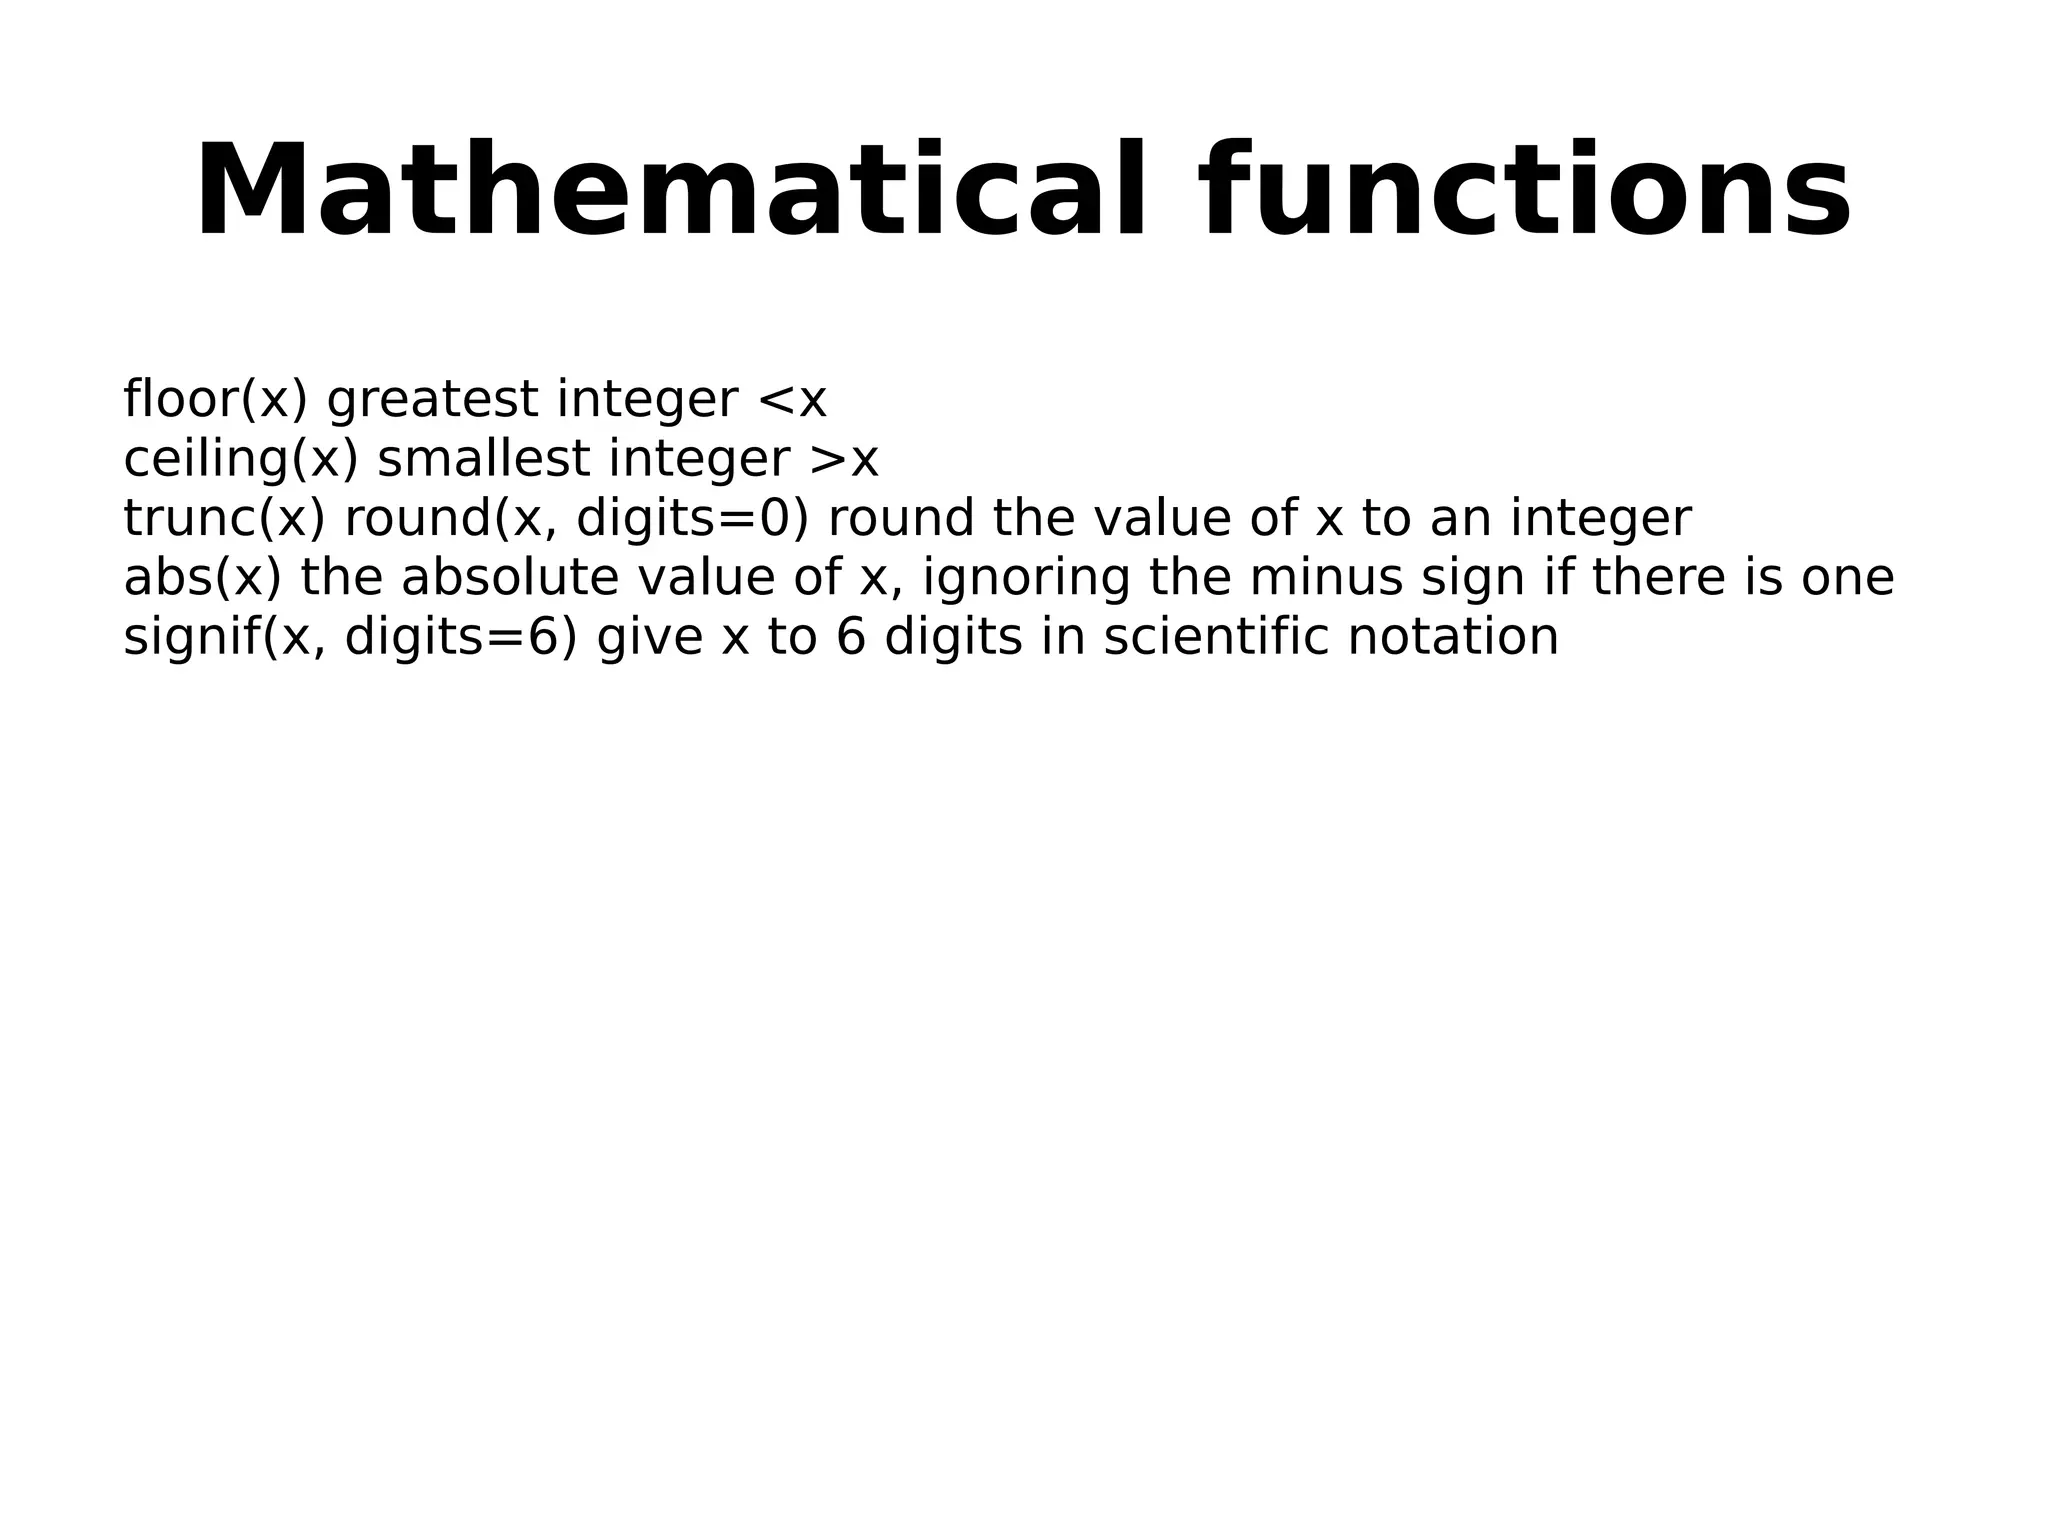
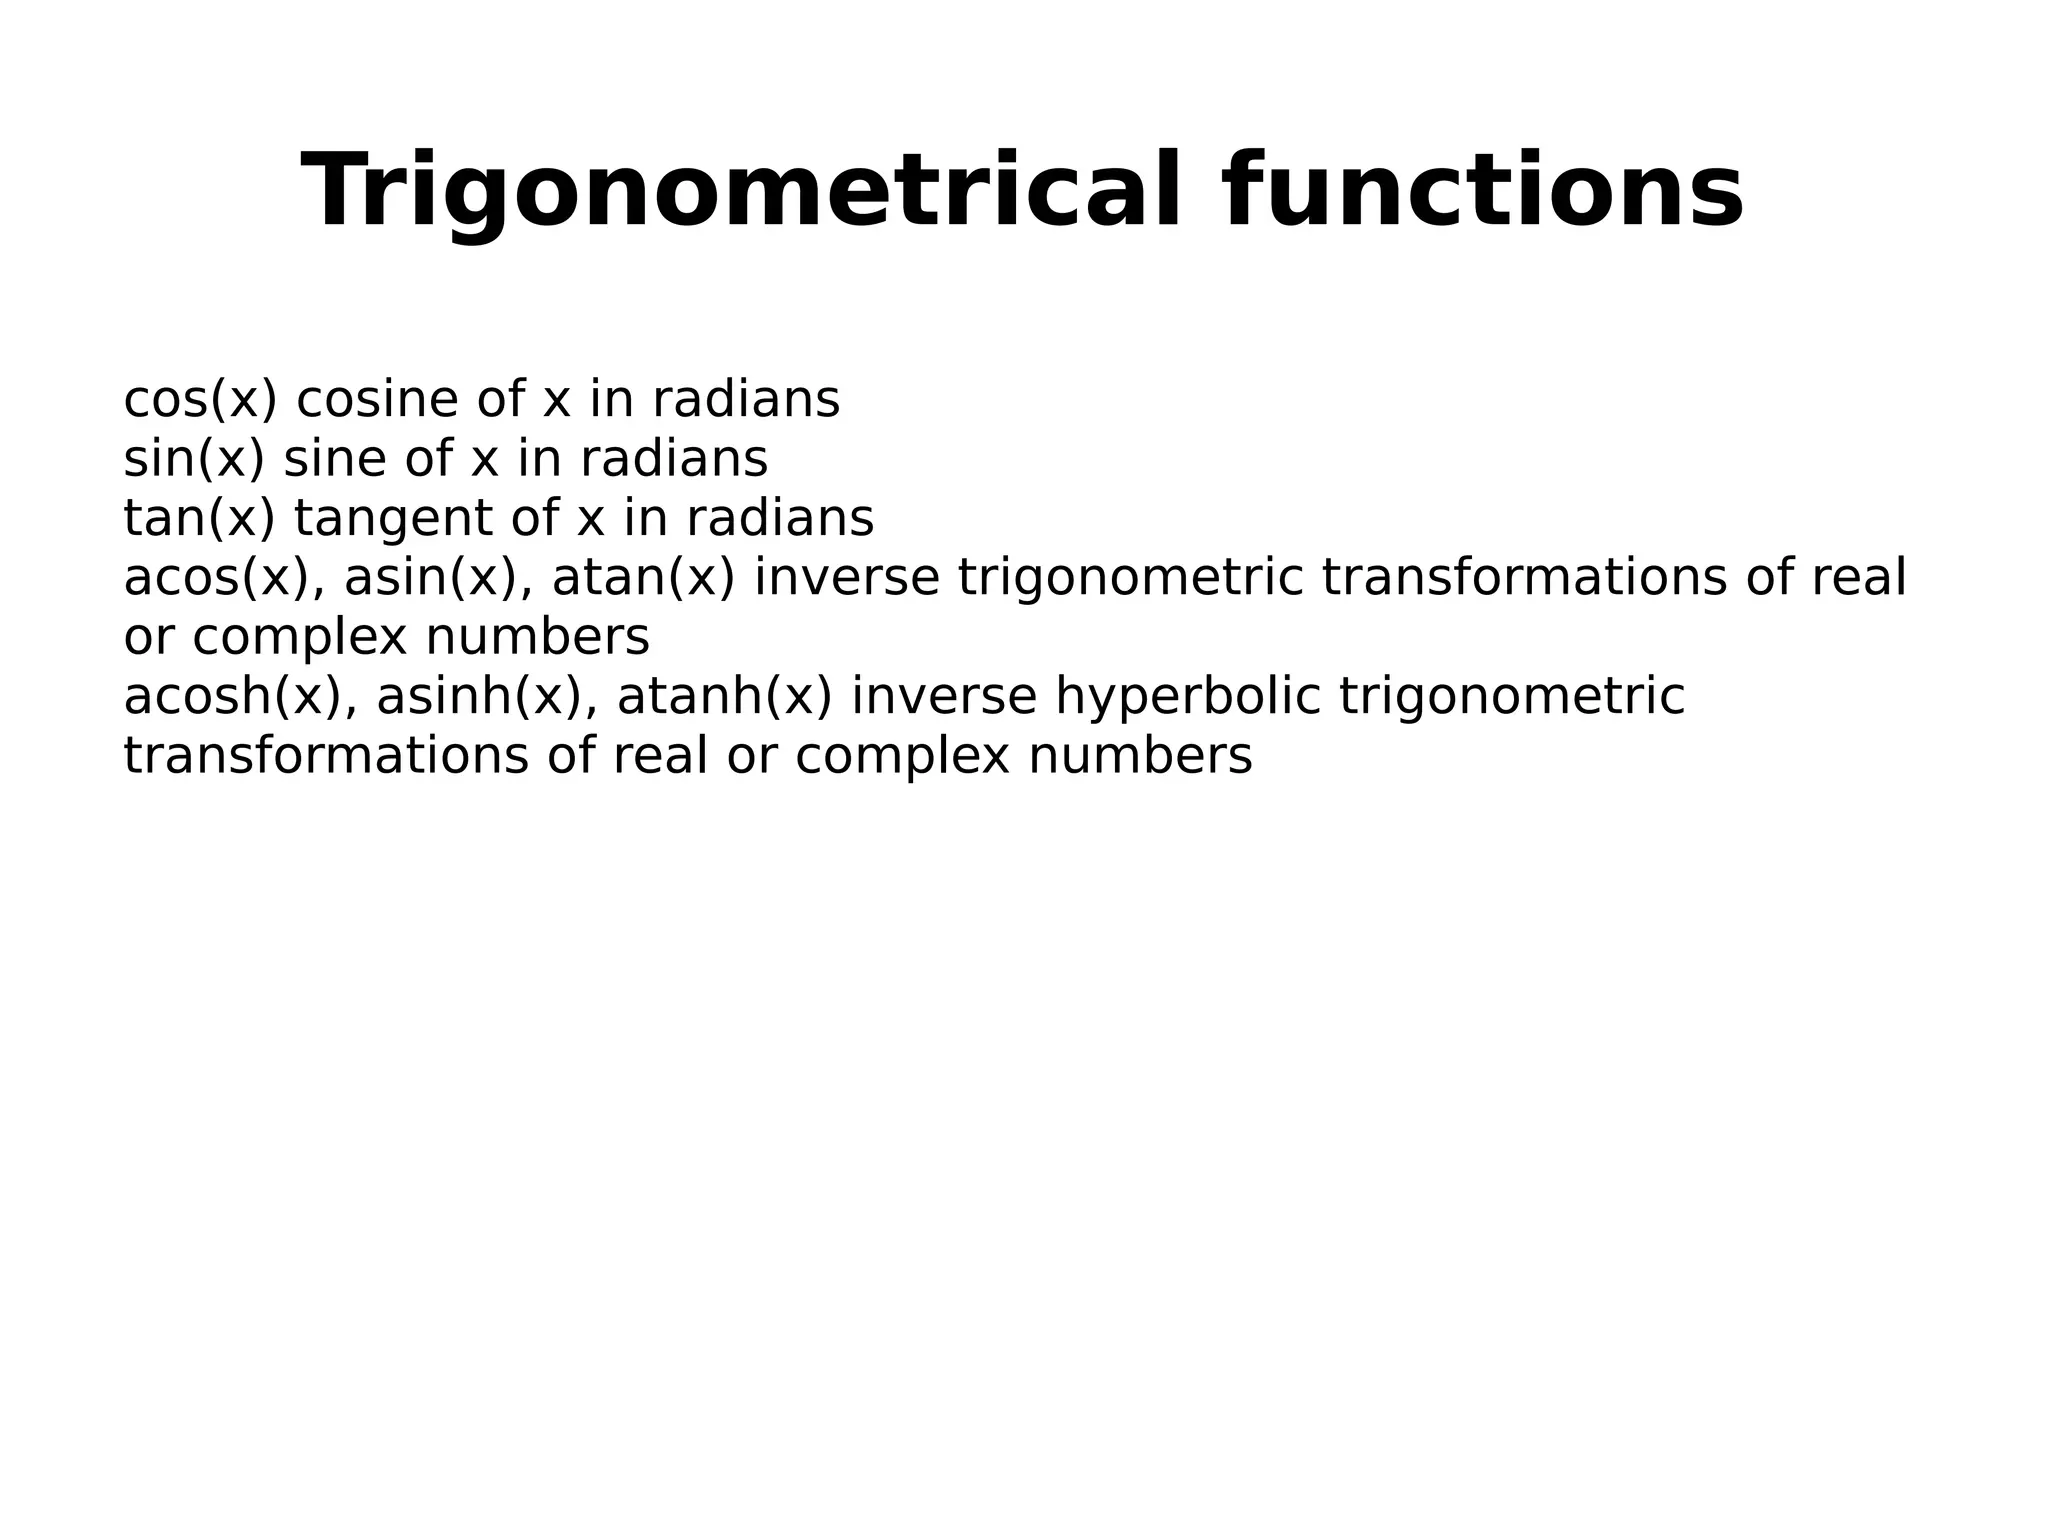
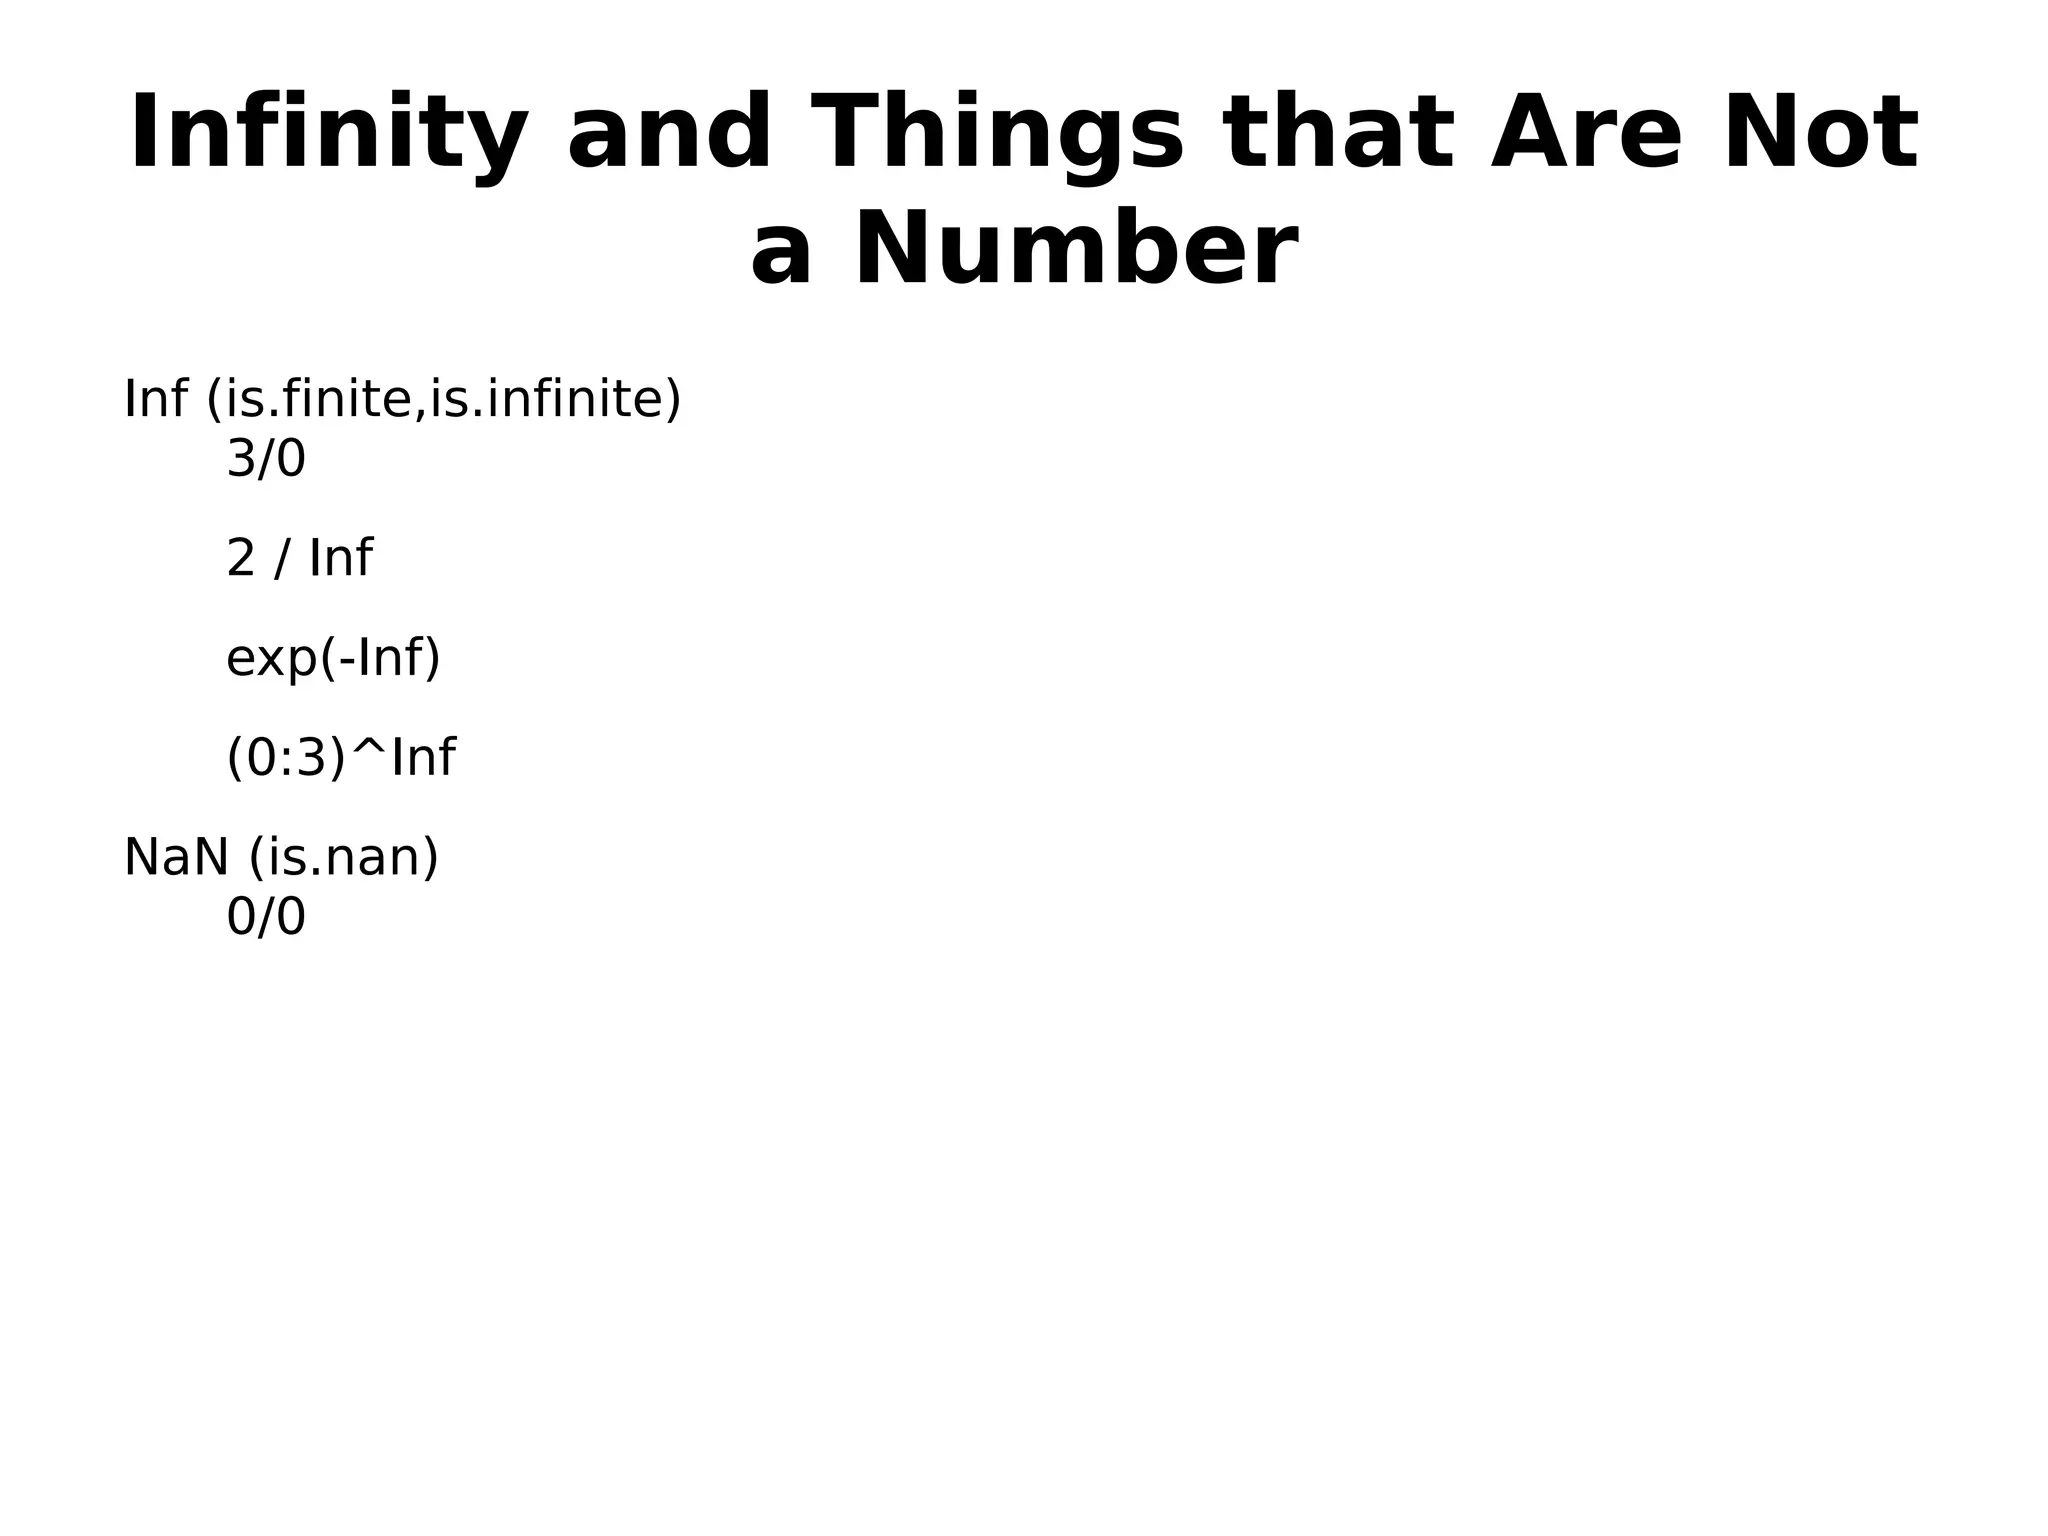
Overview of mathematical functions, logical functions, and handling infinite and NaN values.
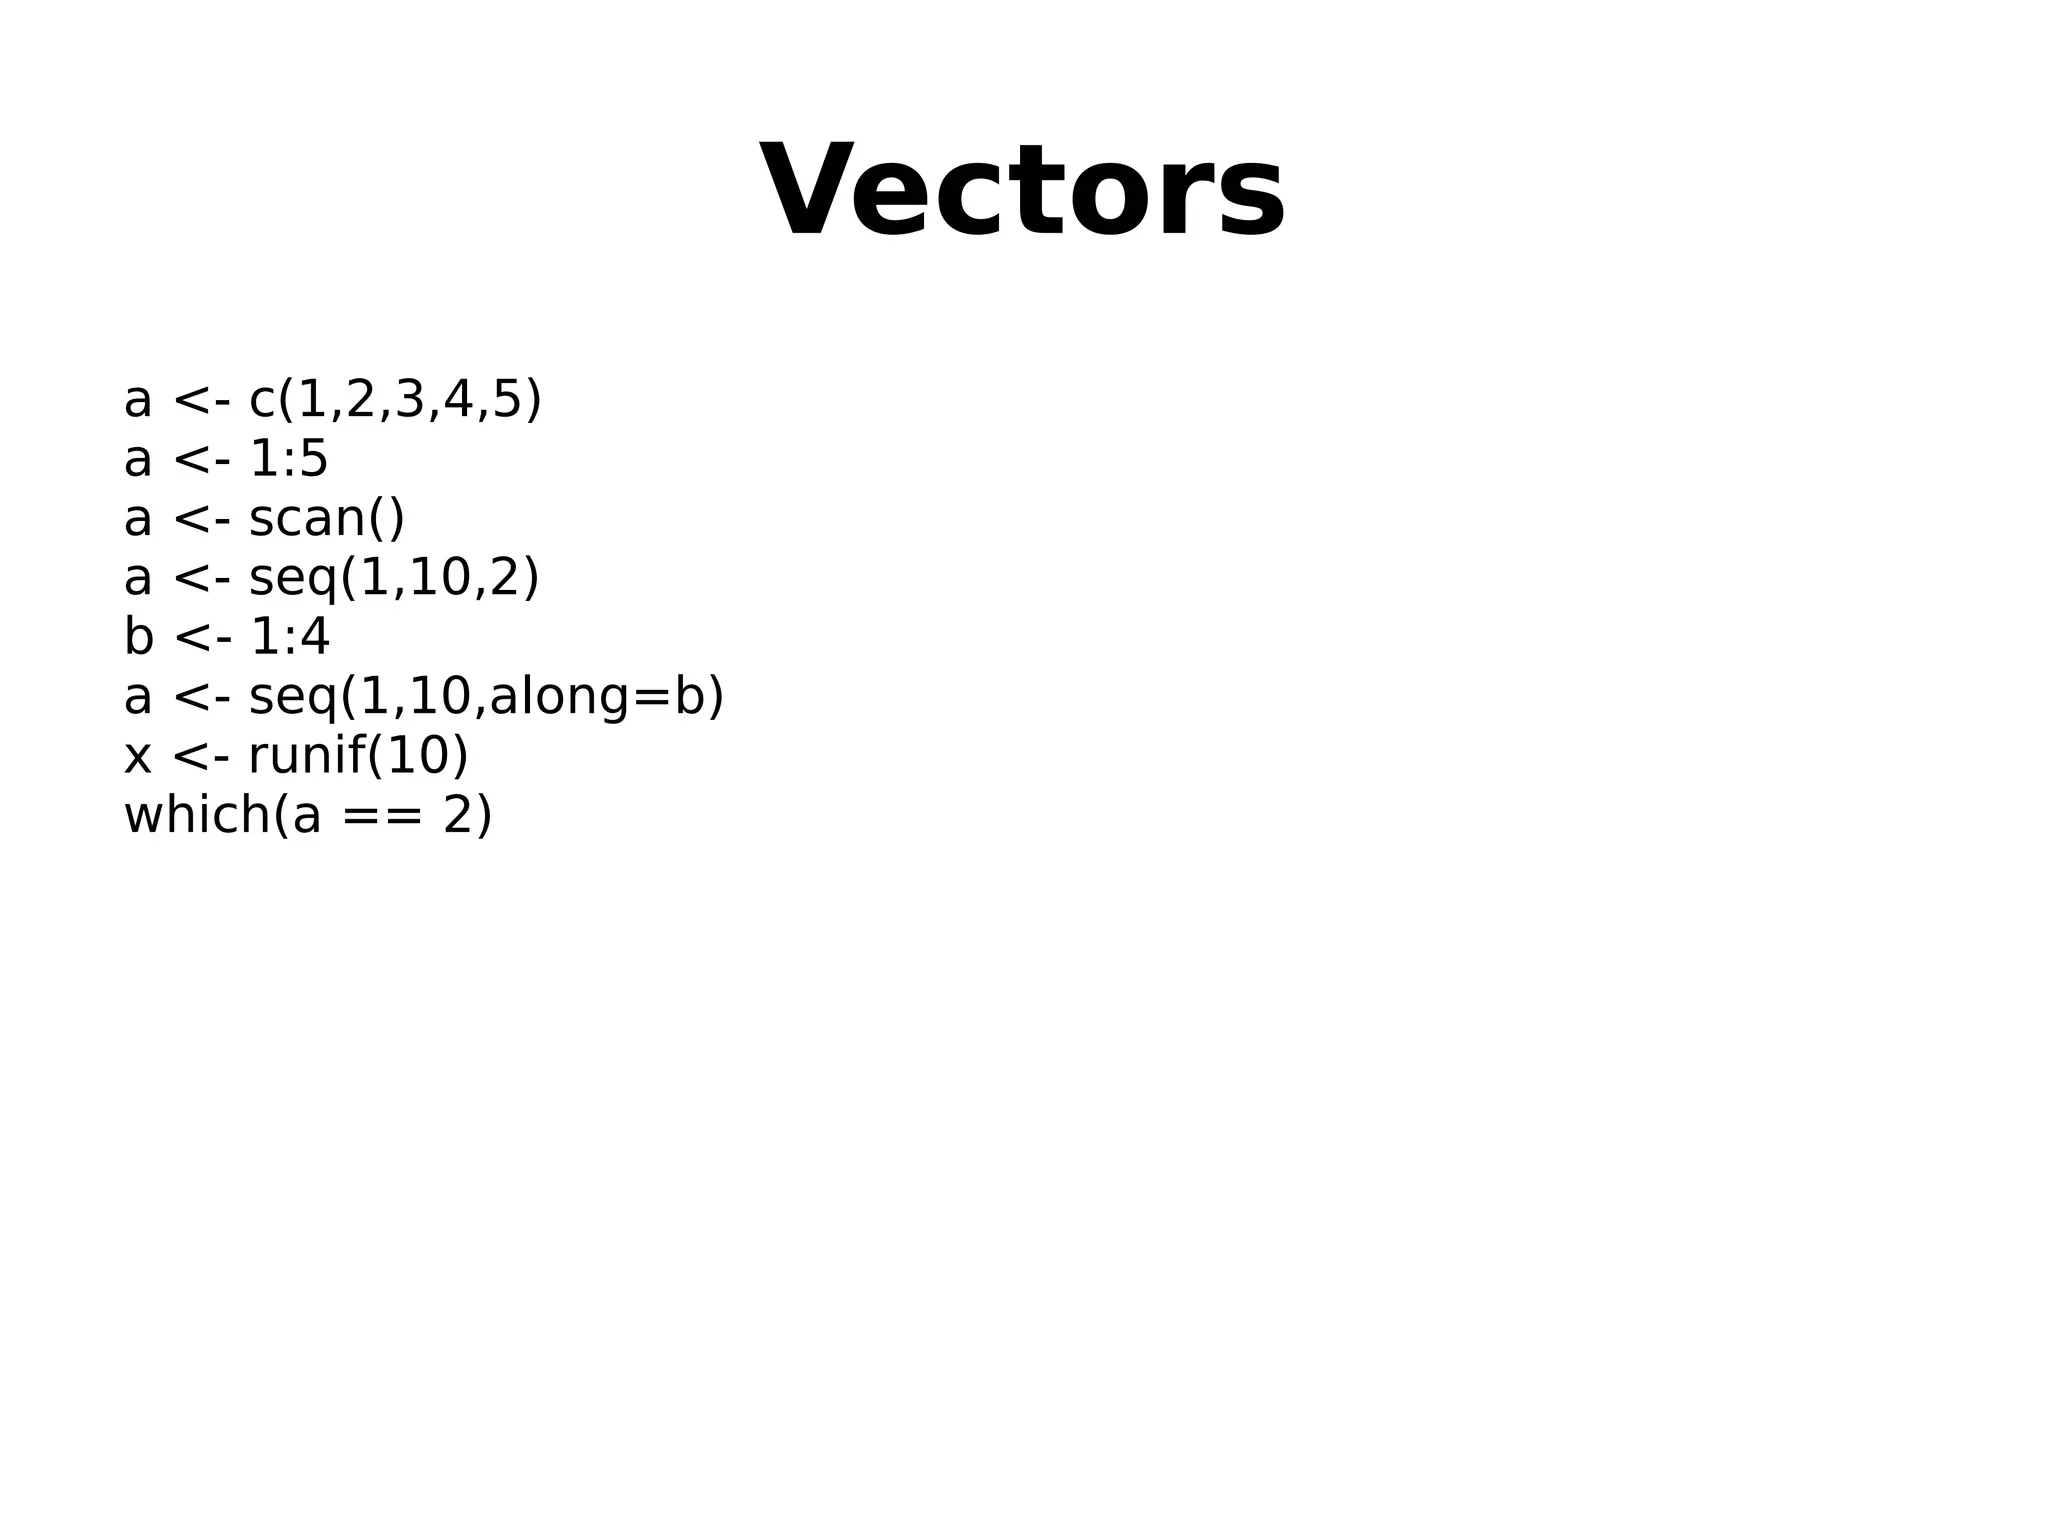
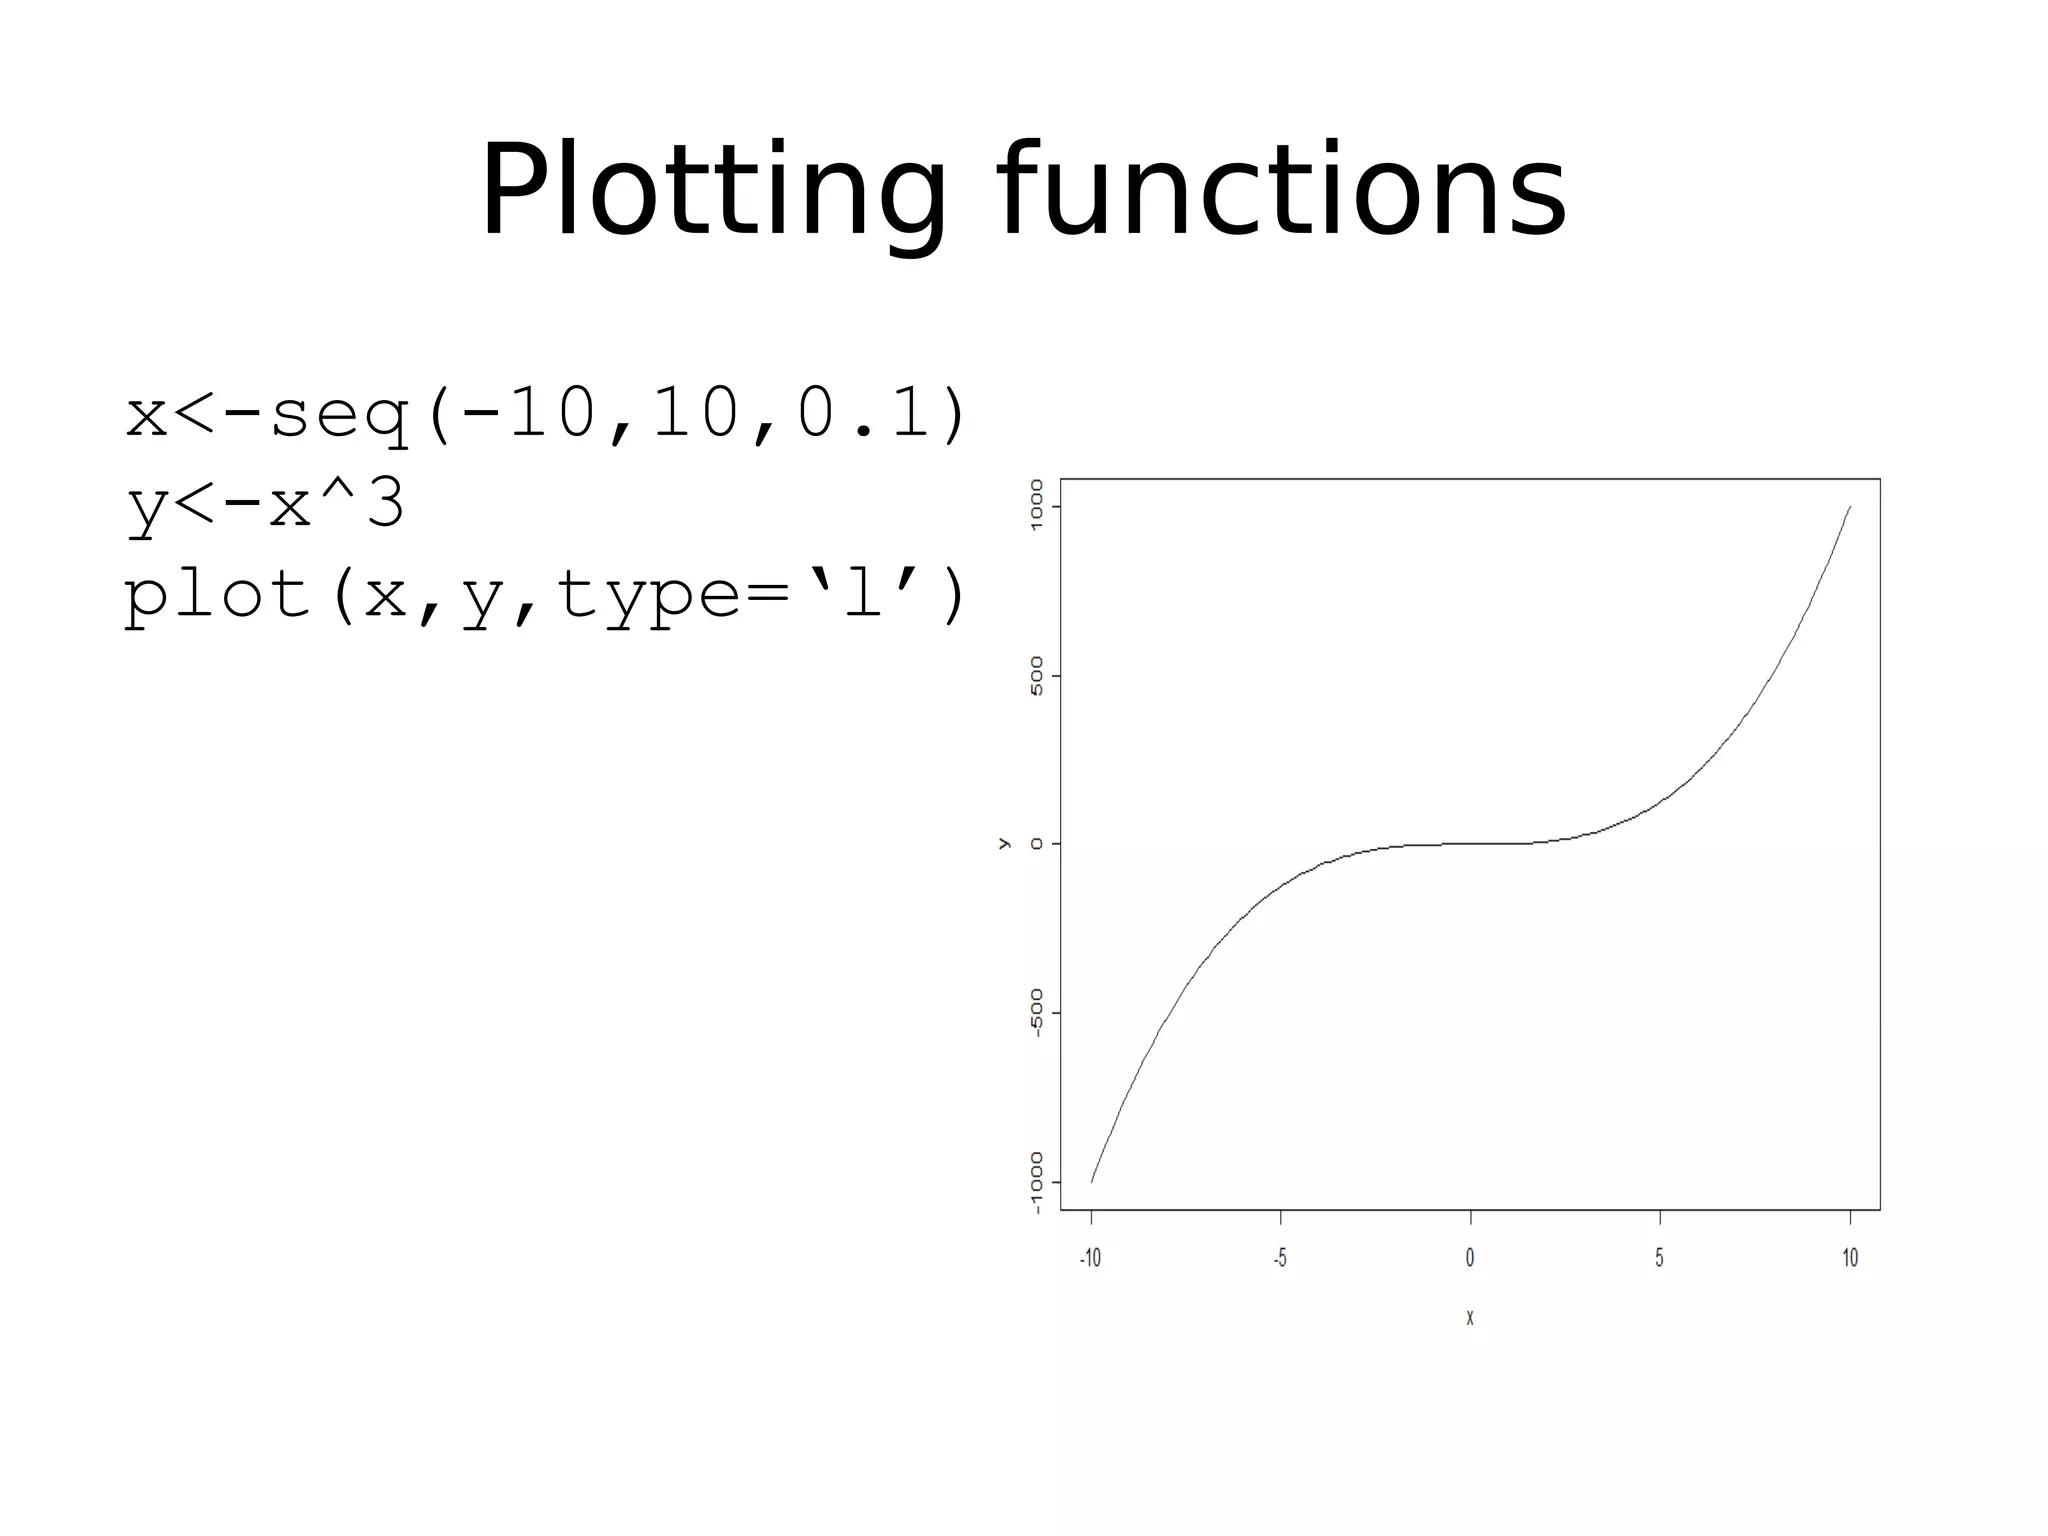
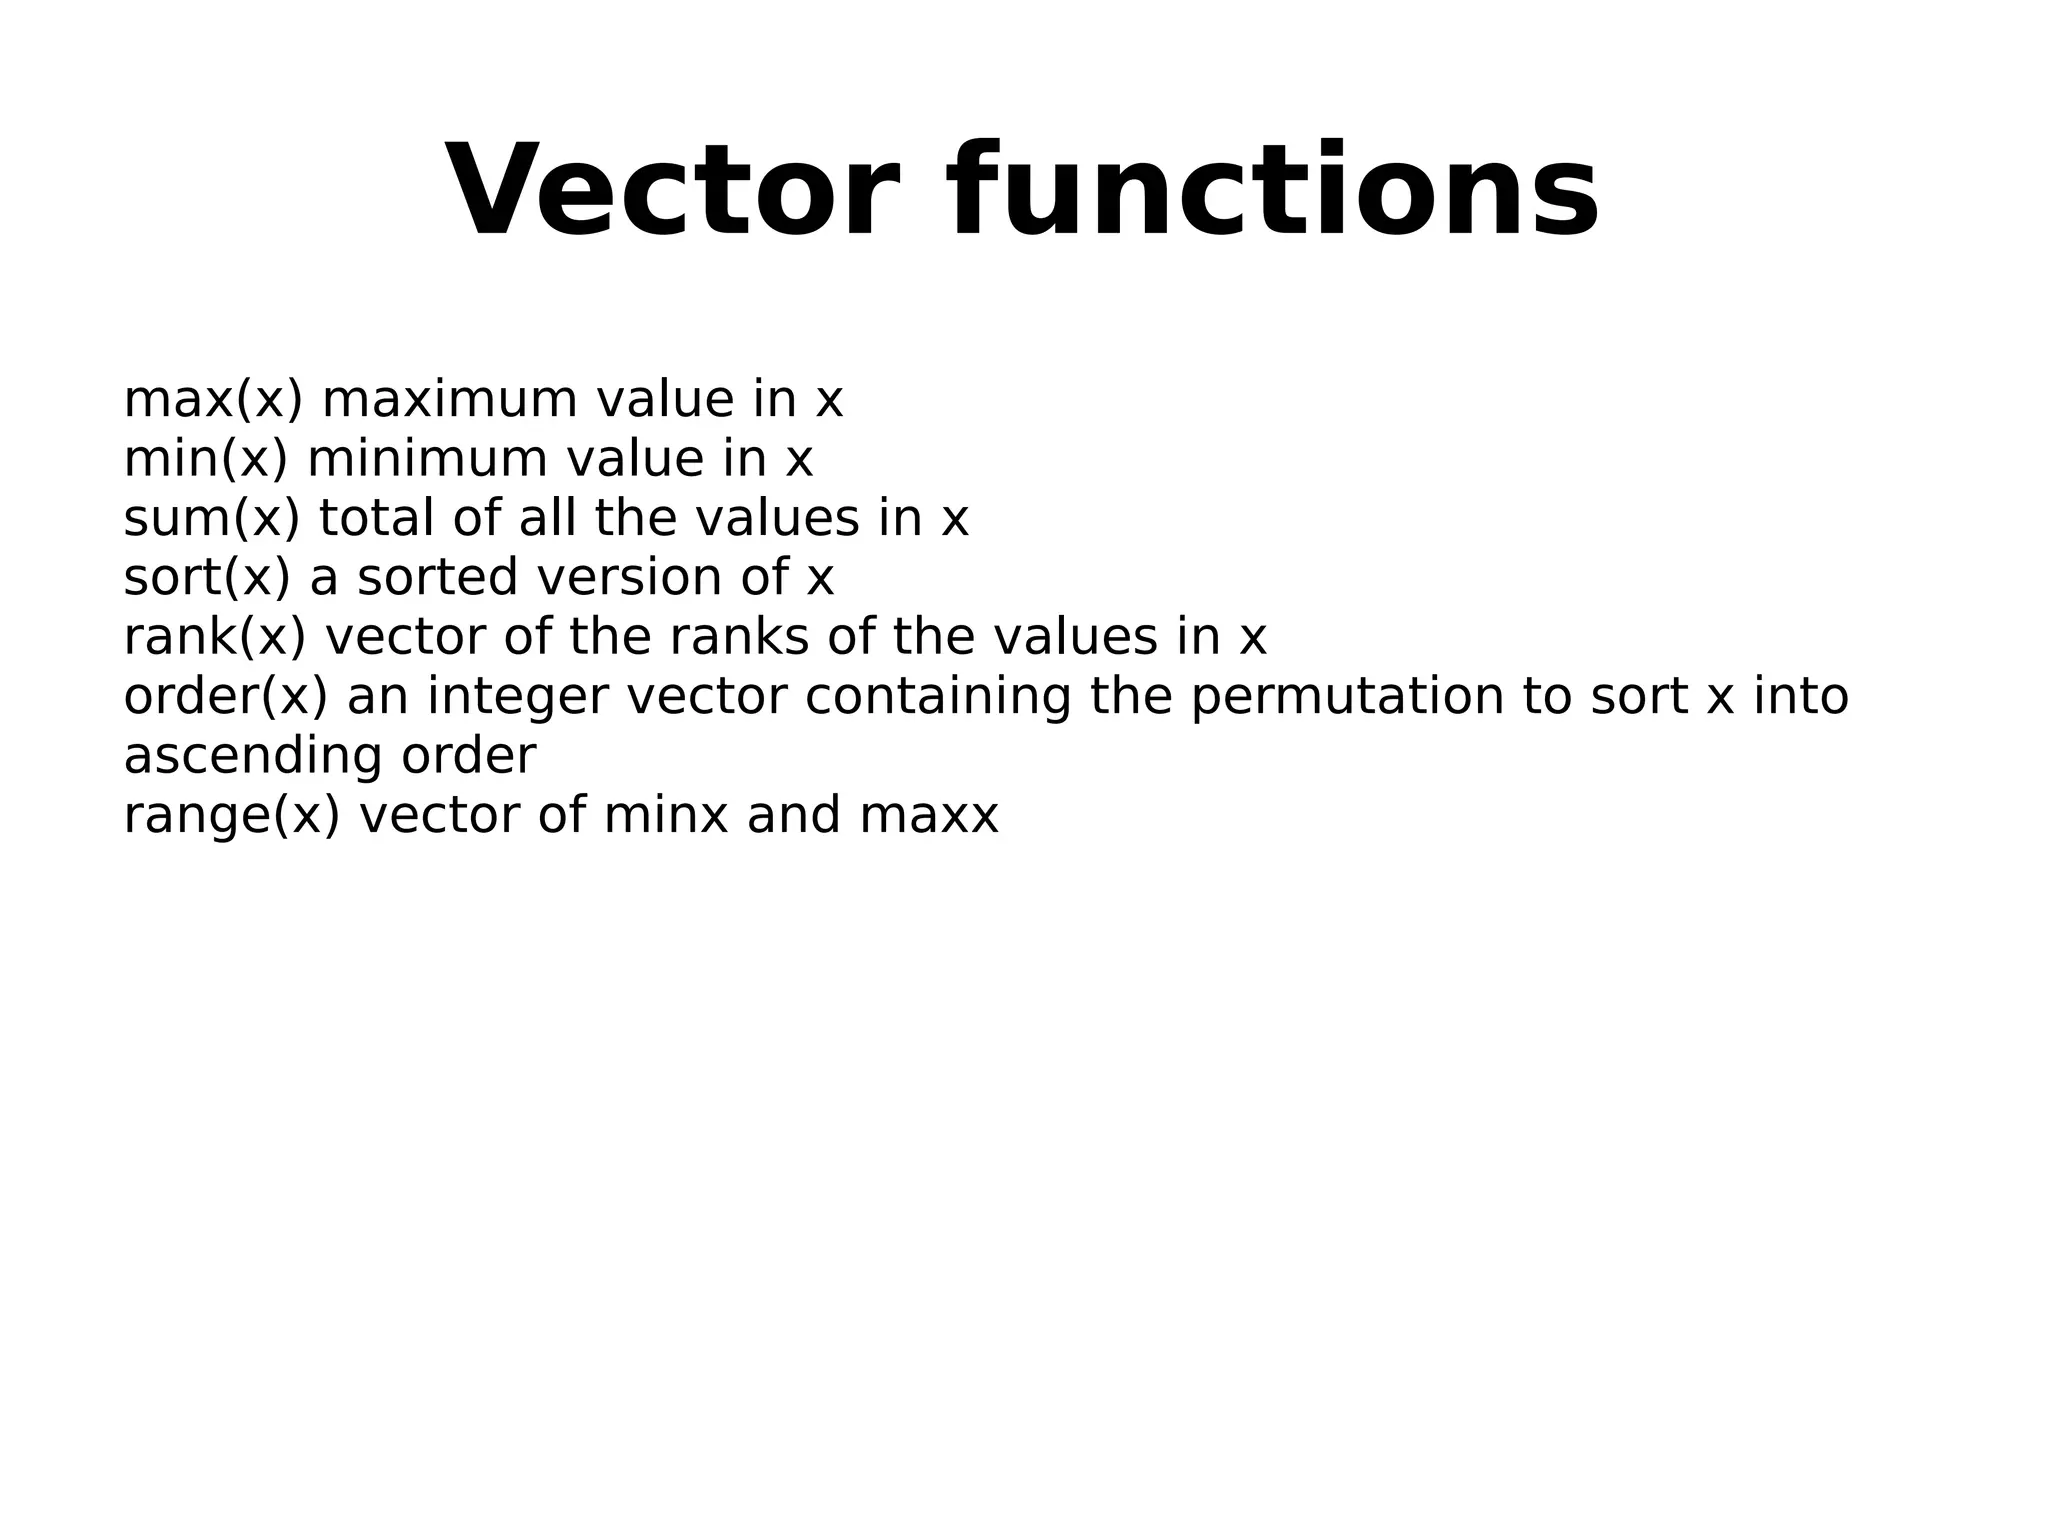
Creating and manipulating vectors, including plotting functionalities.
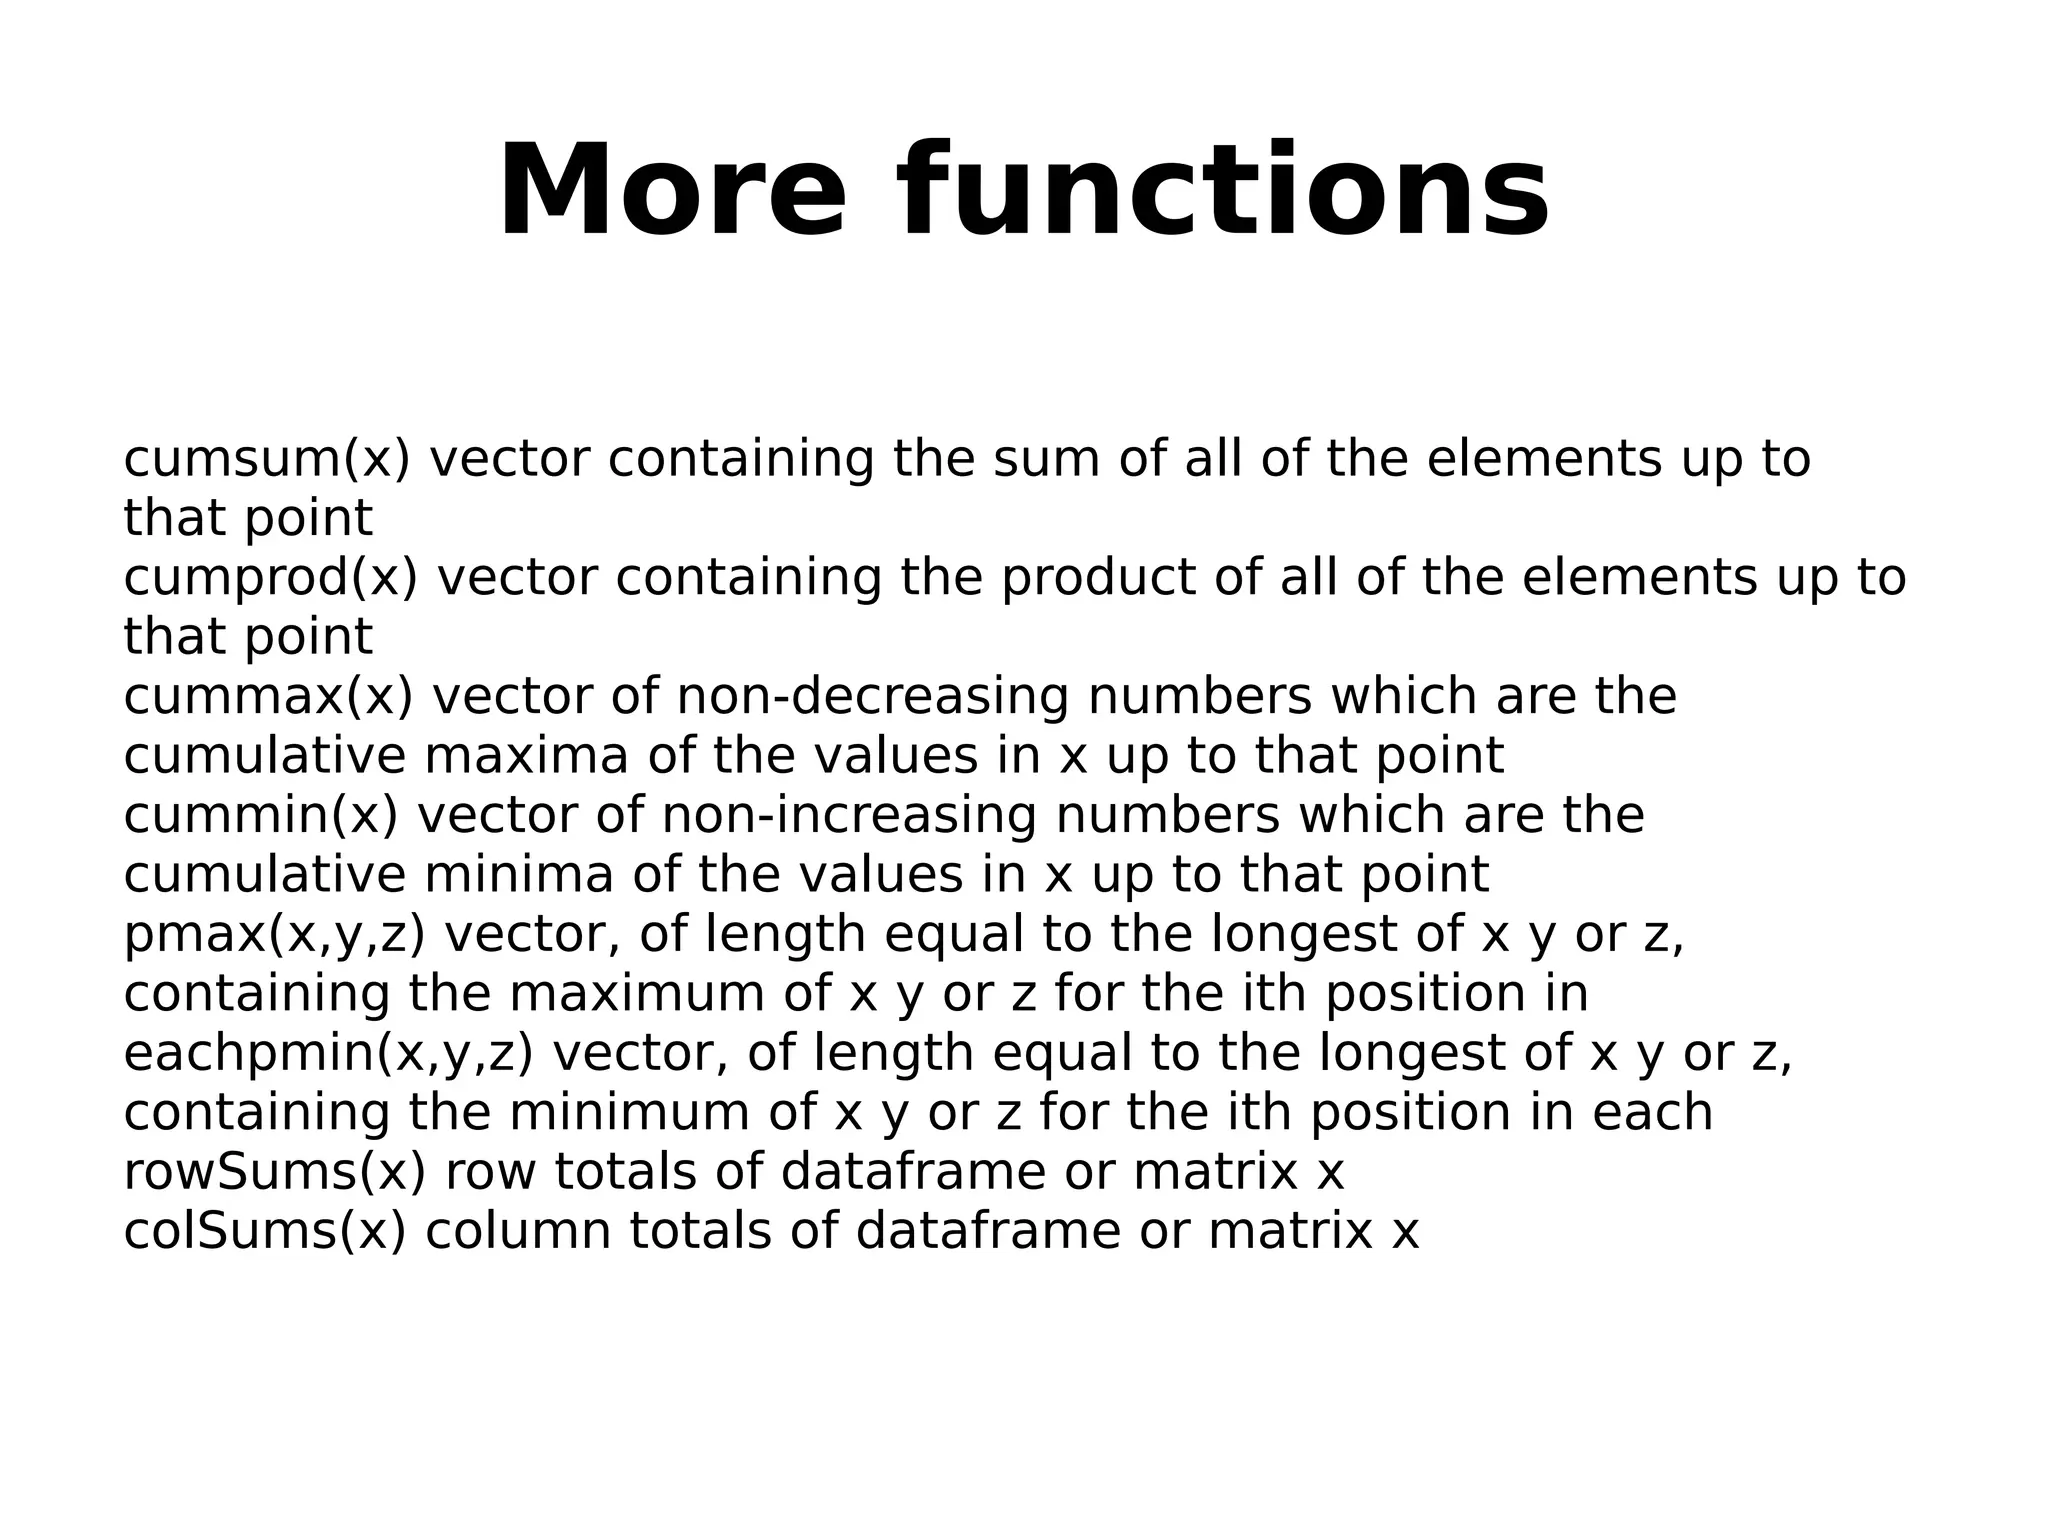
Utility functions for data analysis including cumulative calculations and vector operations.
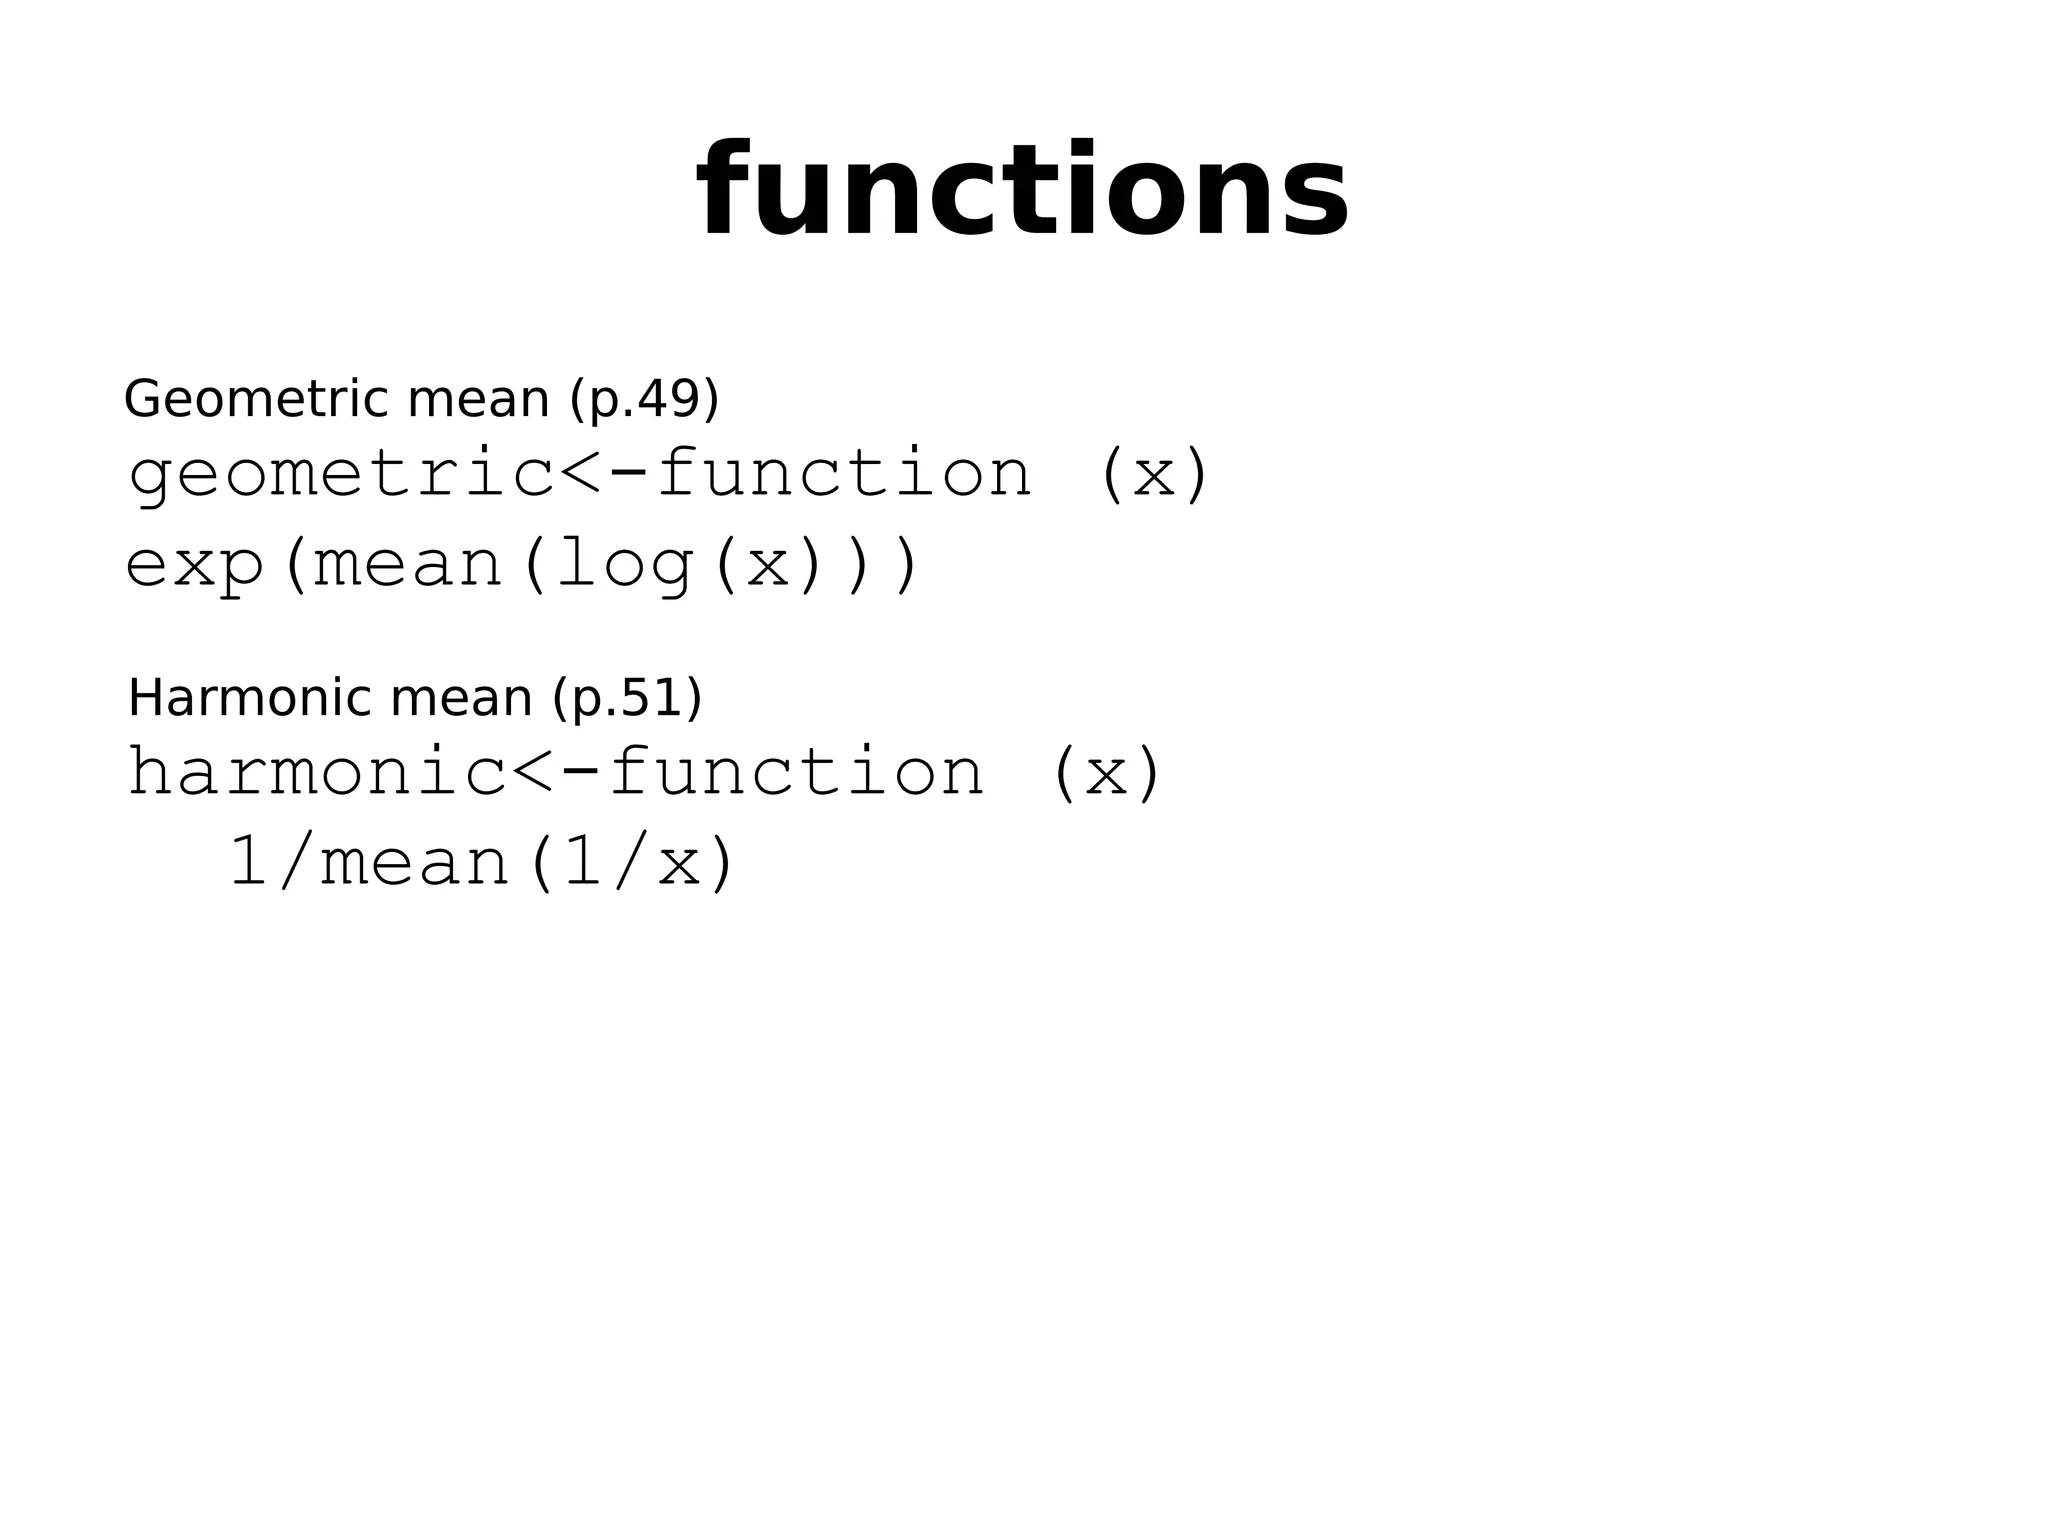
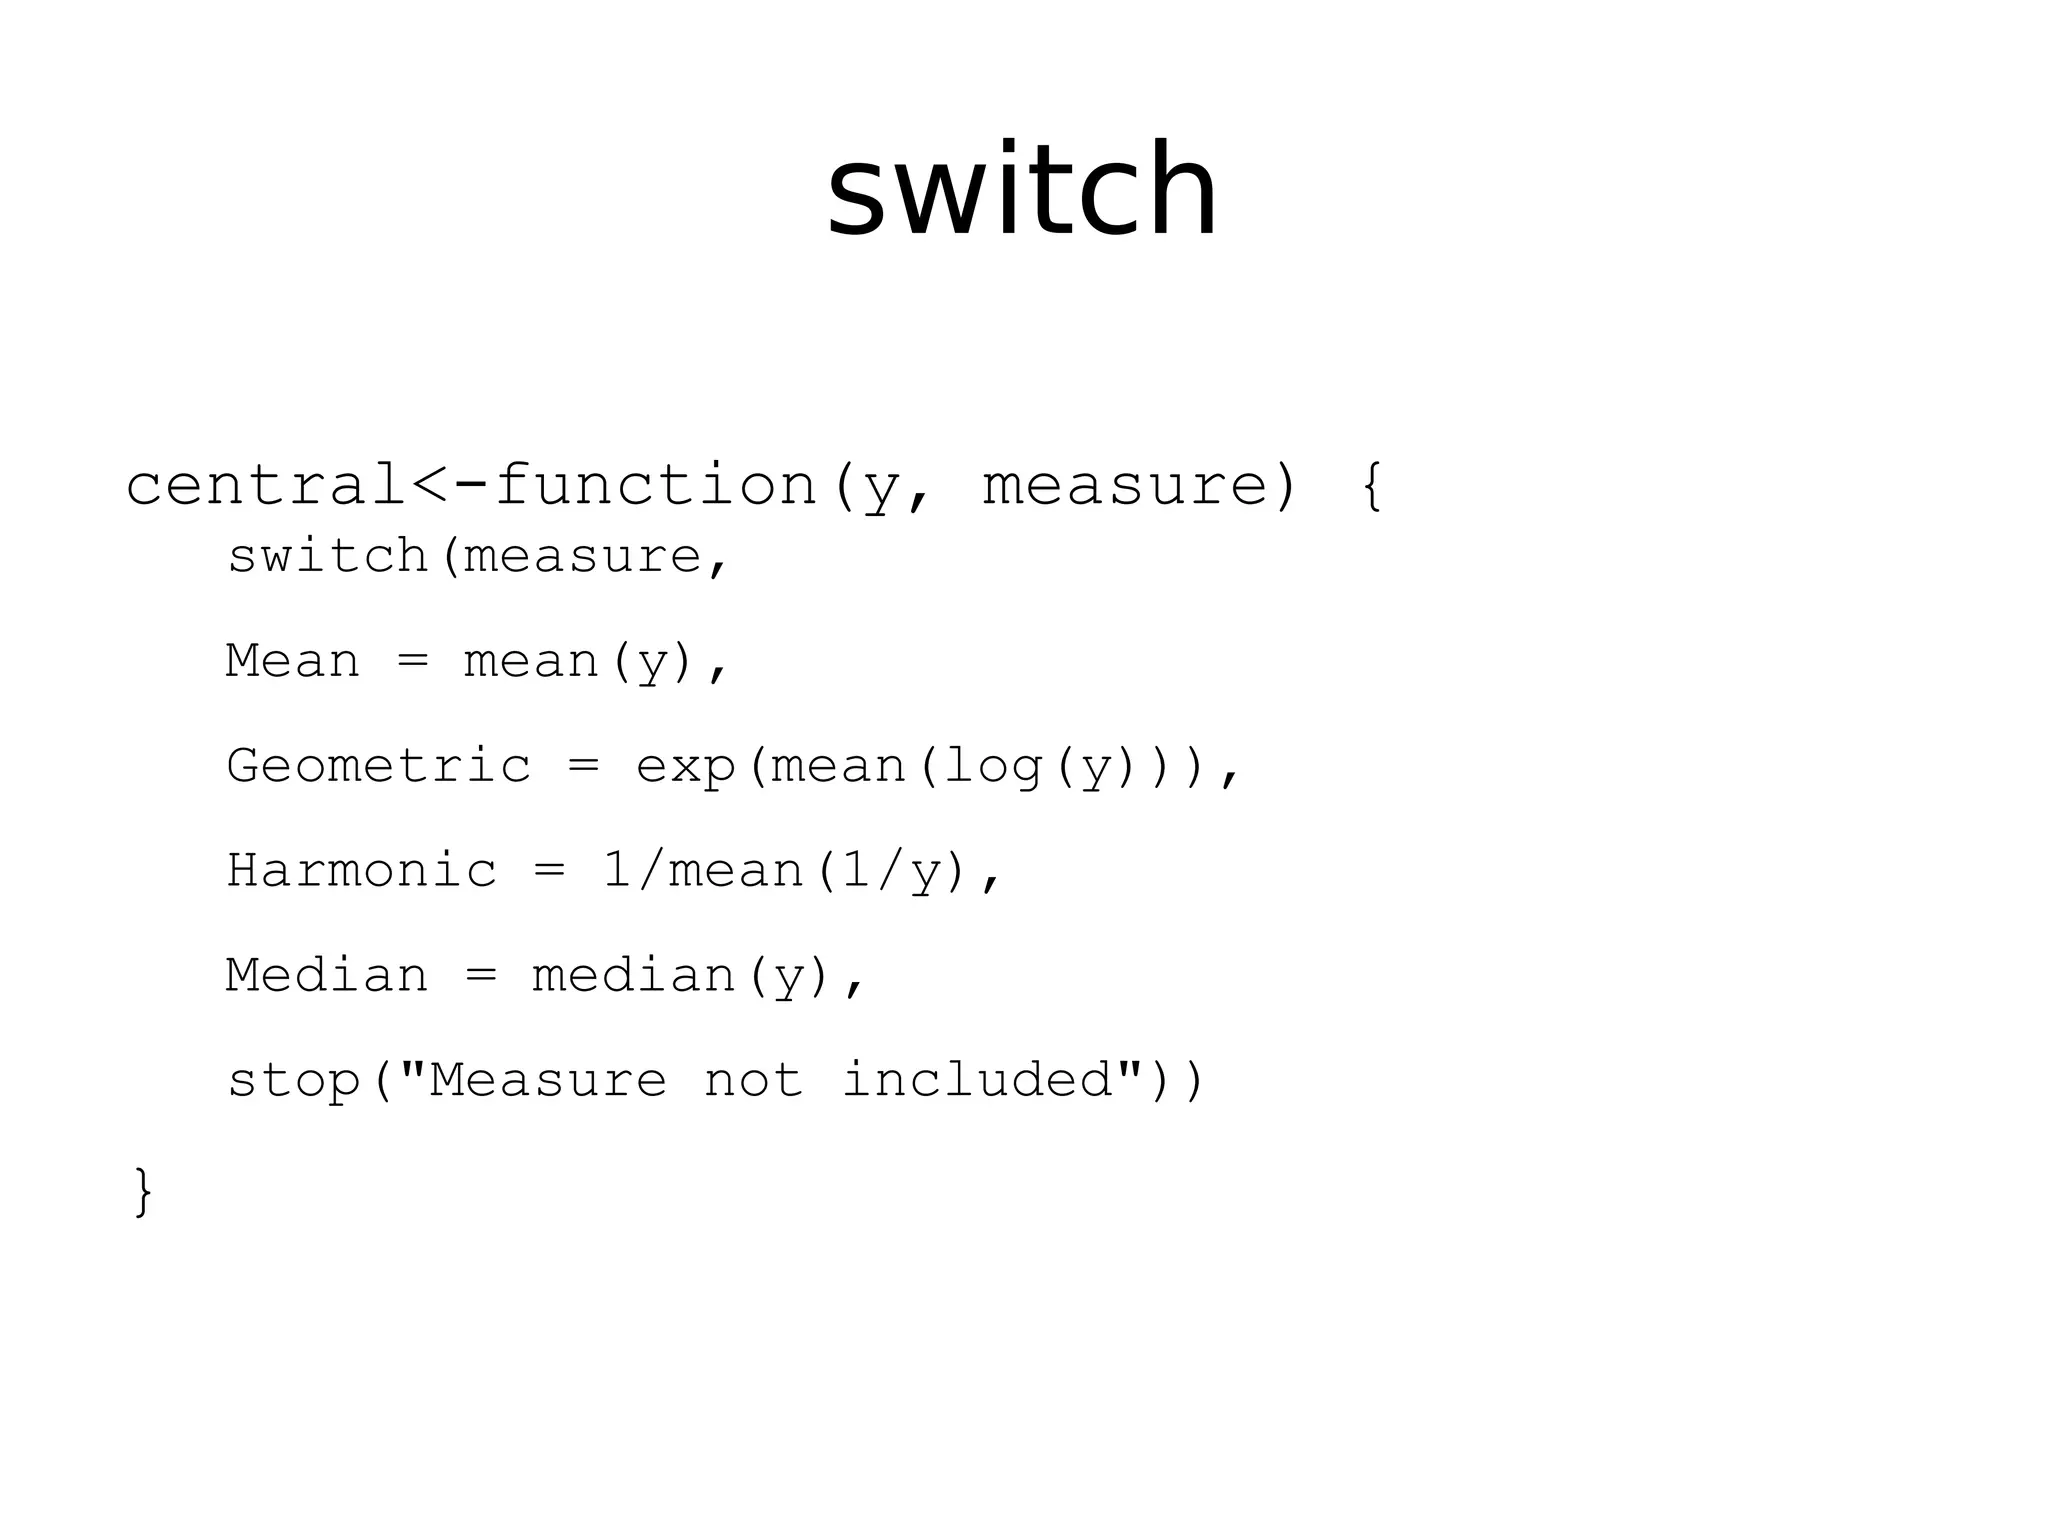
Defining custom functions for calculating geometric and harmonic means.
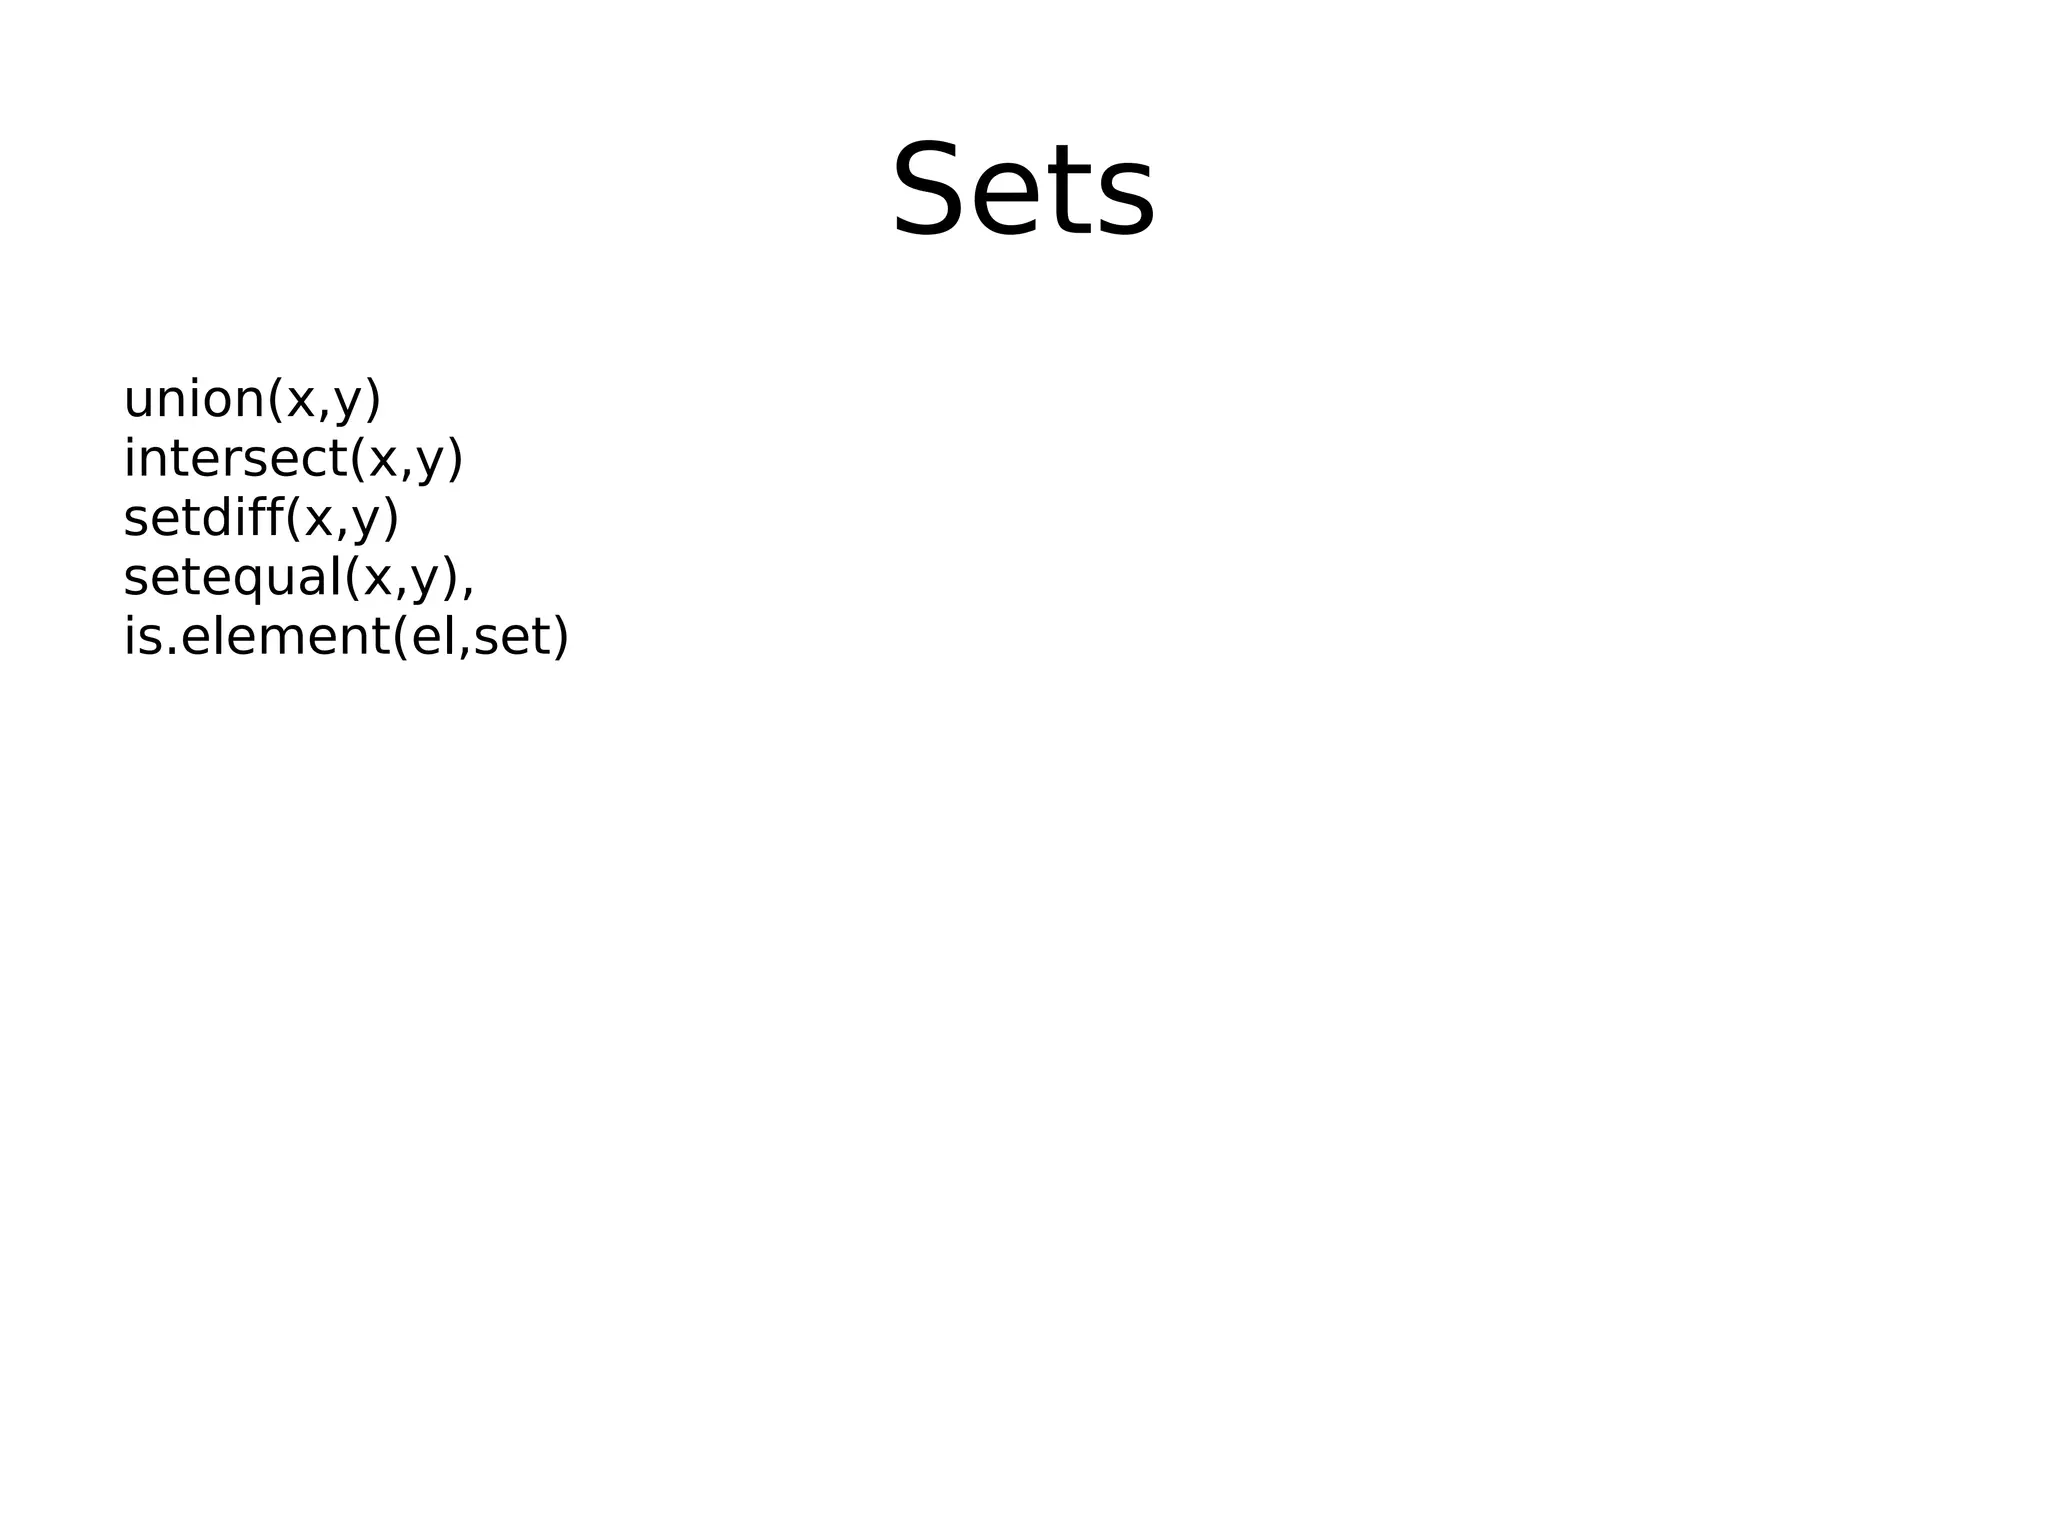
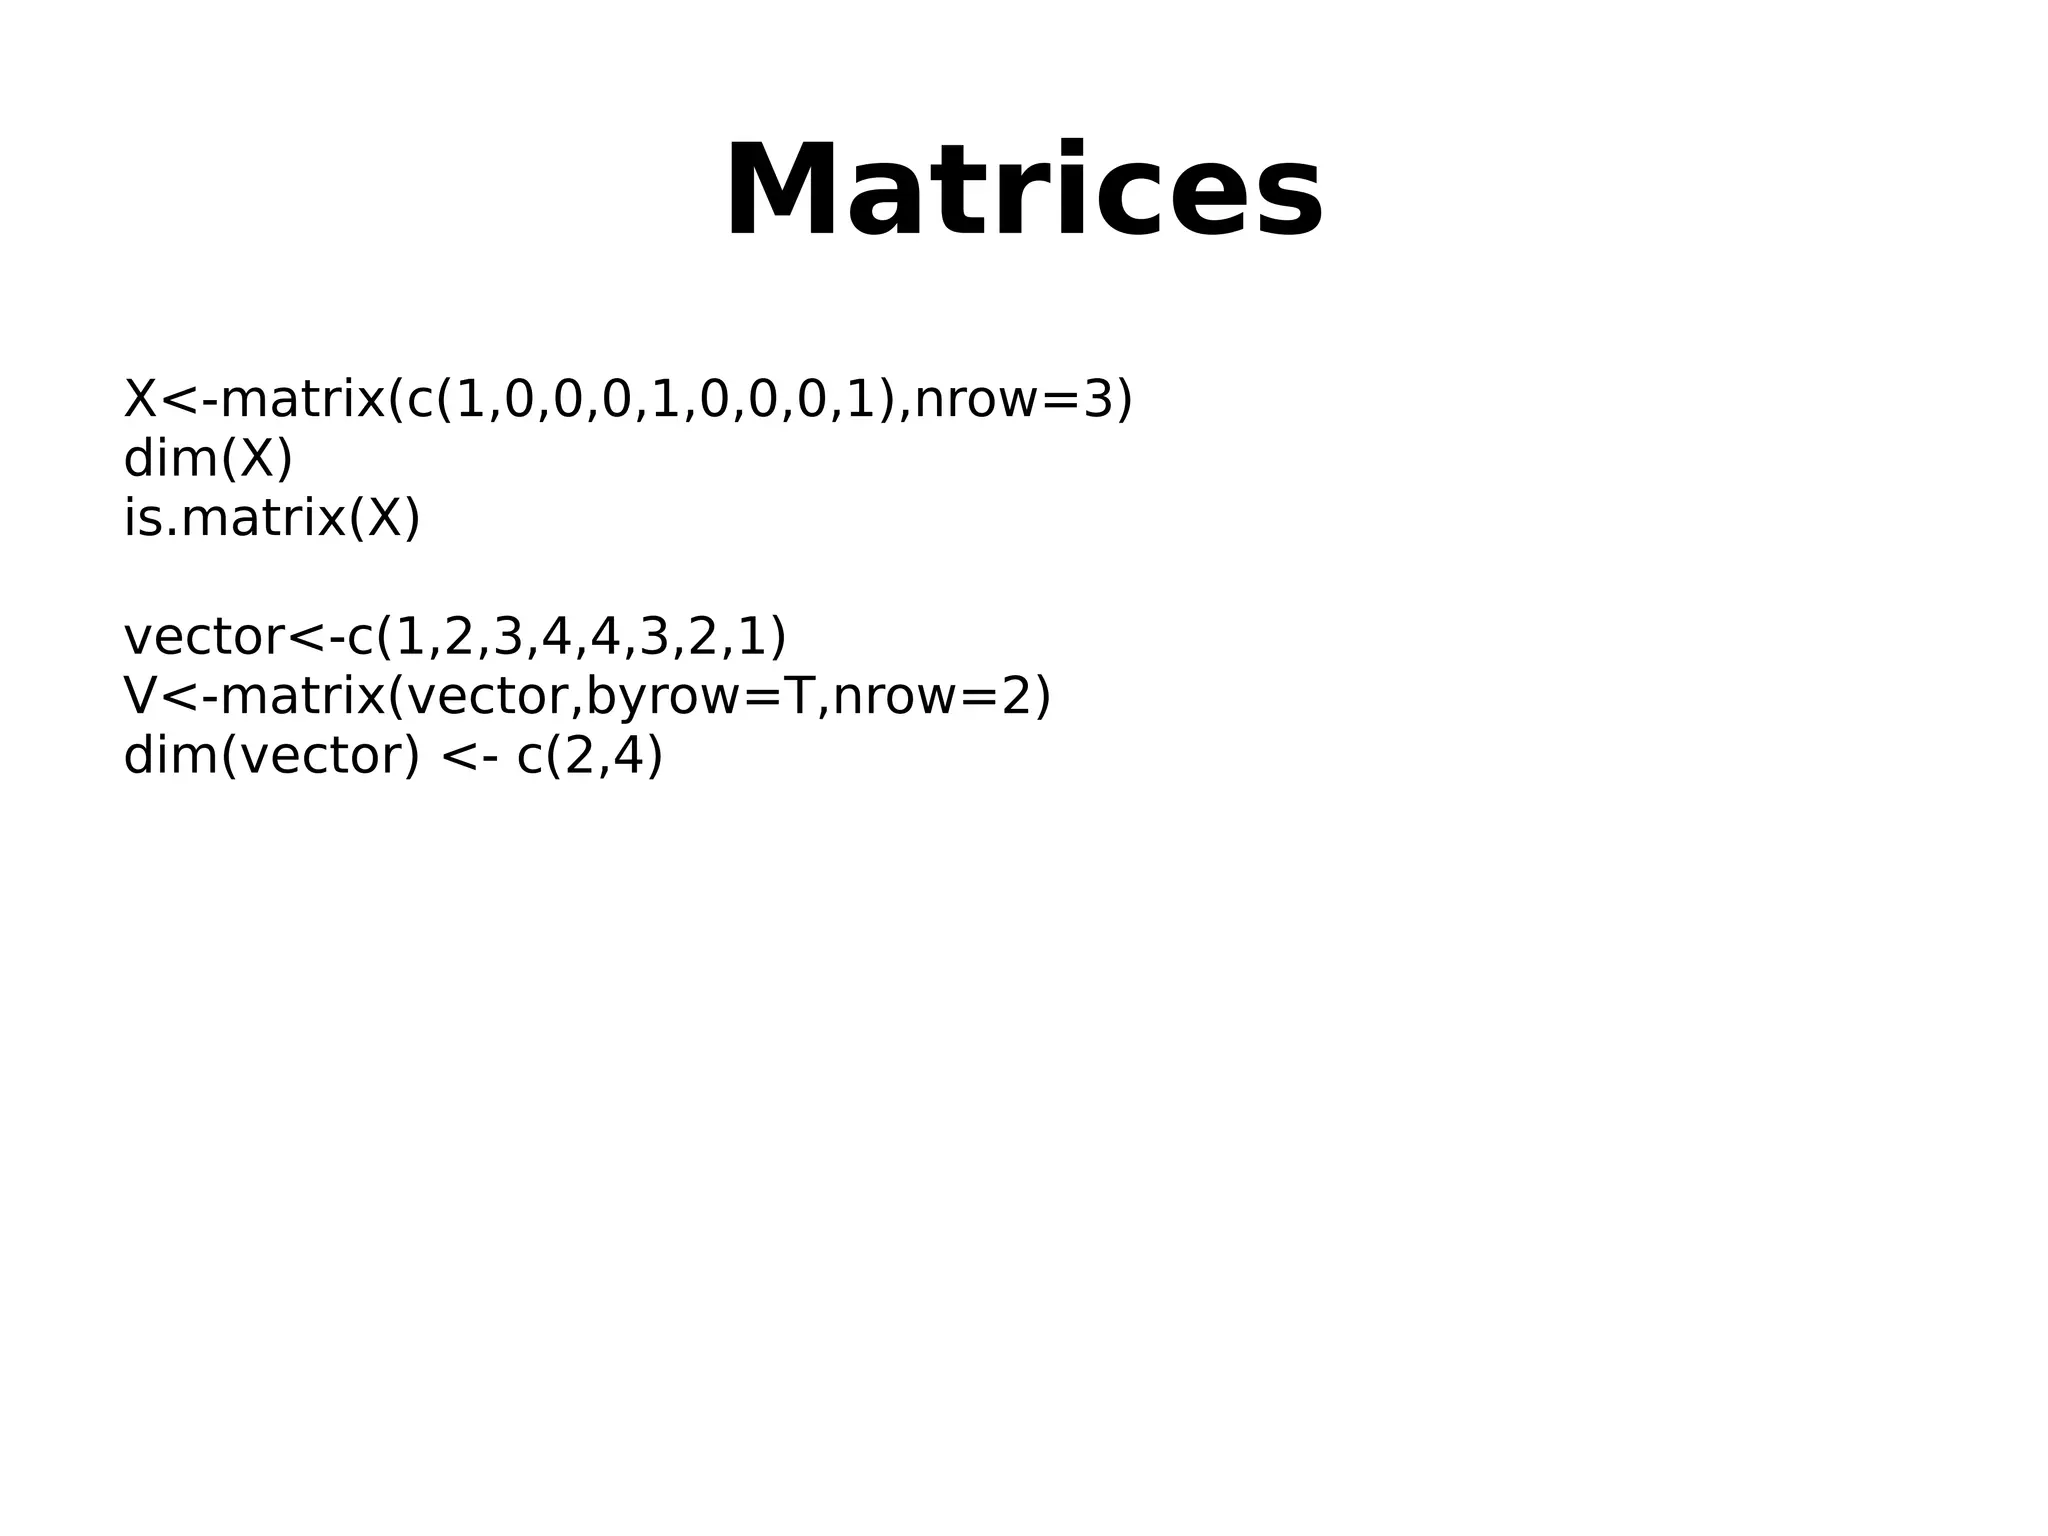
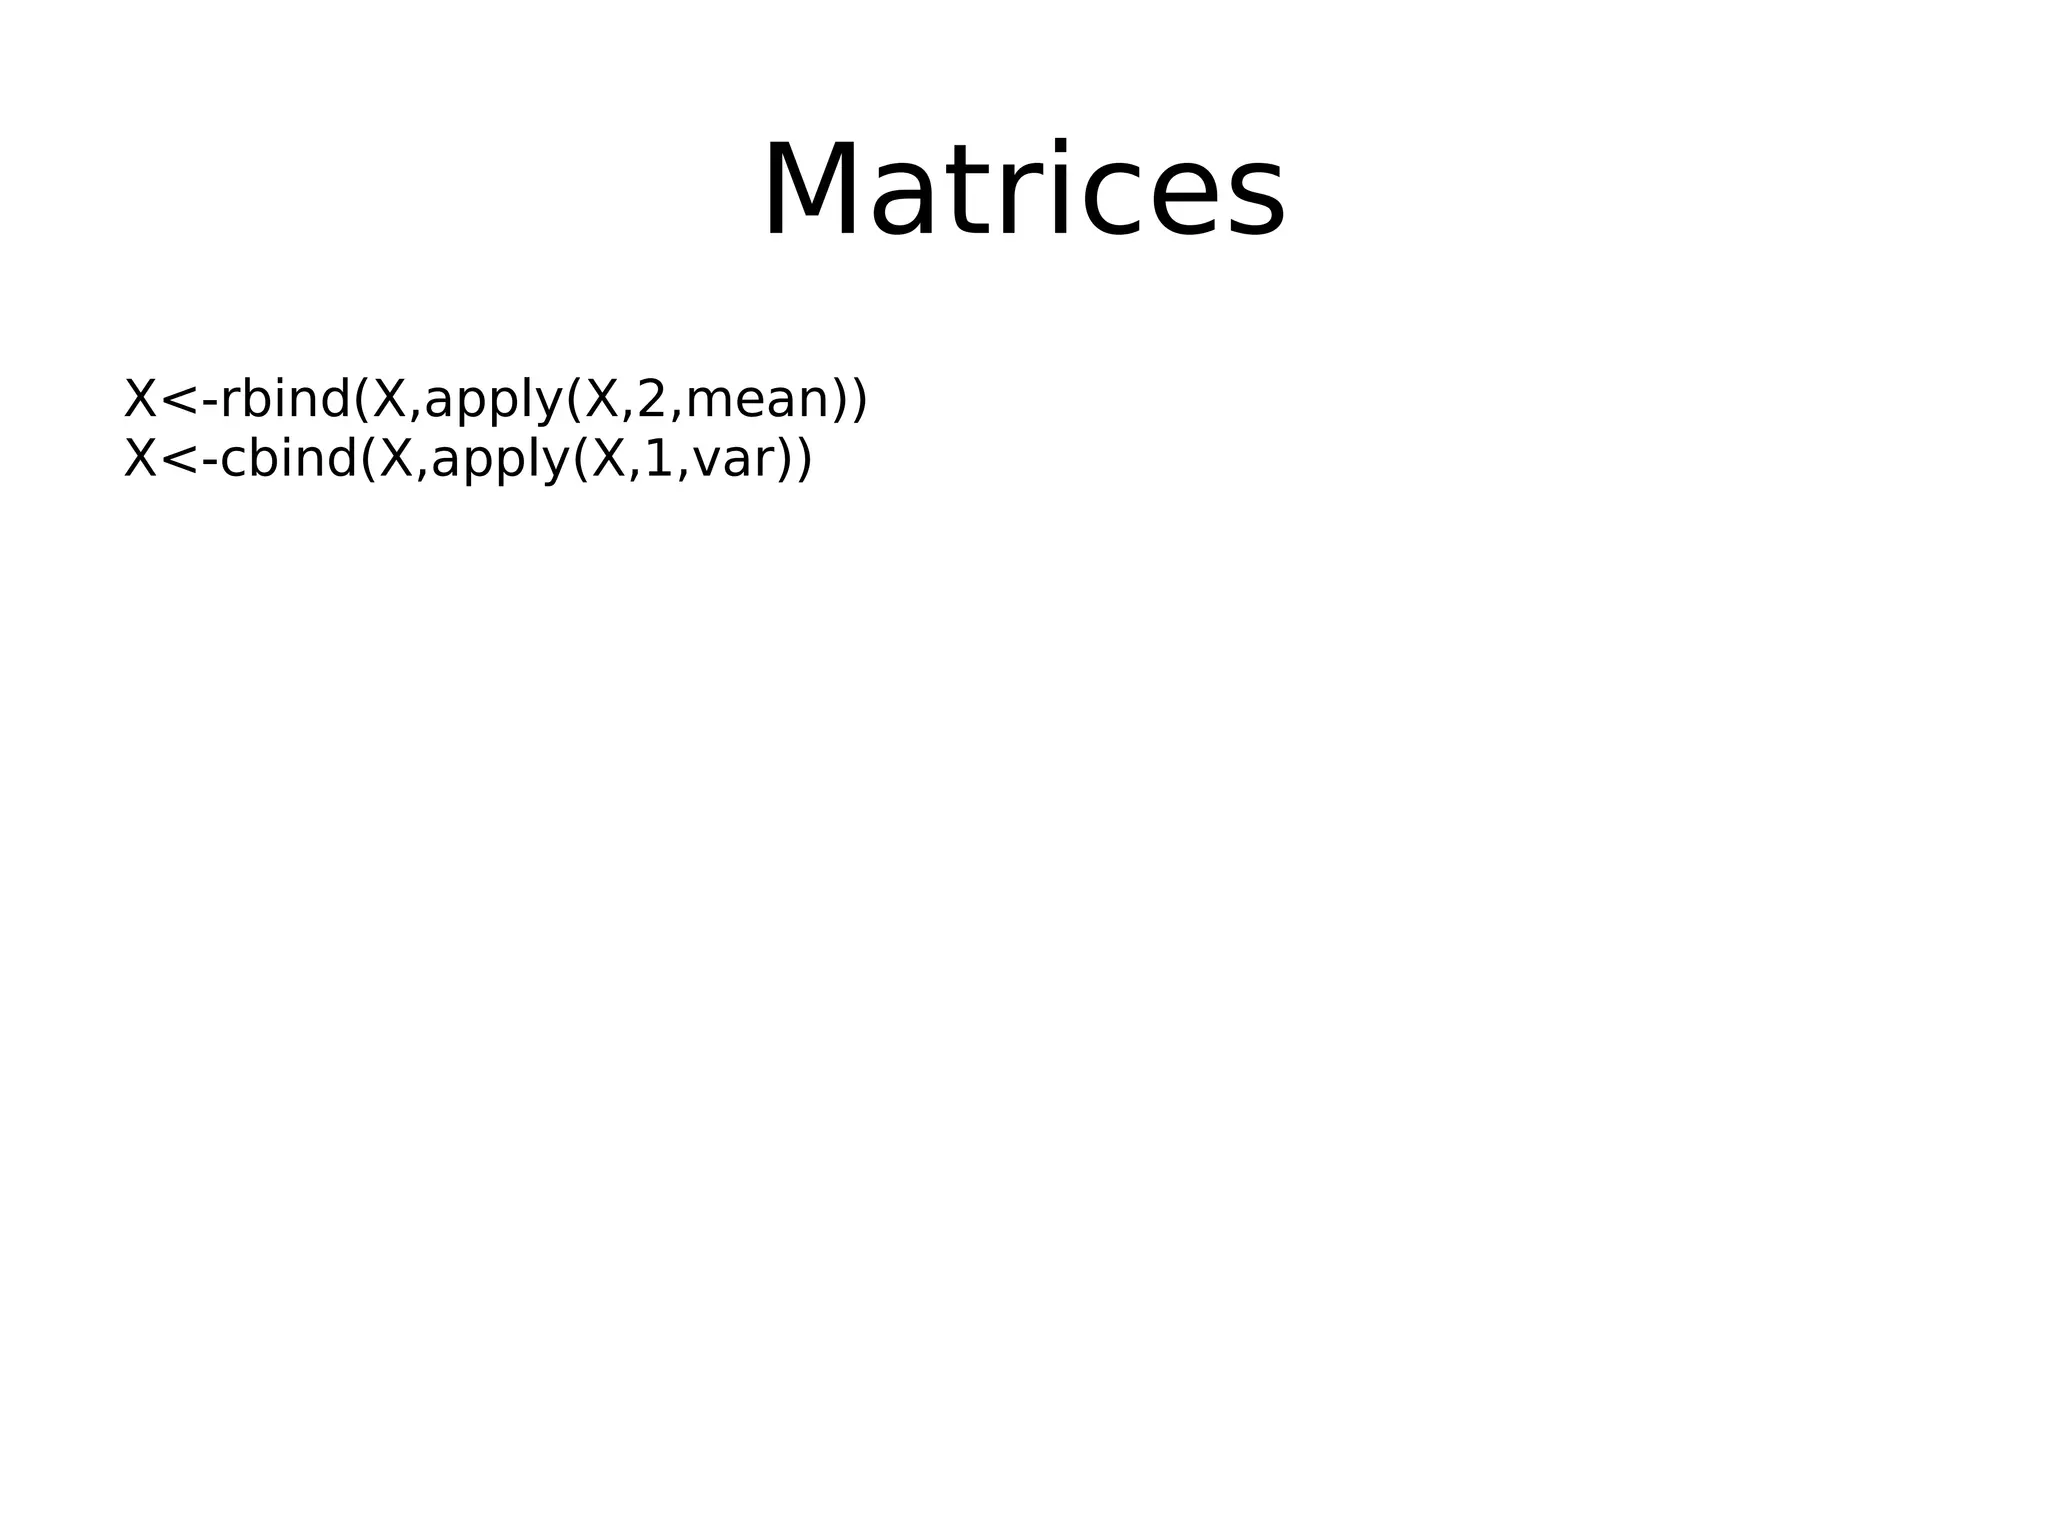
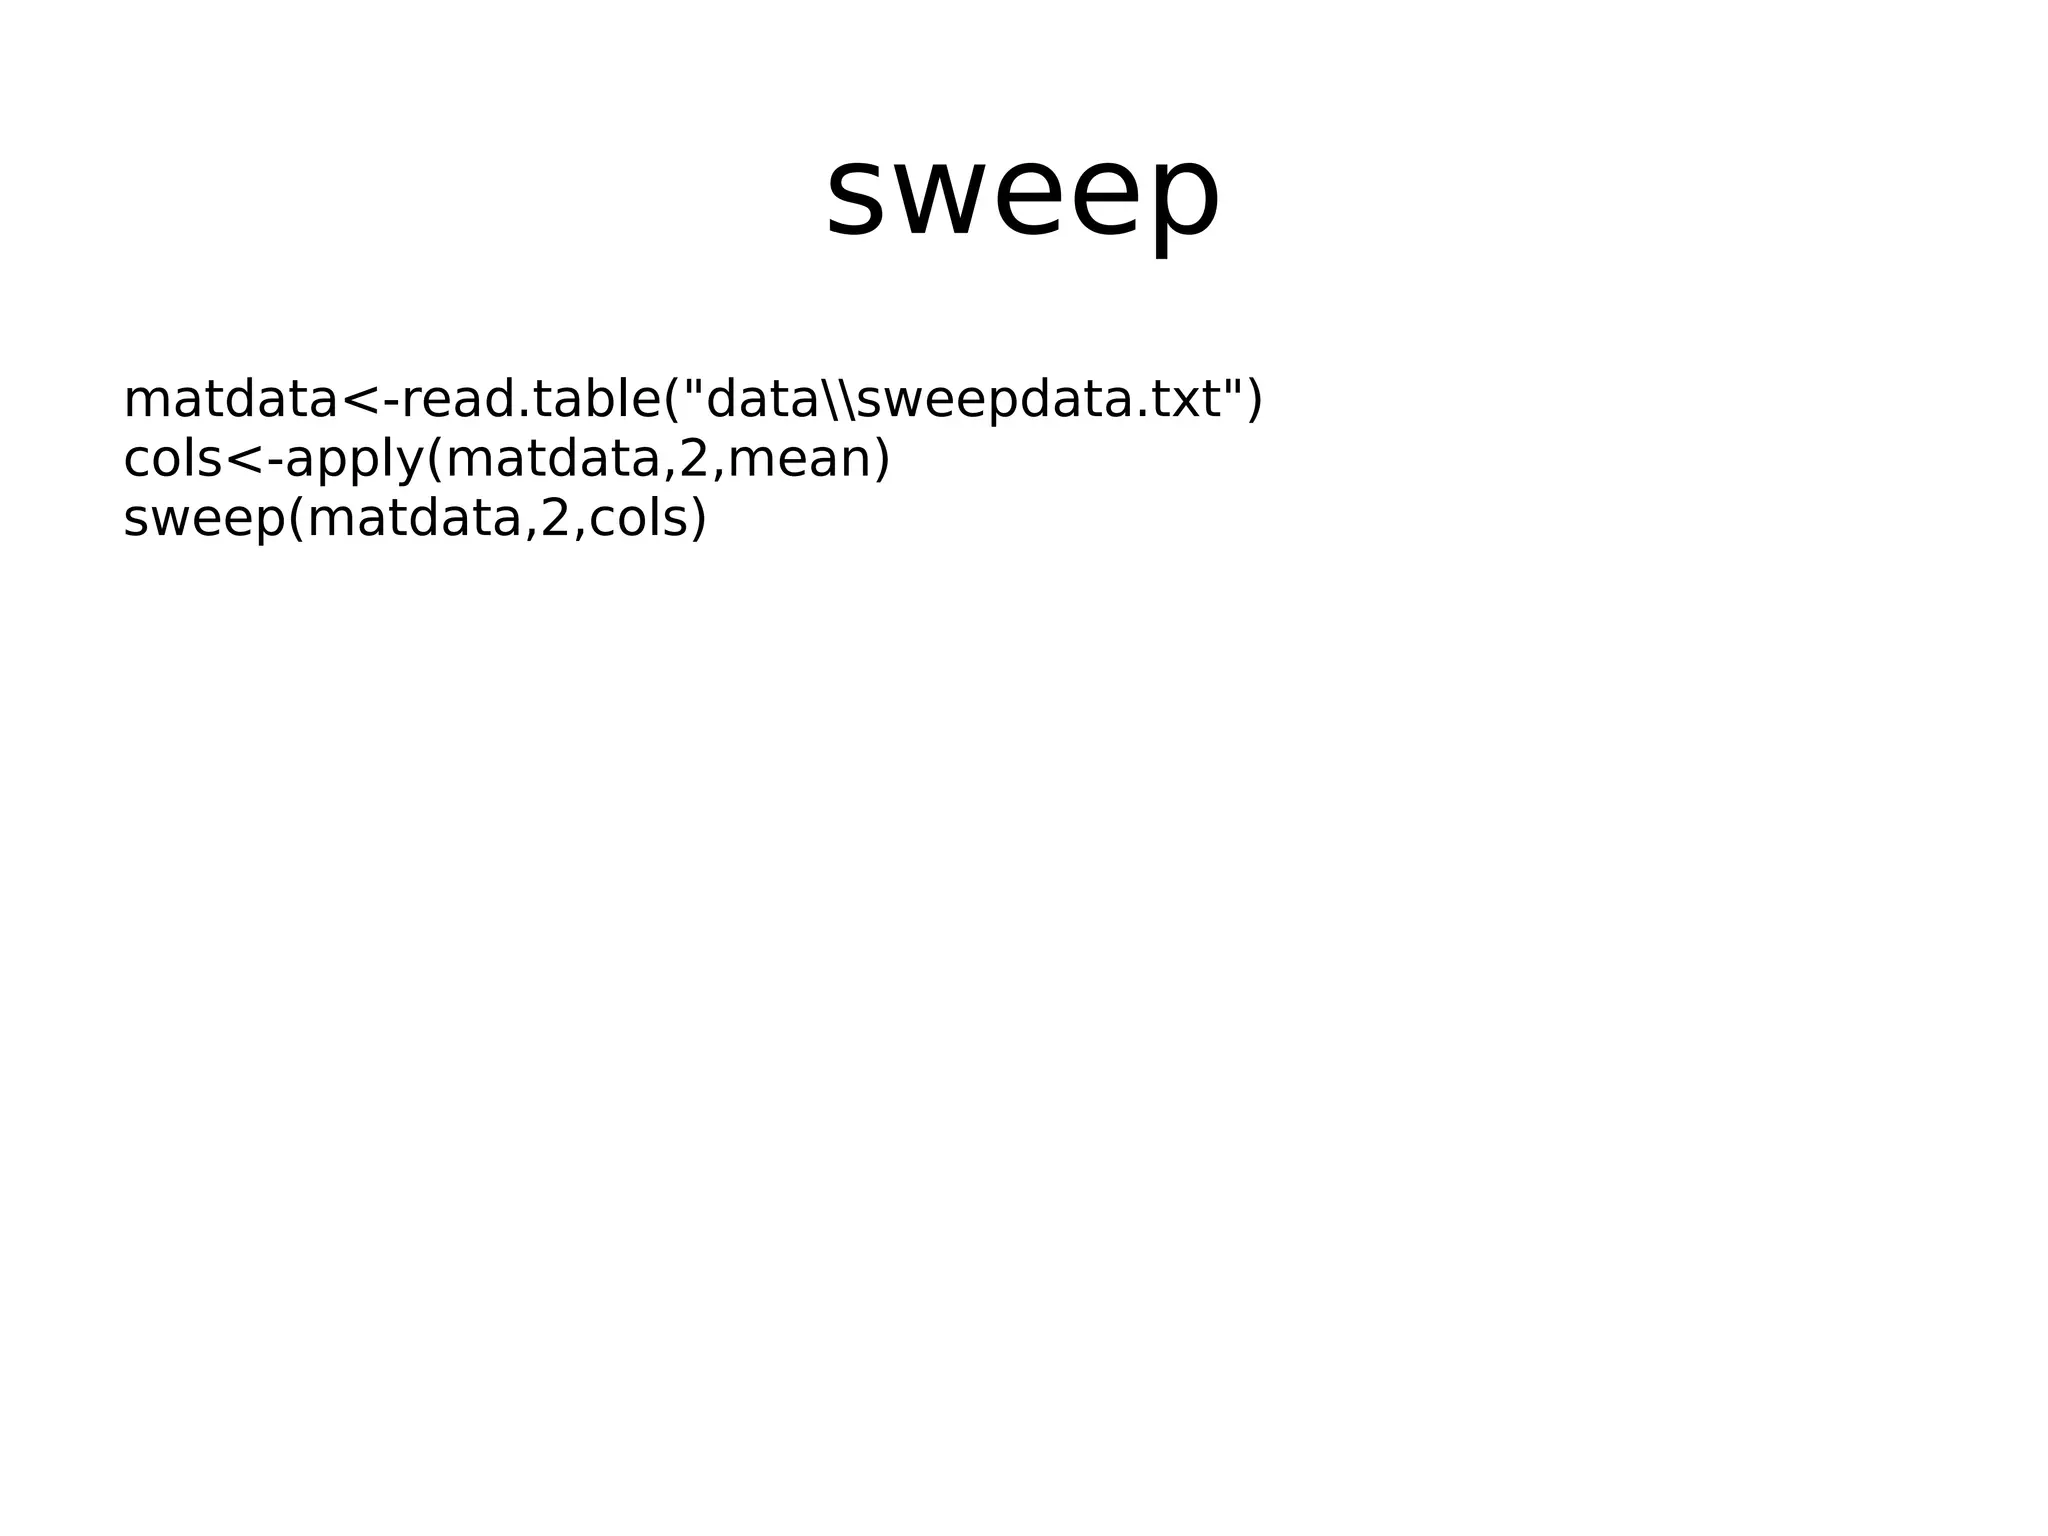
Set operations, creation and manipulation of matrices and applying the sweep function.
Manipulating lists and strings, including regular expressions for text processing.
Creating data frames, handling missing values, and ensuring data integrity.
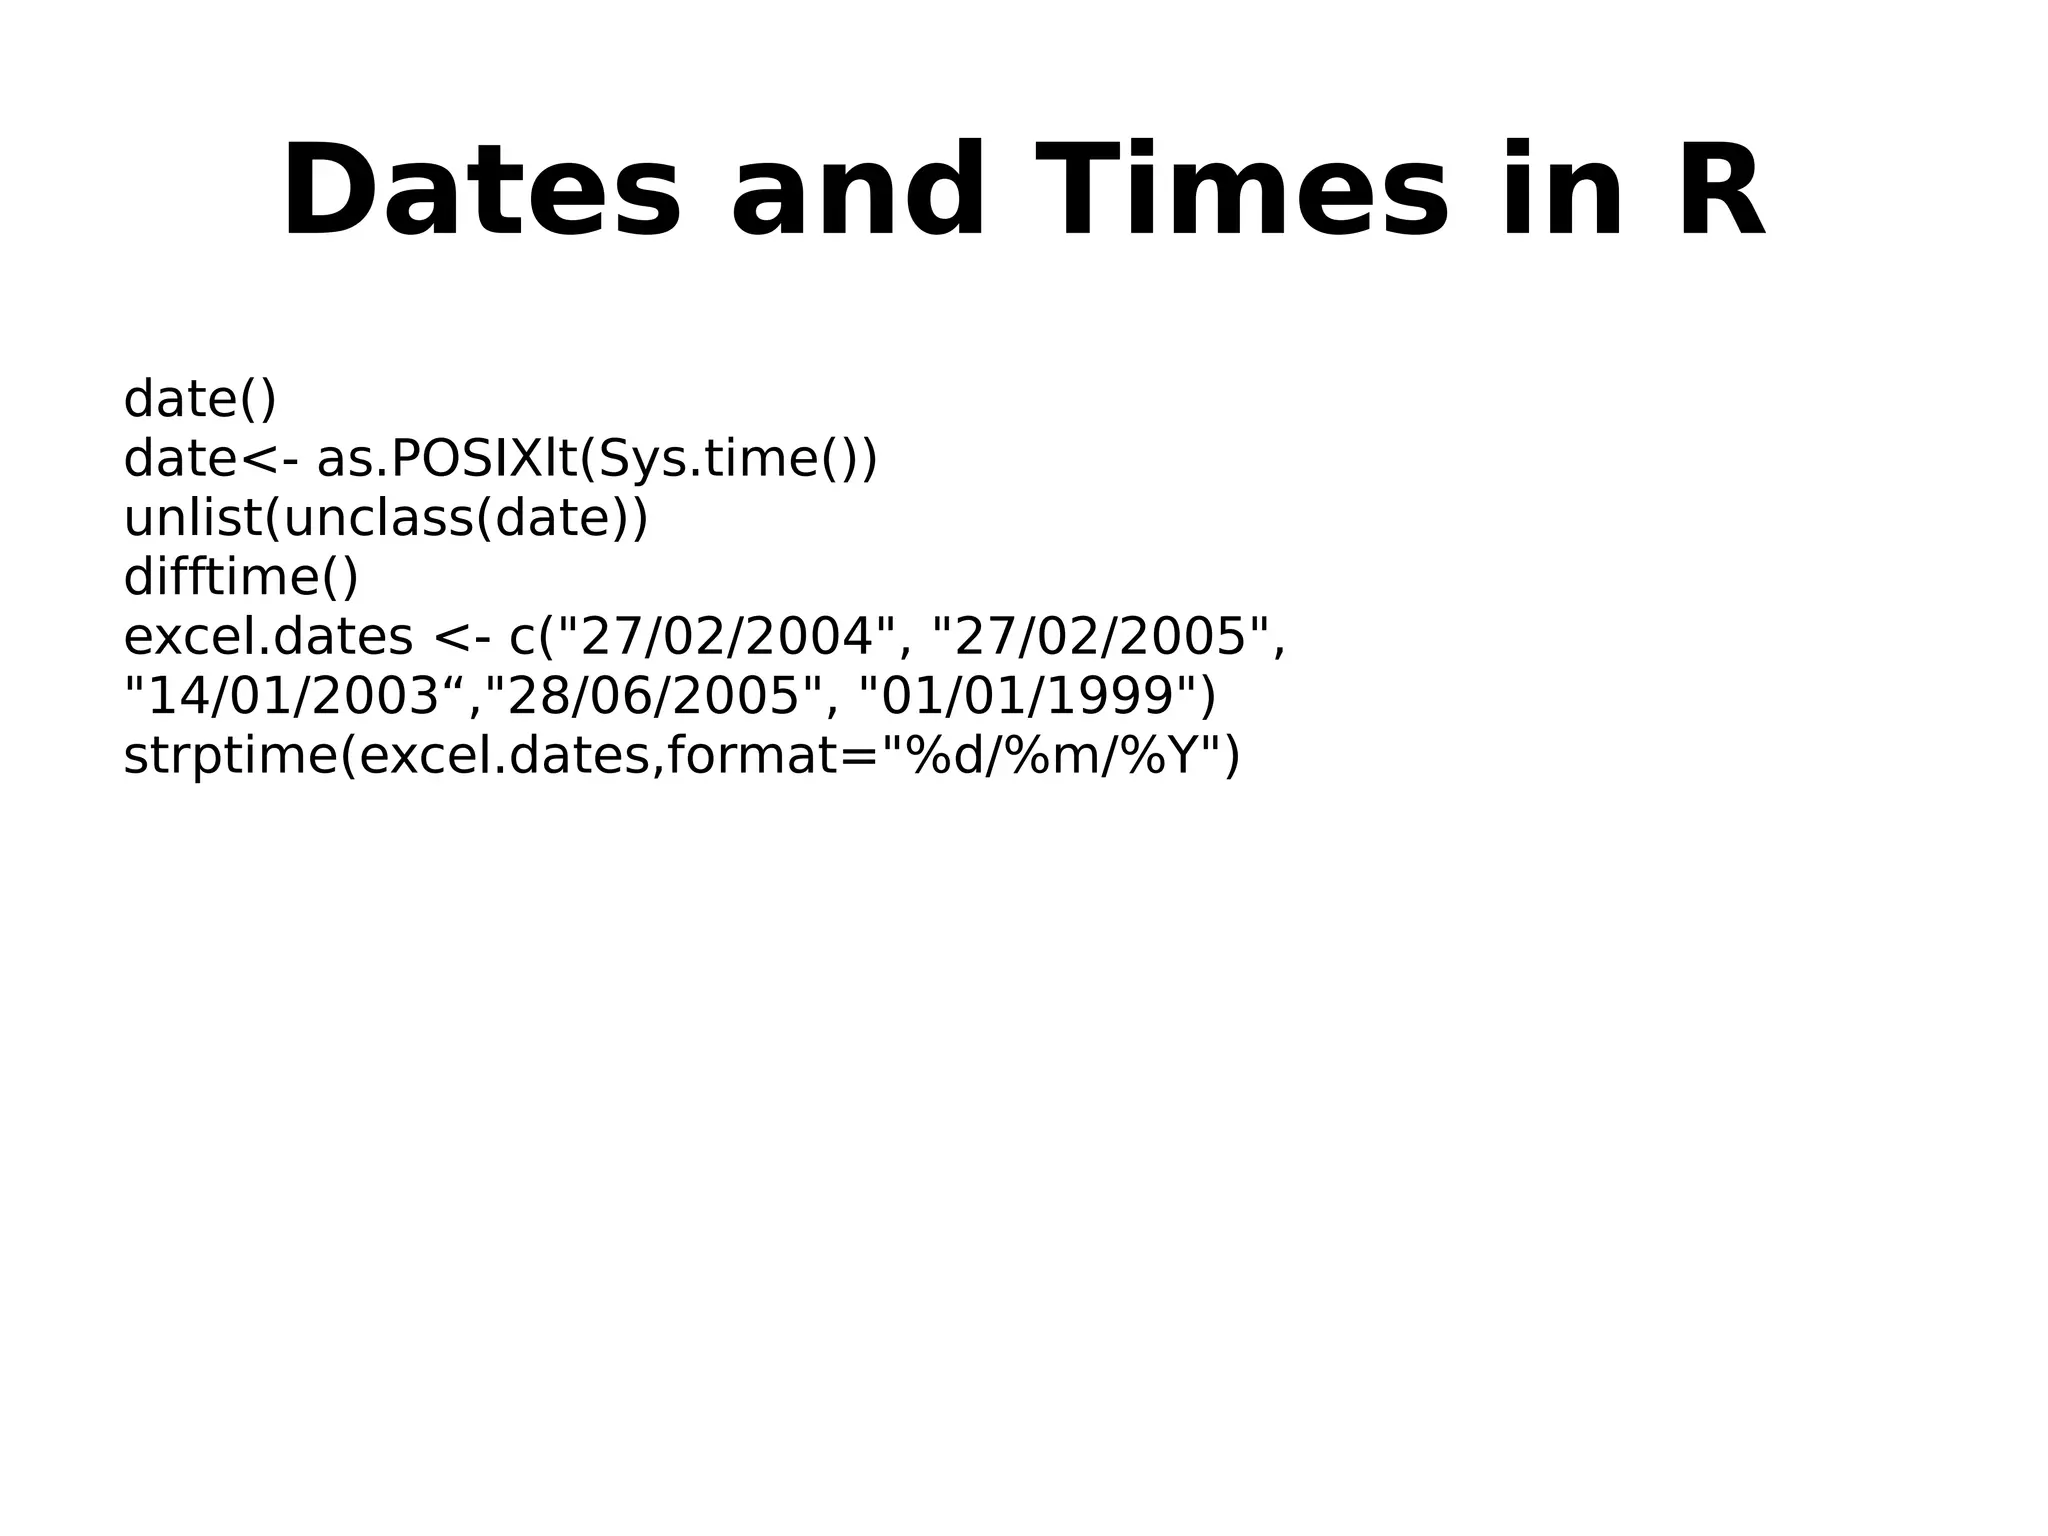
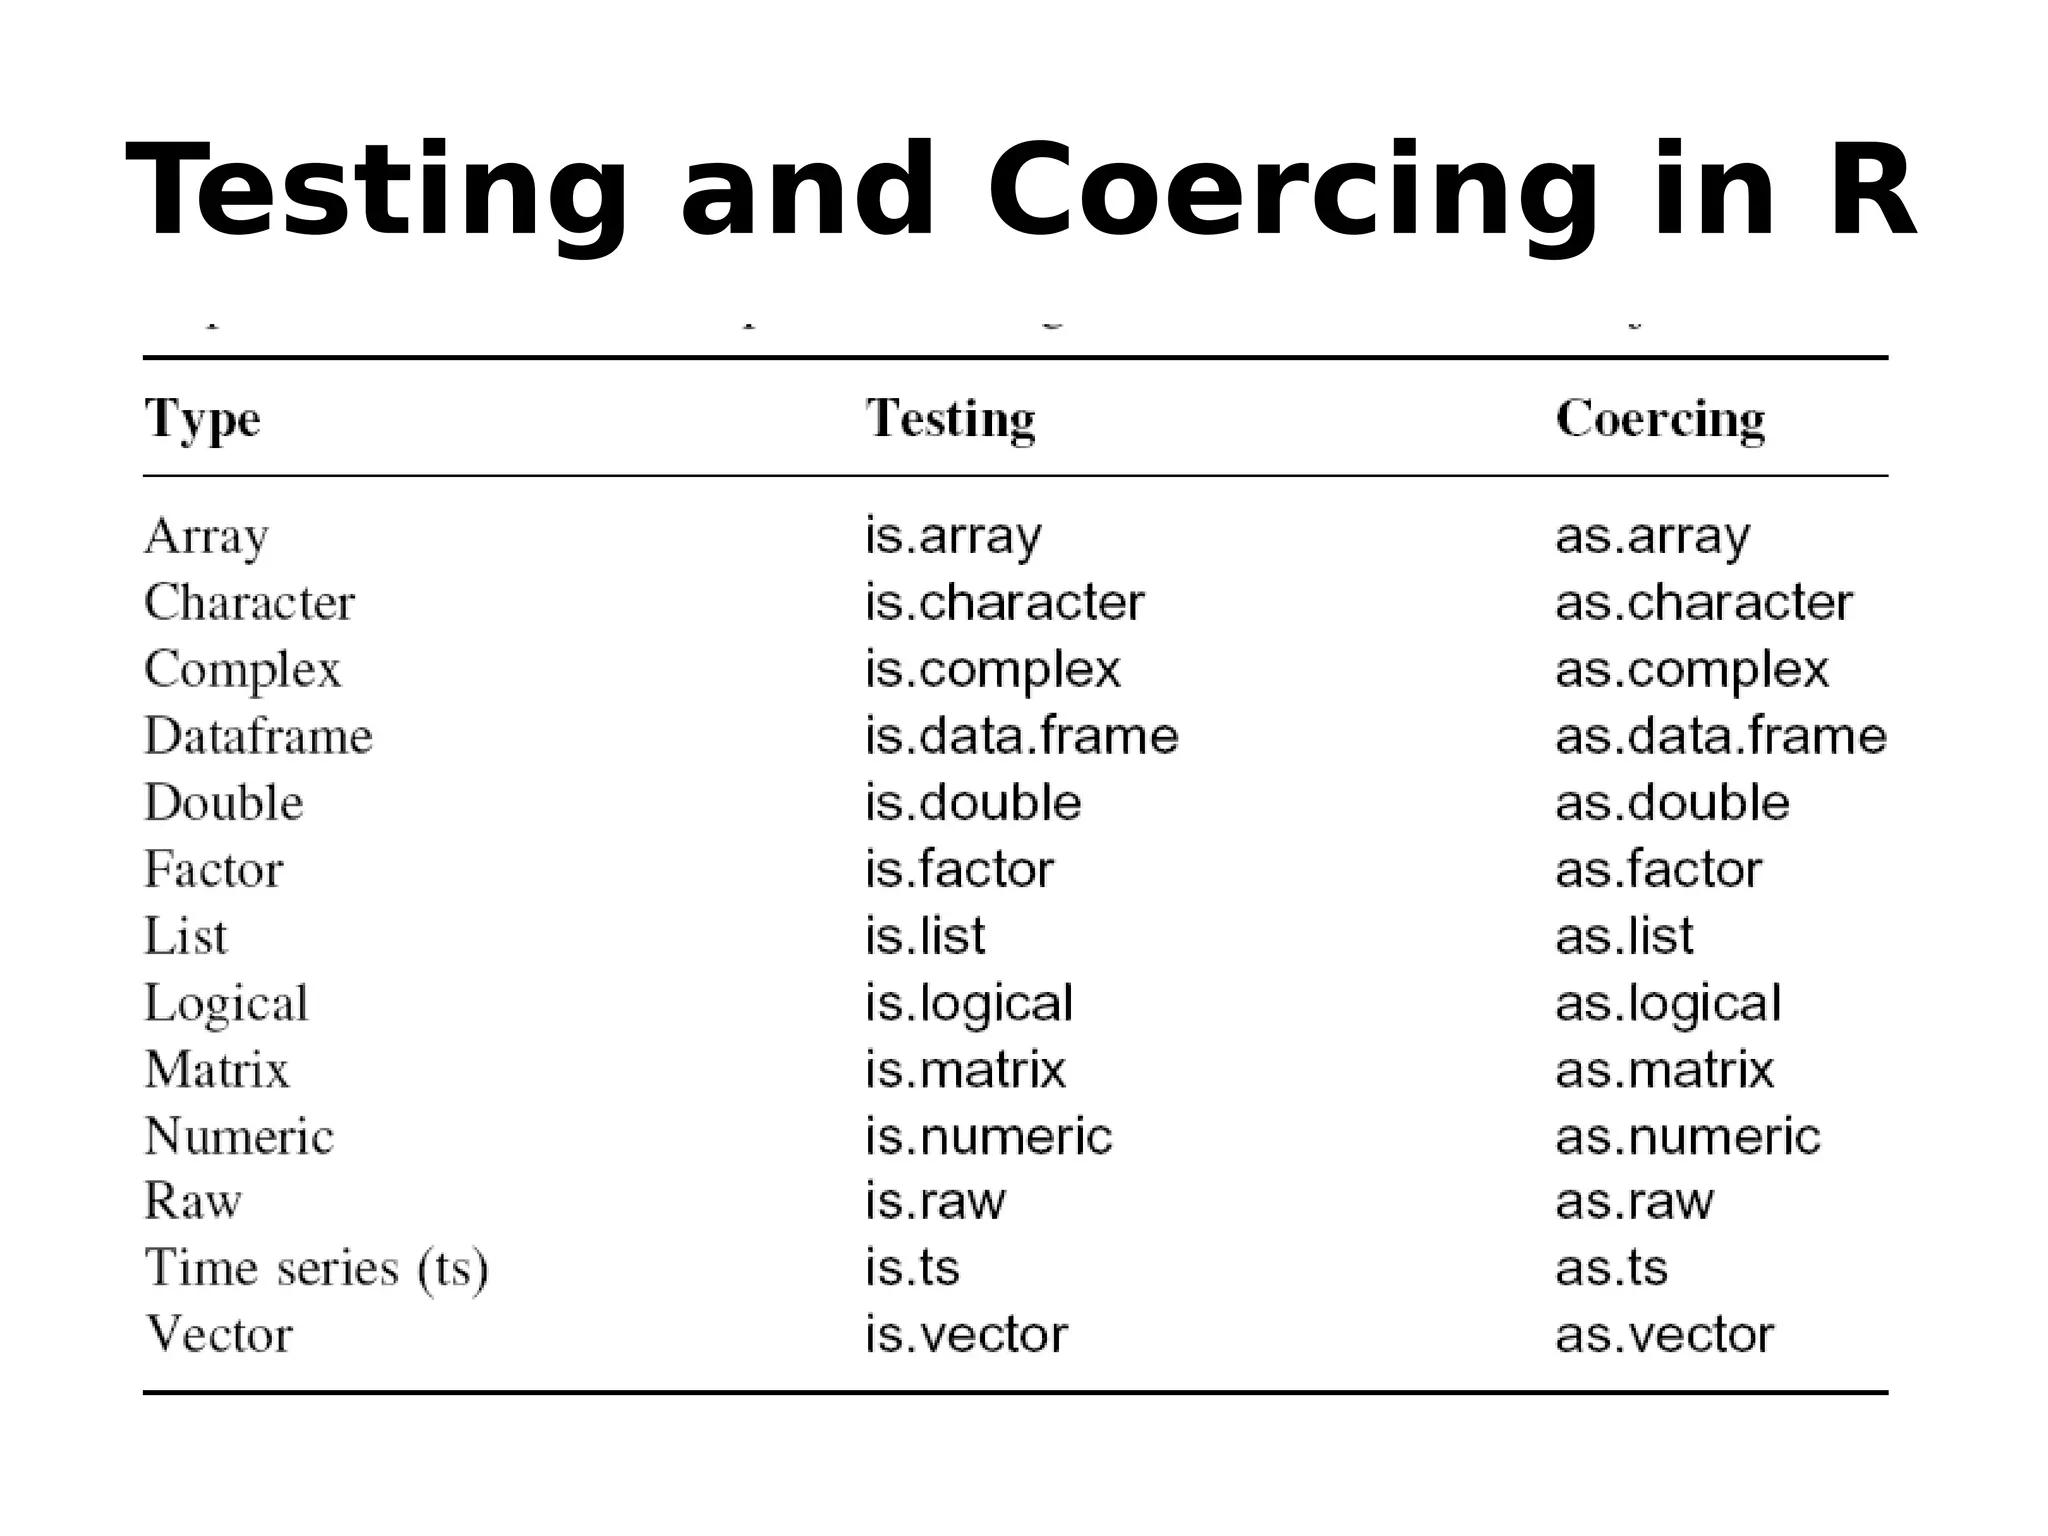
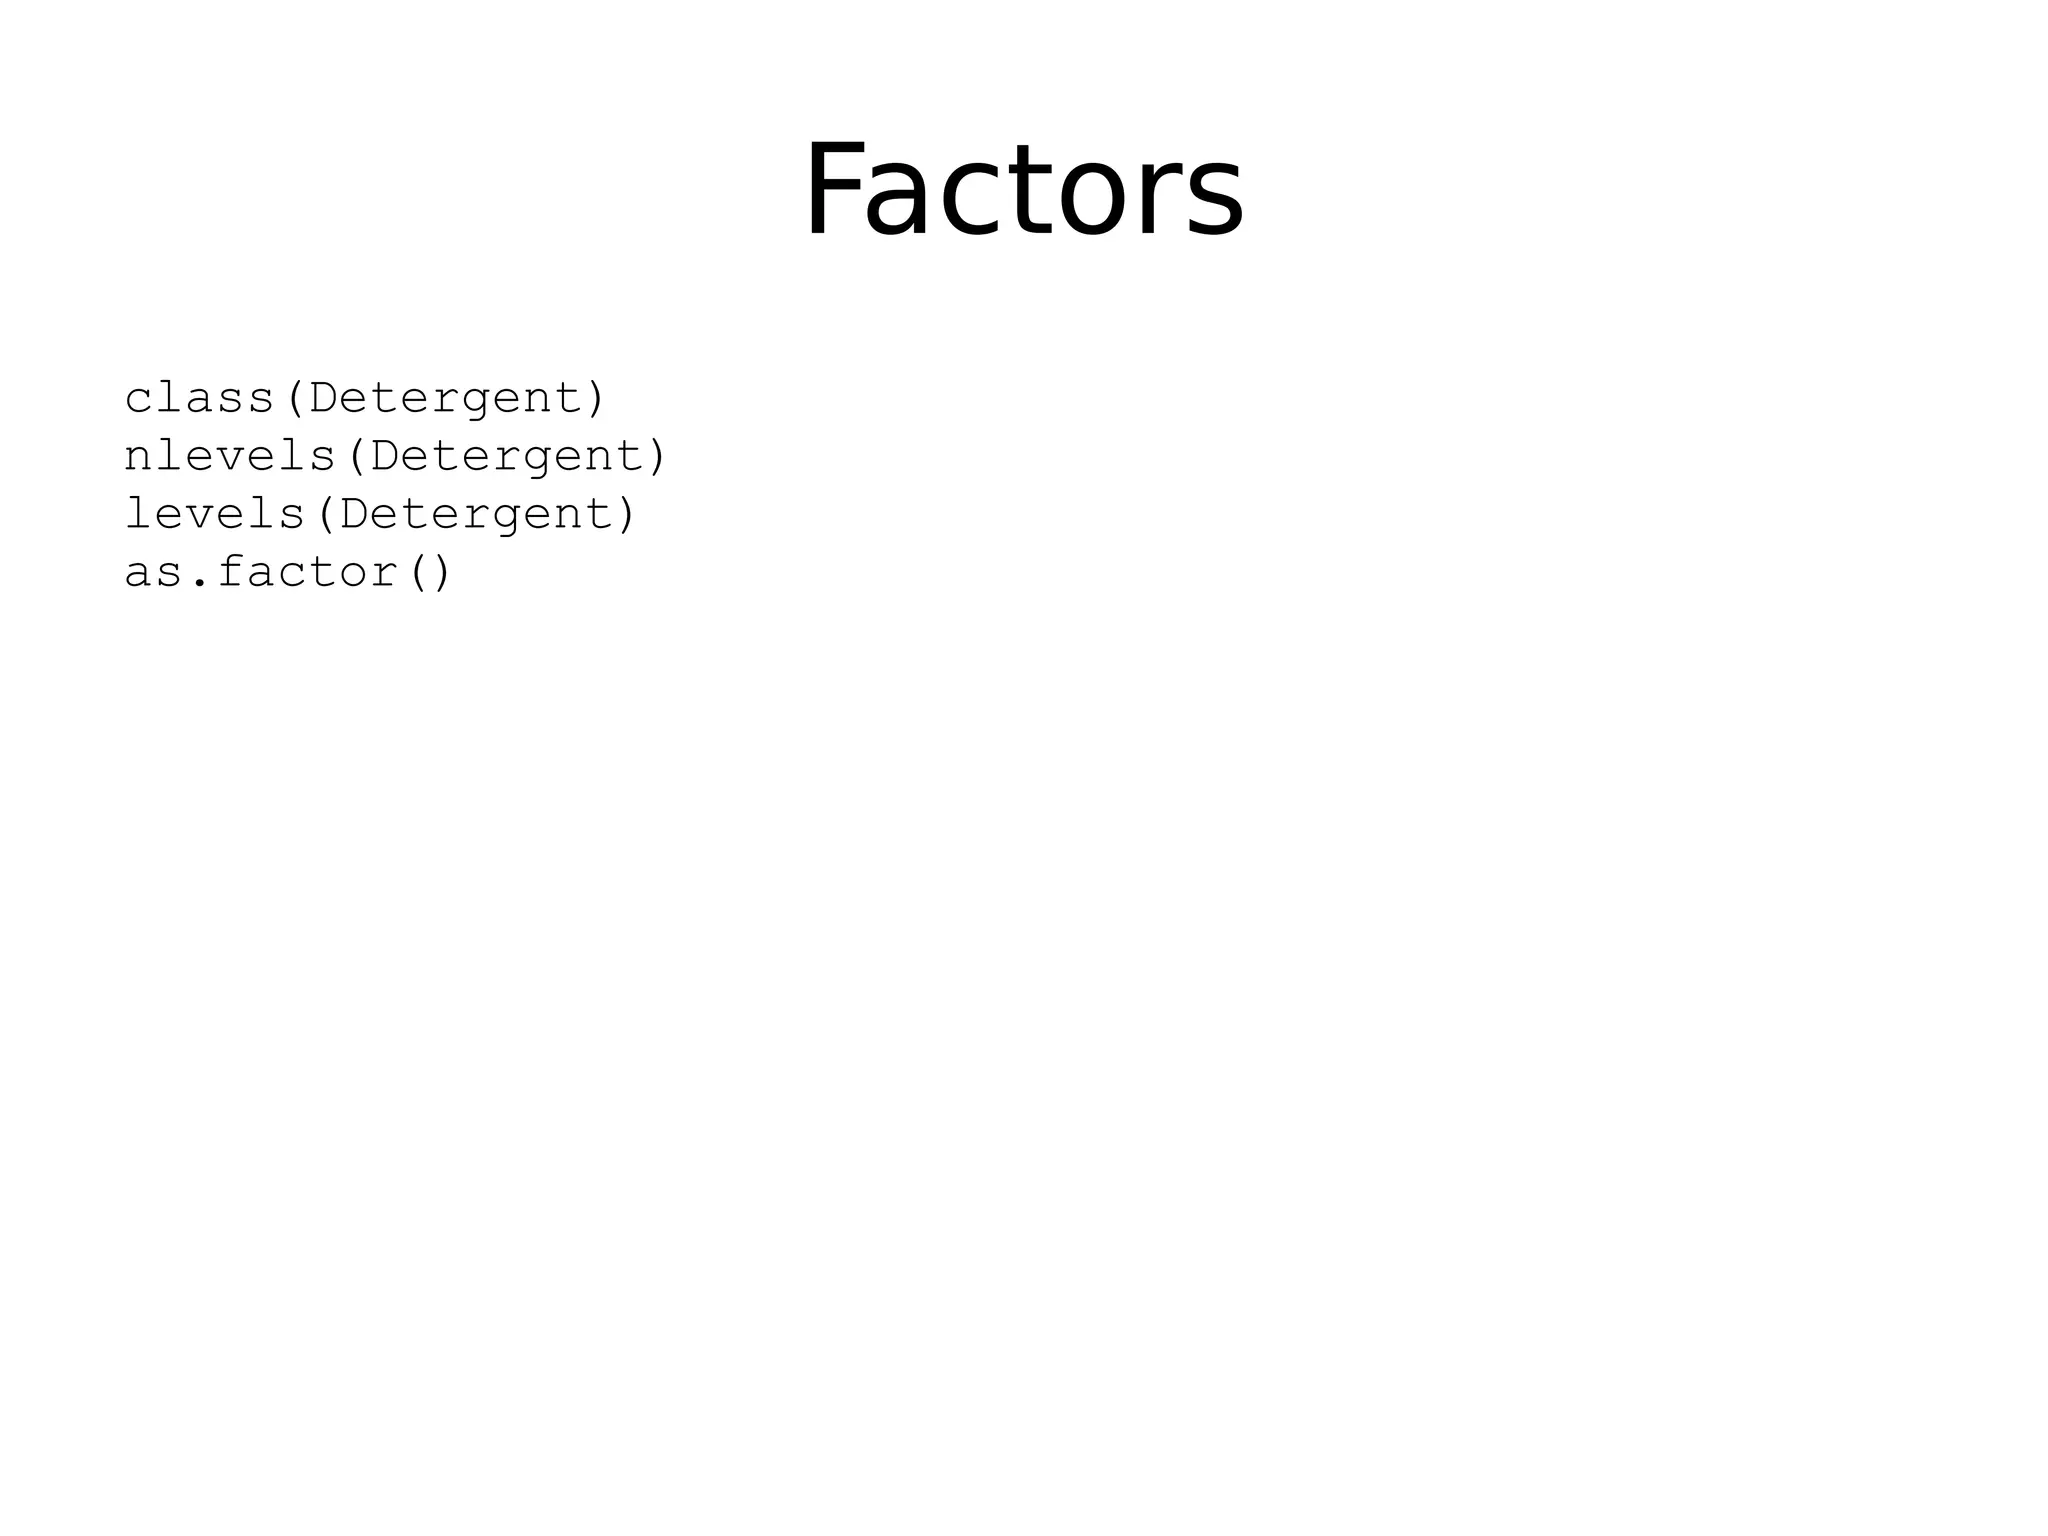
Managing dates in R and coercing data types.
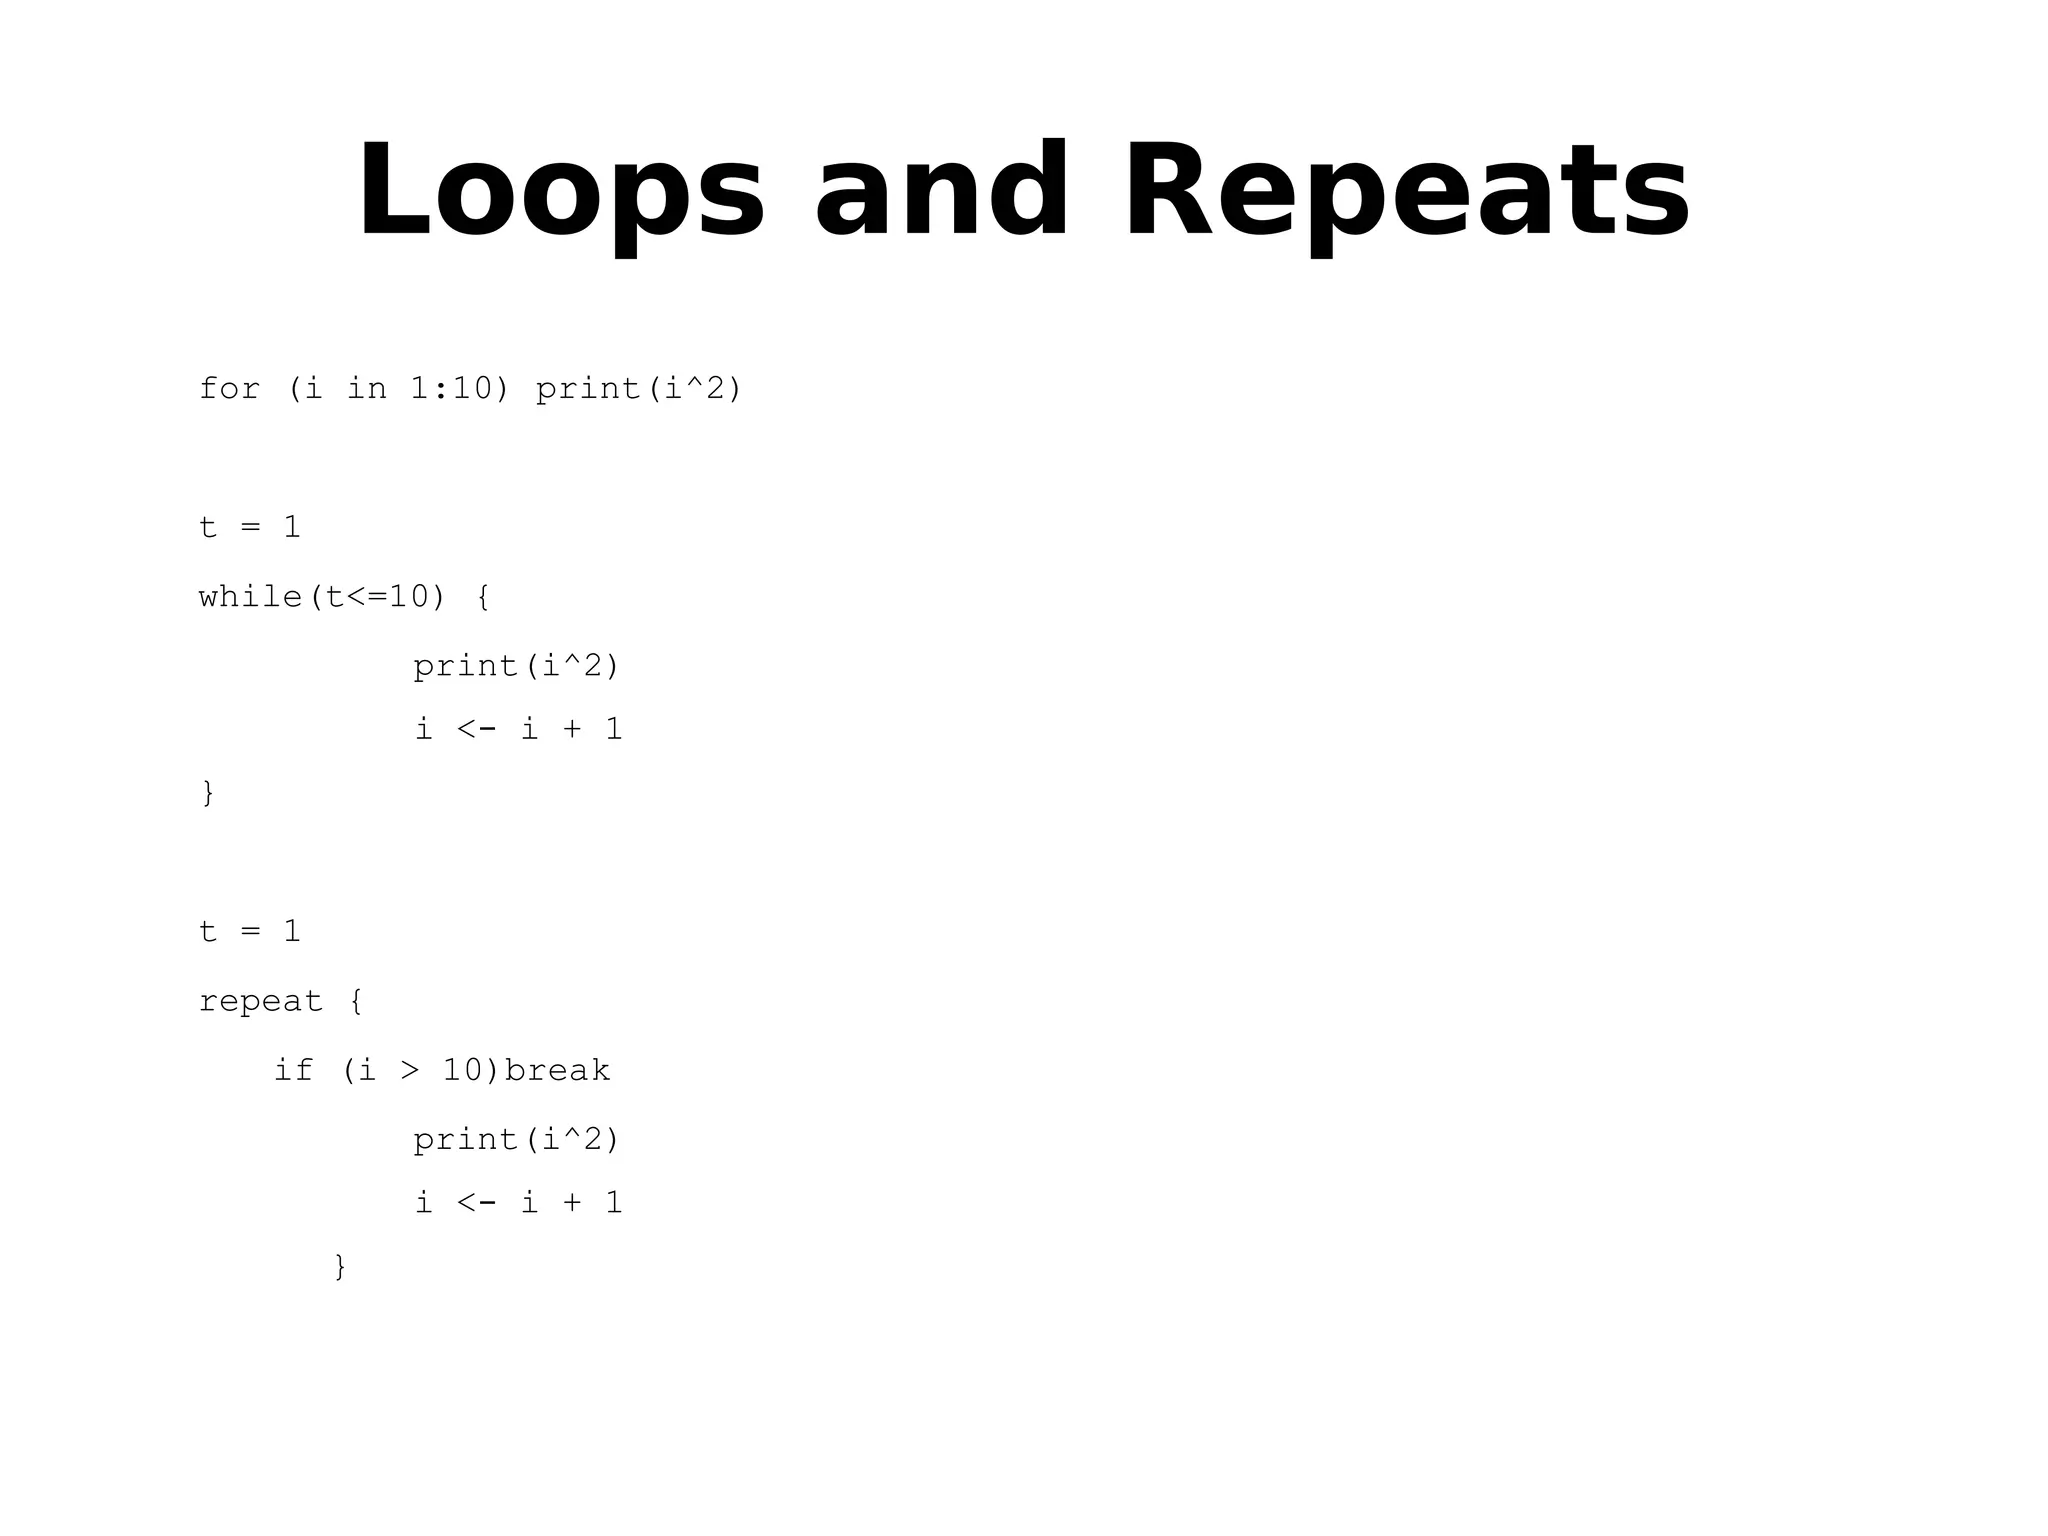
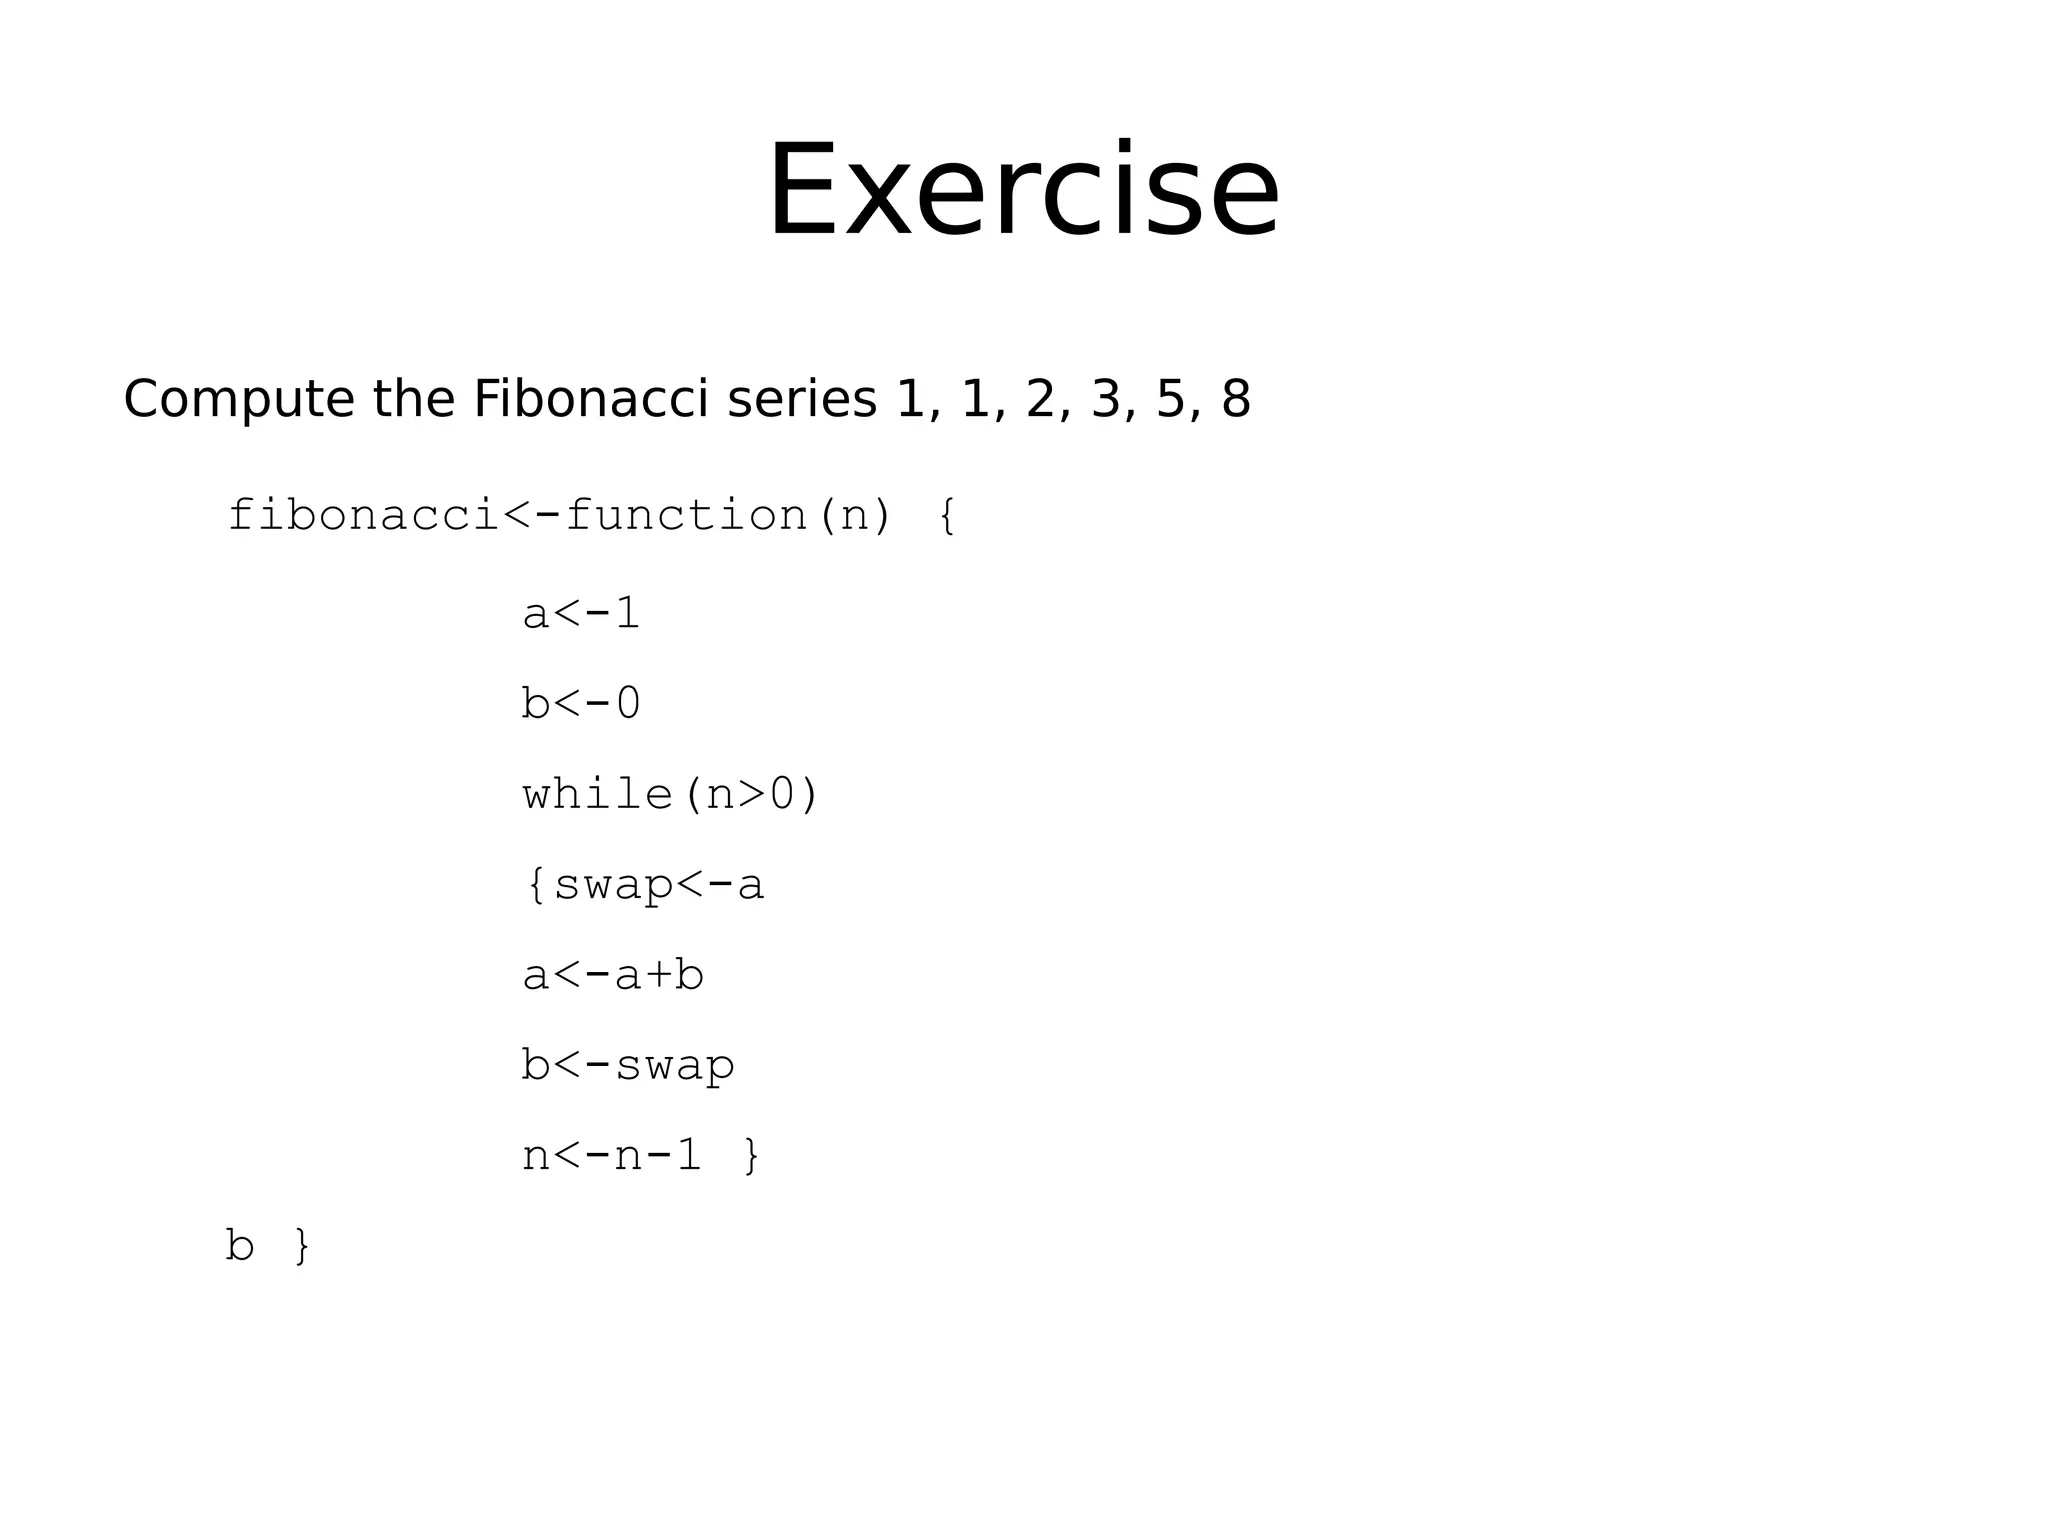
Using if statements and loops for program control in R.
Exercises for coding practices and strategies to avoid loops for efficiency.
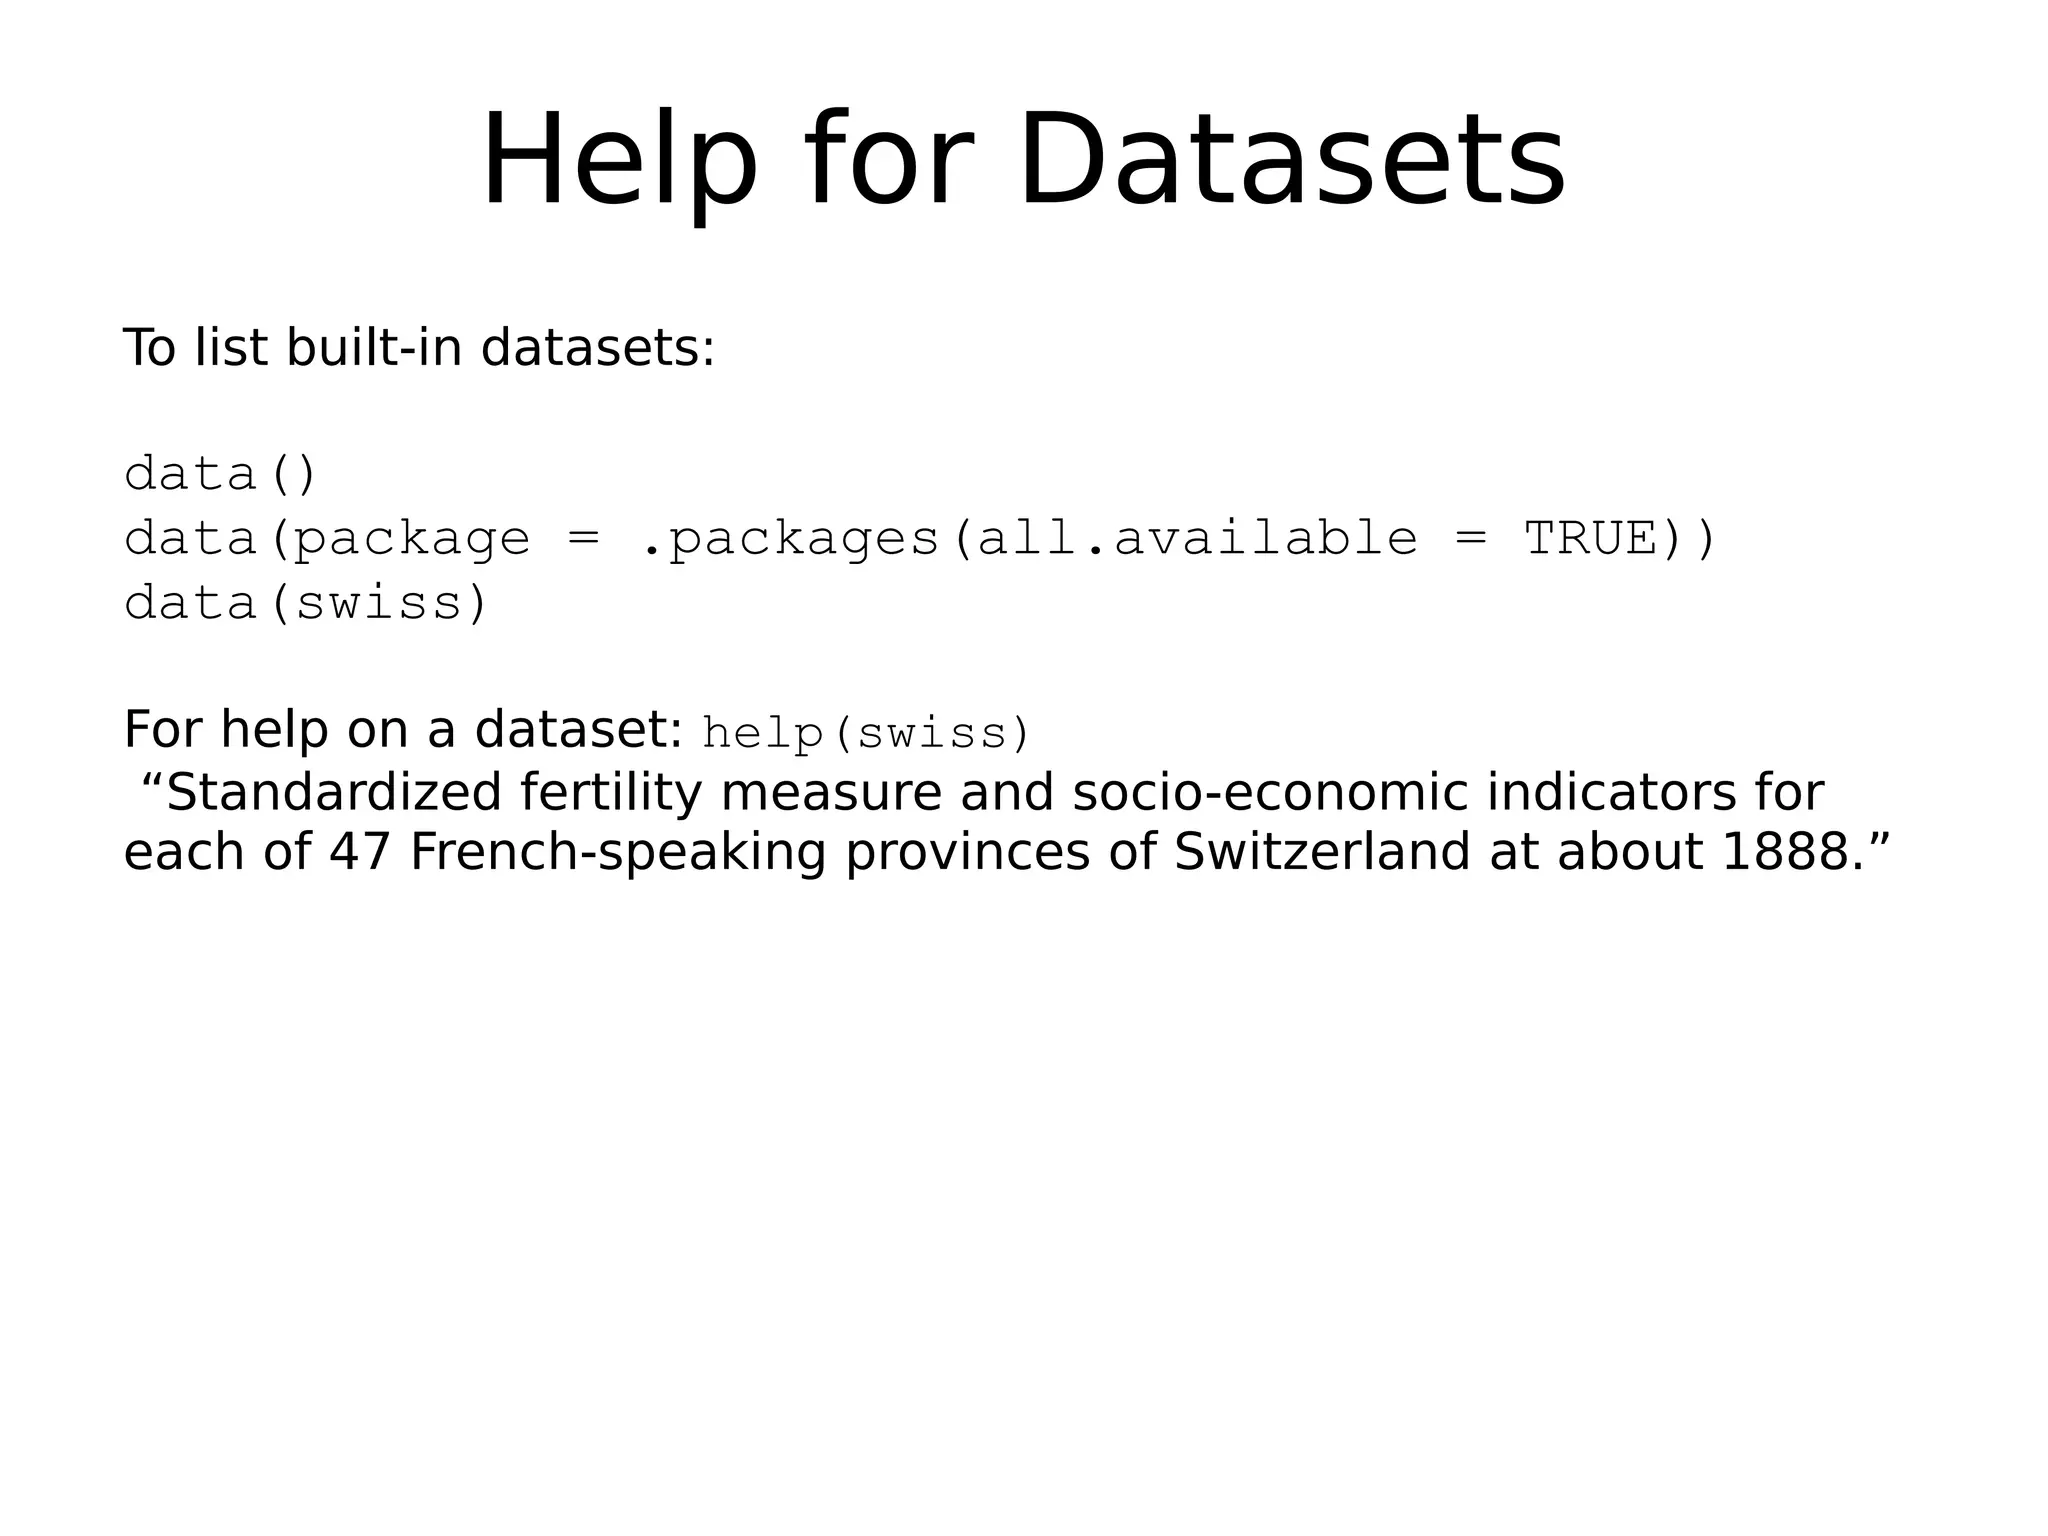
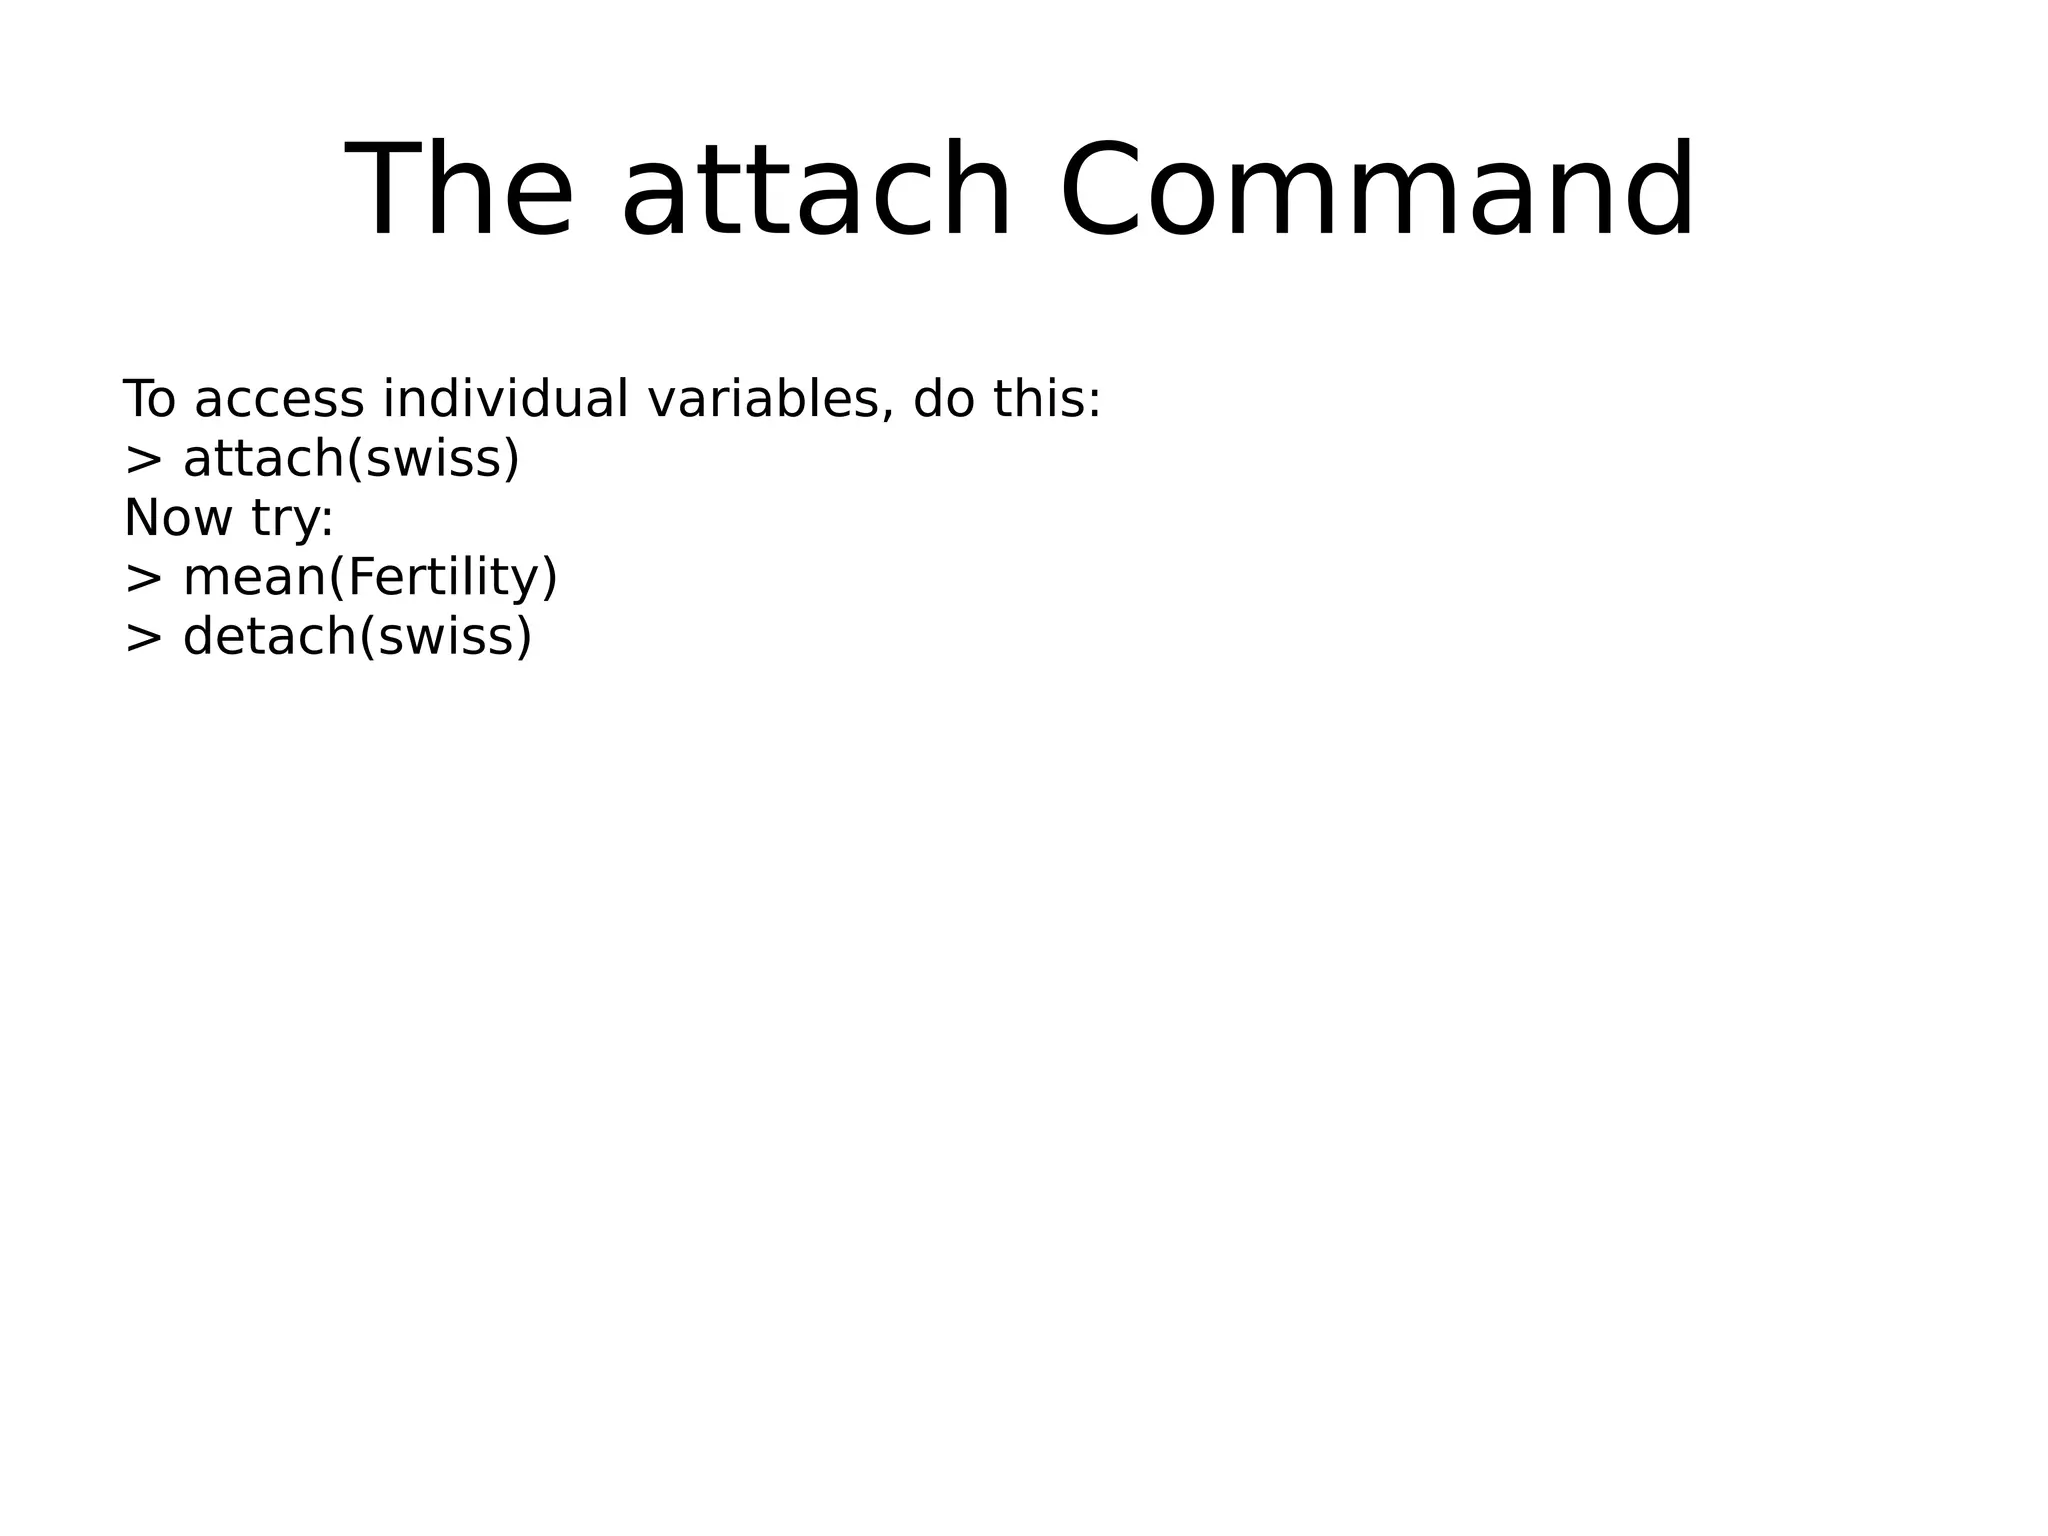
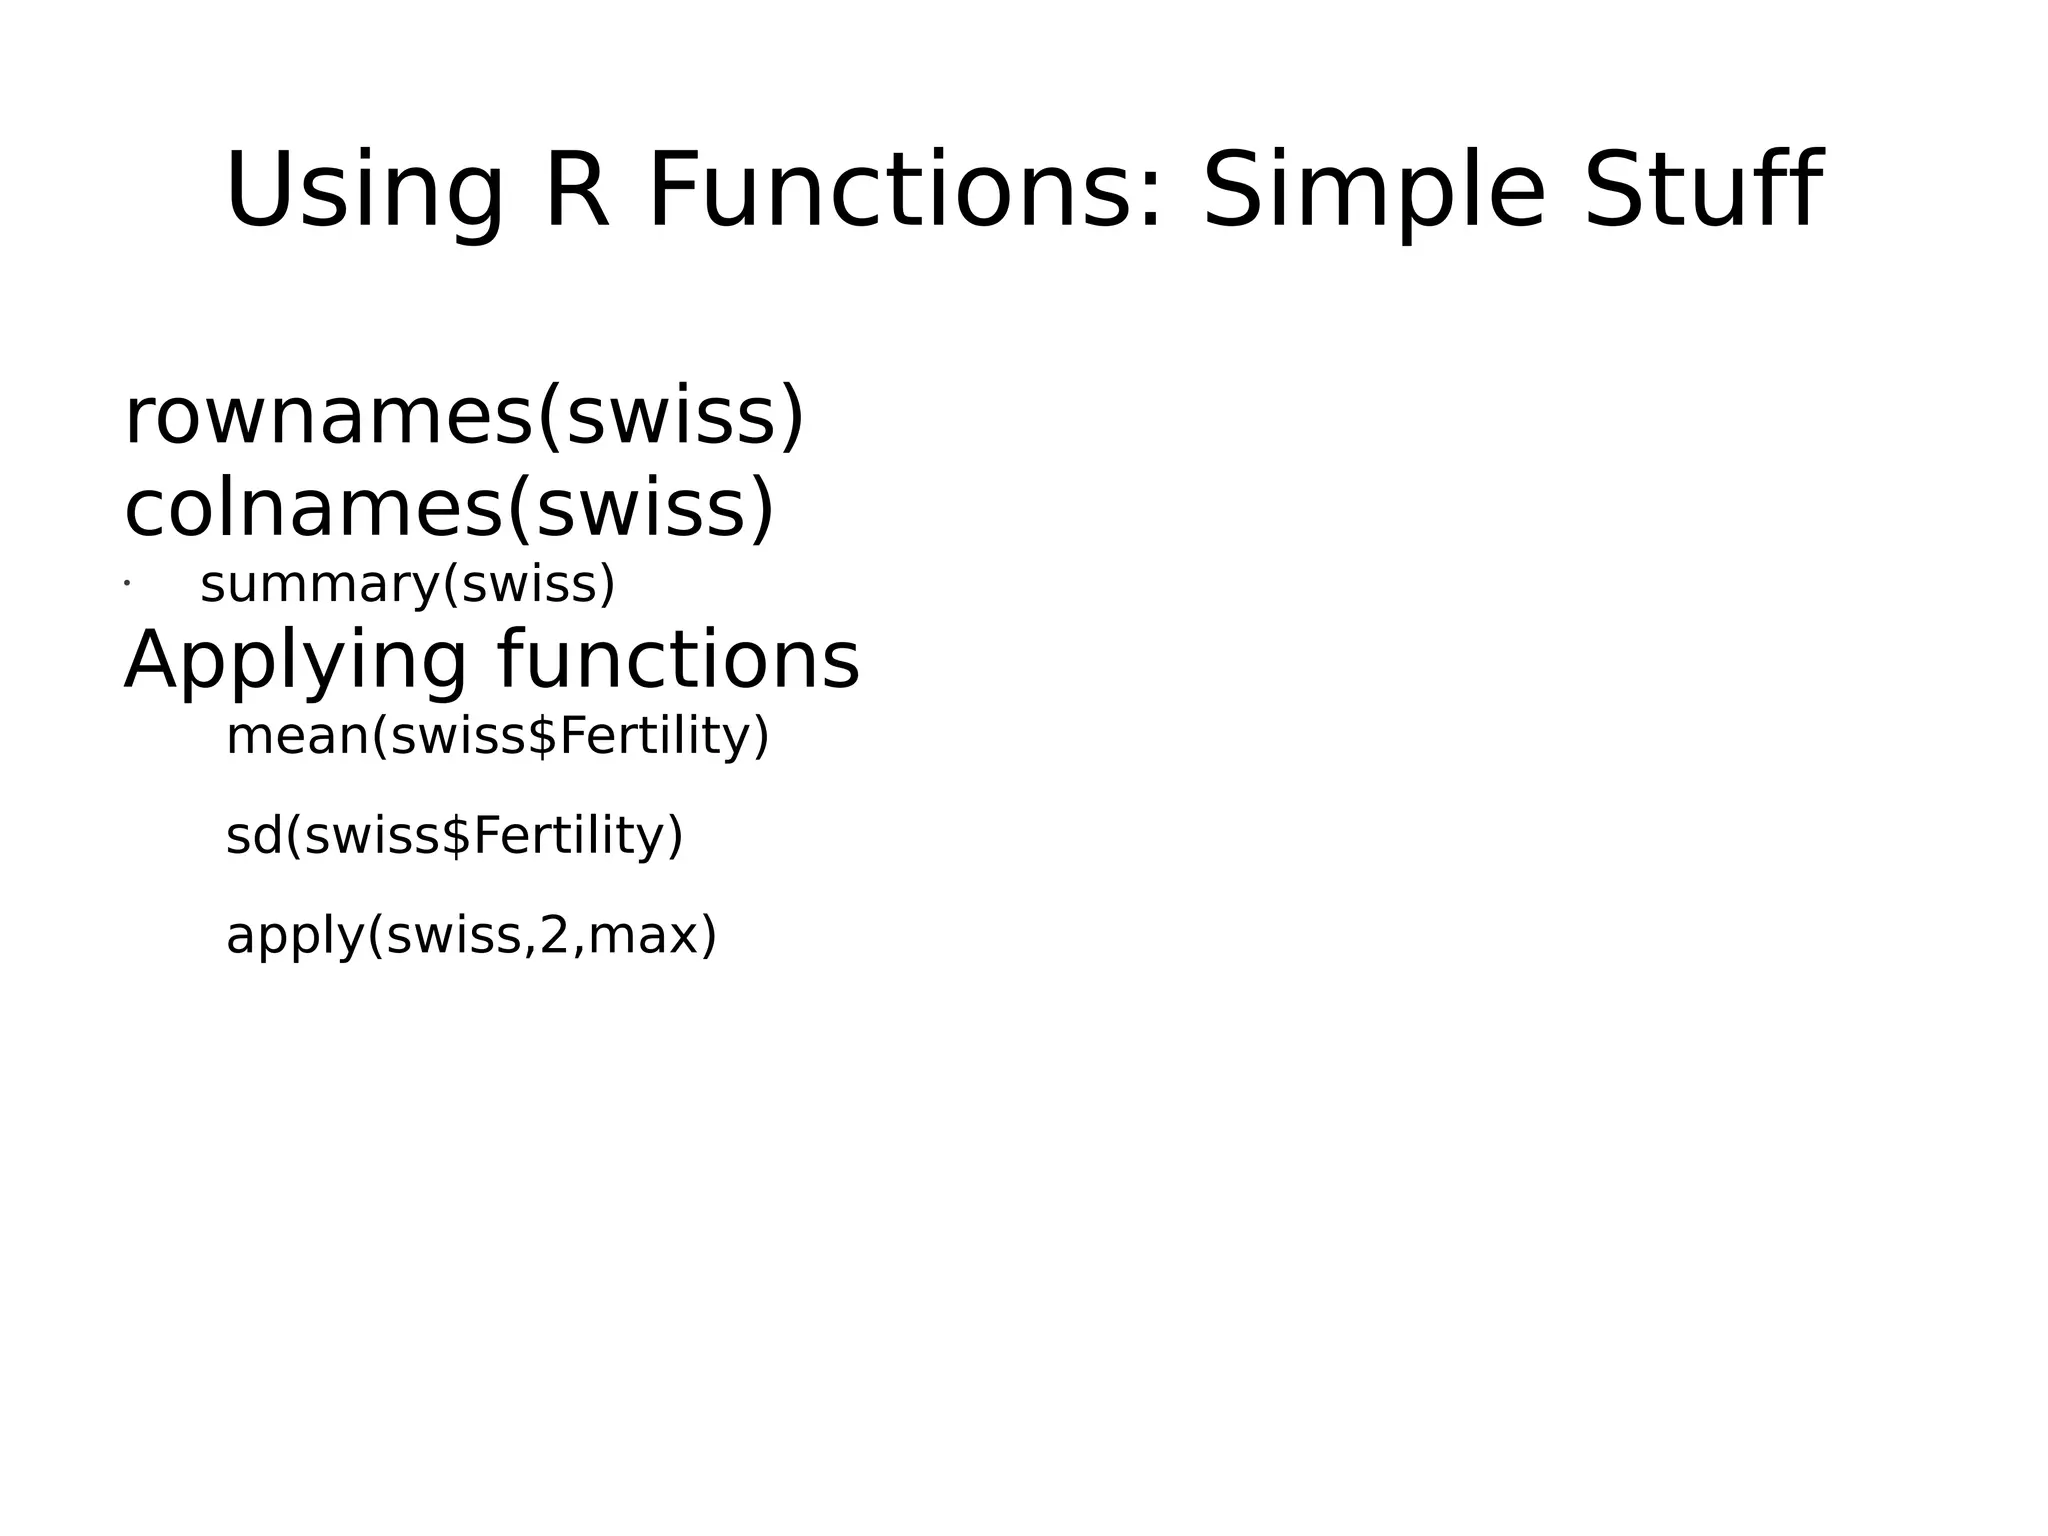
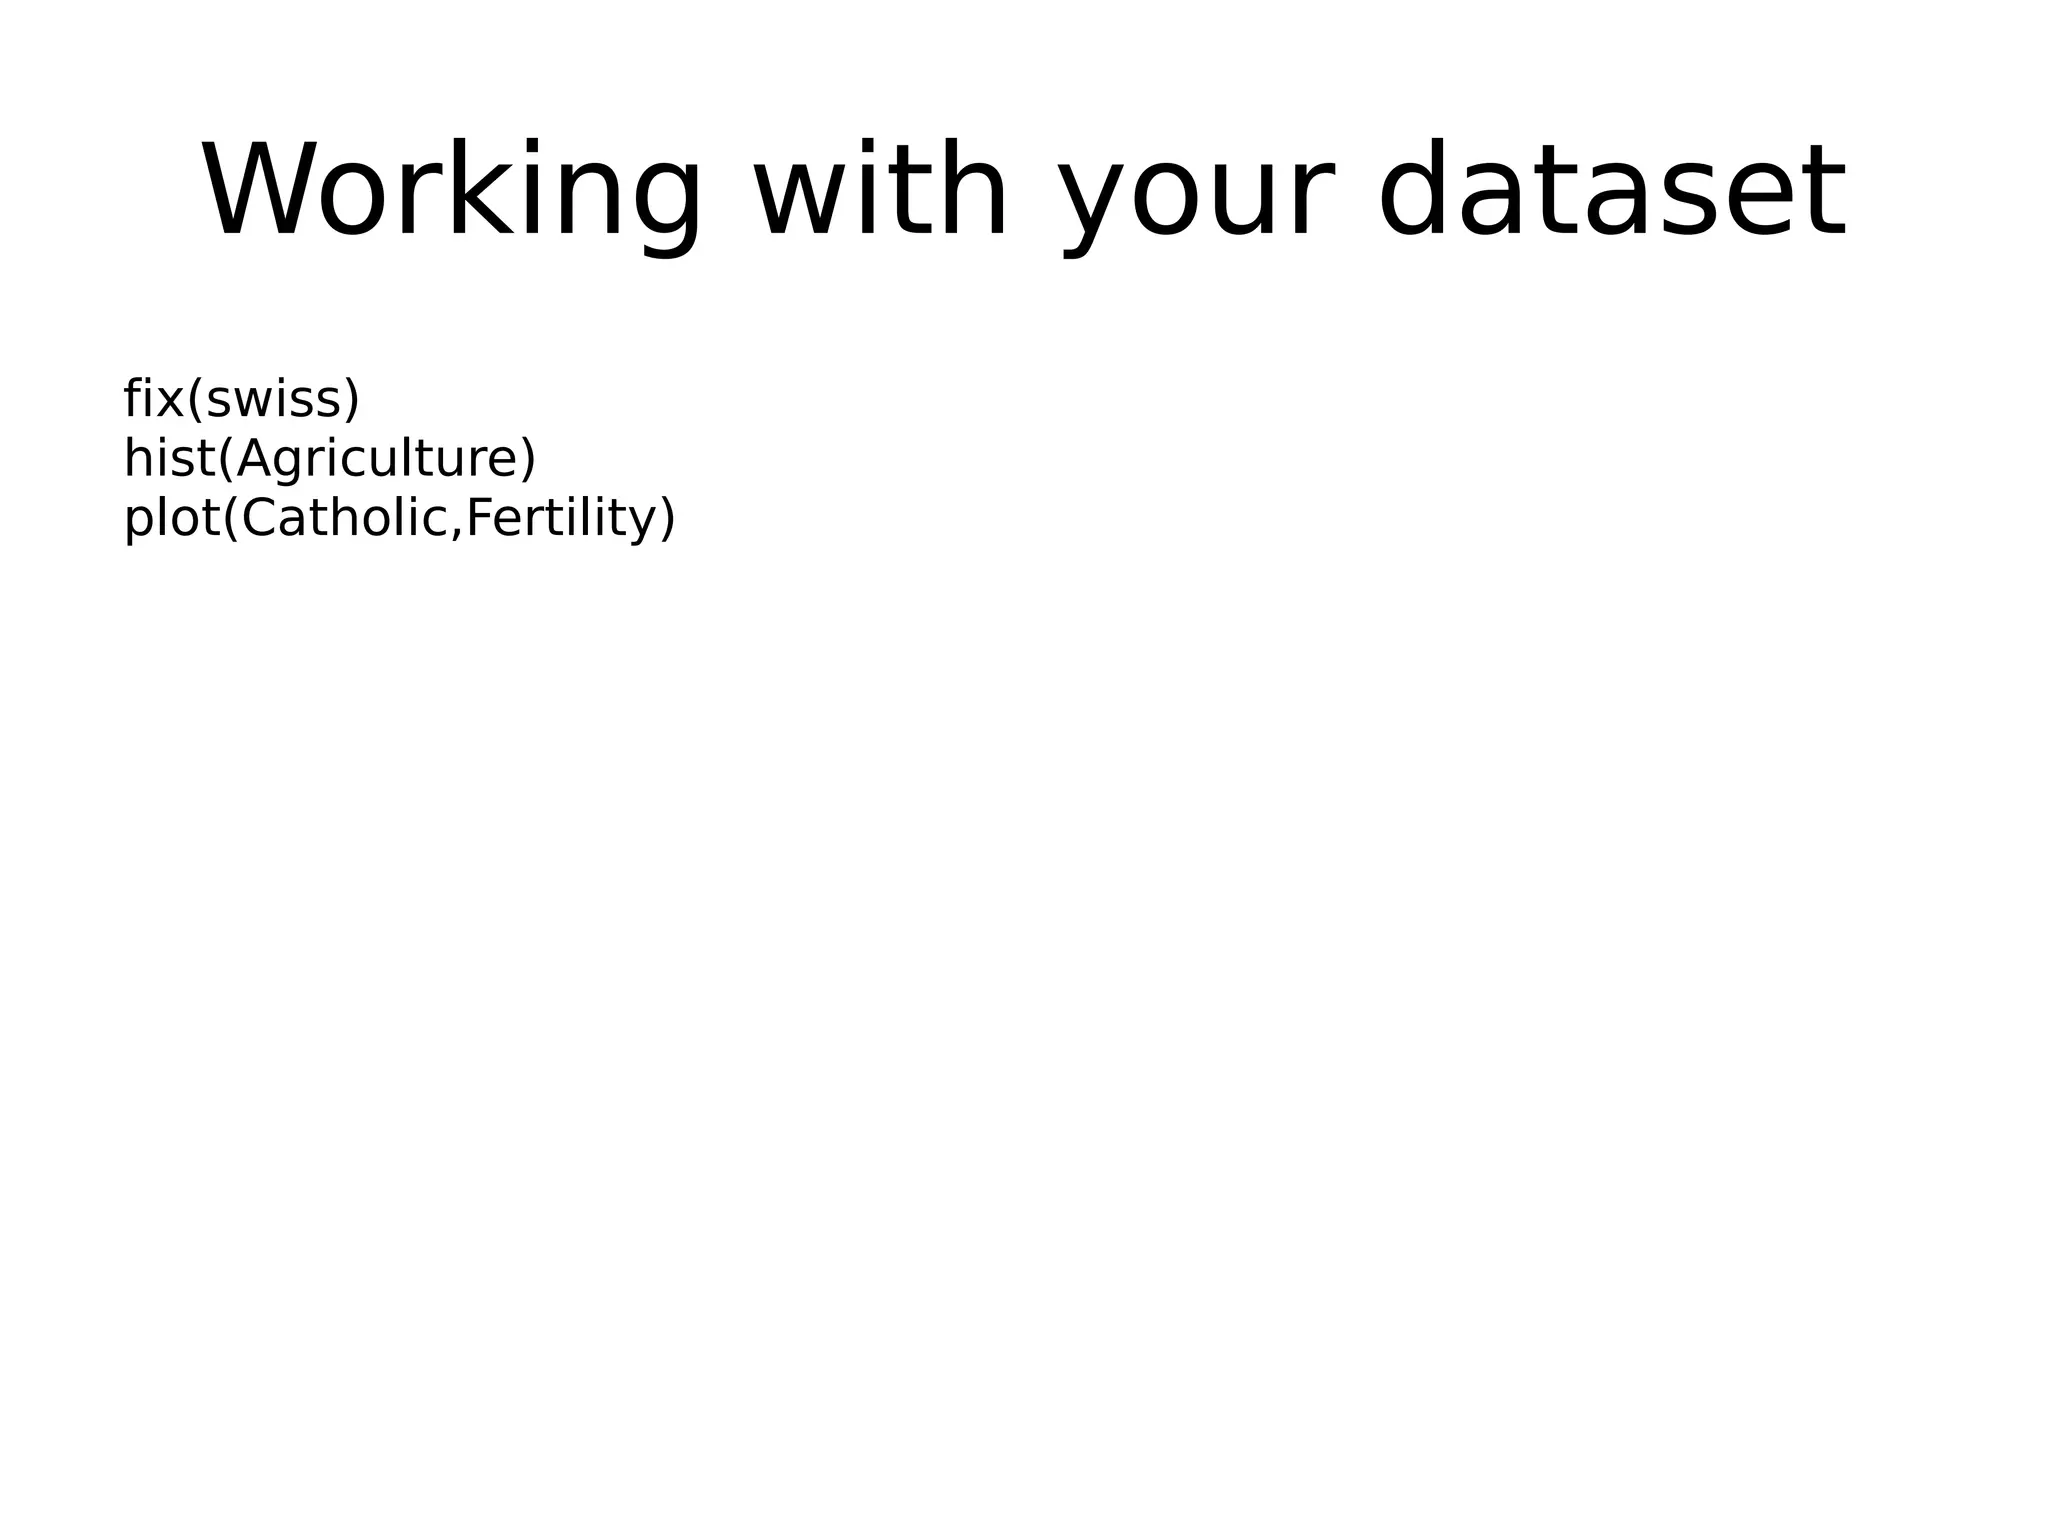
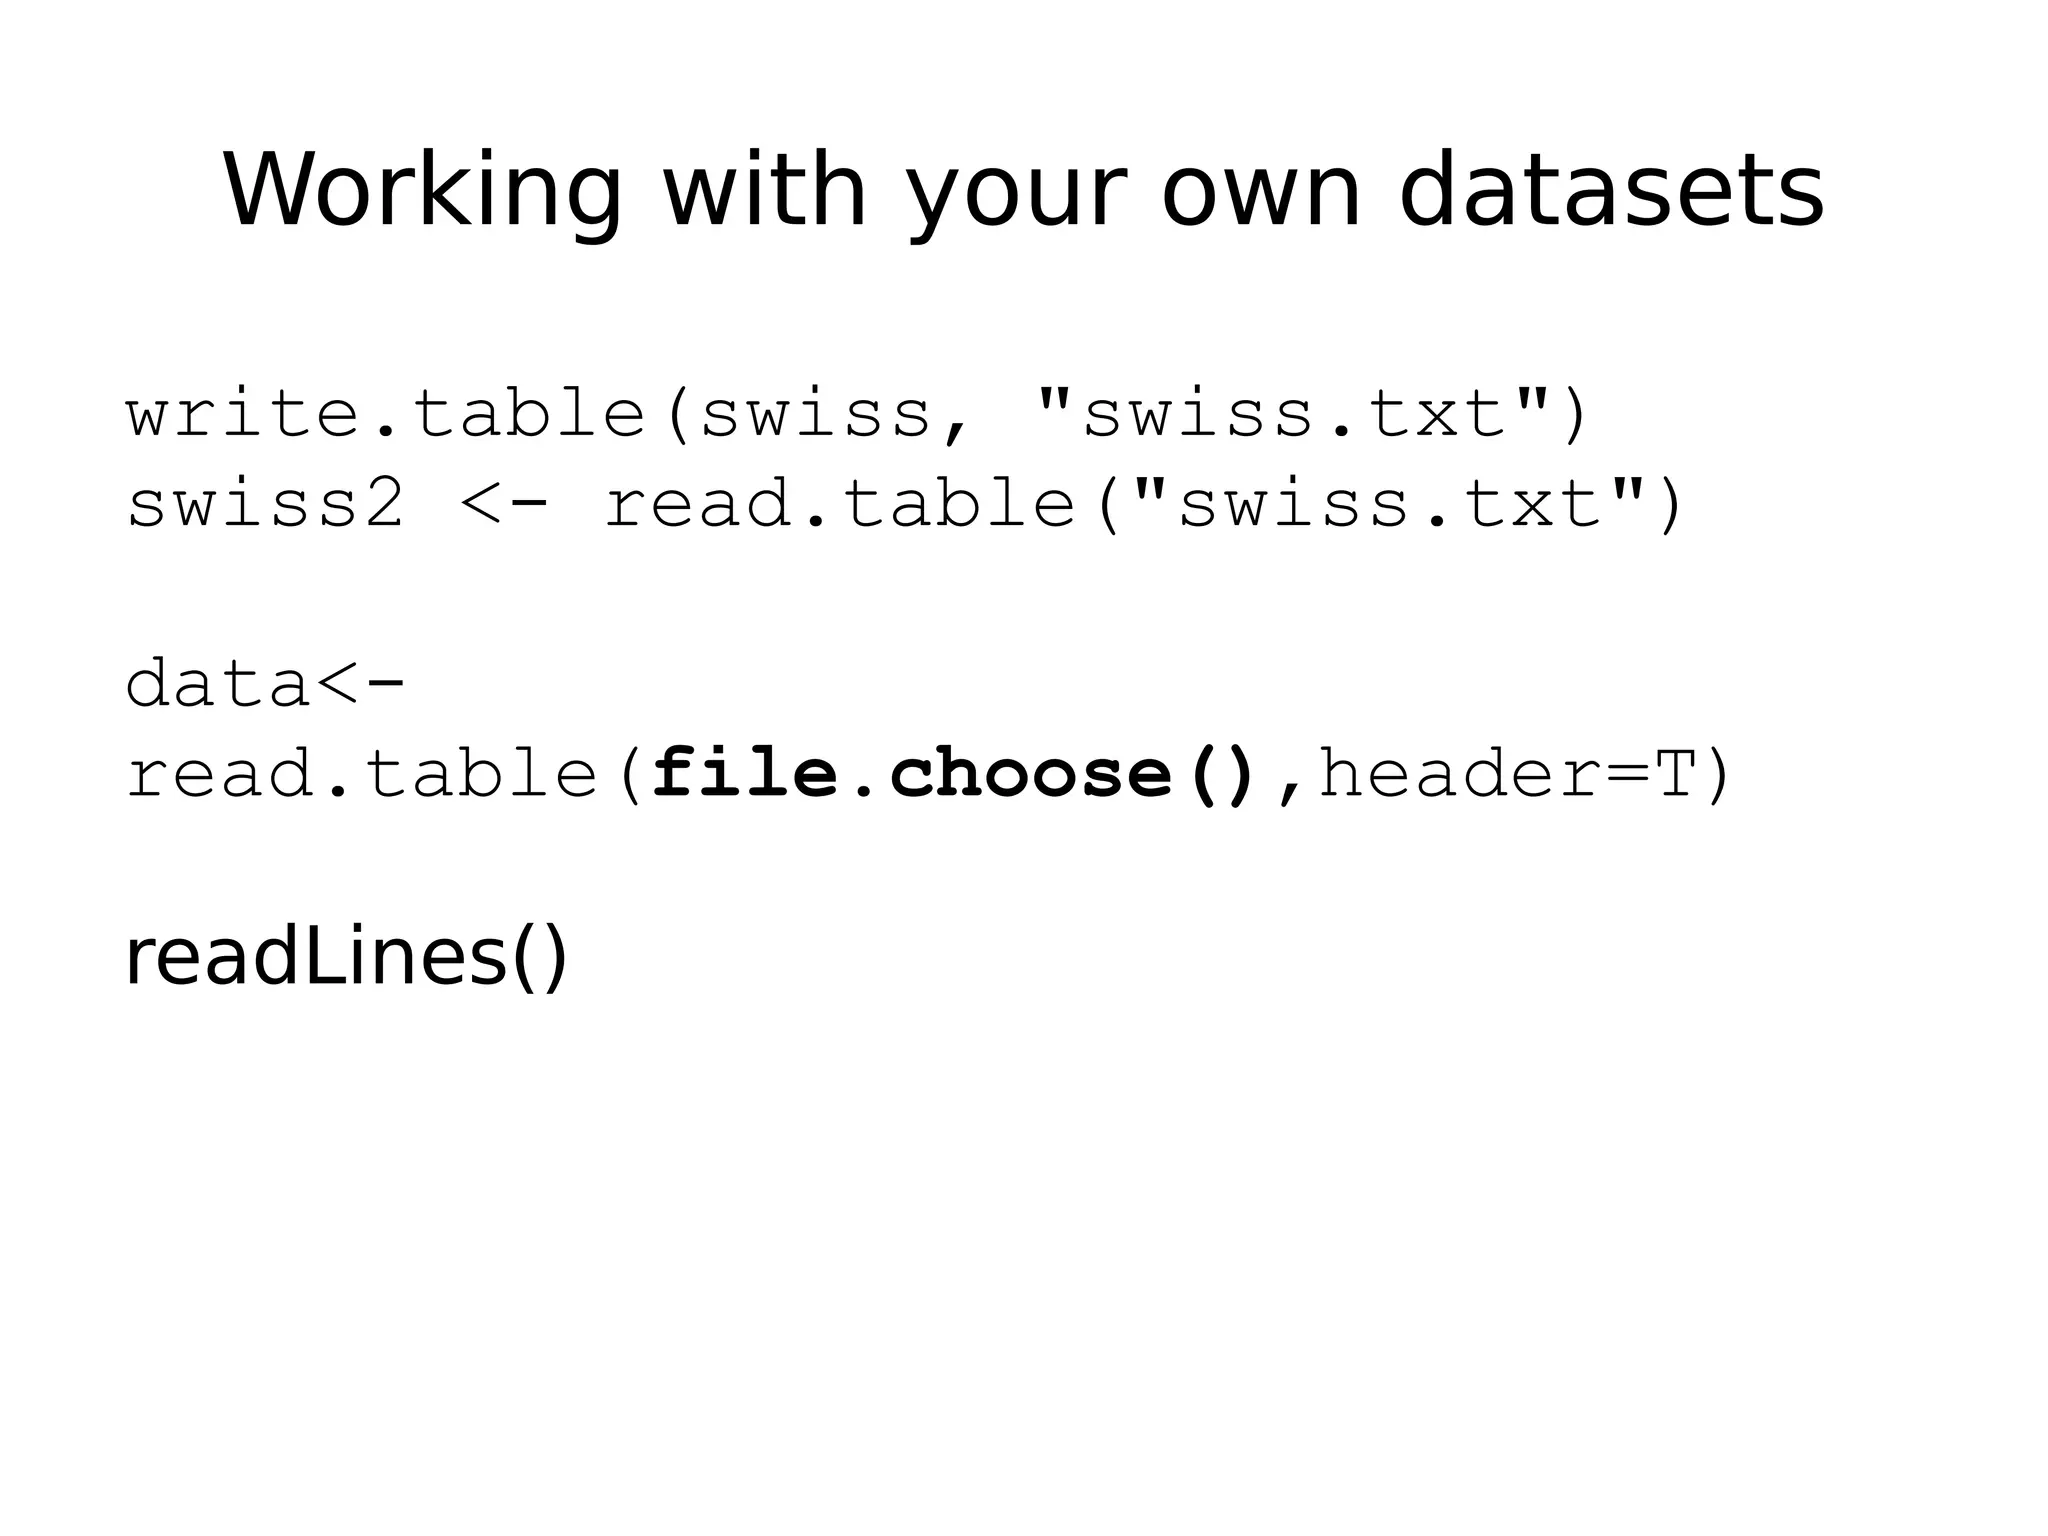
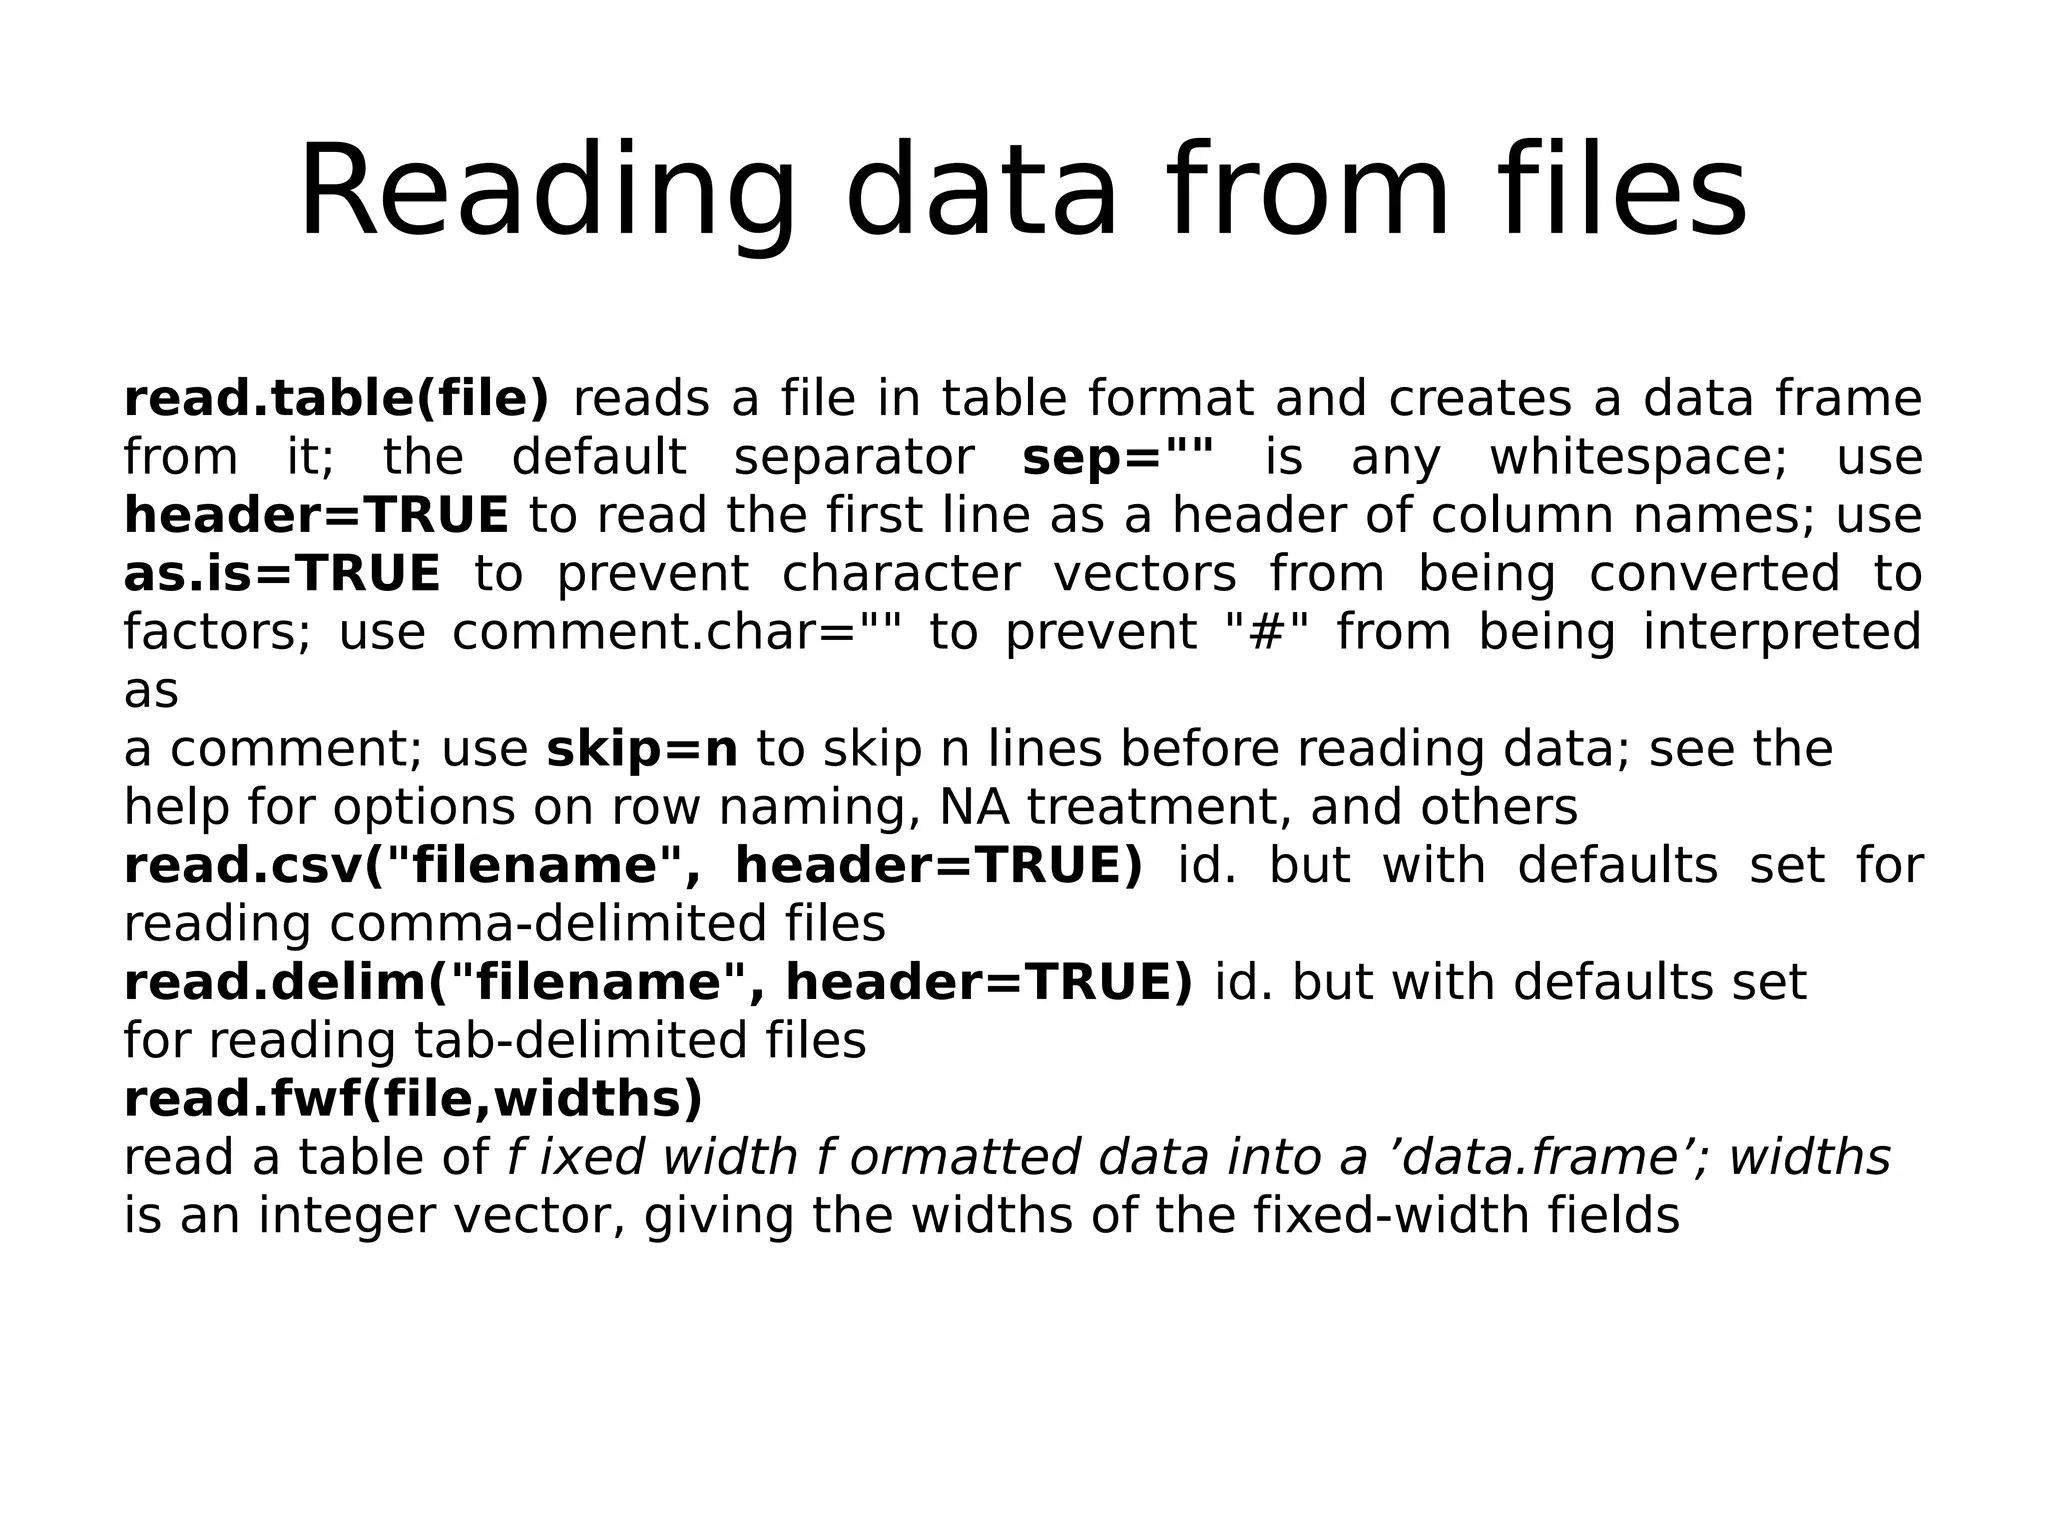
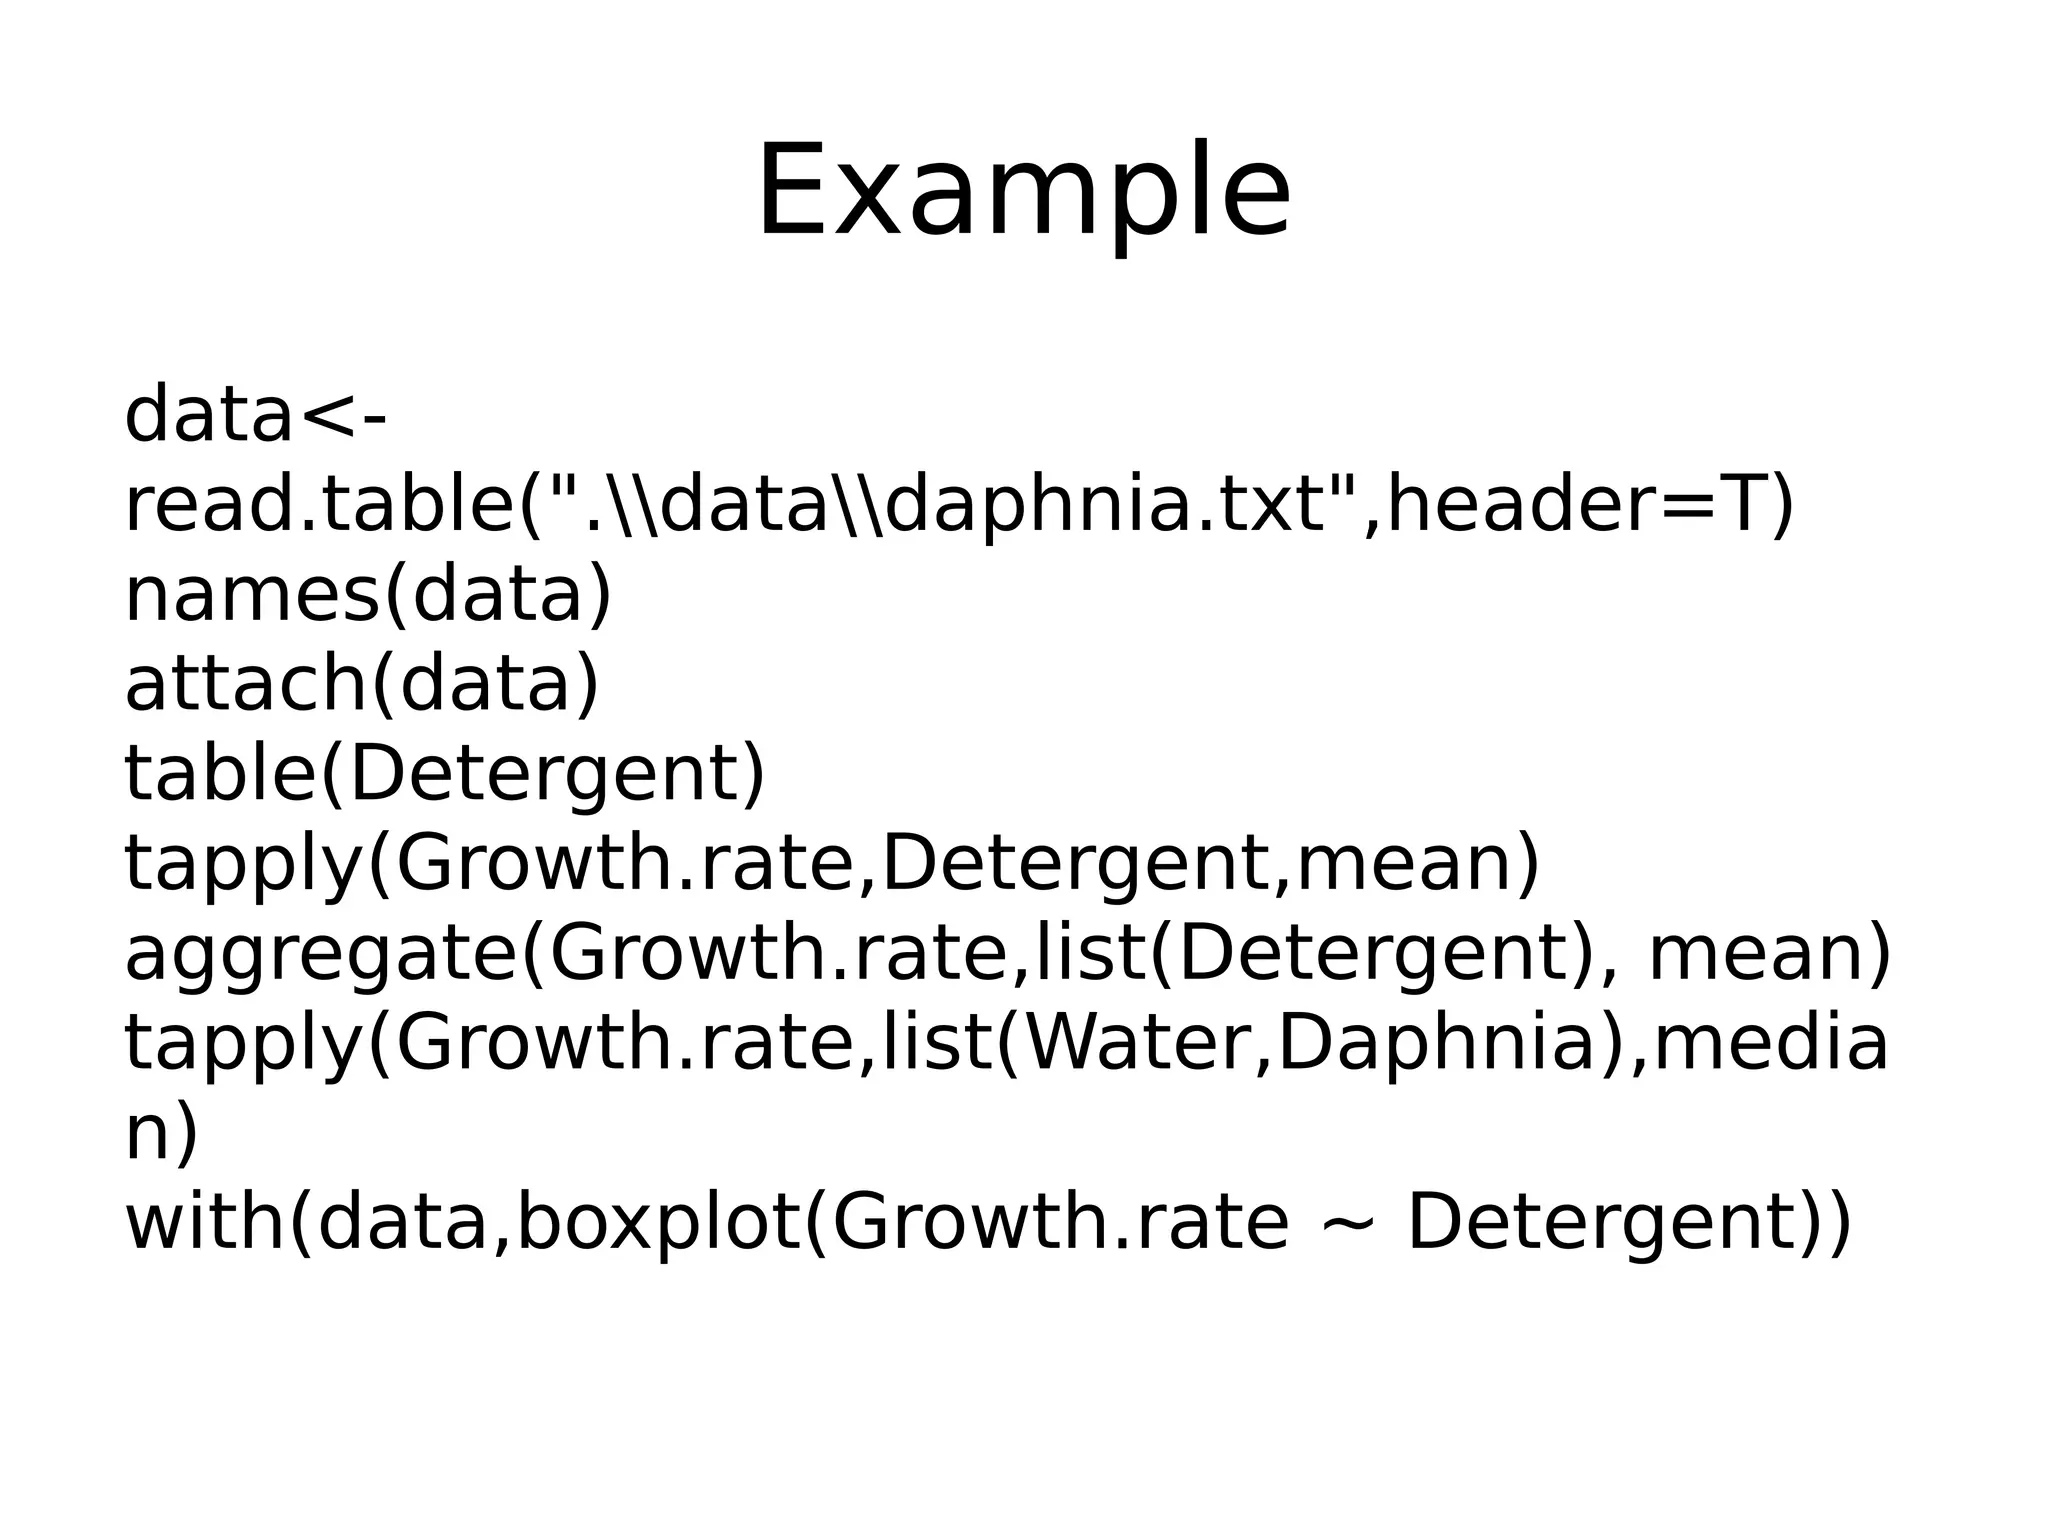
Help for built-in datasets, accessing variables, using R functions, and data import/export.


![[1062BPY12001] Data analysis with R / week 2](https://cdn.slidesharecdn.com/ss_thumbnails/dataanalyzer01-180307063046-thumbnail.jpg?width=640&height=640&fit=bounds)