Downloaded 30 times
![The following BigQuery query (note that the wildcard on "TAX_WEAPONS_SUICIDE_" catches suicide vests, suicide bombers, suicide bombings,
suicide jackets, and so on):
SELECT DATE, DocumentIdentifier, SourceCommonName, V2Themes, V2Locations, V2Tone, SharingImage, TranslationInfo FROM [gdeltv2.gkg] where
(V2Themes like '%TAX_TERROR_GROUP_ISLAMIC_STATE%' or V2Themes like '%TAX_TERROR_GROUP_ISIL%' or V2Themes like
'%TAX_TERROR_GROUP_ISIS%' or V2Themes like '%TAX_TERROR_GROUP_DAASH%') and (V2Themes like '%TERROR%TERROR%' or V2Themes like
'%SUICIDE_ATTACK%' or V2Themes like '%TAX_WEAPONS_SUICIDE_%')
The GDELT Project pushes the boundaries of “big data,” weighing in at over a quarter-billion rows with 59 fields for each record,
spanning the geography of the entire planet, and covering a time horizon of more than 35 years. The GDELT Project is the largest
open-access database on human society in existence. Its archives contain nearly 400M latitude/longitude geographic coordinates
spanning over 12,900 days, making it one of the largest open-access spatio-temporal datasets as well.
GDELT + BigQuery = Query The Planet](https://image.slidesharecdn.com/dsi-170205085905/75/Data-Science-Innovations-Democratisation-of-Data-and-Data-Science-11-2048.jpg)
![“With the addition of NLG [Natural Language
Generation], smart data discovery platforms
automatically present a written or spoken context-based
narrative of findings in the data that, alongside the
visualization, inform the user about what is most
important for them to act on in the data.”
Gartner, 29 June, 2015
Smart Data Discovery
Will Enable
New Class of Citizen Data Scientist](https://image.slidesharecdn.com/dsi-170205085905/75/Data-Science-Innovations-Democratisation-of-Data-and-Data-Science-25-2048.jpg)


![The following BigQuery query (note that the wildcard on "TAX_WEAPONS_SUICIDE_" catches suicide vests, suicide bombers, suicide bombings,
suicide jackets, and so on):
SELECT DATE, DocumentIdentifier, SourceCommonName, V2Themes, V2Locations, V2Tone, SharingImage, TranslationInfo FROM [gdeltv2.gkg] where
(V2Themes like '%TAX_TERROR_GROUP_ISLAMIC_STATE%' or V2Themes like '%TAX_TERROR_GROUP_ISIL%' or V2Themes like
'%TAX_TERROR_GROUP_ISIS%' or V2Themes like '%TAX_TERROR_GROUP_DAASH%') and (V2Themes like '%TERROR%TERROR%' or V2Themes like
'%SUICIDE_ATTACK%' or V2Themes like '%TAX_WEAPONS_SUICIDE_%')
The GDELT Project pushes the boundaries of “big data,” weighing in at over a quarter-billion rows with 59 fields for each record,
spanning the geography of the entire planet, and covering a time horizon of more than 35 years. The GDELT Project is the largest
open-access database on human society in existence. Its archives contain nearly 400M latitude/longitude geographic coordinates
spanning over 12,900 days, making it one of the largest open-access spatio-temporal datasets as well.
GDELT + BigQuery = Query The Planet](https://crownmelresort.com/image.slidesharecdn.com/dsi-170205085905/75/Data-Science-Innovations-Democratisation-of-Data-and-Data-Science-11-2048.jpg)


![“With the addition of NLG [Natural Language
Generation], smart data discovery platforms
automatically present a written or spoken context-based
narrative of findings in the data that, alongside the
visualization, inform the user about what is most
important for them to act on in the data.”
Gartner, 29 June, 2015
Smart Data Discovery
Will Enable
New Class of Citizen Data Scientist](https://crownmelresort.com/image.slidesharecdn.com/dsi-170205085905/75/Data-Science-Innovations-Democratisation-of-Data-and-Data-Science-25-2048.jpg)


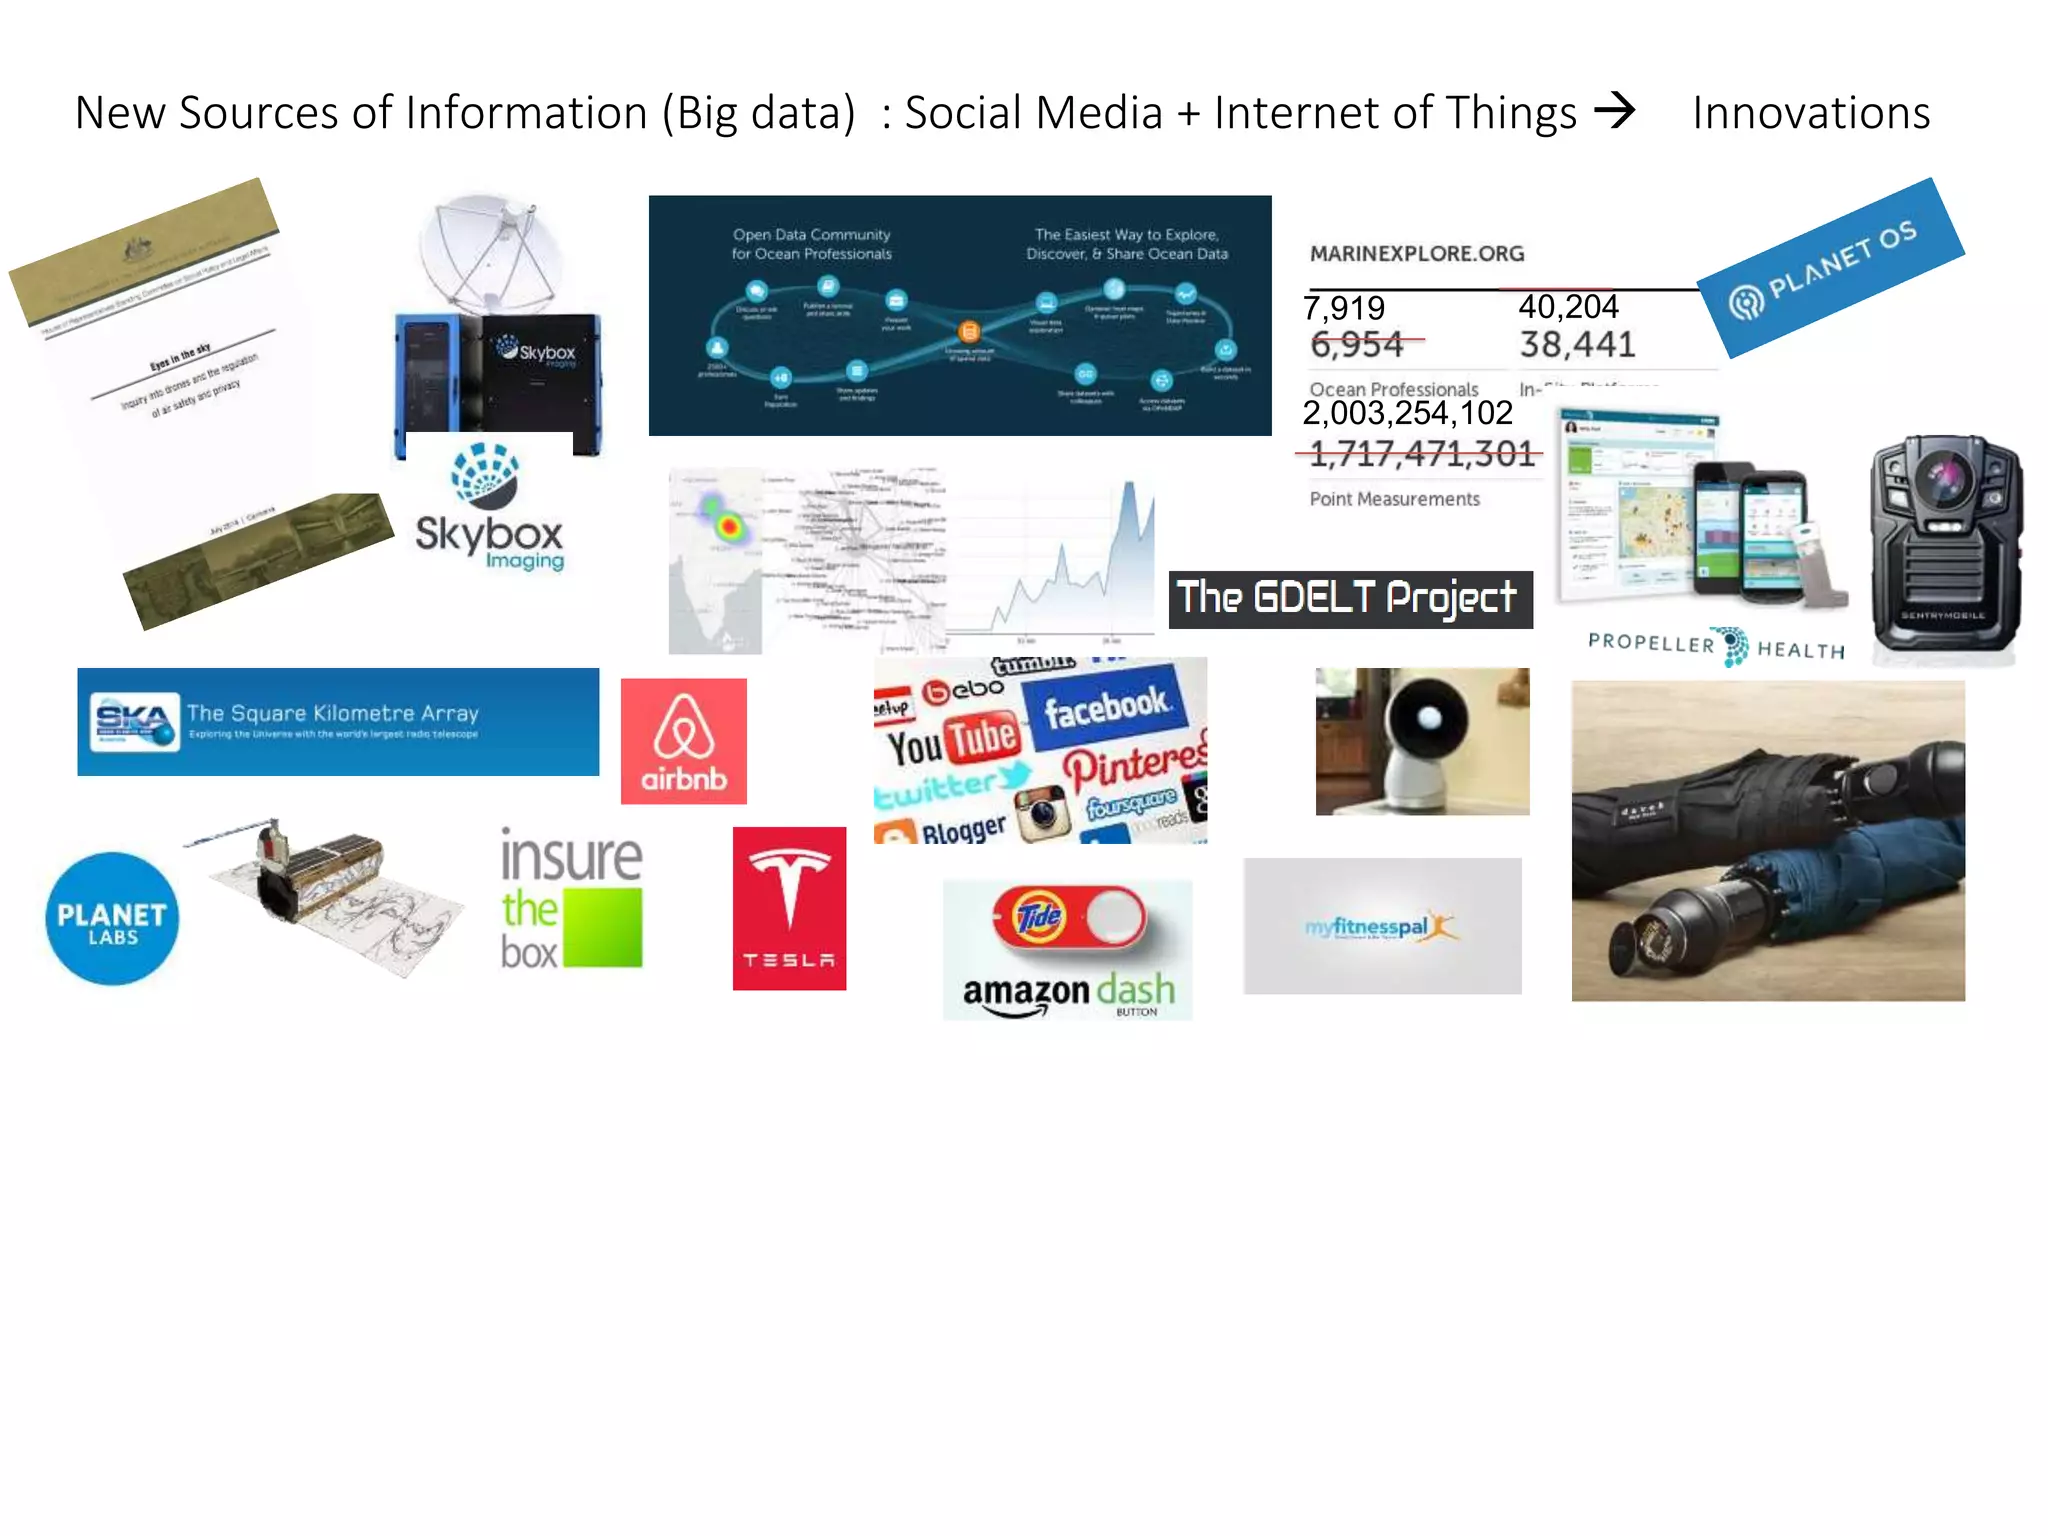
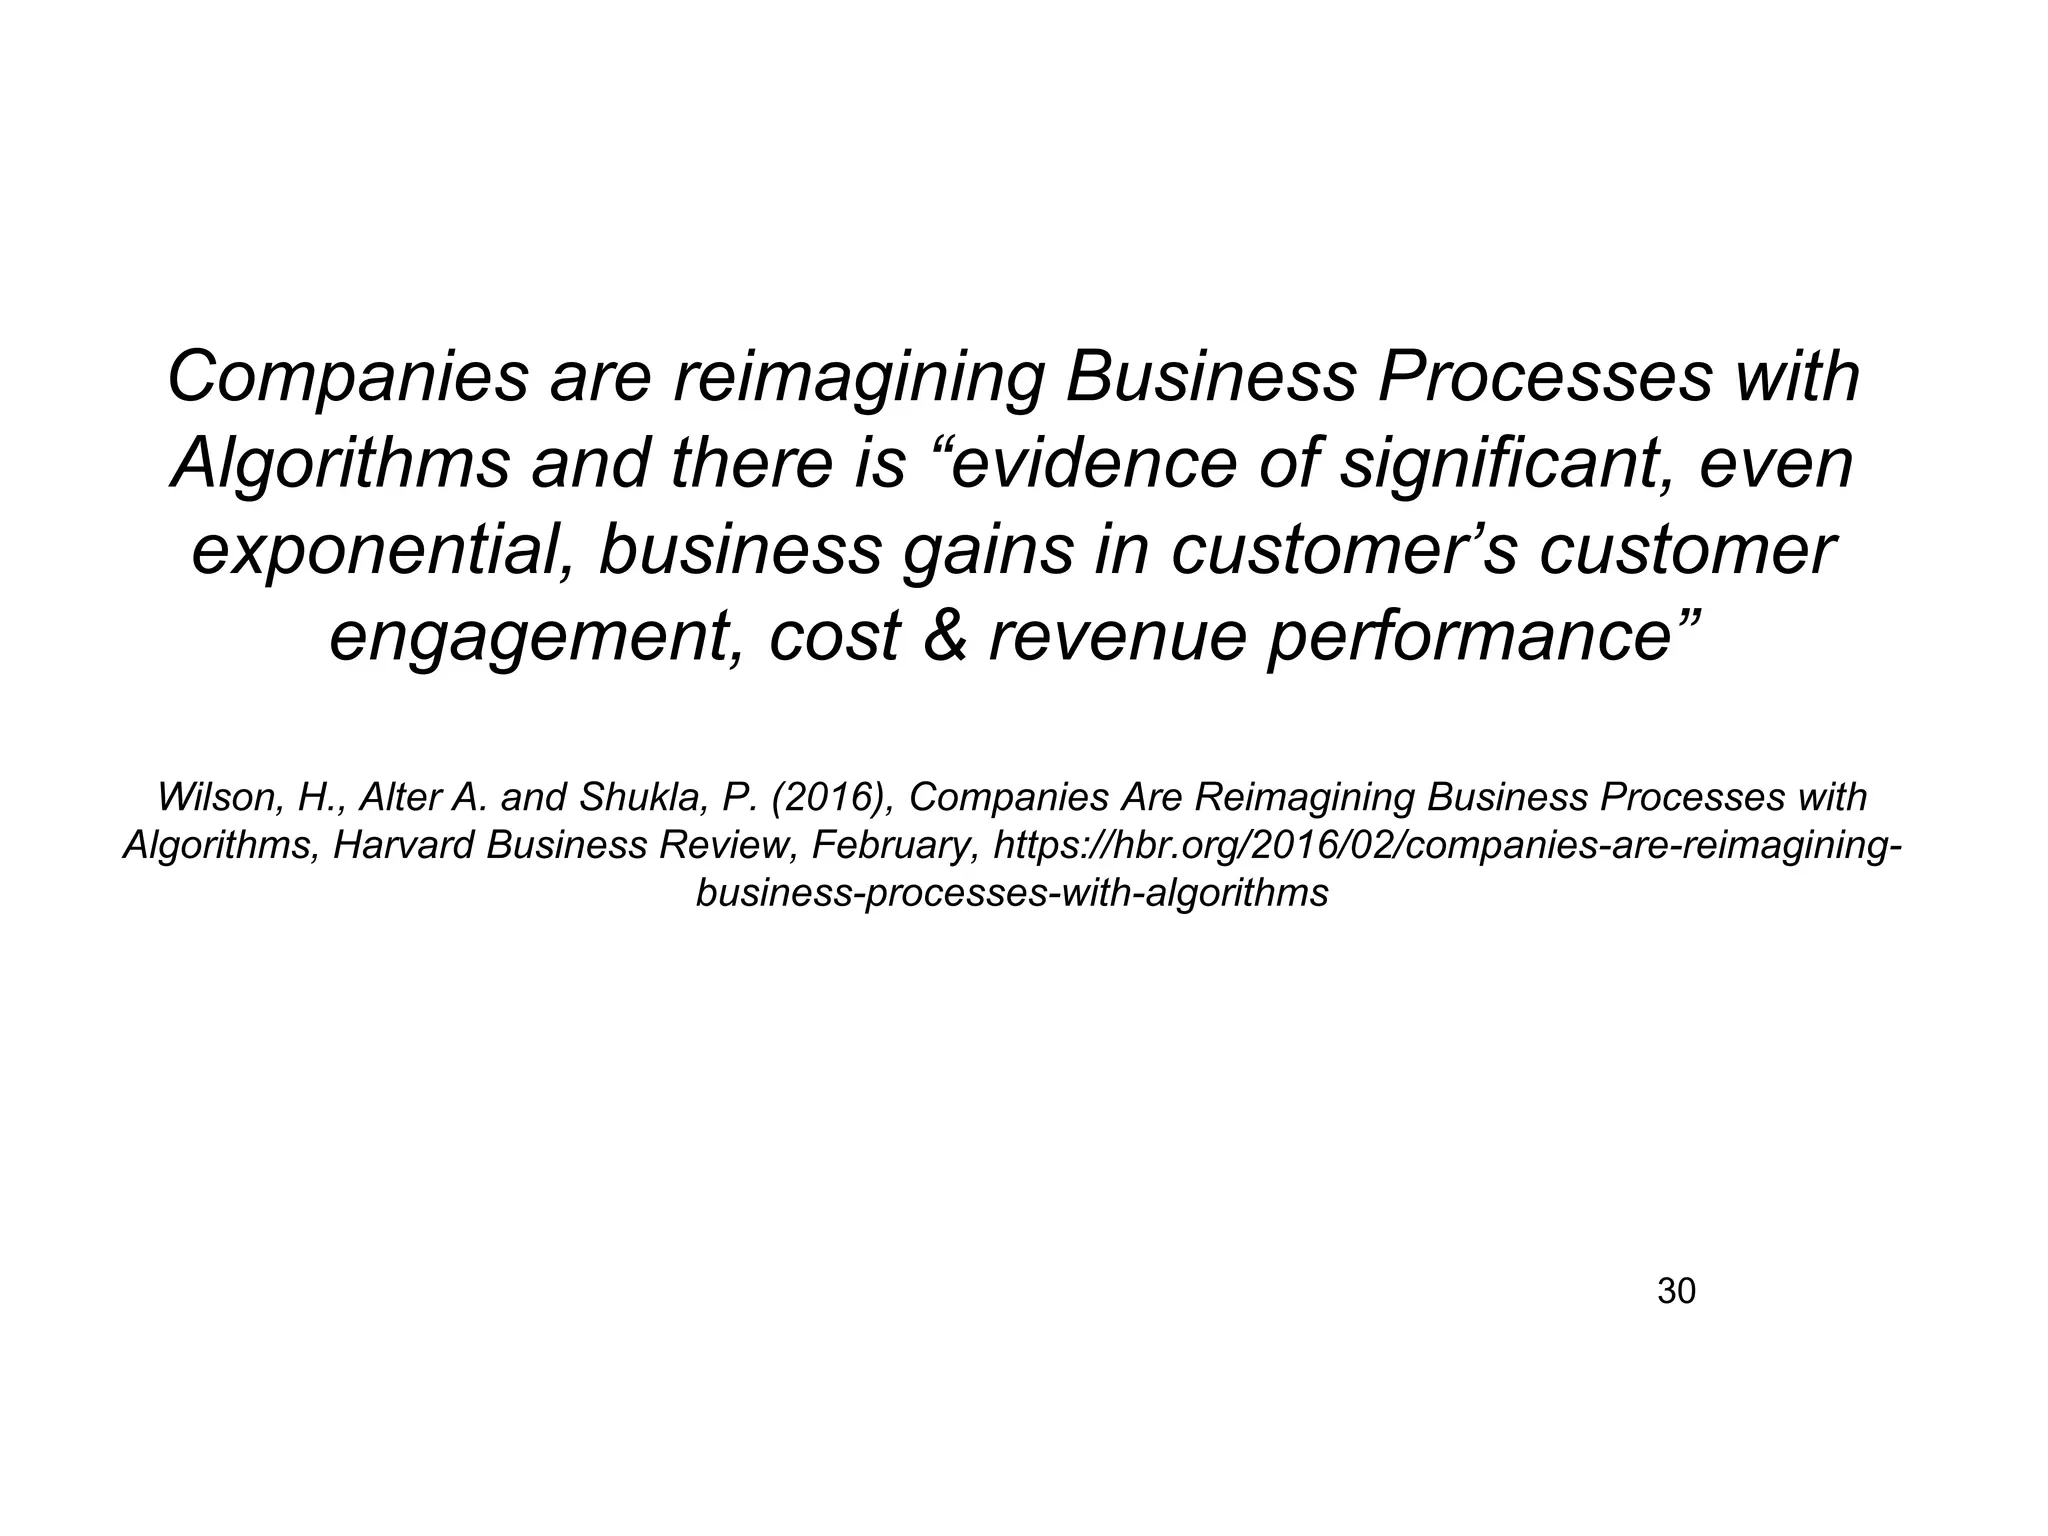
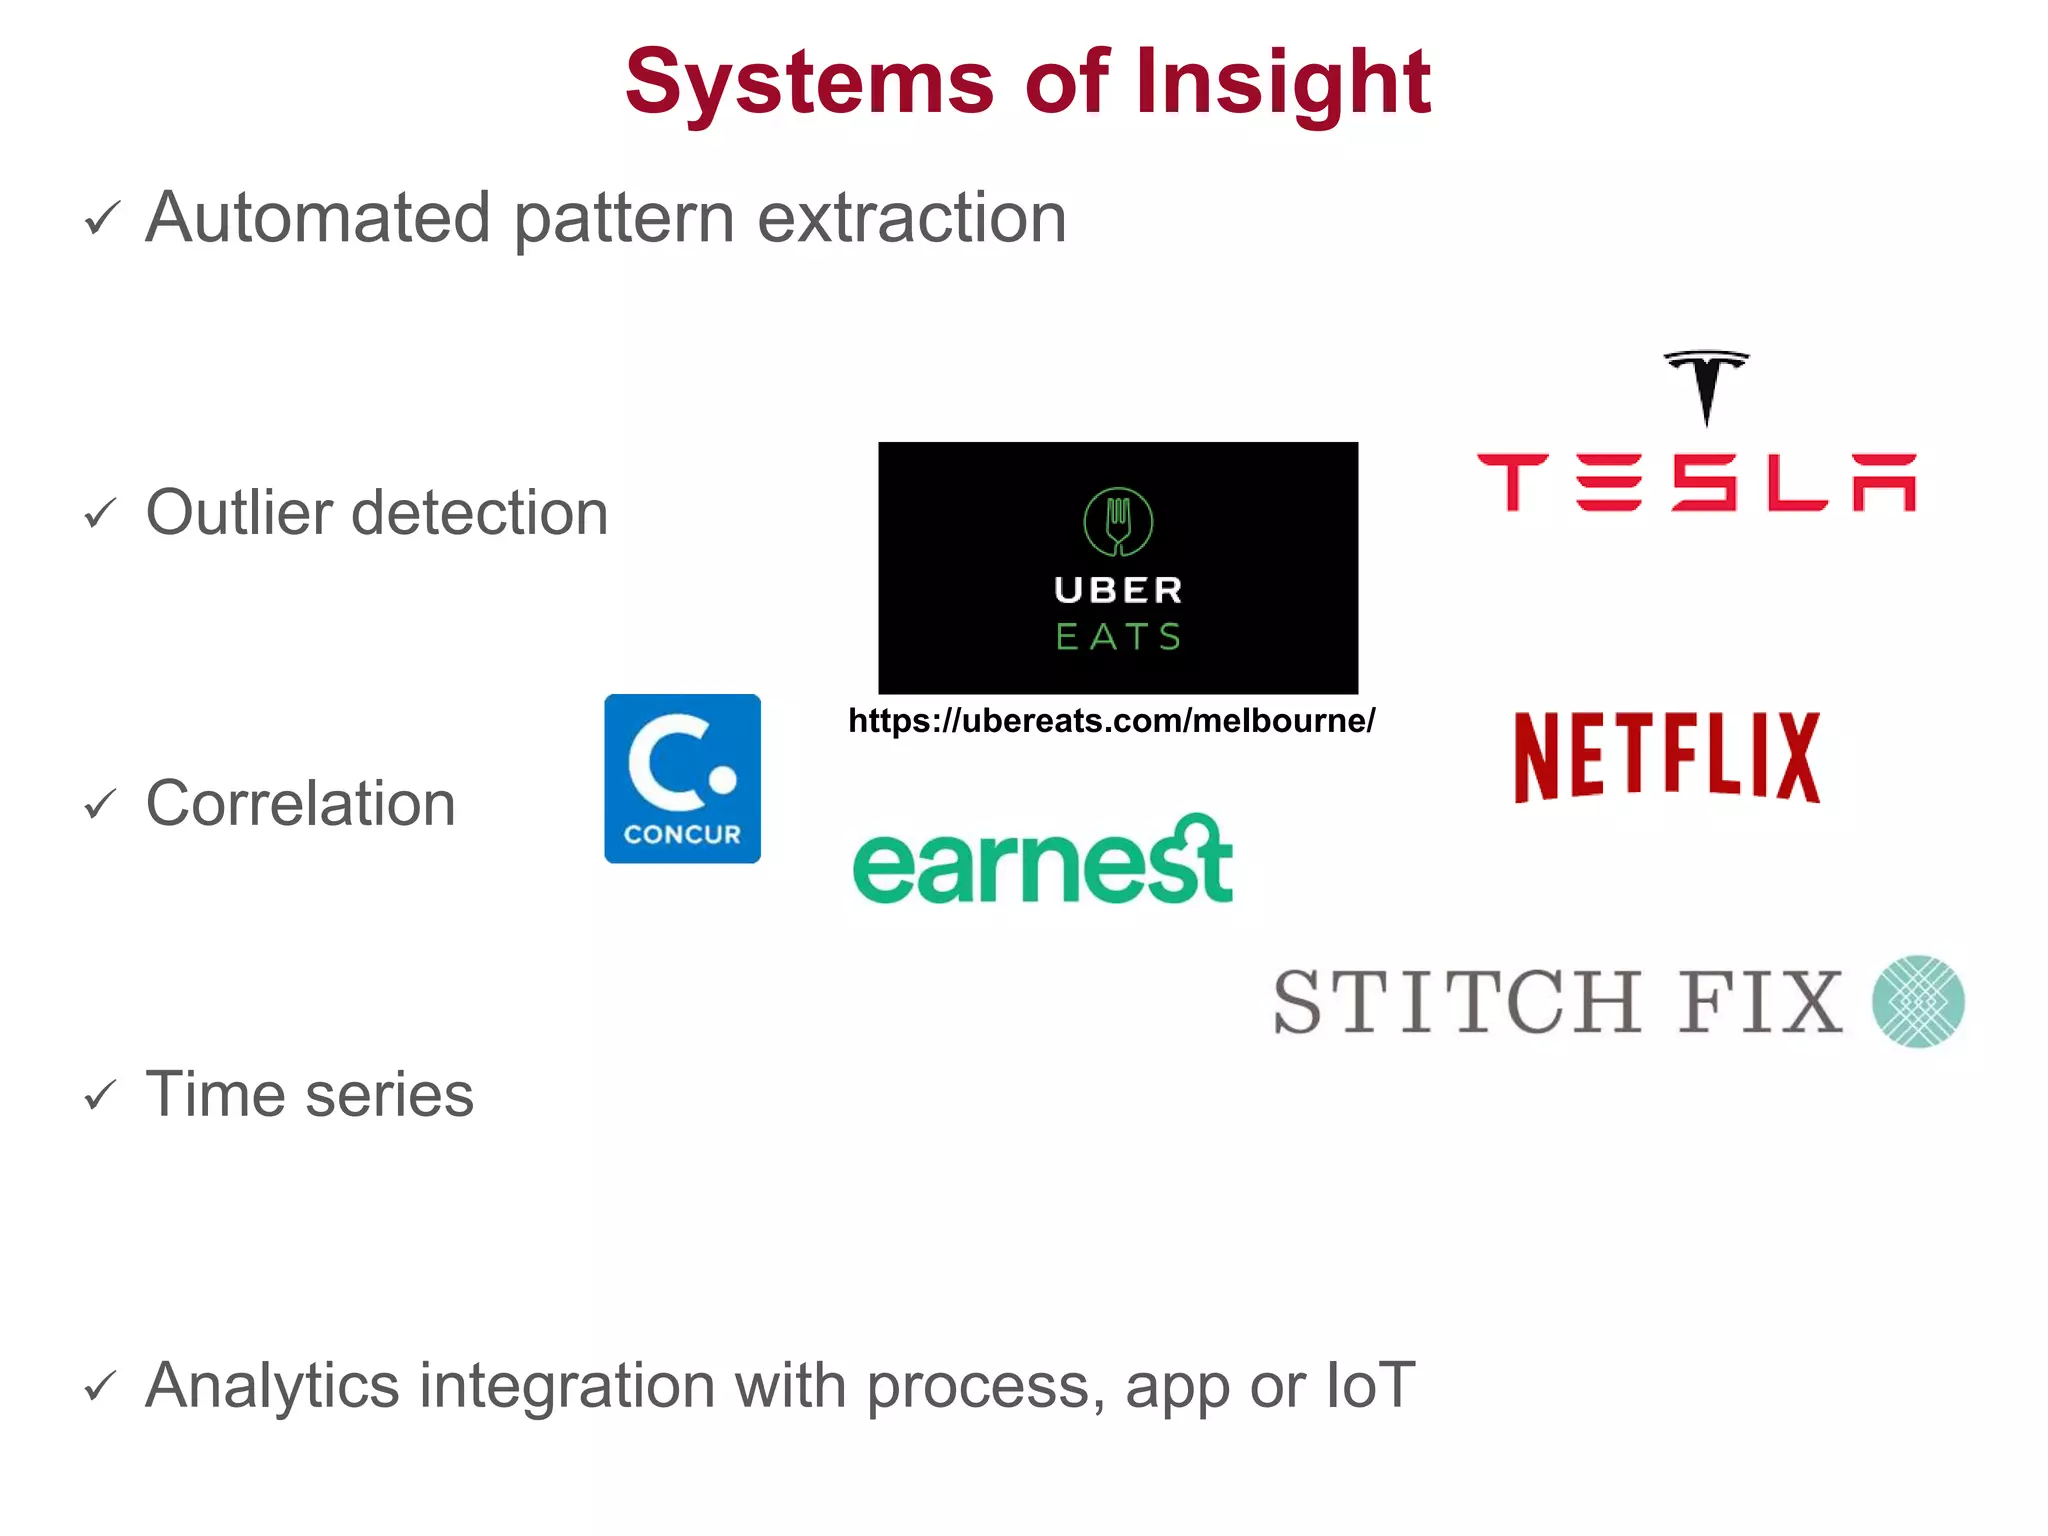
The document explores innovations in data science, particularly the role of systems of insight and the integration of big data and the Internet of Things (IoT) in marketing and business processes. It highlights the importance of new data sources in solving problems and the evolving landscape of analytics, emphasizing the need for a fast and effective decision-making process. Key insights include the rise of citizen data scientists, automated analytics, and the transformative potential of algorithms in enhancing customer engagement and operational efficiency.