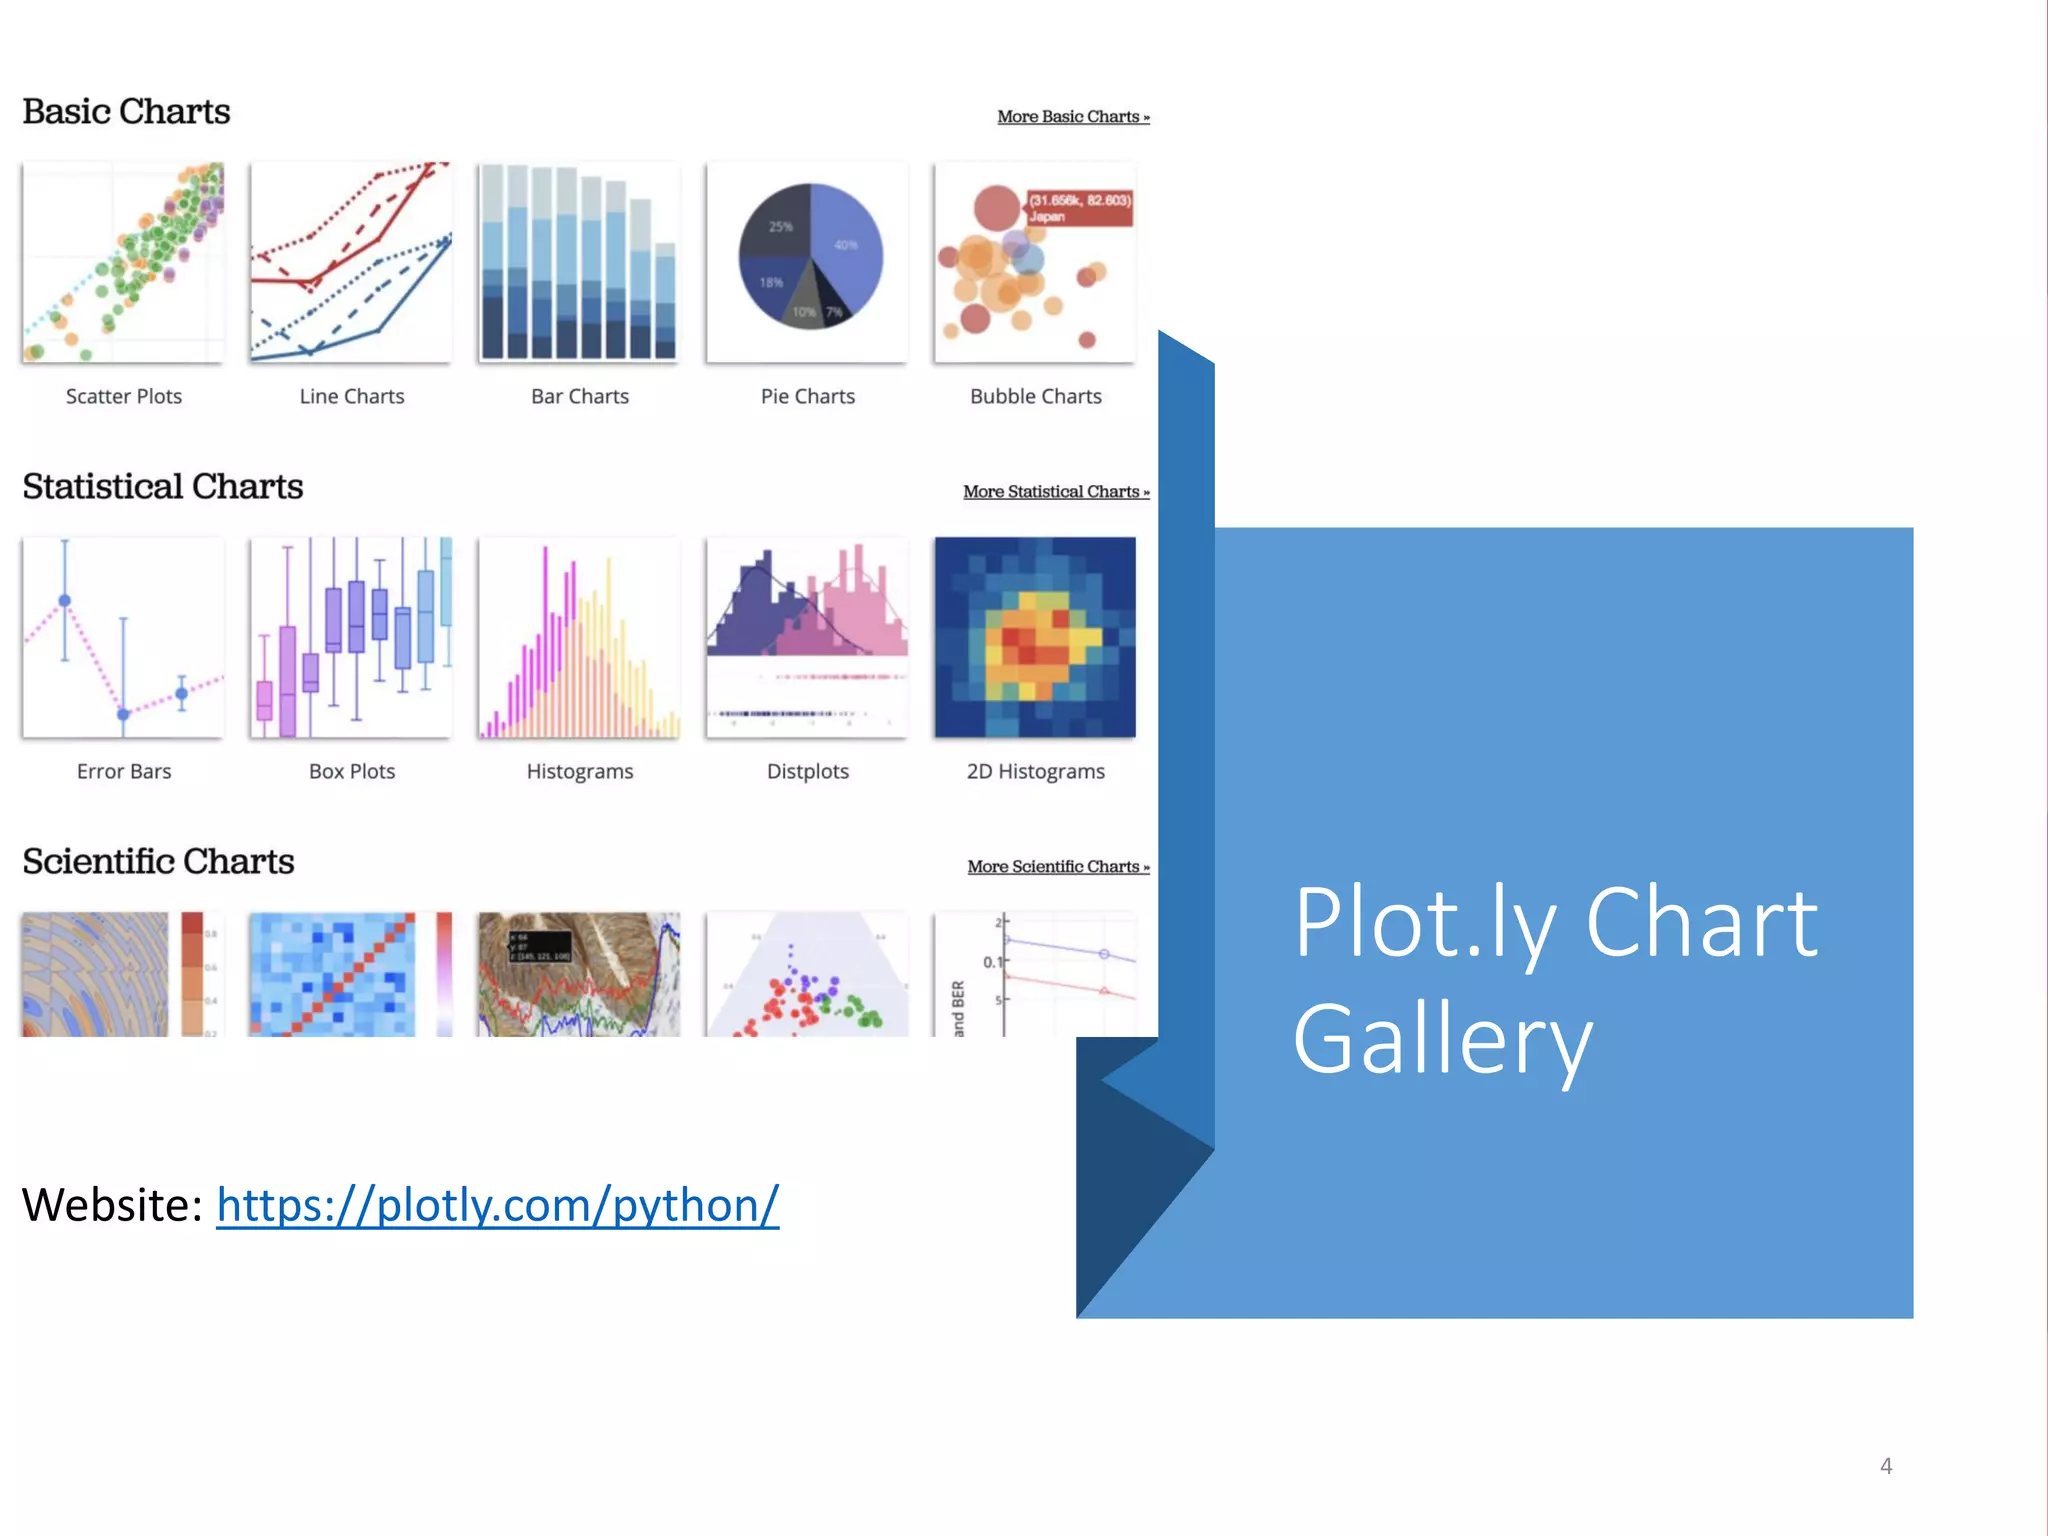
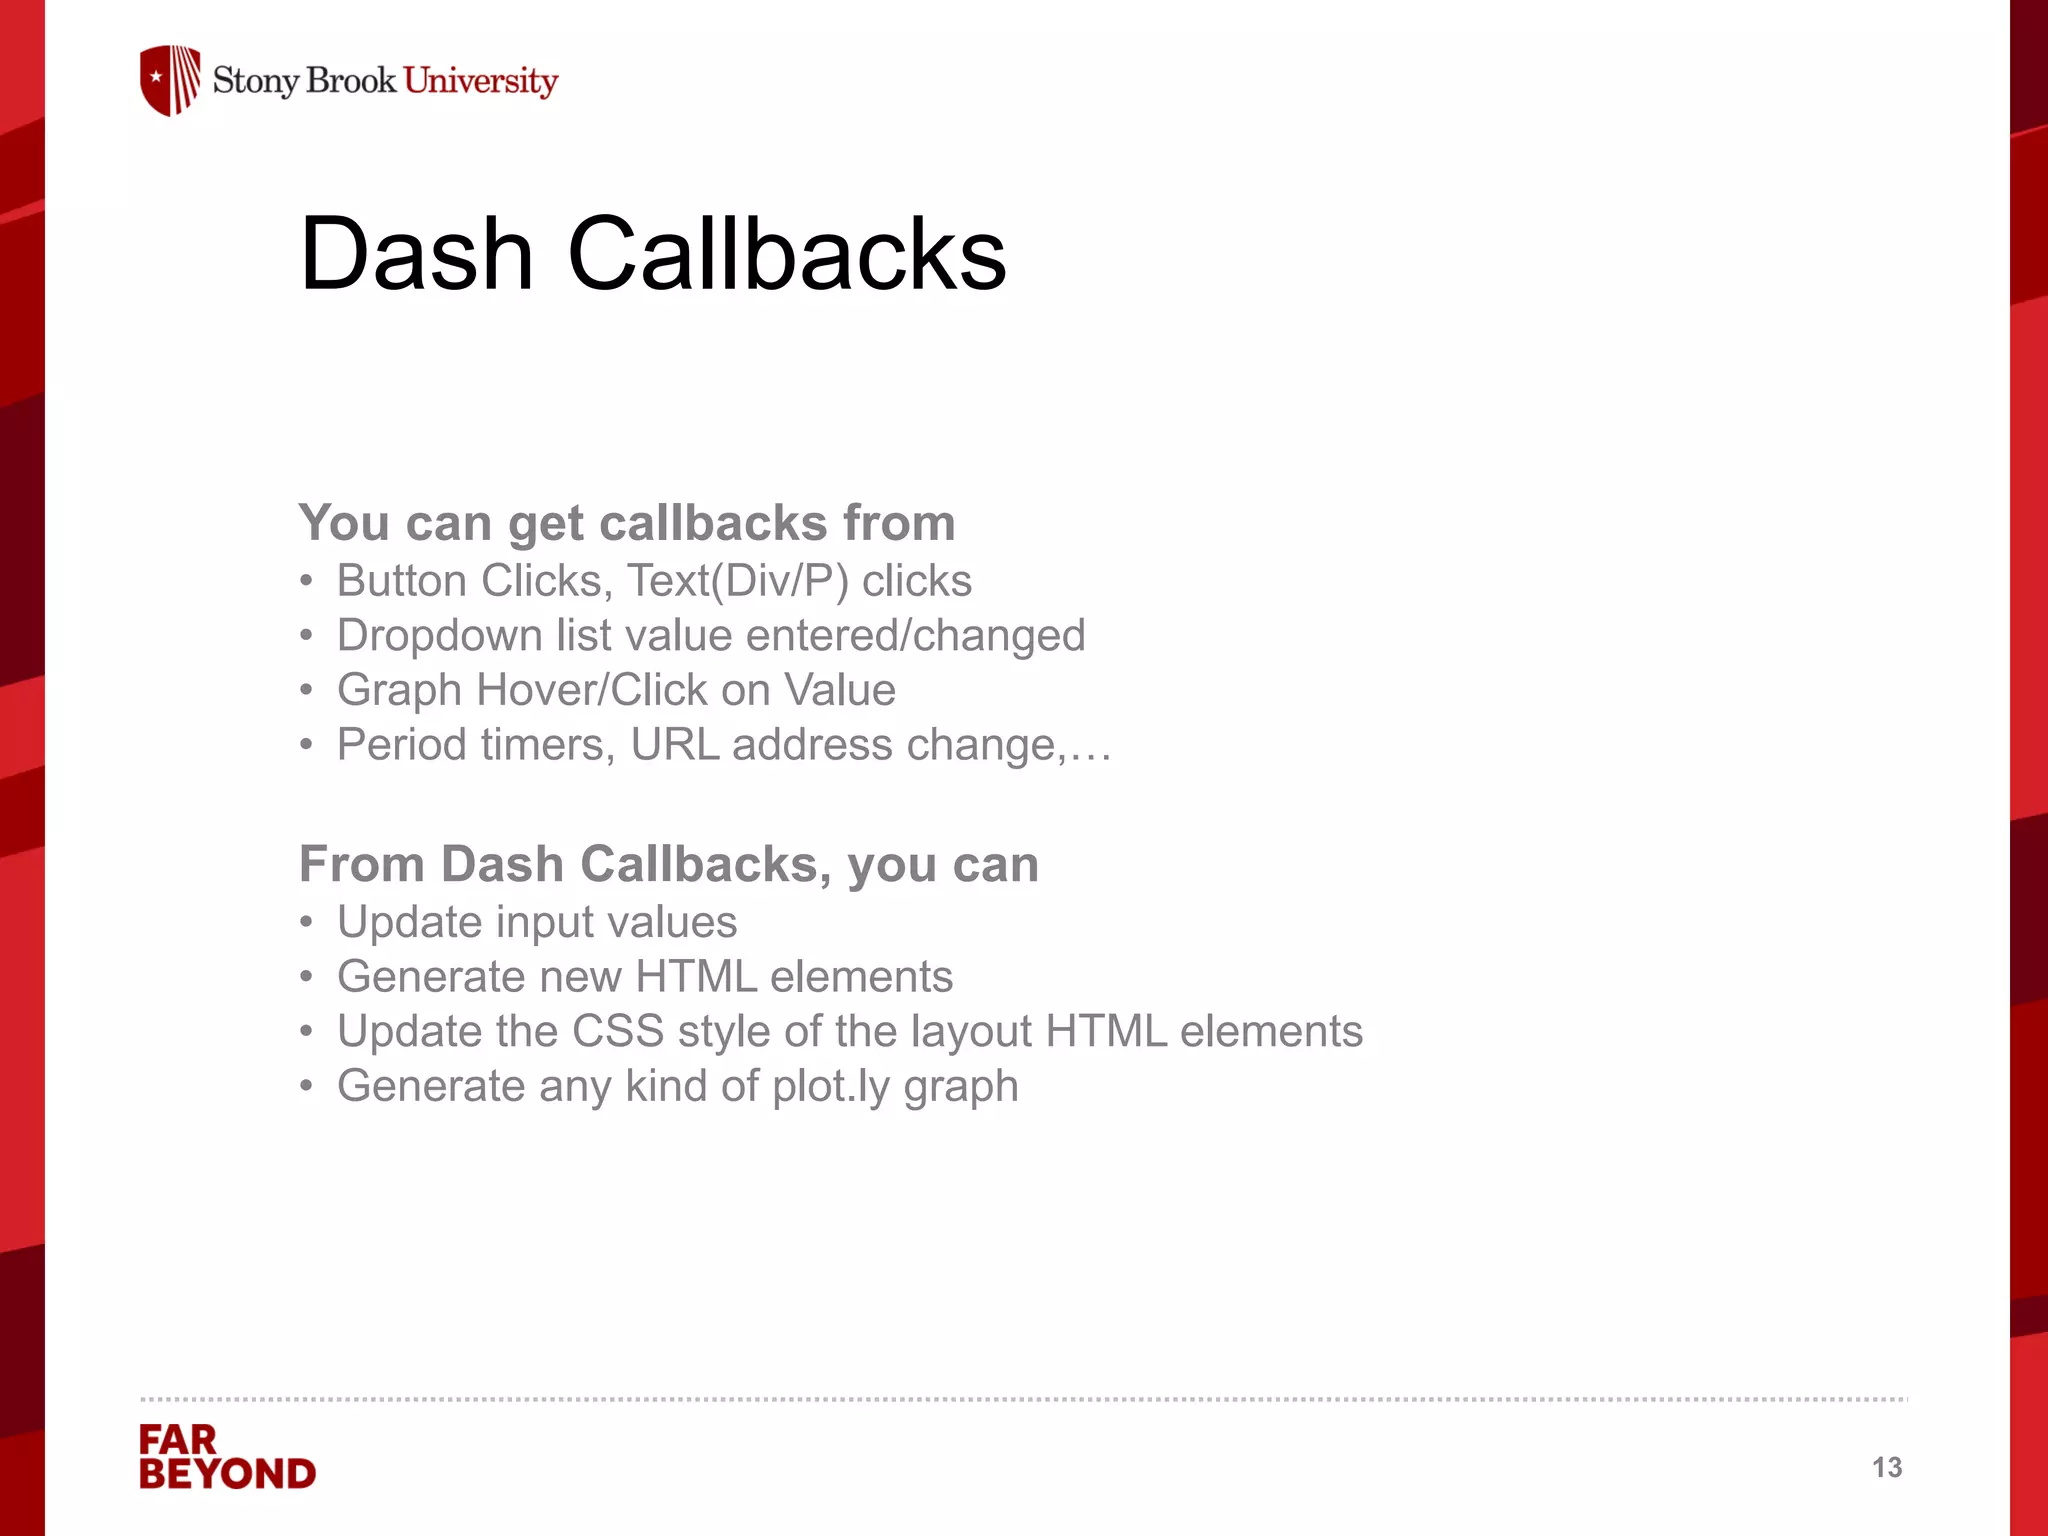
Dash is a Python framework for building web applications that uses Flask, Plotly.js, and React.js. It allows building interactive data visualizations in Python without needing expertise in HTML and JavaScript. Plotly is a Python graphing library that can be used with or without Dash to customize graphs. Dash apps are built with components for the user interface layout and callbacks that define interactivity.


![‘
Dash Layout
HTML ... in Python
import dash_html_components as html
app.layout = html.Div(children=[
html.H1(
'Hello Dash',
style={'text-align': 'center'}),
html.Div(
id='my-div',
children='Dash: A web app
framework for Python. ',
style={'textAlign': 'center'}),
]
)
8](https://image.slidesharecdn.com/dashintro-230710081602-af46676e/75/Dash-Intro-pdf-8-2048.jpg)
![‘
Dash Layout
HTML ... in Python ... plus core components
import dash_core_components as dcc
component1 = dcc.Dropdown(value='MTL', options=[
{'label': 'New York City', 'value': 'NYC'},
{'label': 'Montréal', 'value': 'MTL'},
{'label': 'San Francisco', 'value': 'SF'}])
component2 = dcc.Checklist(value=['MTL'], options=[
{'label': 'New York City', 'value': 'NYC'},
{'label': 'Montréal', 'value': 'MTL'},
{'label': 'San Francisco', 'value': 'SF'}])
component3 = dcc.Slider(min=0, max=9, value=5)
component4 = dcc.Tabs(value='tab-2-example', children=[
dcc.Tab(label='tab one', value='tab-1-example', children=[
component1,
component3
]),
dcc.Tab(label='tab two', value='tab-2-example', children=component2)])
app.layout = html.Div(component4)
9](https://image.slidesharecdn.com/dashintro-230710081602-af46676e/75/Dash-Intro-pdf-9-2048.jpg)
![‘
Dash Core Component -
Graphs
Core component that accepts plotly.py go.Figure object!
import dash_core_components as dcc
import plotly.graph_objs as go
import dash
app = dash.Dash()
app.layout = html.Div(children=[
html.H1('Hello Graph', style={'text-align': 'center’}),
dcc.Graph(
id='my-first-graph’,
figure=dict(data=[dict(x=[0, 1, 2], y=[3, 4, 2])])
)
])
if __name__ == '__main__':
app.run_server()
10](https://image.slidesharecdn.com/dashintro-230710081602-af46676e/75/Dash-Intro-pdf-10-2048.jpg)
![‘
Scatter Plot Graph Example
import dash
import dash_core_components as dcc
import dash_html_components as html
import pandas as pd
import plotly.express as px
external_stylesheets = ['https://codepen.io/chriddyp/pen/bWLwgP.css']
app = dash.Dash(__name__, external_stylesheets=external_stylesheets)
df =
pd.read_csv('https://raw.githubusercontent.com/plotly/datasets/master/gapminderDataFiveYear.csv')
fig = px.scatter(
df, x="gdpPercap", y="lifeExp", size="pop",
color="continent", hover_name="country", log_x=True, size_max=60)
app.layout = html.Div([
dcc.Graph(
id='life-exp-vs-gdp',
figure=fig
)
])
if __name__ == '__main__':
app.run_server(debug=True)
11](https://image.slidesharecdn.com/dashintro-230710081602-af46676e/75/Dash-Intro-pdf-11-2048.jpg)

![‘
Callbacks - Example
from dash.dependencies import Input, Output
df =
pd.read_csv('https://raw.githubusercontent.com/plotly/datasets/master/gapminderDataFiveYear.csv
')
@app.callback(
Output('life-exp-vs-gdp', 'figure'),
Input('year-slider', 'value')
)
def update_figure(selected_year):
filterDf = df[df.year == selected_year]
fig = px.scatter(filterDf, x="gdpPercap", y="lifeExp", size="pop", color="continent",
hover_name="country", log_x=True, size_max=60)
fig.update_layout(transition_duration=500)
return fig
app.layout = html.Div([
dcc.Graph(id='life-exp-vs-gdp'),
dcc.Slider(
id='year-slider', min=df['year'].min(), value=df['year'].min(),
max=df['year'].max(), marks={str(year): str(year) for year in df['year'].unique()}, step=None
)
])
14](https://image.slidesharecdn.com/dashintro-230710081602-af46676e/75/Dash-Intro-pdf-14-2048.jpg)
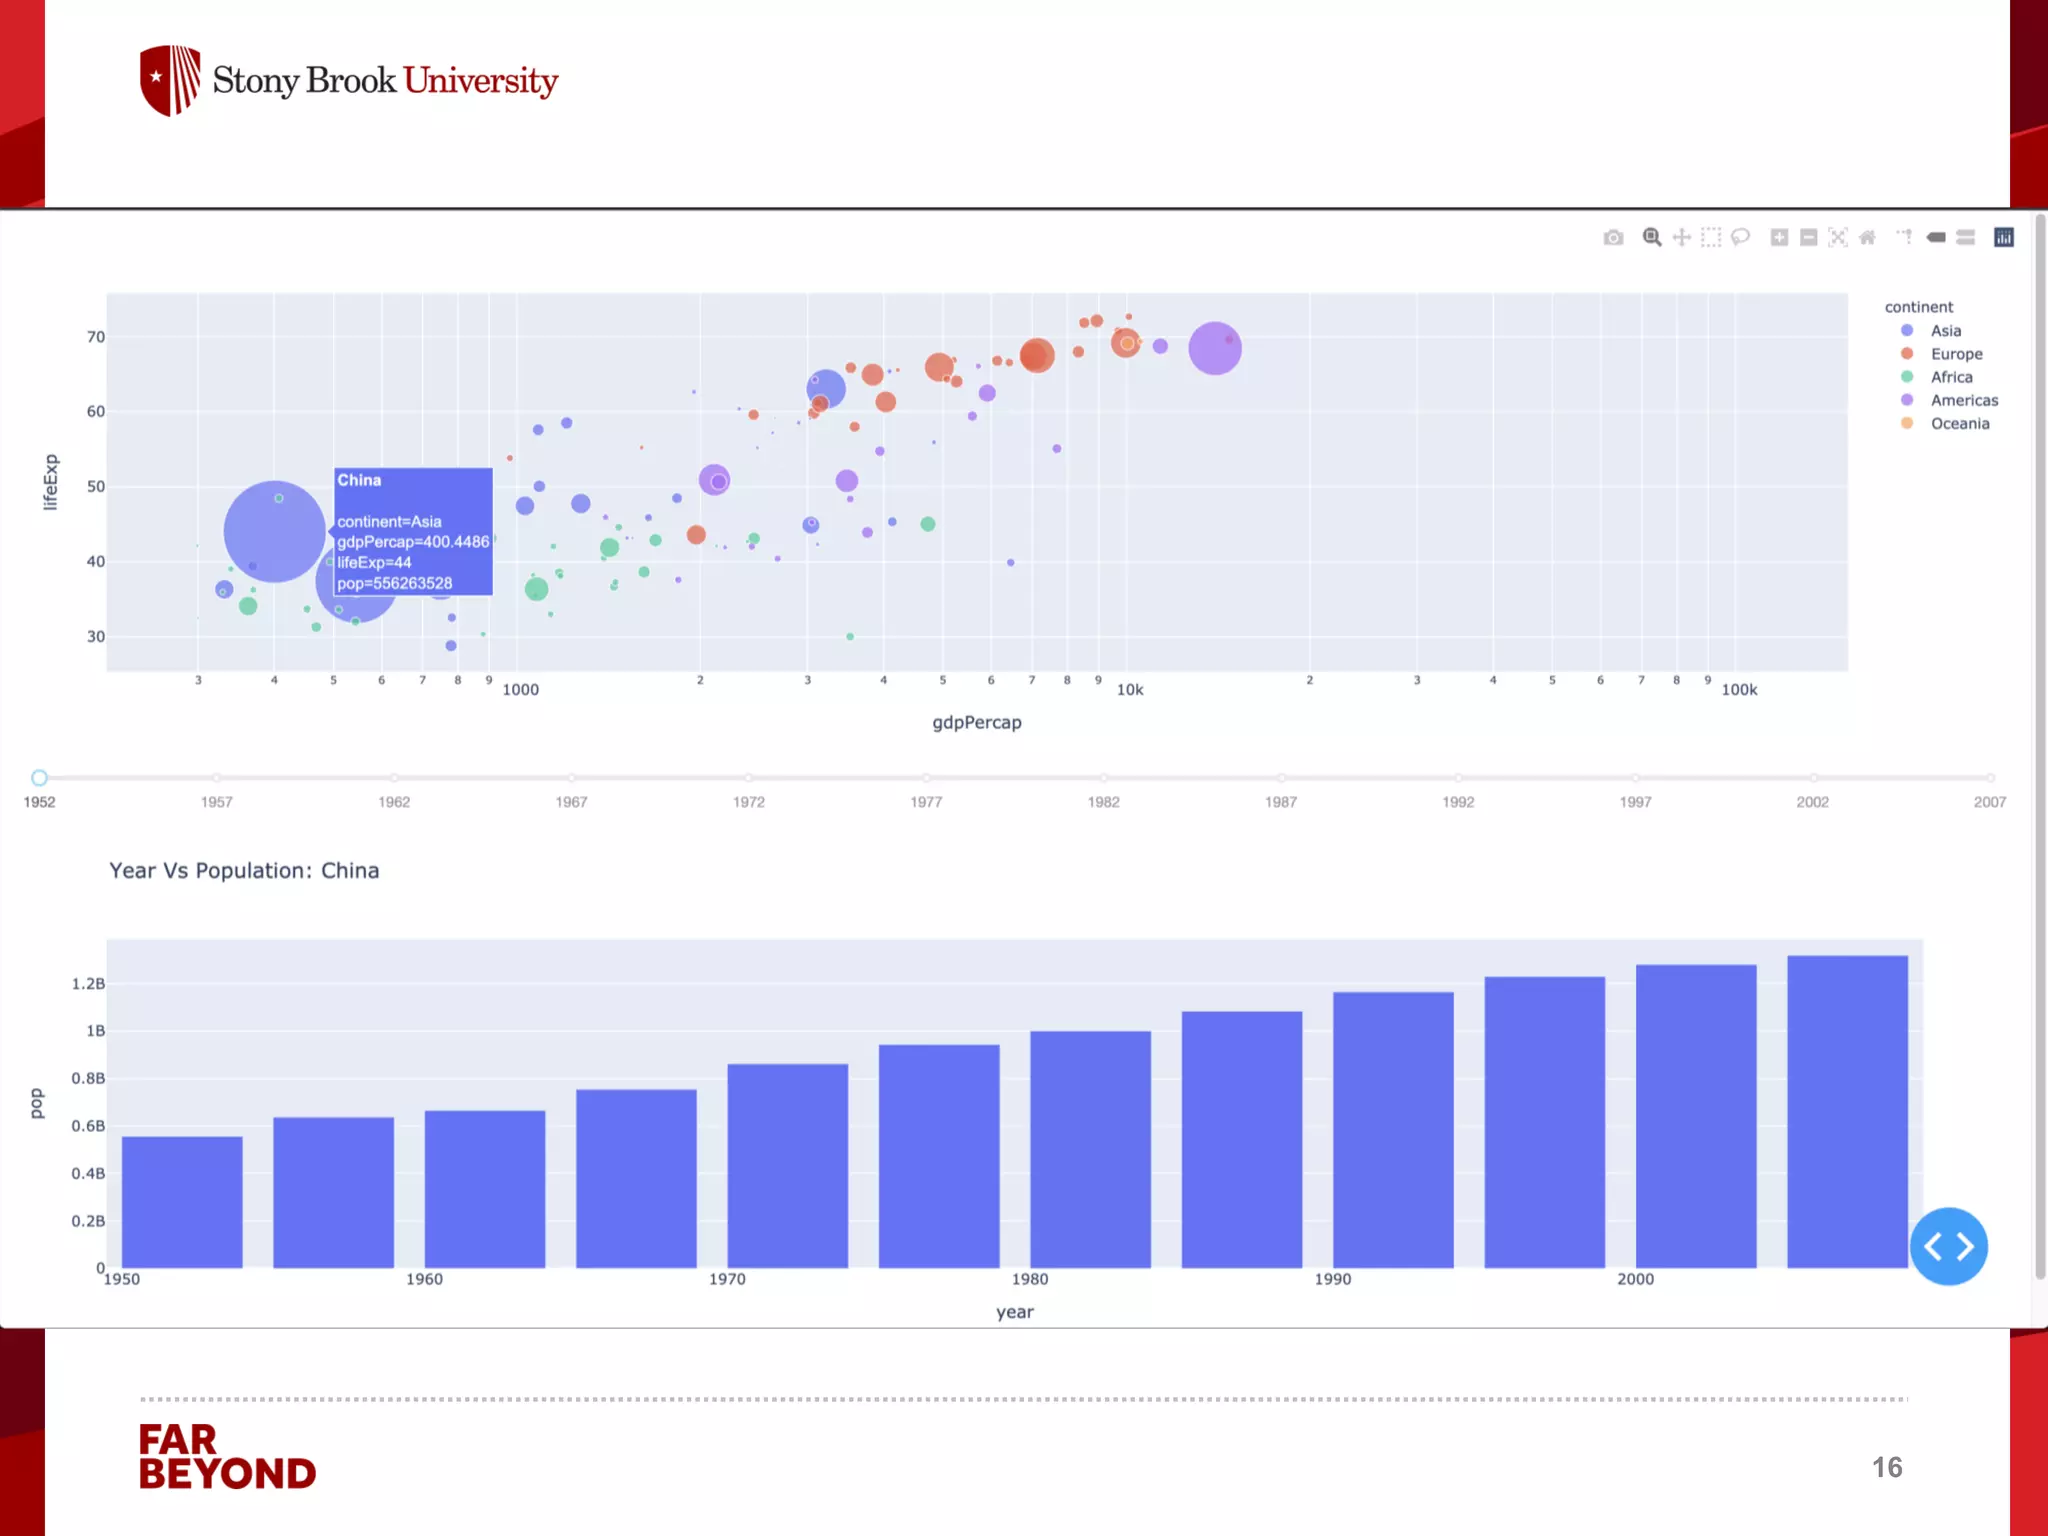
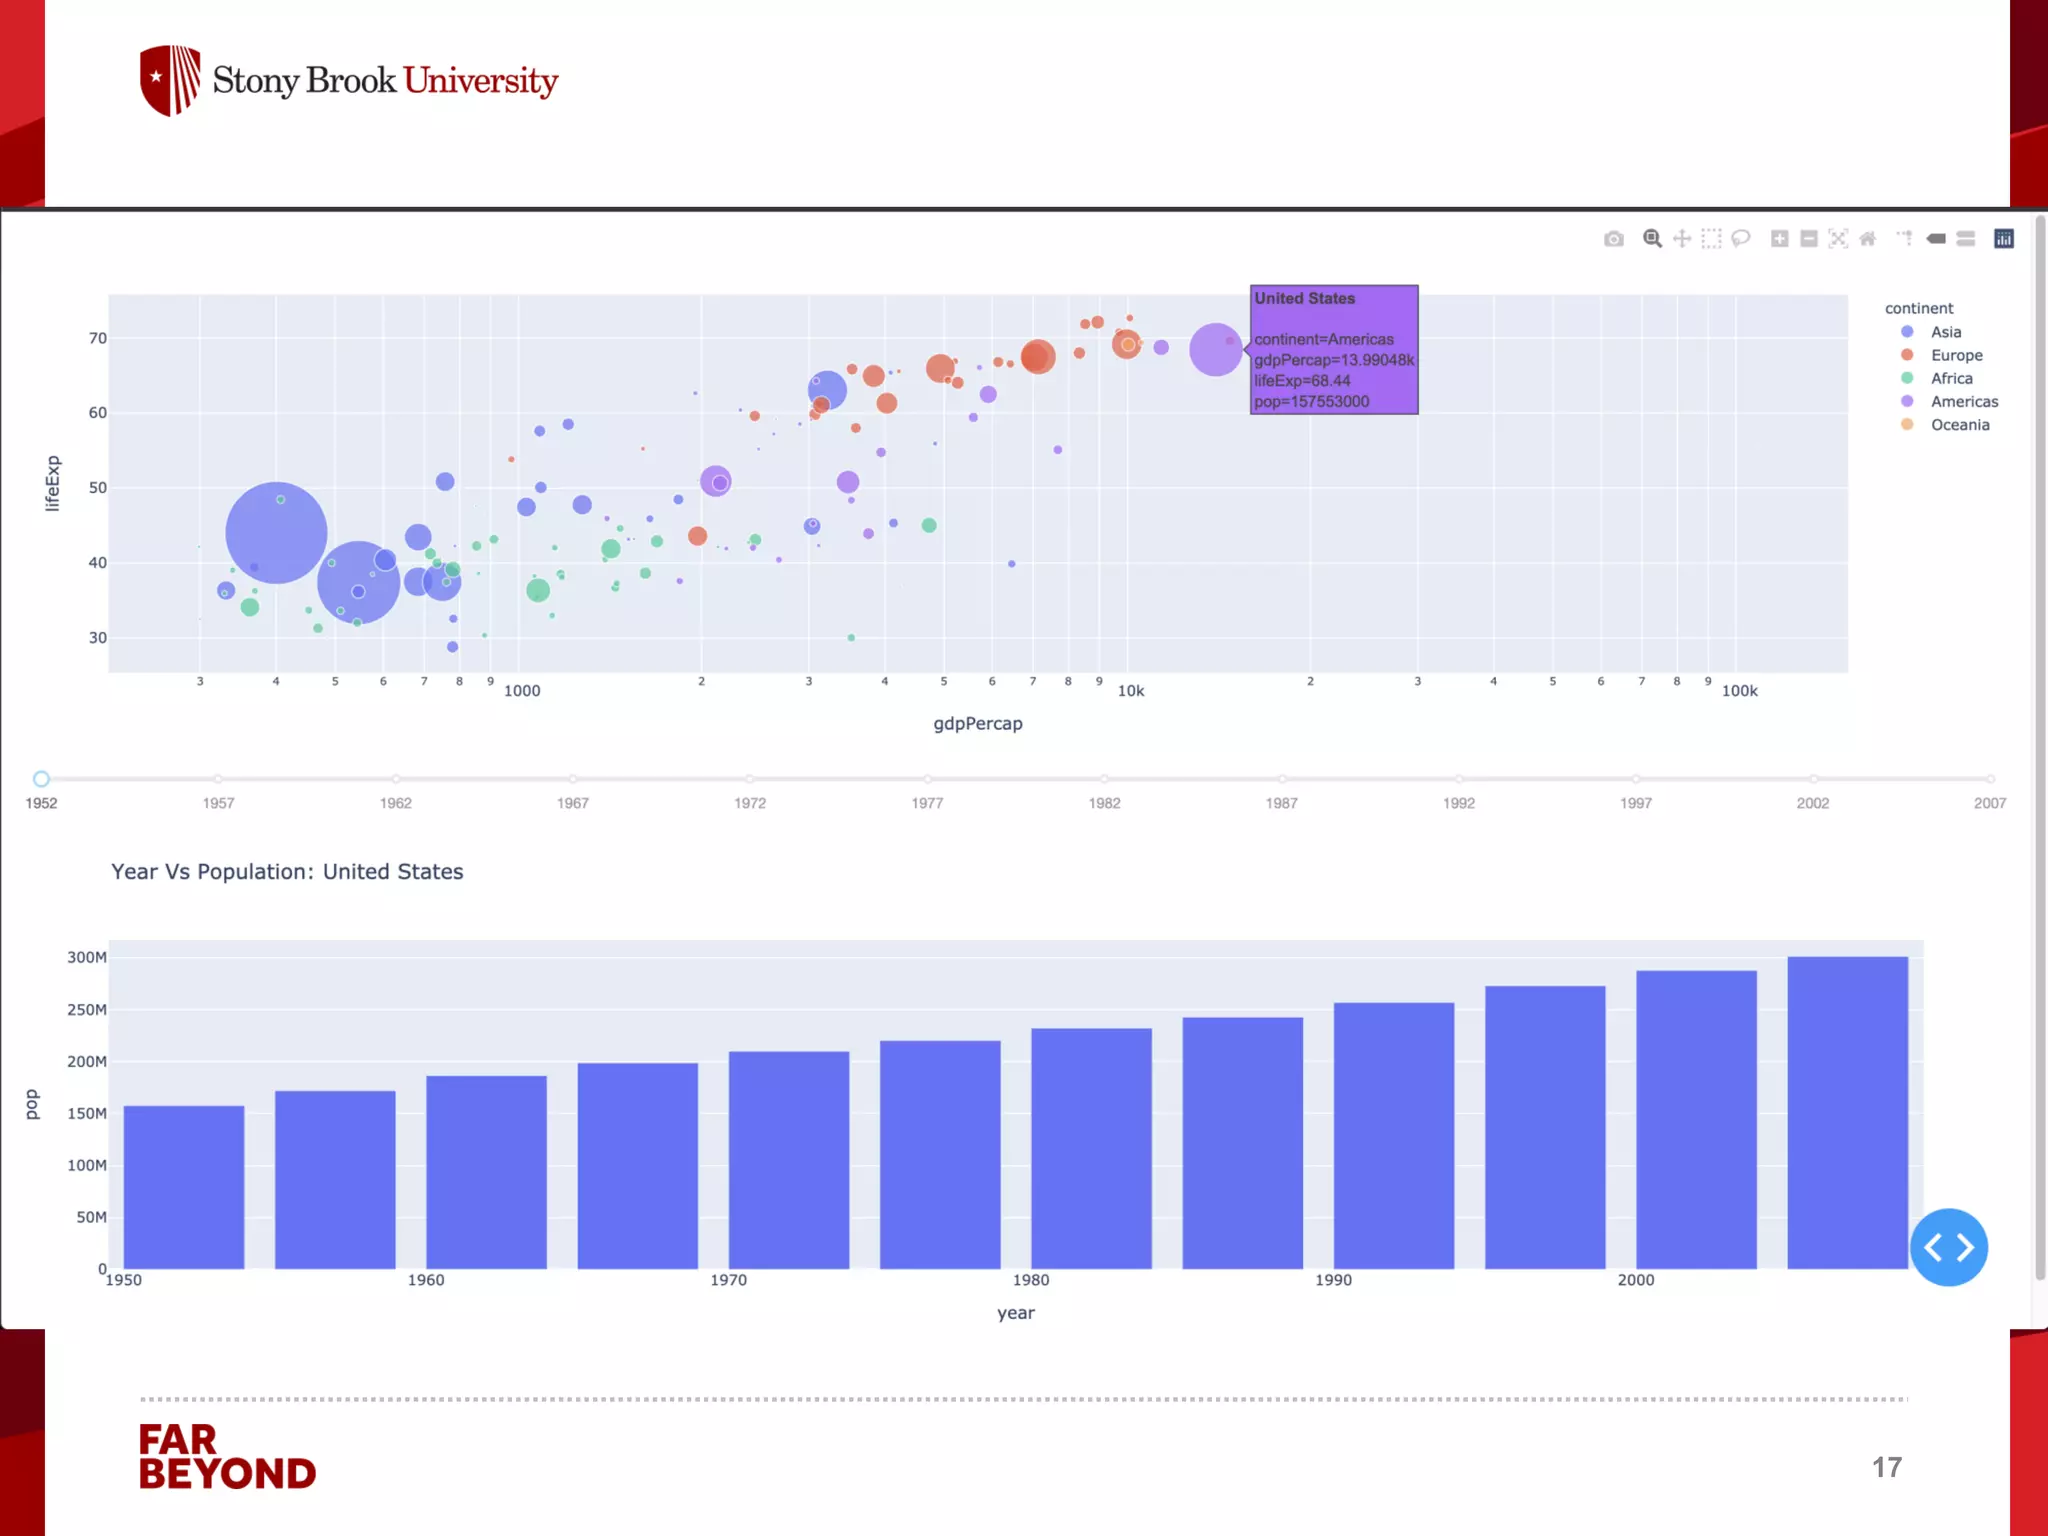
![‘
Callback - Linking
@app.callback(
Output('year-pop', 'figure'),
[dash.dependencies.Input('life-exp-vs-gdp', 'hoverData')]
)
def update_output_div(hoverData):
if not hoverData:
country = ''
else:
country = hoverData['points'][0]['hovertext']
filterDf = df[df.country == country]
fig = px.bar(filterDf, x='year', y='pop', title='Year Vs Population: {}'.format(country))
# return 'Output: {}'.format(hoverData['points'][0]['hovertext'])
return fig
app.layout = html.Div([
dcc.Graph(id='life-exp-vs-gdp'),
dcc.Slider(
id='year-slider', min=df['year'].min(), value=df['year'].min(),
max=df['year'].max(), marks={str(year): str(year) for year in df['year'].unique()}, step=None
),
dcc.Graph(id='year-pop'),
])
15](https://image.slidesharecdn.com/dashintro-230710081602-af46676e/75/Dash-Intro-pdf-15-2048.jpg)


![‘
Dash Layout
HTML ... in Python
import dash_html_components as html
app.layout = html.Div(children=[
html.H1(
'Hello Dash',
style={'text-align': 'center'}),
html.Div(
id='my-div',
children='Dash: A web app
framework for Python. ',
style={'textAlign': 'center'}),
]
)
8](https://crownmelresort.com/image.slidesharecdn.com/dashintro-230710081602-af46676e/75/Dash-Intro-pdf-8-2048.jpg)
![‘
Dash Layout
HTML ... in Python ... plus core components
import dash_core_components as dcc
component1 = dcc.Dropdown(value='MTL', options=[
{'label': 'New York City', 'value': 'NYC'},
{'label': 'Montréal', 'value': 'MTL'},
{'label': 'San Francisco', 'value': 'SF'}])
component2 = dcc.Checklist(value=['MTL'], options=[
{'label': 'New York City', 'value': 'NYC'},
{'label': 'Montréal', 'value': 'MTL'},
{'label': 'San Francisco', 'value': 'SF'}])
component3 = dcc.Slider(min=0, max=9, value=5)
component4 = dcc.Tabs(value='tab-2-example', children=[
dcc.Tab(label='tab one', value='tab-1-example', children=[
component1,
component3
]),
dcc.Tab(label='tab two', value='tab-2-example', children=component2)])
app.layout = html.Div(component4)
9](https://crownmelresort.com/image.slidesharecdn.com/dashintro-230710081602-af46676e/75/Dash-Intro-pdf-9-2048.jpg)
![‘
Dash Core Component -
Graphs
Core component that accepts plotly.py go.Figure object!
import dash_core_components as dcc
import plotly.graph_objs as go
import dash
app = dash.Dash()
app.layout = html.Div(children=[
html.H1('Hello Graph', style={'text-align': 'center’}),
dcc.Graph(
id='my-first-graph’,
figure=dict(data=[dict(x=[0, 1, 2], y=[3, 4, 2])])
)
])
if __name__ == '__main__':
app.run_server()
10](https://crownmelresort.com/image.slidesharecdn.com/dashintro-230710081602-af46676e/75/Dash-Intro-pdf-10-2048.jpg)
![‘
Scatter Plot Graph Example
import dash
import dash_core_components as dcc
import dash_html_components as html
import pandas as pd
import plotly.express as px
external_stylesheets = ['https://codepen.io/chriddyp/pen/bWLwgP.css']
app = dash.Dash(__name__, external_stylesheets=external_stylesheets)
df =
pd.read_csv('https://raw.githubusercontent.com/plotly/datasets/master/gapminderDataFiveYear.csv')
fig = px.scatter(
df, x="gdpPercap", y="lifeExp", size="pop",
color="continent", hover_name="country", log_x=True, size_max=60)
app.layout = html.Div([
dcc.Graph(
id='life-exp-vs-gdp',
figure=fig
)
])
if __name__ == '__main__':
app.run_server(debug=True)
11](https://crownmelresort.com/image.slidesharecdn.com/dashintro-230710081602-af46676e/75/Dash-Intro-pdf-11-2048.jpg)


![‘
Callbacks - Example
from dash.dependencies import Input, Output
df =
pd.read_csv('https://raw.githubusercontent.com/plotly/datasets/master/gapminderDataFiveYear.csv
')
@app.callback(
Output('life-exp-vs-gdp', 'figure'),
Input('year-slider', 'value')
)
def update_figure(selected_year):
filterDf = df[df.year == selected_year]
fig = px.scatter(filterDf, x="gdpPercap", y="lifeExp", size="pop", color="continent",
hover_name="country", log_x=True, size_max=60)
fig.update_layout(transition_duration=500)
return fig
app.layout = html.Div([
dcc.Graph(id='life-exp-vs-gdp'),
dcc.Slider(
id='year-slider', min=df['year'].min(), value=df['year'].min(),
max=df['year'].max(), marks={str(year): str(year) for year in df['year'].unique()}, step=None
)
])
14](https://crownmelresort.com/image.slidesharecdn.com/dashintro-230710081602-af46676e/75/Dash-Intro-pdf-14-2048.jpg)
![‘
Callback - Linking
@app.callback(
Output('year-pop', 'figure'),
[dash.dependencies.Input('life-exp-vs-gdp', 'hoverData')]
)
def update_output_div(hoverData):
if not hoverData:
country = ''
else:
country = hoverData['points'][0]['hovertext']
filterDf = df[df.country == country]
fig = px.bar(filterDf, x='year', y='pop', title='Year Vs Population: {}'.format(country))
# return 'Output: {}'.format(hoverData['points'][0]['hovertext'])
return fig
app.layout = html.Div([
dcc.Graph(id='life-exp-vs-gdp'),
dcc.Slider(
id='year-slider', min=df['year'].min(), value=df['year'].min(),
max=df['year'].max(), marks={str(year): str(year) for year in df['year'].unique()}, step=None
),
dcc.Graph(id='year-pop'),
])
15](https://crownmelresort.com/image.slidesharecdn.com/dashintro-230710081602-af46676e/75/Dash-Intro-pdf-15-2048.jpg)