Downloaded 20 times
![13
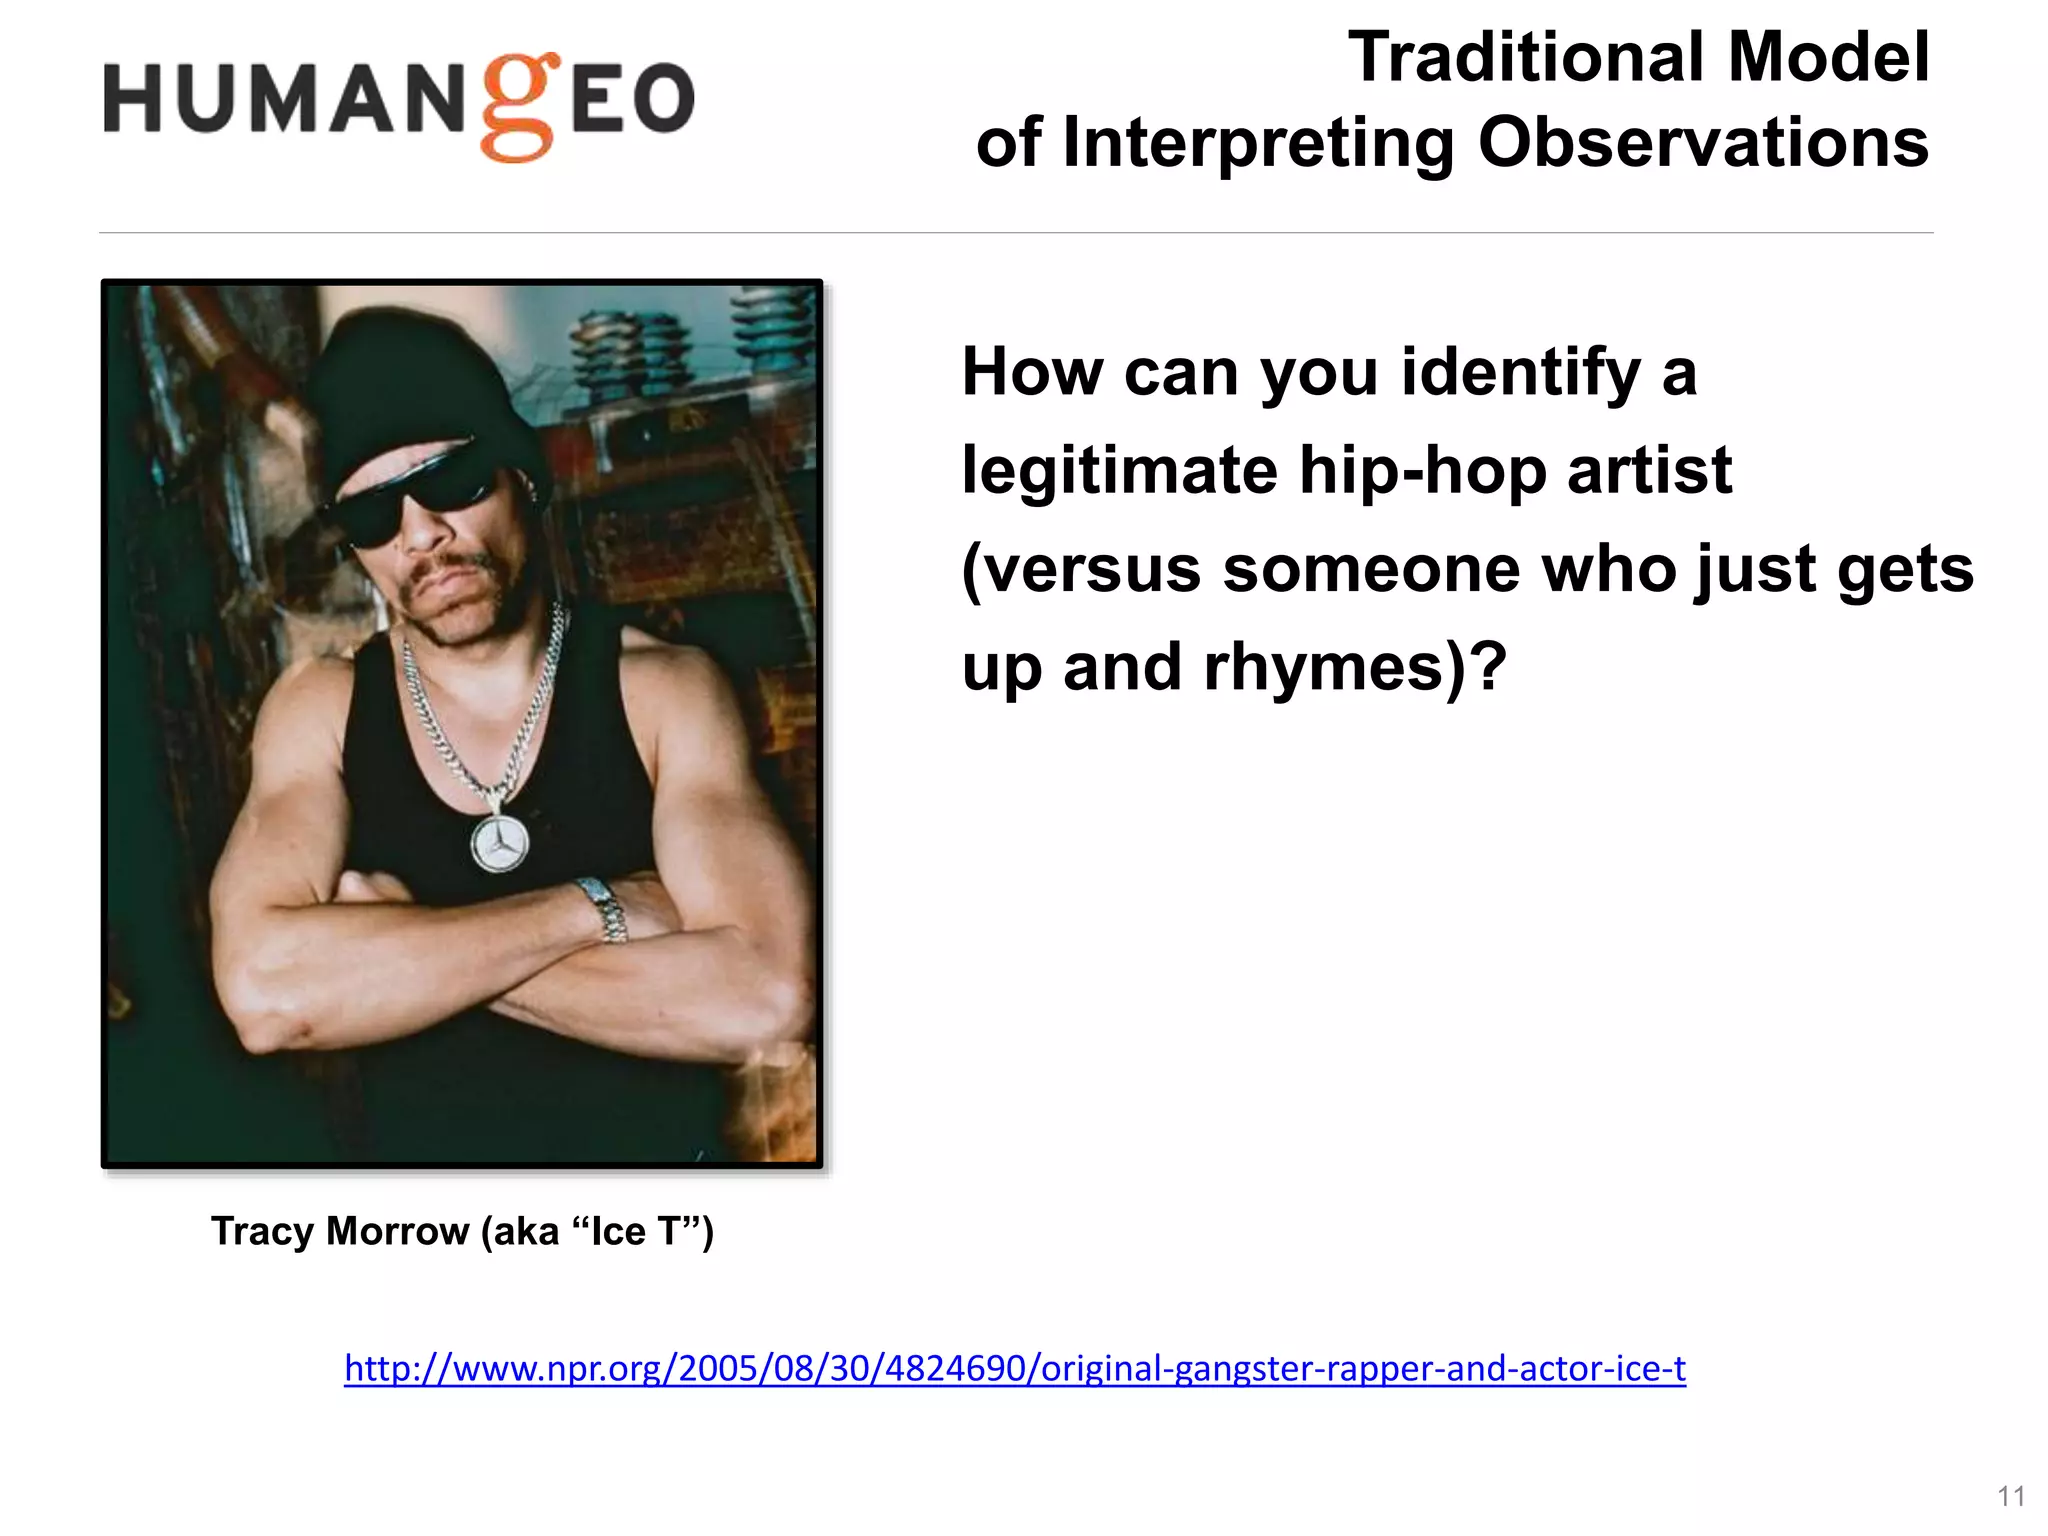
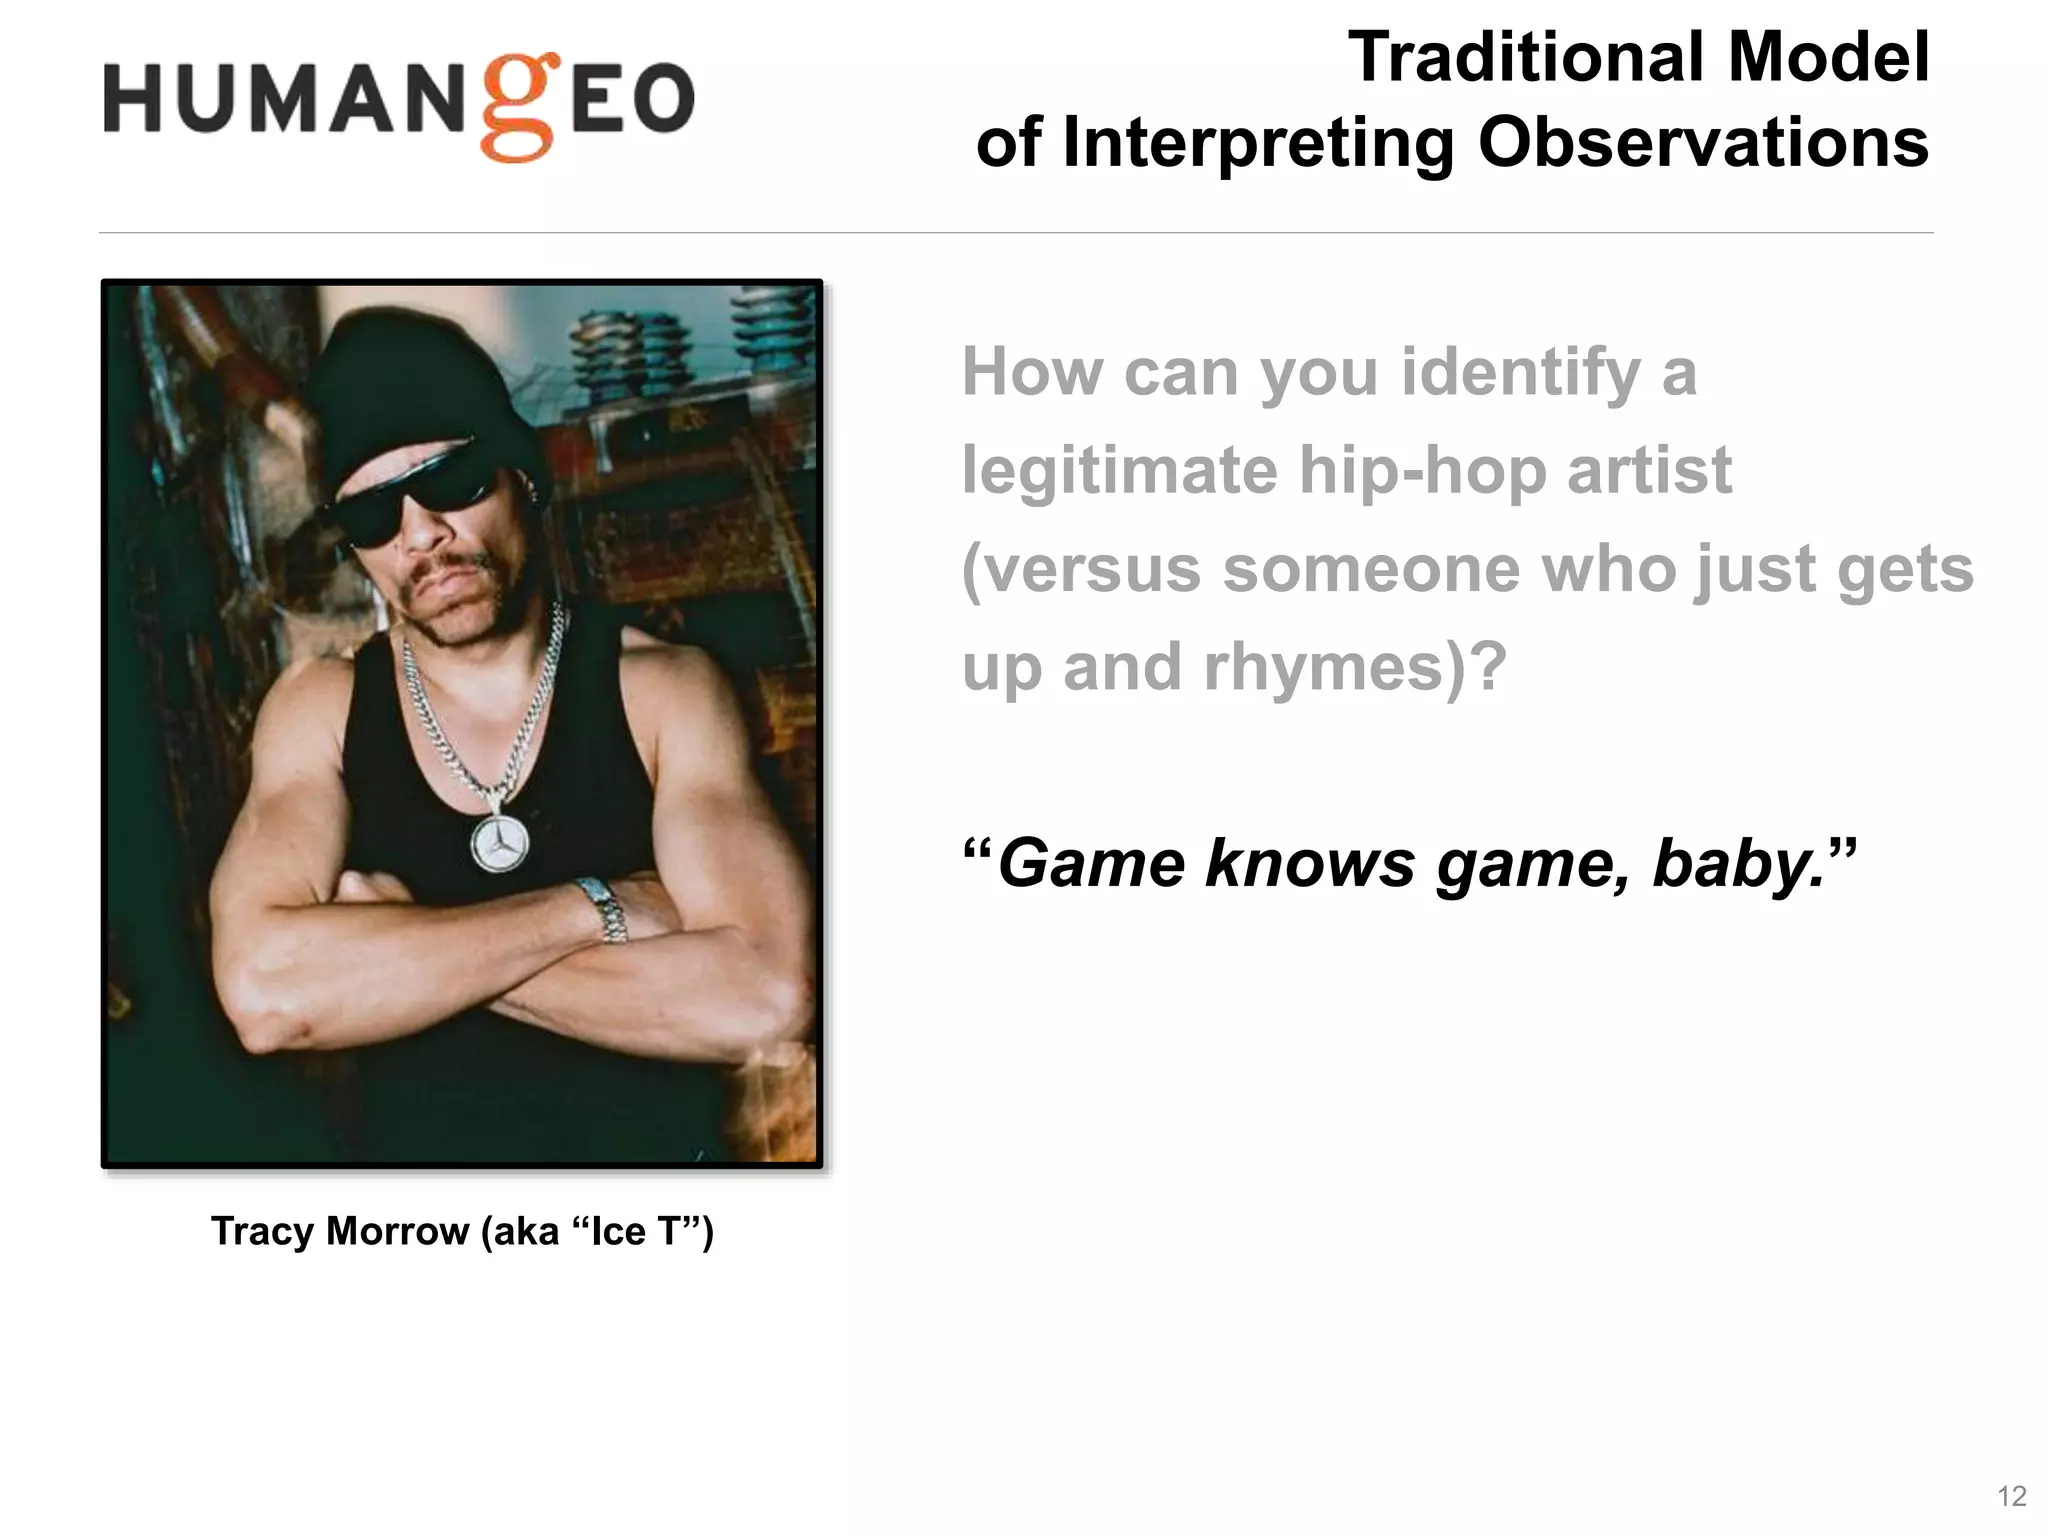
Tracy Morrow (aka “Ice T”)
Traditional Model
of Interpreting Observations
How can you identify a
legitimate hip-hop artist
(versus someone who just gets
up and rhymes)?
“If you have expert knowledge,
then you are capable of
answering complex questions
by interpreting domain specific
information.” [paraphrased]](https://image.slidesharecdn.com/20141010bigdatasocialsciencev2-141010031930-conversion-gate02/75/Big-Data-and-the-Social-Sciences-13-2048.jpg)


![13
Tracy Morrow (aka “Ice T”)
Traditional Model
of Interpreting Observations
How can you identify a
legitimate hip-hop artist
(versus someone who just gets
up and rhymes)?
“If you have expert knowledge,
then you are capable of
answering complex questions
by interpreting domain specific
information.” [paraphrased]](https://crownmelresort.com/image.slidesharecdn.com/20141010bigdatasocialsciencev2-141010031930-conversion-gate02/75/Big-Data-and-the-Social-Sciences-13-2048.jpg)


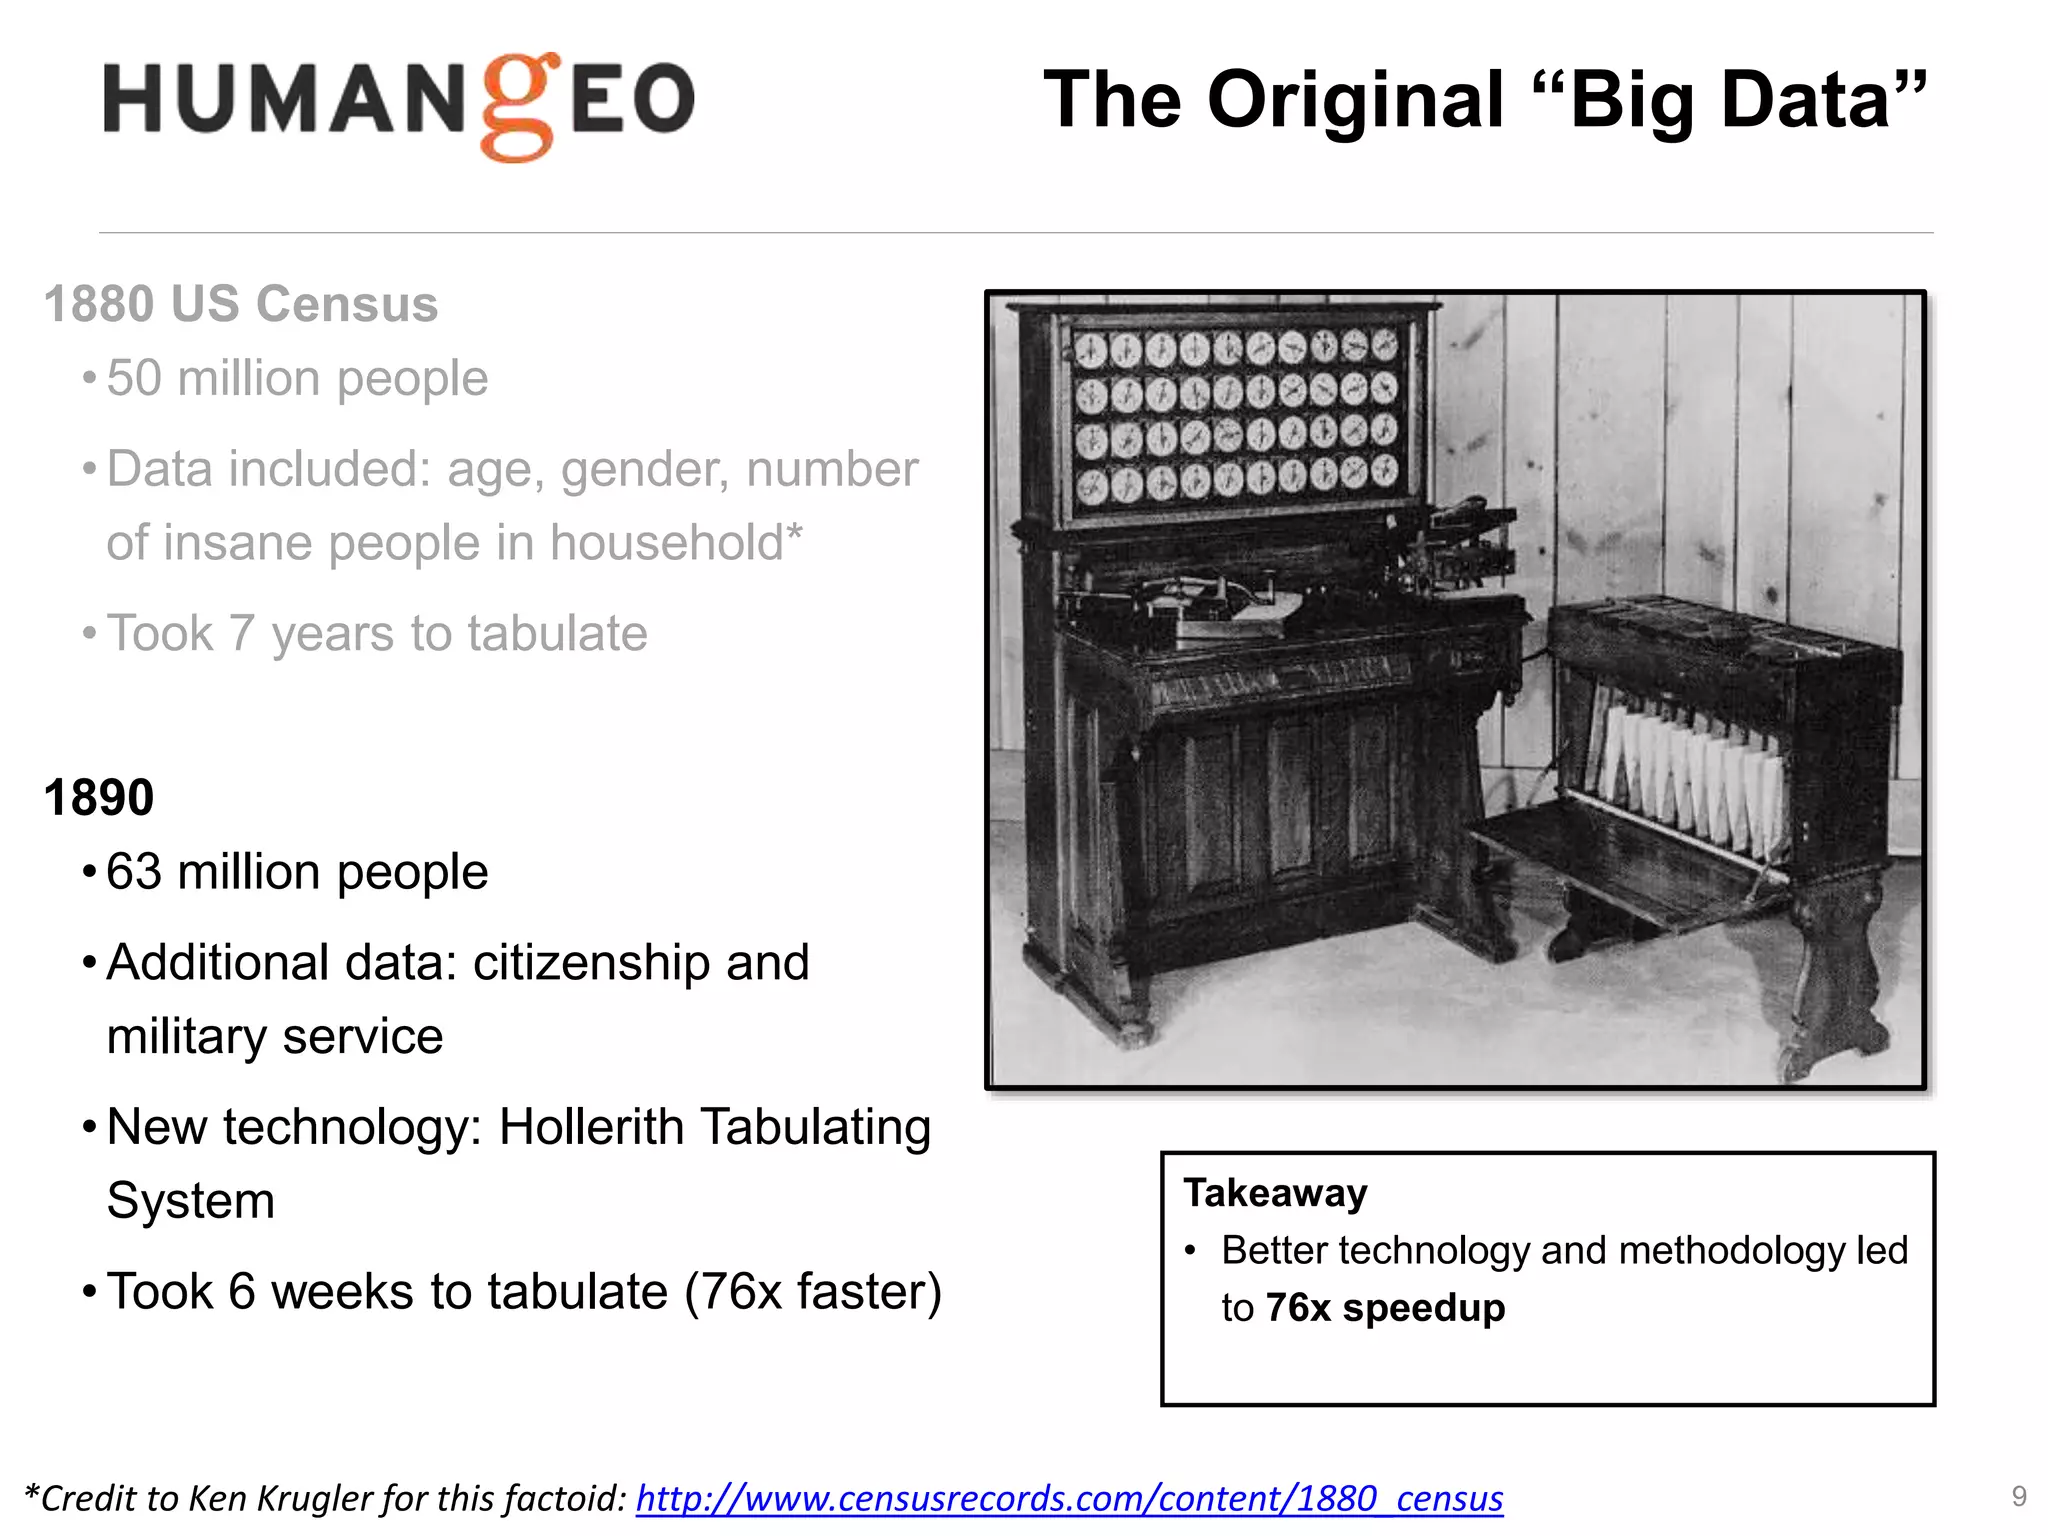
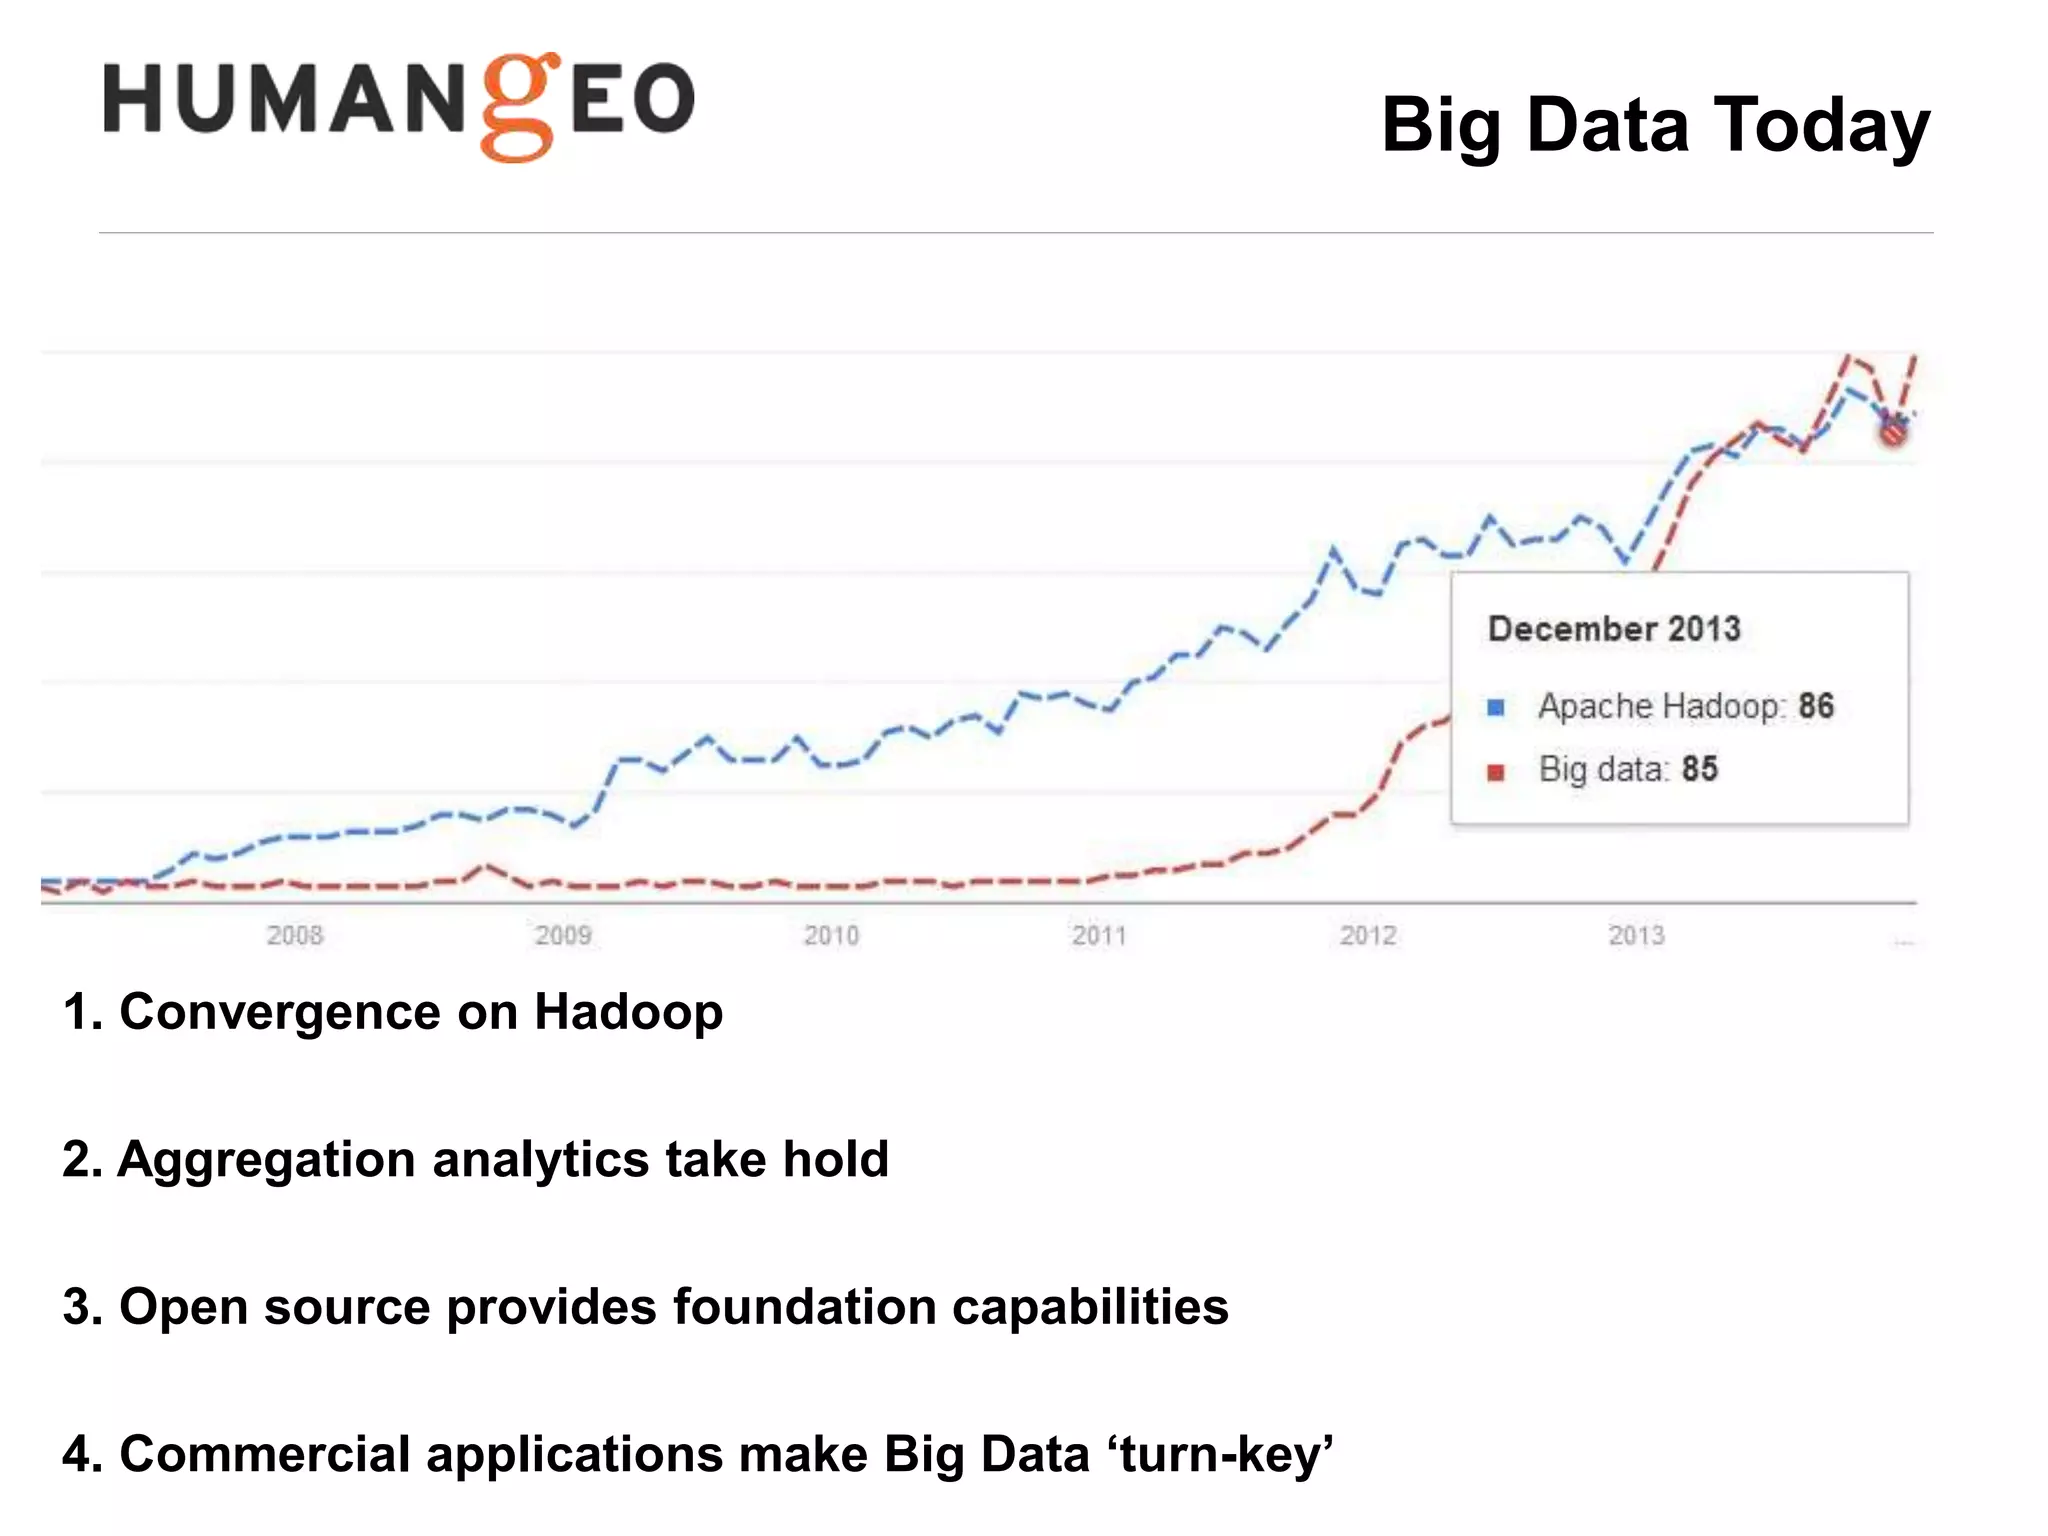
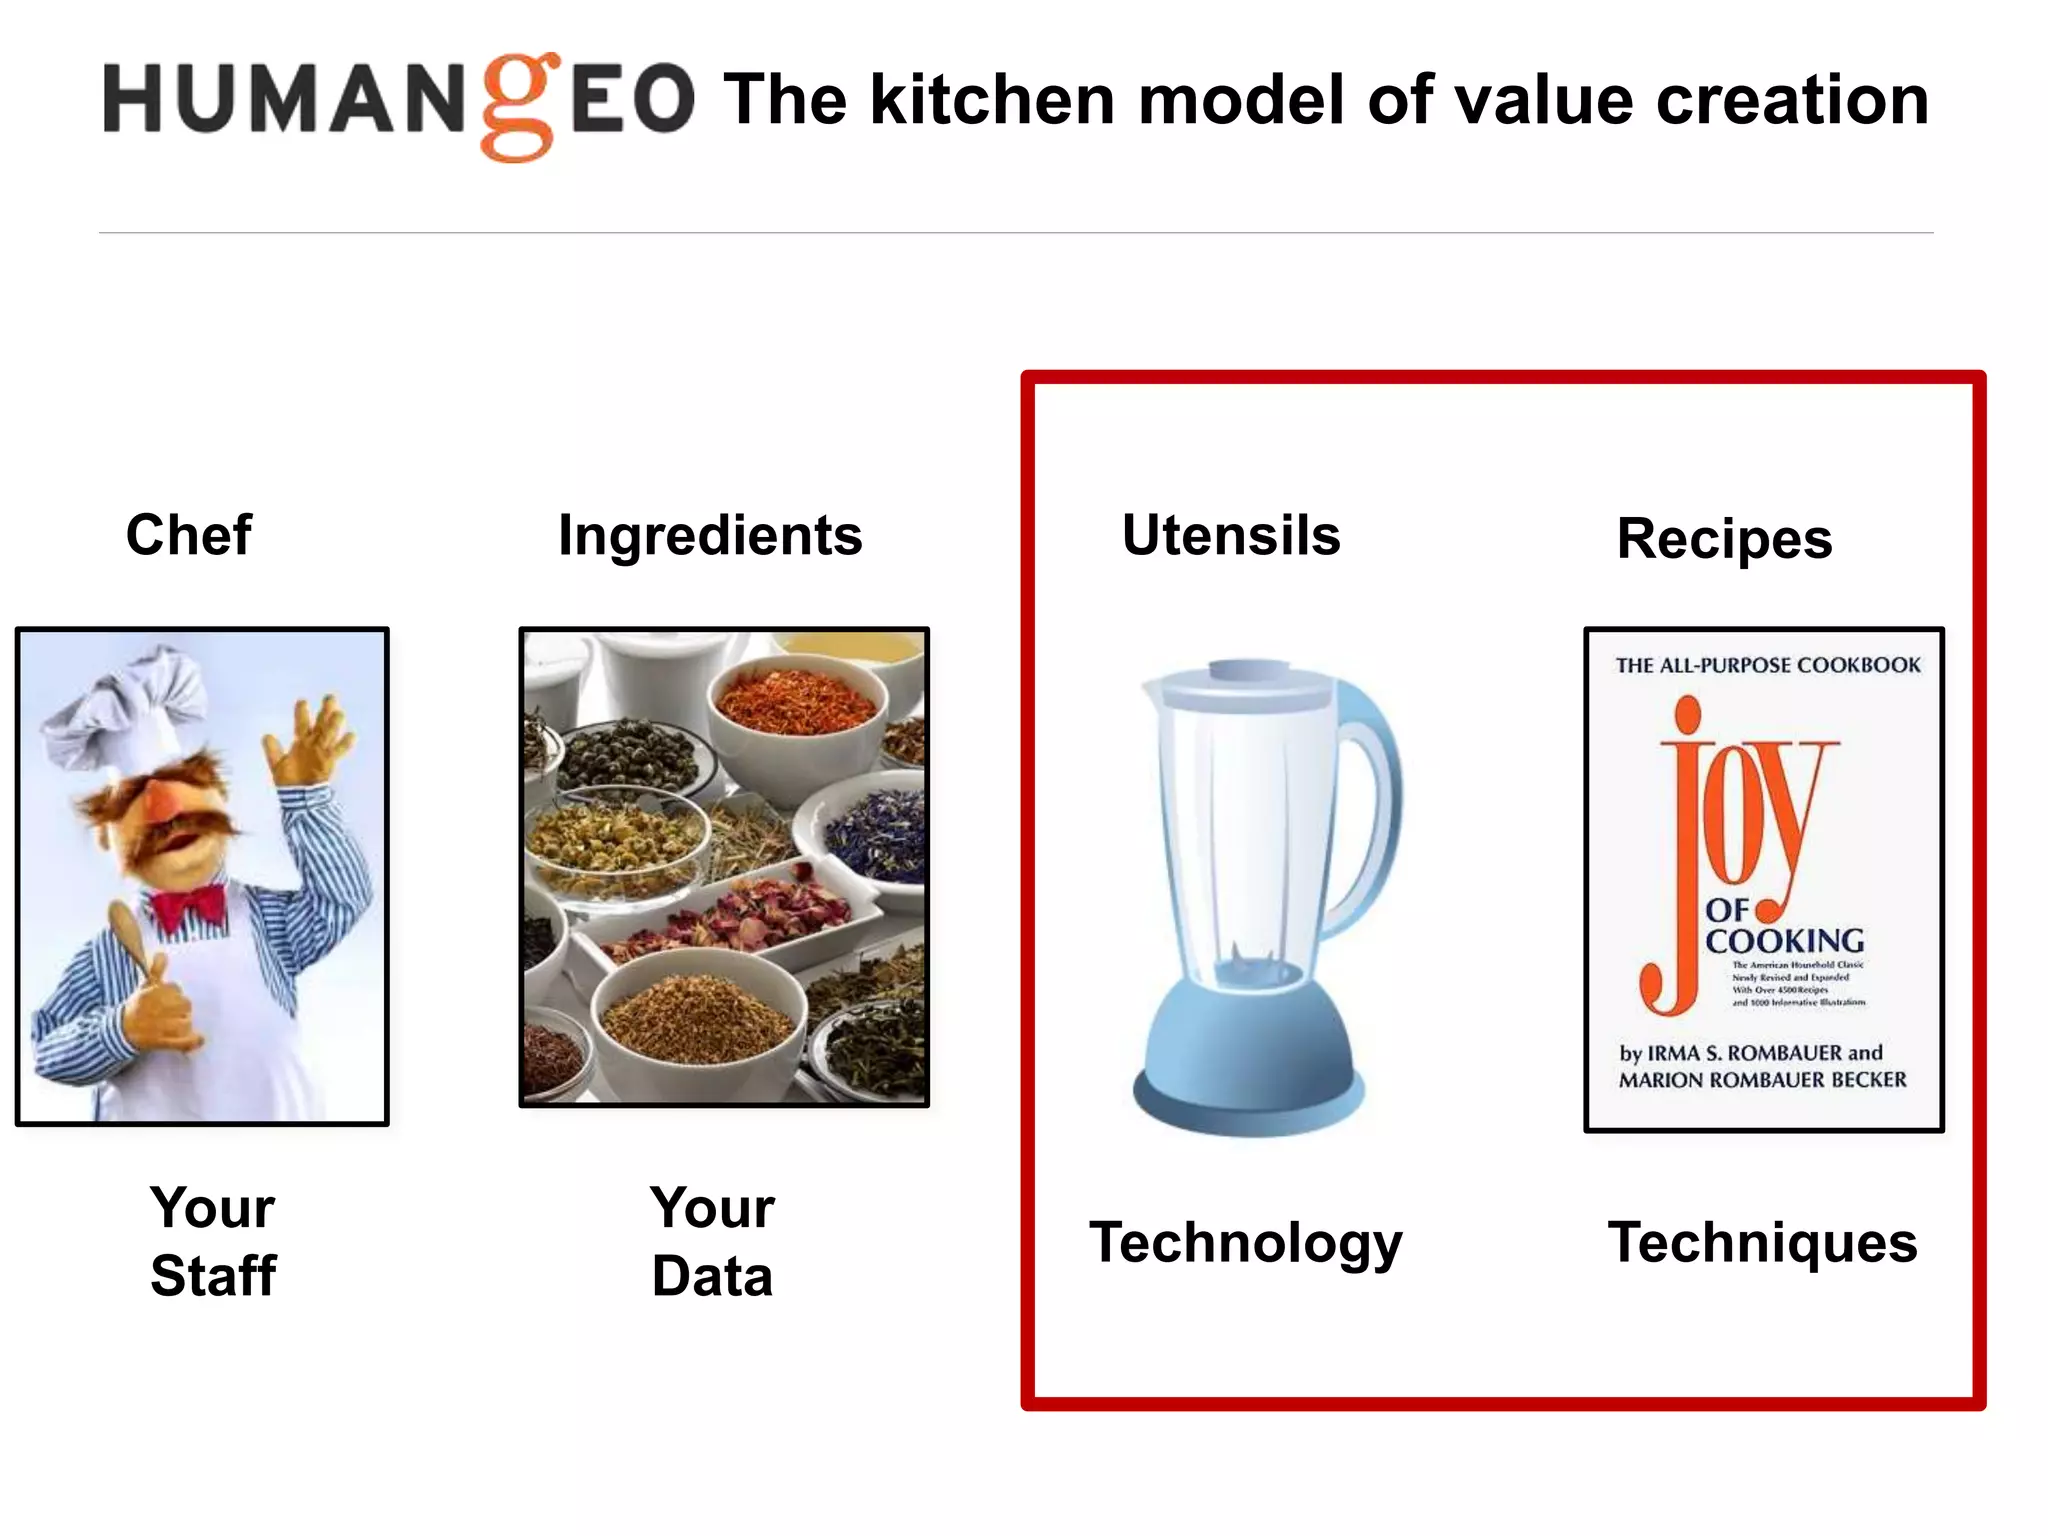
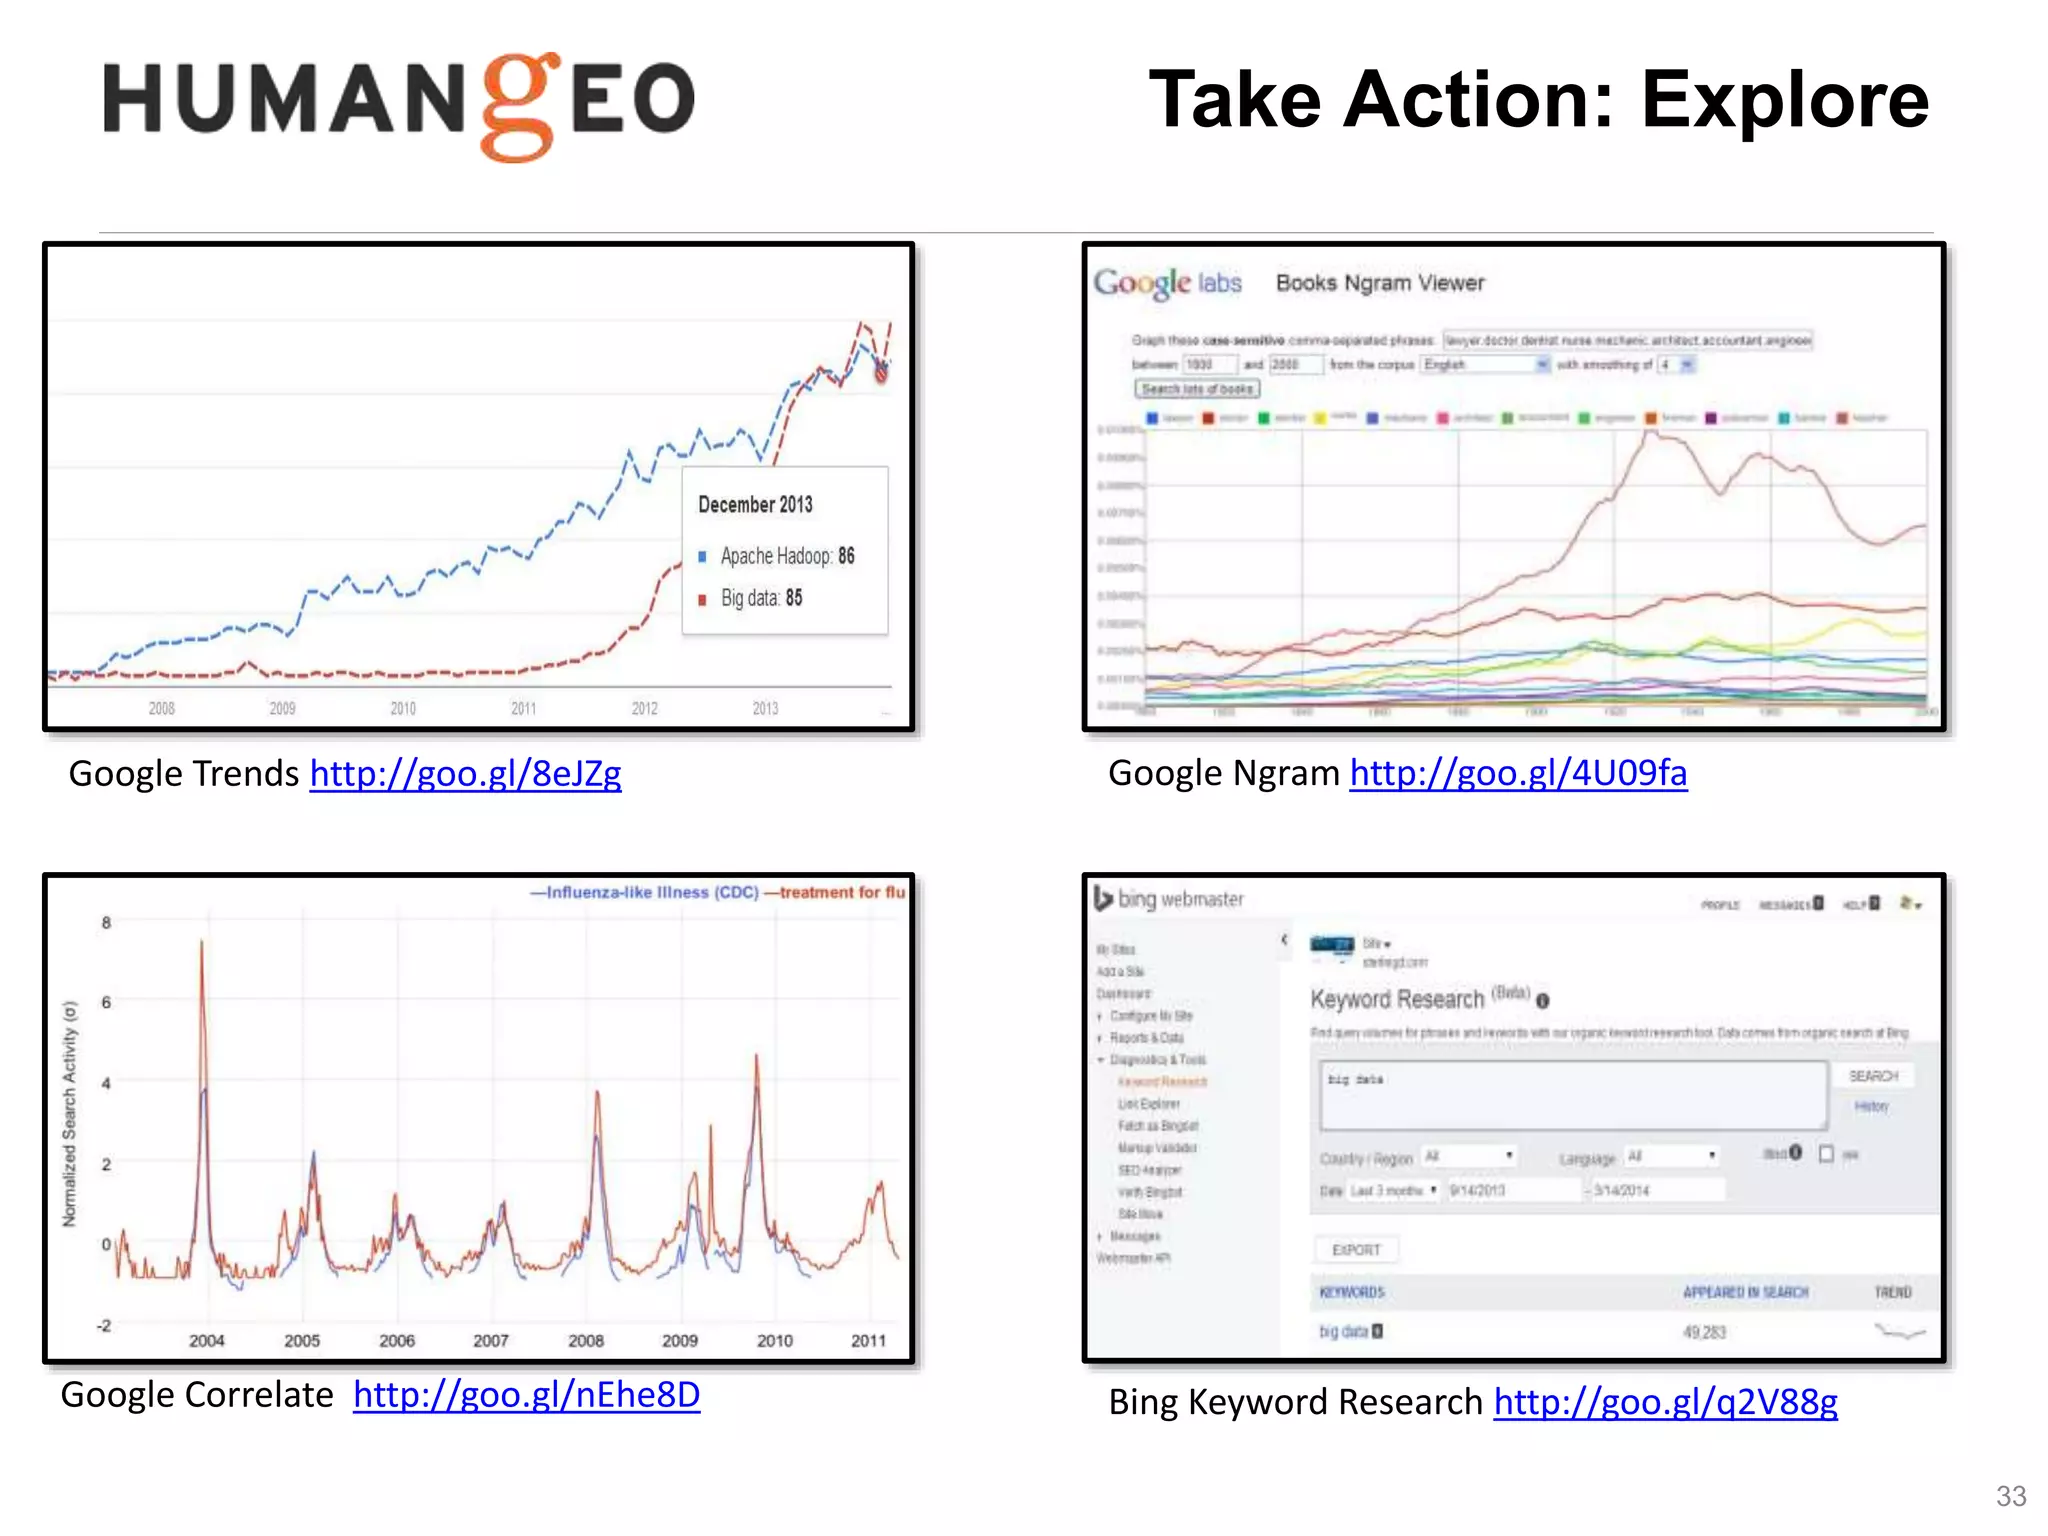
The document outlines a lecture by Abe Usher on the intersection of big data technology and social sciences, emphasizing the importance of understanding data generation, new methodologies for data analysis, and leveraging large datasets for insights. It discusses historical context, modern data sources, and the potential implications for social science research, including the roles of aggregation, visualization, and correlation in interpreting big data. Key takeaways highlight the necessity of adapting traditional analysis methods to harness the growing volume and complexity of data in the digital age.


![[Redis Released]- FalkorDB - Redis + Graph Agentic Memory’s Secret Sauce](https://cdn.slidesharecdn.com/ss_thumbnails/redisreleased-falkordbslidedeck-1125-251115194922-e1c0046b-thumbnail.jpg?width=640&height=640&fit=bounds)


