Download to read offline
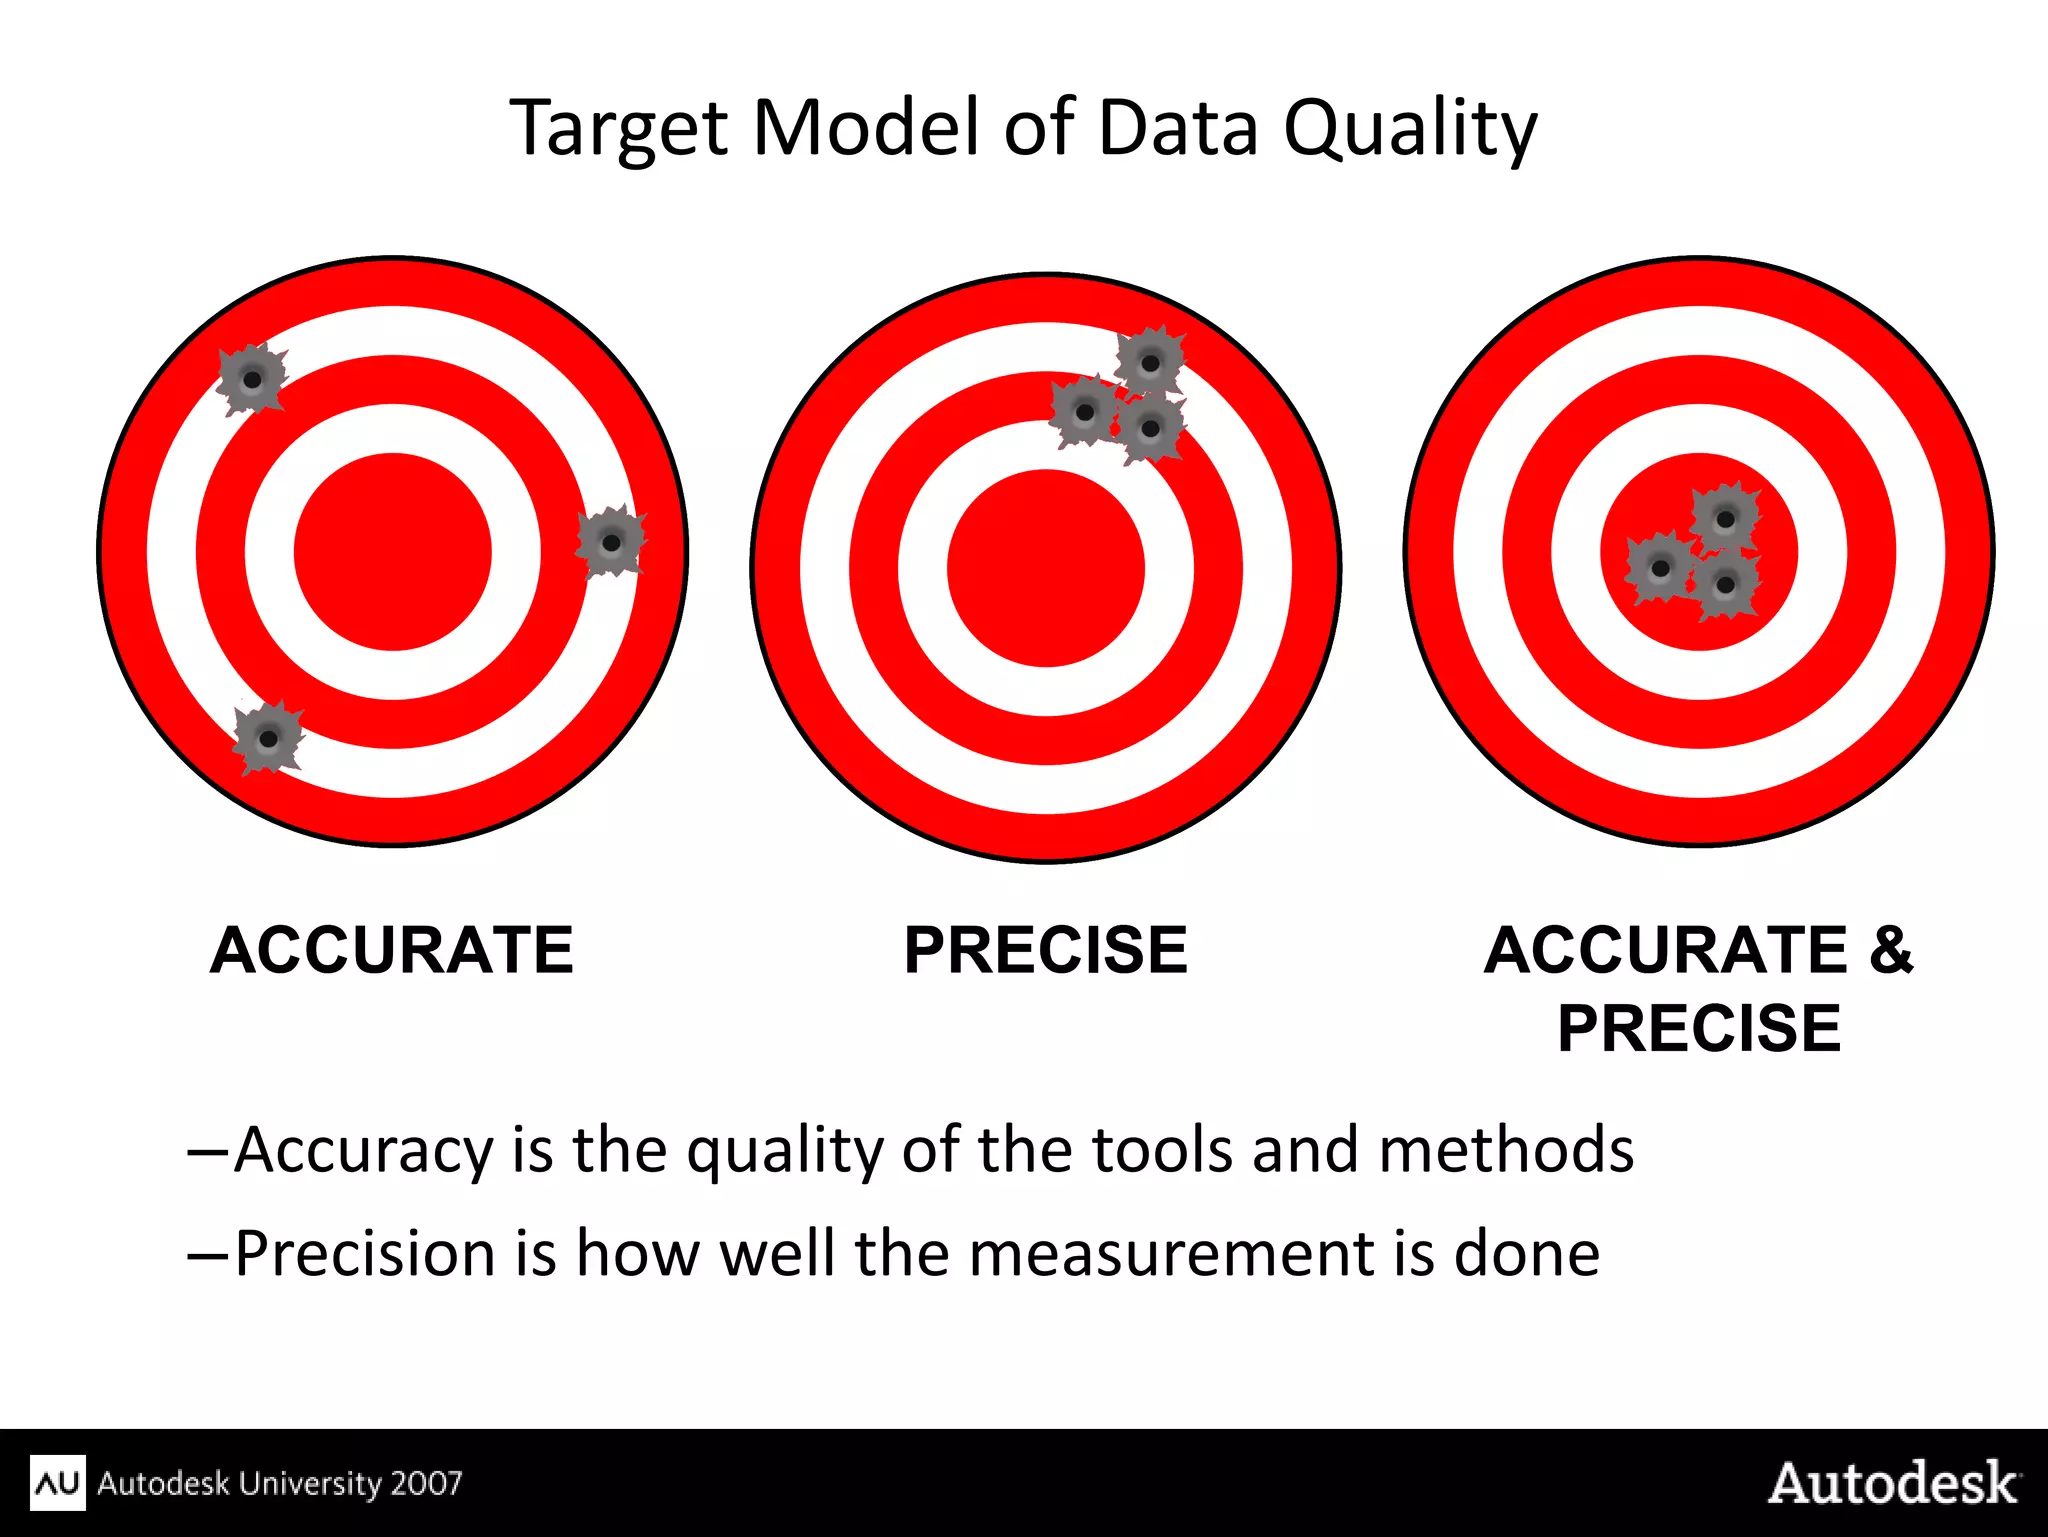
![Accuracy and Precision
"Accuracy - closeness of an estimated (e.g., measured or computed)
value to a standard or accepted [true] value of a particular
quantity.”
FGDC-STD-007.1-1998
Precision - in statistics, a measure of the
tendency of a set of random numbers to cluster about a number
determined by
the set.
FGDC-STD-007.1-1998](https://image.slidesharecdn.com/au2007itsnotcadtogisfinal-12737046890394-phpapp02/75/Au-2007-It-S-Not-Cad-To-Gis-Final-8-2048.jpg)


![Accuracy and Precision
"Accuracy - closeness of an estimated (e.g., measured or computed)
value to a standard or accepted [true] value of a particular
quantity.”
FGDC-STD-007.1-1998
Precision - in statistics, a measure of the
tendency of a set of random numbers to cluster about a number
determined by
the set.
FGDC-STD-007.1-1998](https://crownmelresort.com/image.slidesharecdn.com/au2007itsnotcadtogisfinal-12737046890394-phpapp02/75/Au-2007-It-S-Not-Cad-To-Gis-Final-8-2048.jpg)


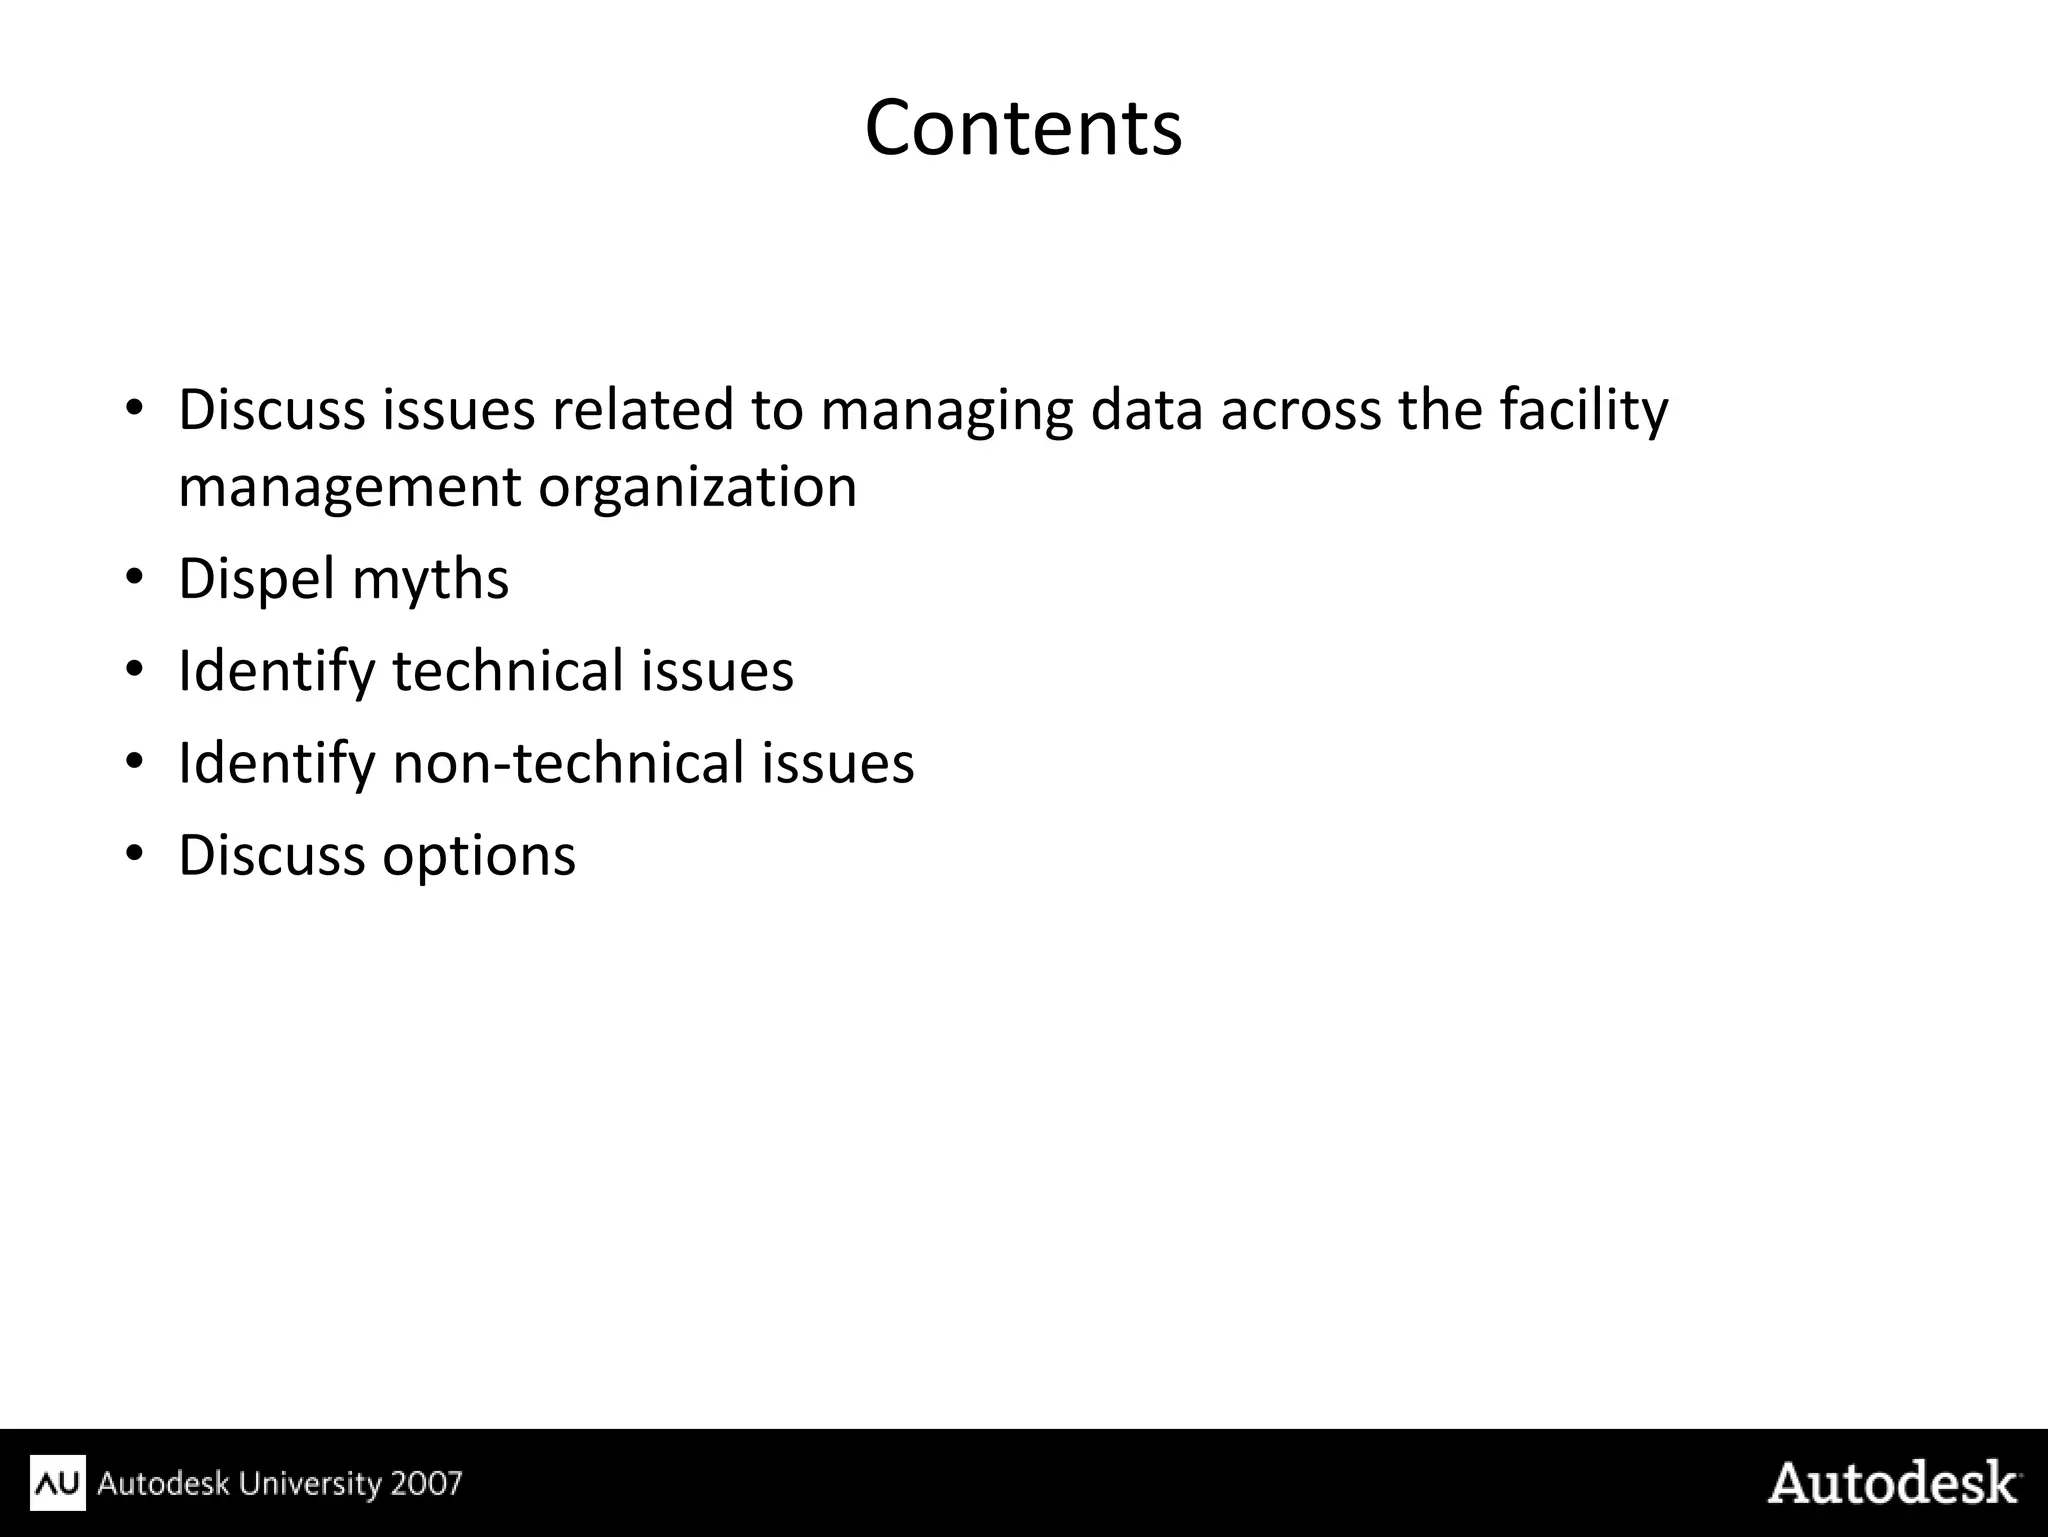
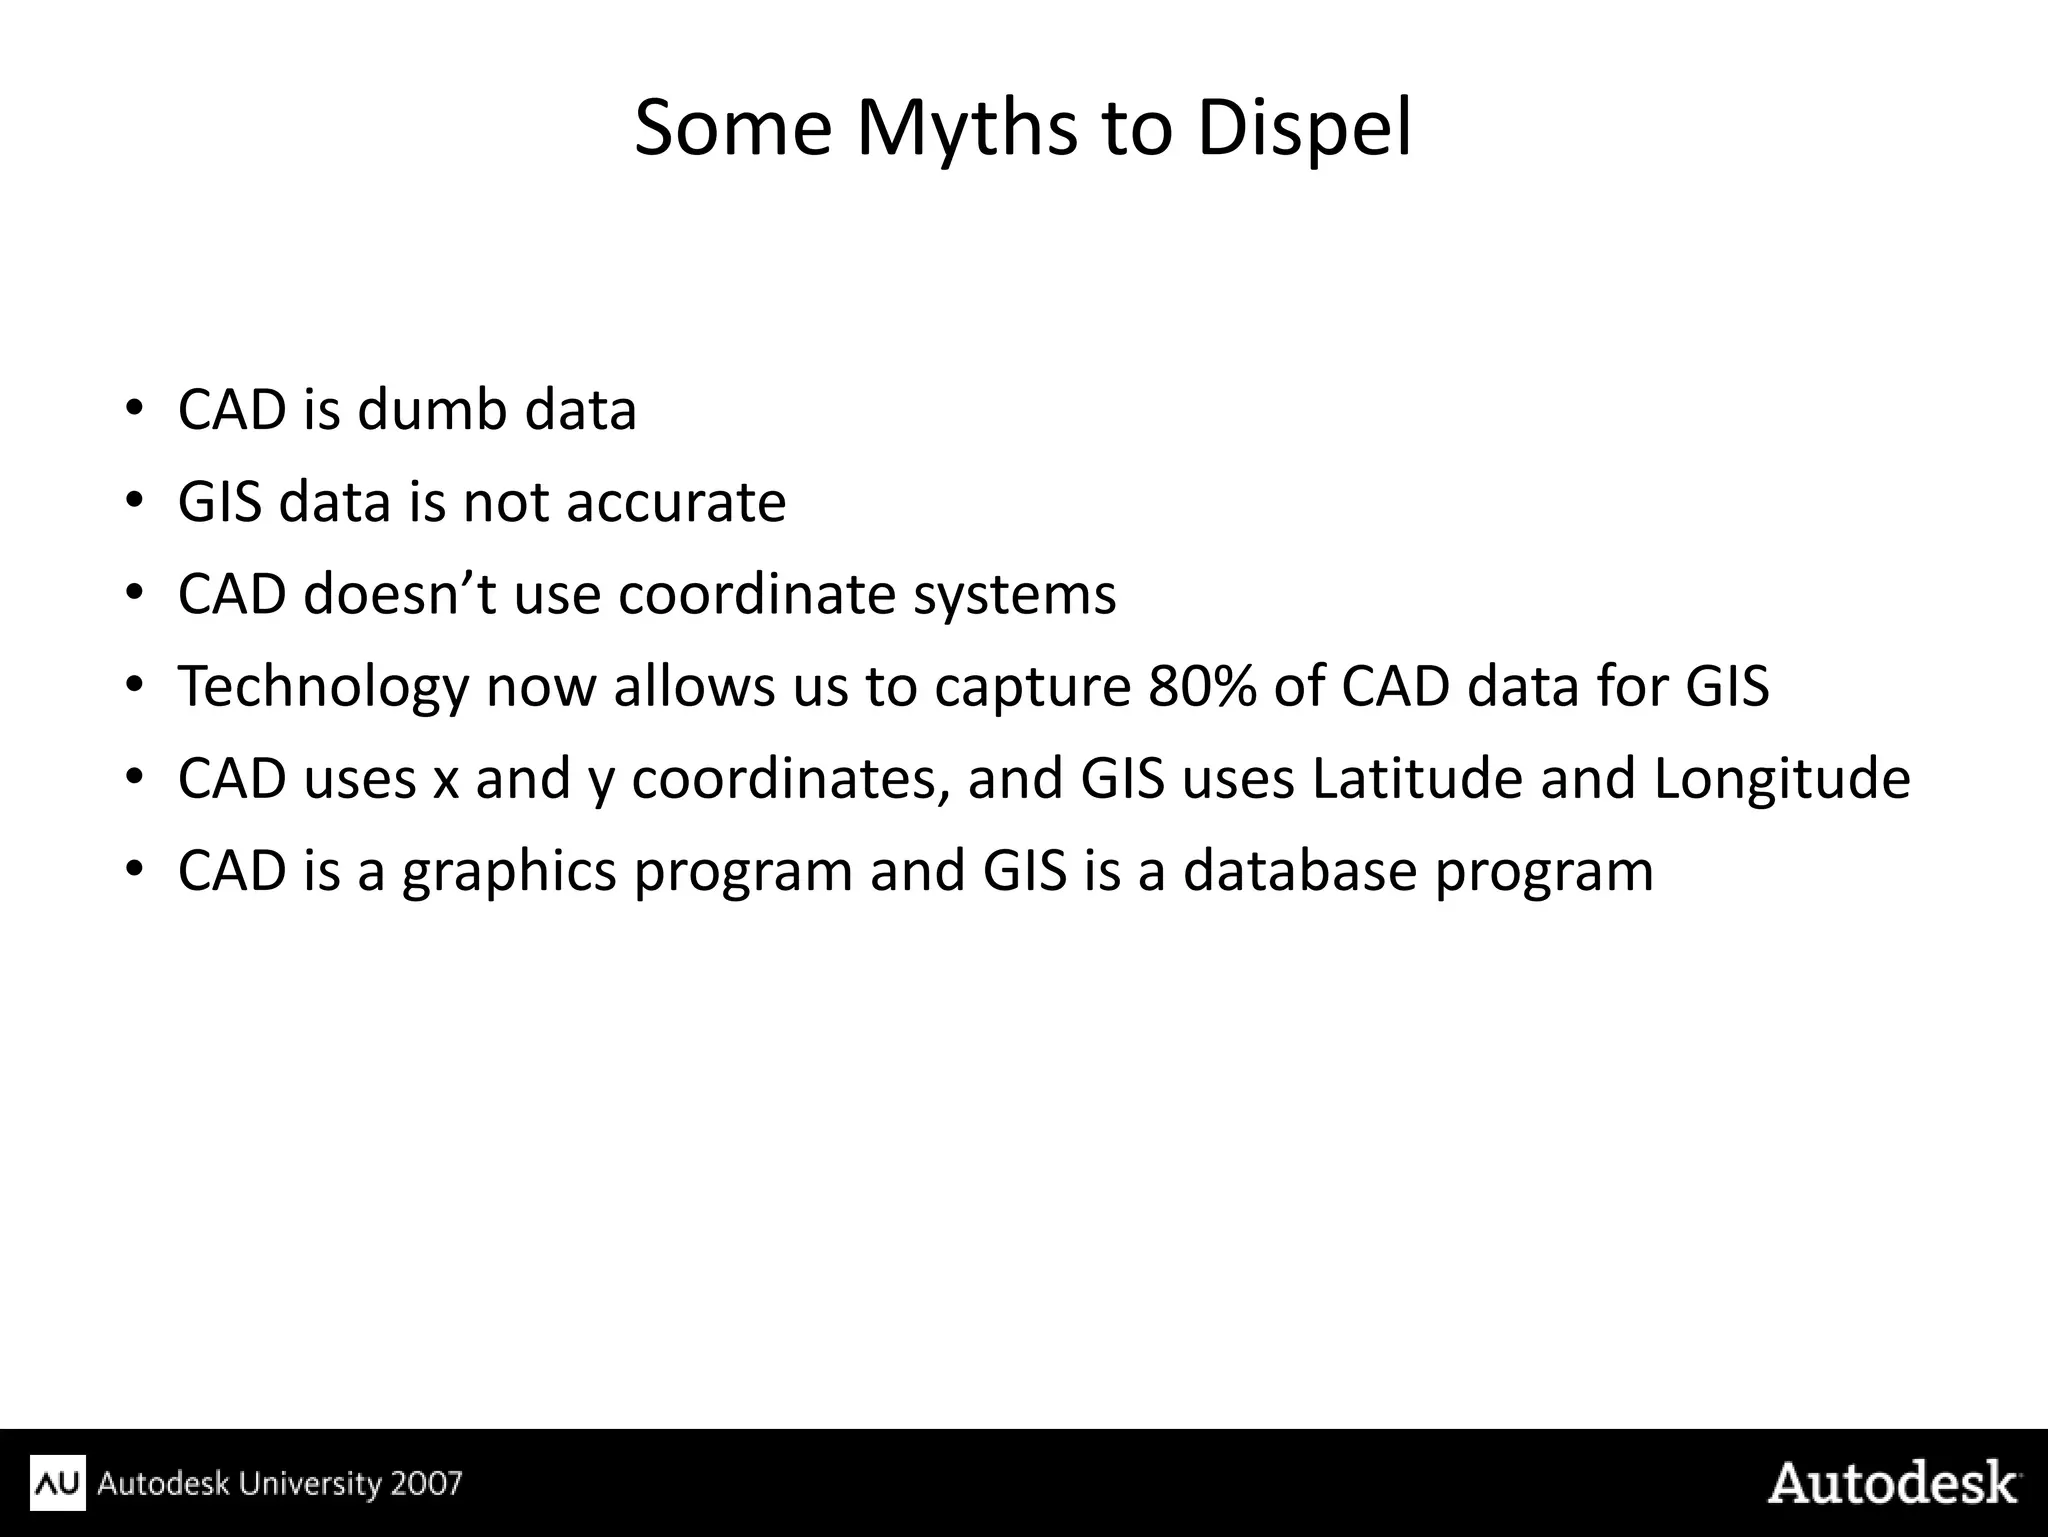
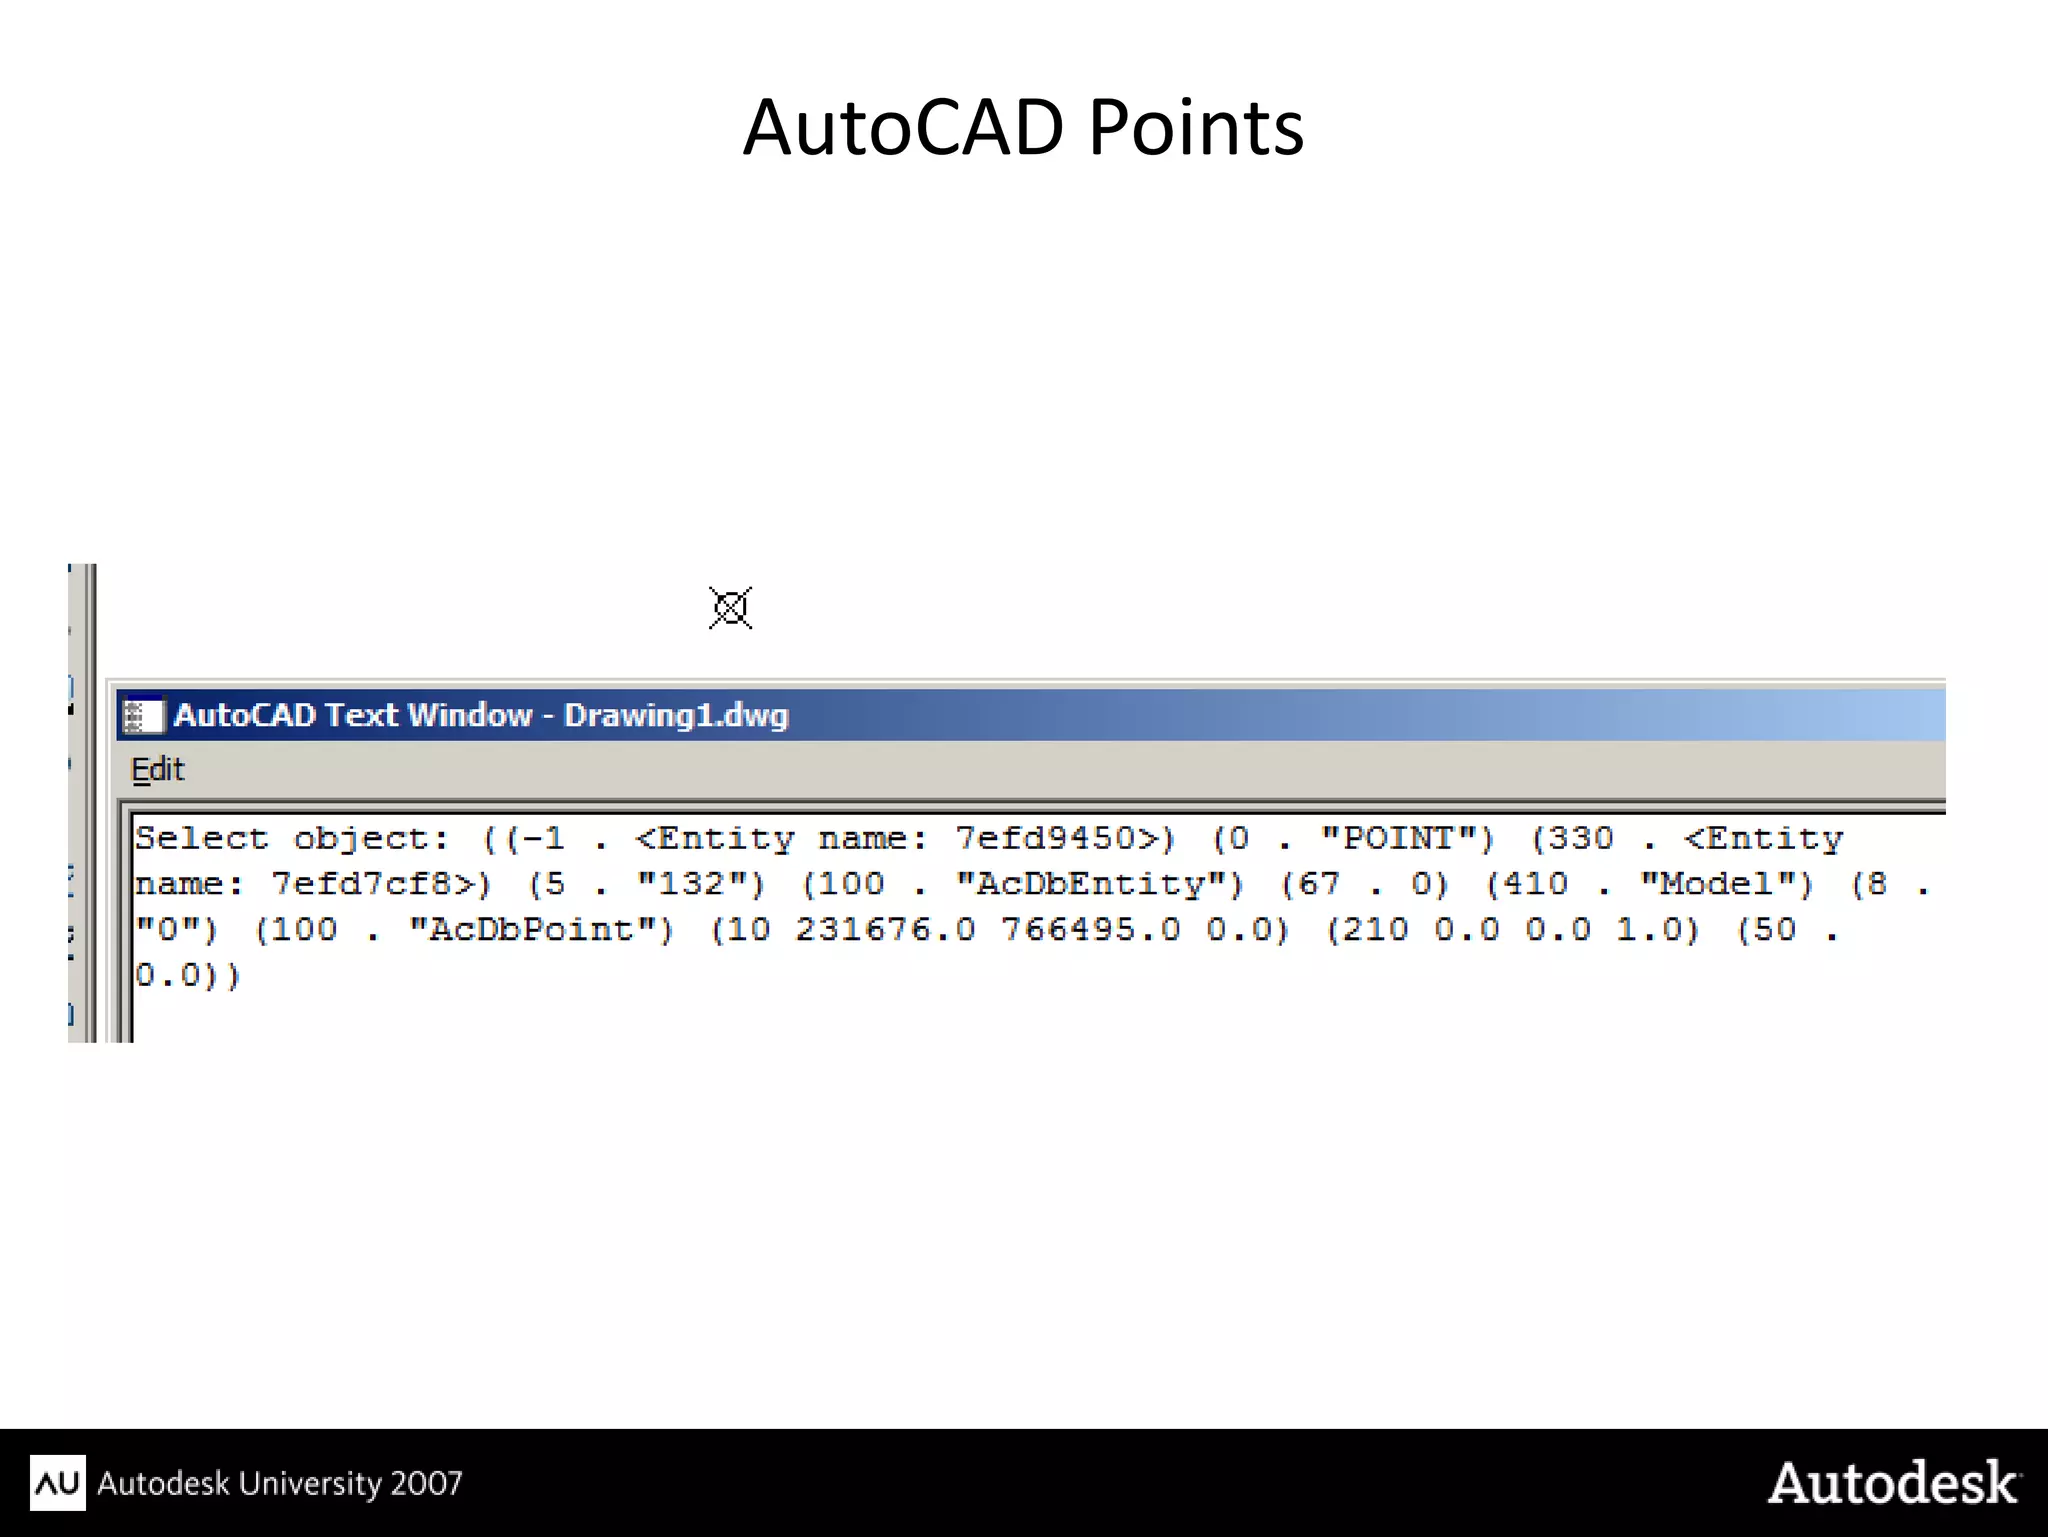
This document discusses issues related to managing data across design and facility management organizations. It aims to dispel myths about CAD and GIS data and identify technical and non-technical integration barriers. While data transfer between CAD and GIS formats is technically possible, the primary barriers are related to how the data is organized and used for different purposes throughout the design and facility management lifecycle. The document recommends focusing on common data requirements and developing standards around layering, symbols, geometry, and attributes to better integrate CAD design data into GIS for facility management.