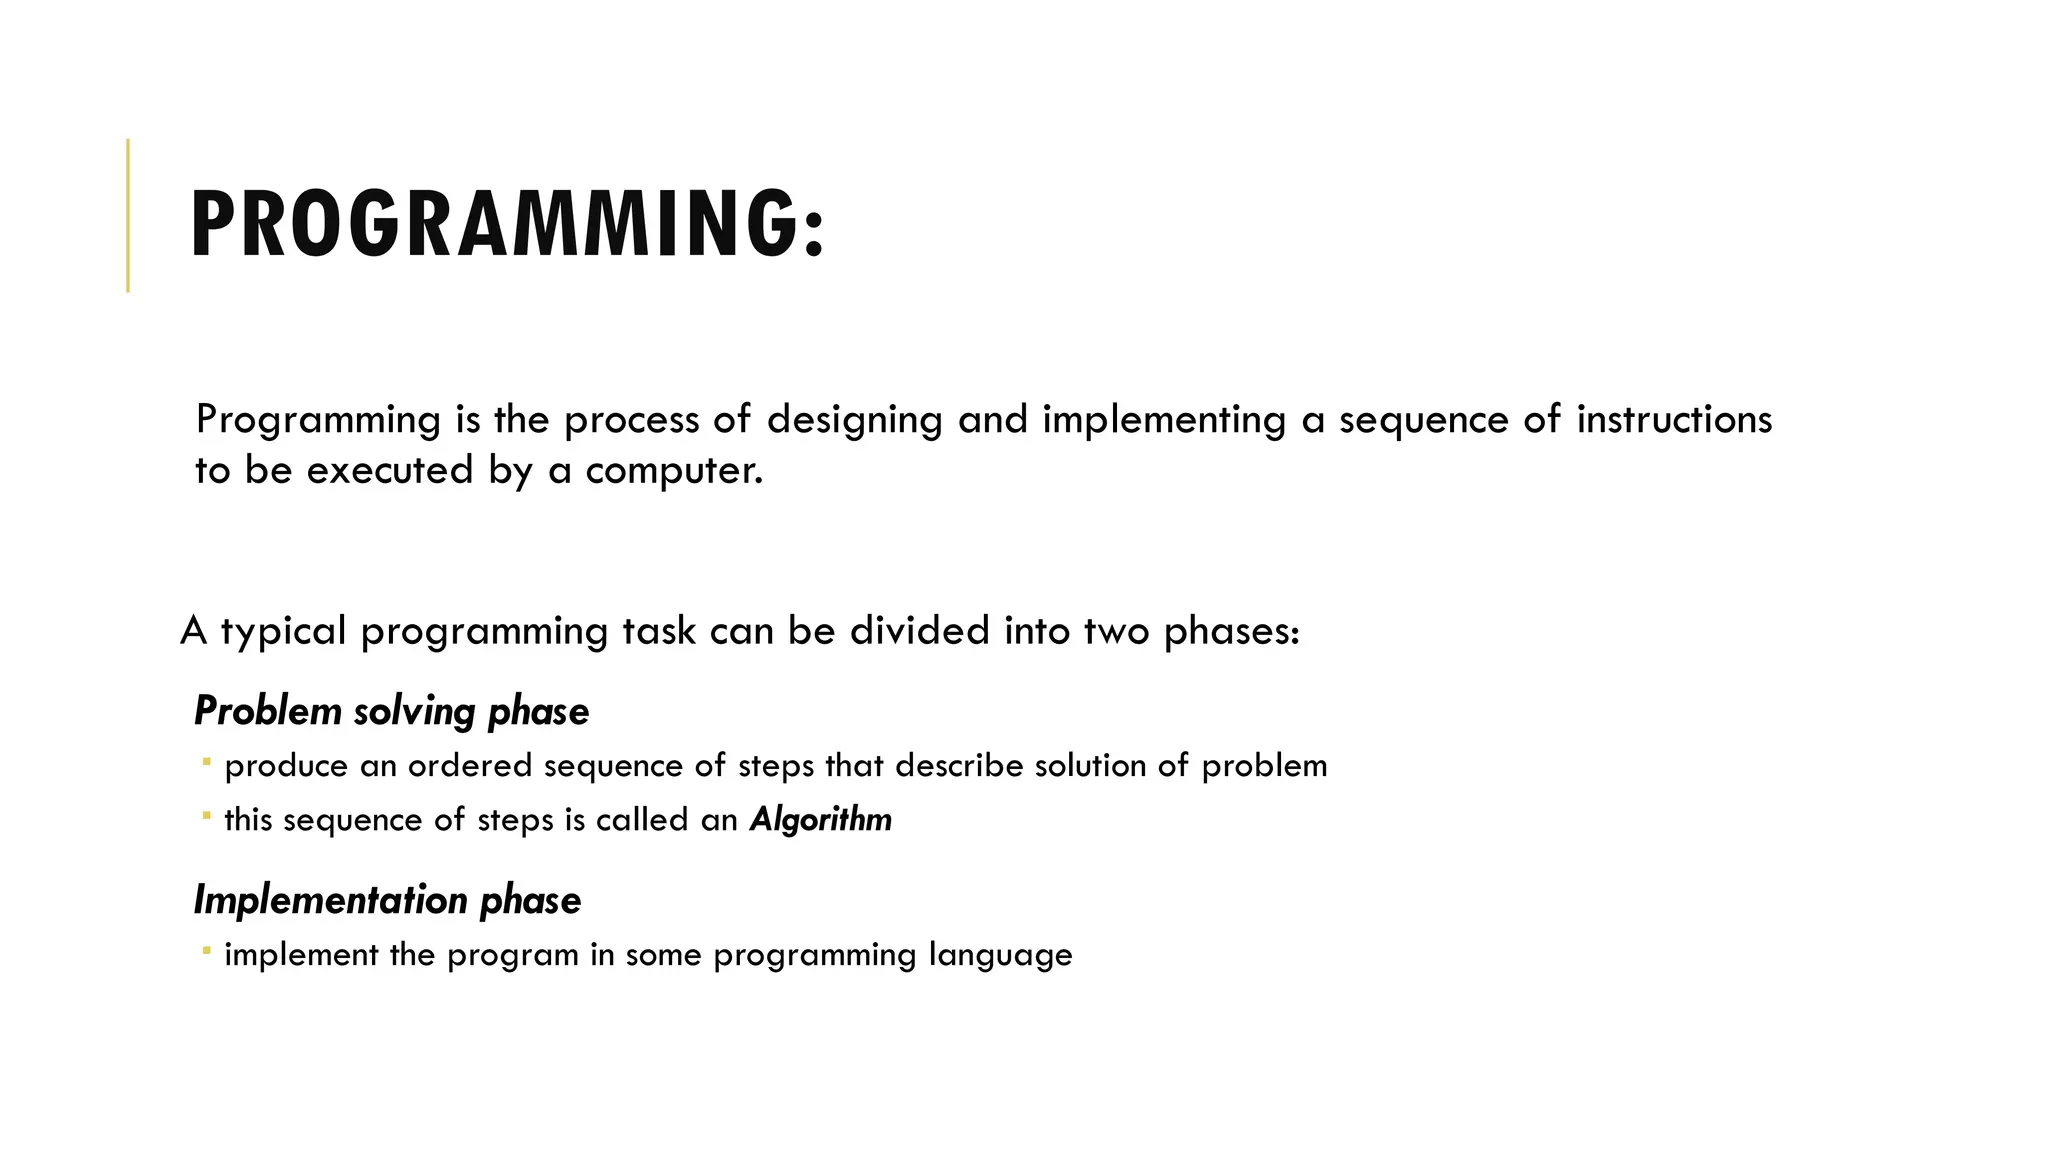
PROGRAMMING:
Programming is theprocess of designing and implementing a sequence of instructions
to be executed by a computer.
A typical programming task can be divided into two phases:
Problem solving phase
produce an ordered sequence of steps that describe solution of problem
this sequence of steps is called an Algorithm
Implementation phase
implement the program in some programming language
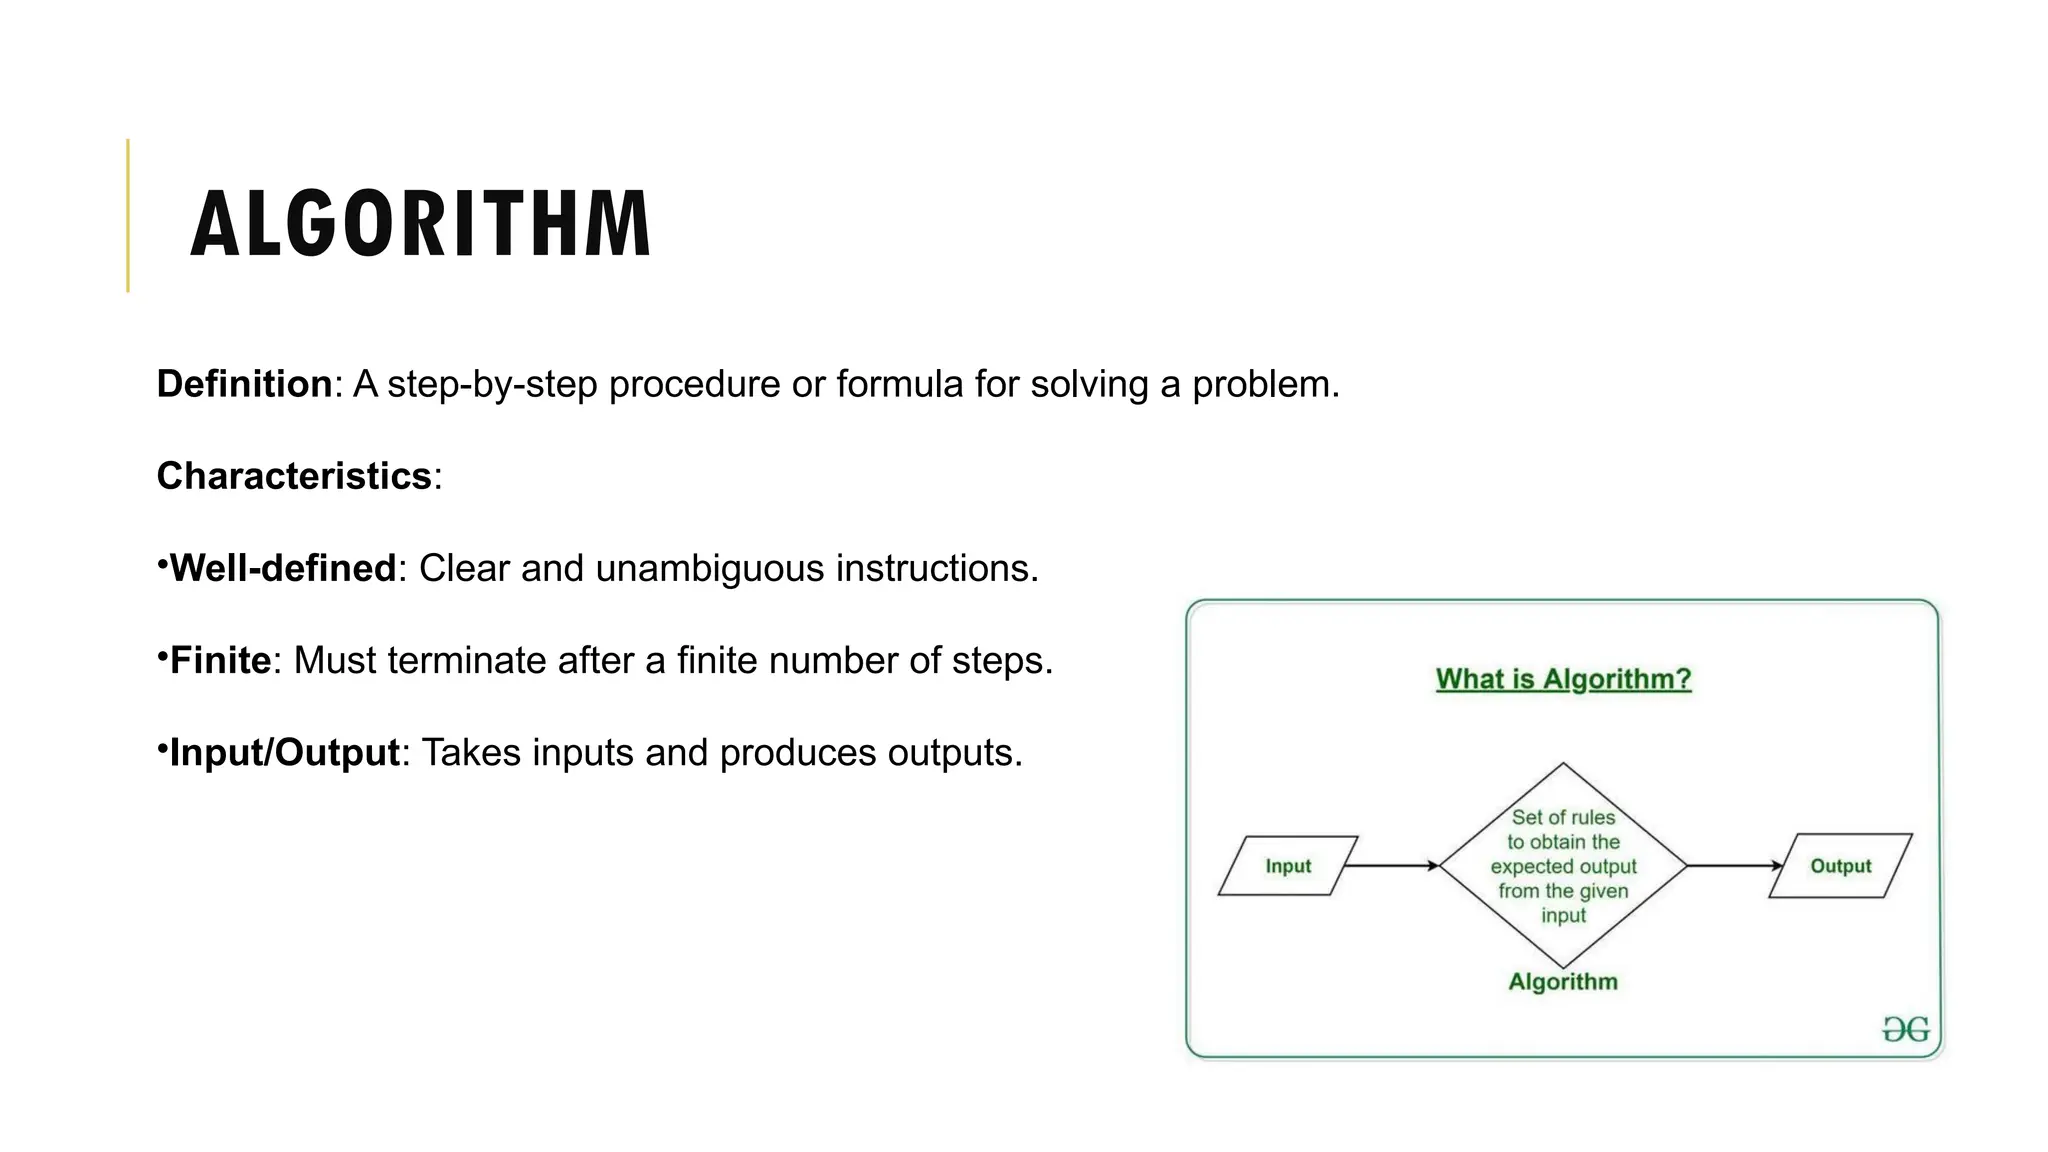
ALGORITHM
Definition: A step-by-stepprocedure or formula for solving a problem.
Characteristics:
•Well-defined: Clear and unambiguous instructions.
•Finite: Must terminate after a finite number of steps.
•Input/Output: Takes inputs and produces outputs.
6.
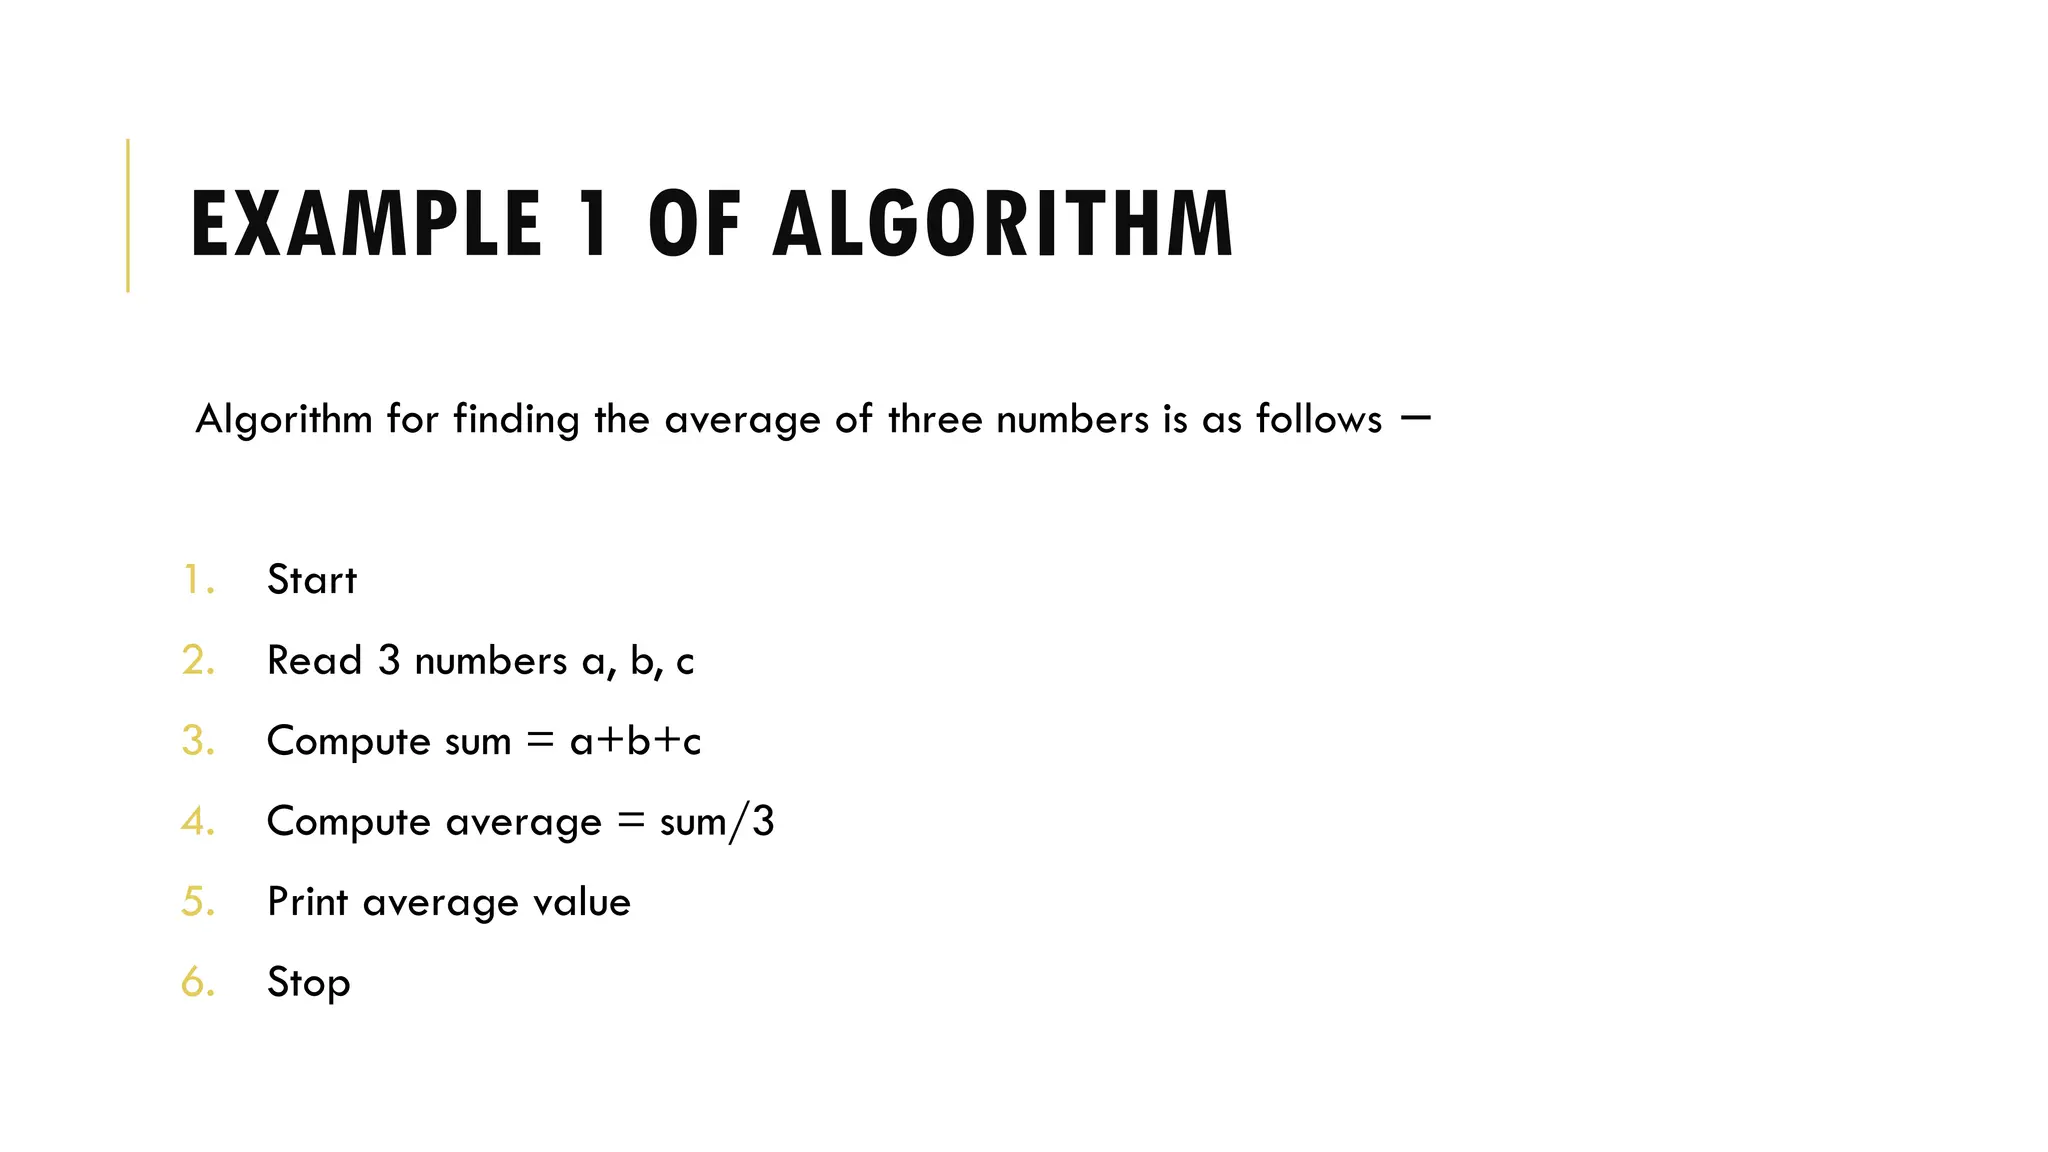
EXAMPLE 1 OFALGORITHM
Algorithm for finding the average of three numbers is as follows −
1. Start
2. Read 3 numbers a, b, c
3. Compute sum = a+b+c
4. Compute average = sum/3
5. Print average value
6. Stop
7.
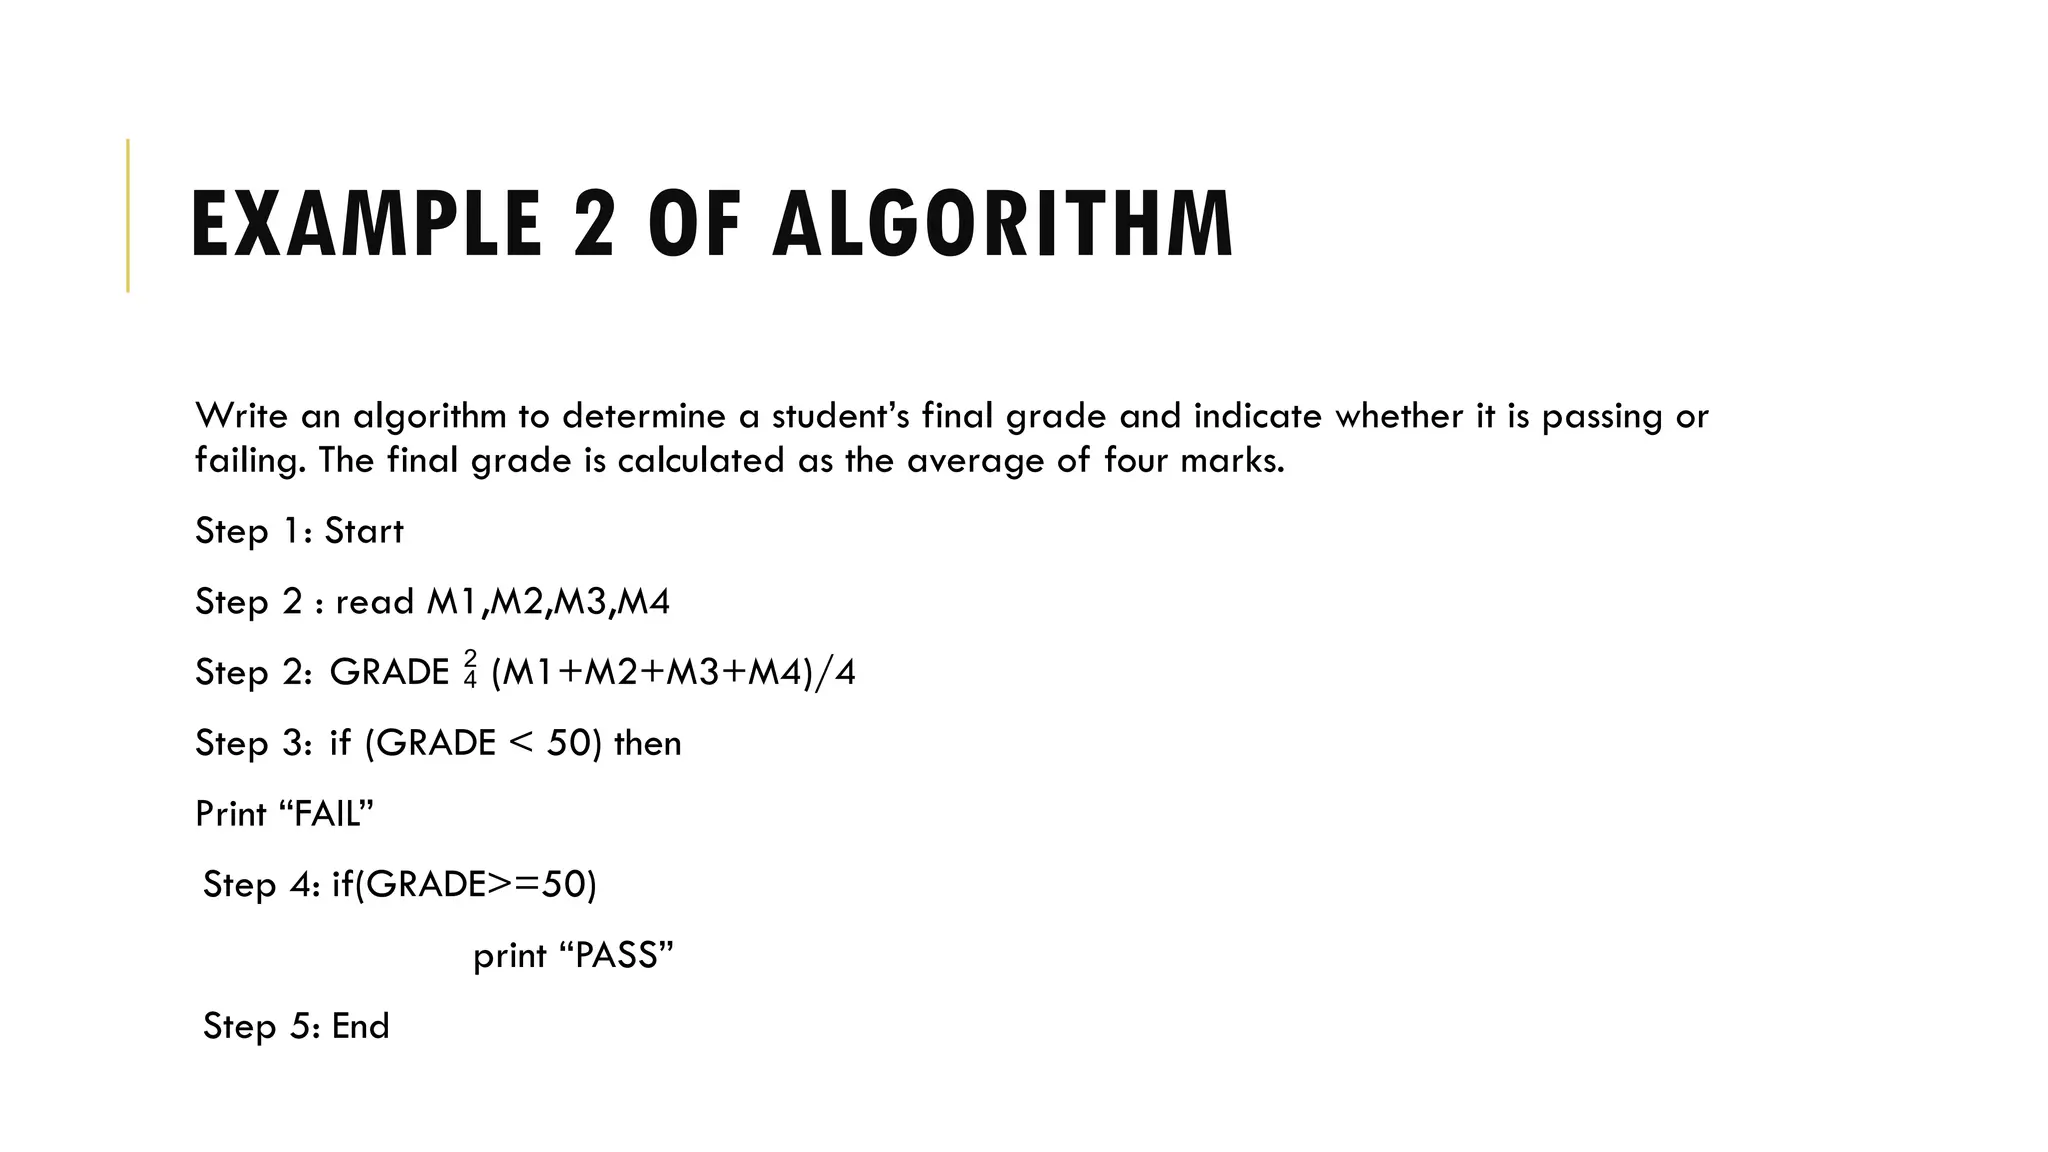
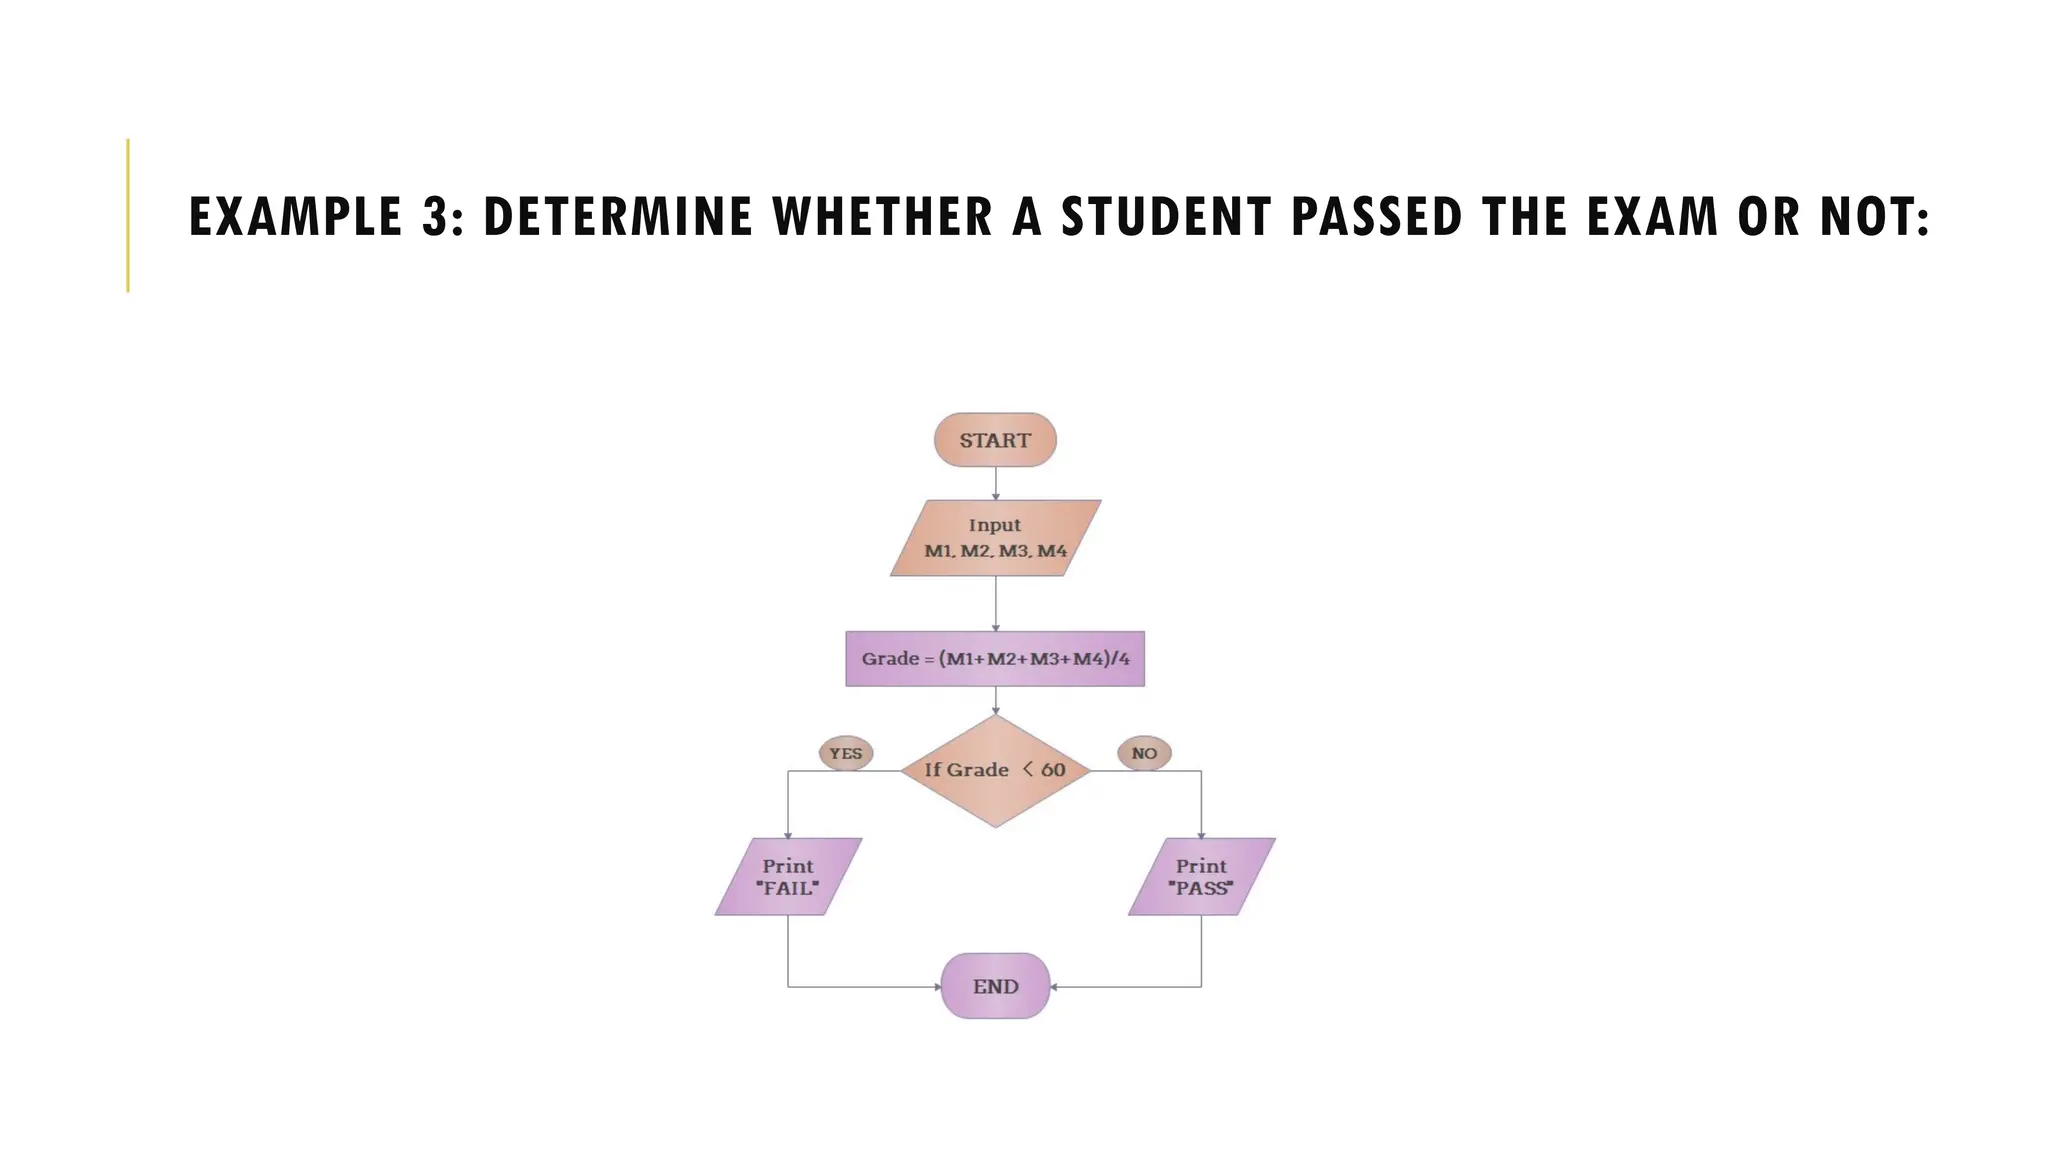
EXAMPLE 2 OFALGORITHM
Write an algorithm to determine a student’s final grade and indicate whether it is passing or
failing. The final grade is calculated as the average of four marks.
Step 1: Start
Step 2 : read M1,M2,M3,M4
Step 2: GRADE (M1+M2+M3+M4)/4
Step 3: if (GRADE < 50) then
Print “FAIL”
Step 4: if(GRADE>=50)
print “PASS”
Step 5: End
8.
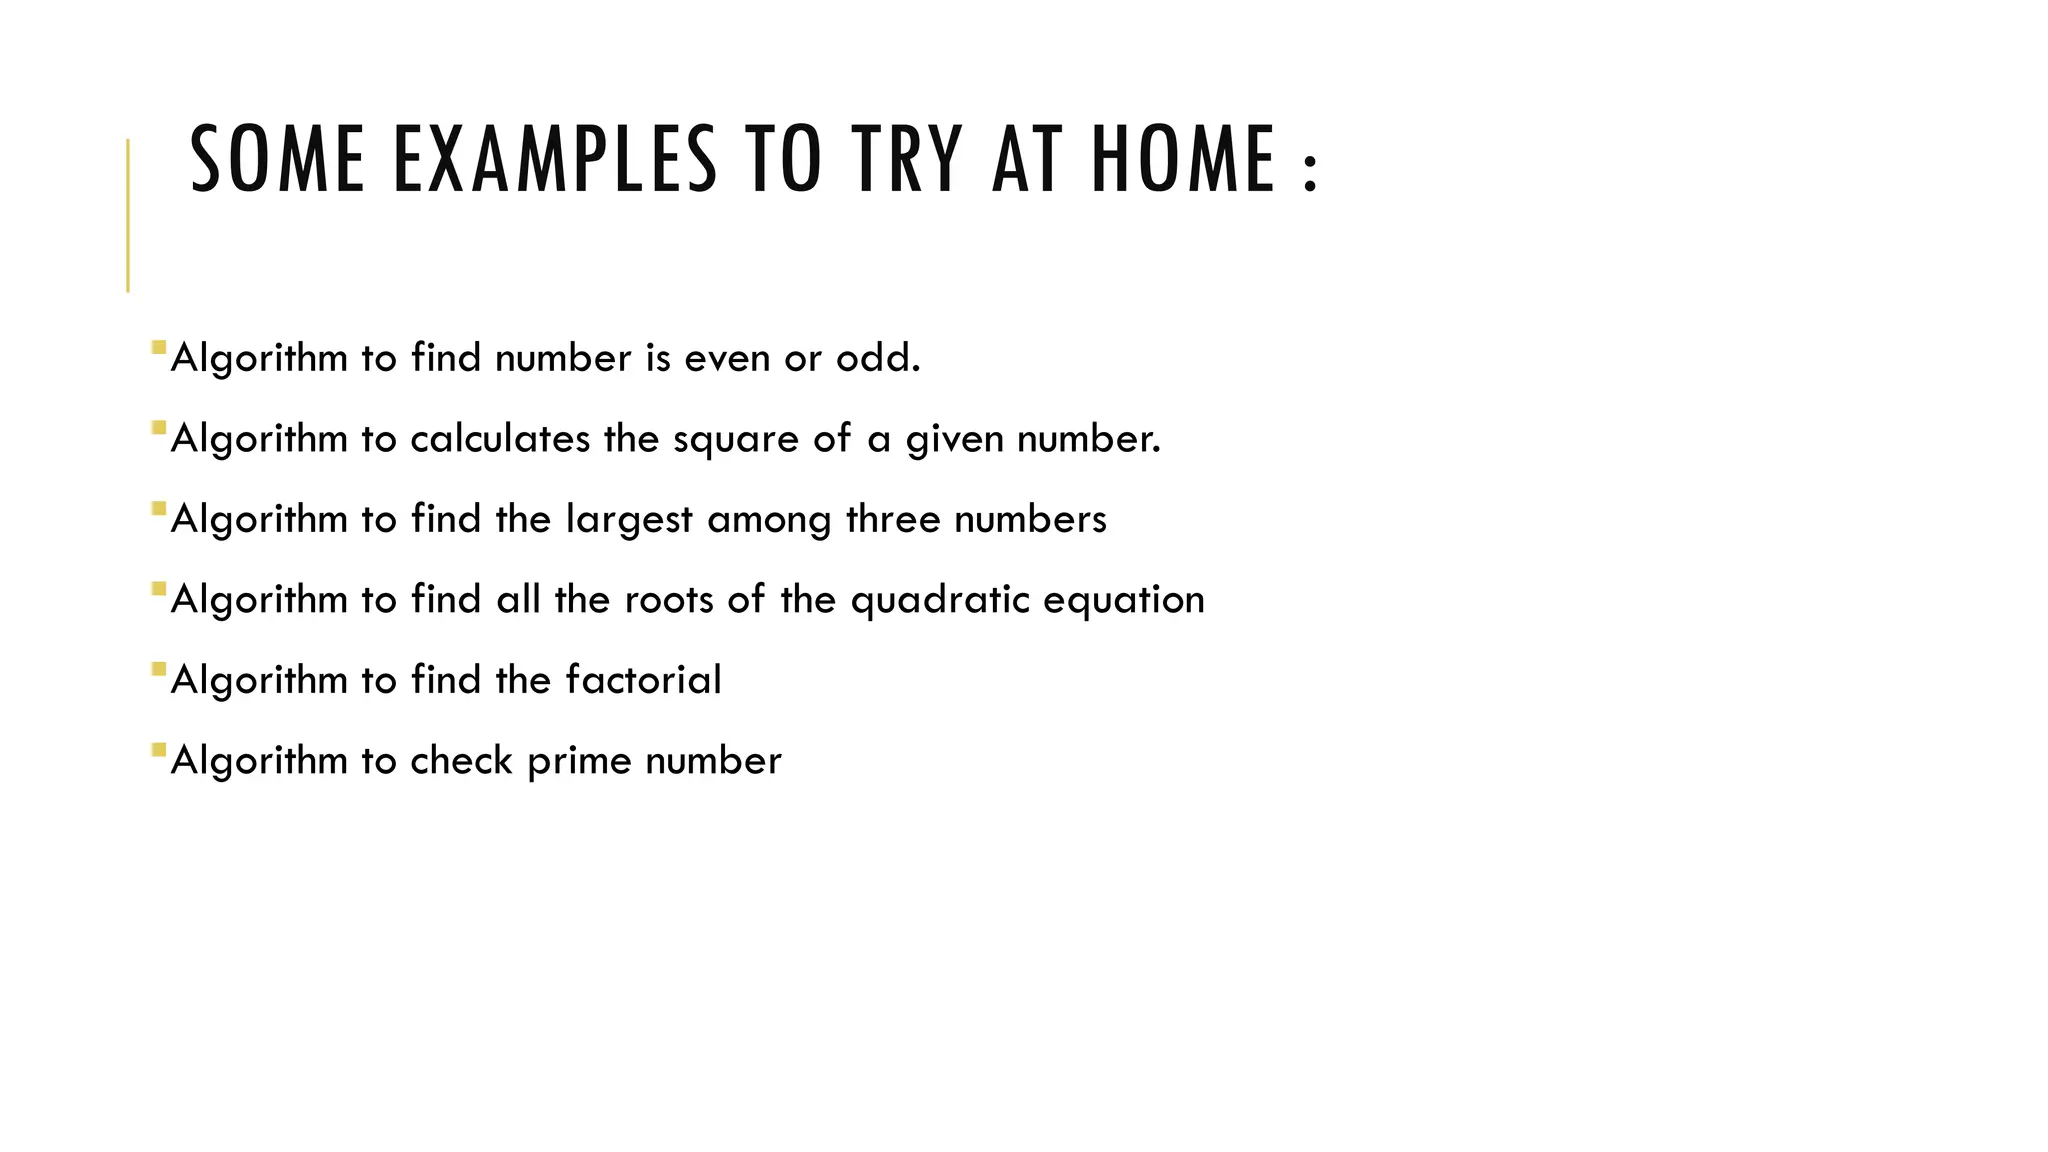
SOME EXAMPLES TOTRY AT HOME :
Algorithm to find number is even or odd.
Algorithm to calculates the square of a given number.
Algorithm to find the largest among three numbers
Algorithm to find all the roots of the quadratic equation
Algorithm to find the factorial
Algorithm to check prime number
9.
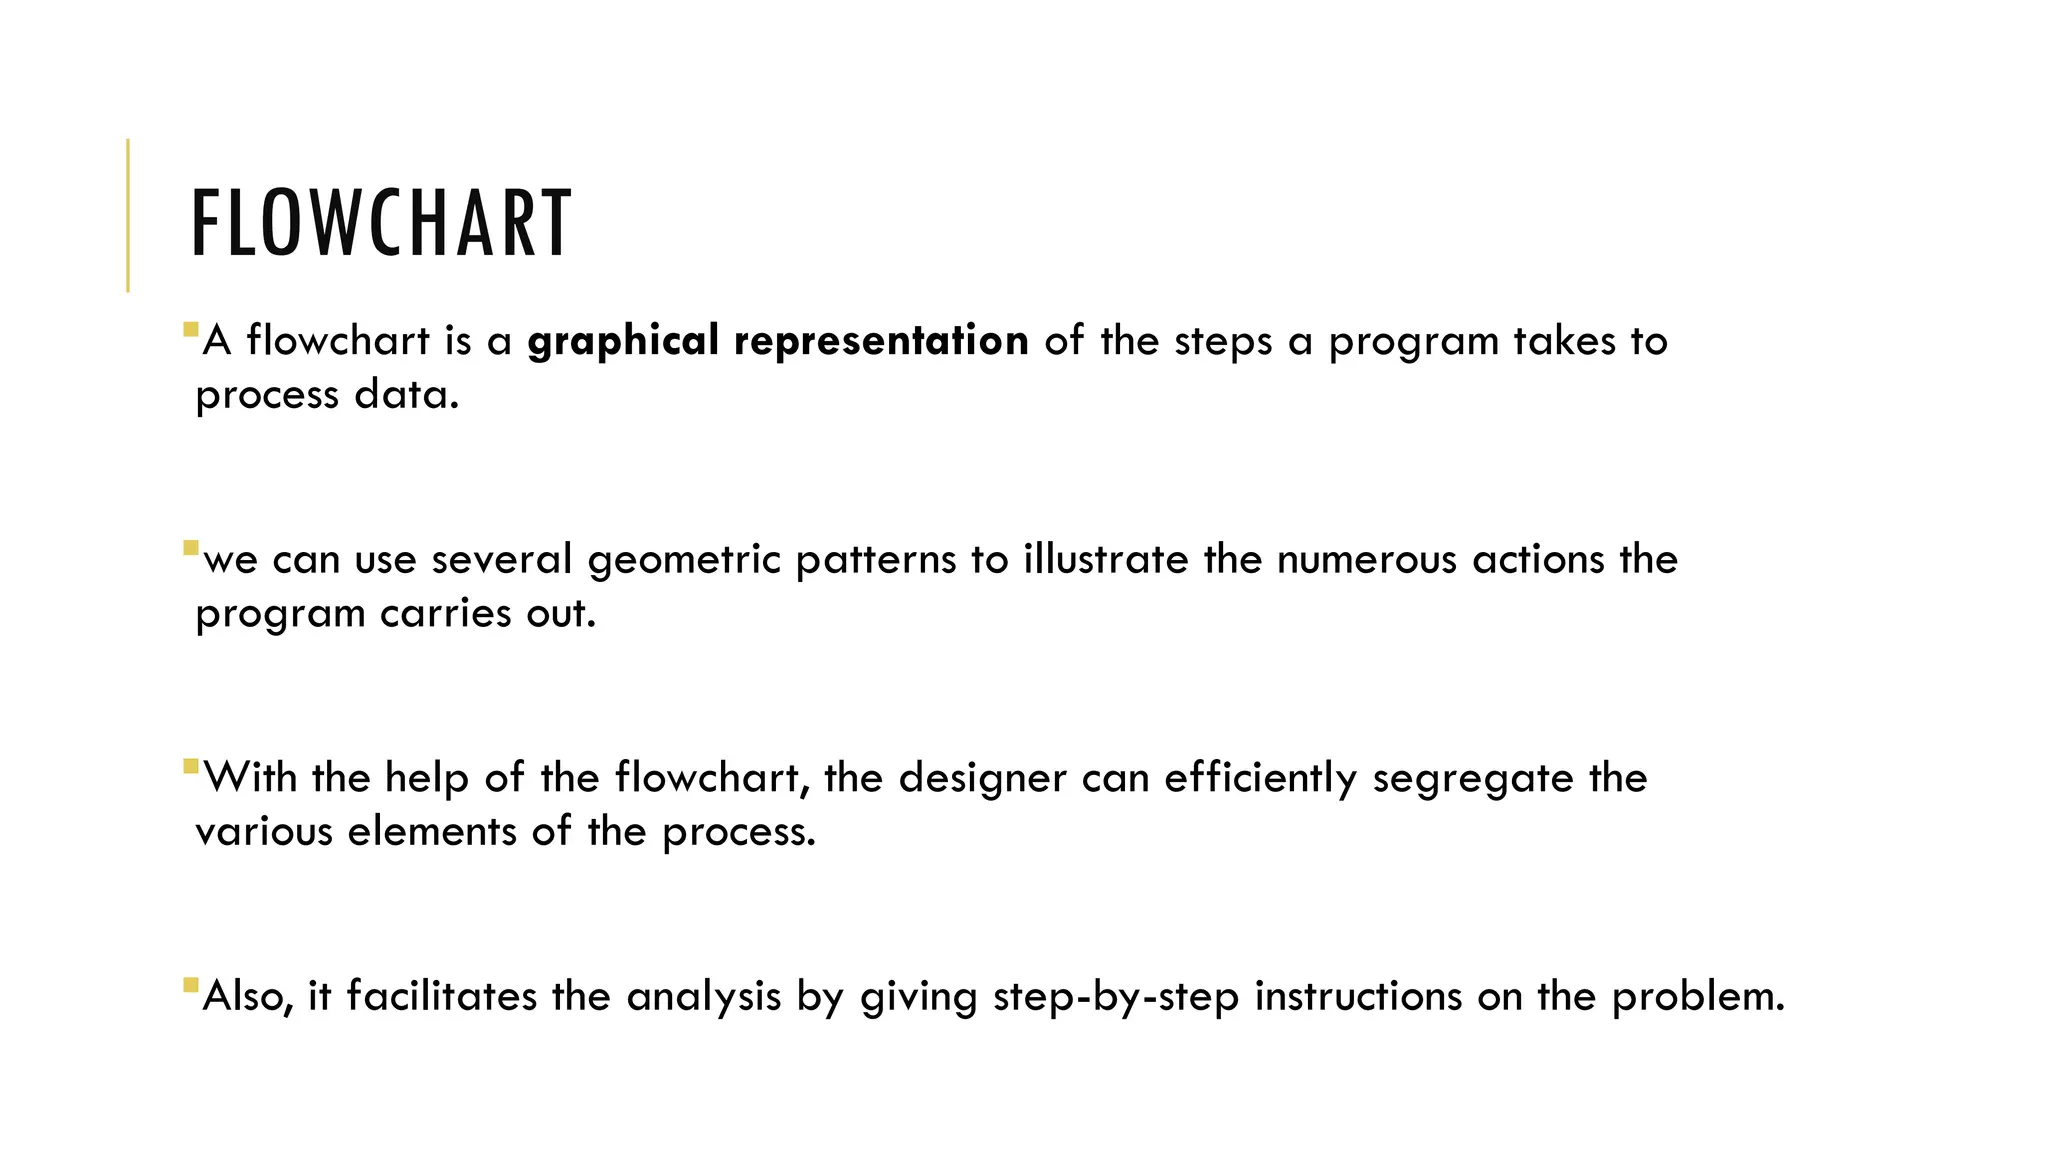
FLOWCHART
A flowchart isa graphical representation of the steps a program takes to
process data.
we can use several geometric patterns to illustrate the numerous actions the
program carries out.
With the help of the flowchart, the designer can efficiently segregate the
various elements of the process.
Also, it facilitates the analysis by giving step-by-step instructions on the problem.
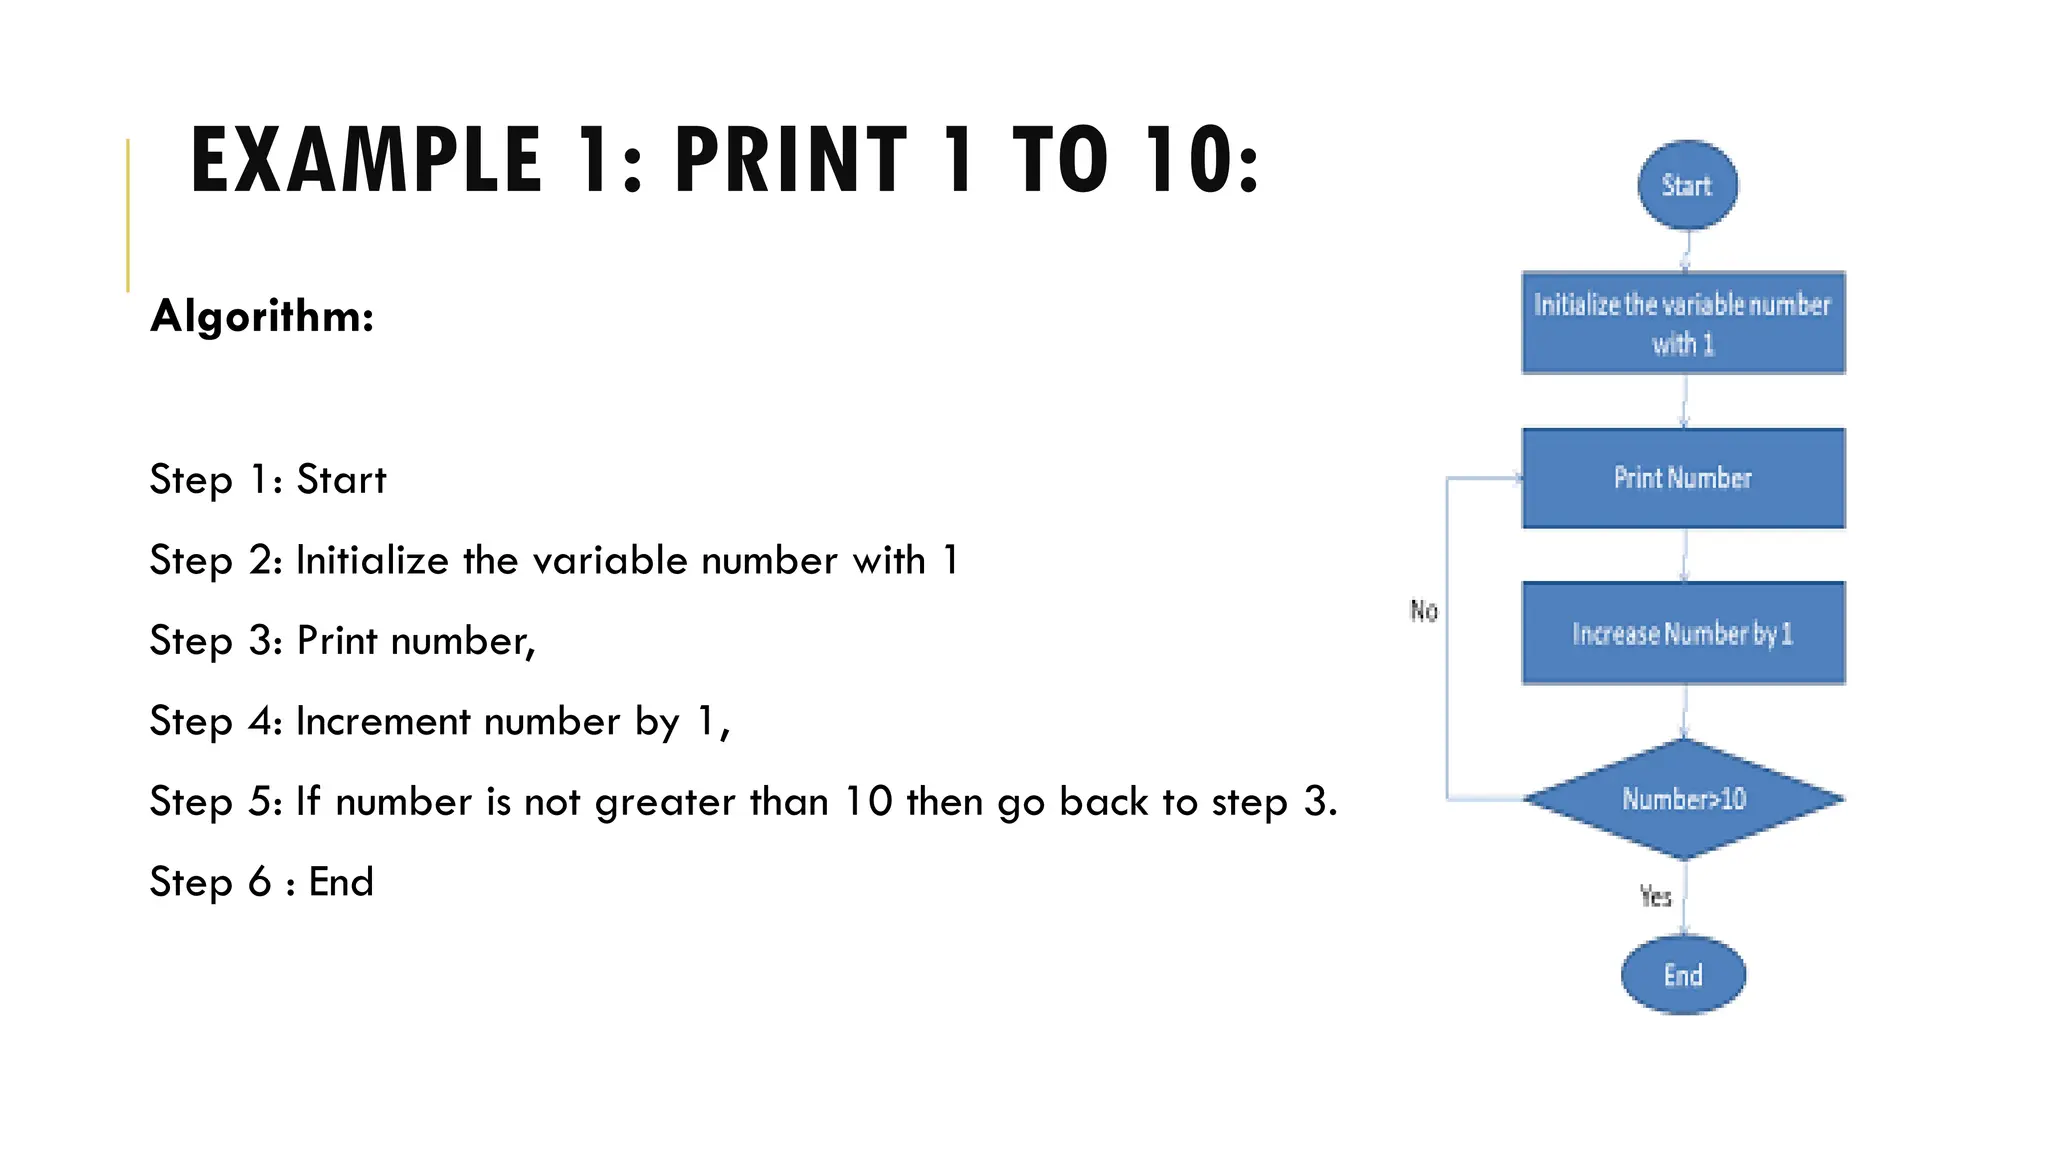
EXAMPLE 1: PRINT1 TO 10:
Algorithm:
Step 1: Start
Step 2: Initialize the variable number with 1
Step 3: Print number,
Step 4: Increment number by 1,
Step 5: If number is not greater than 10 then go back to step 3.
Step 6 : End
13.
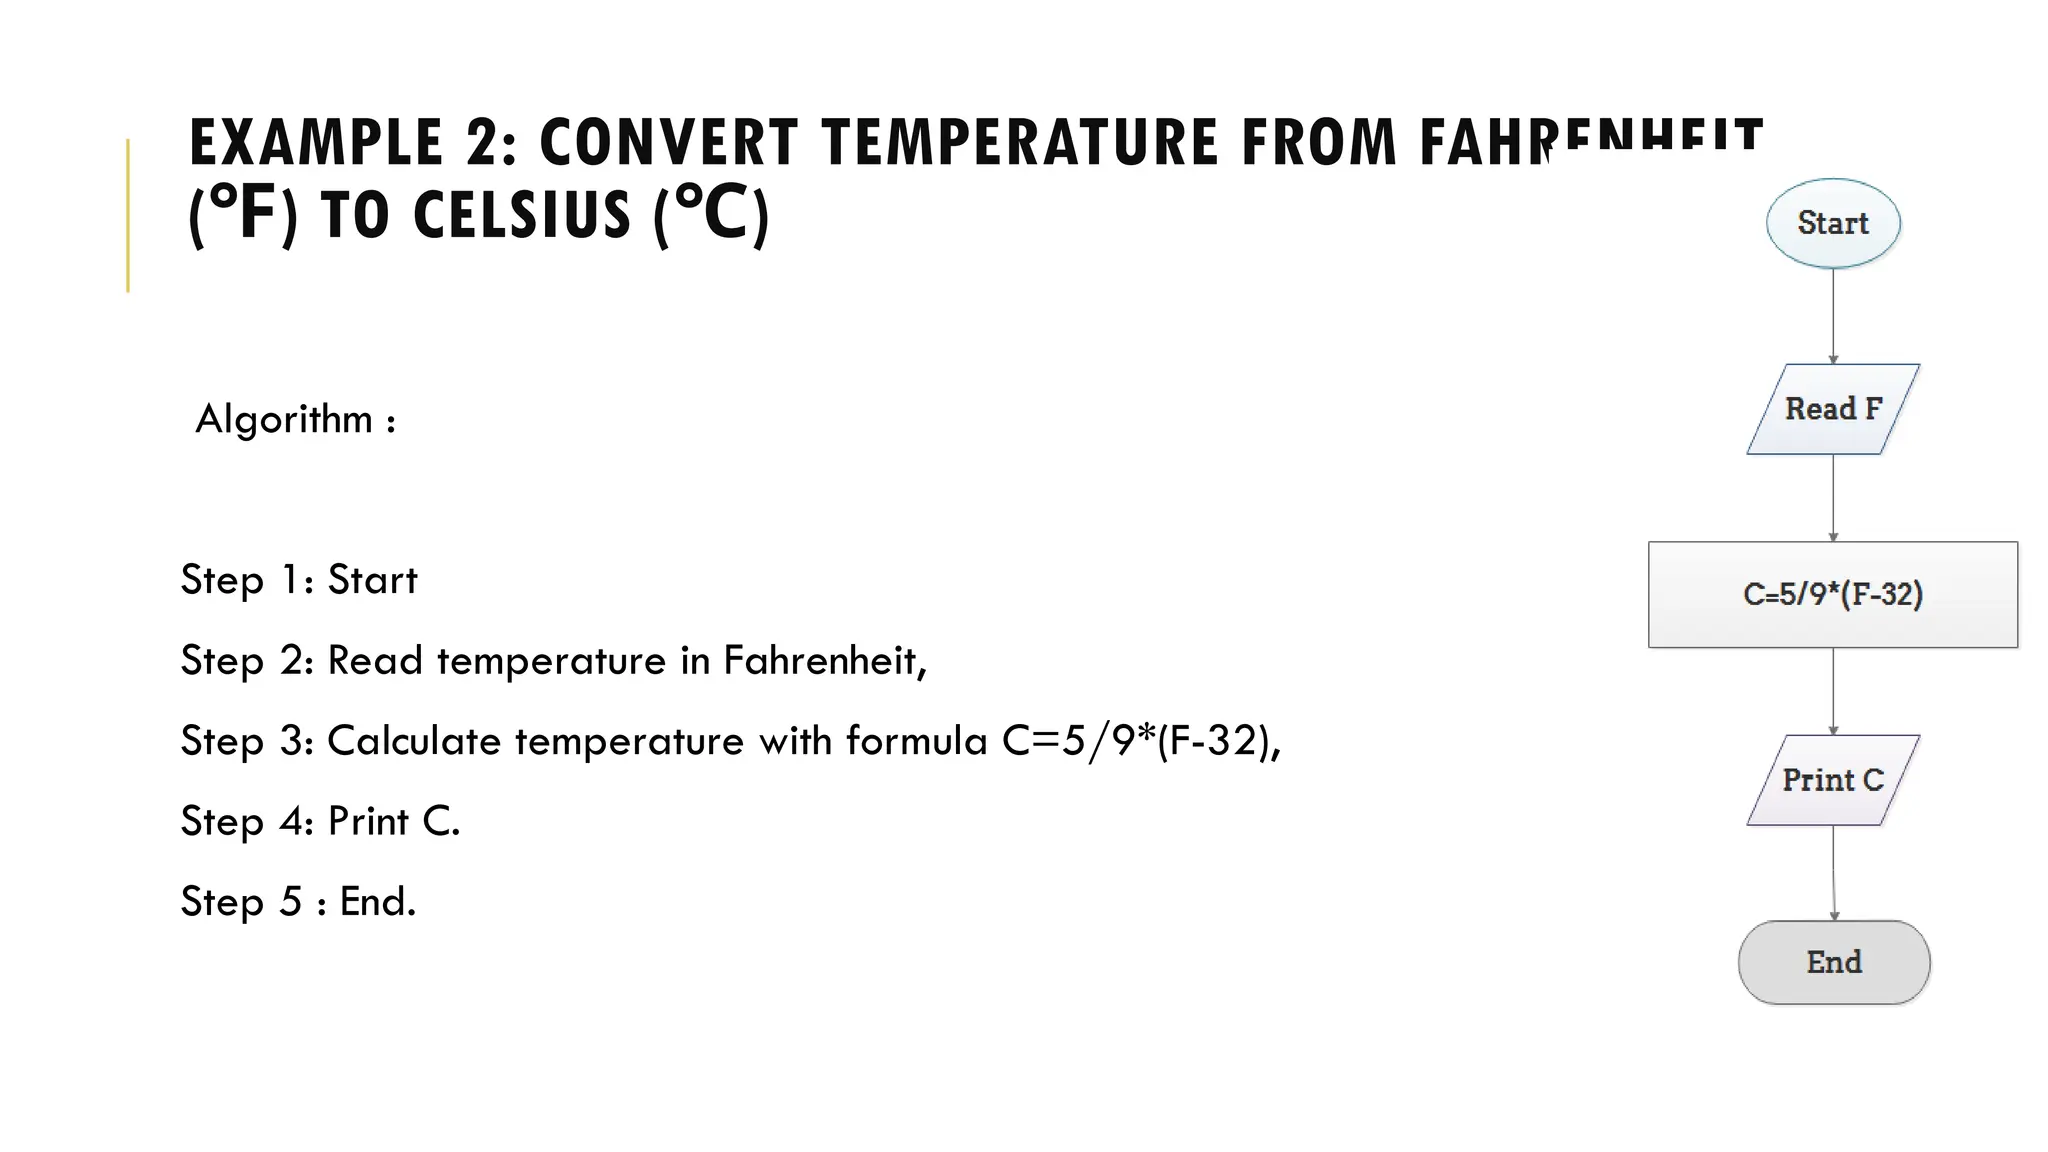
EXAMPLE 2: CONVERTTEMPERATURE FROM FAHRENHEIT
( ) TO CELSIUS ( )
℉ ℃
Algorithm :
Step 1: Start
Step 2: Read temperature in Fahrenheit,
Step 3: Calculate temperature with formula C=5/9*(F-32),
Step 4: Print C.
Step 5 : End.
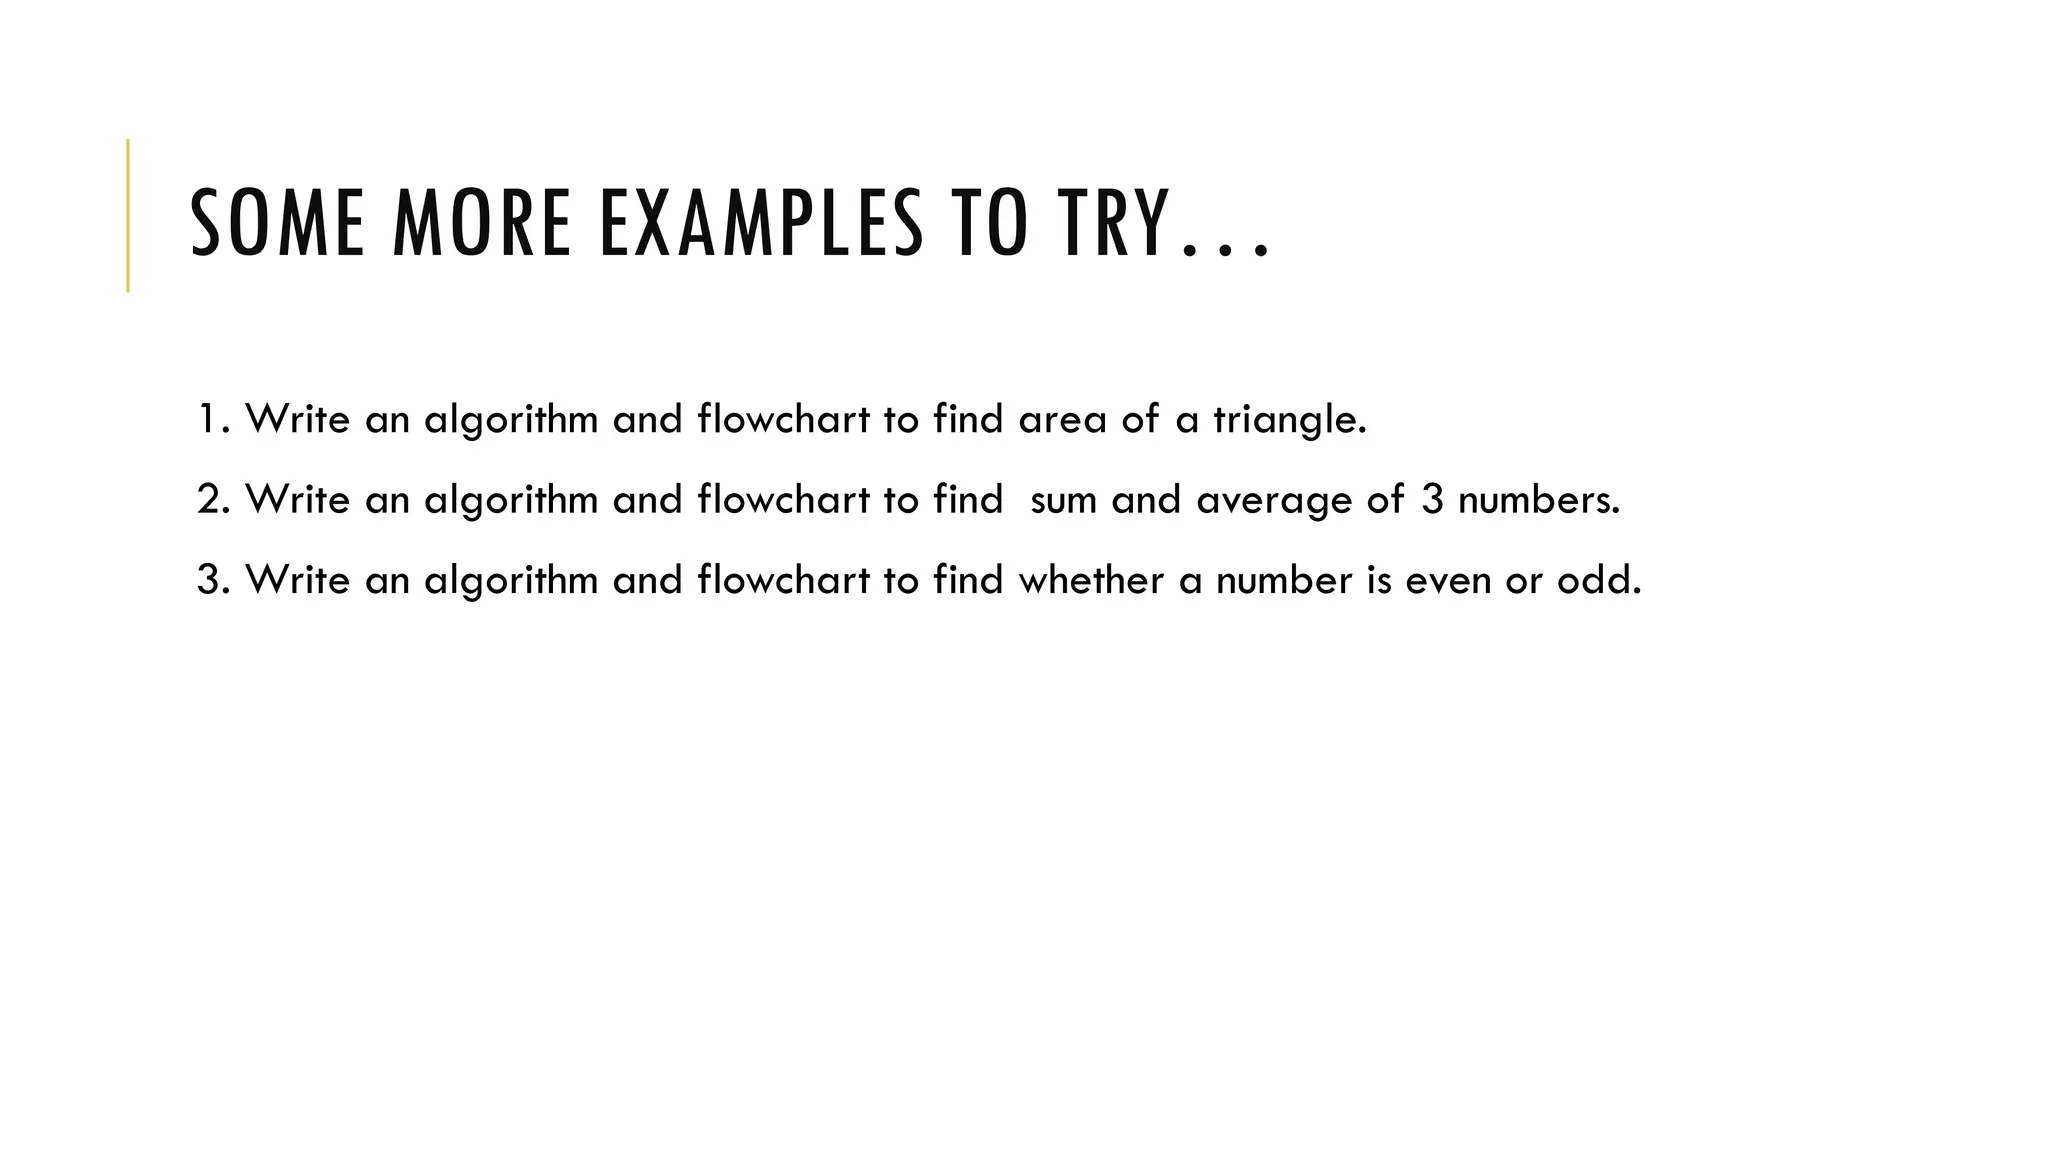
SOME MORE EXAMPLESTO TRY…
1. Write an algorithm and flowchart to find area of a triangle.
2. Write an algorithm and flowchart to find sum and average of 3 numbers.
3. Write an algorithm and flowchart to find whether a number is even or odd.
18.
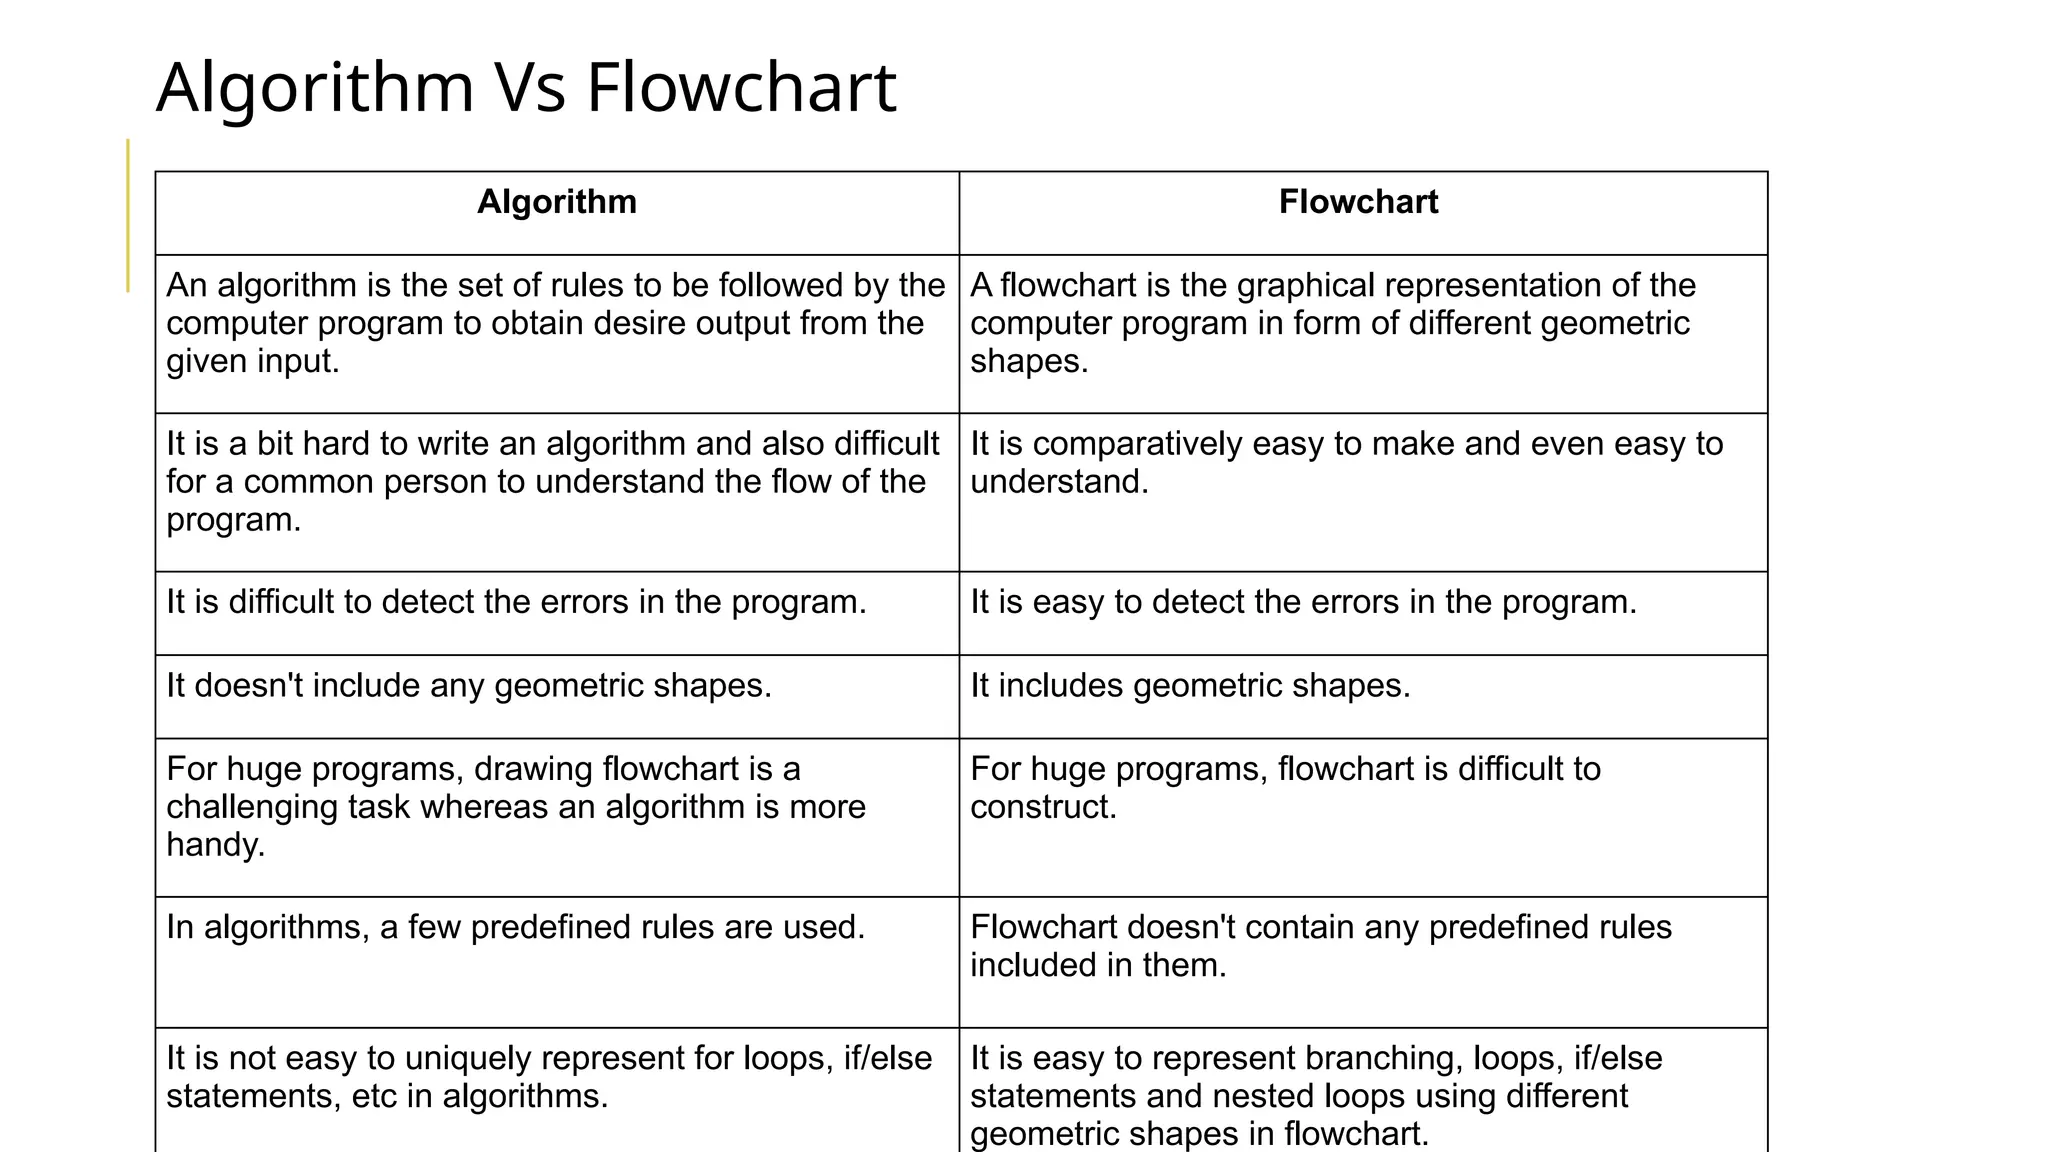
Algorithm Flowchart
An algorithmis the set of rules to be followed by the
computer program to obtain desire output from the
given input.
A flowchart is the graphical representation of the
computer program in form of different geometric
shapes.
It is a bit hard to write an algorithm and also difficult
for a common person to understand the flow of the
program.
It is comparatively easy to make and even easy to
understand.
It is difficult to detect the errors in the program. It is easy to detect the errors in the program.
It doesn't include any geometric shapes. It includes geometric shapes.
For huge programs, drawing flowchart is a
challenging task whereas an algorithm is more
handy.
For huge programs, flowchart is difficult to
construct.
In algorithms, a few predefined rules are used. Flowchart doesn't contain any predefined rules
included in them.
It is not easy to uniquely represent for loops, if/else
statements, etc in algorithms.
It is easy to represent branching, loops, if/else
statements and nested loops using different
geometric shapes in flowchart.
Algorithm Vs Flowchart


![Lecture_01-Problem_Solving[1]||ProgrammingFundamental.ppt](https://cdn.slidesharecdn.com/ss_thumbnails/lecture01-problemsolving1-240327053222-8448be2c-thumbnail.jpg?width=640&height=640&fit=bounds)