The document discusses JVM profiling techniques, highlighting methods for measuring performance, including the use of async profilers and different profiling tools such as VisualVM and Java Mission Control. It presents various challenges in profiling, such as safepoints and native methodologies, while also offering solutions for improving profiling accuracy and effectiveness. Additionally, it emphasizes the need for comprehensive stack sampling to address performance problems and maximize efficiency in Java applications.


![for-loop
public Theme getThemeById(Long id) {
for (int i = 0; i < themes.length; i++) {
if (id.equals(themes[i].getId())) {
return themes[i];
}
}
return null;
}
-XX:+UseCountedLoopSafepoints](https://image.slidesharecdn.com/theartofjvmprofiling-170409082529/75/The-Art-of-JVM-Profiling-14-2048.jpg)


![perf
$ perf record –F 999 java ...
$ perf report
4.70% java [kernel.kallsyms] [k] clear_page_c
2.10% java libpthread-2.17.so [.] pthread_cond_wait
1.97% java libjvm.so [.] Unsafe_Park
1.40% java libjvm.so [.] Parker::park
1.31% java [kernel.kallsyms] [k] try_to_wake_up
1.31% java perf-18762.map [.] 0x00007f8510e9e757
1.21% java perf-18762.map [.] 0x00007f8510e9e89e
1.17% java perf-18762.map [.] 0x00007f8510e9cc17
perf.wiki.kernel.org/index.php/Tutorial
37](https://image.slidesharecdn.com/theartofjvmprofiling-170409082529/75/The-Art-of-JVM-Profiling-37-2048.jpg)

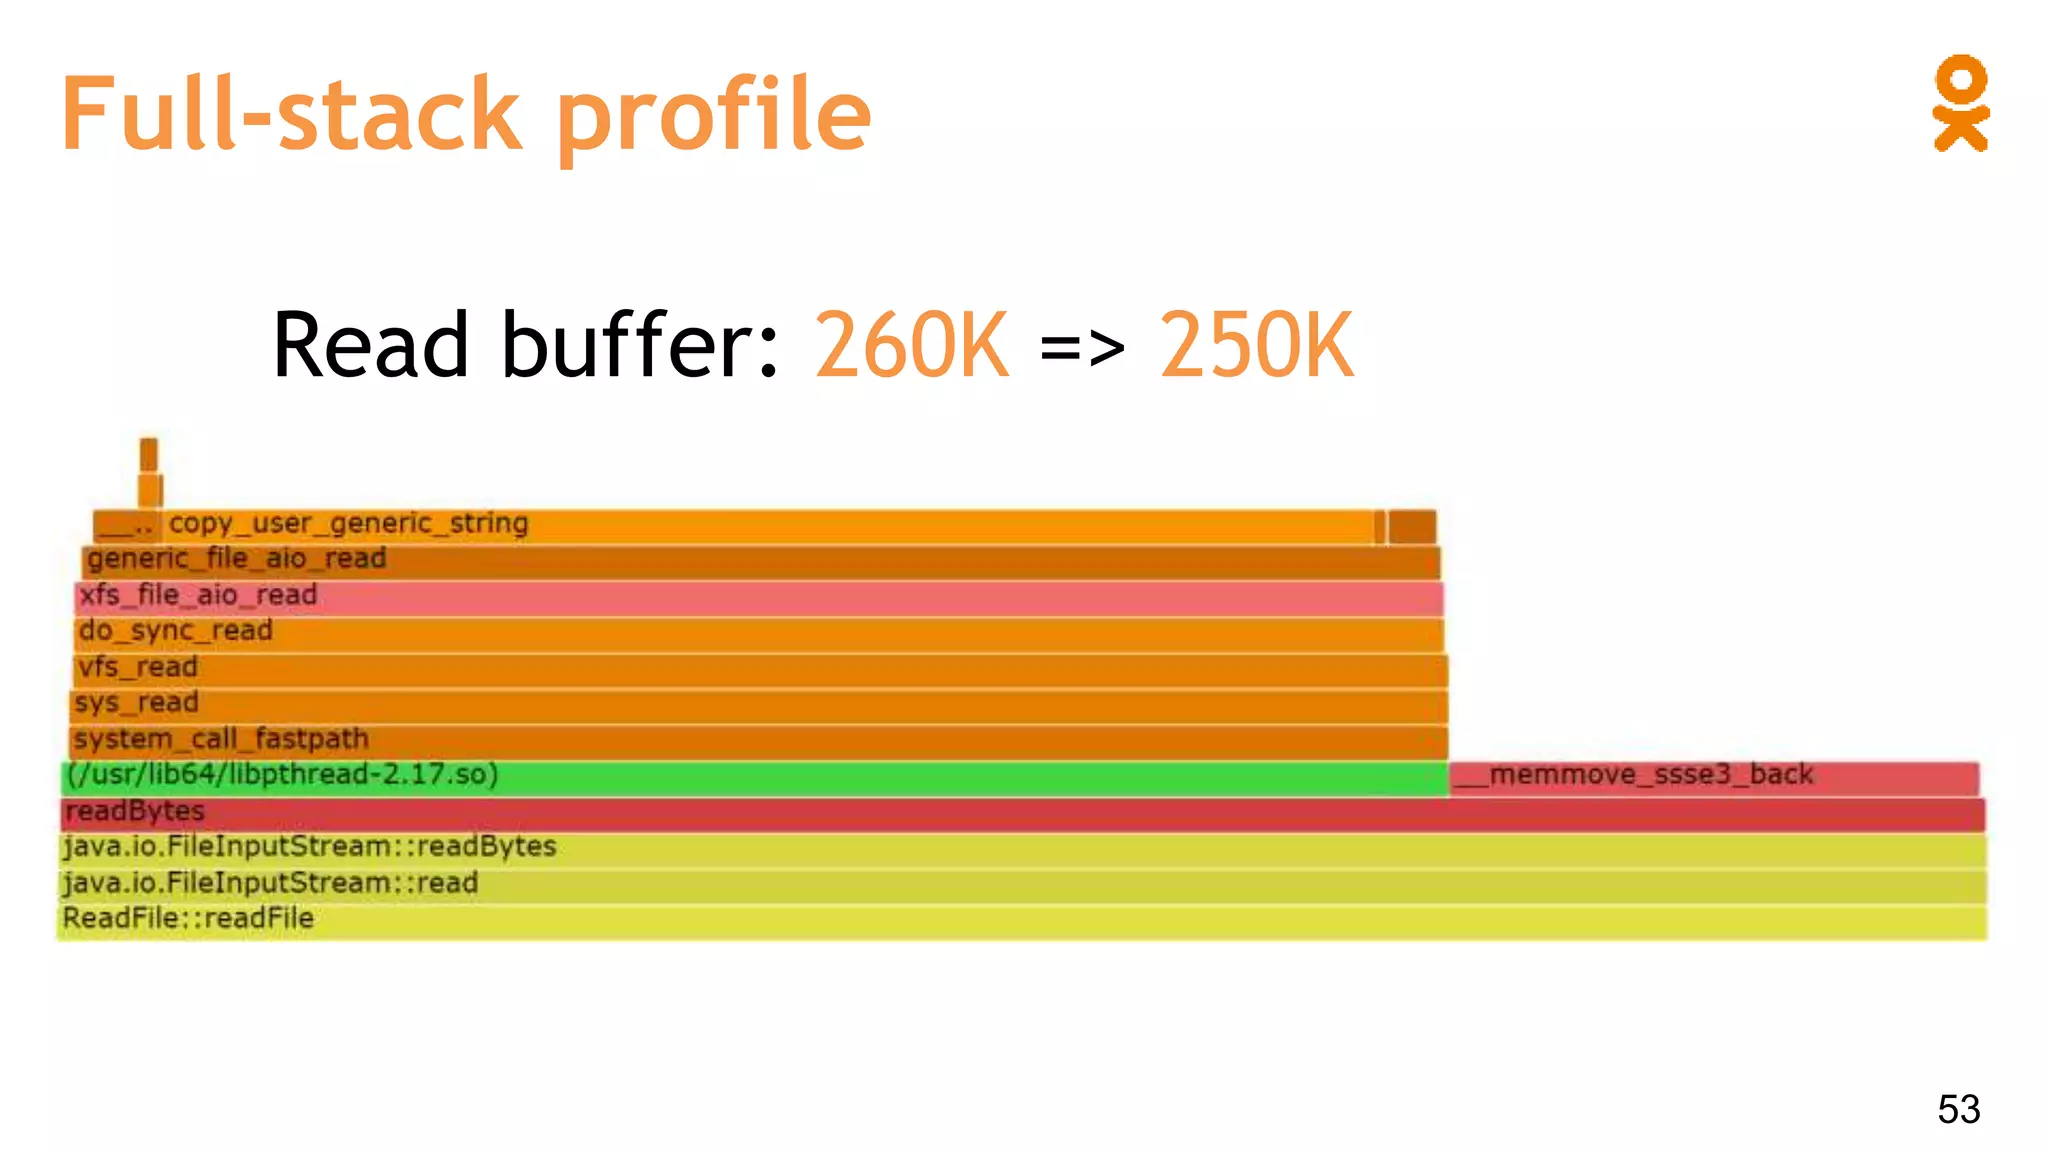
![Case: file reading
byte[] buf = new byte[bufSize];
try (FileInputStream in = new FileInputStream(fileName)) {
int bytesRead;
while ((bytesRead = in.read(buf)) > 0) {
...
}
}
Buffer size?
❑ 8 K
❑ 64 K
❑ 250 K
❑ 1 M
❑ 4 M
51](https://image.slidesharecdn.com/theartofjvmprofiling-170409082529/75/The-Art-of-JVM-Profiling-51-2048.jpg)


![for-loop
public Theme getThemeById(Long id) {
for (int i = 0; i < themes.length; i++) {
if (id.equals(themes[i].getId())) {
return themes[i];
}
}
return null;
}
-XX:+UseCountedLoopSafepoints](https://crownmelresort.com/image.slidesharecdn.com/theartofjvmprofiling-170409082529/75/The-Art-of-JVM-Profiling-14-2048.jpg)


![perf
$ perf record –F 999 java ...
$ perf report
4.70% java [kernel.kallsyms] [k] clear_page_c
2.10% java libpthread-2.17.so [.] pthread_cond_wait
1.97% java libjvm.so [.] Unsafe_Park
1.40% java libjvm.so [.] Parker::park
1.31% java [kernel.kallsyms] [k] try_to_wake_up
1.31% java perf-18762.map [.] 0x00007f8510e9e757
1.21% java perf-18762.map [.] 0x00007f8510e9e89e
1.17% java perf-18762.map [.] 0x00007f8510e9cc17
perf.wiki.kernel.org/index.php/Tutorial
37](https://crownmelresort.com/image.slidesharecdn.com/theartofjvmprofiling-170409082529/75/The-Art-of-JVM-Profiling-37-2048.jpg)


![Case: file reading
byte[] buf = new byte[bufSize];
try (FileInputStream in = new FileInputStream(fileName)) {
int bytesRead;
while ((bytesRead = in.read(buf)) > 0) {
...
}
}
Buffer size?
❑ 8 K
❑ 64 K
❑ 250 K
❑ 1 M
❑ 4 M
51](https://crownmelresort.com/image.slidesharecdn.com/theartofjvmprofiling-170409082529/75/The-Art-of-JVM-Profiling-51-2048.jpg)