1
Q4 FY 2024Financial results | Investor presentation
SYNEKTIK SA
Investor Presentation
Q4 FY 2024: Financial results
November 2025
2.
2
Q4 FY 2024Financial results | Investor presentation
0
50
100
150
200
250
300
sty 23 kwi 23 lip 23 paź 23 sty 24 kwi 24 lip 24 paź 24 sty 25 kwi 25 lip 25 paź 25
Synektik stock price (PLN)
2
Q4 FY 2024 Financial results | Investor presentation
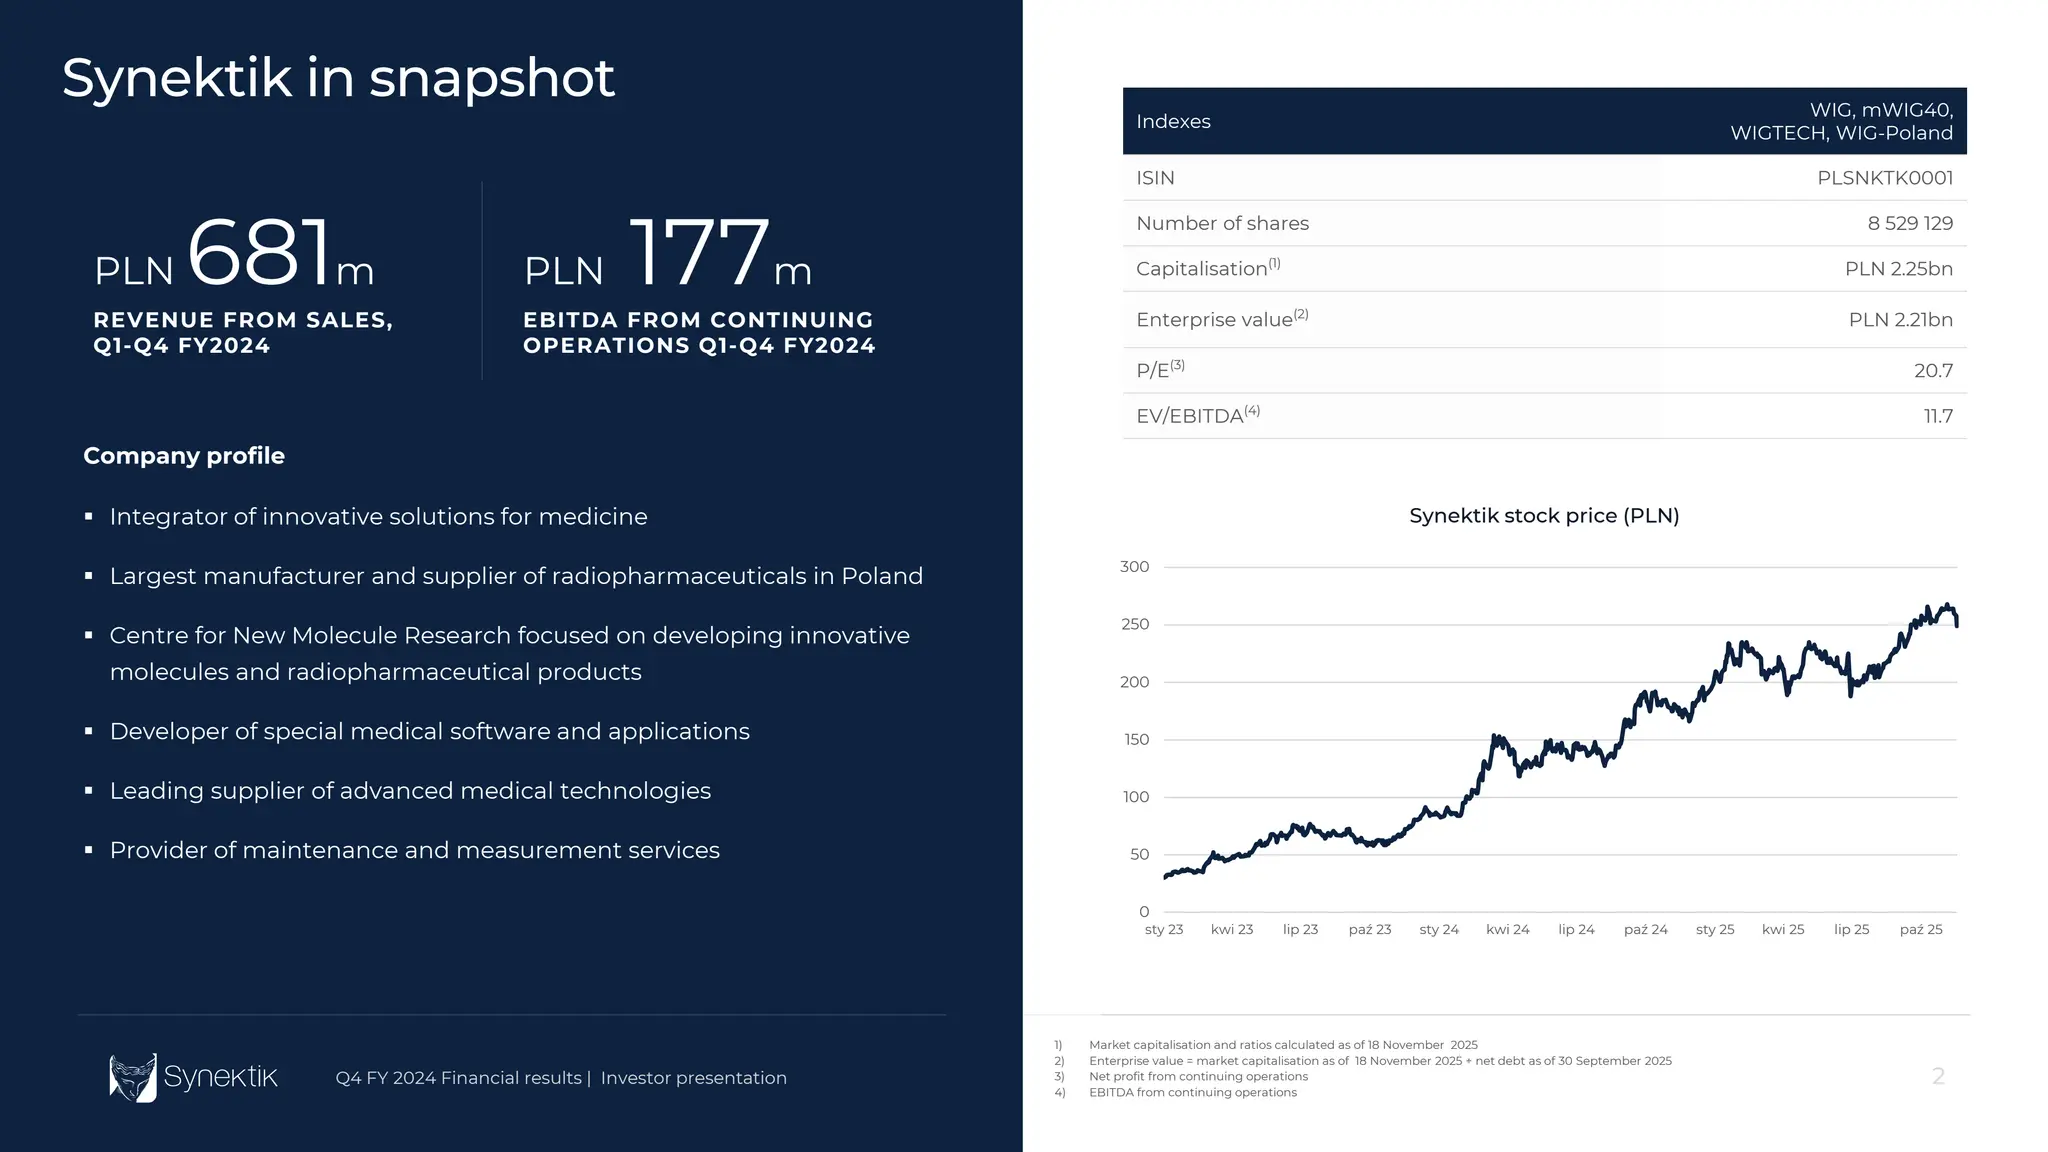
Indexes
WIG, mWIG40,
WIGTECH, WIG-Poland
ISIN PLSNKTK0001
Number of shares 8 529 129
Capitalisation(1)
PLN 2.25bn
Enterprise value(2)
PLN 2.21bn
P/E(3)
20.7
EV/EBITDA(4)
11.7
Company profile
Integrator of innovative solutions for medicine
Largest manufacturer and supplier of radiopharmaceuticals in Poland
Centre for New Molecule Research focused on developing innovative
molecules and radiopharmaceutical products
Developer of special medical software and applications
Leading supplier of advanced medical technologies
Provider of maintenance and measurement services
Synektik in snapshot
PLN 681m
REVENUE FROM SALES,
Q1-Q4 FY2024
PLN 177m
EBITDA FROM CONTINUING
OPERATIONS Q1-Q4 FY2024
1) Market capitalisation and ratios calculated as of 18 November 2025
2) Enterprise value = market capitalisation as of 18 November 2025 + net debt as of 30 September 2025
3) Net profit from continuing operations
4) EBITDA from continuing operations
3.
3
Q4 FY 2024Financial results | Investor presentation
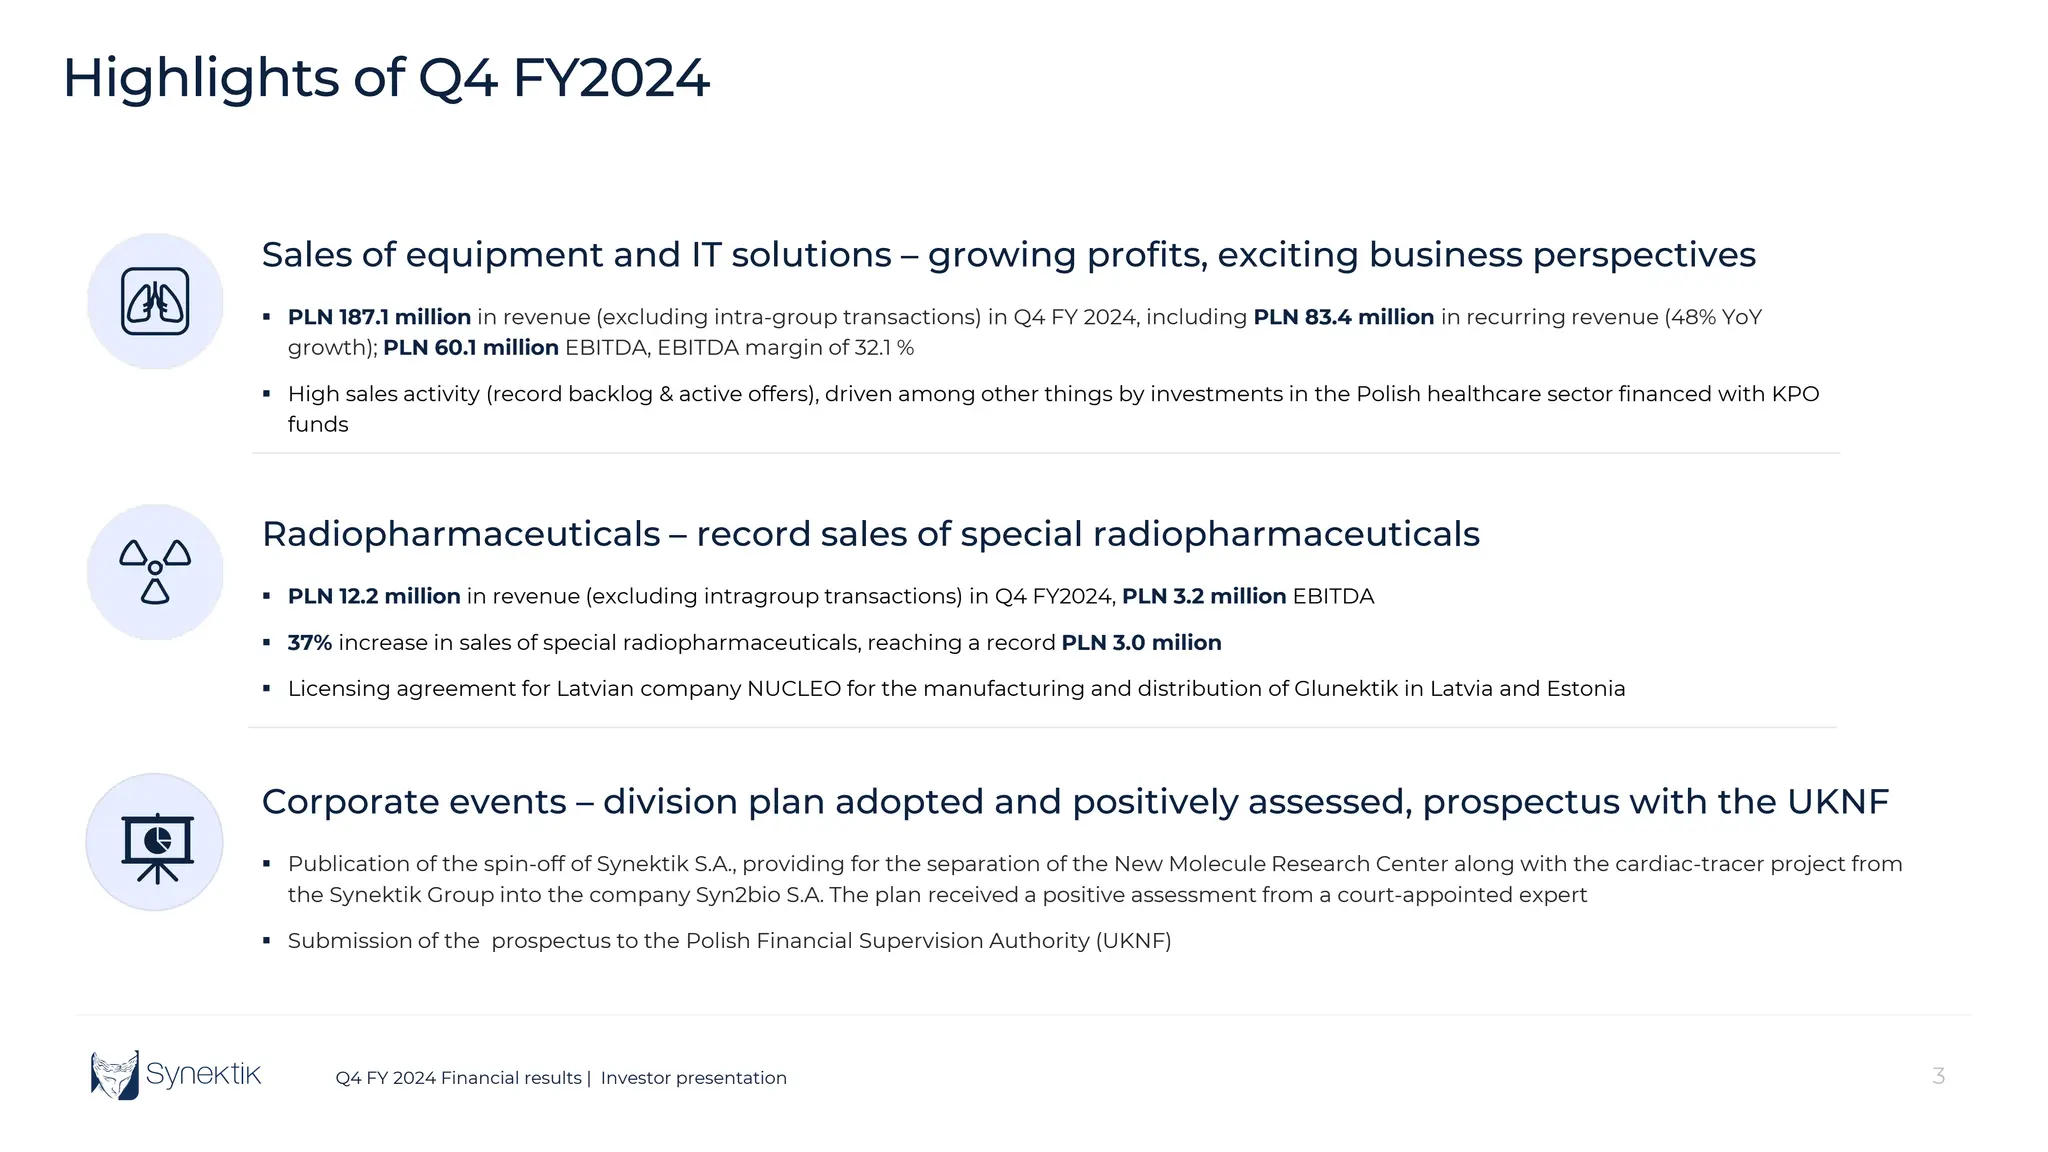
Corporate events – division plan adopted and positively assessed, prospectus with the UKNF
Publication of the spin-off of Synektik S.A., providing for the separation of the New Molecule Research Center along with the cardiac-tracer project from
the Synektik Group into the company Syn2bio S.A. The plan received a positive assessment from a court-appointed expert
Submission of the prospectus to the Polish Financial Supervision Authority (UKNF)
Radiopharmaceuticals – record sales of special radiopharmaceuticals
PLN 12.2 million in revenue (excluding intragroup transactions) in Q4 FY2024, PLN 3.2 million EBITDA
37% increase in sales of special radiopharmaceuticals, reaching a record PLN 3.0 milion
Licensing agreement for Latvian company NUCLEO for the manufacturing and distribution of Glunektik in Latvia and Estonia
Highlights of Q4 FY2024
Sales of equipment and IT solutions – growing profits, exciting business perspectives
PLN 187.1 million in revenue (excluding intra-group transactions) in Q4 FY 2024, including PLN 83.4 million in recurring revenue (48% YoY
growth); PLN 60.1 million EBITDA, EBITDA margin of 32.1 %
High sales activity (record backlog & active offers), driven among other things by investments in the Polish healthcare sector financed with KPO
funds
4.
4
Q4 FY 2024Financial results | Investor presentation 4
Q4 FY 2024 Financial results | Investor presentation
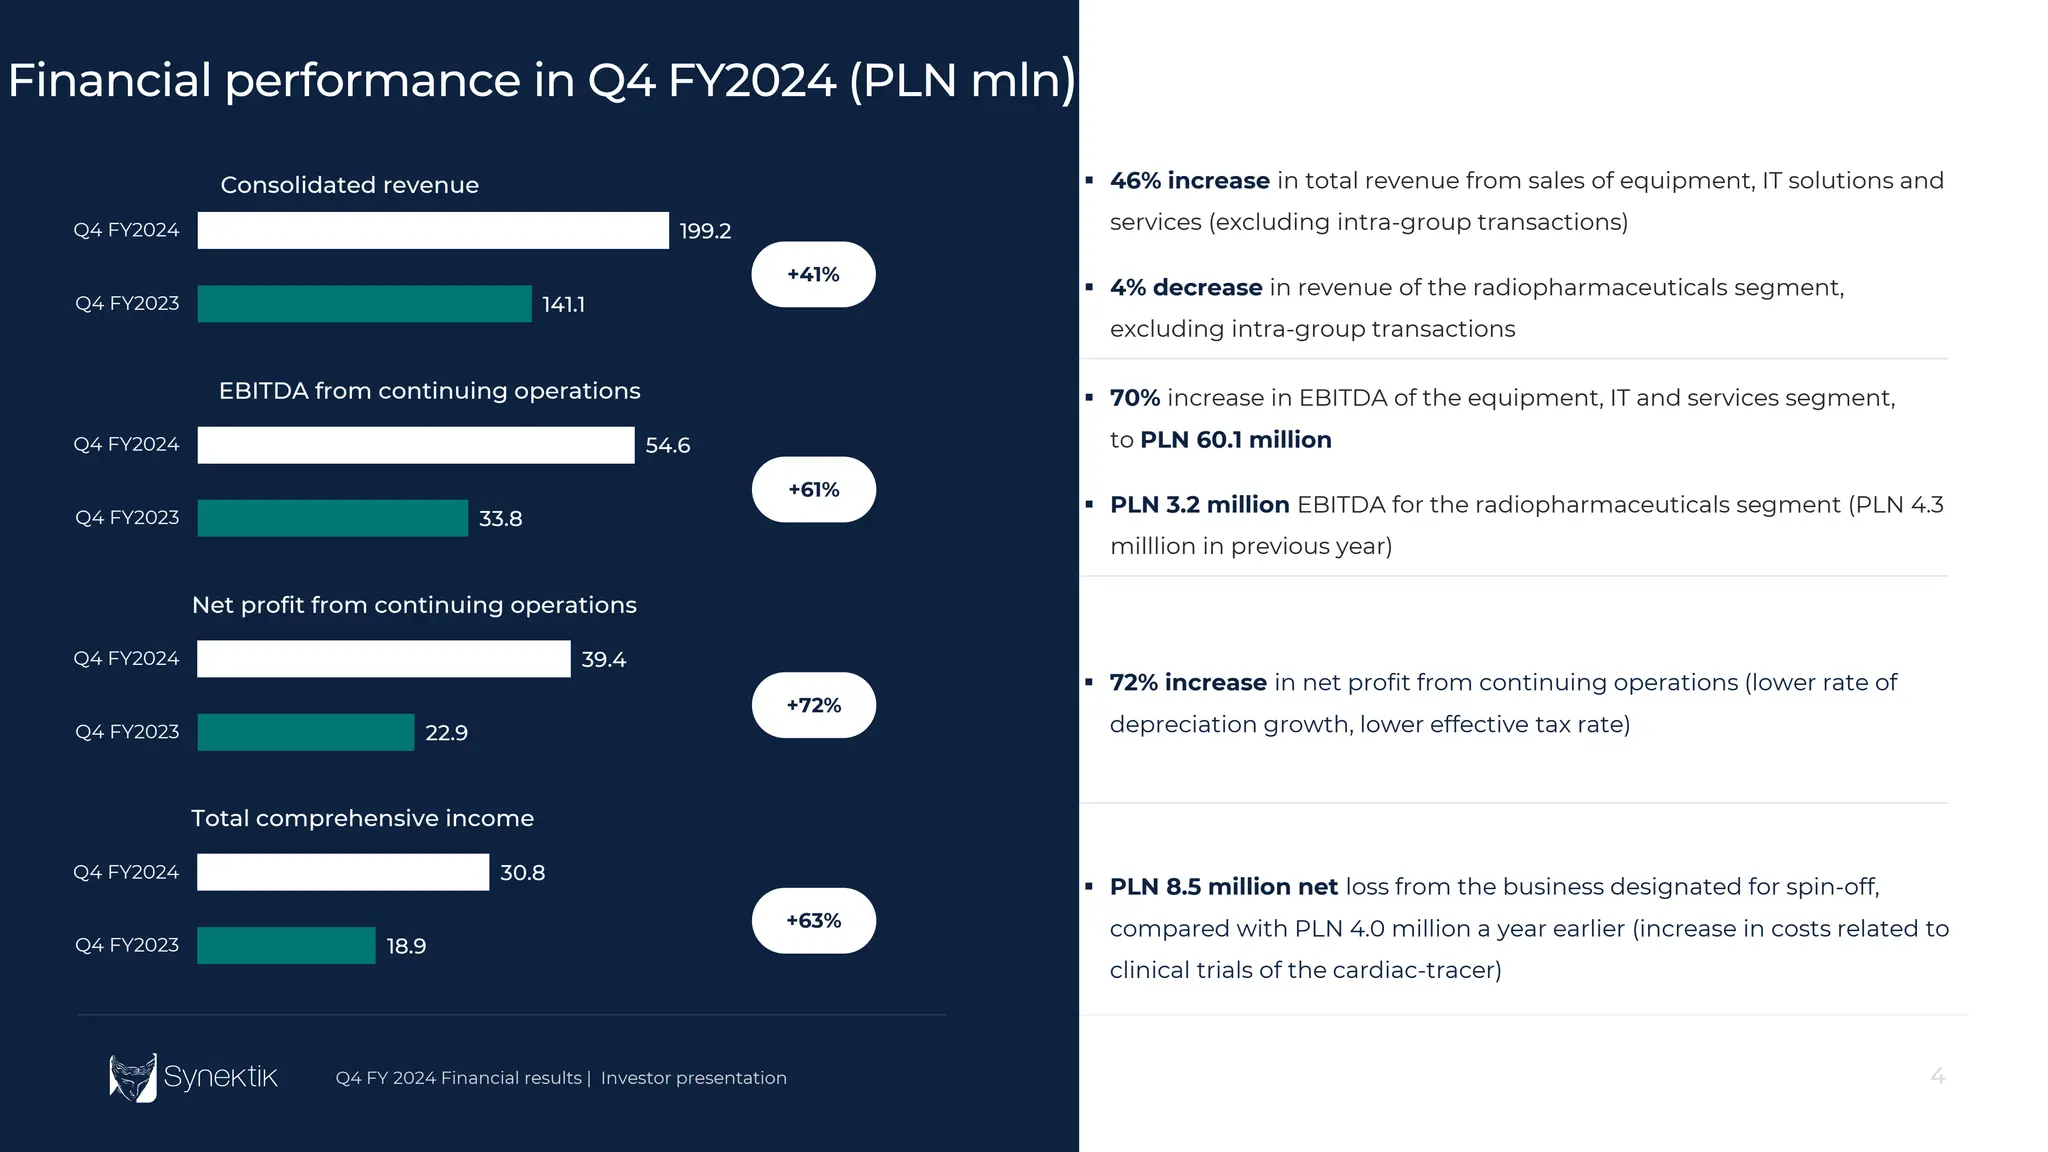
Financial performance in Q4 FY2024 (PLN mln)
141.1
199.2
Q4 FY2023
Q4 FY2024
Consolidated revenue
+41%
33.8
54.6
Q4 FY2023
Q4 FY2024
EBITDA from continuing operations
22.9
39.4
Q4 FY2023
Q4 FY2024
Net profit from continuing operations
+61%
+72%
70% increase in EBITDA of the equipment, IT and services segment,
to PLN 60.1 million
PLN 3.2 million EBITDA for the radiopharmaceuticals segment (PLN 4.3
milllion in previous year)
72% increase in net profit from continuing operations (lower rate of
depreciation growth, lower effective tax rate)
18.9
30.8
Q4 FY2023
Q4 FY2024
Total comprehensive income
+63%
PLN 8.5 million net loss from the business designated for spin-off,
compared with PLN 4.0 million a year earlier (increase in costs related to
clinical trials of the cardiac-tracer)
46% increase in total revenue from sales of equipment, IT solutions and
services (excluding intra-group transactions)
4% decrease in revenue of the radiopharmaceuticals segment,
excluding intra-group transactions
5.
5
Q4 FY 2024Financial results | Investor presentation 5
Wyniki Q4 2024 r. fin. | Prezentacja inwestorska
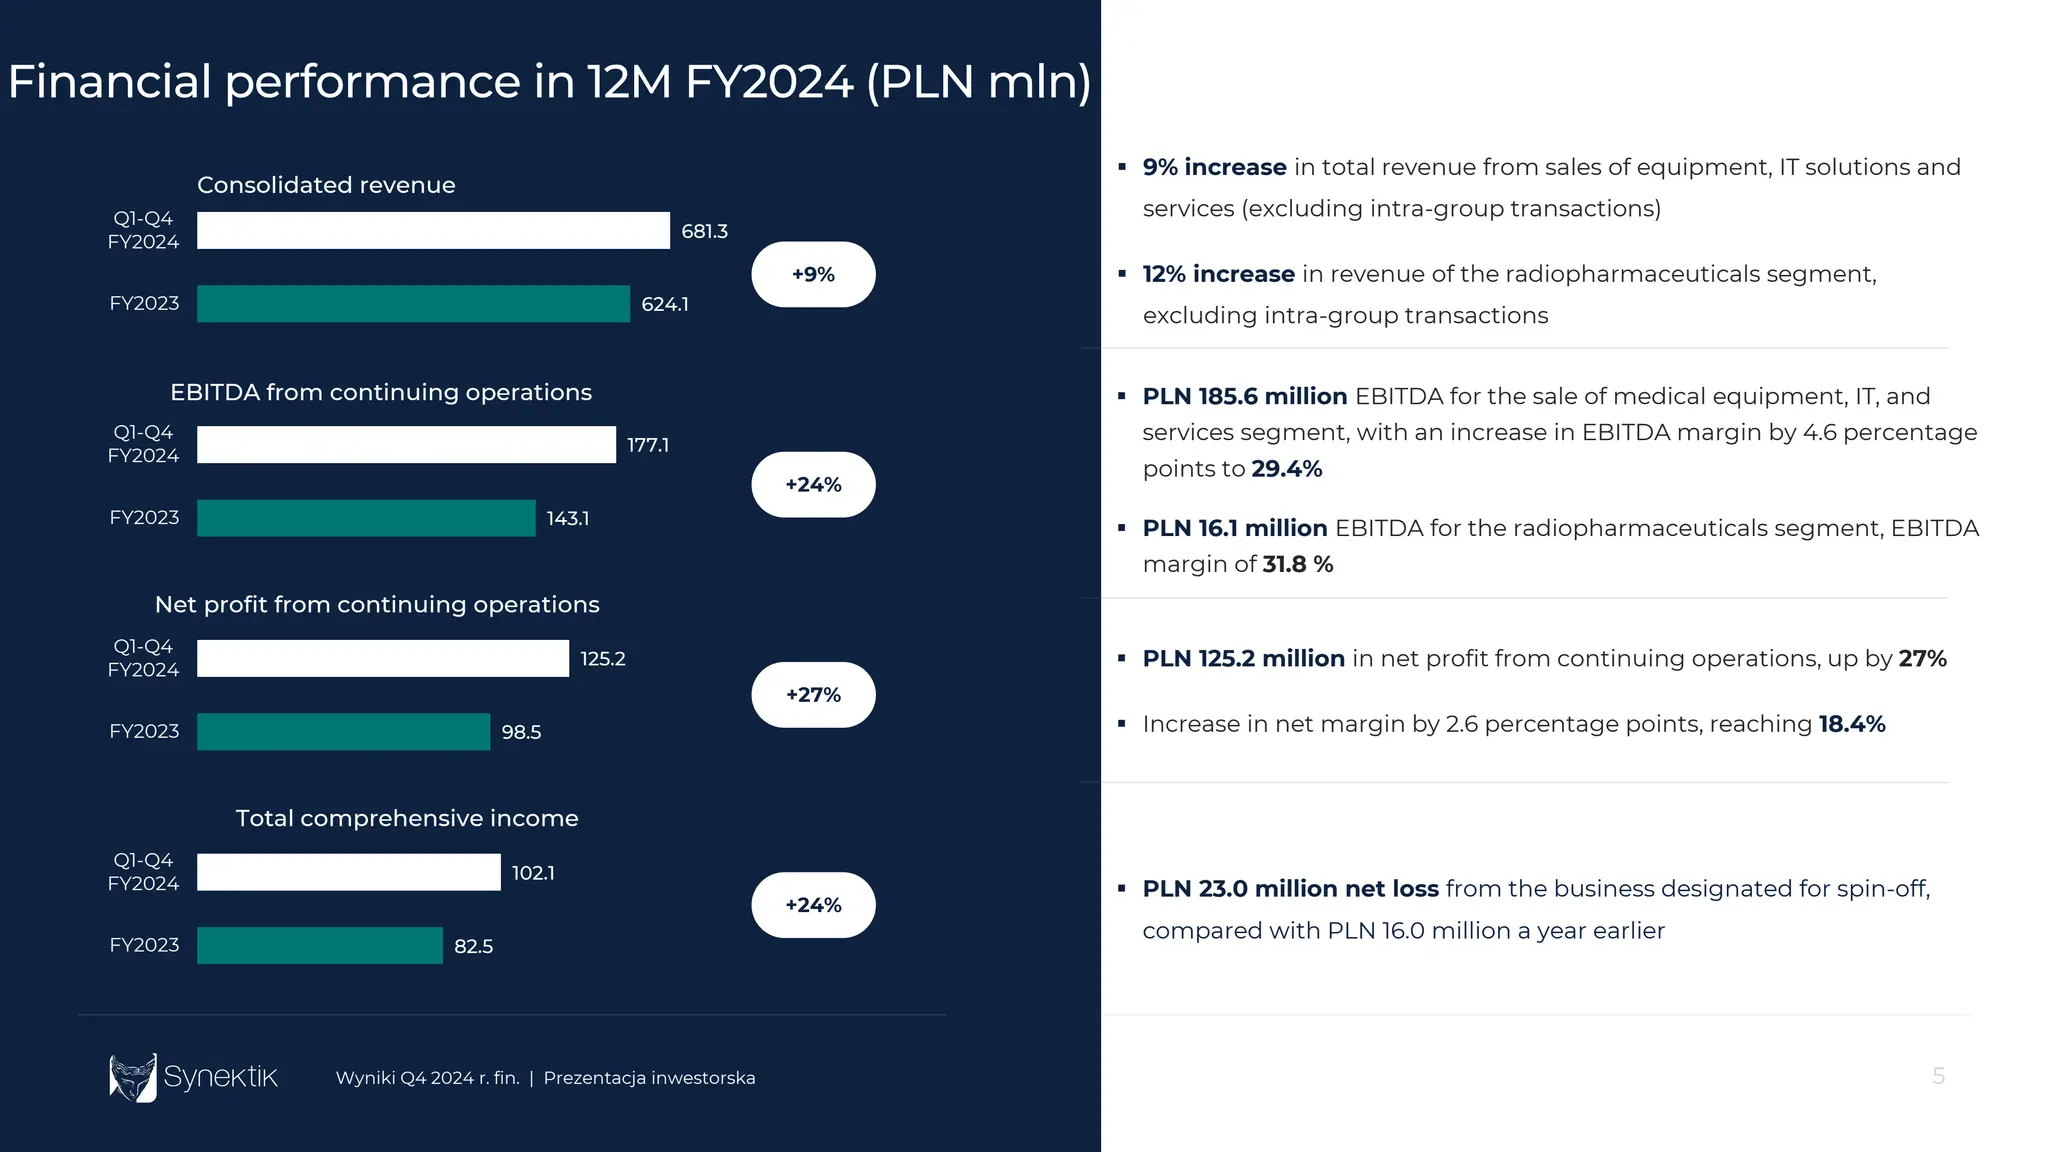
Financial performance in 12M FY2024 (PLN mln)
624.1
681.3
FY2023
Q1-Q4
FY2024
Consolidated revenue
+9%
143.1
177.1
FY2023
Q1-Q4
FY2024
EBITDA from continuing operations
98.5
125.2
FY2023
Q1-Q4
FY2024
Net profit from continuing operations
+24%
+27%
PLN 185.6 million EBITDA for the sale of medical equipment, IT, and
services segment, with an increase in EBITDA margin by 4.6 percentage
points to 29.4%
PLN 16.1 million EBITDA for the radiopharmaceuticals segment, EBITDA
margin of 31.8 %
PLN 125.2 million in net profit from continuing operations, up by 27%
Increase in net margin by 2.6 percentage points, reaching 18.4%
9% increase in total revenue from sales of equipment, IT solutions and
services (excluding intra-group transactions)
12% increase in revenue of the radiopharmaceuticals segment,
excluding intra-group transactions
82.5
102.1
FY2023
Q1-Q4
FY2024
Total comprehensive income
+24%
PLN 23.0 million net loss from the business designated for spin-off,
compared with PLN 16.0 million a year earlier
6.
6
Q4 FY 2024Financial results | Investor presentation
5.5
29.8
52.7
6.2
10.9
24.9
7.1
24.9
31.7
13.3
31.7 33.8
Q1 2021 Q1 2022 Q1 2023 Q1 2024 Q2 2021 Q2 2022 Q2 2023 Q2 2024 Q3 2021 Q3 2022 Q3 2023 Q3 2024 Q4 2021 Q4 2022 Q4 2023 Q4 2024
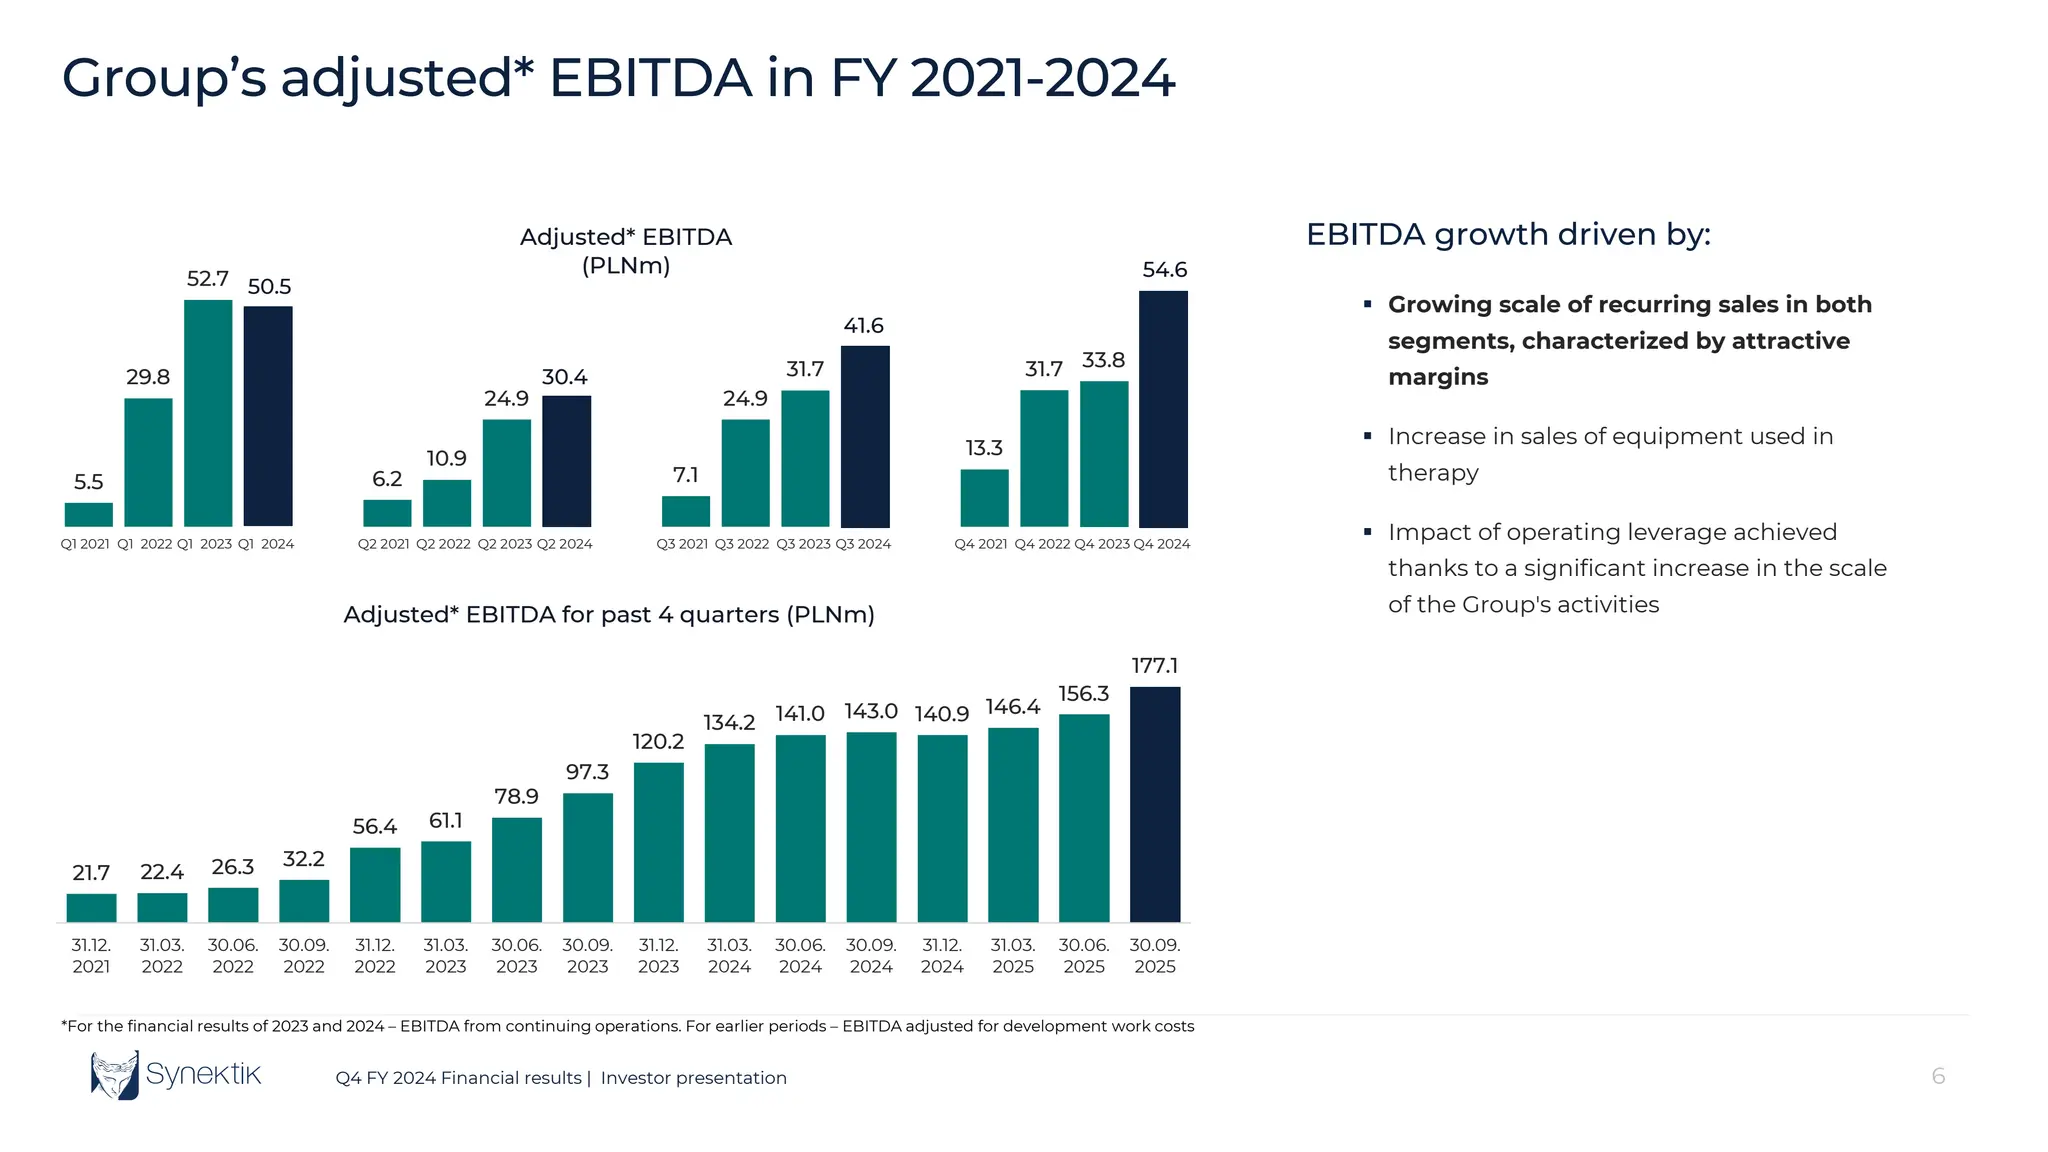
Adjusted* EBITDA
(PLNm)
50.5
Group’s adjusted* EBITDA in FY 2021-2024
21.7 22.4 26.3 32.2
56.4 61.1
78.9
97.3
120.2
134.2 141.0 143.0 140.9 146.4
156.3
177.1
31.12.
2021
31.03.
2022
30.06.
2022
30.09.
2022
31.12.
2022
31.03.
2023
30.06.
2023
30.09.
2023
31.12.
2023
31.03.
2024
30.06.
2024
30.09.
2024
31.12.
2024
31.03.
2025
30.06.
2025
30.09.
2025
Adjusted* EBITDA for past 4 quarters (PLNm)
*For the financial results of 2023 and 2024 – EBITDA from continuing operations. For earlier periods – EBITDA adjusted for development work costs
30.4
EBITDA growth driven by:
Growing scale of recurring sales in both
segments, characterized by attractive
margins
Increase in sales of equipment used in
therapy
Impact of operating leverage achieved
thanks to a significant increase in the scale
of the Group's activities
41.6
54.6
7.
7
Q4 FY 2024Financial results | Investor presentation
Group’s recurring sales in FY 2021-2024
18.2 25.0
41.6
59.8
75.4
92.4 100.3
112.9
133.6
151.6
170.1
193.9
219.8
250.4
284.0
311.0
21.8
22.0
21.5
22.0
21.8
23.5
25.3
26.5
28.5
29.5
30.2
31.5
31.9
33.2
35.0
35.8
31.12.
2021
31.03.
2022
30.06.
2022
30.09.
2022
31.12.
2022
31.03.
2023
30.06.
2023
30.09.
2023
31.12.
2023
31.03.
2024
30.06.
2024
30.09.
2024
31.12.
2024
31.03.
2025
30.06.
2025
30.09.
2025
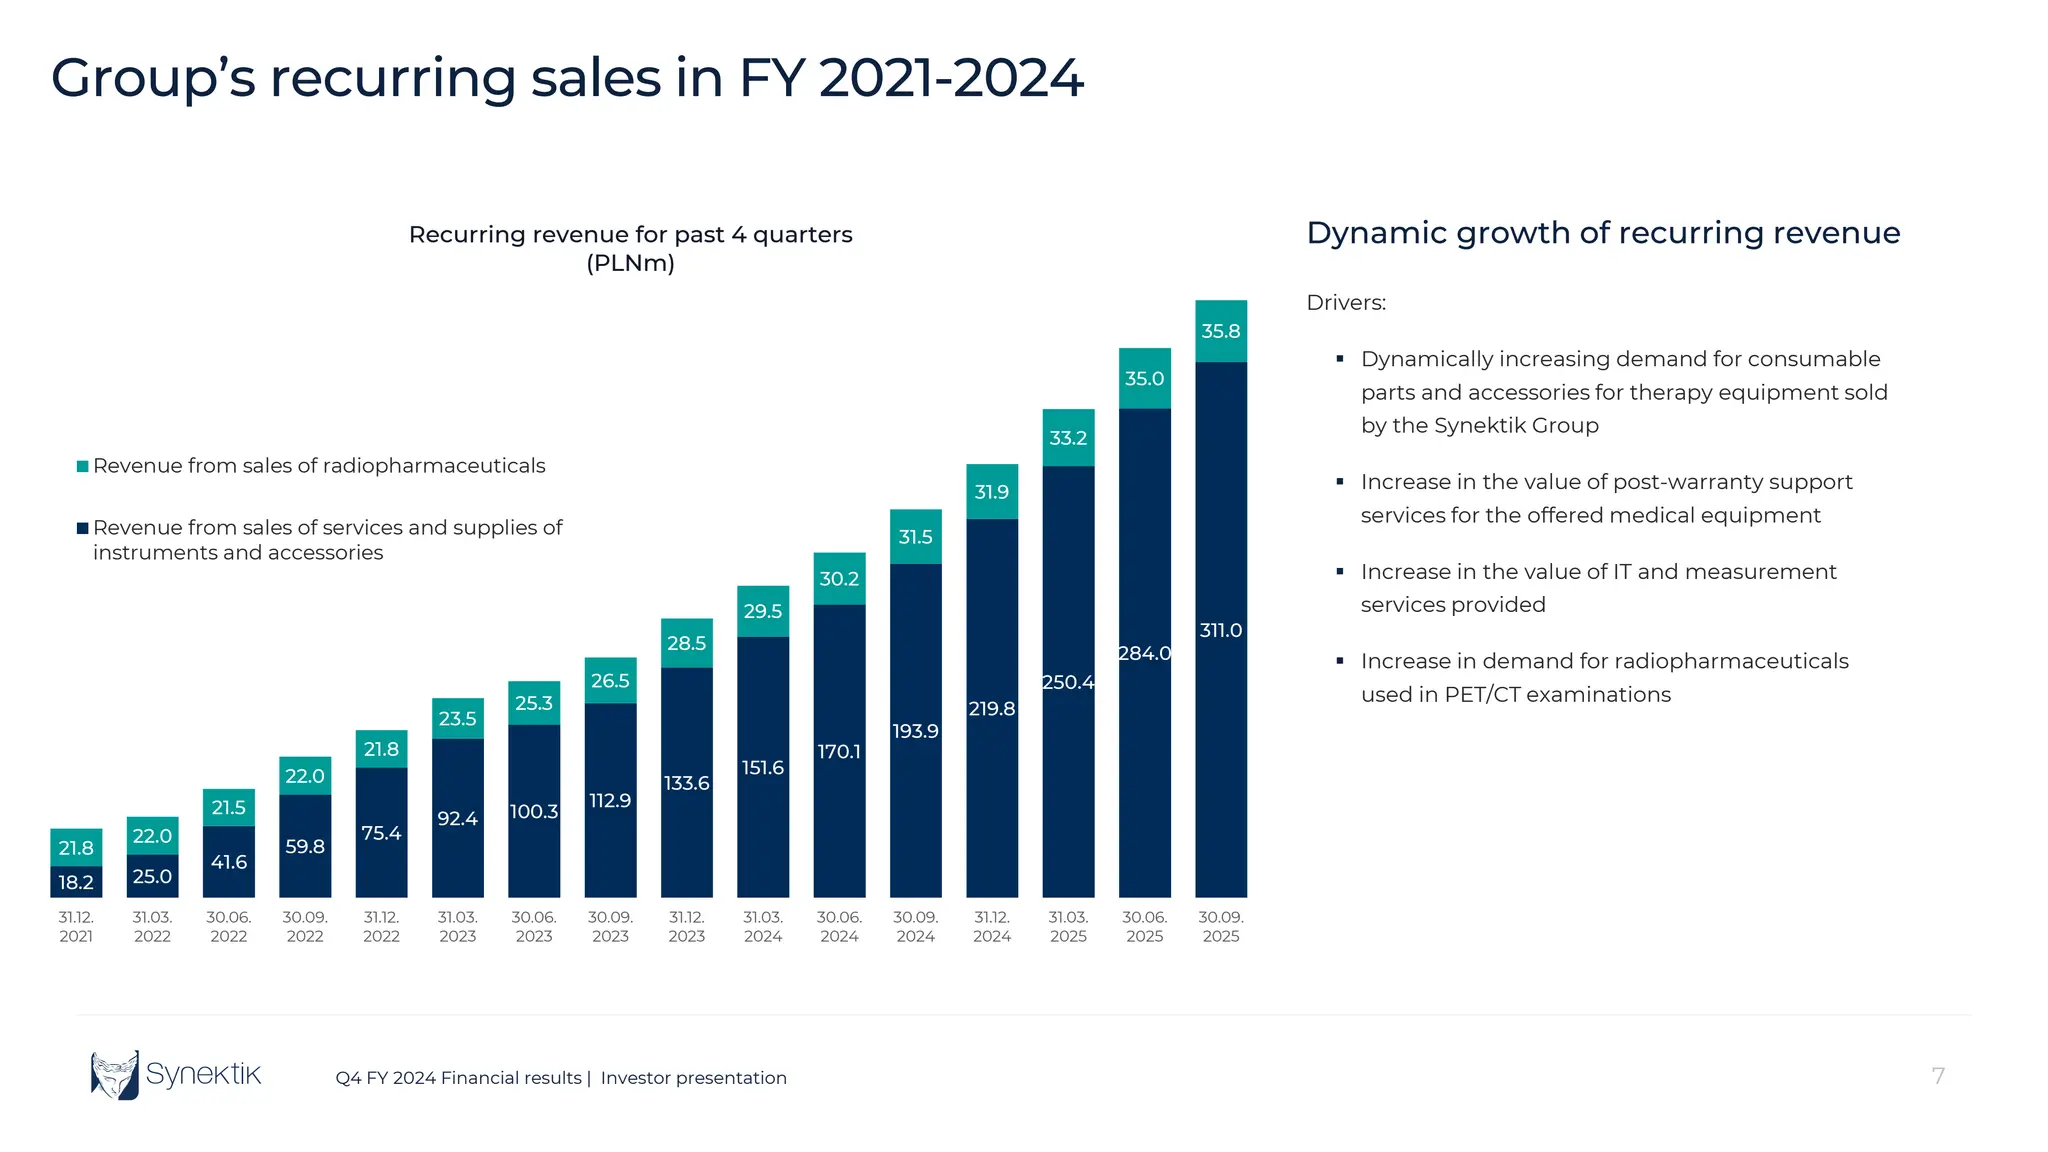
Recurring revenue for past 4 quarters
(PLNm)
Revenue from sales of radiopharmaceuticals
Revenue from sales of services and supplies of
instruments and accessories
Dynamic growth of recurring revenue
Drivers:
Dynamically increasing demand for consumable
parts and accessories for therapy equipment sold
by the Synektik Group
Increase in the value of post-warranty support
services for the offered medical equipment
Increase in the value of IT and measurement
services provided
Increase in demand for radiopharmaceuticals
used in PET/CT examinations
8.
8
Q4 FY 2024Financial results | Investor presentation
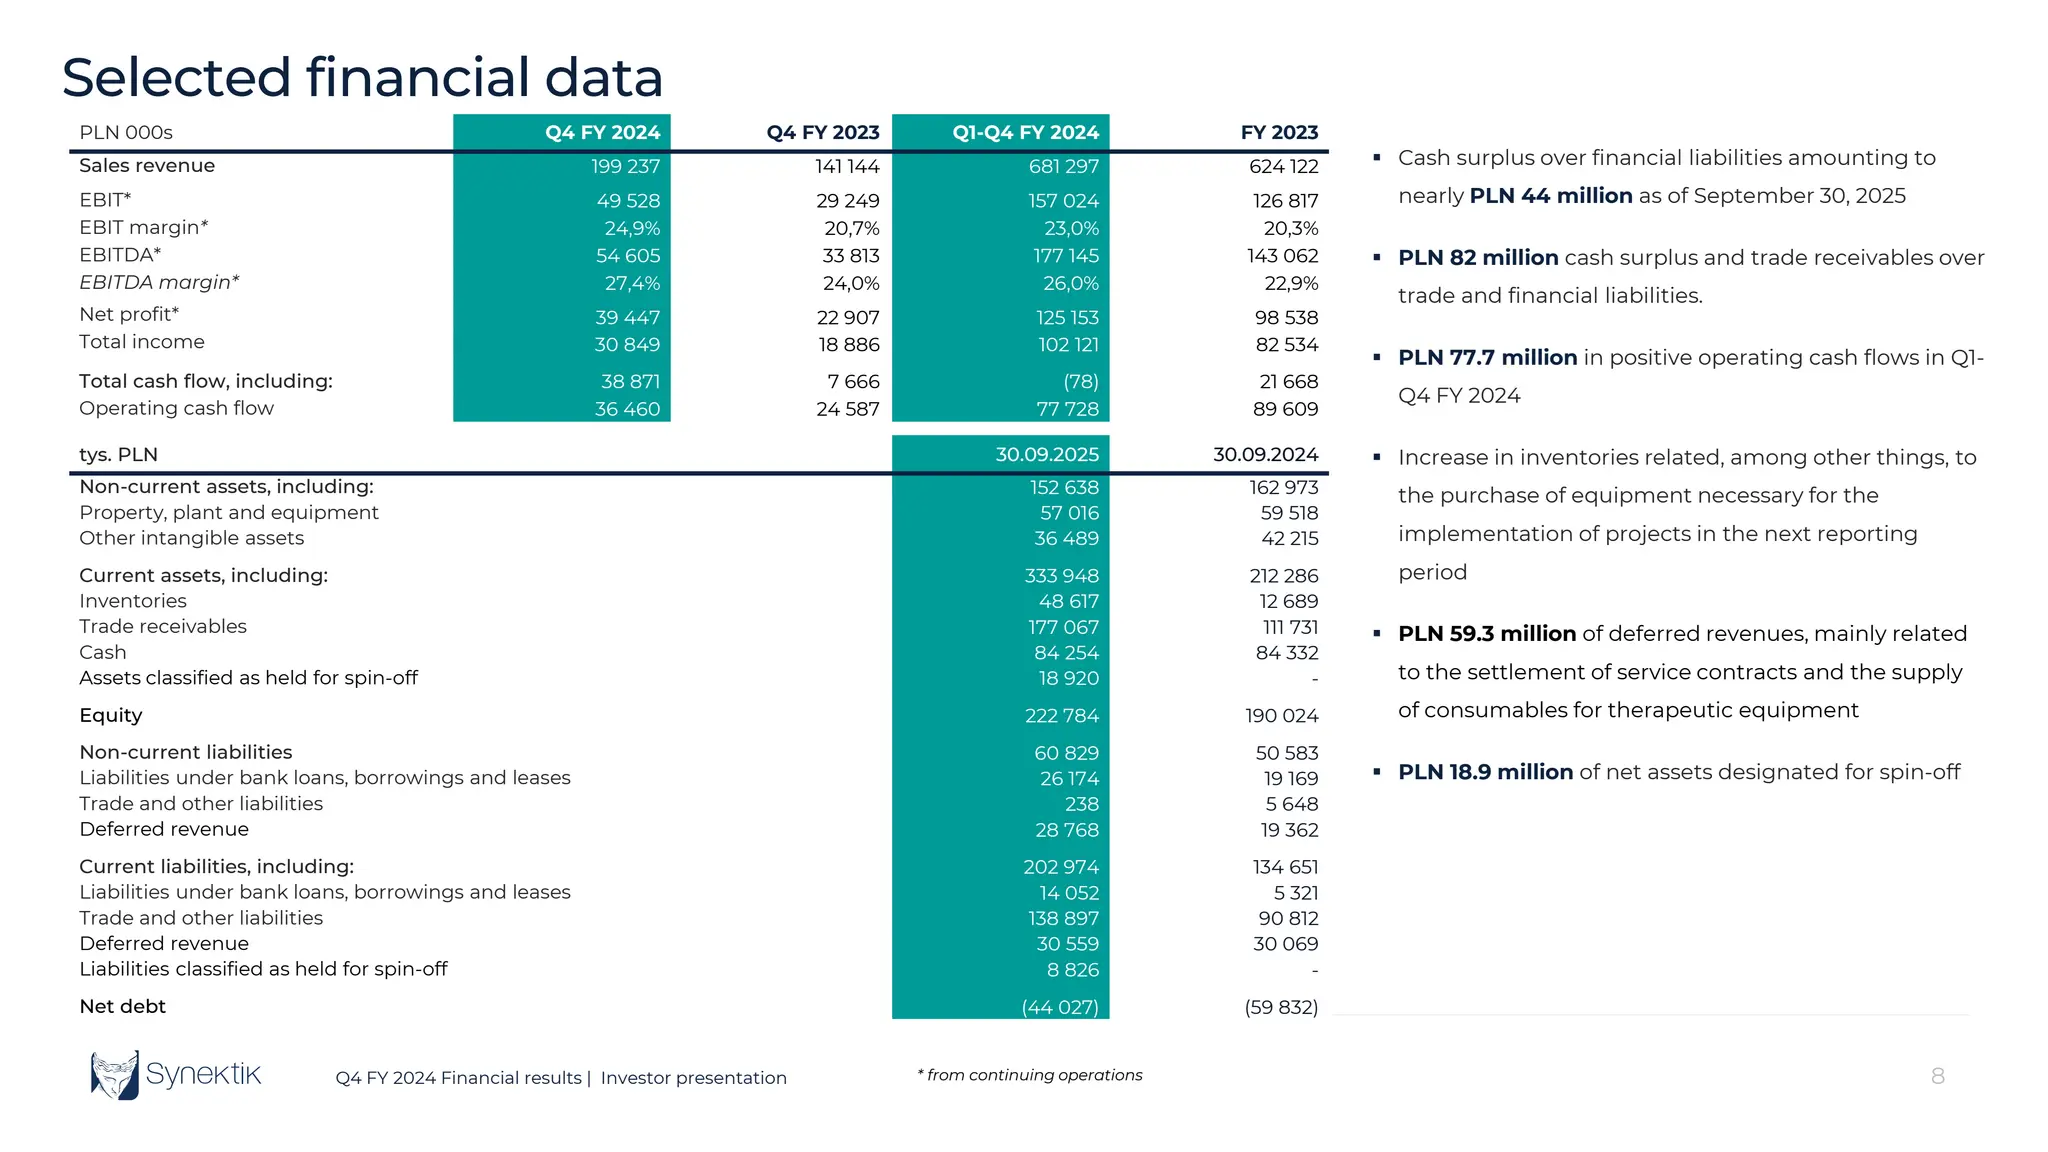
Selected financial data
tys. PLN 30.09.2025 30.09.2024
Non-current assets, including: 152 638 162 973
Property, plant and equipment 57 016 59 518
Other intangible assets 36 489 42 215
Current assets, including: 333 948 212 286
Inventories 48 617 12 689
Trade receivables 177 067 111 731
Cash 84 254 84 332
Assets classified as held for spin-off 18 920 -
Equity 222 784 190 024
Non-current liabilities 60 829 50 583
Liabilities under bank loans, borrowings and leases 26 174 19 169
Trade and other liabilities 238 5 648
Deferred revenue 28 768 19 362
Current liabilities, including: 202 974 134 651
Liabilities under bank loans, borrowings and leases 14 052 5 321
Trade and other liabilities 138 897 90 812
Deferred revenue 30 559 30 069
Liabilities classified as held for spin-off 8 826 -
Net debt (44 027) (59 832)
PLN 000s Q4 FY 2024 Q4 FY 2023 Q1-Q4 FY 2024 FY 2023
Sales revenue 199 237 141 144 681 297 624 122
EBIT* 49 528 29 249 157 024 126 817
EBIT margin* 24,9% 20,7% 23,0% 20,3%
EBITDA* 54 605 33 813 177 145 143 062
EBITDA margin* 27,4% 24,0% 26,0% 22,9%
Net profit* 39 447 22 907 125 153 98 538
Total income 30 849 18 886 102 121 82 534
Total cash flow, including: 38 871 7 666 (78) 21 668
Operating cash flow 36 460 24 587 77 728 89 609
* from continuing operations
Cash surplus over financial liabilities amounting to
nearly PLN 44 million as of September 30, 2025
PLN 82 million cash surplus and trade receivables over
trade and financial liabilities.
PLN 77.7 million in positive operating cash flows in Q1-
Q4 FY 2024
Increase in inventories related, among other things, to
the purchase of equipment necessary for the
implementation of projects in the next reporting
period
PLN 59.3 million of deferred revenues, mainly related
to the settlement of service contracts and the supply
of consumables for therapeutic equipment
PLN 18.9 million of net assets designated for spin-off
9.
9
Q4 FY 2024Financial results | Investor presentation 9
Q3 FY 2024 Financial results | Investor presentation
SYNEKTIK SA
Medical equipment and IT solutions
10.
10
Q4 FY 2024Financial results | Investor presentation
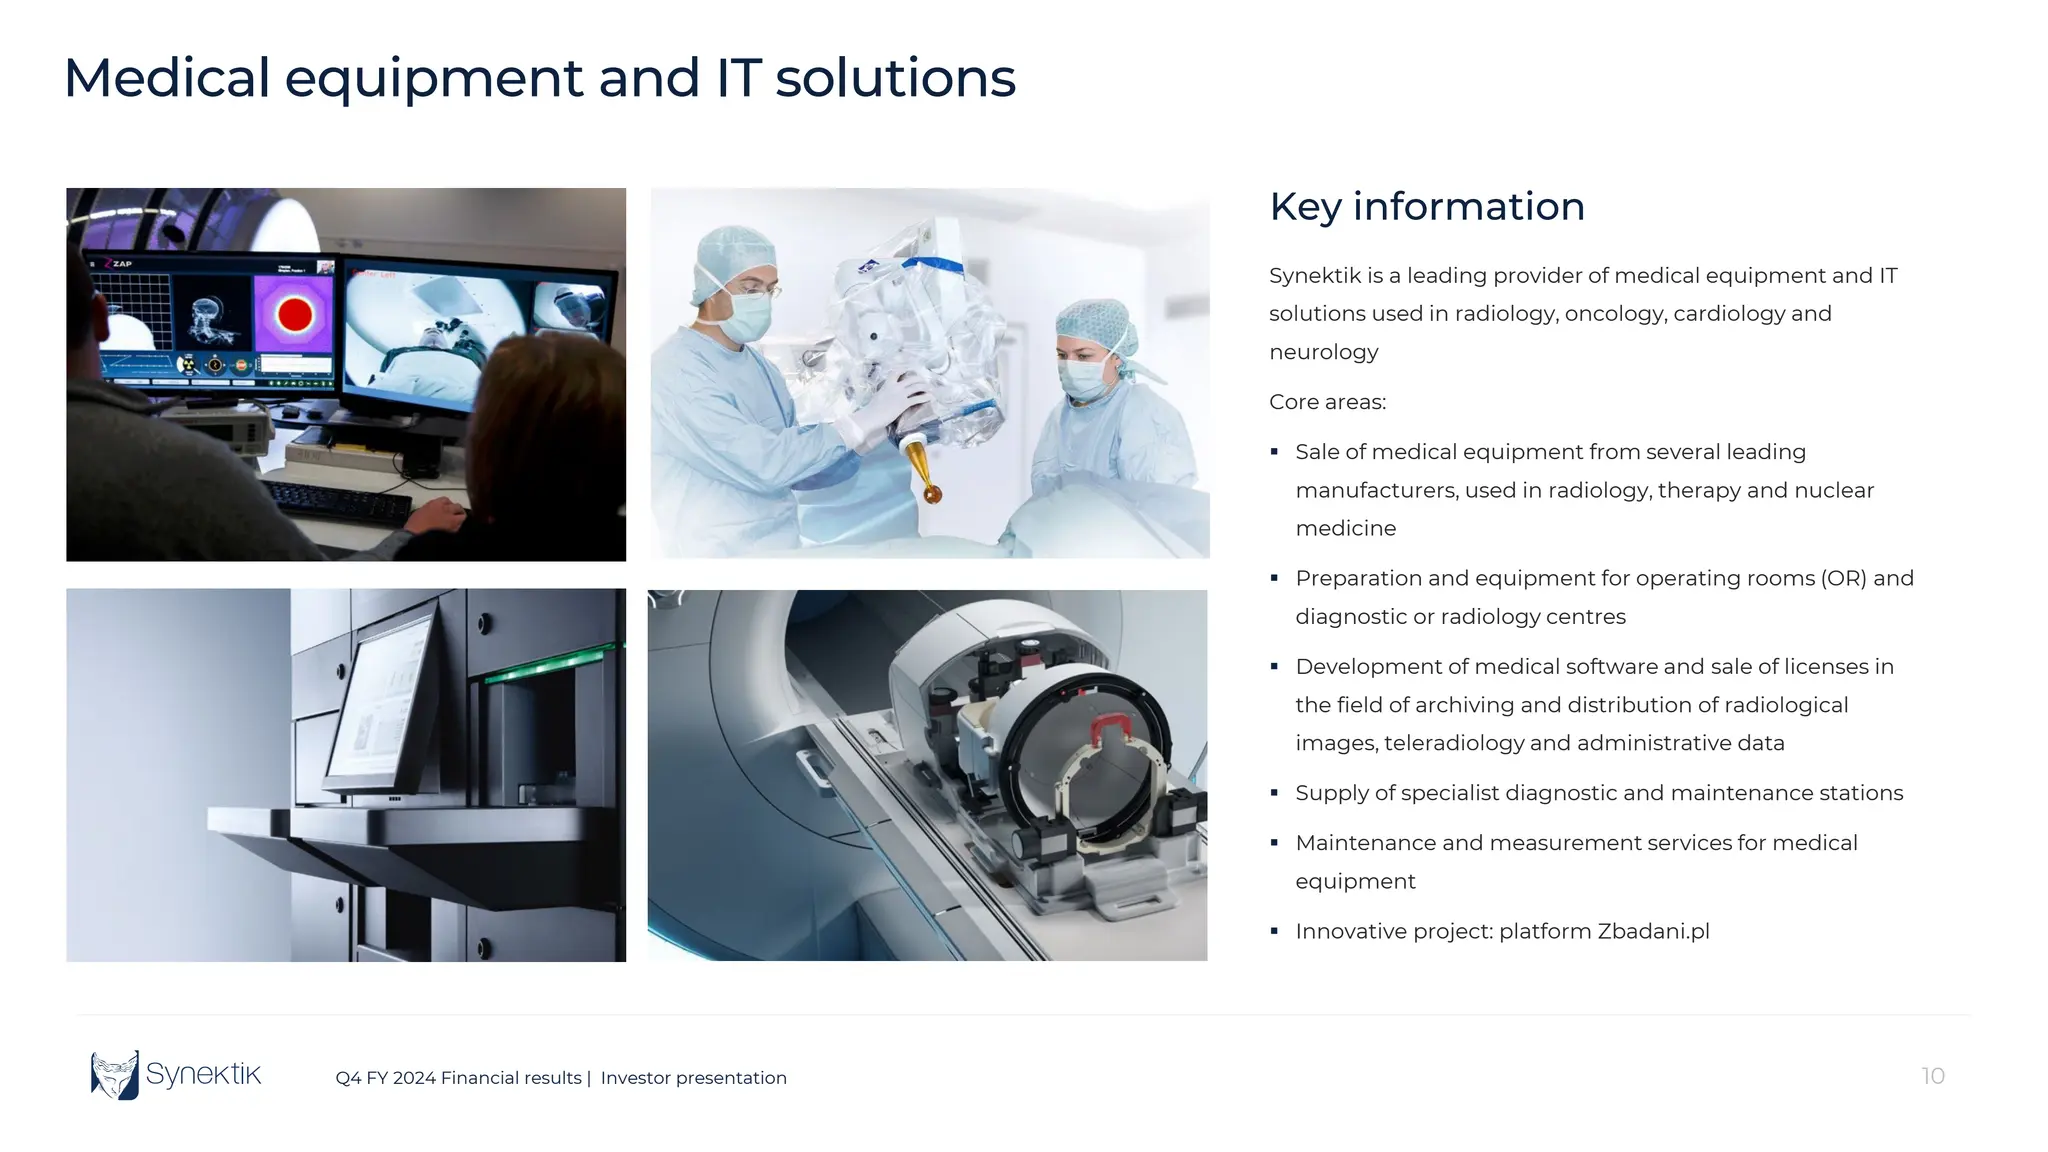
Key information
Synektik is a leading provider of medical equipment and IT
solutions used in radiology, oncology, cardiology and
neurology
Core areas:
Sale of medical equipment from several leading
manufacturers, used in radiology, therapy and nuclear
medicine
Preparation and equipment for operating rooms (OR) and
diagnostic or radiology centres
Development of medical software and sale of licenses in
the field of archiving and distribution of radiological
images, teleradiology and administrative data
Supply of specialist diagnostic and maintenance stations
Maintenance and measurement services for medical
equipment
Innovative project: platform Zbadani.pl
Medical equipment and IT solutions
11.
11
Q4 FY 2024Financial results | Investor presentation 11
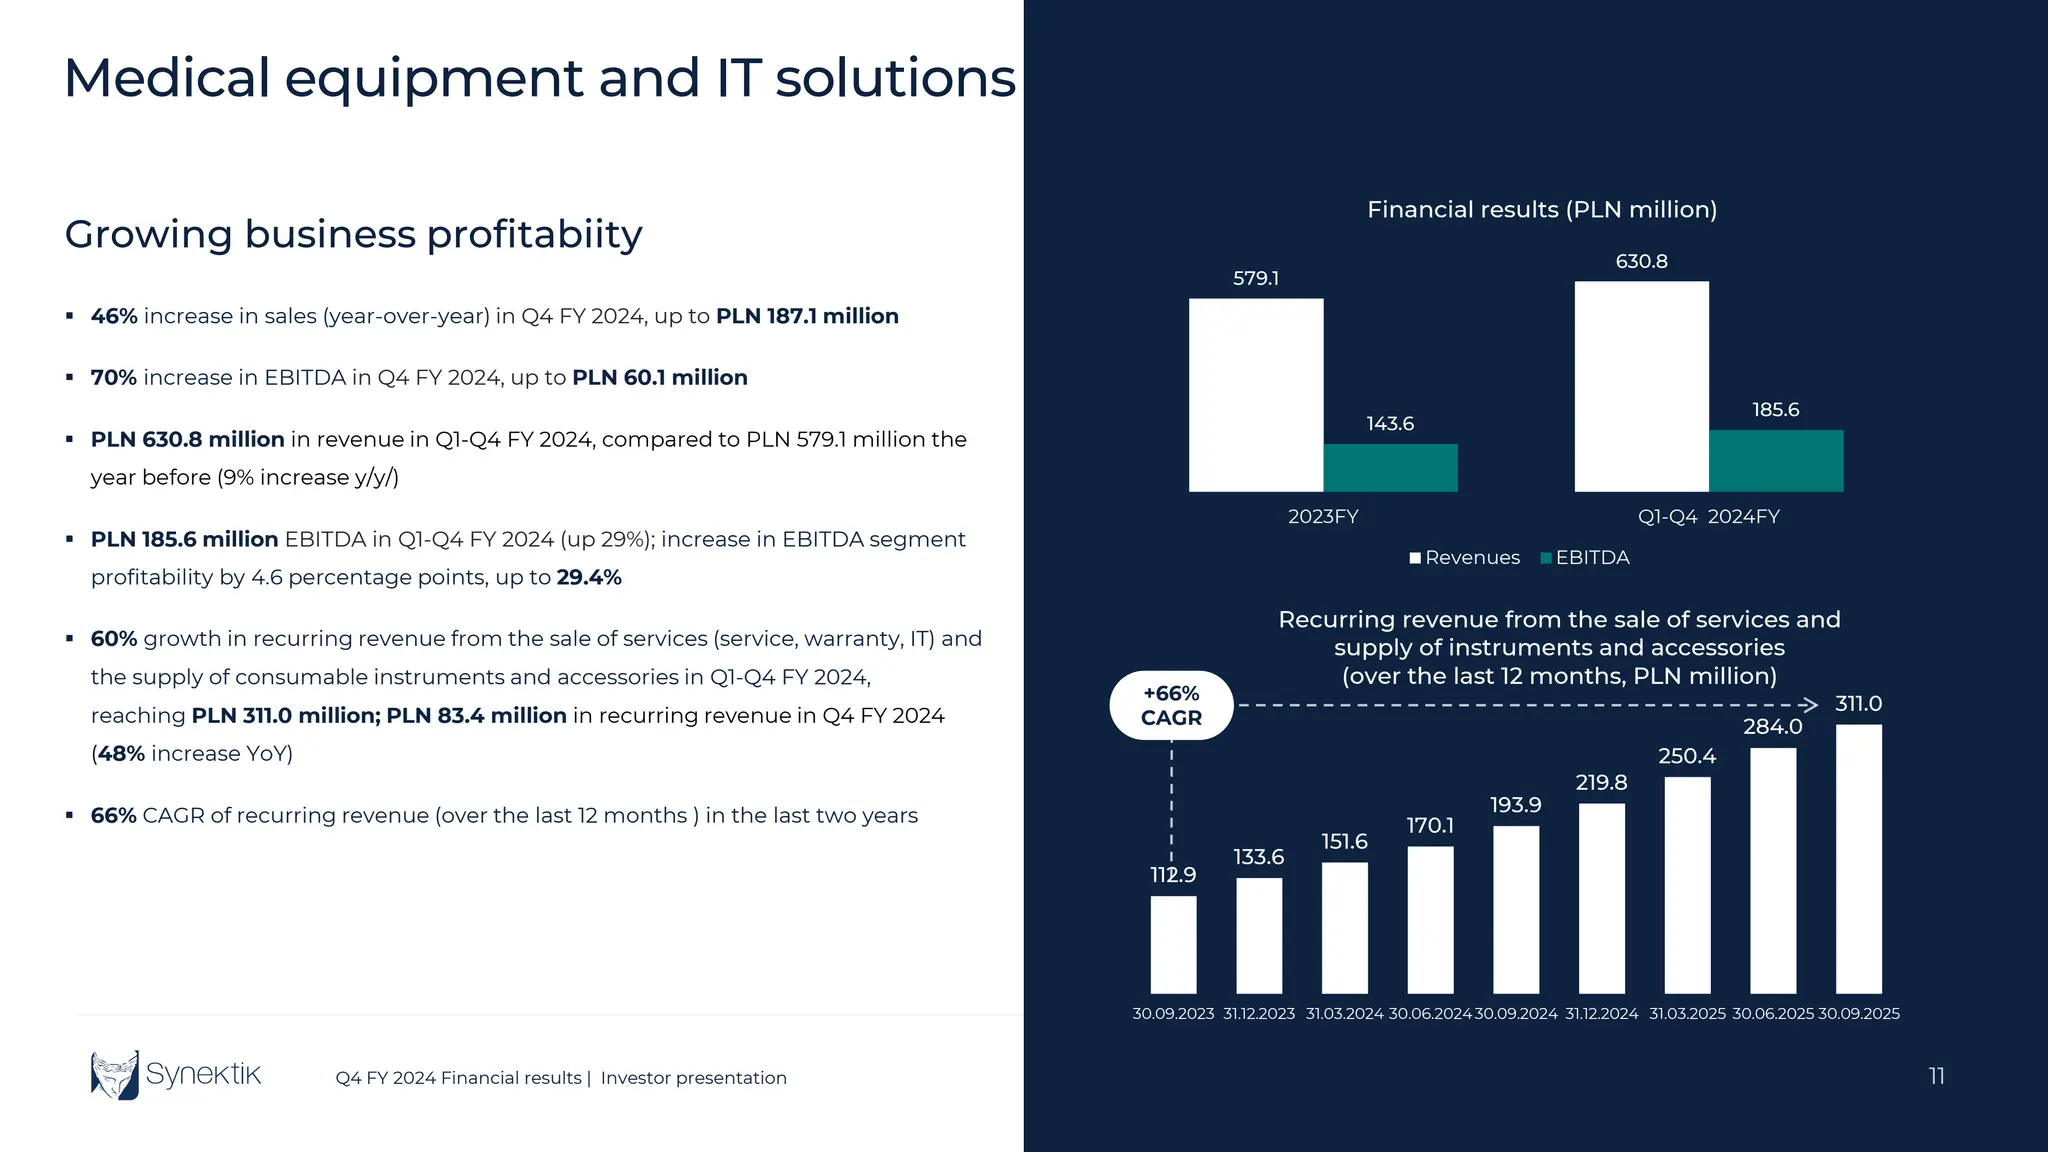
Growing business profitabiity
579.1
630.8
143.6
185.6
2023FY Q1-Q4 2024FY
Financial results (PLN million)
Revenues EBITDA
112.9
133.6
151.6
170.1
193.9
219.8
250.4
284.0
311.0
30.09.2023 31.12.2023 31.03.2024 30.06.202430.09.2024 31.12.2024 31.03.2025 30.06.2025 30.09.2025
Recurring revenue from the sale of services and
supply of instruments and accessories
(over the last 12 months, PLN million)
+66%
CAGR
Medical equipment and IT solutions
46% increase in sales (year-over-year) in Q4 FY 2024, up to PLN 187.1 million
70% increase in EBITDA in Q4 FY 2024, up to PLN 60.1 million
PLN 630.8 million in revenue in Q1-Q4 FY 2024, compared to PLN 579.1 million the
year before (9% increase y/y/)
PLN 185.6 million EBITDA in Q1-Q4 FY 2024 (up 29%); increase in EBITDA segment
profitability by 4.6 percentage points, up to 29.4%
60% growth in recurring revenue from the sale of services (service, warranty, IT) and
the supply of consumable instruments and accessories in Q1-Q4 FY 2024,
reaching PLN 311.0 million; PLN 83.4 million in recurring revenue in Q4 FY 2024
(48% increase YoY)
66% CAGR of recurring revenue (over the last 12 months ) in the last two years
12.
12
Q4 FY 2024Financial results | Investor presentation
12 months 12 months 12 months 12 months 12 months 12 months
12
Medical equipment and IT solutions
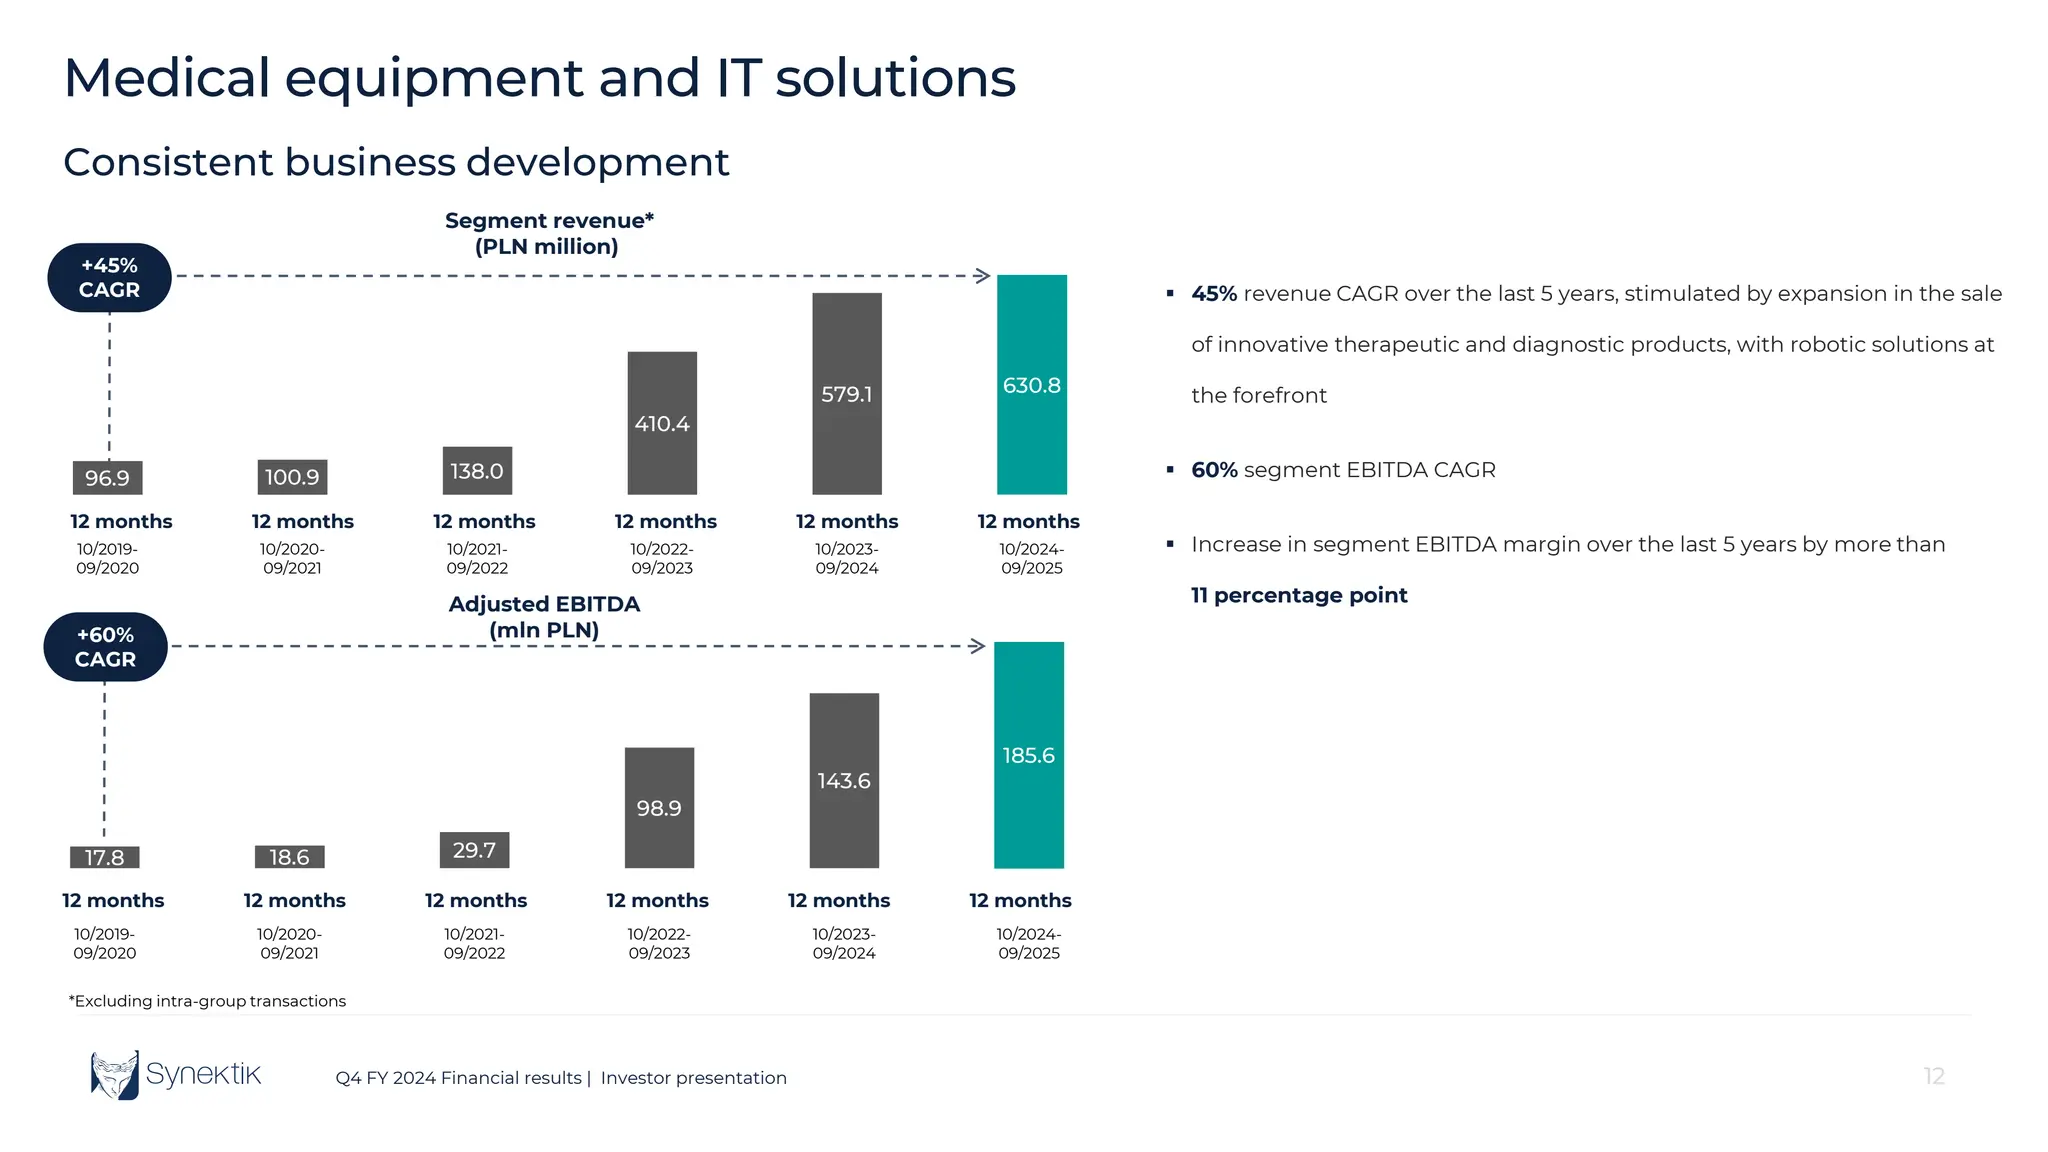
Consistent business development
96.9 100.9 138.0
410.4
579.1 630.8
10/2019-
09/2020
10/2020-
09/2021
10/2021-
09/2022
10/2022-
09/2023
10/2023-
09/2024
10/2024-
09/2025
Segment revenue*
(PLN million)
17.8 18.6 29.7
98.9
143.6
185.6
10/2019-
09/2020
10/2020-
09/2021
10/2021-
09/2022
10/2022-
09/2023
10/2023-
09/2024
10/2024-
09/2025
Adjusted EBITDA
(mln PLN)
*Excluding intra-group transactions
+45%
CAGR
12 months 12 months 12 months 12 months 12 months 12 months
+60%
CAGR
45% revenue CAGR over the last 5 years, stimulated by expansion in the sale
of innovative therapeutic and diagnostic products, with robotic solutions at
the forefront
60% segment EBITDA CAGR
Increase in segment EBITDA margin over the last 5 years by more than
11 percentage point
13.
13
Q4 FY 2024Financial results | Investor presentation 13
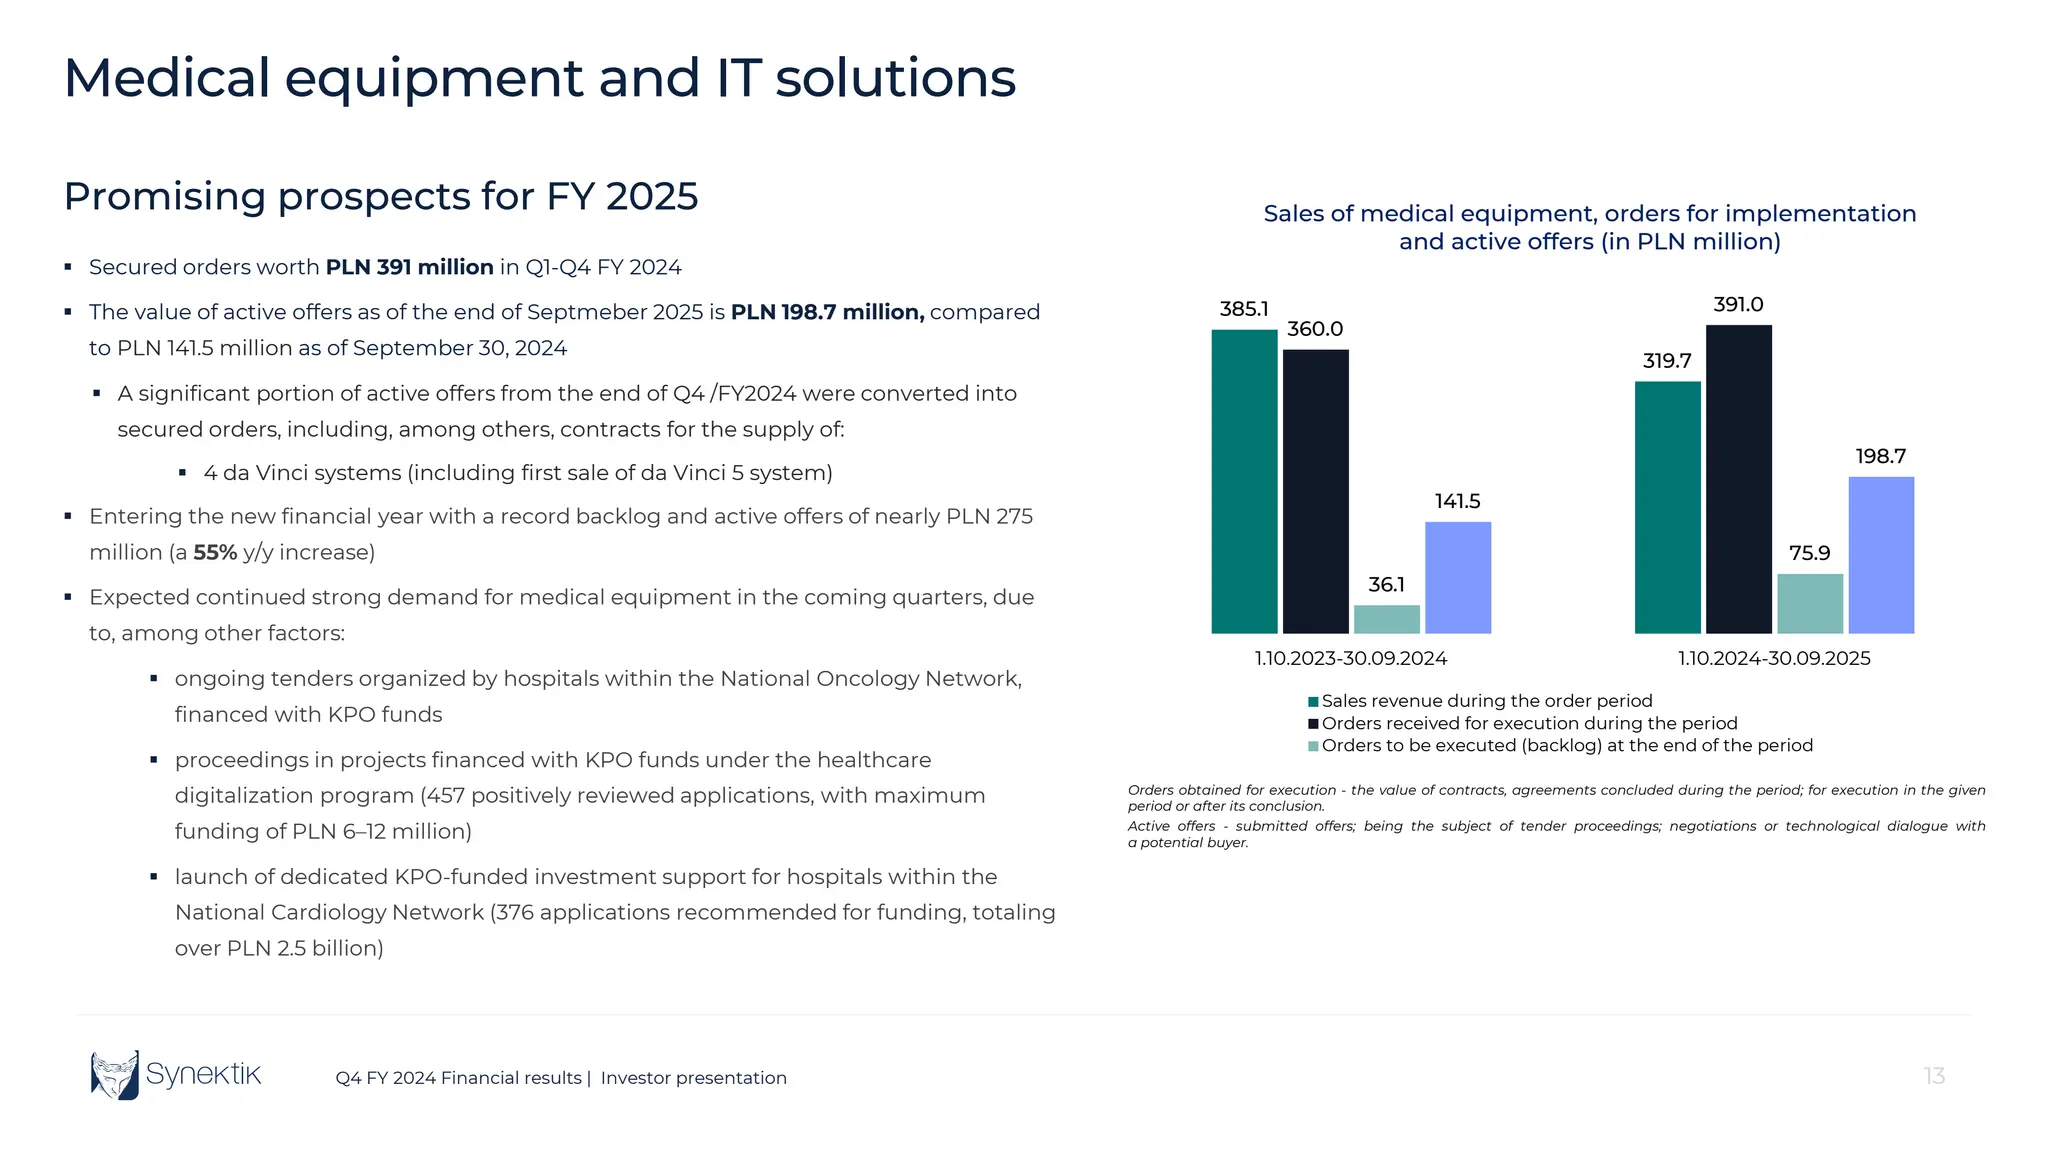
Secured orders worth PLN 391 million in Q1-Q4 FY 2024
The value of active offers as of the end of Septmeber 2025 is PLN 198.7 million, compared
to PLN 141.5 million as of September 30, 2024
A significant portion of active offers from the end of Q4 /FY2024 were converted into
secured orders, including, among others, contracts for the supply of:
4 da Vinci systems (including first sale of da Vinci 5 system)
Entering the new financial year with a record backlog and active offers of nearly PLN 275
million (a 55% y/y increase)
Expected continued strong demand for medical equipment in the coming quarters, due
to, among other factors:
ongoing tenders organized by hospitals within the National Oncology Network,
financed with KPO funds
proceedings in projects financed with KPO funds under the healthcare
digitalization program (457 positively reviewed applications, with maximum
funding of PLN 6–12 million)
launch of dedicated KPO-funded investment support for hospitals within the
National Cardiology Network (376 applications recommended for funding, totaling
over PLN 2.5 billion)
385.1
319.7
360.0
391.0
36.1
75.9
141.5
198.7
1.10.2023-30.09.2024 1.10.2024-30.09.2025
Sales of medical equipment, orders for implementation
and active offers (in PLN million)
Sales revenue during the order period
Orders received for execution during the period
Orders to be executed (backlog) at the end of the period
Orders obtained for execution - the value of contracts, agreements concluded during the period; for execution in the given
period or after its conclusion.
Active offers - submitted offers; being the subject of tender proceedings; negotiations or technological dialogue with
a potential buyer.
Medical equipment and IT solutions
Promising prospects for FY 2025
14.
14
Q4 FY 2024Financial results | Investor presentation 14
4
8
13
32
41
69
96
113
0
1000
2000
3000
4000
5000
6000
7000
8000
9000
10000
Q4
2018
Q1
2019
Q2
2019
Q3
2019
Q4
2019
Q1
2020
Q2
2020
Q3
2020
Q4
2020
Q1
2021
Q2
2021
Q3
2021
Q4
2021
Q1
2022
Q2
2022
Q3
2022
Q4
2022
Q1
2023
Q2
2023
Q3
2023
Q4
2023
Q1
2024
Q2
2024
Q3
2024
Q4
2024
Q1
2025
Q2
2025
Q3
2025
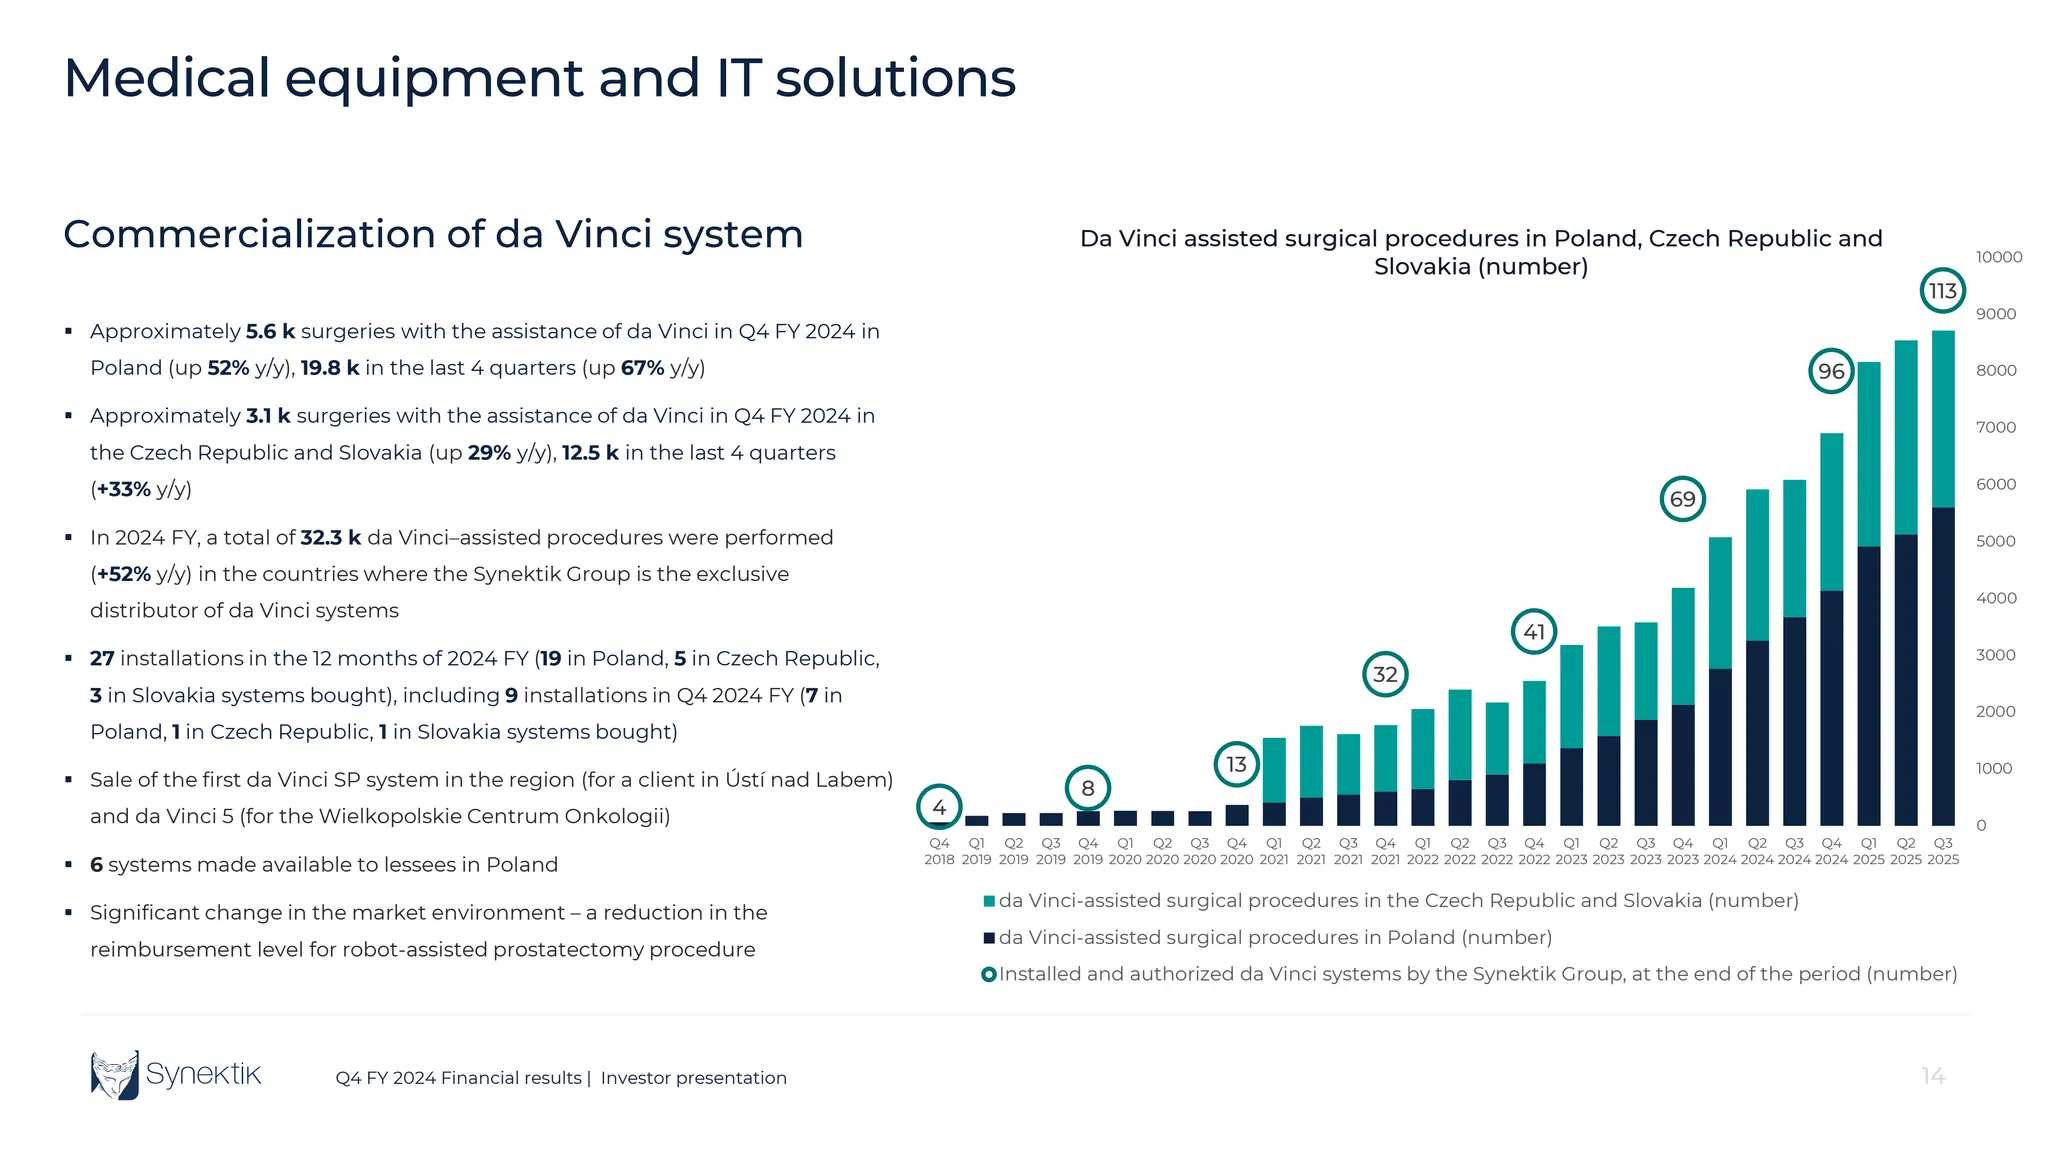
Da Vinci assisted surgical procedures in Poland, Czech Republic and
Slovakia (number)
da Vinci-assisted surgical procedures in the Czech Republic and Slovakia (number)
da Vinci-assisted surgical procedures in Poland (number)
Installed and authorized da Vinci systems by the Synektik Group, at the end of the period (number)
Commercialization of da Vinci system
Approximately 5.6 k surgeries with the assistance of da Vinci in Q4 FY 2024 in
Poland (up 52% y/y), 19.8 k in the last 4 quarters (up 67% y/y)
Approximately 3.1 k surgeries with the assistance of da Vinci in Q4 FY 2024 in
the Czech Republic and Slovakia (up 29% y/y), 12.5 k in the last 4 quarters
(+33% y/y)
In 2024 FY, a total of 32.3 k da Vinci–assisted procedures were performed
(+52% y/y) in the countries where the Synektik Group is the exclusive
distributor of da Vinci systems
27 installations in the 12 months of 2024 FY (19 in Poland, 5 in Czech Republic,
3 in Slovakia systems bought), including 9 installations in Q4 2024 FY (7 in
Poland, 1 in Czech Republic, 1 in Slovakia systems bought)
Sale of the first da Vinci SP system in the region (for a client in Ústí nad Labem)
and da Vinci 5 (for the Wielkopolskie Centrum Onkologii)
6 systems made available to lessees in Poland
Significant change in the market environment – a reduction in the
reimbursement level for robot-assisted prostatectomy procedure
Medical equipment and IT solutions
15.
15
Q4 FY 2024Financial results | Investor presentation
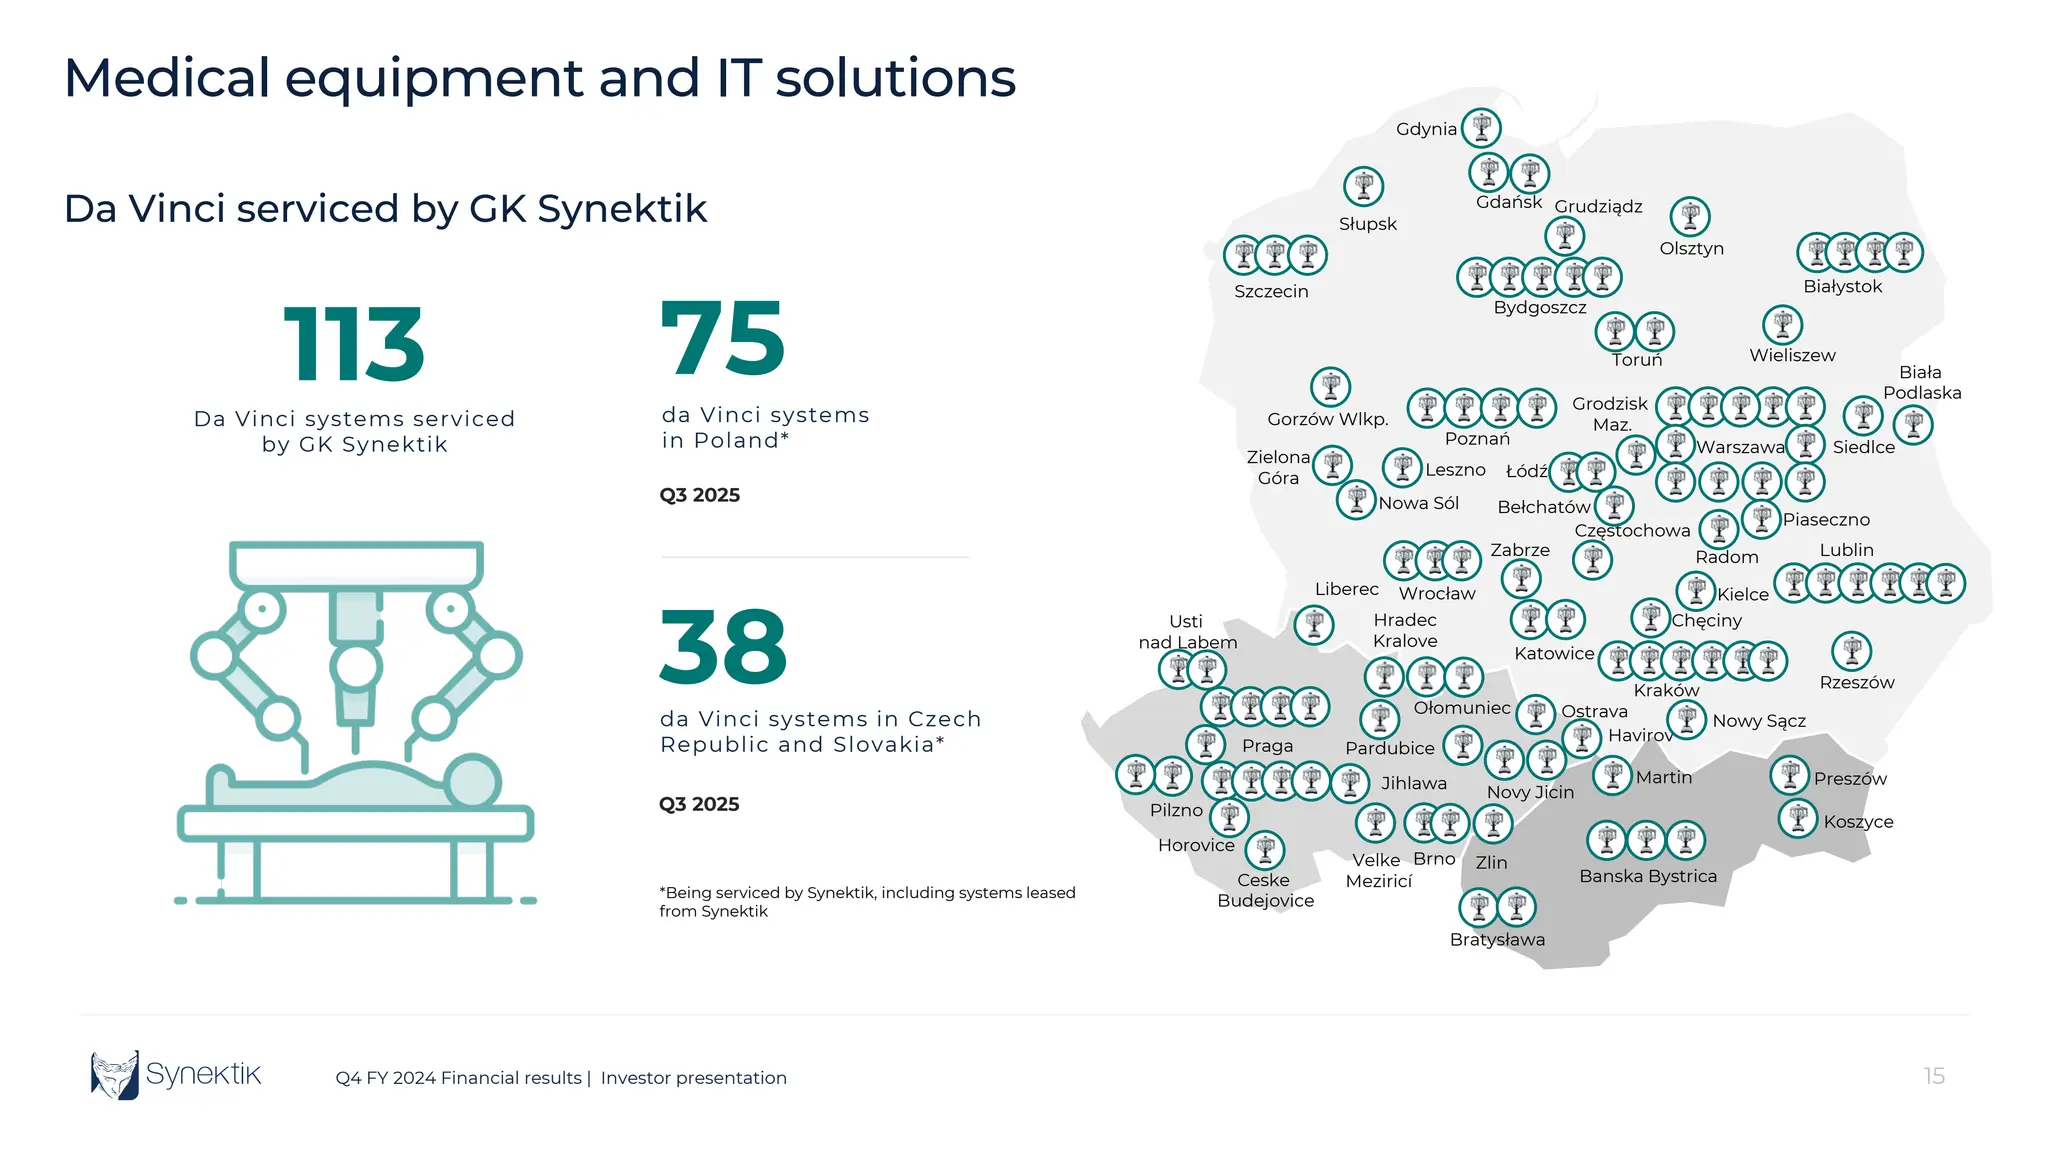
38
Q3 2025
75
Q3 2025
Da Vinci serviced by GK Synektik
*Being serviced by Synektik, including systems leased
from Synektik
da Vinci systems in Czech
Republic and Slovakia*
da Vinci systems
in Poland* Warszawa
Wrocław
Białystok
Poznań
Kraków
Siedlce
Wieliszew
Szczecin
Gdańsk
Gorzów Wlkp.
Lublin
Gdynia
Katowice
Bydgoszcz
Rzeszów
Łódź
Toruń
Usti
nad Labem
Pilzno
Ceske
Budejovice
Hradec
Kralove
Velke
Meziricí
Brno
Novy Jicin
Ołomuniec
Banska Bystrica
Ostrava
Praga
Martin
Jihlawa
Liberec
Bratysława
Koszyce
Kielce
Leszno
Zlin
Częstochowa
Słupsk
Zielona
Góra
Olsztyn
Pardubice
Havirov
Piaseczno
Nowa Sól
113
Da Vinci systems serviced
by GK Synektik
Zabrze Radom
Biała
Podlaska
Grodzisk
Maz.
Bełchatów
Medical equipment and IT solutions
Horovice
Preszów
Chęciny
Nowy Sącz
Grudziądz
17
Q4 FY 2024Financial results | Investor presentation
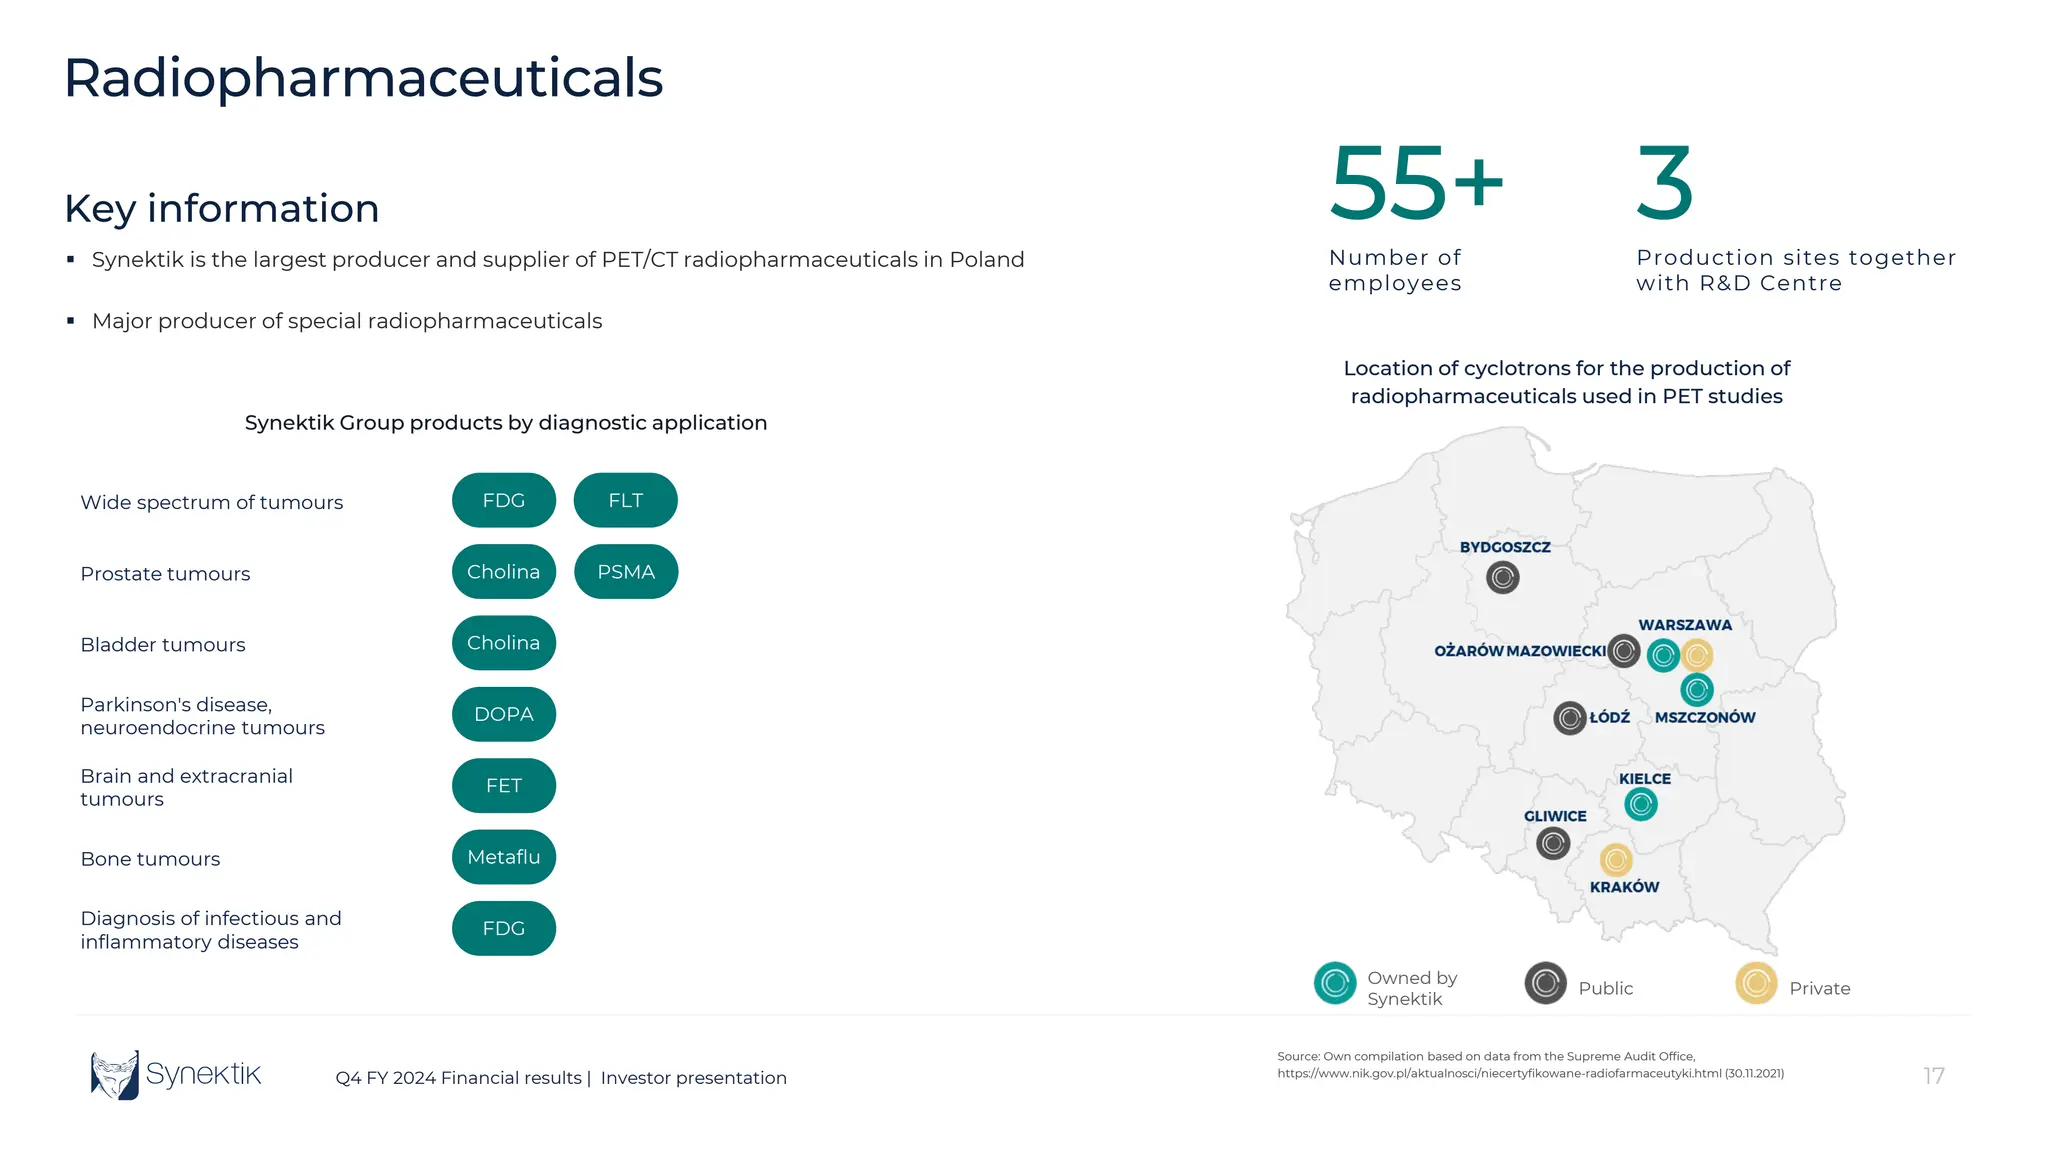
Key information
Radiopharmaceuticals
55+
Number of
employees
Synektik Group products by diagnostic application
Wide spectrum of tumours
Prostate tumours
Bladder tumours
Parkinson's disease,
neuroendocrine tumours
Brain and extracranial
tumours
Bone tumours
Diagnosis of infectious and
inflammatory diseases
PSMA
FDG FLT
Cholina
Cholina
Metaflu
FET
DOPA
FDG
Synektik is the largest producer and supplier of PET/CT radiopharmaceuticals in Poland
Major producer of special radiopharmaceuticals
3
Production sites together
with R&D Centre
Location of cyclotrons for the production of
radiopharmaceuticals used in PET studies
Owned by
Synektik
Public Private
Source: Own compilation based on data from the Supreme Audit Office,
https://www.nik.gov.pl/aktualnosci/niecertyfikowane-radiofarmaceutyki.html (30.11.2021)
18.
18
Q4 FY 2024Financial results | Investor presentation
Radiopharmaceuticals
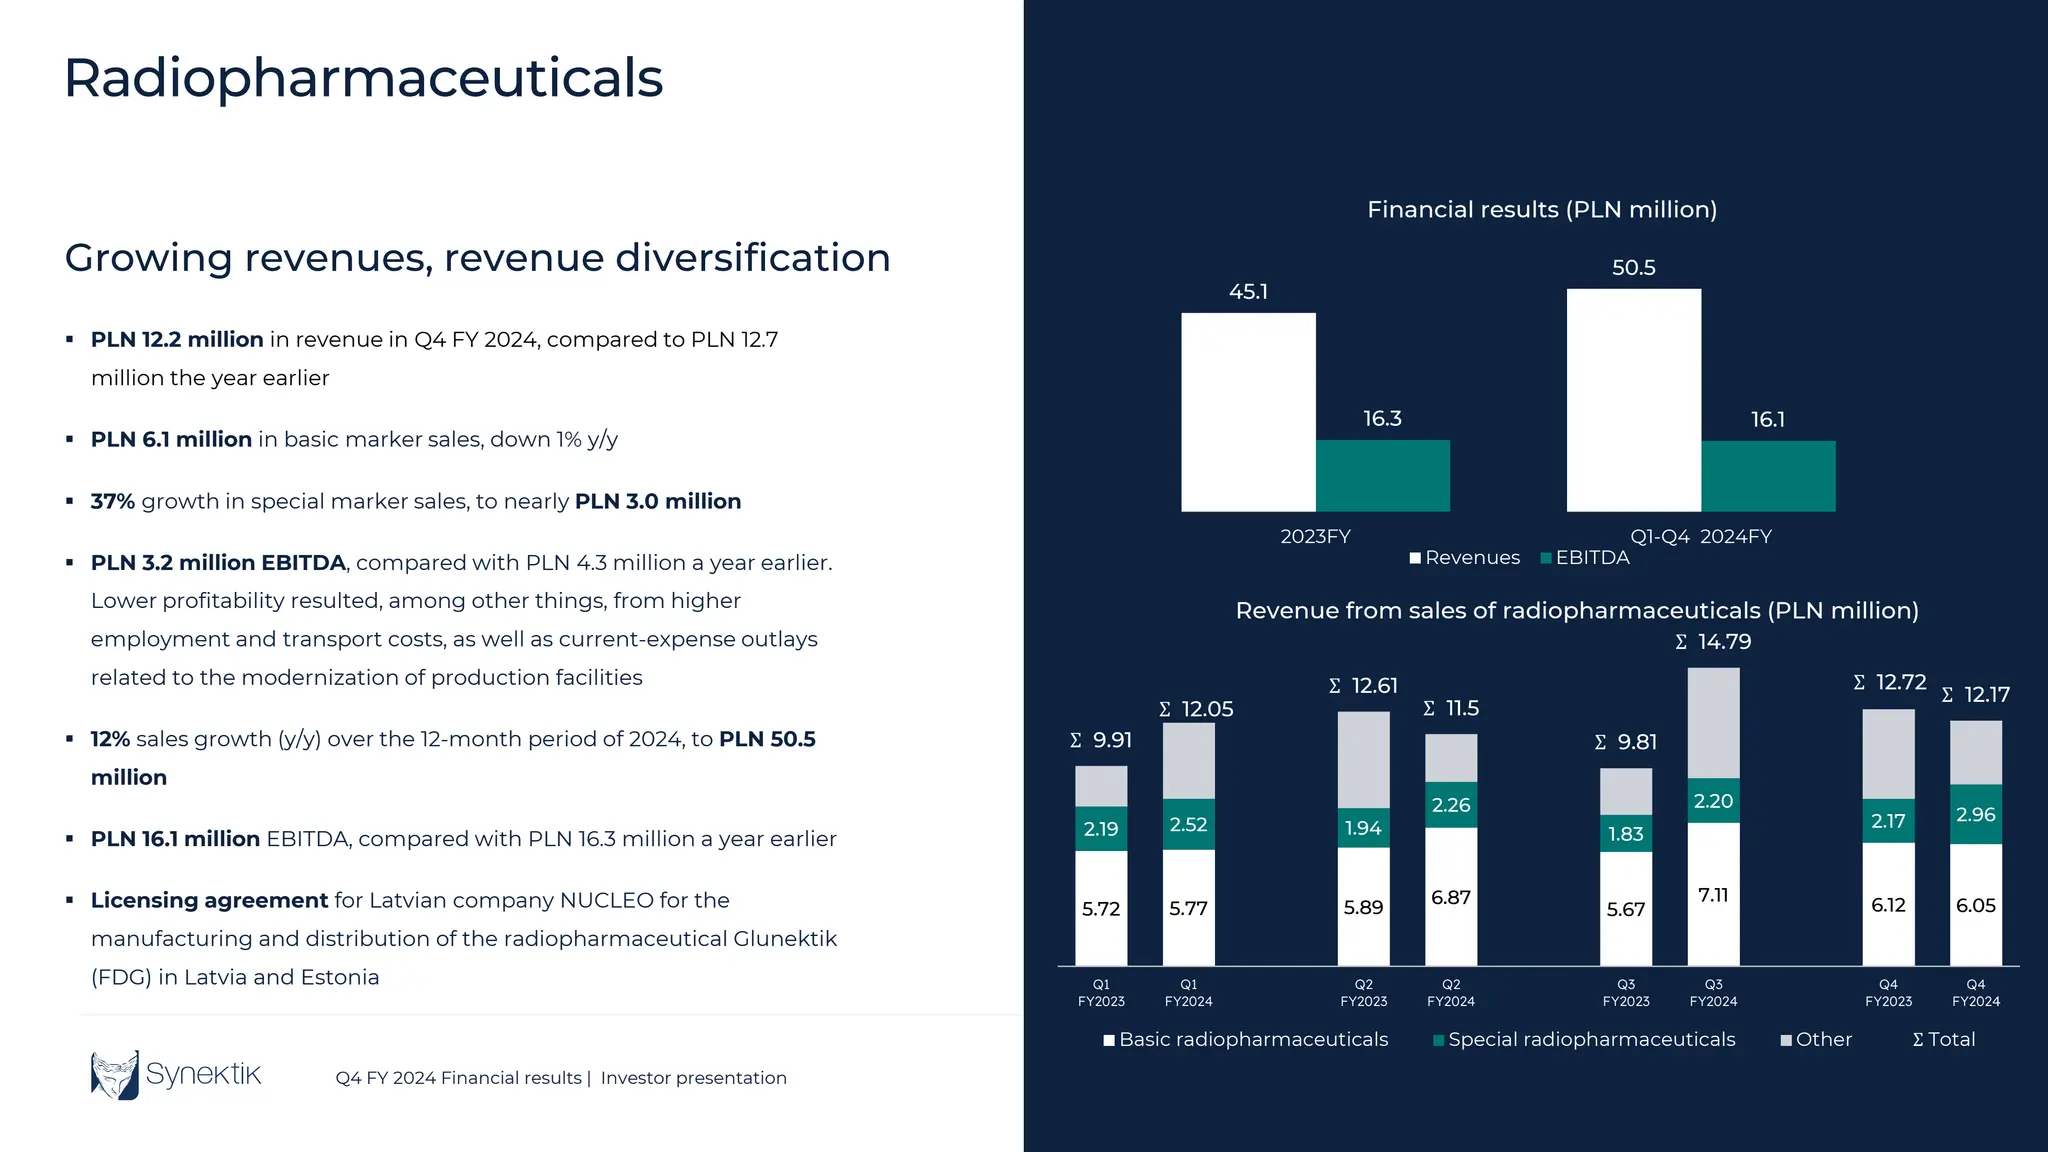
Growing revenues, revenue diversification
PLN 12.2 million in revenue in Q4 FY 2024, compared to PLN 12.7
million the year earlier
PLN 6.1 million in basic marker sales, down 1% y/y
37% growth in special marker sales, to nearly PLN 3.0 million
PLN 3.2 million EBITDA, compared with PLN 4.3 million a year earlier.
Lower profitability resulted, among other things, from higher
employment and transport costs, as well as current-expense outlays
related to the modernization of production facilities
12% sales growth (y/y) over the 12-month period of 2024, to PLN 50.5
million
PLN 16.1 million EBITDA, compared with PLN 16.3 million a year earlier
Licensing agreement for Latvian company NUCLEO for the
manufacturing and distribution of the radiopharmaceutical Glunektik
(FDG) in Latvia and Estonia
45.1
50.5
16.3 16.1
2023FY Q1-Q4 2024FY
Financial results (PLN million)
Revenues EBITDA
5.72 5.77 5.89
6.87
5.67
7.11
6.12 6.05
2.19 2.52 1.94
2.26
1.83
2.20
2.17 2.96
Σ 9.91
Σ 12.05
Σ 12.61
Σ 11.5
Σ 9.81
Σ 14.79
Σ 12.72
Σ 12.17
Q1
FY2023
Q1
FY2024
Q2
FY2023
Q2
FY2024
Q3
FY2023
Q3
FY2024
Q4
FY2023
Q4
FY2024
Revenue from sales of radiopharmaceuticals (PLN million)
Basic radiopharmaceuticals Special radiopharmaceuticals Other Σ Total
19.
19
Q4 FY 2024Financial results | Investor presentation
Radiopharmaceuticals
19
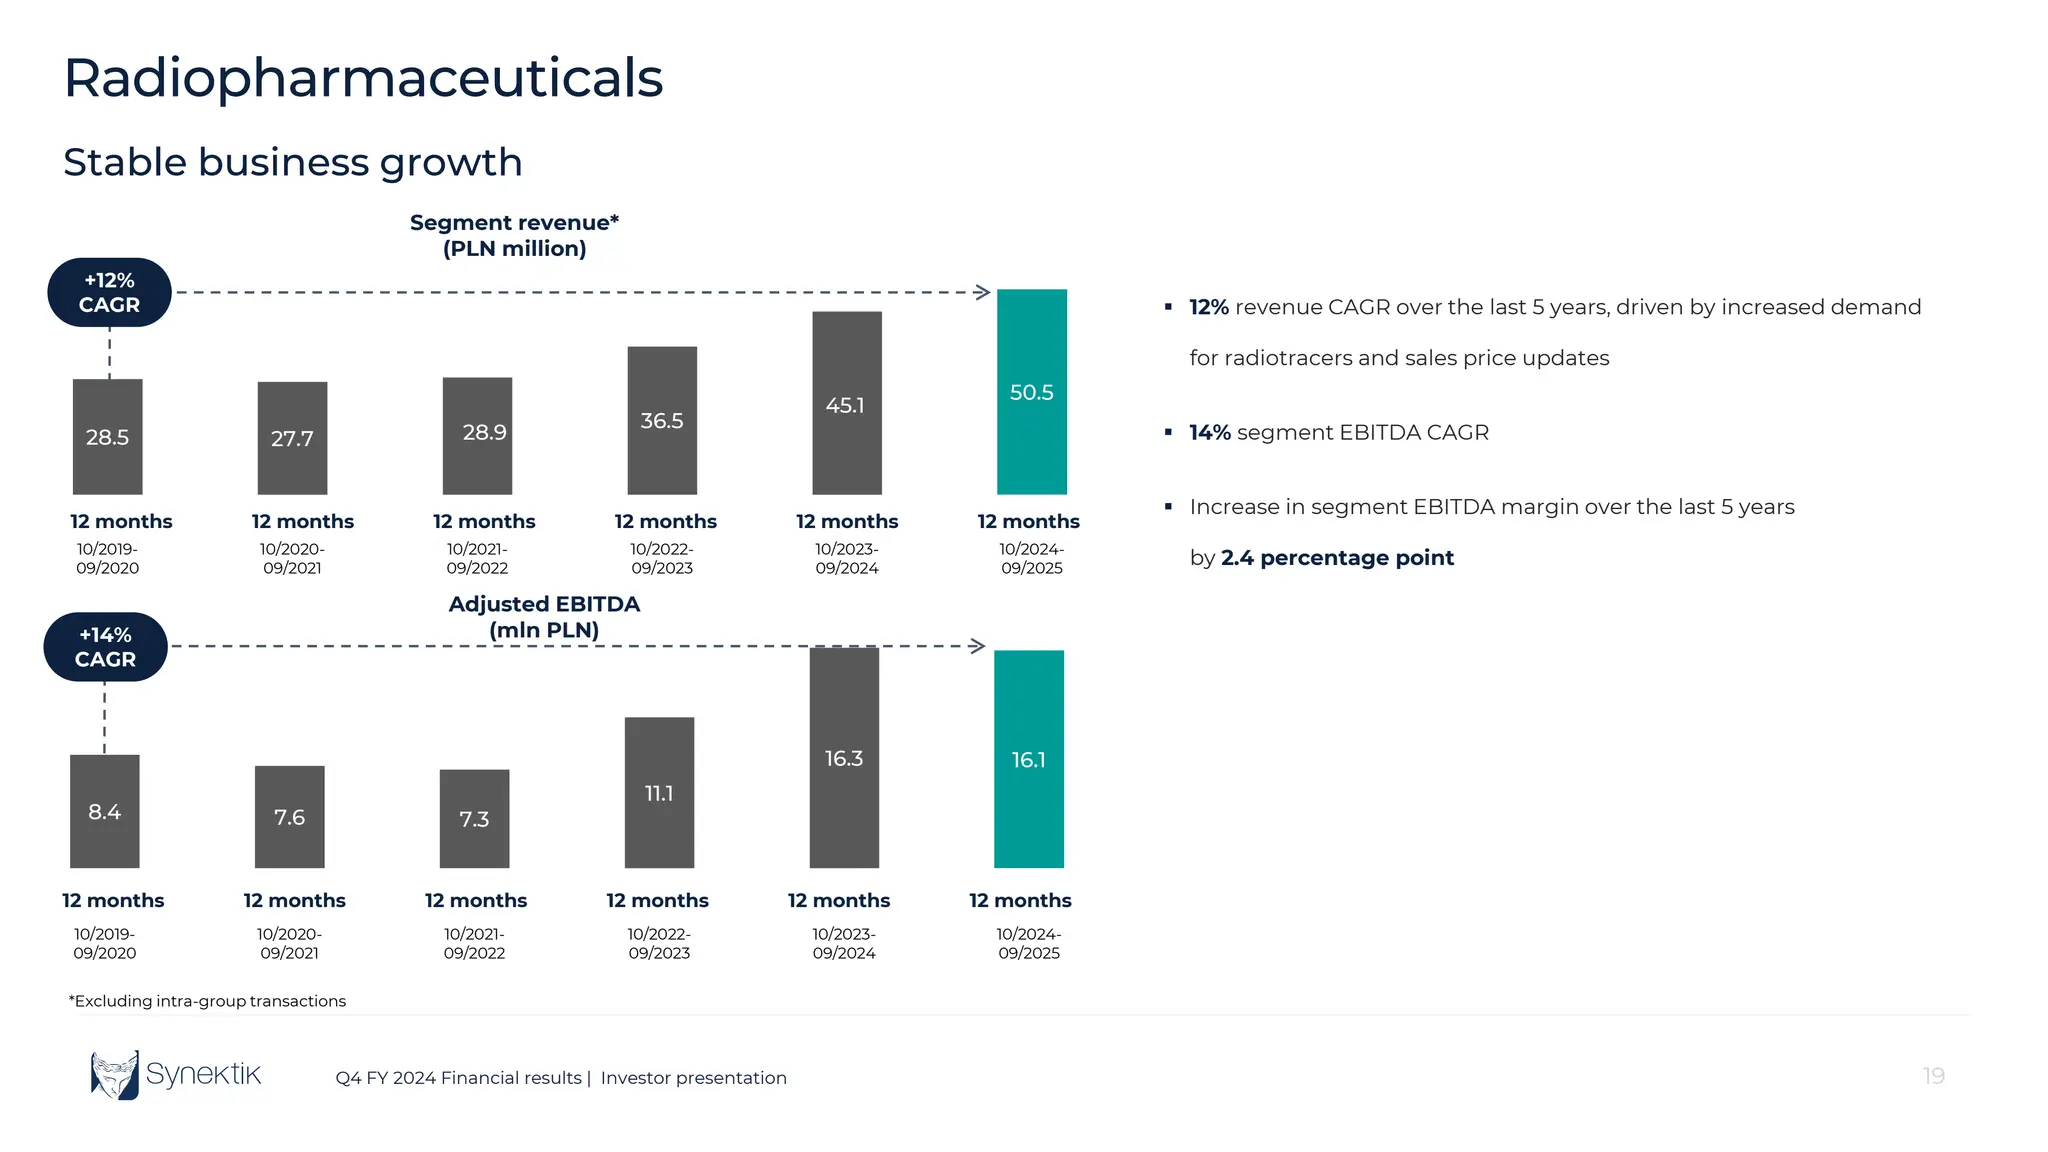
Stable business growth
*Excluding intra-group transactions
+12%
CAGR
+14%
CAGR
12% revenue CAGR over the last 5 years, driven by increased demand
for radiotracers and sales price updates
14% segment EBITDA CAGR
Increase in segment EBITDA margin over the last 5 years
by 2.4 percentage point
28.5 27.7 28.9
36.5
45.1
50.5
10/2019-
09/2020
10/2020-
09/2021
10/2021-
09/2022
10/2022-
09/2023
10/2023-
09/2024
10/2024-
09/2025
Segment revenue*
(PLN million)
8.4 7.6 7.3
11.1
16.3 16.1
10/2019-
09/2020
10/2020-
09/2021
10/2021-
09/2022
10/2022-
09/2023
10/2023-
09/2024
10/2024-
09/2025
Adjusted EBITDA
(mln PLN)
12 months 12 months 12 months 12 months 12 months 12 months
12 months 12 months 12 months 12 months 12 months 12 months
21
Q4 FY 2024Financial results | Investor presentation
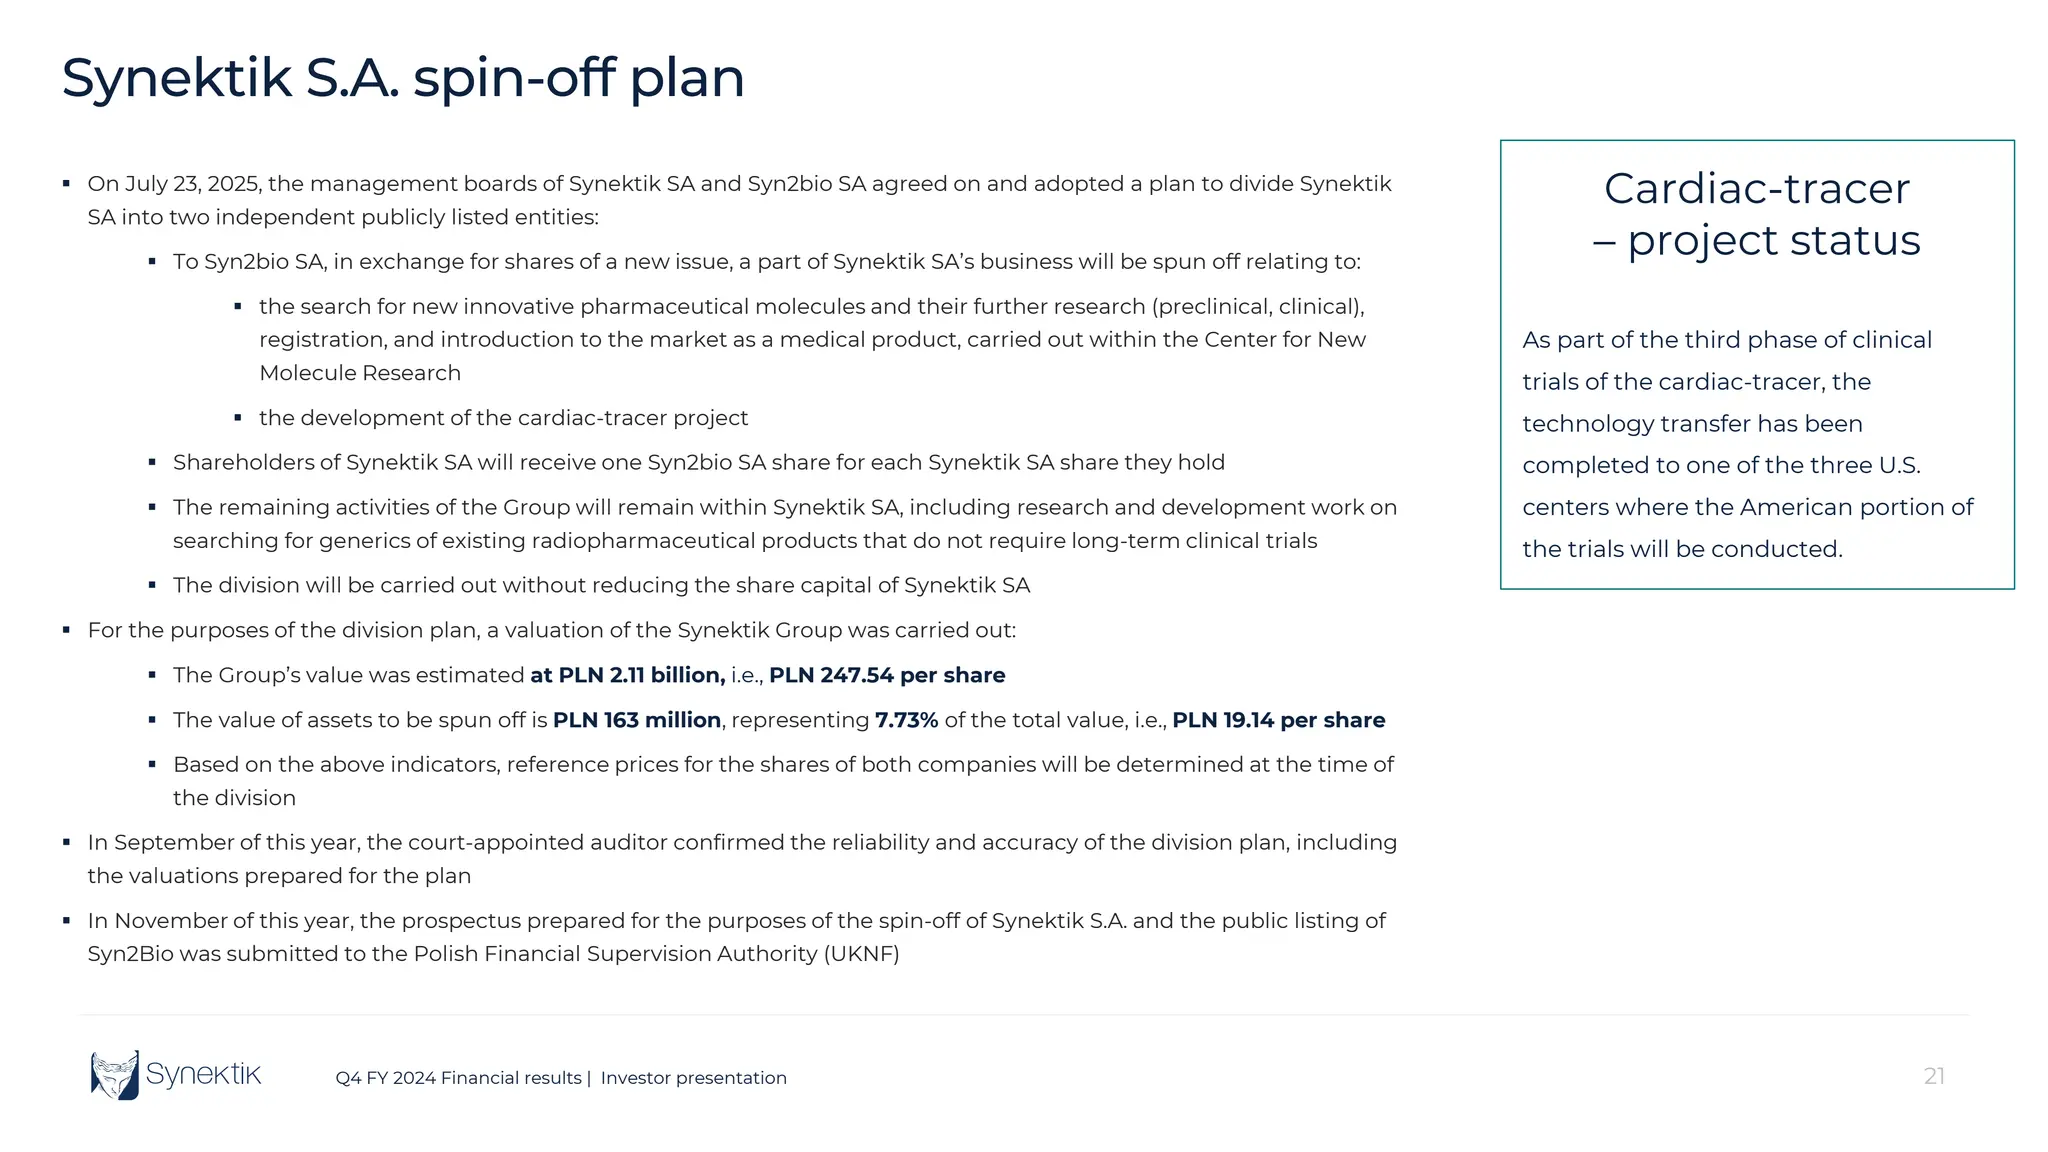
Synektik S.A. spin-off plan
On July 23, 2025, the management boards of Synektik SA and Syn2bio SA agreed on and adopted a plan to divide Synektik
SA into two independent publicly listed entities:
To Syn2bio SA, in exchange for shares of a new issue, a part of Synektik SA’s business will be spun off relating to:
the search for new innovative pharmaceutical molecules and their further research (preclinical, clinical),
registration, and introduction to the market as a medical product, carried out within the Center for New
Molecule Research
the development of the cardiac-tracer project
Shareholders of Synektik SA will receive one Syn2bio SA share for each Synektik SA share they hold
The remaining activities of the Group will remain within Synektik SA, including research and development work on
searching for generics of existing radiopharmaceutical products that do not require long-term clinical trials
The division will be carried out without reducing the share capital of Synektik SA
For the purposes of the division plan, a valuation of the Synektik Group was carried out:
The Group’s value was estimated at PLN 2.11 billion, i.e., PLN 247.54 per share
The value of assets to be spun off is PLN 163 million, representing 7.73% of the total value, i.e., PLN 19.14 per share
Based on the above indicators, reference prices for the shares of both companies will be determined at the time of
the division
In September of this year, the court-appointed auditor confirmed the reliability and accuracy of the division plan, including
the valuations prepared for the plan
In November of this year, the prospectus prepared for the purposes of the spin-off of Synektik S.A. and the public listing of
Syn2Bio was submitted to the Polish Financial Supervision Authority (UKNF)
Cardiac-tracer
– project status
As part of the third phase of clinical
trials of the cardiac-tracer, the
technology transfer has been
completed to one of the three U.S.
centers where the American portion of
the trials will be conducted.
Thank you!
Cezary Kozanecki
Presidentof the Management Board, CEO
ckozanecki@synektik.com.pl
Dariusz Korecki
Vice-President of the Management Board, CFO
dkorecki@synektik.com.pl