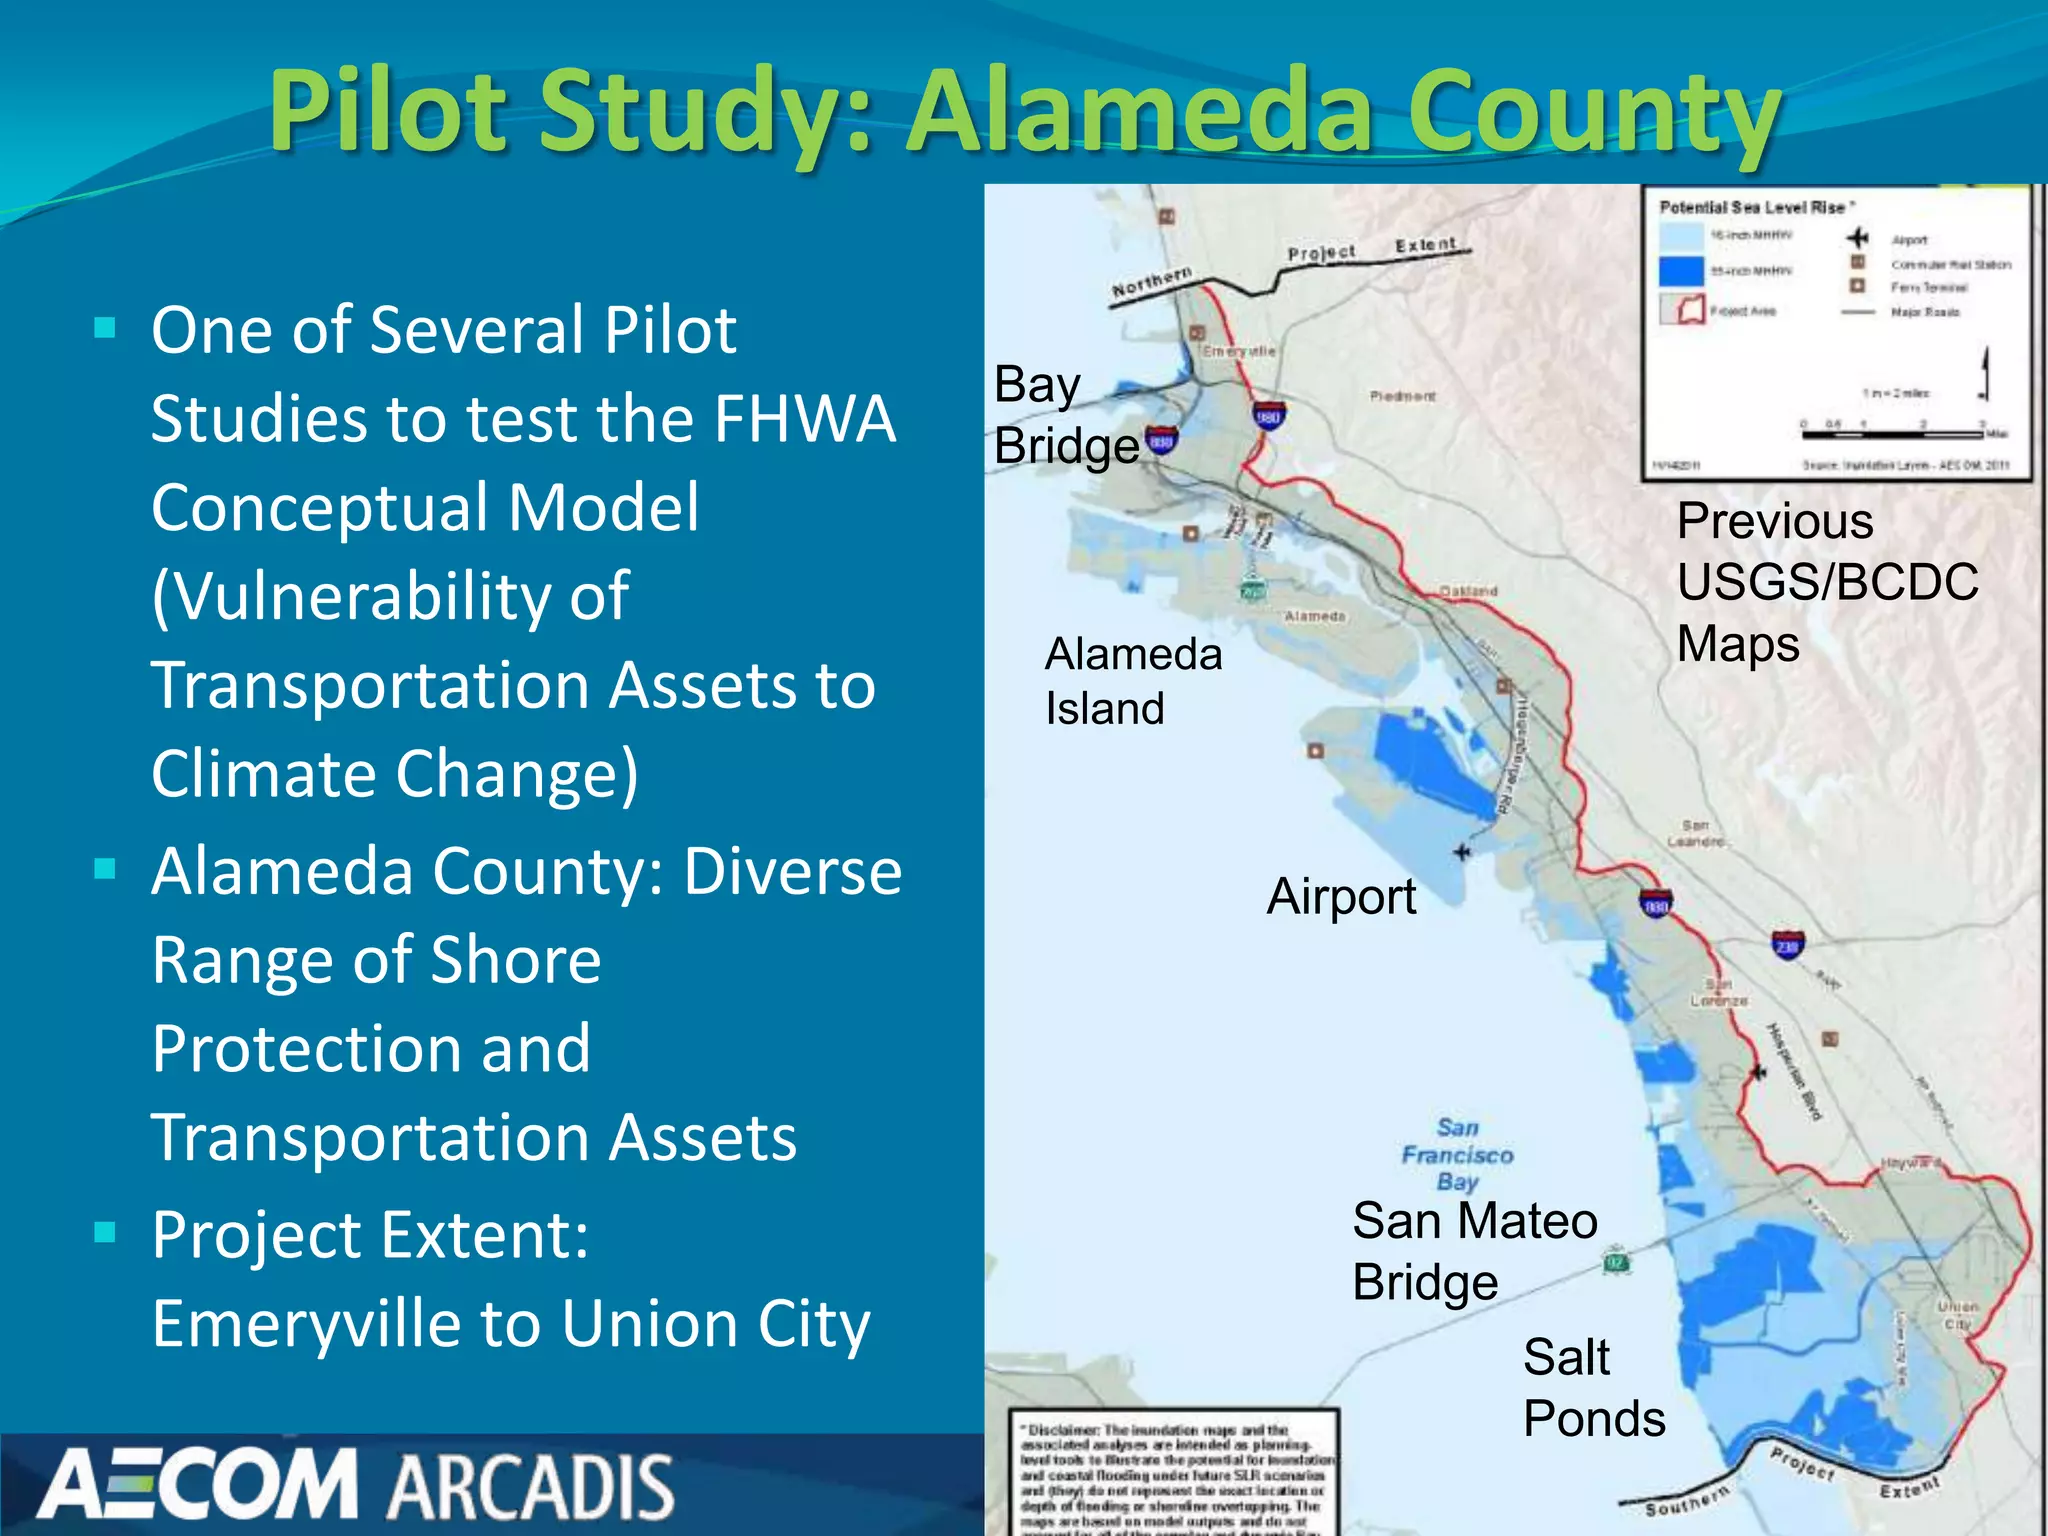
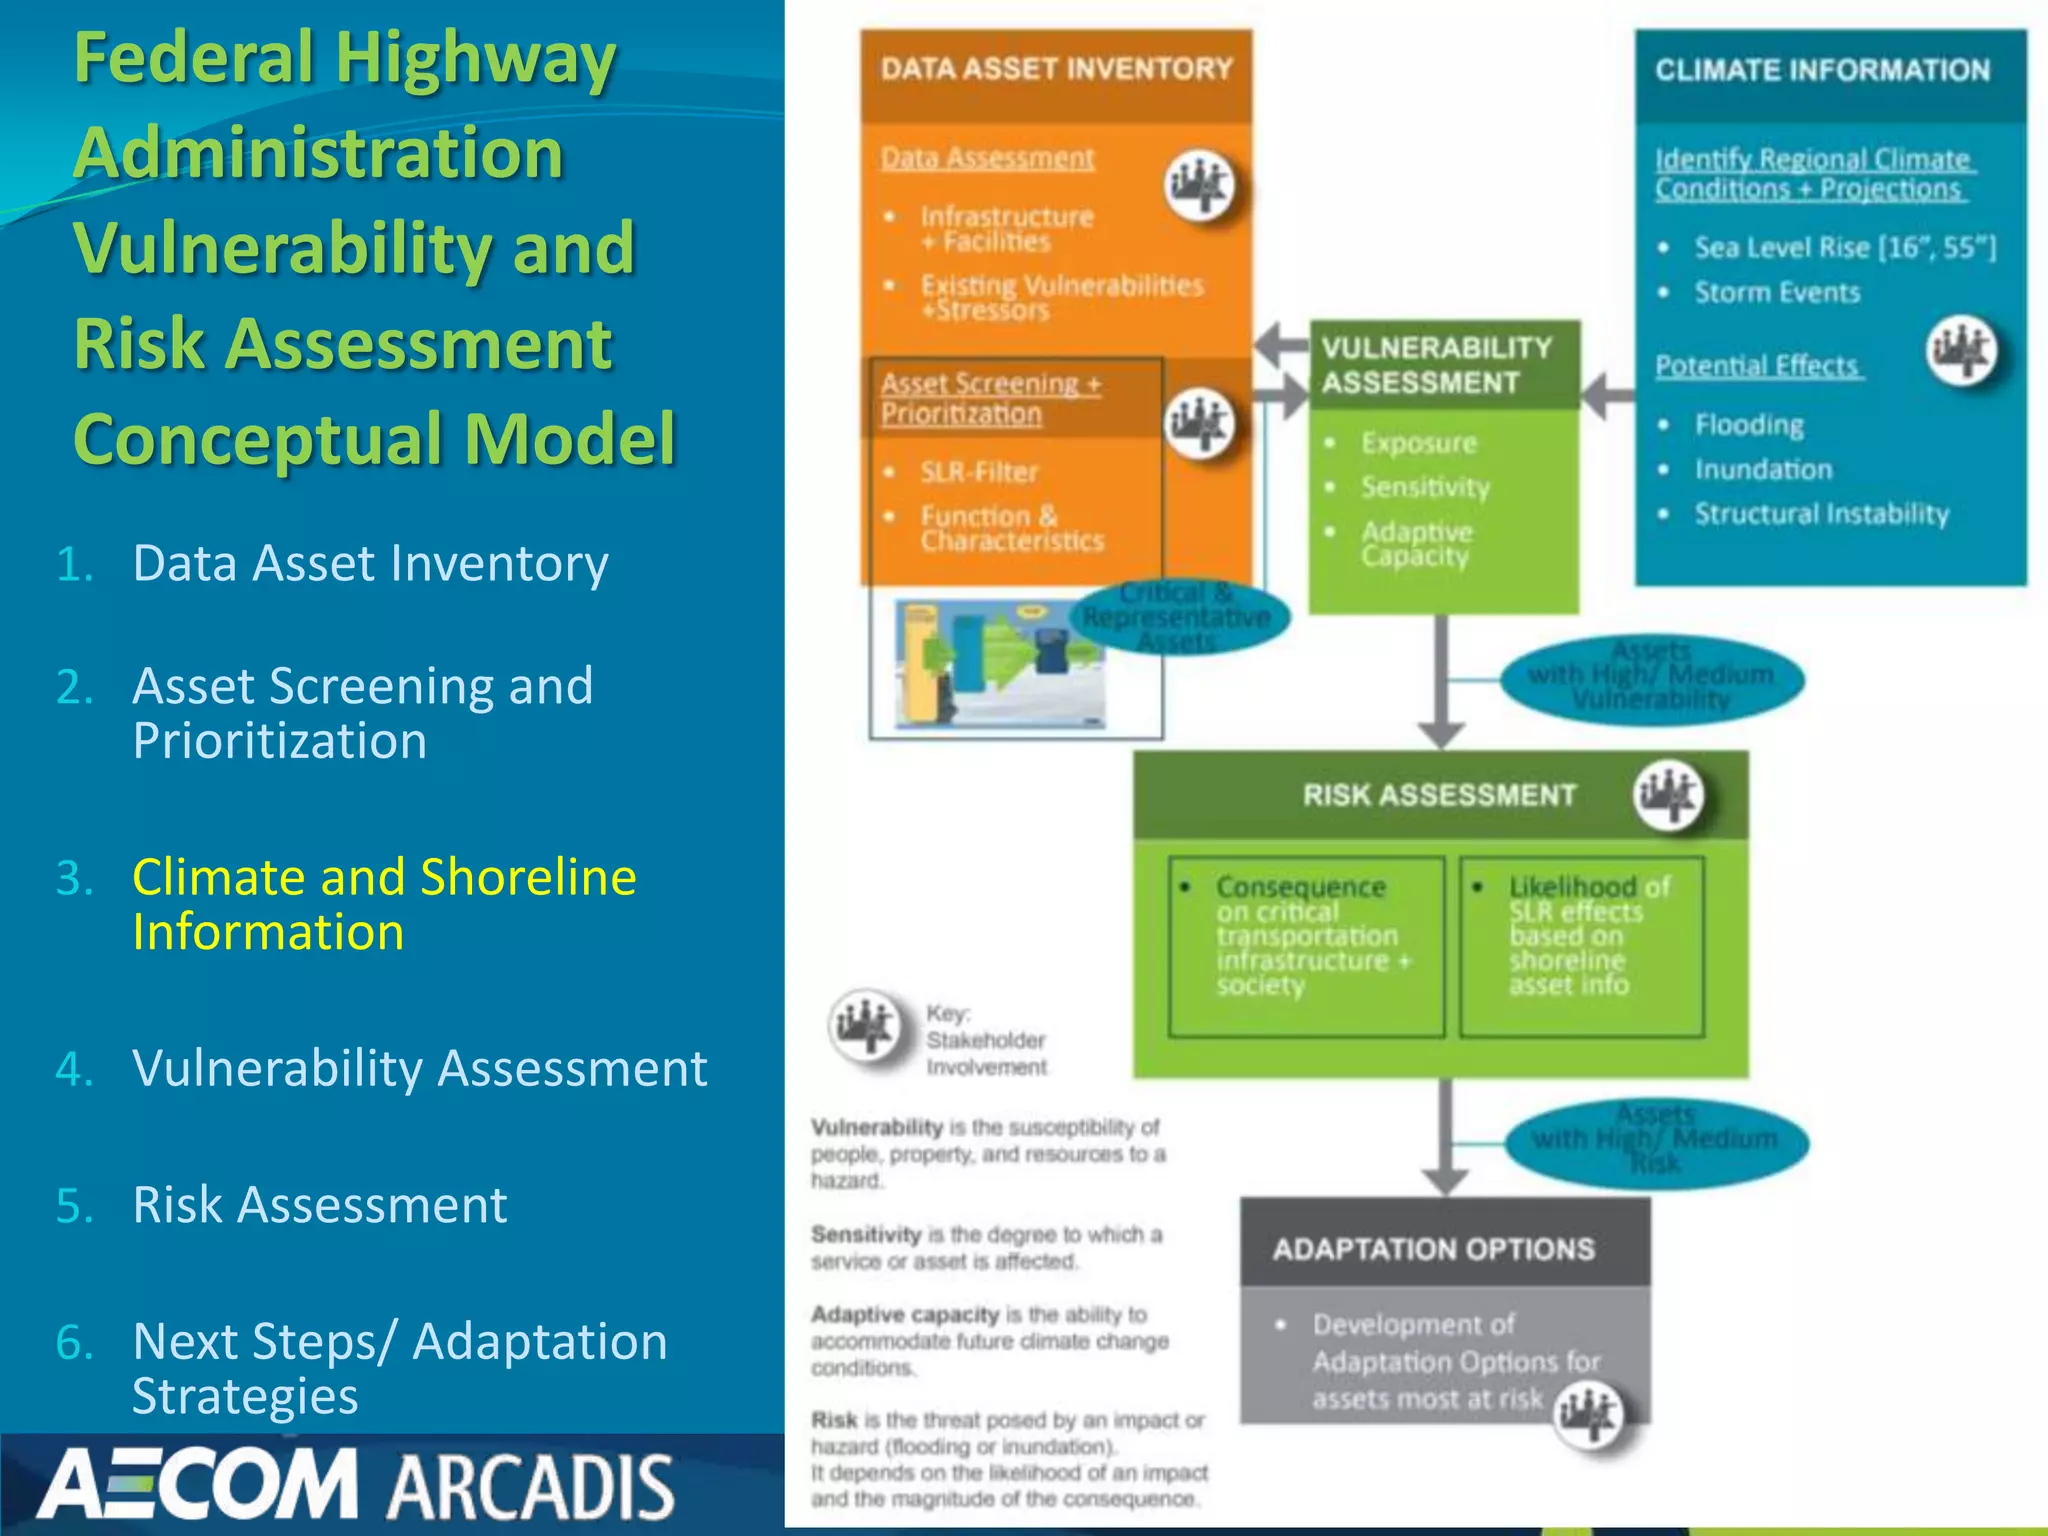
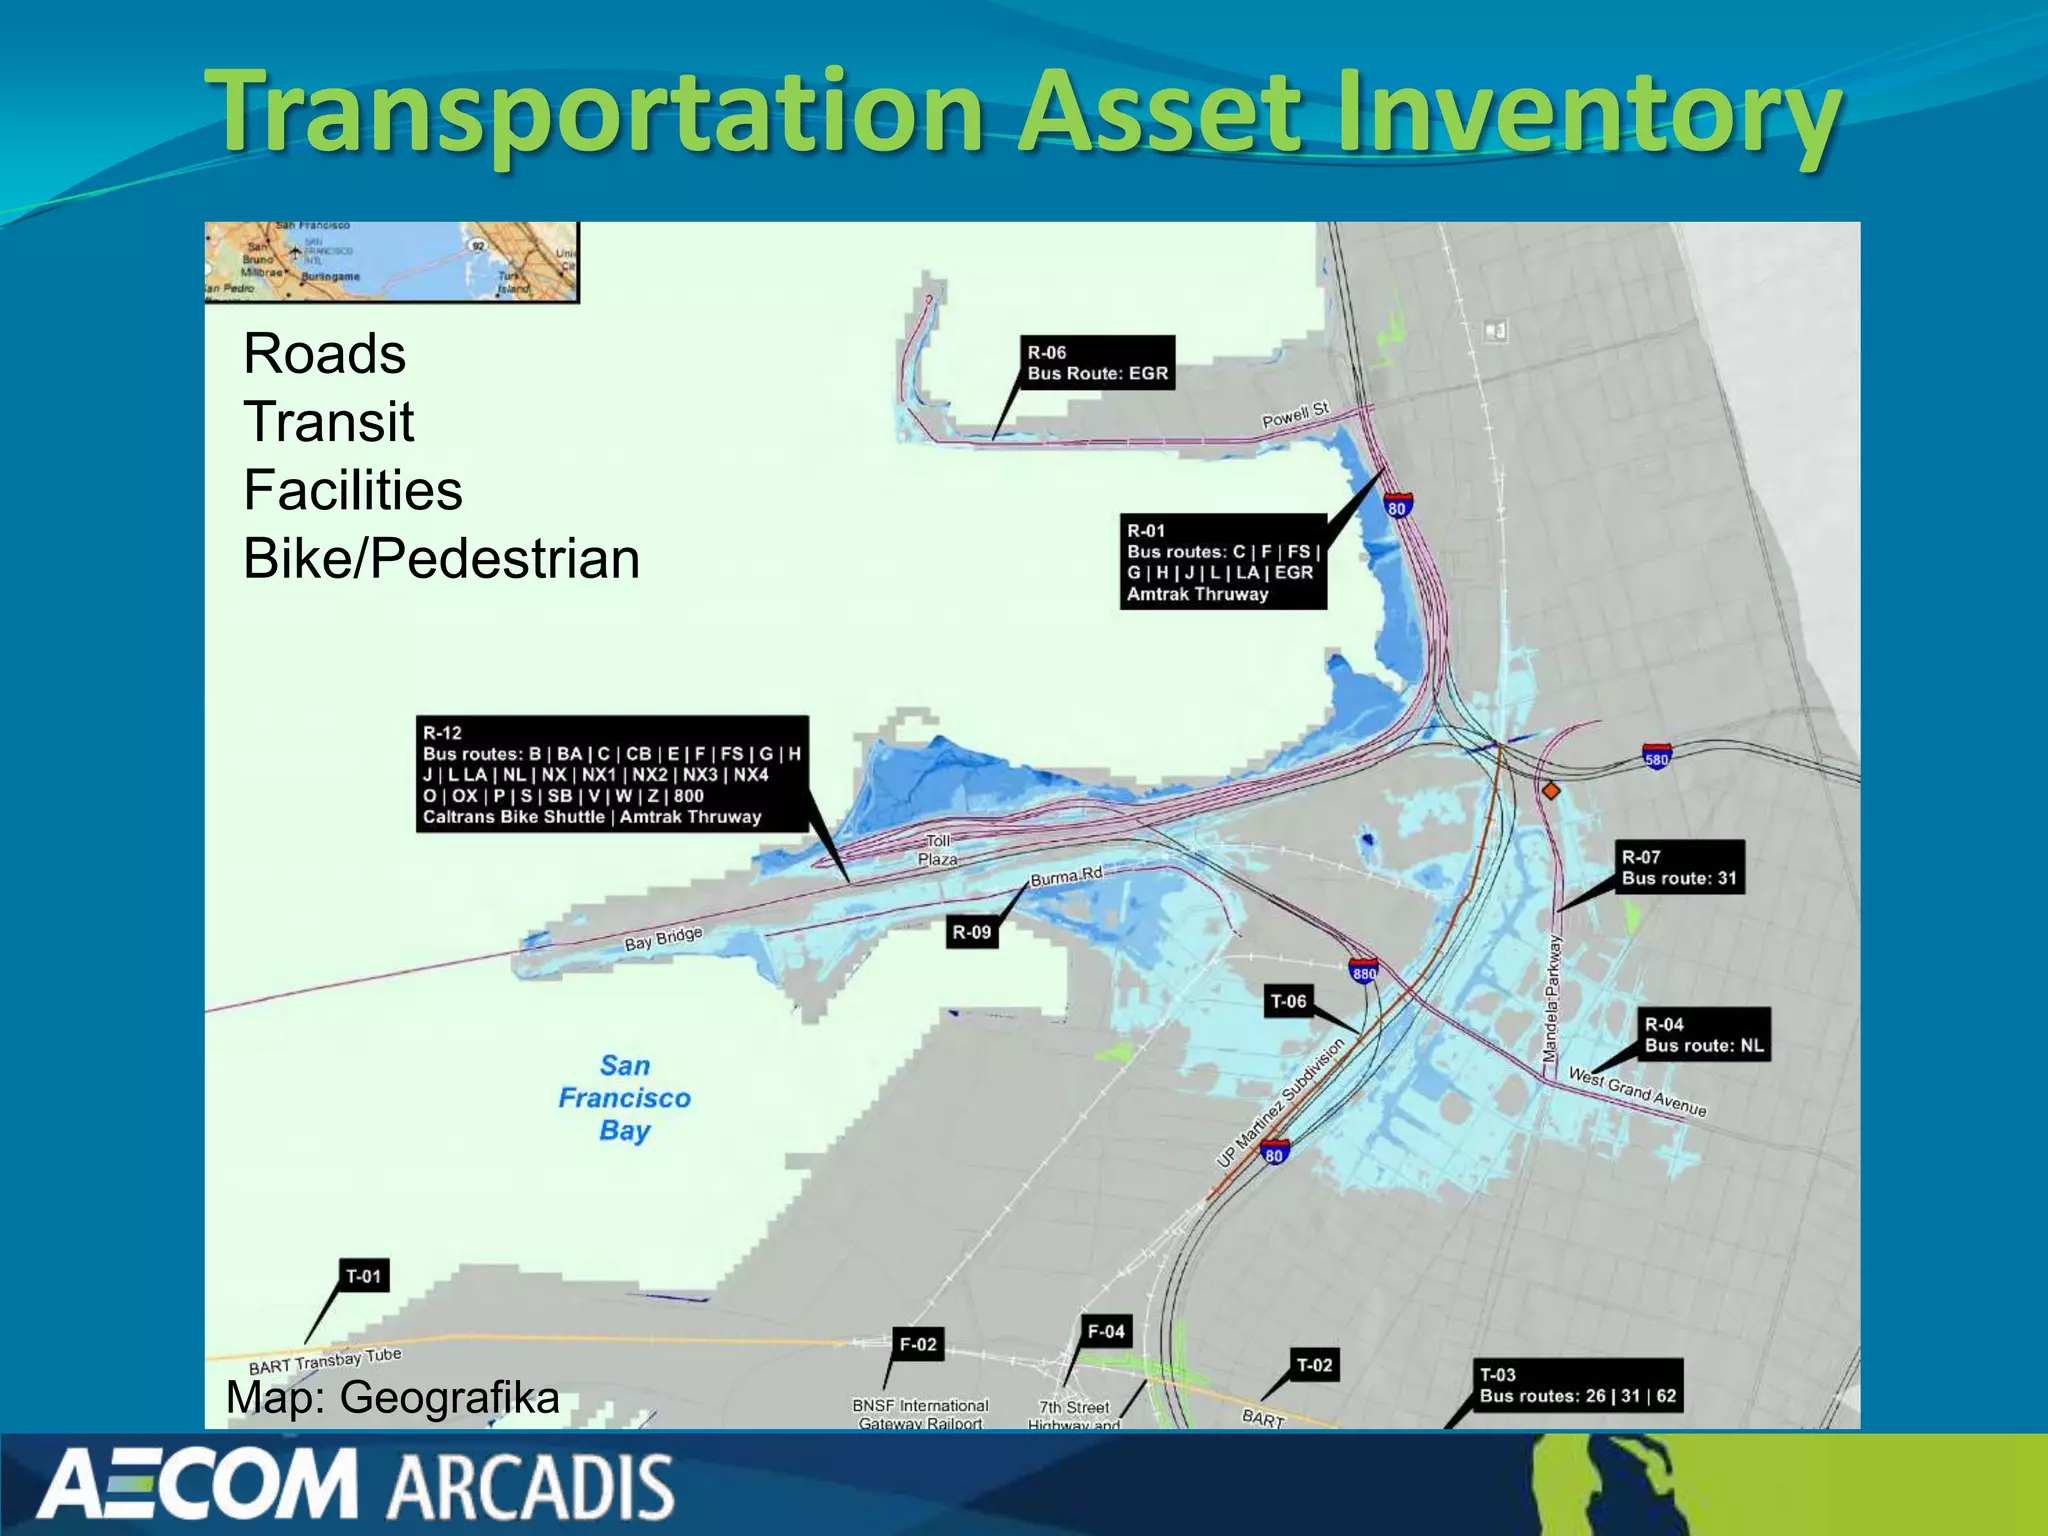
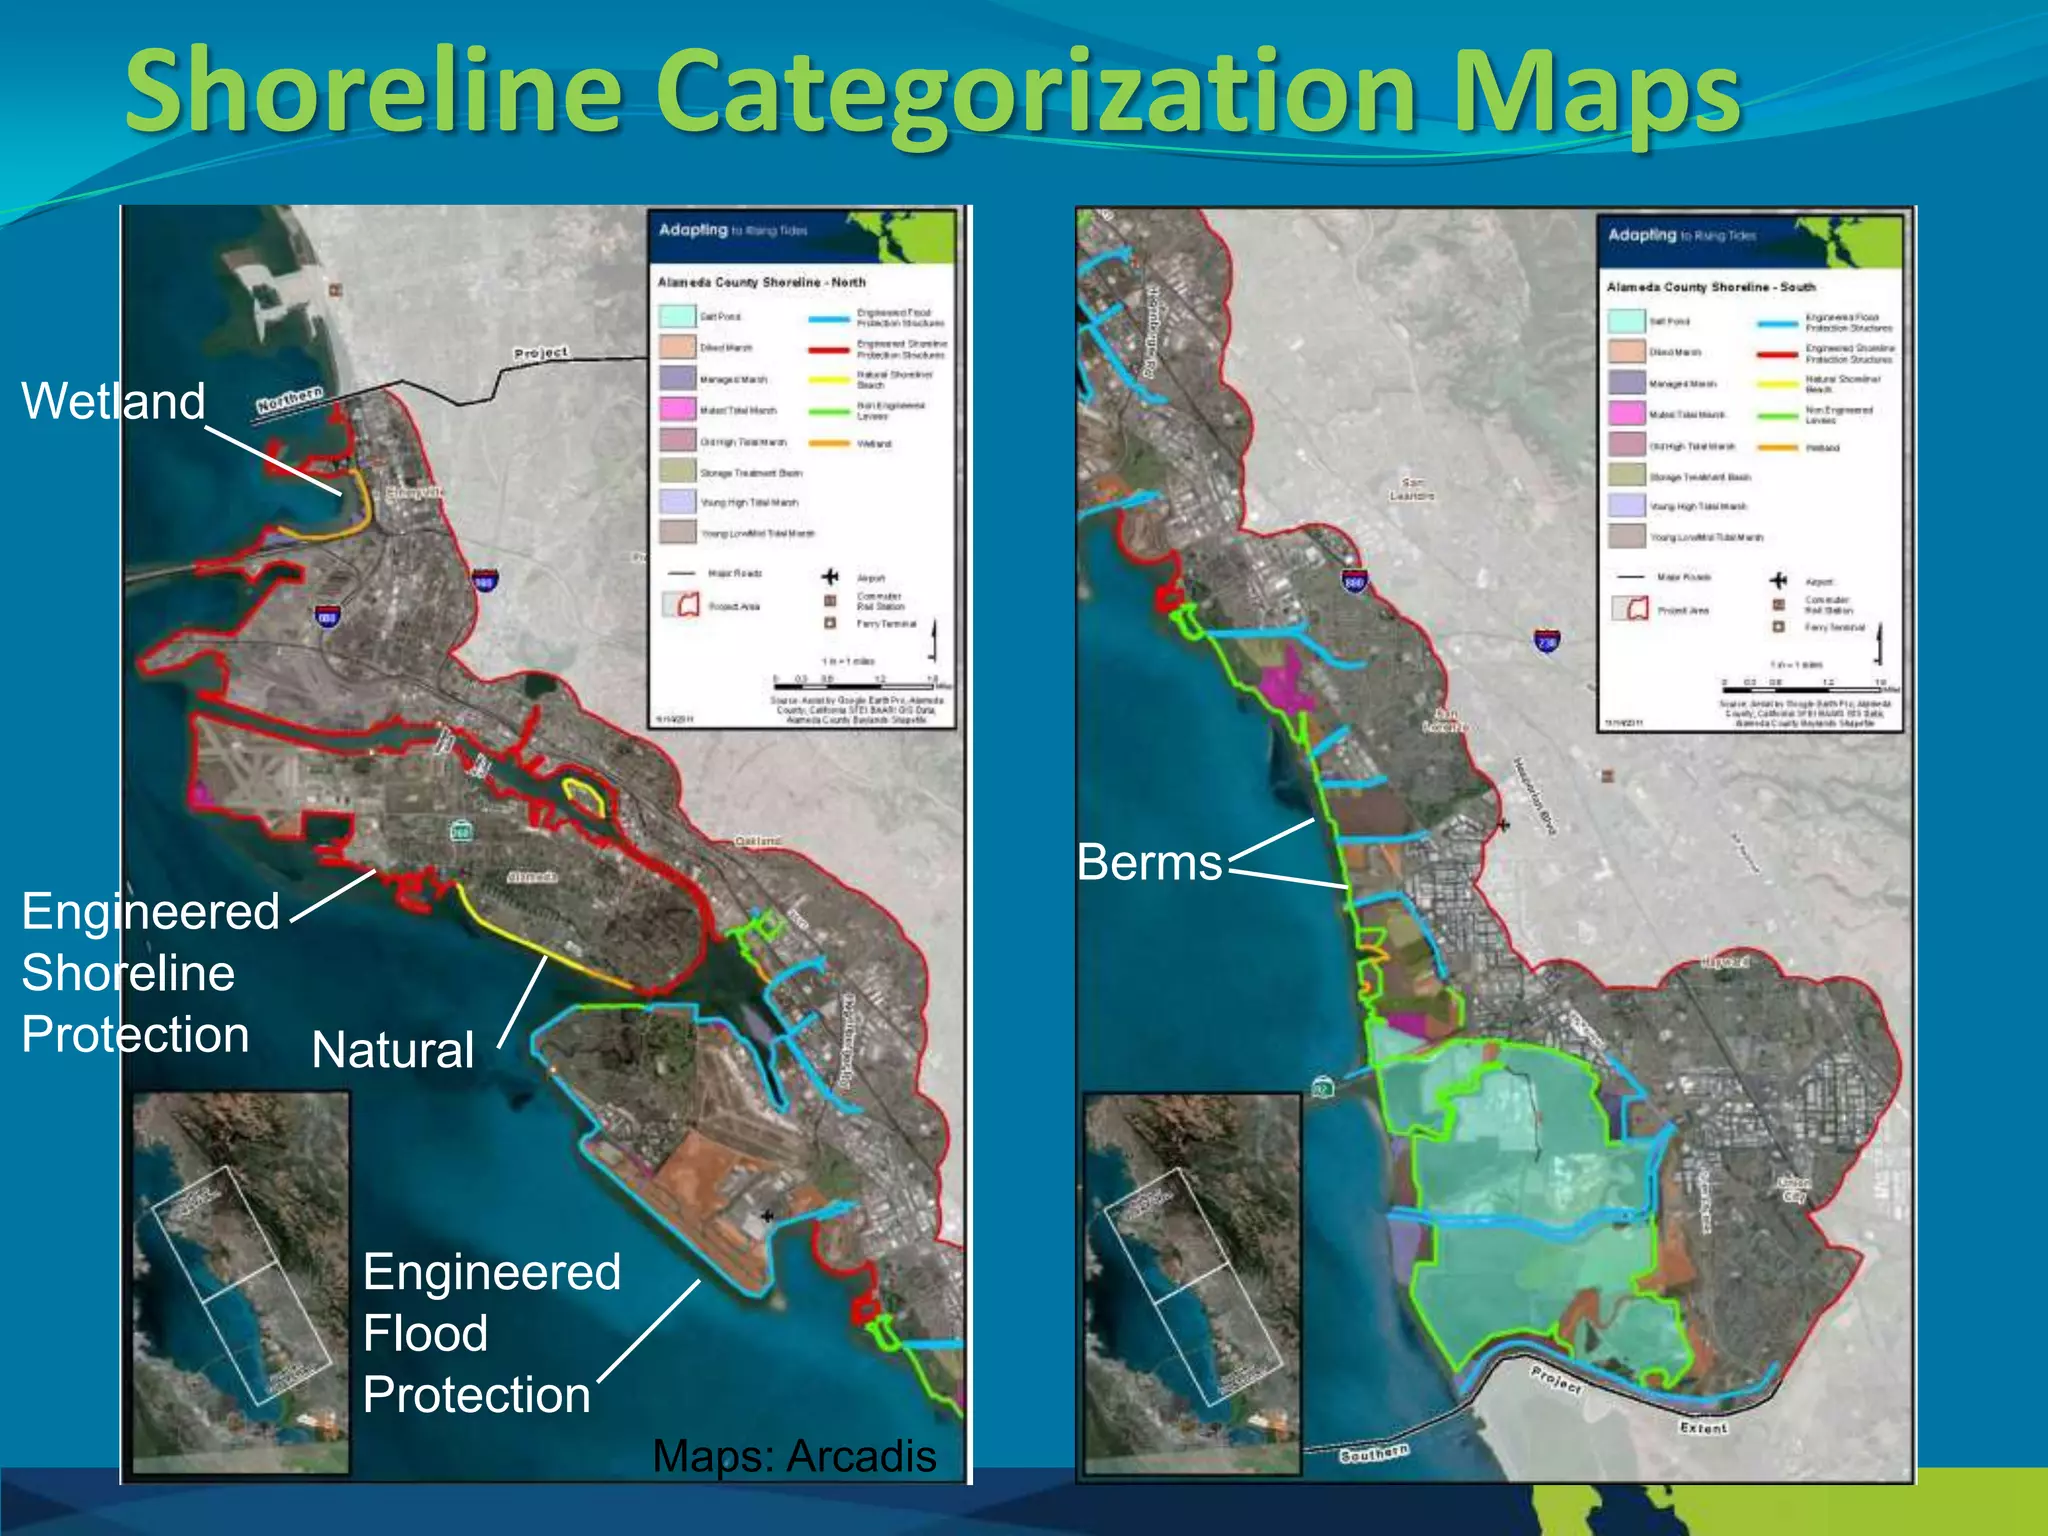
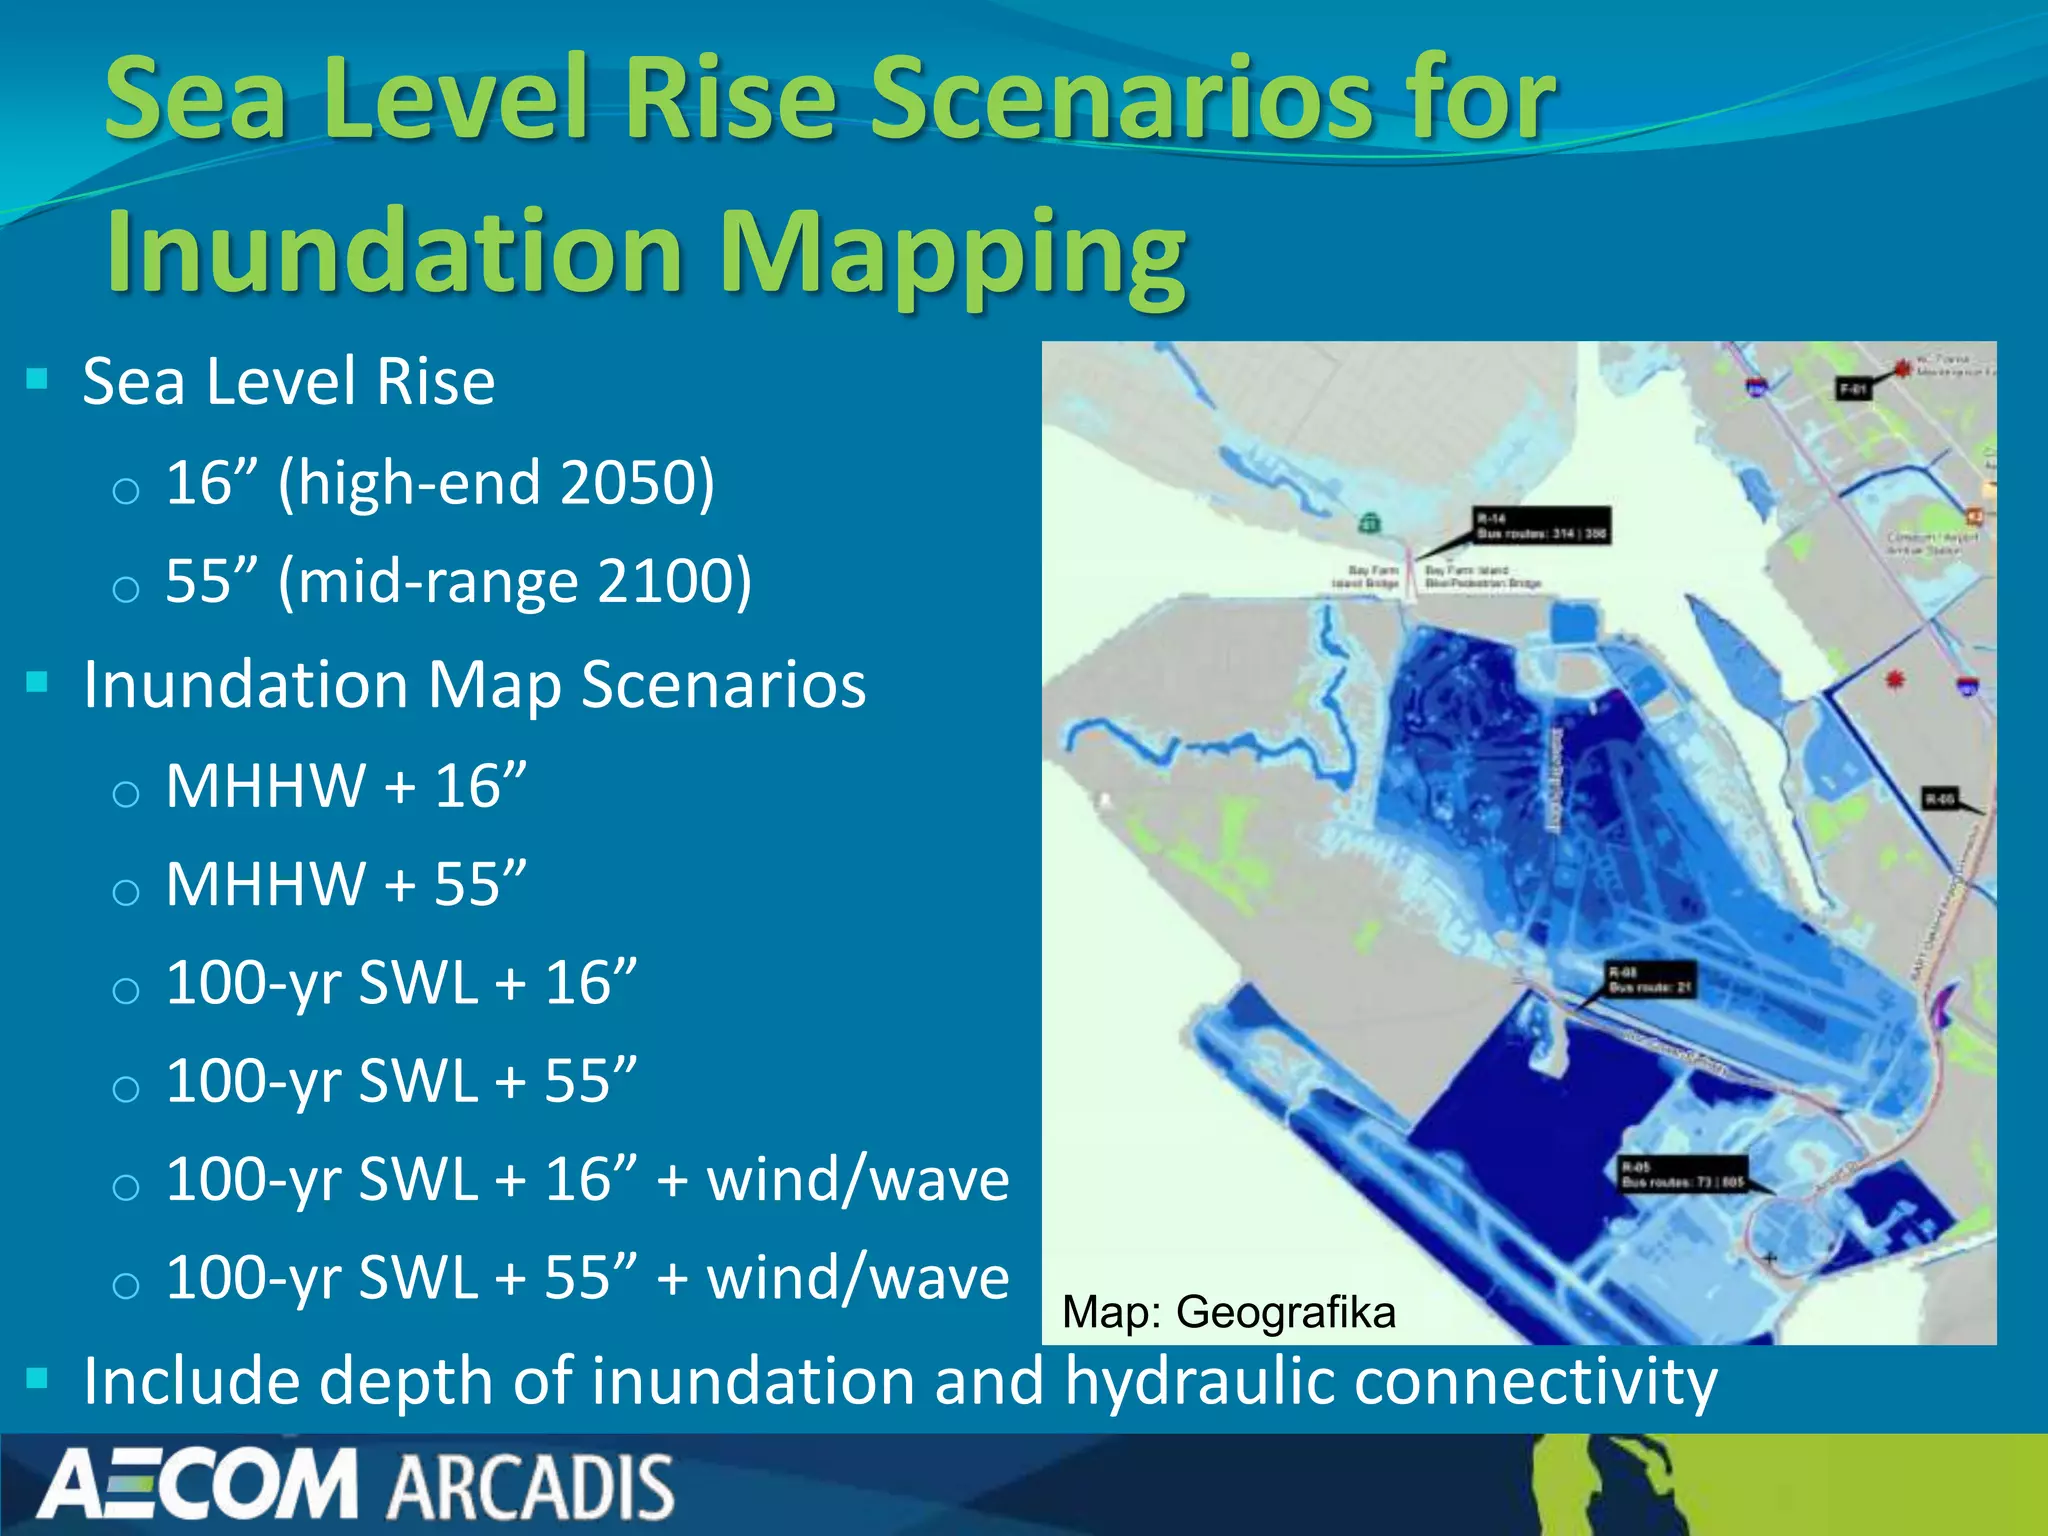
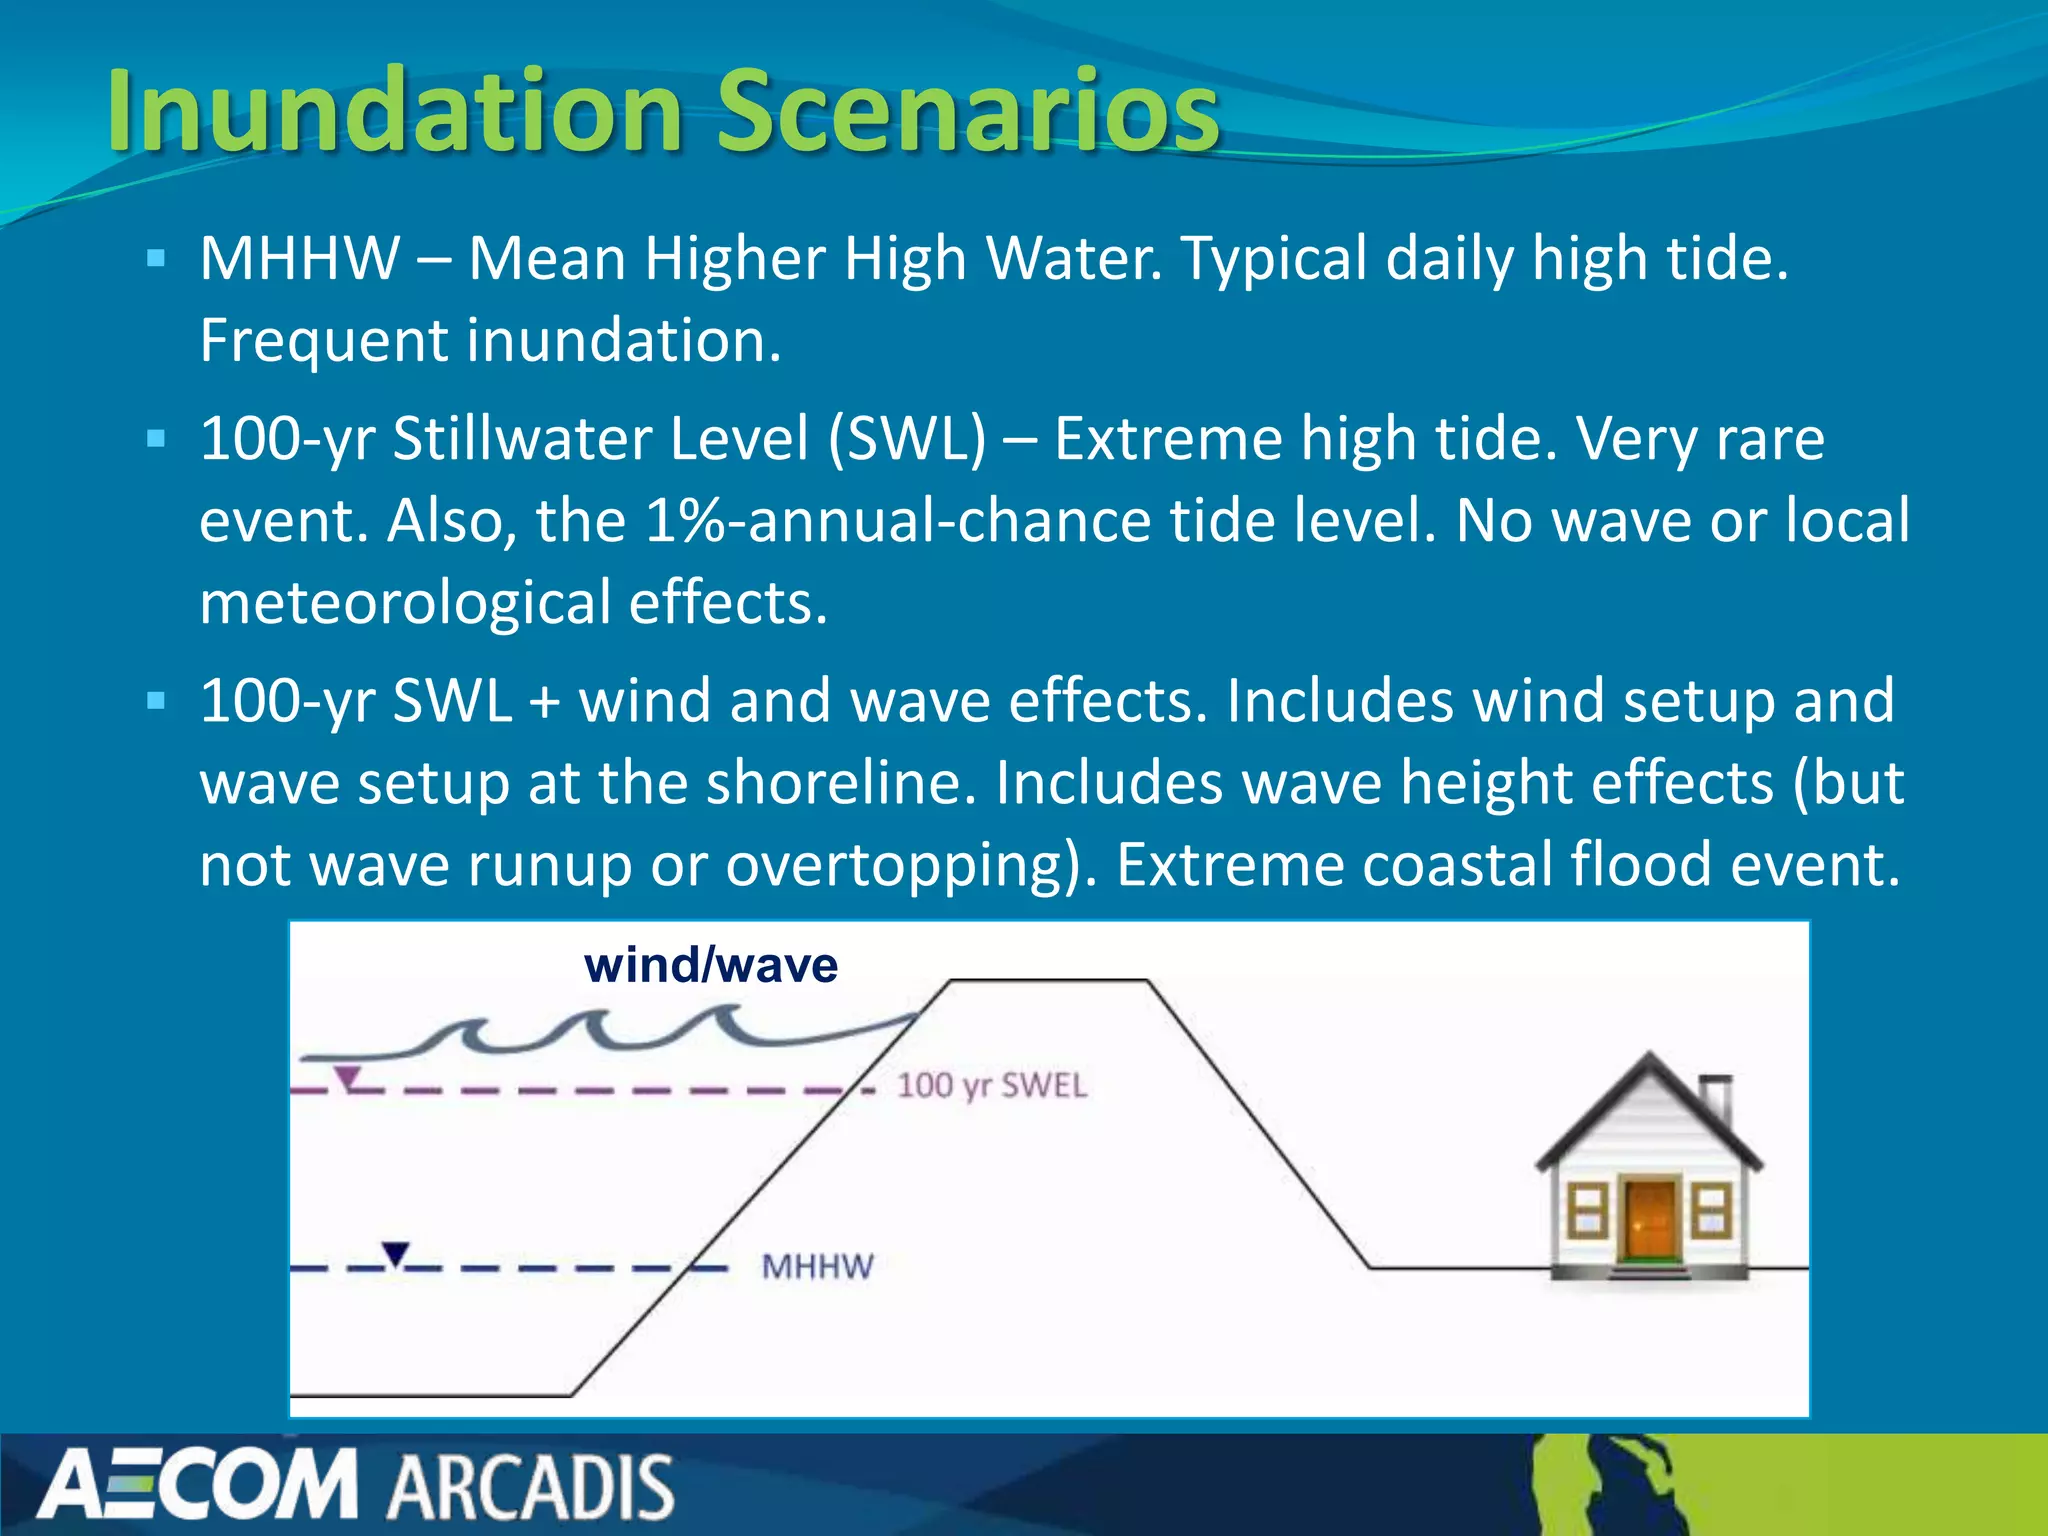
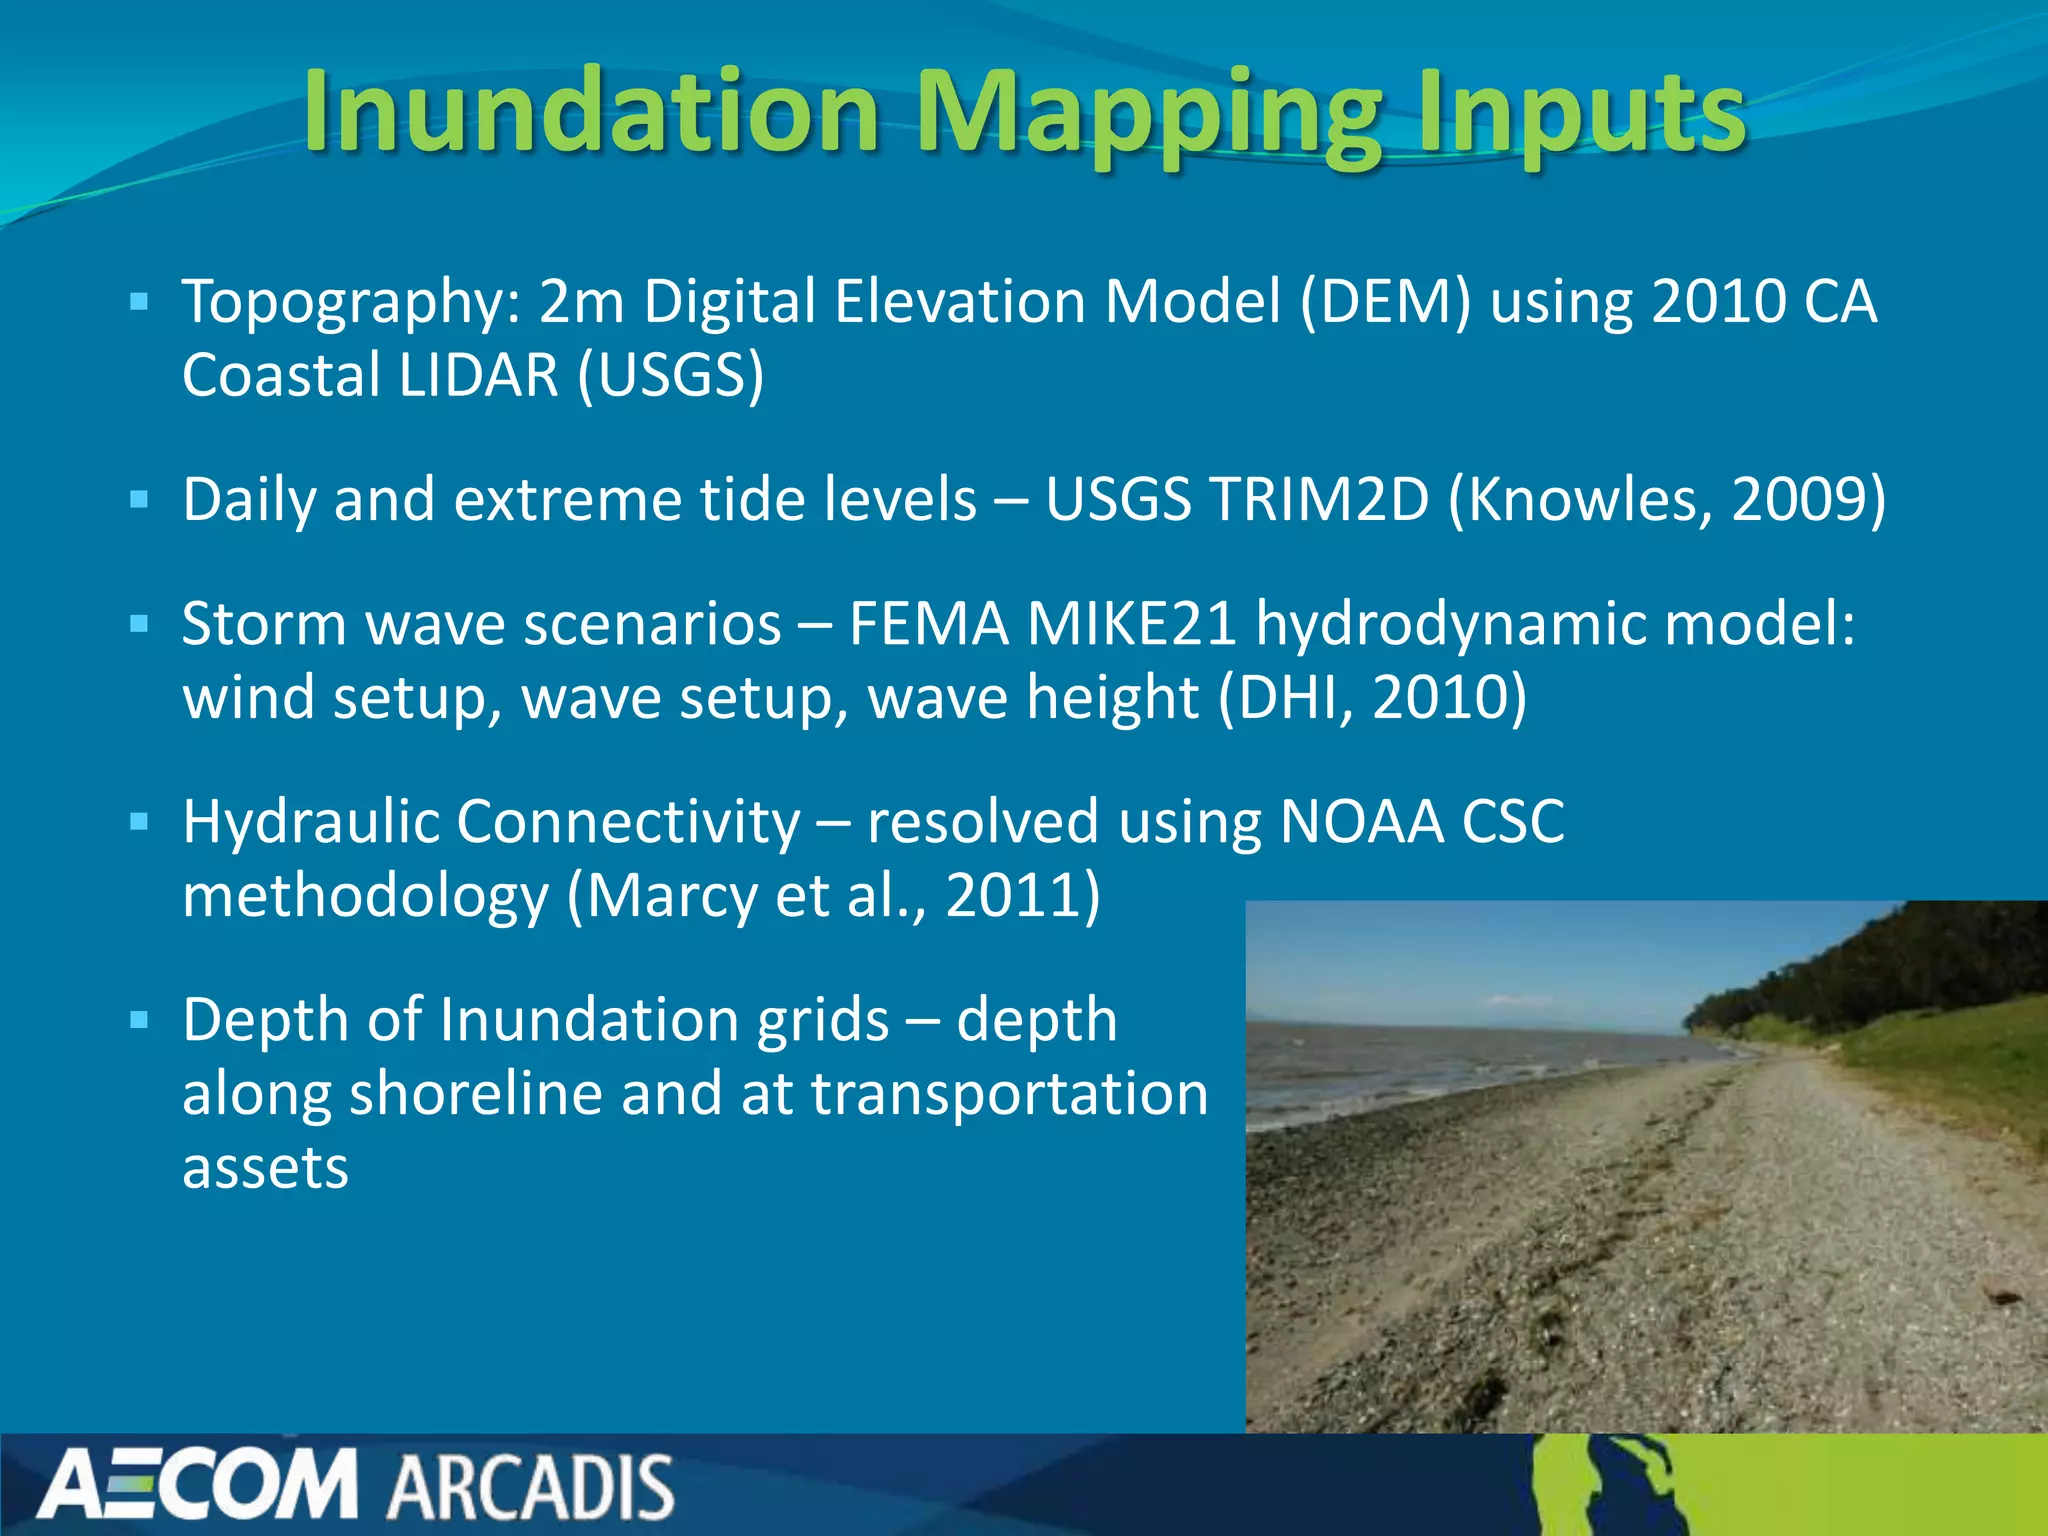
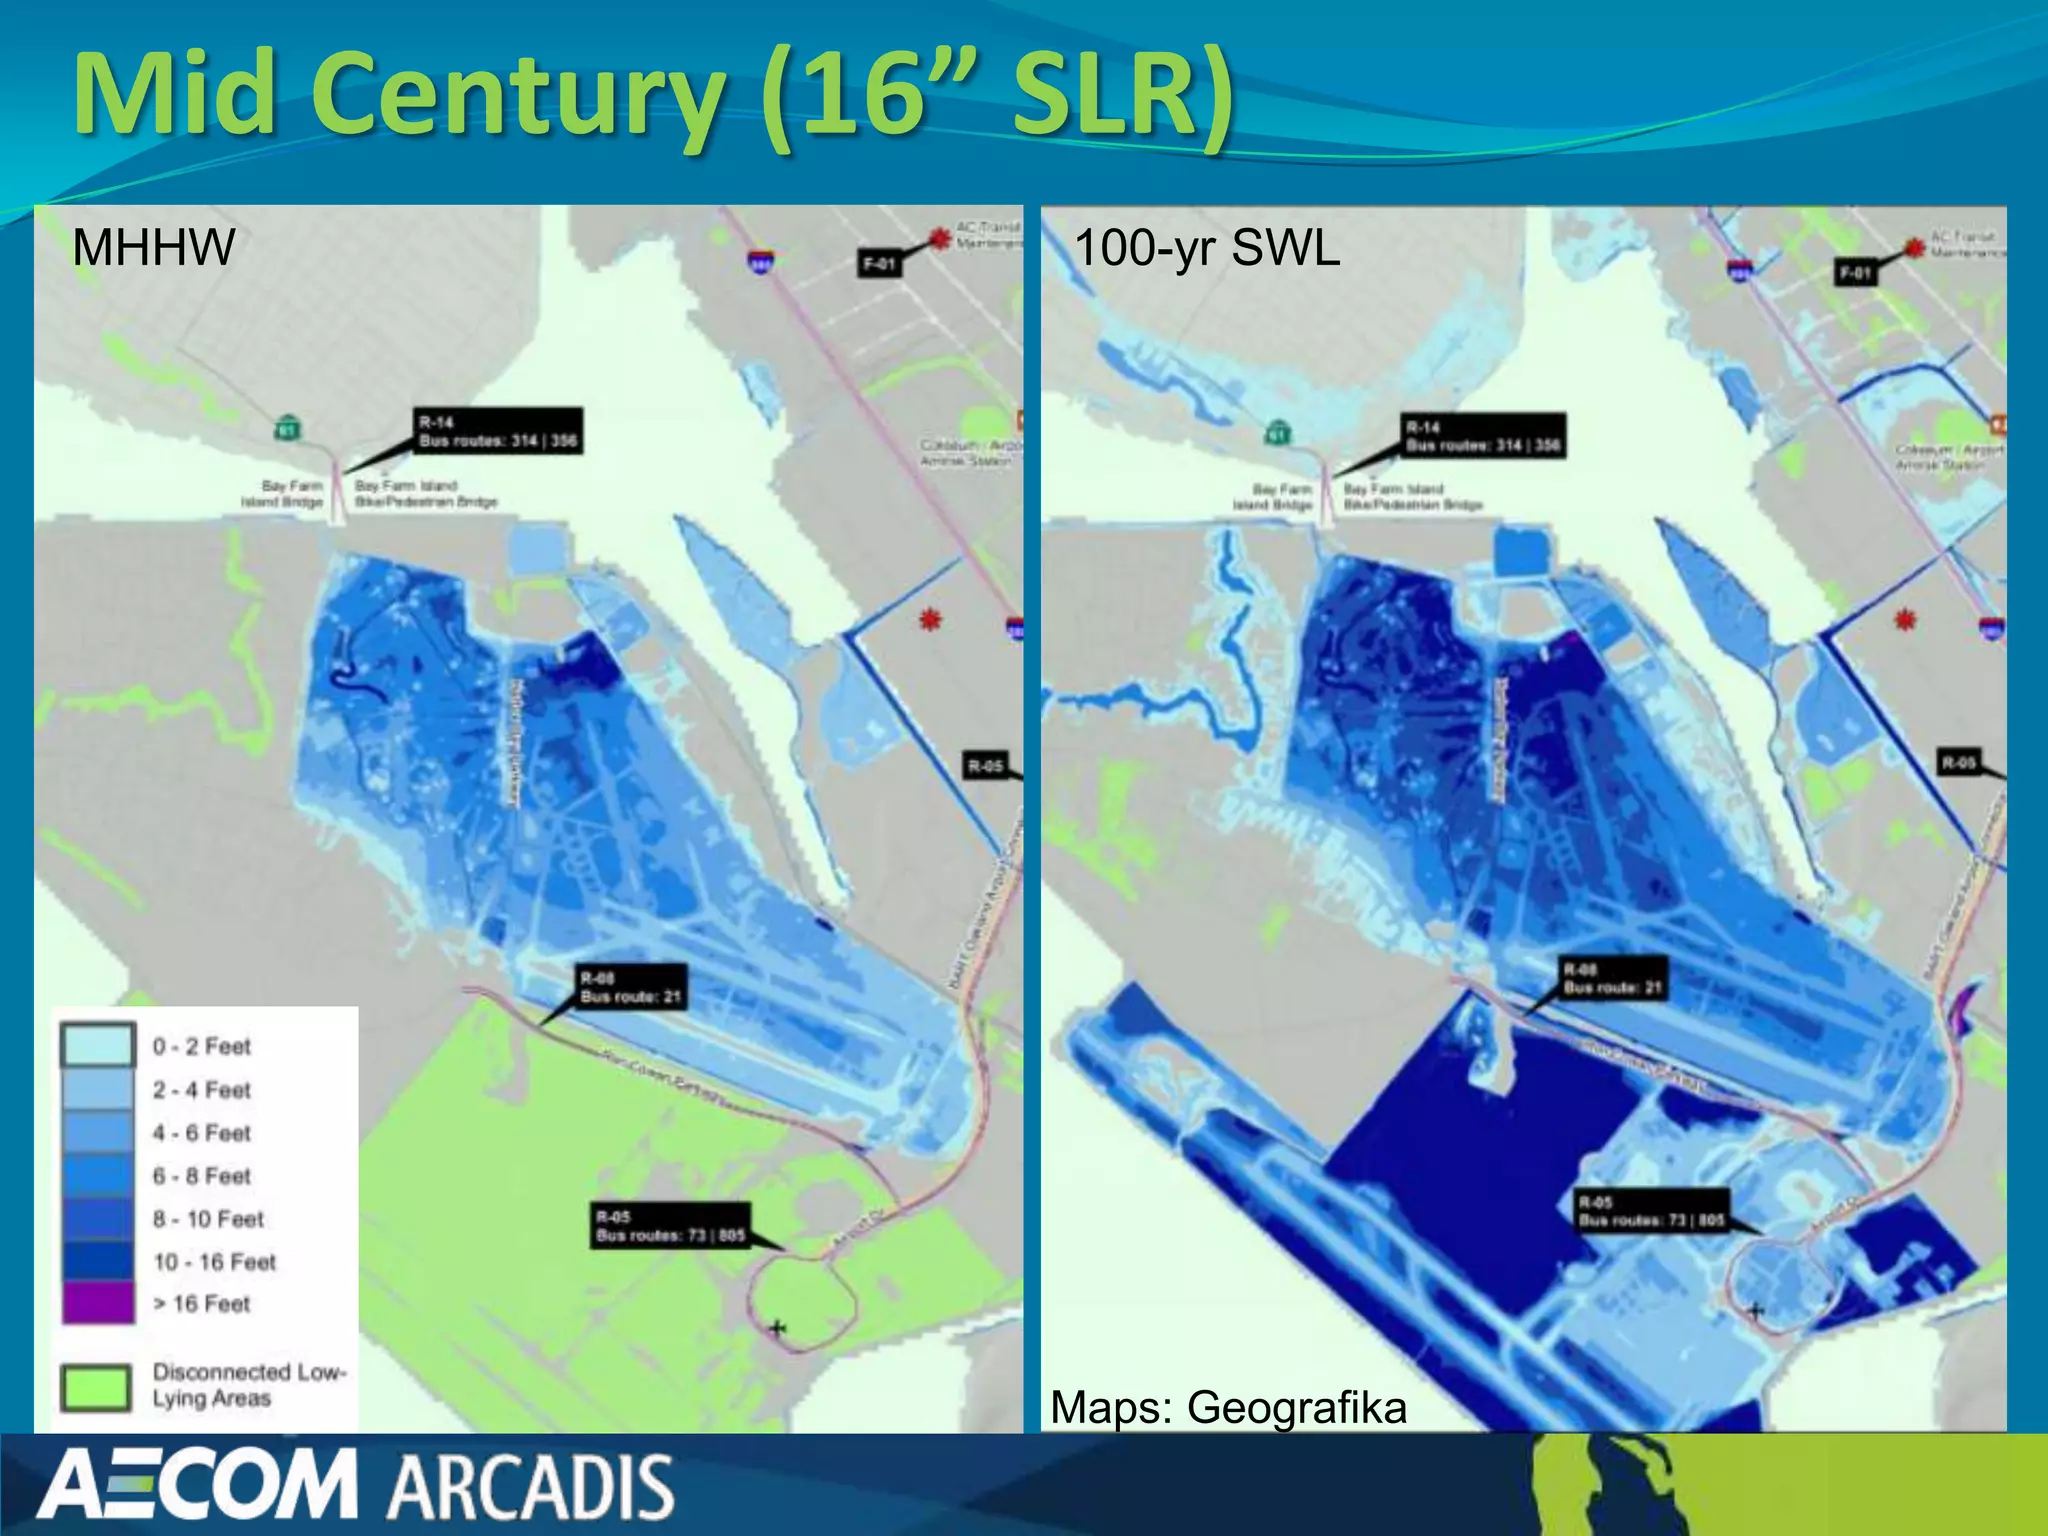
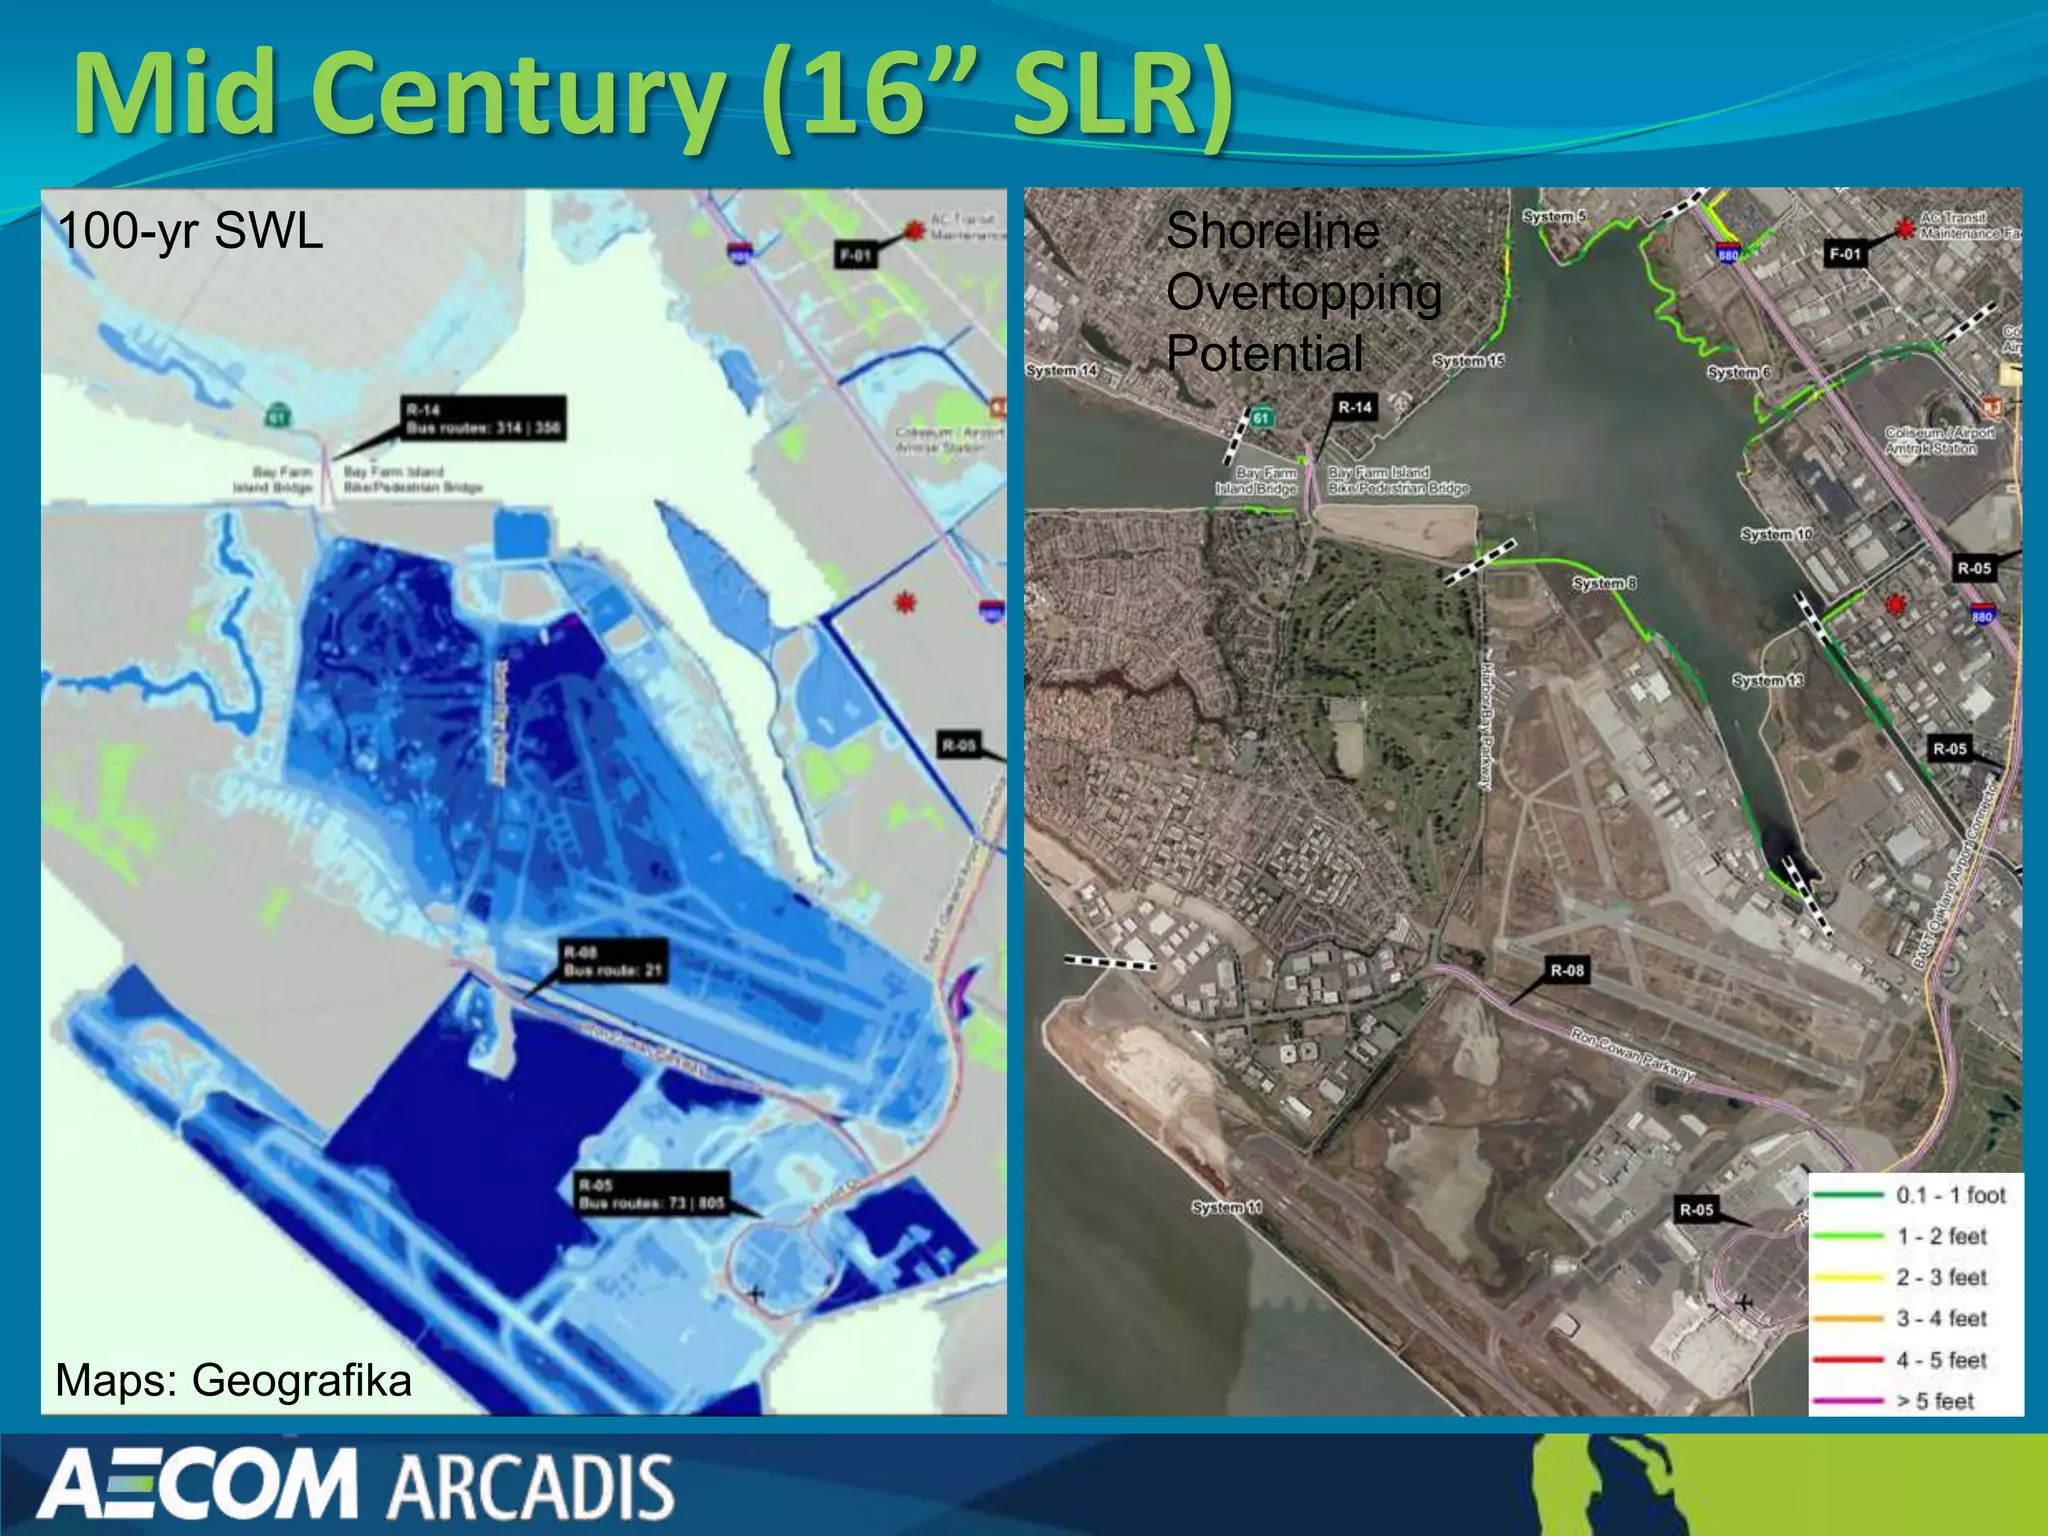
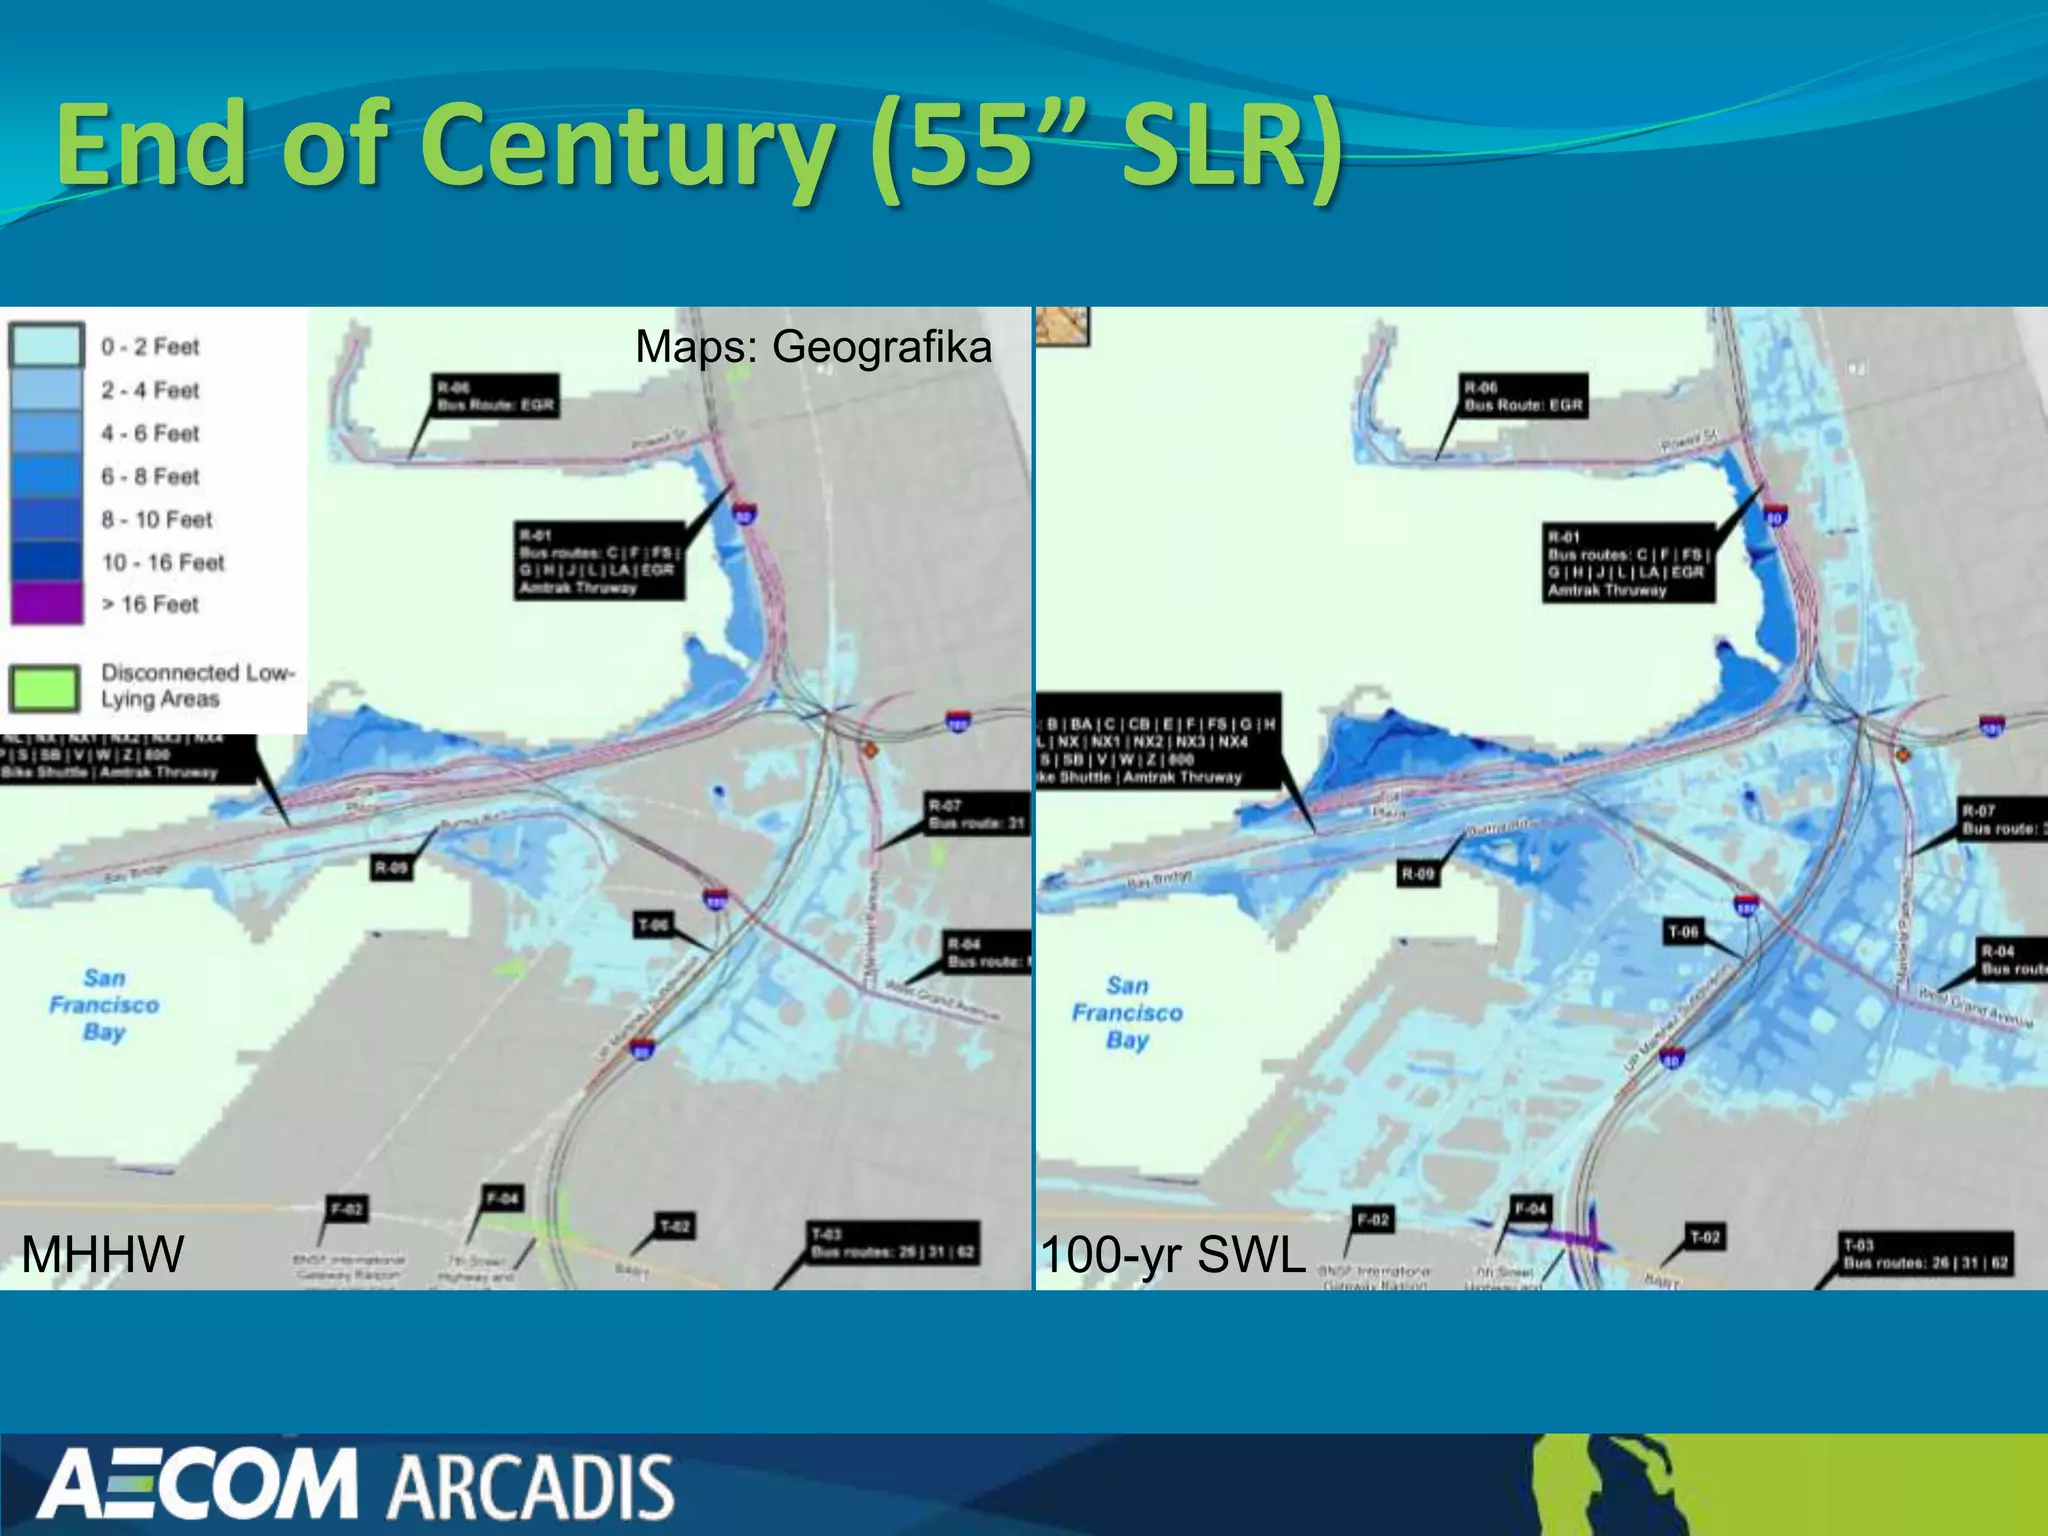
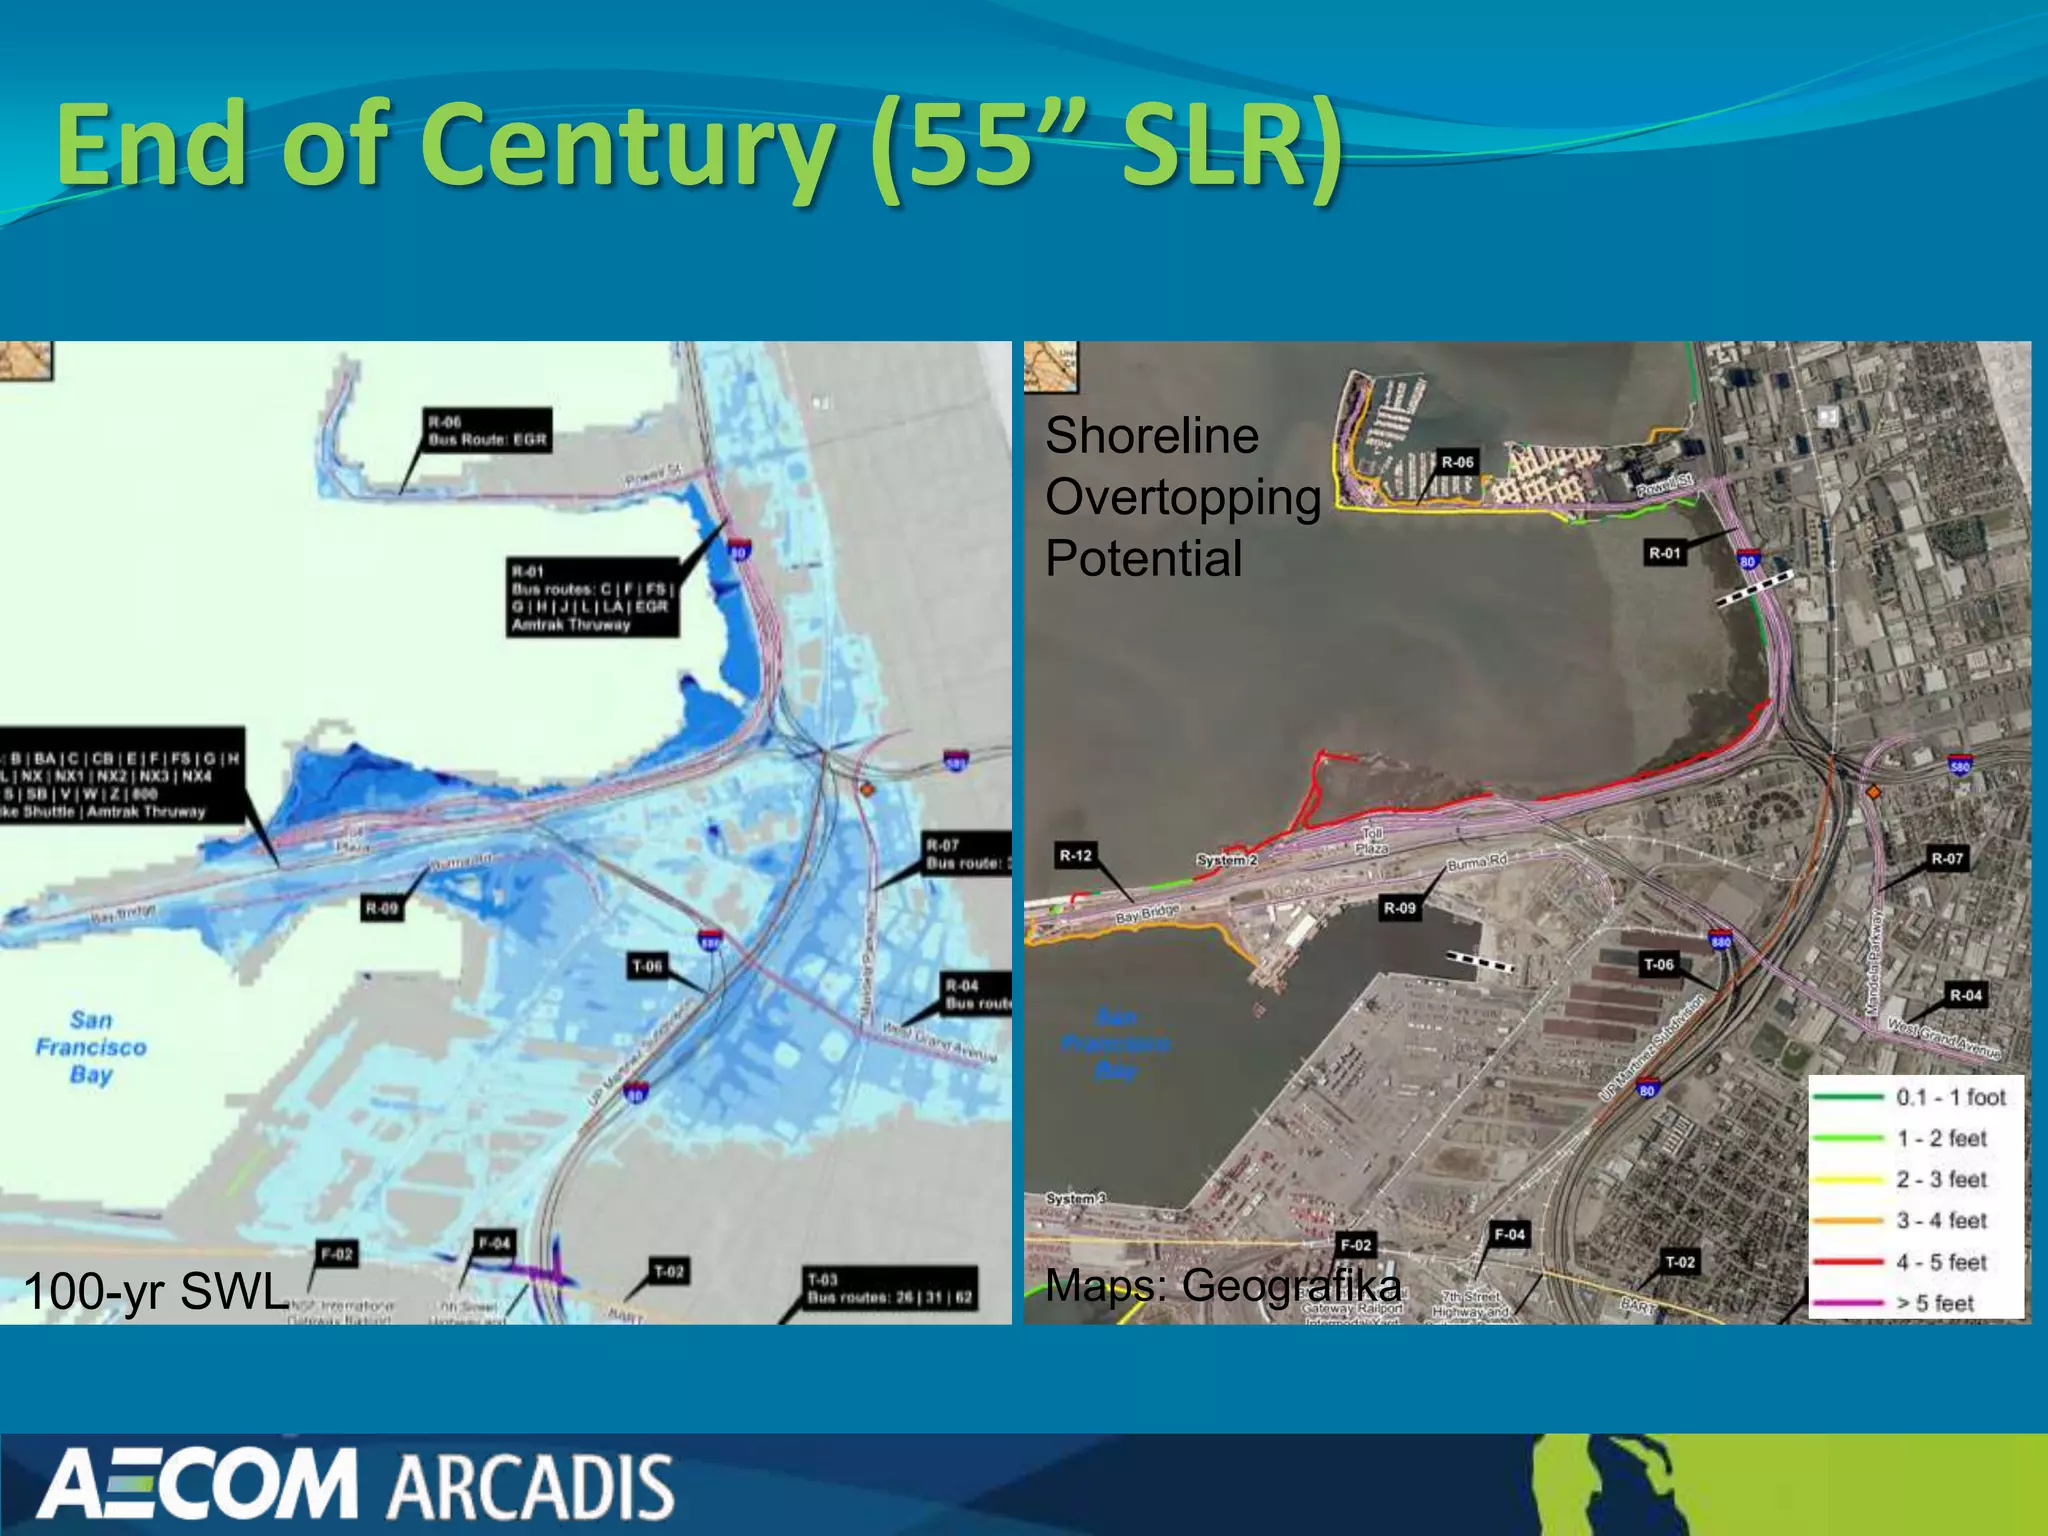
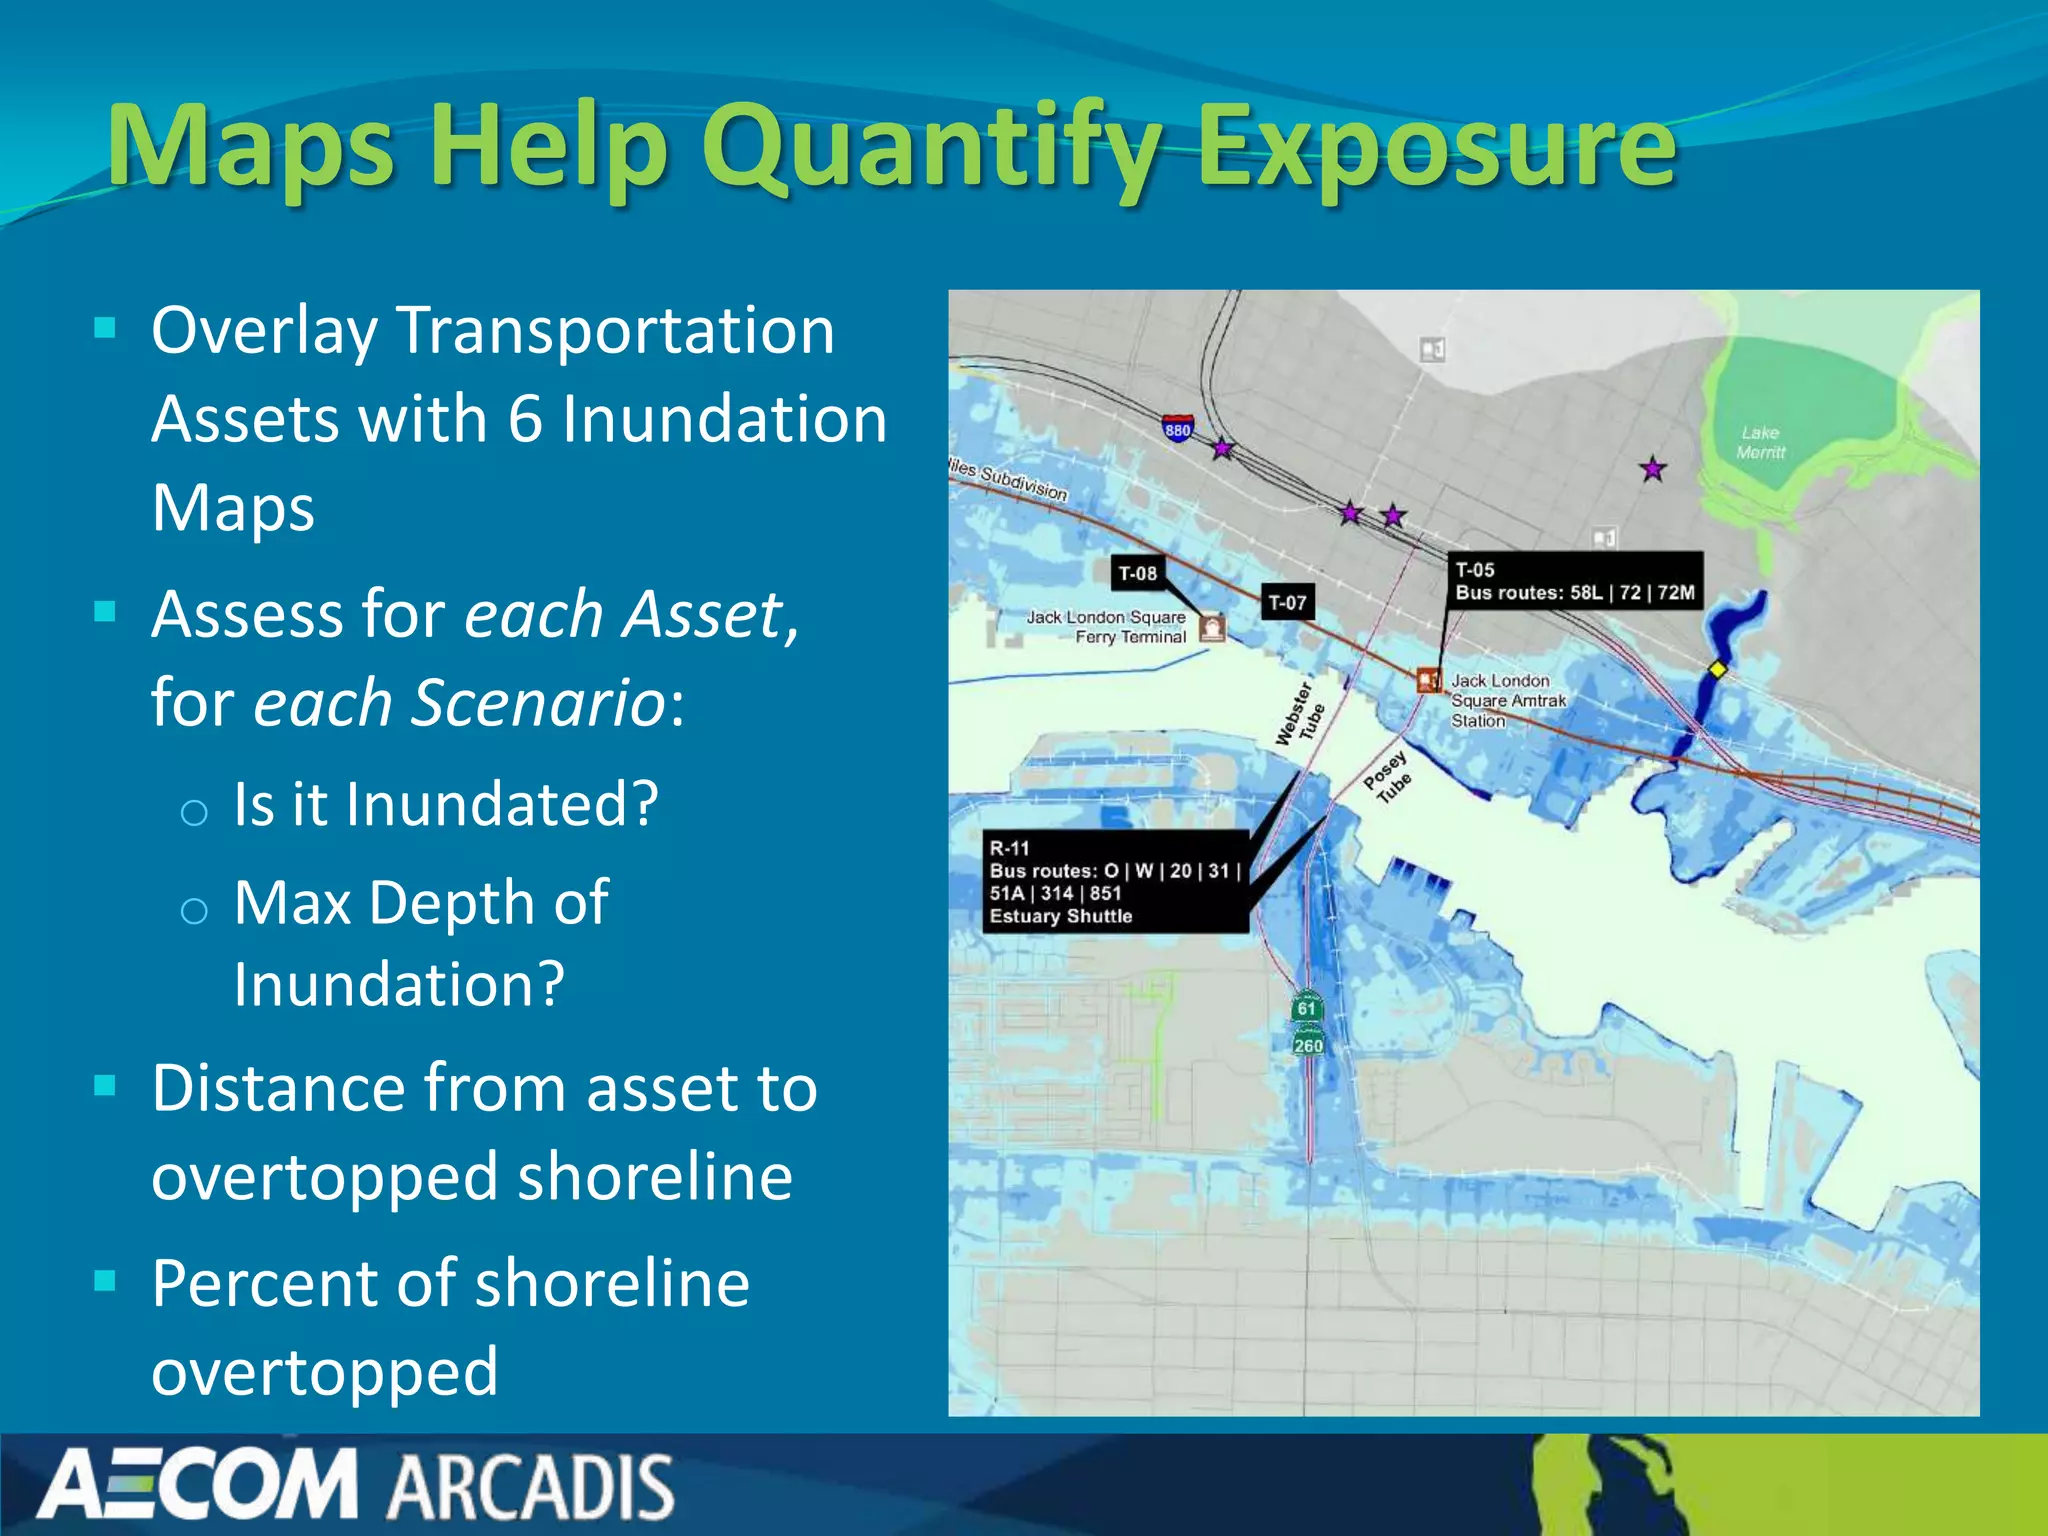
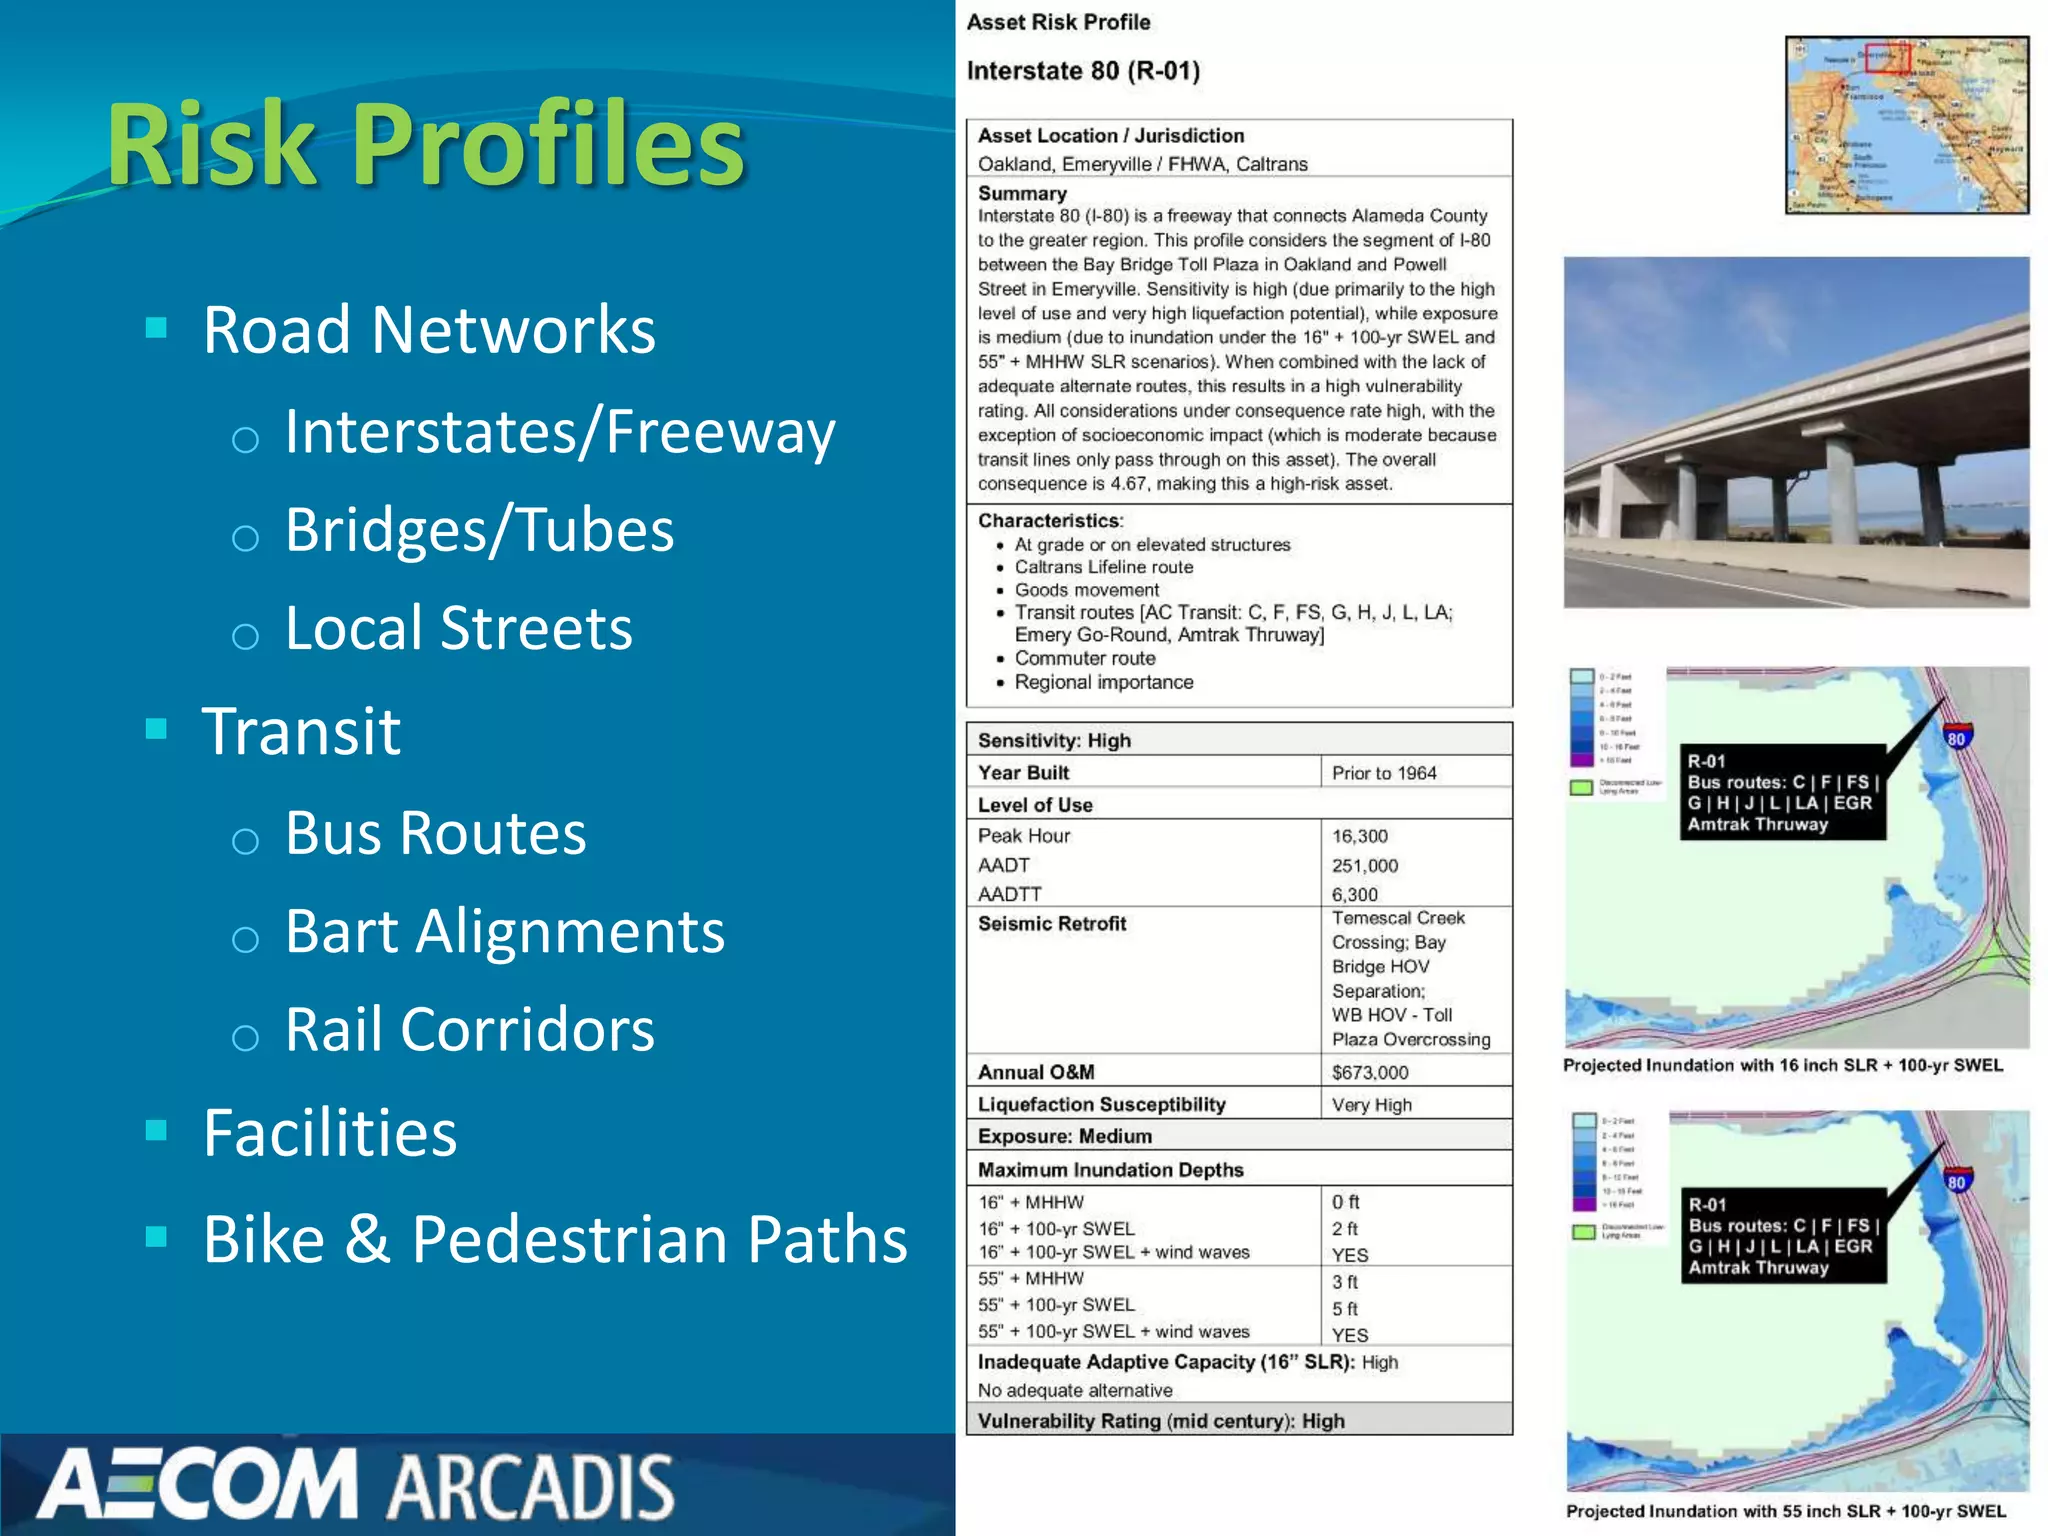
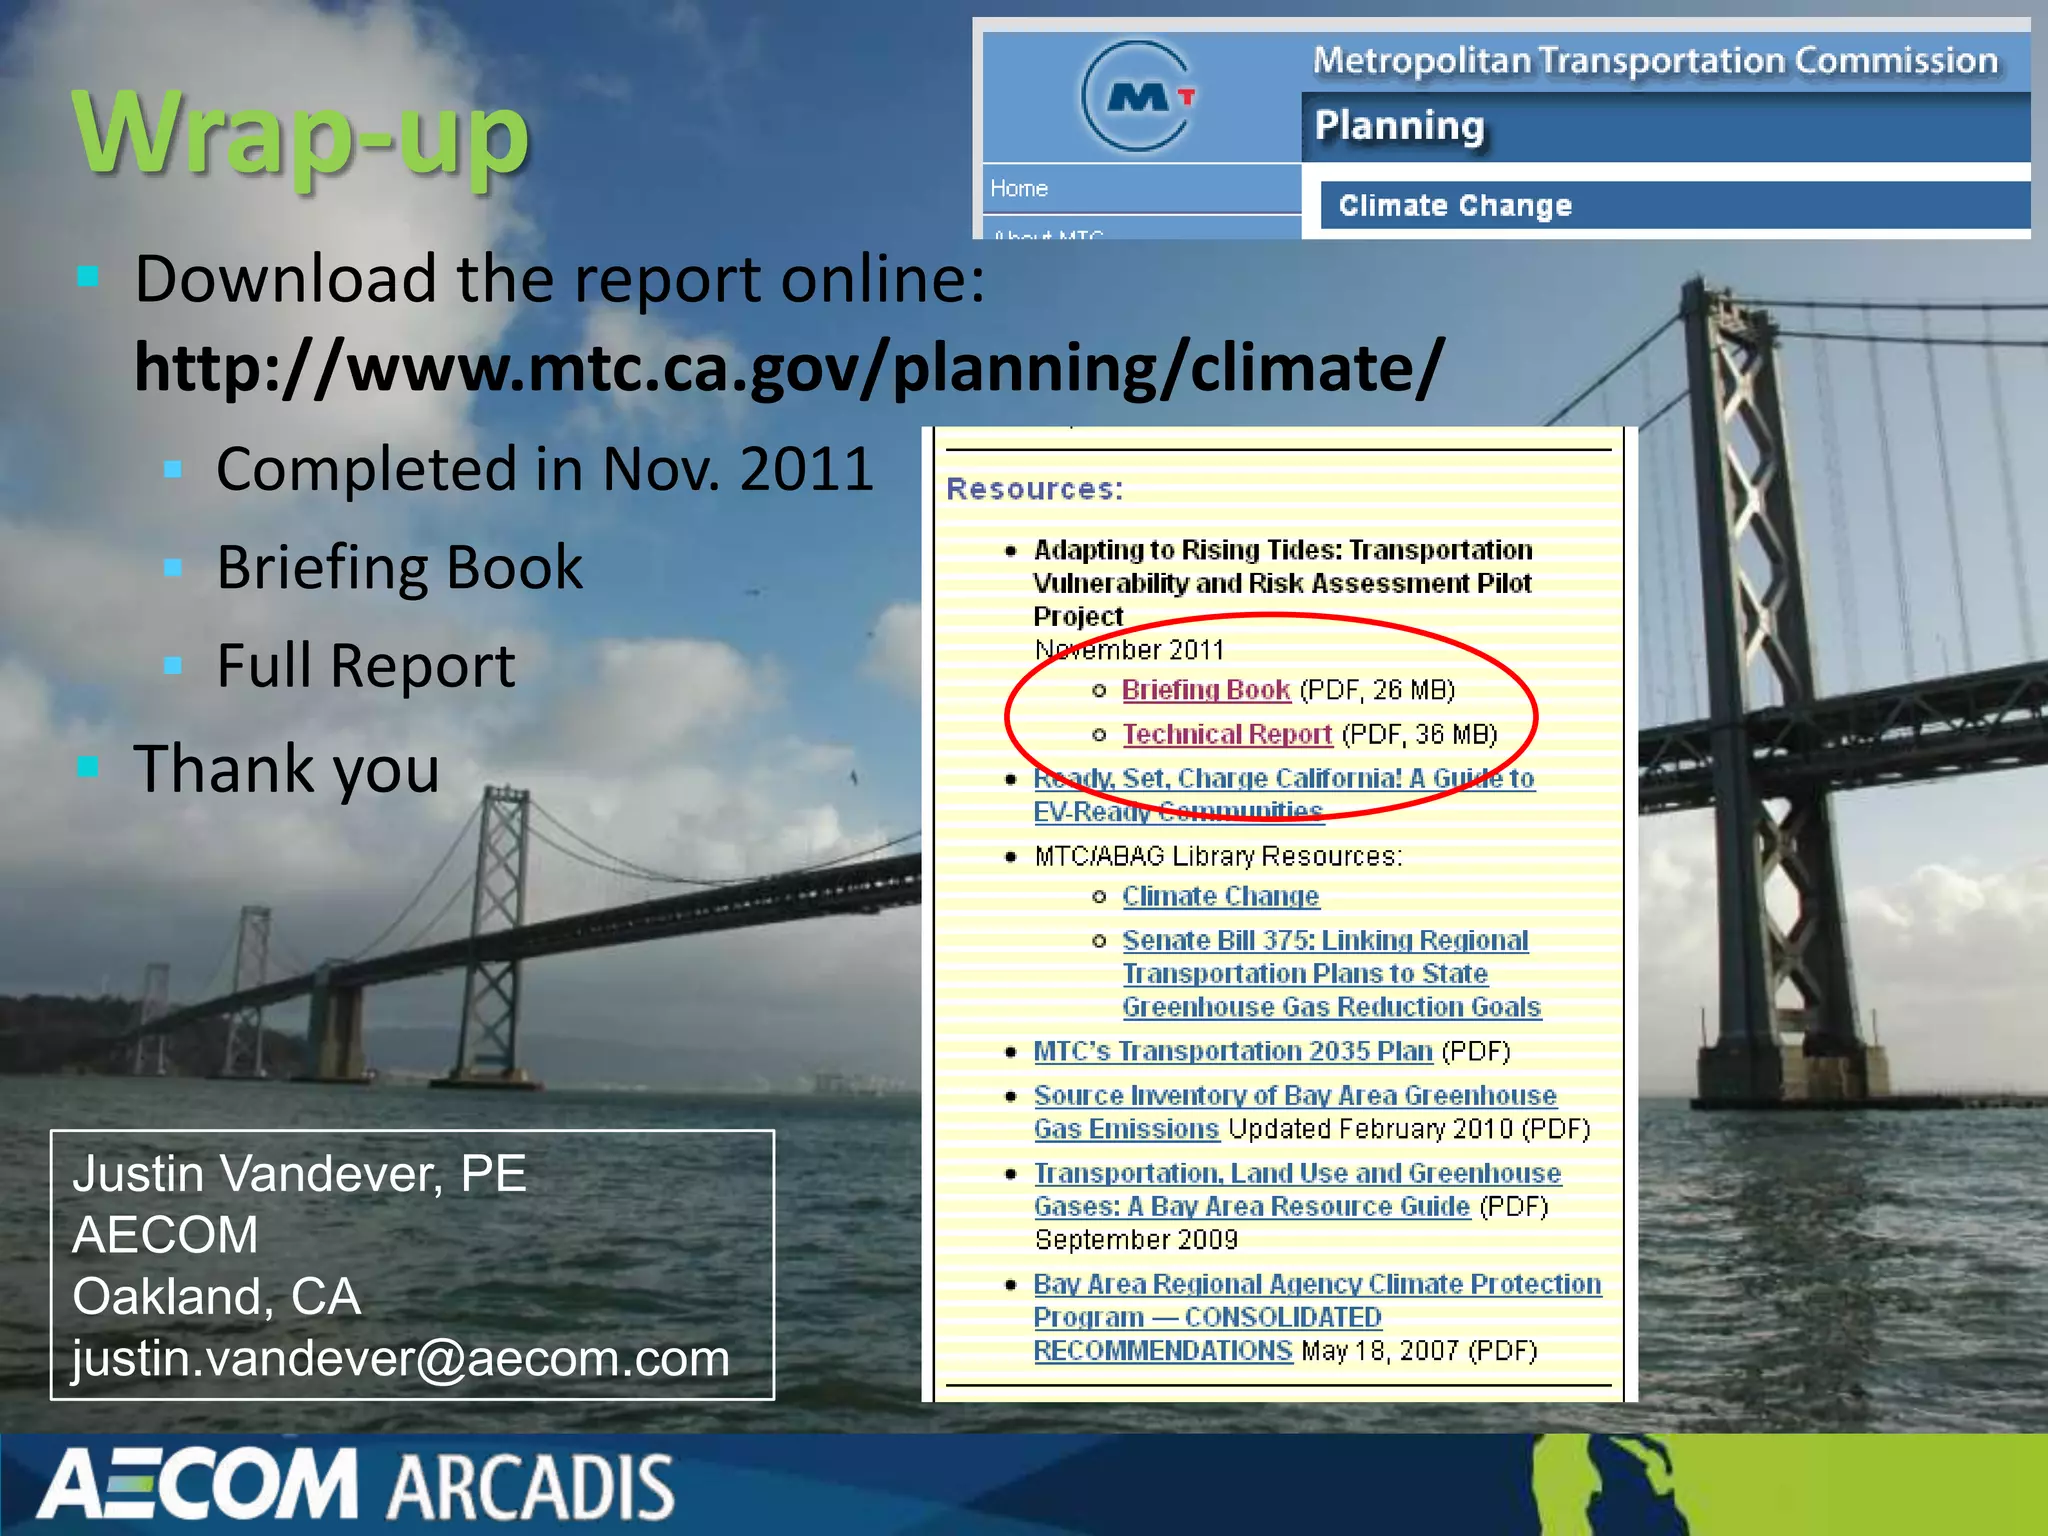
Justin Vandever, PE, Kris May, PhD PE, Brendan Gunn, CFM
                              justin.vandever@aecom.com


                   Headwaters to Ocean 2012 Conference
                                       May 29-31, 2012
                                         San Diego, CA
Project Team
 Project Management Team
  o MTC: Ashley Nguyen, Brenda Dix
  o BCDC: Wendy Goodfriend, Joe LaClair, Lindy Lowe
  o Caltrans: Stephen Yokoi, Richard Fahey
 Consultant Team
  o AECOM: Claire Bonham-Carter, Yanna Badet, Marcia
    Tobin, Sarah Heard, Jeff Chan, Ryan Park, Kris
    May, Justin Vandever, Brendan Gunn, Bob Fish, Stan
    Kline
  o Arcadis: Peter Wijsman, Lucas Paz
  o Geografika: Megan Gosch
  o 3D Visions: Kate Gillespie
ART and FHWA Background
Adapting to Rising Tides Project
 Partnership between SF Bay Conservation and
  Development Commission (BCDC) and NOAA
  Coastal Services Center
 Increase preparedness and resilience of Bay Area
  communities to sea level rise
 Evaluate shoreline impacts,
  vulnerabilities and risks,
  identify adaptation strategies
  and planning tools
ART and FHWA Background
Federal Highway Administration Risk Assessment
 Conceptual Model
   MTC, Caltrans, and BCDC collaborated on
    subregional planning pilot project
   Provides a framework for conducting risk and
    vulnerability assessments
   Test Federal Highway Administration (FHWA)
    conceptual Risk Assessment model to assess SLR
    risks to transportation infrastructure
   Portion of Alameda County shoreline selected for
    study area
Pilot Study: Alameda County
 One of Several Pilot
                             Bay
  Studies to test the FHWA   Bridge
  Conceptual Model                                         Previous
  (Vulnerability of                                        USGS/BCDC
                               Alameda                     Maps
  Transportation Assets to     Island
  Climate Change)
 Alameda County: Diverse                Airport
  Range of Shore
  Protection and
  Transportation Assets
 Project Extent:                           San Mateo
                                            Bridge
  Emeryville to Union City                         Salt
                                                   Ponds
Federal Highway
Administration
Vulnerability and
Risk Assessment
Conceptual Model
1. Data Asset Inventory

2. Asset Screening and
   Prioritization

3. Climate and Shoreline
   Information

4. Vulnerability Assessment

5. Risk Assessment

6. Next Steps/ Adaptation
   Strategies
Transportation Asset Inventory
Roads
Transit
Facilities
Bike/Pedestrian


Map: Geografika
Shoreline Asset Inventory
    Identify the topographic feature that controls
     inundation landward of shoreline (e.g., levee, road
     embankment, beach, etc)
    May not be the true “shoreline” (e.g., MHW, etc)
    Shoreline Categories
    1.   Engineered Flood Protection Structures
    2.   Engineered Shoreline Protection Structures
    3.   Non-Engineered Berms
    4.   Wetlands
    5.   Natural Shorelines (Non-Wetland)
    Shoreline delineation will be used later to determine
     vulnerability to inundation
Shoreline Asset Categories
                                                     Engineered Shoreline Protection
    Flood Protection Levee


                             Natural Shoreline (non-wetland)


Non-Engineered Berm              Images: Google Earth            Wetland Shoreline
Shoreline Categorization Maps

Wetland


                                          Berms
Engineered
Shoreline
Protection Natural


             Engineered
             Flood
             Protection
                          Maps: Arcadis
Sea Level Rise Scenarios for
  Inundation Mapping
 Sea Level Rise
   o 16” (high-end 2050)
   o 55” (mid-range 2100)
 Inundation Map Scenarios
   o MHHW + 16”
   o MHHW + 55”
   o 100-yr SWL + 16”
   o 100-yr SWL + 55”
   o 100-yr SWL + 16” + wind/wave
   o 100-yr SWL + 55” + wind/wave Map: Geografika
 Include depth of inundation and hydraulic connectivity
Inundation Scenarios
 MHHW – Mean Higher High Water. Typical daily high tide.
  Frequent inundation.
 100-yr Stillwater Level (SWL) – Extreme high tide. Very rare
  event. Also, the 1%-annual-chance tide level. No wave or local
  meteorological effects.
 100-yr SWL + wind and wave effects. Includes wind setup and
  wave setup at the shoreline. Includes wave height effects (but
  not wave runup or overtopping). Extreme coastal flood event.
               wind/wave
Inundation Mapping Inputs
 Topography: 2m Digital Elevation Model (DEM) using 2010 CA
 Coastal LIDAR (USGS)
 Daily and extreme tide levels – USGS TRIM2D (Knowles, 2009)

 Storm wave scenarios – FEMA MIKE21 hydrodynamic model:
 wind setup, wave setup, wave height (DHI, 2010)
 Hydraulic Connectivity – resolved using NOAA CSC
 methodology (Marcy et al., 2011)
 Depth of Inundation grids – depth
 along shoreline and at transportation
 assets
Ocean Protection Council LIDAR
                      USGS 2010
                      Complete Coverage
                       to 10 m Contour
                      2 m DEM used for
                       inundation
                       mapping
                      Resolves Levees
USGS TRIM2D Modeling
      Hydrodynamic Model
      Extraction Points
                            100-yr Water Level Time Series
                            (Detrended = SLR trend removed)


Estimate MHHW and 100-yr SWL at each extraction point
FEMA MIKE21 Modeling
                        DHI (2010) for
                           FEMA
                          32-year
                           Continuous
                           Hindcast
                          Water Levels
   Swell
                           (MIKE21 HD)
                          Wind Waves
                           (MIKE21 SW)
                          Ocean Swell
                           (MIKE21 SW)
NOAA Methodology
 Sea Level Rise Viewer (Marcy et al, 2011)
 Hydraulic Connectivity
 Inputs:
  o Water Surface
    Elevation (DEM)
    at Shoreline
  o Transect Definition
  o DEM (at a resolution
    that resolves
    shoreline features)
Mid Century (16” SLR)
MHHW              100-yr SWL


                 Maps: Geografika
Mid Century (16” SLR)
100-yr SWL         Shoreline
                   Overtopping
                   Potential


Maps: Geografika
End of Century (55” SLR)
          Maps: Geografika


MHHW                         100-yr SWL
End of Century (55” SLR)

                   Shoreline
                   Overtopping
                   Potential


100-yr SWL         Maps: Geografika
Maps Help Quantify Exposure
 Overlay Transportation
  Assets with 6 Inundation
  Maps
 Assess for each Asset,
  for each Scenario:
  o Is it Inundated?
  o Max Depth of
    Inundation?
 Distance from asset to
  overtopped shoreline
 Percent of shoreline
  overtopped
Risk Profiles
 Road Networks
   o Interstates/Freeway
   o Bridges/Tubes
   o Local Streets
 Transit
   o Bus Routes
   o Bart Alignments
   o Rail Corridors
 Facilities
 Bike & Pedestrian Paths
Wrap-up
 Download the report online:
  http://www.mtc.ca.gov/planning/climate/
    Completed in Nov. 2011
    Briefing Book
    Full Report
 Thank you


Justin Vandever, PE
AECOM
Oakland, CA
justin.vandever@aecom.com

Sea Level Rise Inundation Mapping for the ART Project

  • 1.
    Justin Vandever, PE,Kris May, PhD PE, Brendan Gunn, CFM justin.vandever@aecom.com Headwaters to Ocean 2012 Conference May 29-31, 2012 San Diego, CA
  • 2.
    Project Team  ProjectManagement Team o MTC: Ashley Nguyen, Brenda Dix o BCDC: Wendy Goodfriend, Joe LaClair, Lindy Lowe o Caltrans: Stephen Yokoi, Richard Fahey  Consultant Team o AECOM: Claire Bonham-Carter, Yanna Badet, Marcia Tobin, Sarah Heard, Jeff Chan, Ryan Park, Kris May, Justin Vandever, Brendan Gunn, Bob Fish, Stan Kline o Arcadis: Peter Wijsman, Lucas Paz o Geografika: Megan Gosch o 3D Visions: Kate Gillespie
  • 3.
    ART and FHWABackground Adapting to Rising Tides Project  Partnership between SF Bay Conservation and Development Commission (BCDC) and NOAA Coastal Services Center  Increase preparedness and resilience of Bay Area communities to sea level rise  Evaluate shoreline impacts, vulnerabilities and risks, identify adaptation strategies and planning tools
  • 4.
    ART and FHWABackground Federal Highway Administration Risk Assessment Conceptual Model  MTC, Caltrans, and BCDC collaborated on subregional planning pilot project  Provides a framework for conducting risk and vulnerability assessments  Test Federal Highway Administration (FHWA) conceptual Risk Assessment model to assess SLR risks to transportation infrastructure  Portion of Alameda County shoreline selected for study area
  • 5.
    Pilot Study: AlamedaCounty  One of Several Pilot Bay Studies to test the FHWA Bridge Conceptual Model Previous (Vulnerability of USGS/BCDC Alameda Maps Transportation Assets to Island Climate Change)  Alameda County: Diverse Airport Range of Shore Protection and Transportation Assets  Project Extent: San Mateo Bridge Emeryville to Union City Salt Ponds
  • 6.
    Federal Highway Administration Vulnerability and RiskAssessment Conceptual Model 1. Data Asset Inventory 2. Asset Screening and Prioritization 3. Climate and Shoreline Information 4. Vulnerability Assessment 5. Risk Assessment 6. Next Steps/ Adaptation Strategies
  • 7.
  • 8.
    Shoreline Asset Inventory  Identify the topographic feature that controls inundation landward of shoreline (e.g., levee, road embankment, beach, etc)  May not be the true “shoreline” (e.g., MHW, etc)  Shoreline Categories 1. Engineered Flood Protection Structures 2. Engineered Shoreline Protection Structures 3. Non-Engineered Berms 4. Wetlands 5. Natural Shorelines (Non-Wetland)  Shoreline delineation will be used later to determine vulnerability to inundation
  • 9.
    Shoreline Asset Categories Engineered Shoreline Protection Flood Protection Levee Natural Shoreline (non-wetland) Non-Engineered Berm Images: Google Earth Wetland Shoreline
  • 10.
    Shoreline Categorization Maps Wetland Berms Engineered Shoreline Protection Natural Engineered Flood Protection Maps: Arcadis
  • 11.
    Sea Level RiseScenarios for Inundation Mapping  Sea Level Rise o 16” (high-end 2050) o 55” (mid-range 2100)  Inundation Map Scenarios o MHHW + 16” o MHHW + 55” o 100-yr SWL + 16” o 100-yr SWL + 55” o 100-yr SWL + 16” + wind/wave o 100-yr SWL + 55” + wind/wave Map: Geografika  Include depth of inundation and hydraulic connectivity
  • 12.
    Inundation Scenarios  MHHW– Mean Higher High Water. Typical daily high tide. Frequent inundation.  100-yr Stillwater Level (SWL) – Extreme high tide. Very rare event. Also, the 1%-annual-chance tide level. No wave or local meteorological effects.  100-yr SWL + wind and wave effects. Includes wind setup and wave setup at the shoreline. Includes wave height effects (but not wave runup or overtopping). Extreme coastal flood event. wind/wave
  • 13.
    Inundation Mapping Inputs Topography: 2m Digital Elevation Model (DEM) using 2010 CA Coastal LIDAR (USGS)  Daily and extreme tide levels – USGS TRIM2D (Knowles, 2009)  Storm wave scenarios – FEMA MIKE21 hydrodynamic model: wind setup, wave setup, wave height (DHI, 2010)  Hydraulic Connectivity – resolved using NOAA CSC methodology (Marcy et al., 2011)  Depth of Inundation grids – depth along shoreline and at transportation assets
  • 14.
    Ocean Protection CouncilLIDAR  USGS 2010  Complete Coverage to 10 m Contour  2 m DEM used for inundation mapping  Resolves Levees
  • 15.
    USGS TRIM2D Modeling Hydrodynamic Model Extraction Points 100-yr Water Level Time Series (Detrended = SLR trend removed) Estimate MHHW and 100-yr SWL at each extraction point
  • 16.
    FEMA MIKE21 Modeling  DHI (2010) for FEMA  32-year Continuous Hindcast  Water Levels Swell (MIKE21 HD)  Wind Waves (MIKE21 SW)  Ocean Swell (MIKE21 SW)
  • 17.
    NOAA Methodology  SeaLevel Rise Viewer (Marcy et al, 2011)  Hydraulic Connectivity  Inputs: o Water Surface Elevation (DEM) at Shoreline o Transect Definition o DEM (at a resolution that resolves shoreline features)
  • 18.
    Mid Century (16”SLR) MHHW 100-yr SWL Maps: Geografika
  • 19.
    Mid Century (16”SLR) 100-yr SWL Shoreline Overtopping Potential Maps: Geografika
  • 20.
    End of Century(55” SLR) Maps: Geografika MHHW 100-yr SWL
  • 21.
    End of Century(55” SLR) Shoreline Overtopping Potential 100-yr SWL Maps: Geografika
  • 22.
    Maps Help QuantifyExposure  Overlay Transportation Assets with 6 Inundation Maps  Assess for each Asset, for each Scenario: o Is it Inundated? o Max Depth of Inundation?  Distance from asset to overtopped shoreline  Percent of shoreline overtopped
  • 23.
    Risk Profiles  RoadNetworks o Interstates/Freeway o Bridges/Tubes o Local Streets  Transit o Bus Routes o Bart Alignments o Rail Corridors  Facilities  Bike & Pedestrian Paths
  • 24.
    Wrap-up  Download thereport online: http://www.mtc.ca.gov/planning/climate/  Completed in Nov. 2011  Briefing Book  Full Report  Thank you Justin Vandever, PE AECOM Oakland, CA justin.vandever@aecom.com