WHAT IS PYTHONLIBRARY?
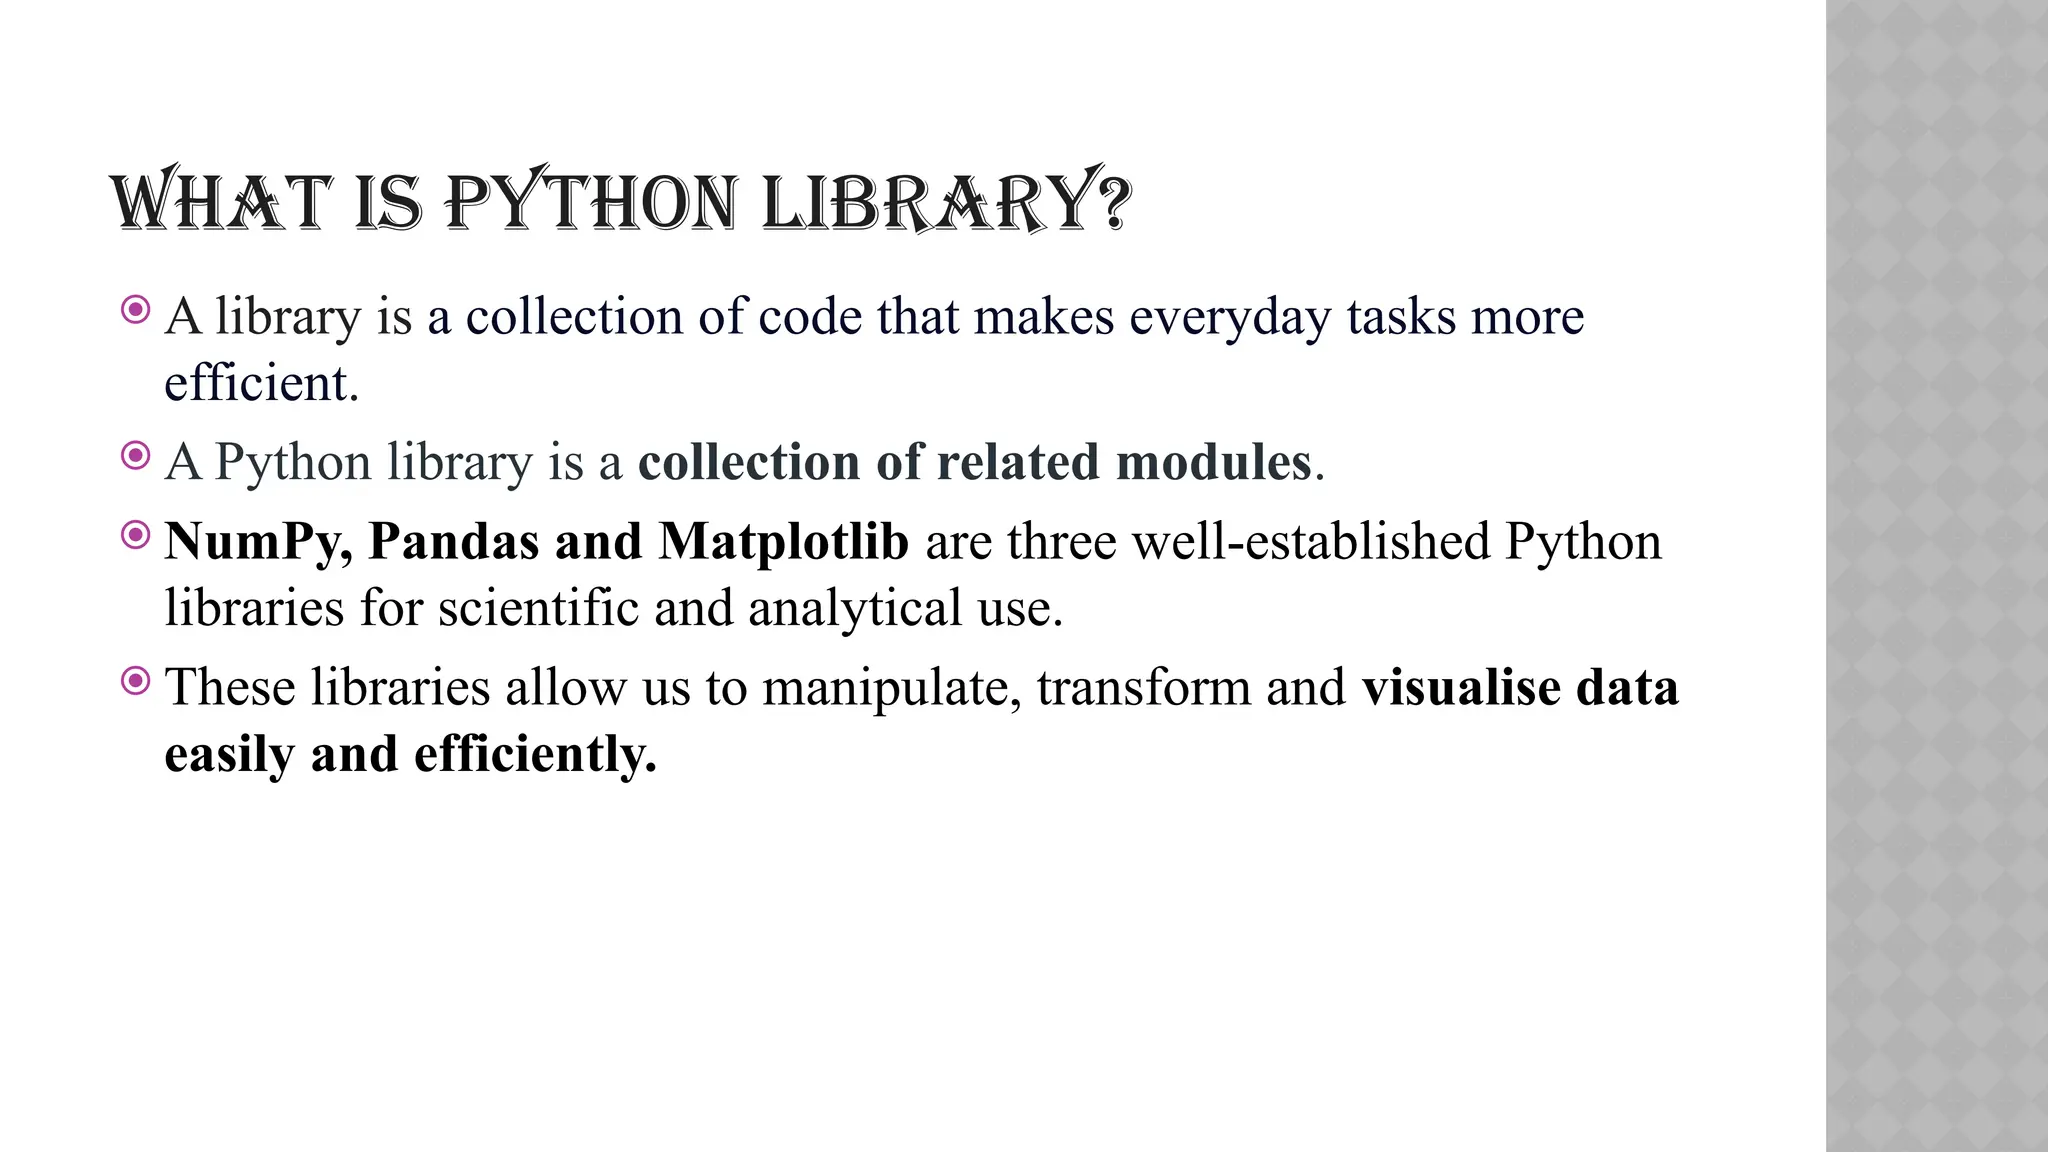
A library is a collection of code that makes everyday tasks more
efficient.
A Python library is a collection of related modules.
NumPy, Pandas and Matplotlib are three well-established Python
libraries for scientific and analytical use.
These libraries allow us to manipulate, transform and visualise data
easily and efficiently.
3.
WHAT IS PANDAS?
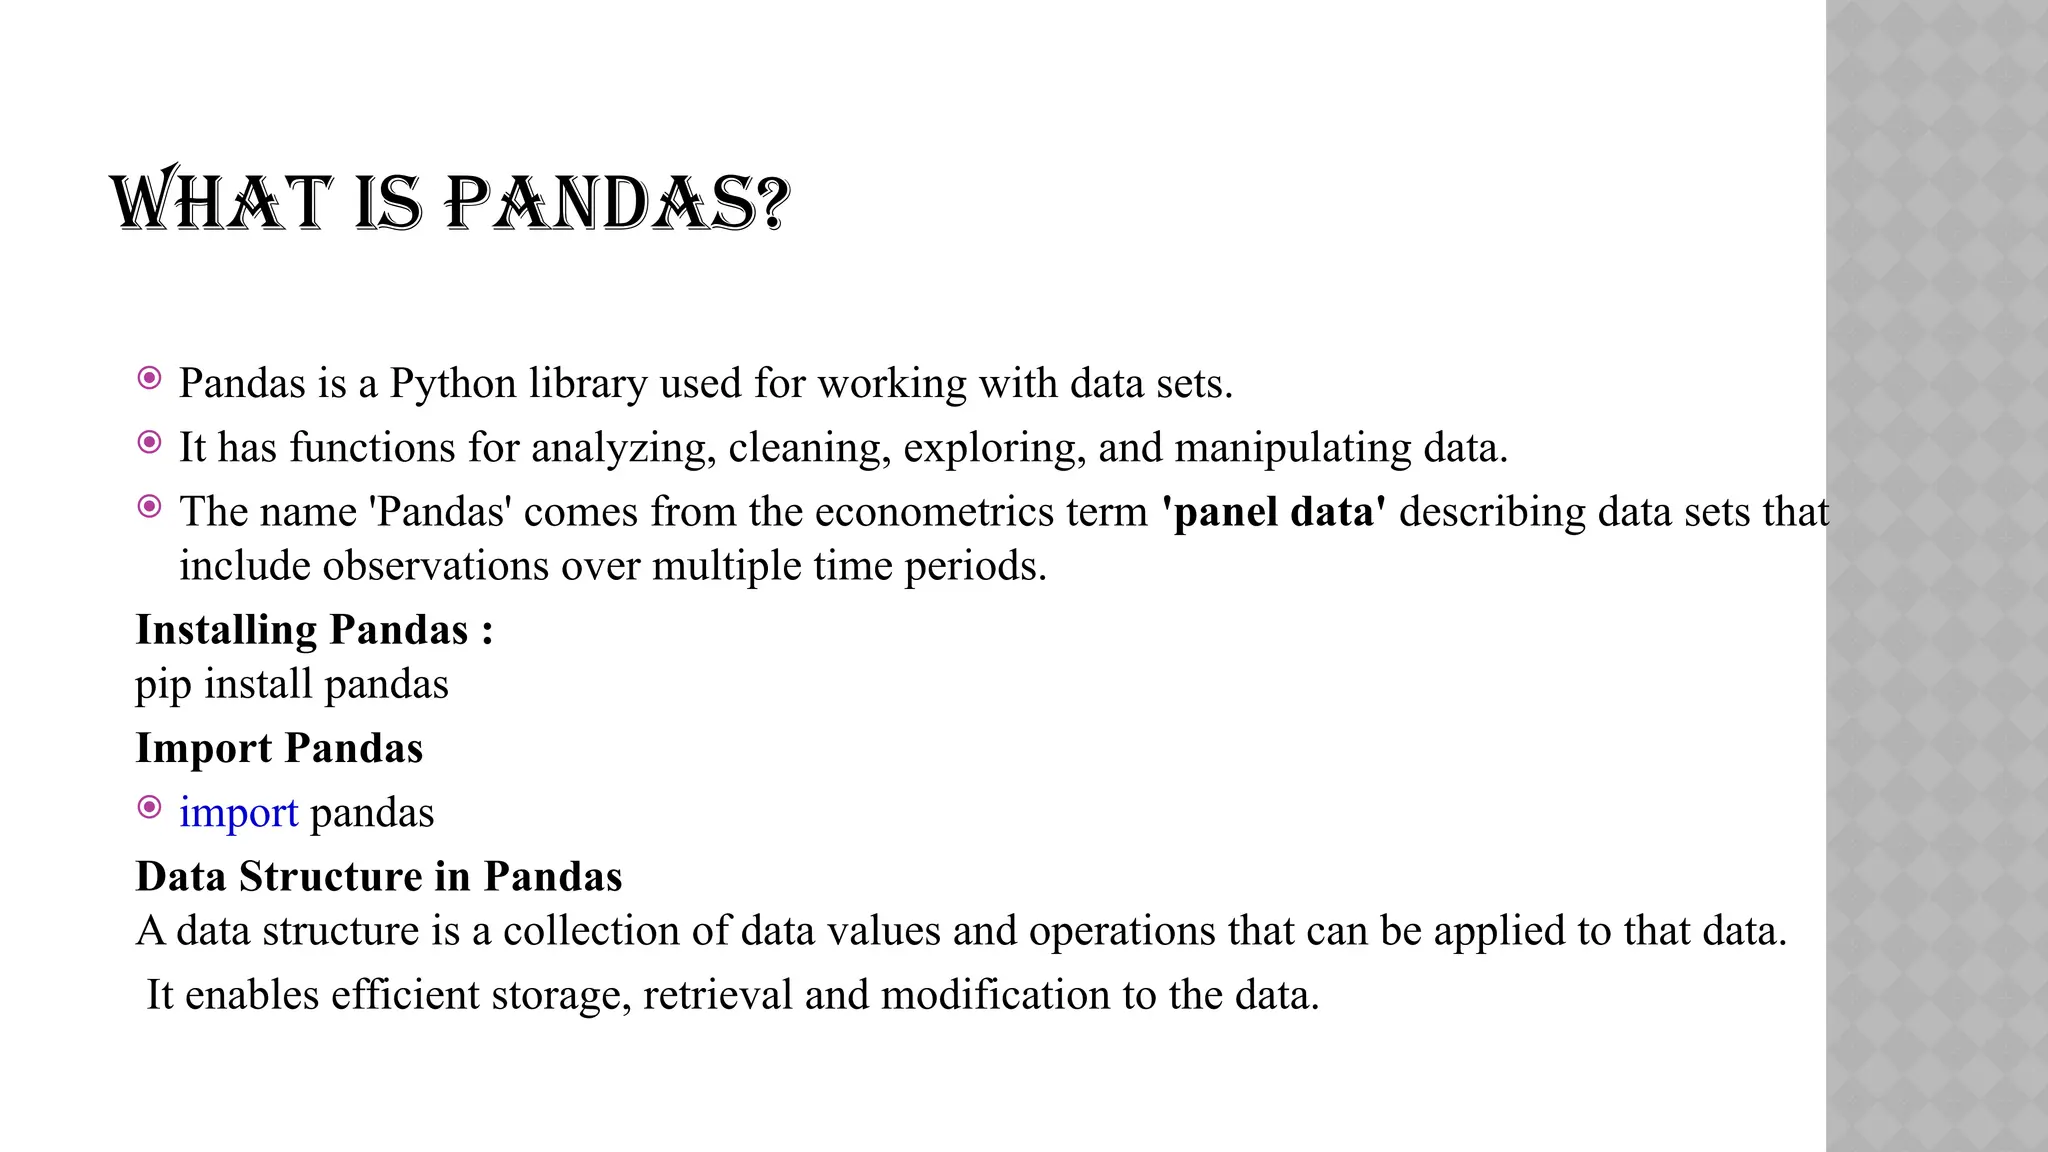
Pandas is a Python library used for working with data sets.
It has functions for analyzing, cleaning, exploring, and manipulating data.
The name 'Pandas' comes from the econometrics term 'panel data' describing data sets that
include observations over multiple time periods.
Installing Pandas :
pip install pandas
Import Pandas
import pandas
Data Structure in Pandas
A data structure is a collection of data values and operations that can be applied to that data.
It enables efficient storage, retrieval and modification to the data.
WHAT IS ASERIES?
A Pandas Series is like a column in a table.
It is a one-dimensional array holding data of any type.
import pandas as pd
a = [1,7,2]
myvar = pd.Series(a)
print(myvar)
O/P:
Labels
If nothing else is specified, the values are labeled with their index number. First value has index 0, second value has index 1 etc.
0 1
1 7
2 2
dtype: int64
6.
Create Labels
With theindex argument, you can name your own labels.
Example
Create your own labels:
import pandas as pd
a = [1, 7, 2]
myvar = pd.Series(a, index = ["x", "y", "z"])
print(myvar)
O/P
x 1
y 7
z 2
dtype: int64
7.
CREATION OF SERIESFROM NUMPY ARRAYS
We can create a series from a one-dimensional (1D)
NumPy array, as shown below:
import numpy as np # import NumPy with alias np
import pandas as pd
array1 = np.array([1,2,3,4])
series3 = pd.Series(array1)
print(series3)
8.
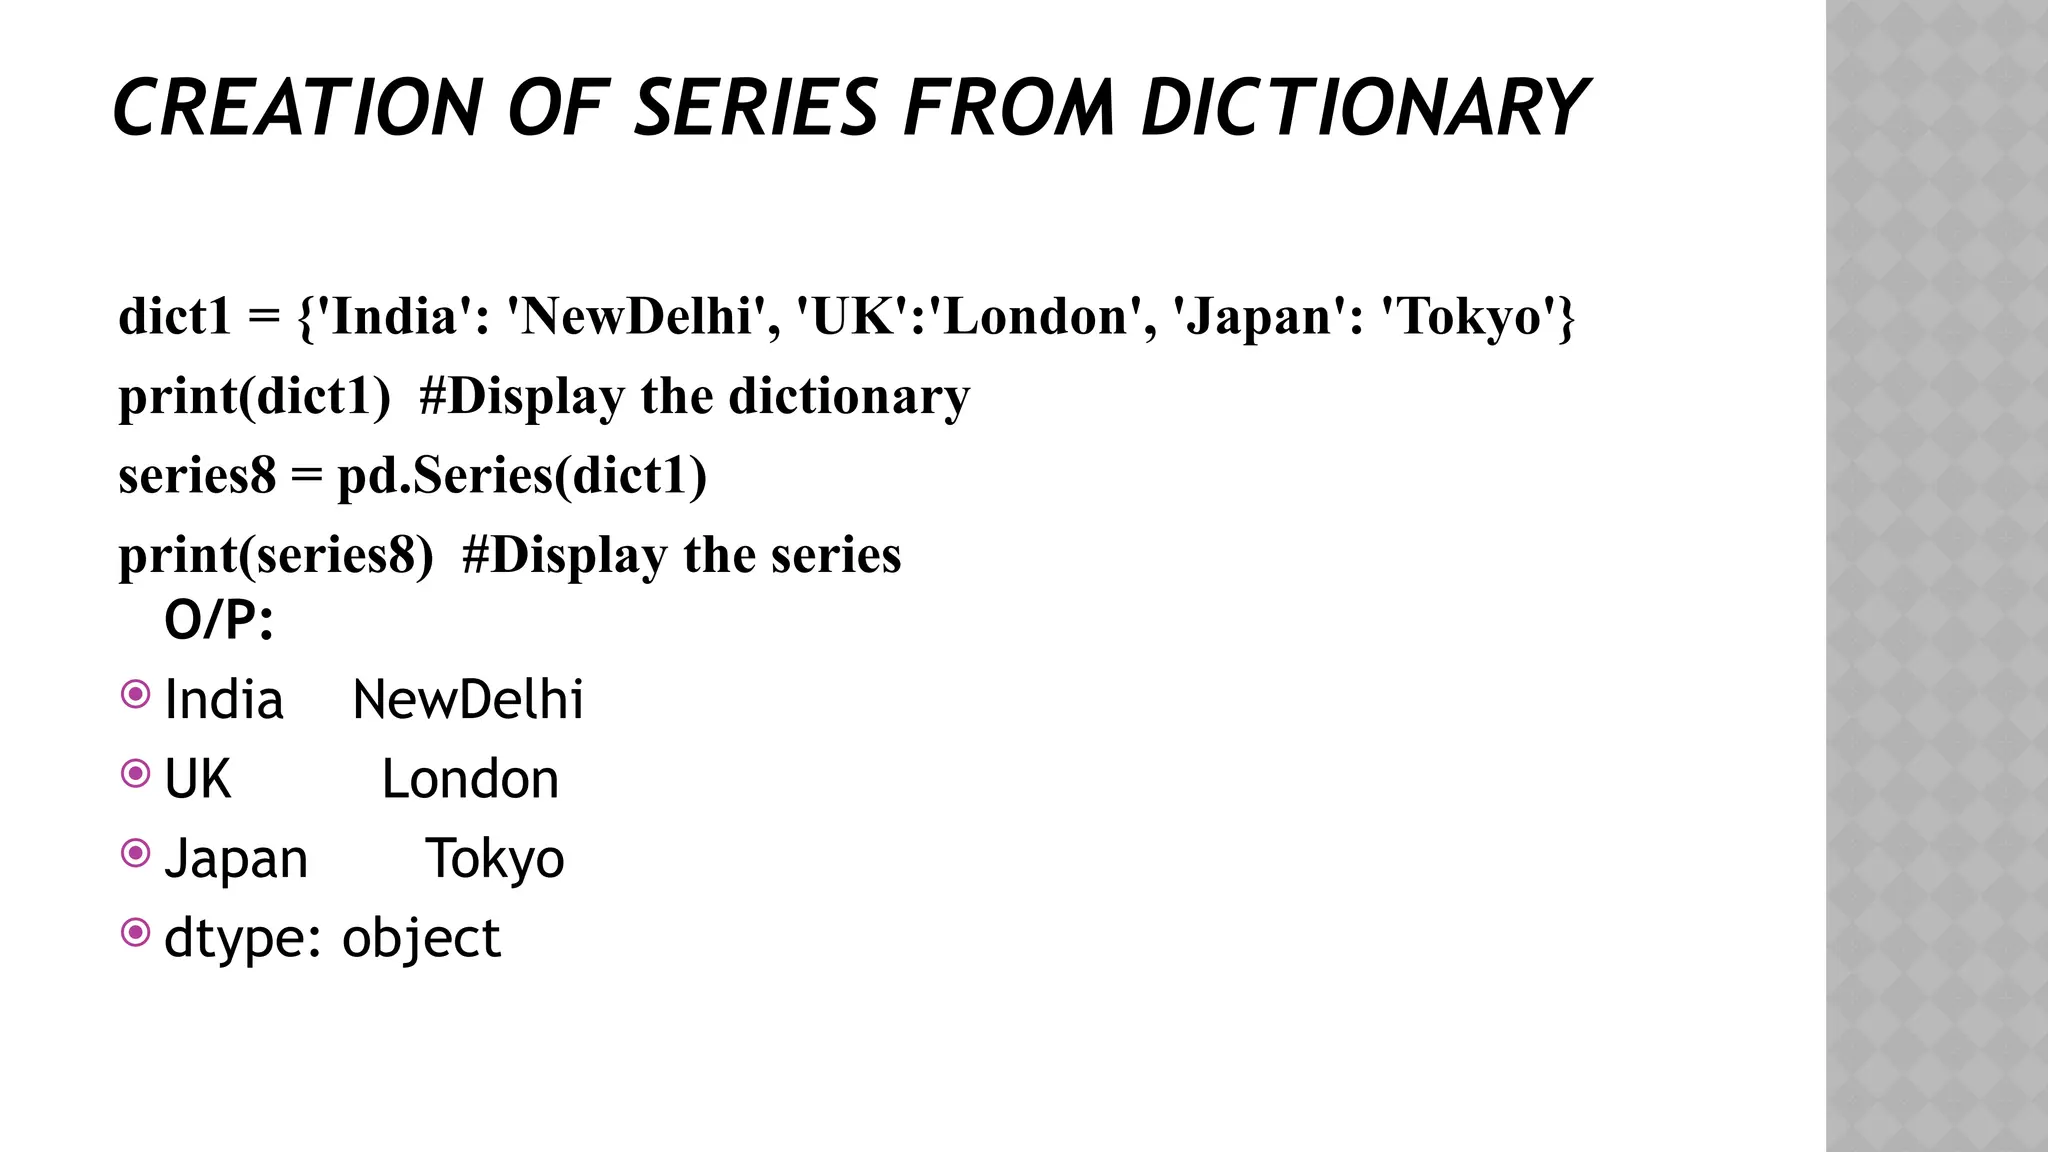
CREATION OF SERIESFROM DICTIONARY
dict1 = {'India': 'NewDelhi', 'UK':'London', 'Japan': 'Tokyo'}
print(dict1) #Display the dictionary
series8 = pd.Series(dict1)
print(series8) #Display the series
O/P:
India NewDelhi
UK London
Japan Tokyo
dtype: object
9.
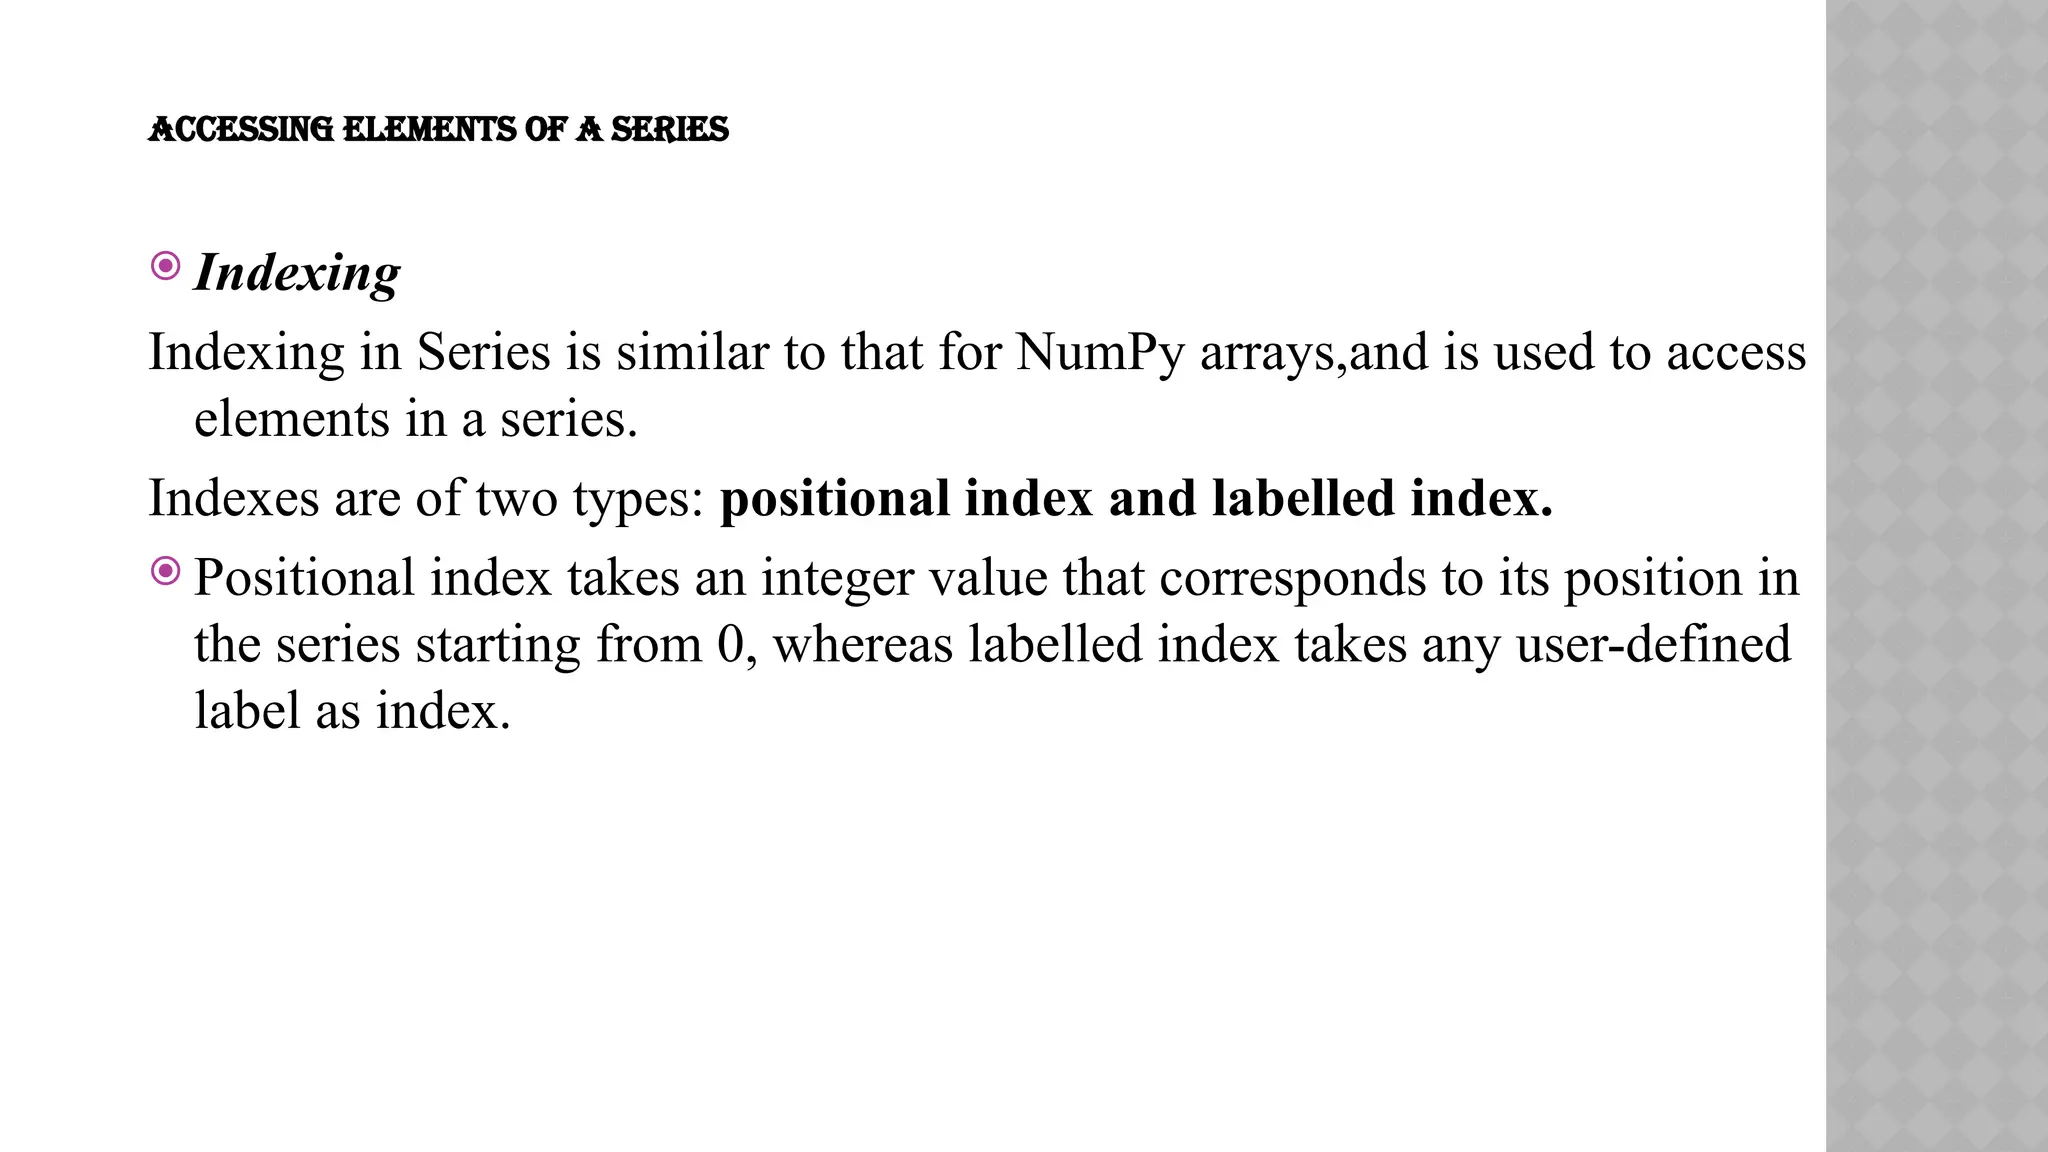
ACCESSING ELEMENTS OFA SERIES
Indexing
Indexing in Series is similar to that for NumPy arrays,and is used to access
elements in a series.
Indexes are of two types: positional index and labelled index.
Positional index takes an integer value that corresponds to its position in
the series starting from 0, whereas labelled index takes any user-defined
label as index.
10.
POSITIONAL INDEX ANDLABELLED INDEX
Positional index
seriesNum = pd.Series([10,20,30])
seriesNum[2]
O/P: 30
Labelled index
seriesMnths = pd.Series([2,3,4],index=["Feb","Mar","Apr"])
seriesMnths["Mar"]
O/P:3
11.
SLICING
Slicing
Sometimes, we mayneed to extract a part of a series. We can define which
part of the series is to be sliced by specifying the start and end parameters
[start :end] with the series name.
When we use positional indices for slicing, the value at the end index
position is excluded, i.e., only (end -start) number of data values of the
series are extracted.
seriesCapCntry = pd.Series(['NewDelhi', 'WashingtonDC', 'London',
'Paris'], index=['India', 'USA', 'UK', 'France'])
seriesCapCntry[1:3] #excludes the value at index position 3
USA WashingtonDC
UK London
dtype: object
12.
If labelledindexes are used for slicing, then value at the end index
label is also included in the output, for example:
seriesCapCntry['USA' : 'France']
USA WashingtonDC
UK London
France Paris
dtype: object
13.
We canalso get the series in reverse order, for
example:
seriesCapCntry[ : : -1]
France Paris
UK London
USA WashingtonDC
India NewDelhi
dtype: object
14.
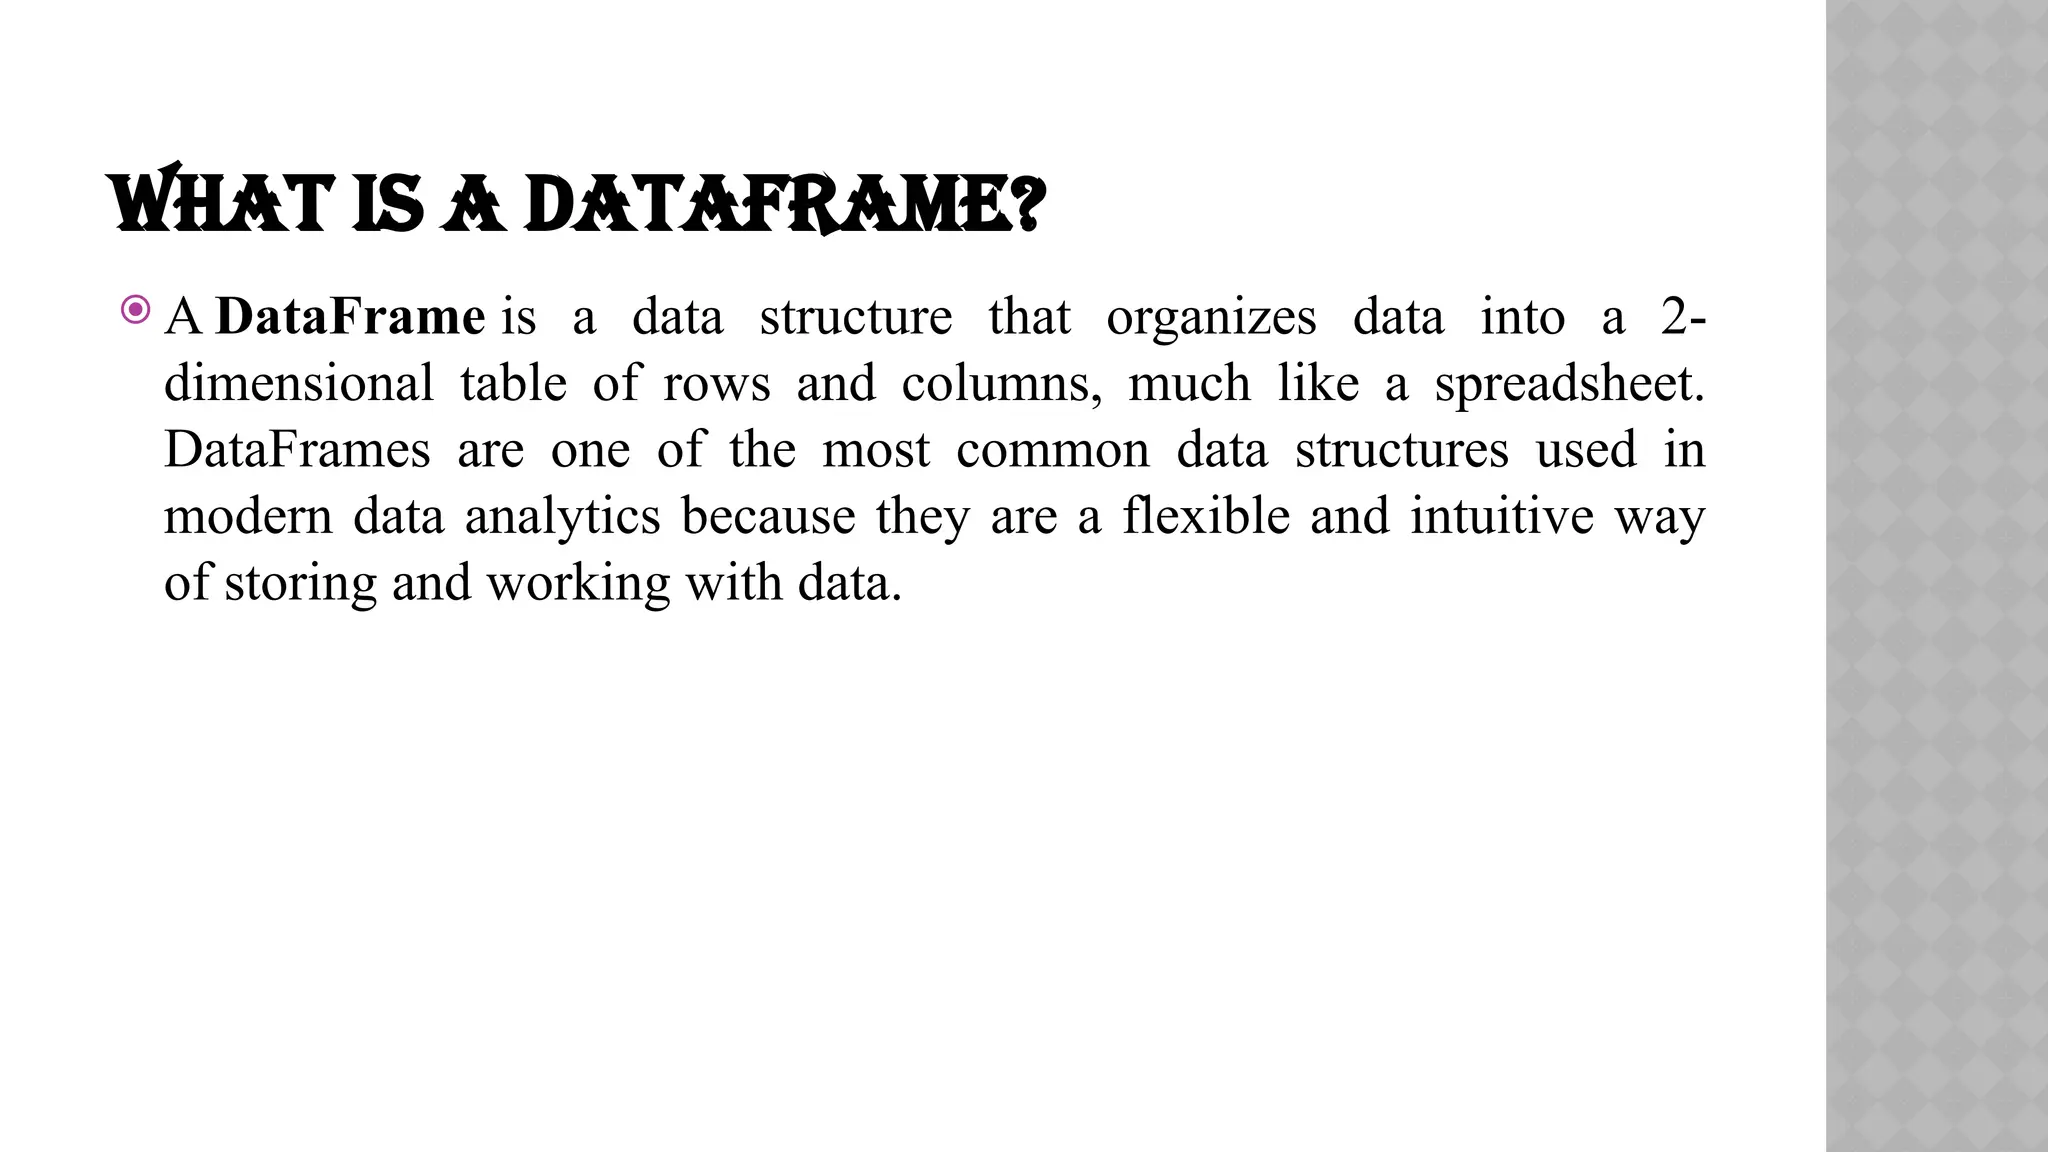
WHAT IS ADATAFRAME?
A DataFrame is a data structure that organizes data into a 2-
dimensional table of rows and columns, much like a spreadsheet.
DataFrames are one of the most common data structures used in
modern data analytics because they are a flexible and intuitive way
of storing and working with data.
15.
The Matplotliblibrary in Python is used for plotting graphs and visualisation.
Using Matplotlib, with just a few lines of code we can generate publication
quality plots, histograms, bar charts, scatterplots, etc.
1. A Numpy array requires homogeneous data, while a Pandas DataFrame can
have different data types (float, int, string, datetime, etc.).
2. Pandas have a simpler interface for operations like file loading, plotting,
selection, joining, GROUP BY, which come very handy in data-processing
applications.
3. Pandas DataFrames (with column names) make it very easy to keep track of
data.
4. Pandas is used when data is in Tabular Format, whereas Numpy is used for
numeric array based data manipulation.

![WHAT IS A SERIES?
A Pandas Series is like a column in a table.
It is a one-dimensional array holding data of any type.
import pandas as pd
a = [1,7,2]
myvar = pd.Series(a)
print(myvar)
O/P:
Labels
If nothing else is specified, the values are labeled with their index number. First value has index 0, second value has index 1 etc.
0 1
1 7
2 2
dtype: int64](https://image.slidesharecdn.com/introductiontopythonlibraries-250411053822-50b609c7/75/Introduction-to-a-Python-Libraries-and-python-frameworks-5-2048.jpg)
![Create Labels
With the index argument, you can name your own labels.
Example
Create your own labels:
import pandas as pd
a = [1, 7, 2]
myvar = pd.Series(a, index = ["x", "y", "z"])
print(myvar)
O/P
x 1
y 7
z 2
dtype: int64](https://image.slidesharecdn.com/introductiontopythonlibraries-250411053822-50b609c7/75/Introduction-to-a-Python-Libraries-and-python-frameworks-6-2048.jpg)
![CREATION OF SERIES FROM NUMPY ARRAYS
We can create a series from a one-dimensional (1D)
NumPy array, as shown below:
import numpy as np # import NumPy with alias np
import pandas as pd
array1 = np.array([1,2,3,4])
series3 = pd.Series(array1)
print(series3)](https://image.slidesharecdn.com/introductiontopythonlibraries-250411053822-50b609c7/75/Introduction-to-a-Python-Libraries-and-python-frameworks-7-2048.jpg)
![POSITIONAL INDEX AND LABELLED INDEX
Positional index
seriesNum = pd.Series([10,20,30])
seriesNum[2]
O/P: 30
Labelled index
seriesMnths = pd.Series([2,3,4],index=["Feb","Mar","Apr"])
seriesMnths["Mar"]
O/P:3](https://image.slidesharecdn.com/introductiontopythonlibraries-250411053822-50b609c7/75/Introduction-to-a-Python-Libraries-and-python-frameworks-10-2048.jpg)
![SLICING
Slicing
Sometimes, we may need to extract a part of a series. We can define which
part of the series is to be sliced by specifying the start and end parameters
[start :end] with the series name.
When we use positional indices for slicing, the value at the end index
position is excluded, i.e., only (end -start) number of data values of the
series are extracted.
seriesCapCntry = pd.Series(['NewDelhi', 'WashingtonDC', 'London',
'Paris'], index=['India', 'USA', 'UK', 'France'])
seriesCapCntry[1:3] #excludes the value at index position 3
USA WashingtonDC
UK London
dtype: object](https://image.slidesharecdn.com/introductiontopythonlibraries-250411053822-50b609c7/75/Introduction-to-a-Python-Libraries-and-python-frameworks-11-2048.jpg)
![ If labelled indexes are used for slicing, then value at the end index
label is also included in the output, for example:
seriesCapCntry['USA' : 'France']
USA WashingtonDC
UK London
France Paris
dtype: object](https://image.slidesharecdn.com/introductiontopythonlibraries-250411053822-50b609c7/75/Introduction-to-a-Python-Libraries-and-python-frameworks-12-2048.jpg)
![ We can also get the series in reverse order, for
example:
seriesCapCntry[ : : -1]
France Paris
UK London
USA WashingtonDC
India NewDelhi
dtype: object](https://image.slidesharecdn.com/introductiontopythonlibraries-250411053822-50b609c7/75/Introduction-to-a-Python-Libraries-and-python-frameworks-13-2048.jpg)


![WHAT IS A SERIES?
A Pandas Series is like a column in a table.
It is a one-dimensional array holding data of any type.
import pandas as pd
a = [1,7,2]
myvar = pd.Series(a)
print(myvar)
O/P:
Labels
If nothing else is specified, the values are labeled with their index number. First value has index 0, second value has index 1 etc.
0 1
1 7
2 2
dtype: int64](https://crownmelresort.com/image.slidesharecdn.com/introductiontopythonlibraries-250411053822-50b609c7/75/Introduction-to-a-Python-Libraries-and-python-frameworks-5-2048.jpg)
![Create Labels
With the index argument, you can name your own labels.
Example
Create your own labels:
import pandas as pd
a = [1, 7, 2]
myvar = pd.Series(a, index = ["x", "y", "z"])
print(myvar)
O/P
x 1
y 7
z 2
dtype: int64](https://crownmelresort.com/image.slidesharecdn.com/introductiontopythonlibraries-250411053822-50b609c7/75/Introduction-to-a-Python-Libraries-and-python-frameworks-6-2048.jpg)
![CREATION OF SERIES FROM NUMPY ARRAYS
We can create a series from a one-dimensional (1D)
NumPy array, as shown below:
import numpy as np # import NumPy with alias np
import pandas as pd
array1 = np.array([1,2,3,4])
series3 = pd.Series(array1)
print(series3)](https://crownmelresort.com/image.slidesharecdn.com/introductiontopythonlibraries-250411053822-50b609c7/75/Introduction-to-a-Python-Libraries-and-python-frameworks-7-2048.jpg)


![POSITIONAL INDEX AND LABELLED INDEX
Positional index
seriesNum = pd.Series([10,20,30])
seriesNum[2]
O/P: 30
Labelled index
seriesMnths = pd.Series([2,3,4],index=["Feb","Mar","Apr"])
seriesMnths["Mar"]
O/P:3](https://crownmelresort.com/image.slidesharecdn.com/introductiontopythonlibraries-250411053822-50b609c7/75/Introduction-to-a-Python-Libraries-and-python-frameworks-10-2048.jpg)
![SLICING
Slicing
Sometimes, we may need to extract a part of a series. We can define which
part of the series is to be sliced by specifying the start and end parameters
[start :end] with the series name.
When we use positional indices for slicing, the value at the end index
position is excluded, i.e., only (end -start) number of data values of the
series are extracted.
seriesCapCntry = pd.Series(['NewDelhi', 'WashingtonDC', 'London',
'Paris'], index=['India', 'USA', 'UK', 'France'])
seriesCapCntry[1:3] #excludes the value at index position 3
USA WashingtonDC
UK London
dtype: object](https://crownmelresort.com/image.slidesharecdn.com/introductiontopythonlibraries-250411053822-50b609c7/75/Introduction-to-a-Python-Libraries-and-python-frameworks-11-2048.jpg)
![ If labelled indexes are used for slicing, then value at the end index
label is also included in the output, for example:
seriesCapCntry['USA' : 'France']
USA WashingtonDC
UK London
France Paris
dtype: object](https://crownmelresort.com/image.slidesharecdn.com/introductiontopythonlibraries-250411053822-50b609c7/75/Introduction-to-a-Python-Libraries-and-python-frameworks-12-2048.jpg)
![ We can also get the series in reverse order, for
example:
seriesCapCntry[ : : -1]
France Paris
UK London
USA WashingtonDC
India NewDelhi
dtype: object](https://crownmelresort.com/image.slidesharecdn.com/introductiontopythonlibraries-250411053822-50b609c7/75/Introduction-to-a-Python-Libraries-and-python-frameworks-13-2048.jpg)