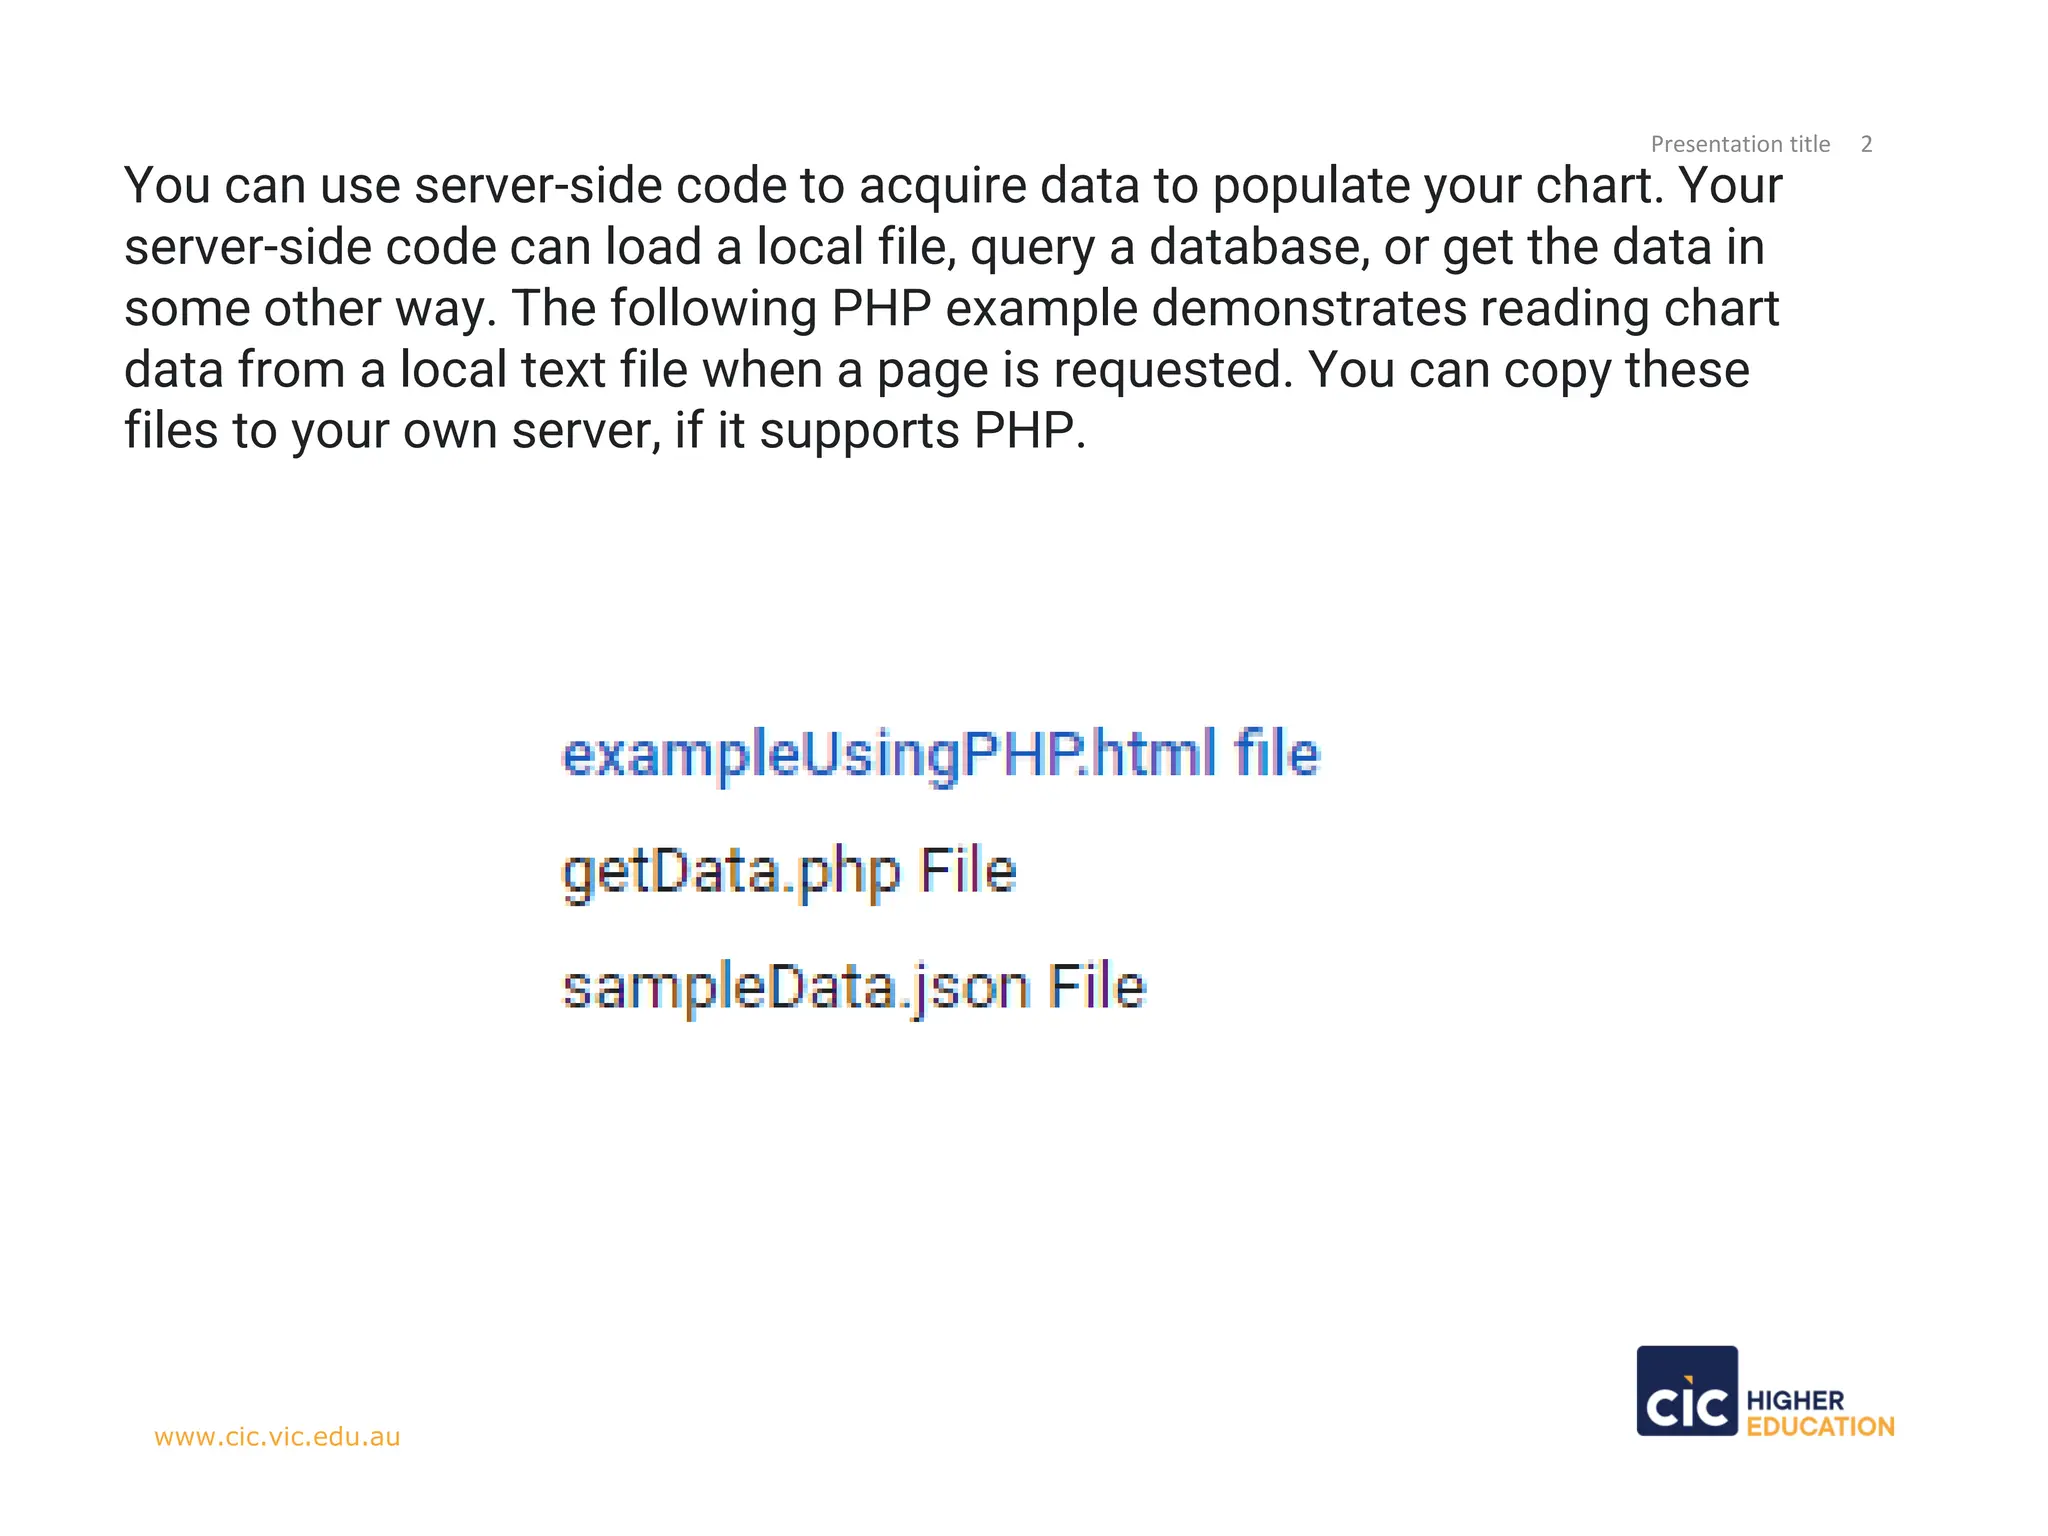
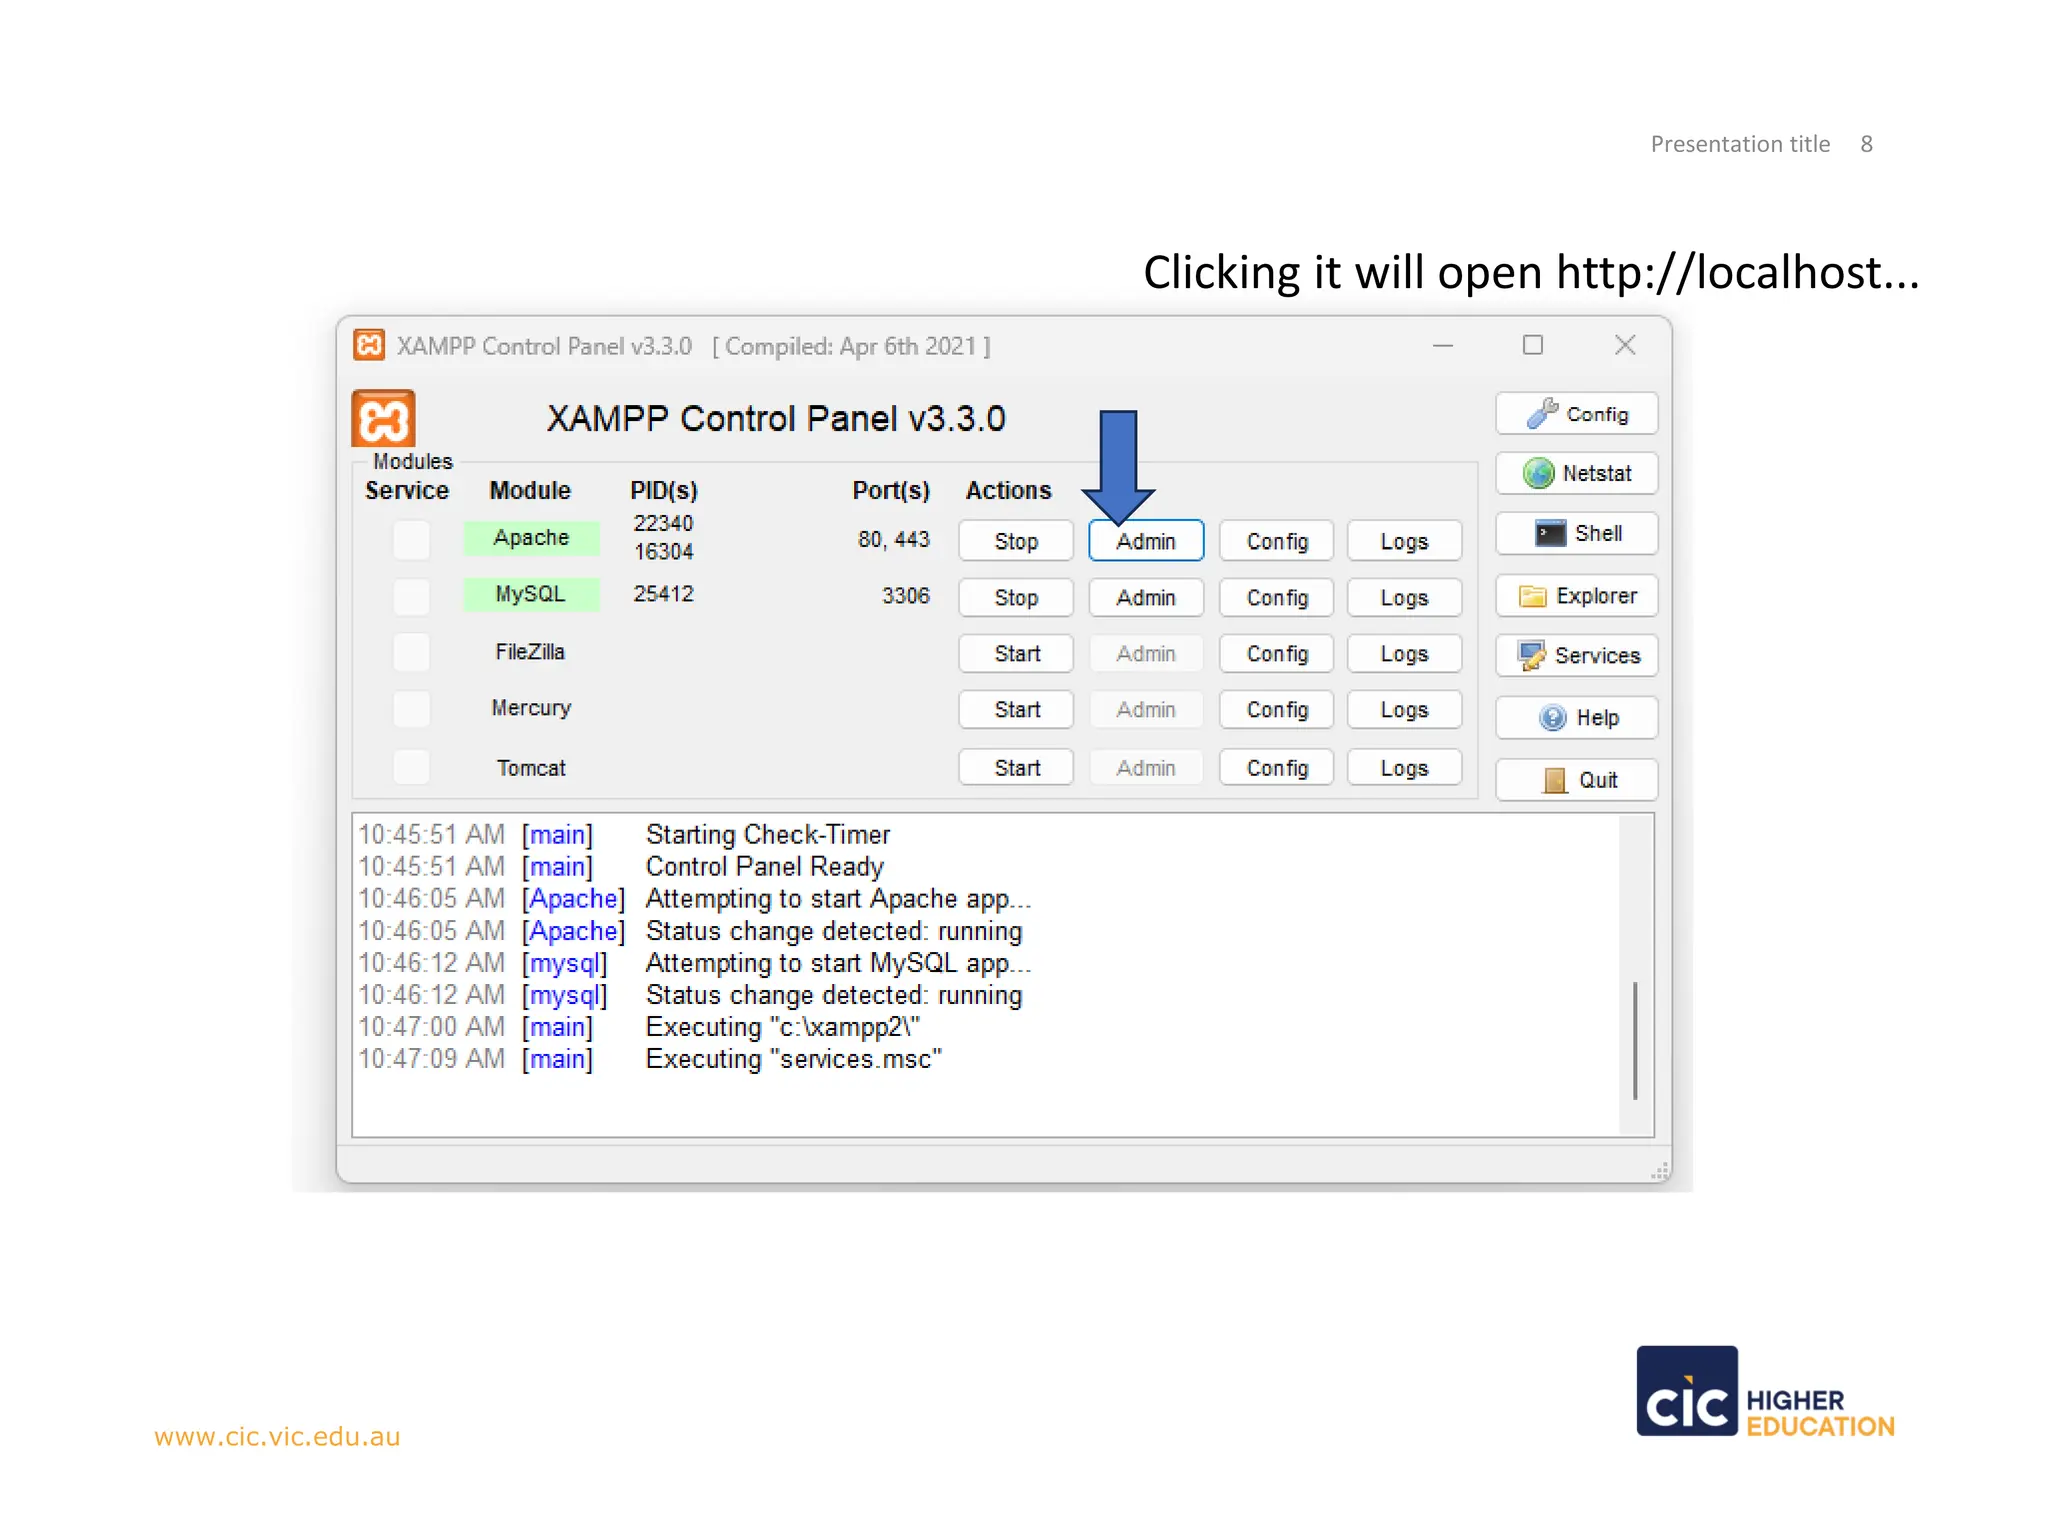
The document details how to use PHP and JSON to populate charts with data from a server-side source, such as a local file or database. It provides a code example that demonstrates reading JSON data and creating a pie chart using Google's visualization API. It includes links for further reference and additional resources.

![Presentation title 4
www.cic.vic.edu.au
<html>
<head>
<!--Load the AJAX API-->
<script type="text/javascript" src="https://www.gstatic.com/charts/loader.js"></script>
<script type="text/javascript" src="//ajax.googleapis.com/ajax/libs/jquery/1.10.2/jquery.min.js"></script>
<script type="text/javascript">
// Load the Visualization API and the piechart package.
google.charts.load('current', {'packages':['corechart']});
// Set a callback to run when the Google Visualization API is loaded.
google.charts.setOnLoadCallback(drawChart);
function drawChart() {
var jsonData = $.ajax({
url: "getData.php",
dataType: "json",
async: false
}).responseText;
// Create our data table out of JSON data loaded from server.
var data = new google.visualization.DataTable(jsonData);
// Instantiate and draw our chart, passing in some options.
var chart = new google.visualization.PieChart(document.getElementById('chart_div'));
chart.draw(data, {width: 400, height: 240});
}
</script>
</head>
<body>
<!--Div that will hold the pie chart-->
<div id="chart_div"></div>
</body>
</html>](https://image.slidesharecdn.com/week-6-lab-240713020630-9dec315d/75/Data-Visualization-and-Data-Modelling-week-6-LAB-pdf-4-2048.jpg)
![Presentation title 6
www.cic.vic.edu.au
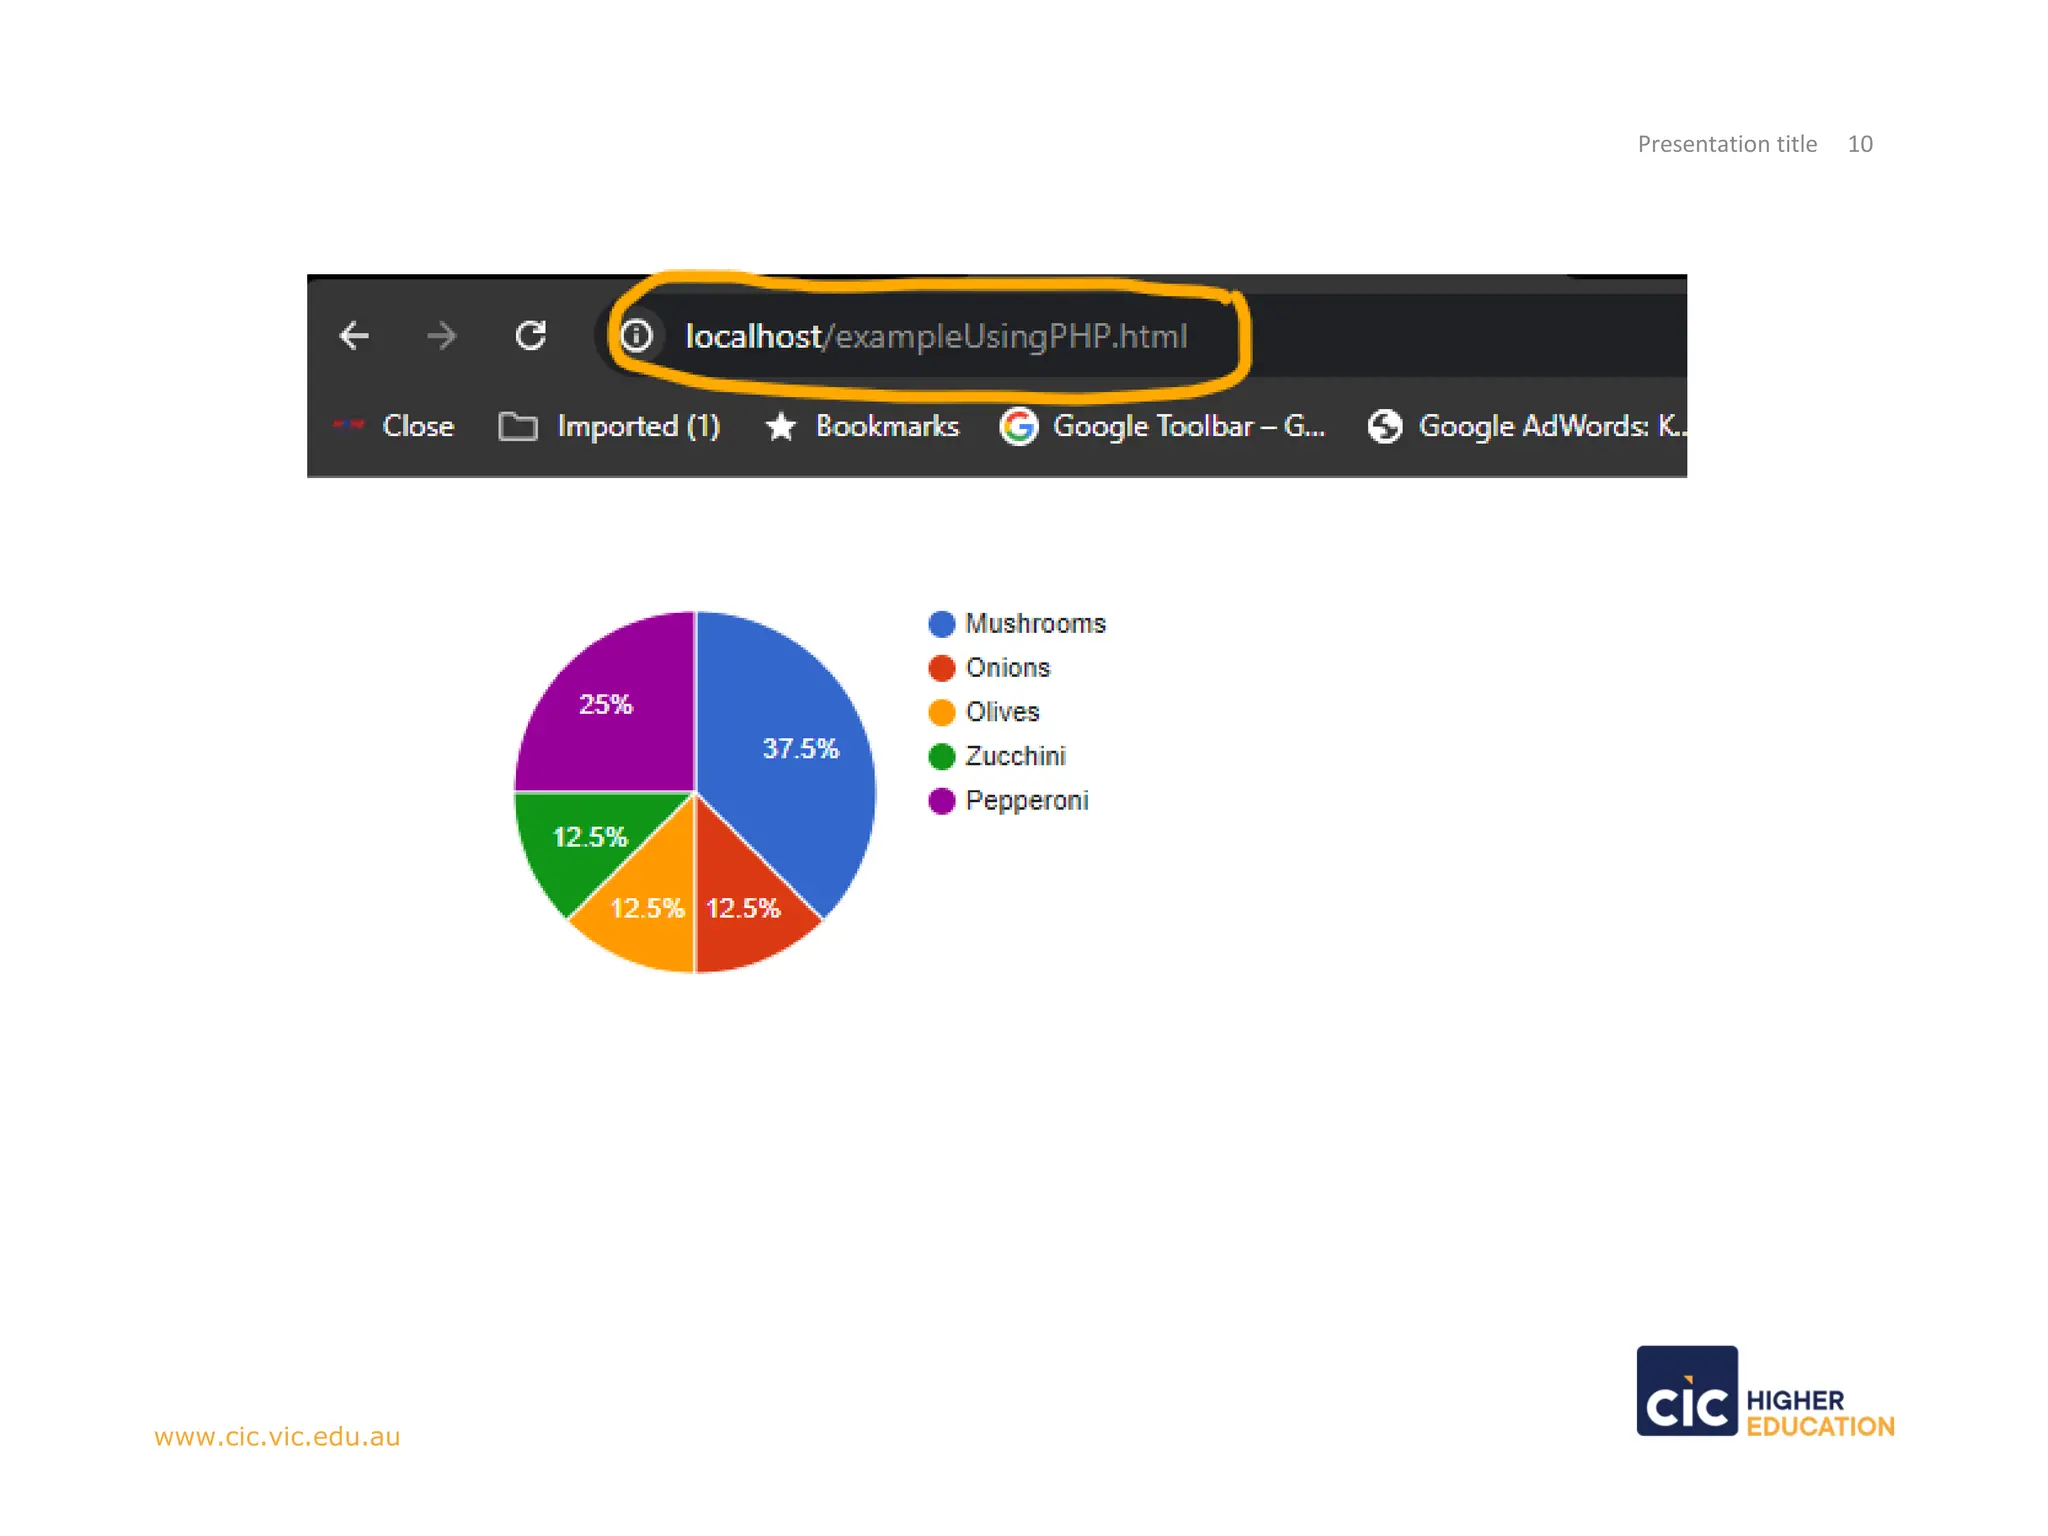
Link: https://developers.google.com/chart/interactive/docs/php_example#sampledata.json-file
{
"cols": [
{"id":"","label":"Topping","pattern":"","type":"string"},
{"id":"","label":"Slices","pattern":"","type":"number"}
],
"rows": [
{"c":[{"v":"Mushrooms","f":null},{"v":3,"f":null}]},
{"c":[{"v":"Onions","f":null},{"v":1,"f":null}]},
{"c":[{"v":"Olives","f":null},{"v":1,"f":null}]},
{"c":[{"v":"Zucchini","f":null},{"v":1,"f":null}]},
{"c":[{"v":"Pepperoni","f":null},{"v":2,"f":null}]}
]
}](https://image.slidesharecdn.com/week-6-lab-240713020630-9dec315d/75/Data-Visualization-and-Data-Modelling-week-6-LAB-pdf-6-2048.jpg)


![Presentation title 4
www.cic.vic.edu.au
<html>
<head>
<!--Load the AJAX API-->
<script type="text/javascript" src="https://www.gstatic.com/charts/loader.js"></script>
<script type="text/javascript" src="//ajax.googleapis.com/ajax/libs/jquery/1.10.2/jquery.min.js"></script>
<script type="text/javascript">
// Load the Visualization API and the piechart package.
google.charts.load('current', {'packages':['corechart']});
// Set a callback to run when the Google Visualization API is loaded.
google.charts.setOnLoadCallback(drawChart);
function drawChart() {
var jsonData = $.ajax({
url: "getData.php",
dataType: "json",
async: false
}).responseText;
// Create our data table out of JSON data loaded from server.
var data = new google.visualization.DataTable(jsonData);
// Instantiate and draw our chart, passing in some options.
var chart = new google.visualization.PieChart(document.getElementById('chart_div'));
chart.draw(data, {width: 400, height: 240});
}
</script>
</head>
<body>
<!--Div that will hold the pie chart-->
<div id="chart_div"></div>
</body>
</html>](https://crownmelresort.com/image.slidesharecdn.com/week-6-lab-240713020630-9dec315d/75/Data-Visualization-and-Data-Modelling-week-6-LAB-pdf-4-2048.jpg)

![Presentation title 6
www.cic.vic.edu.au
Link: https://developers.google.com/chart/interactive/docs/php_example#sampledata.json-file
{
"cols": [
{"id":"","label":"Topping","pattern":"","type":"string"},
{"id":"","label":"Slices","pattern":"","type":"number"}
],
"rows": [
{"c":[{"v":"Mushrooms","f":null},{"v":3,"f":null}]},
{"c":[{"v":"Onions","f":null},{"v":1,"f":null}]},
{"c":[{"v":"Olives","f":null},{"v":1,"f":null}]},
{"c":[{"v":"Zucchini","f":null},{"v":1,"f":null}]},
{"c":[{"v":"Pepperoni","f":null},{"v":2,"f":null}]}
]
}](https://crownmelresort.com/image.slidesharecdn.com/week-6-lab-240713020630-9dec315d/75/Data-Visualization-and-Data-Modelling-week-6-LAB-pdf-6-2048.jpg)


![SHS_Core_CAE_Q3_LE1 FOR THIRD [FINAL].pdf](https://cdn.slidesharecdn.com/ss_thumbnails/shscorecaeq3le1final-251116055110-e3081055-thumbnail.jpg?width=640&height=640&fit=bounds)

