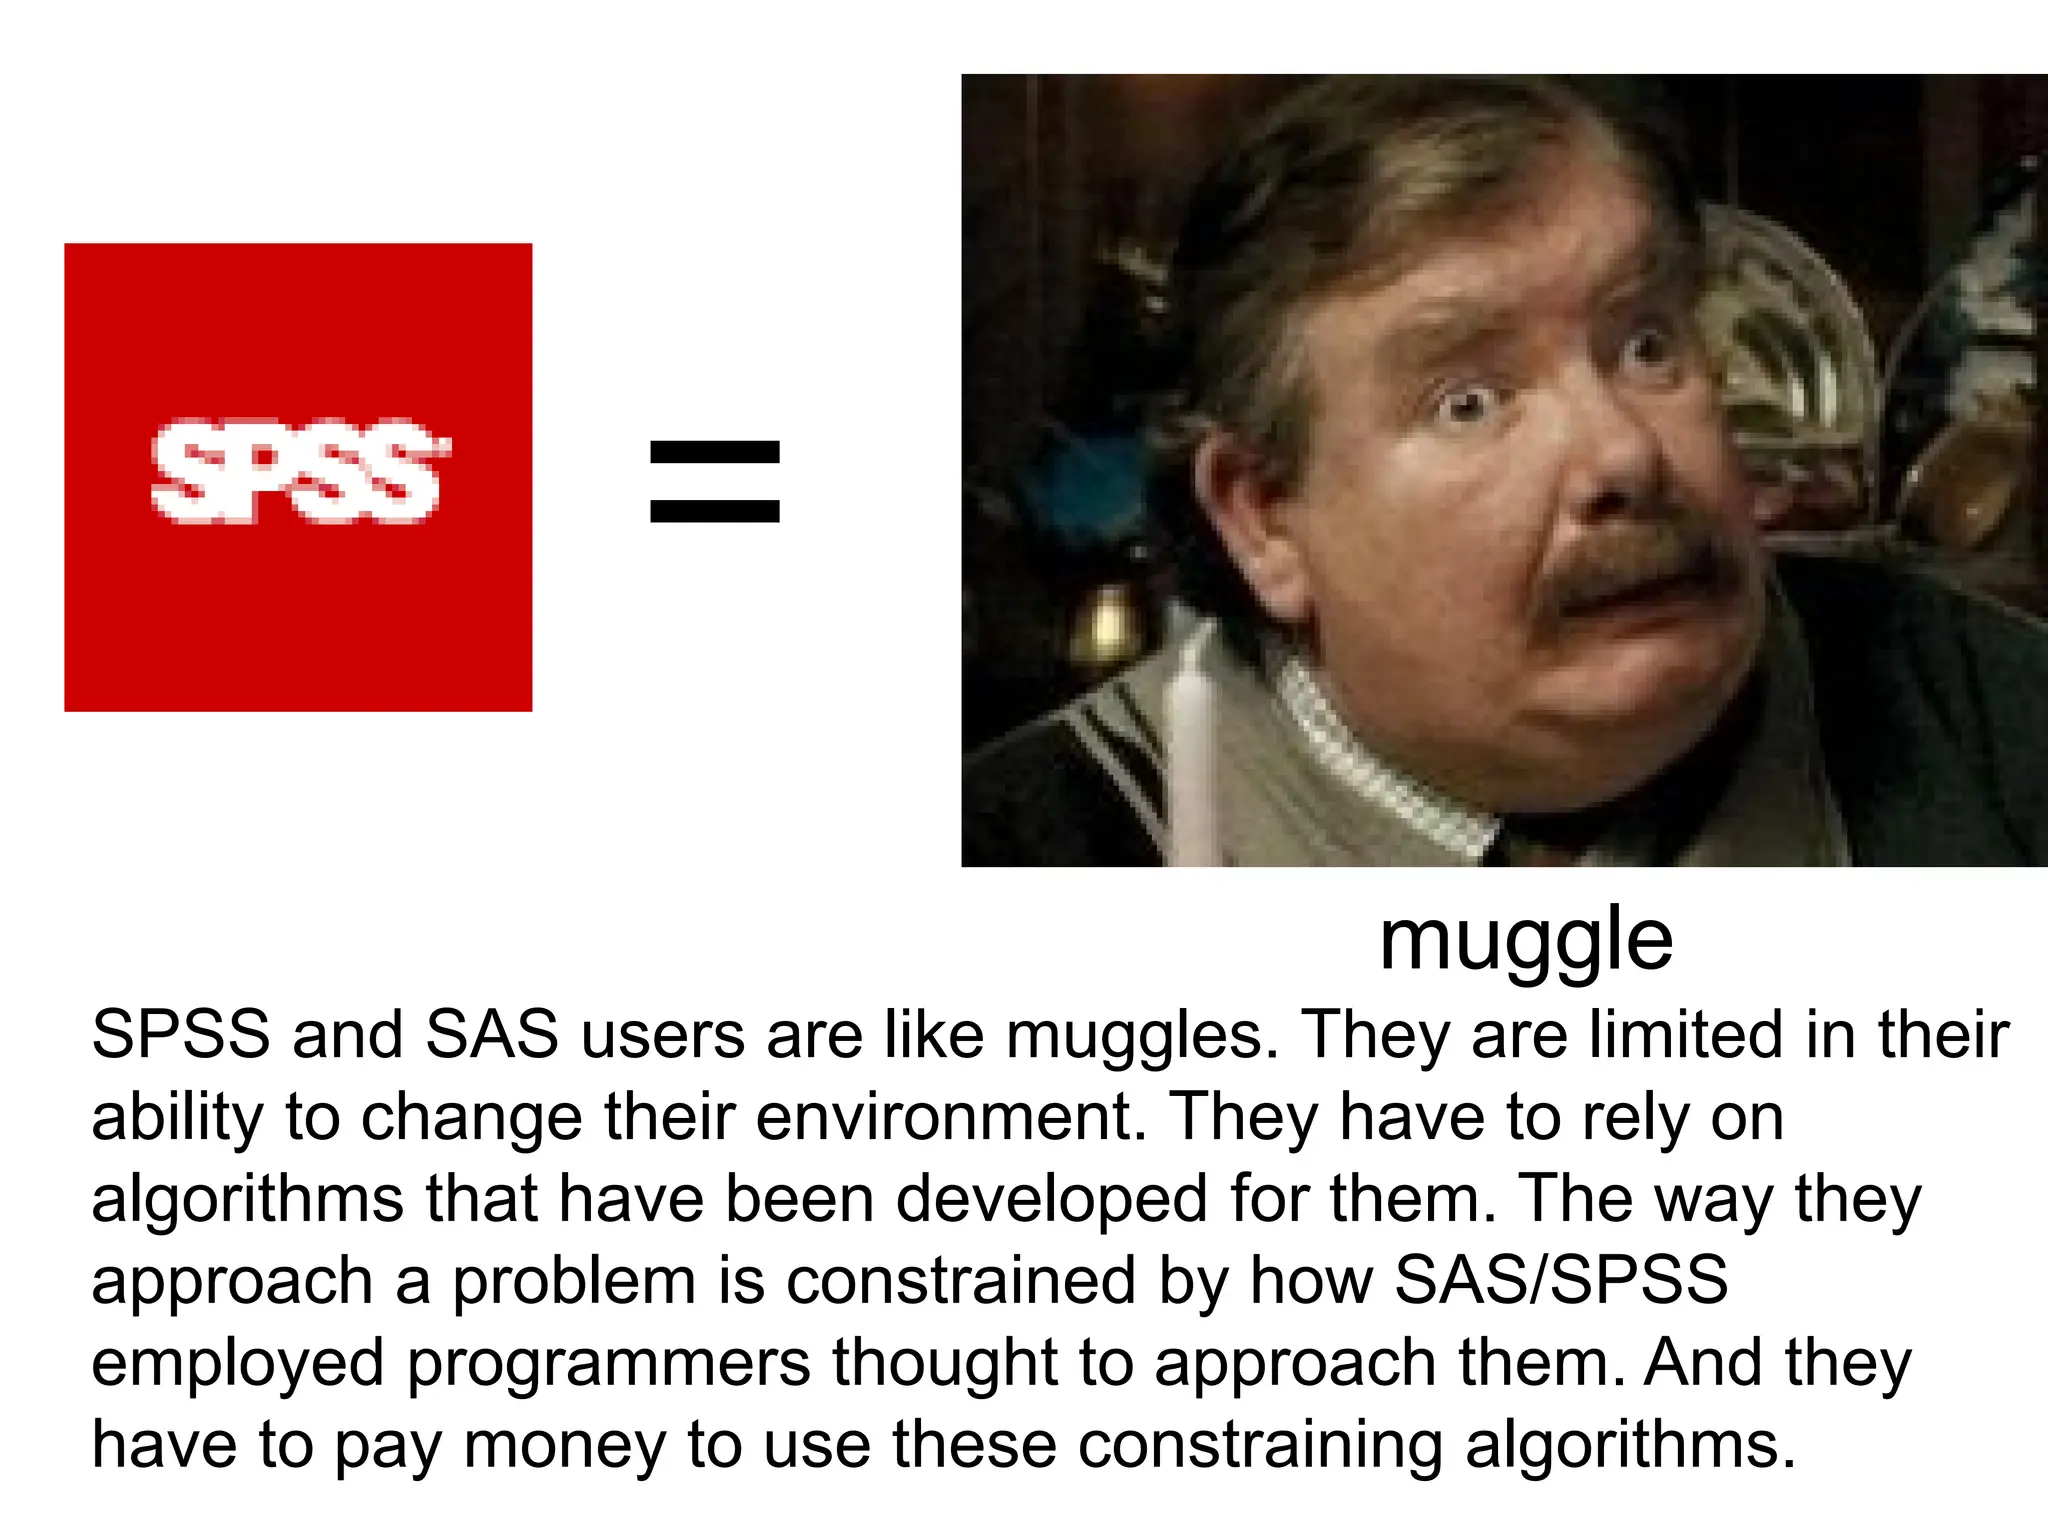
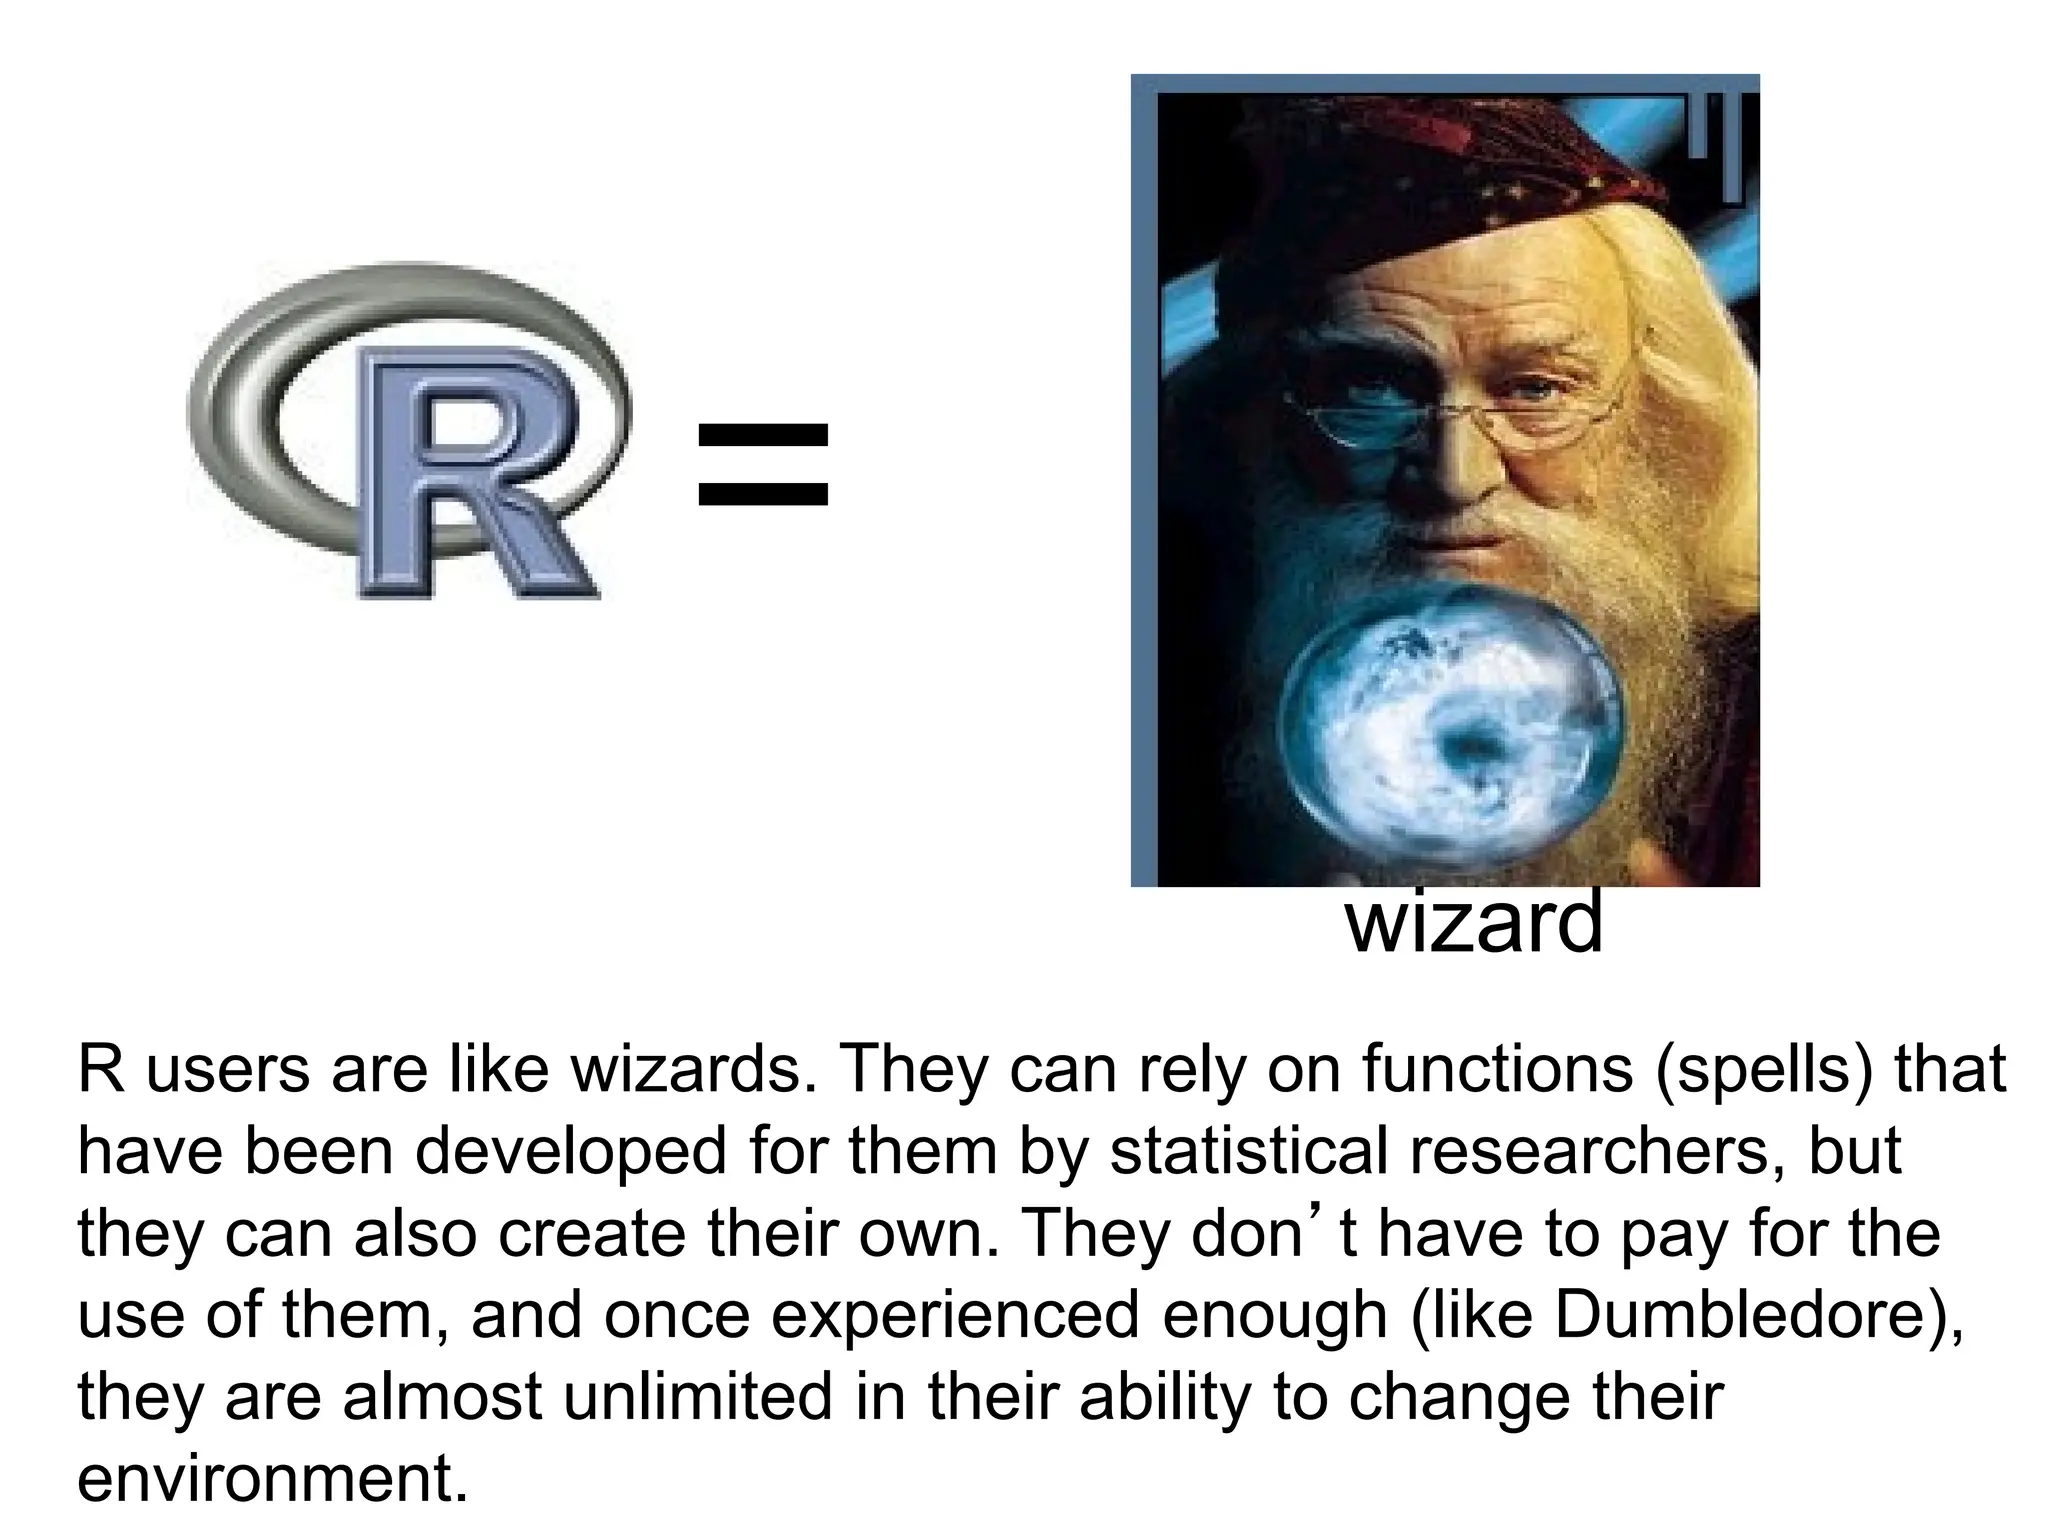
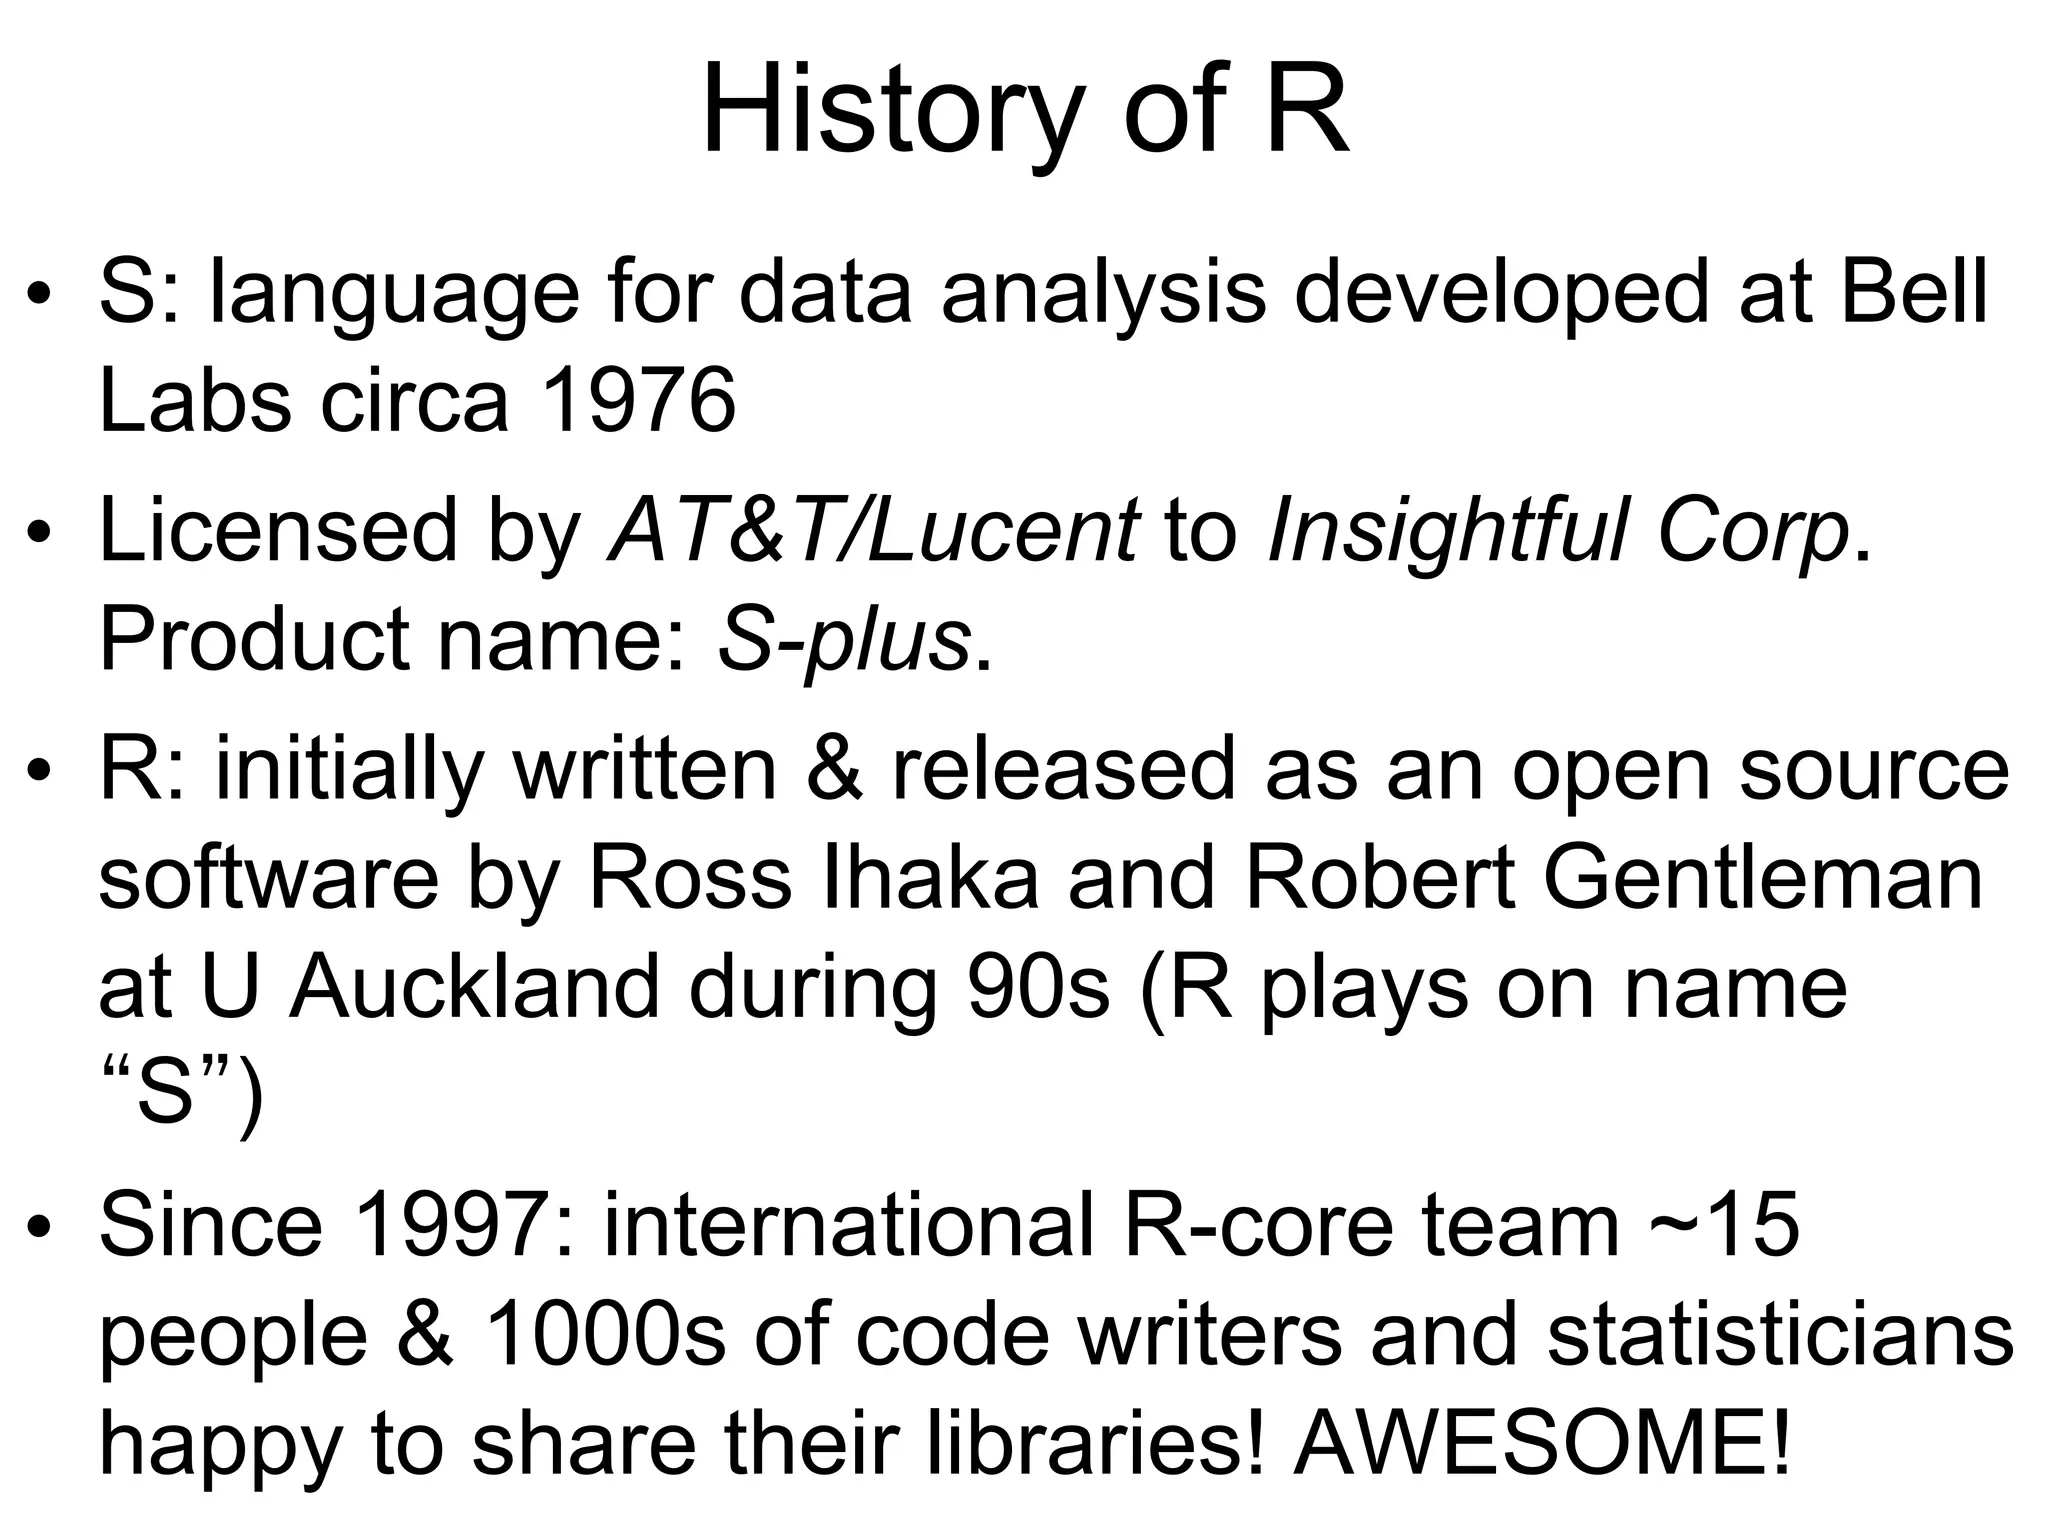
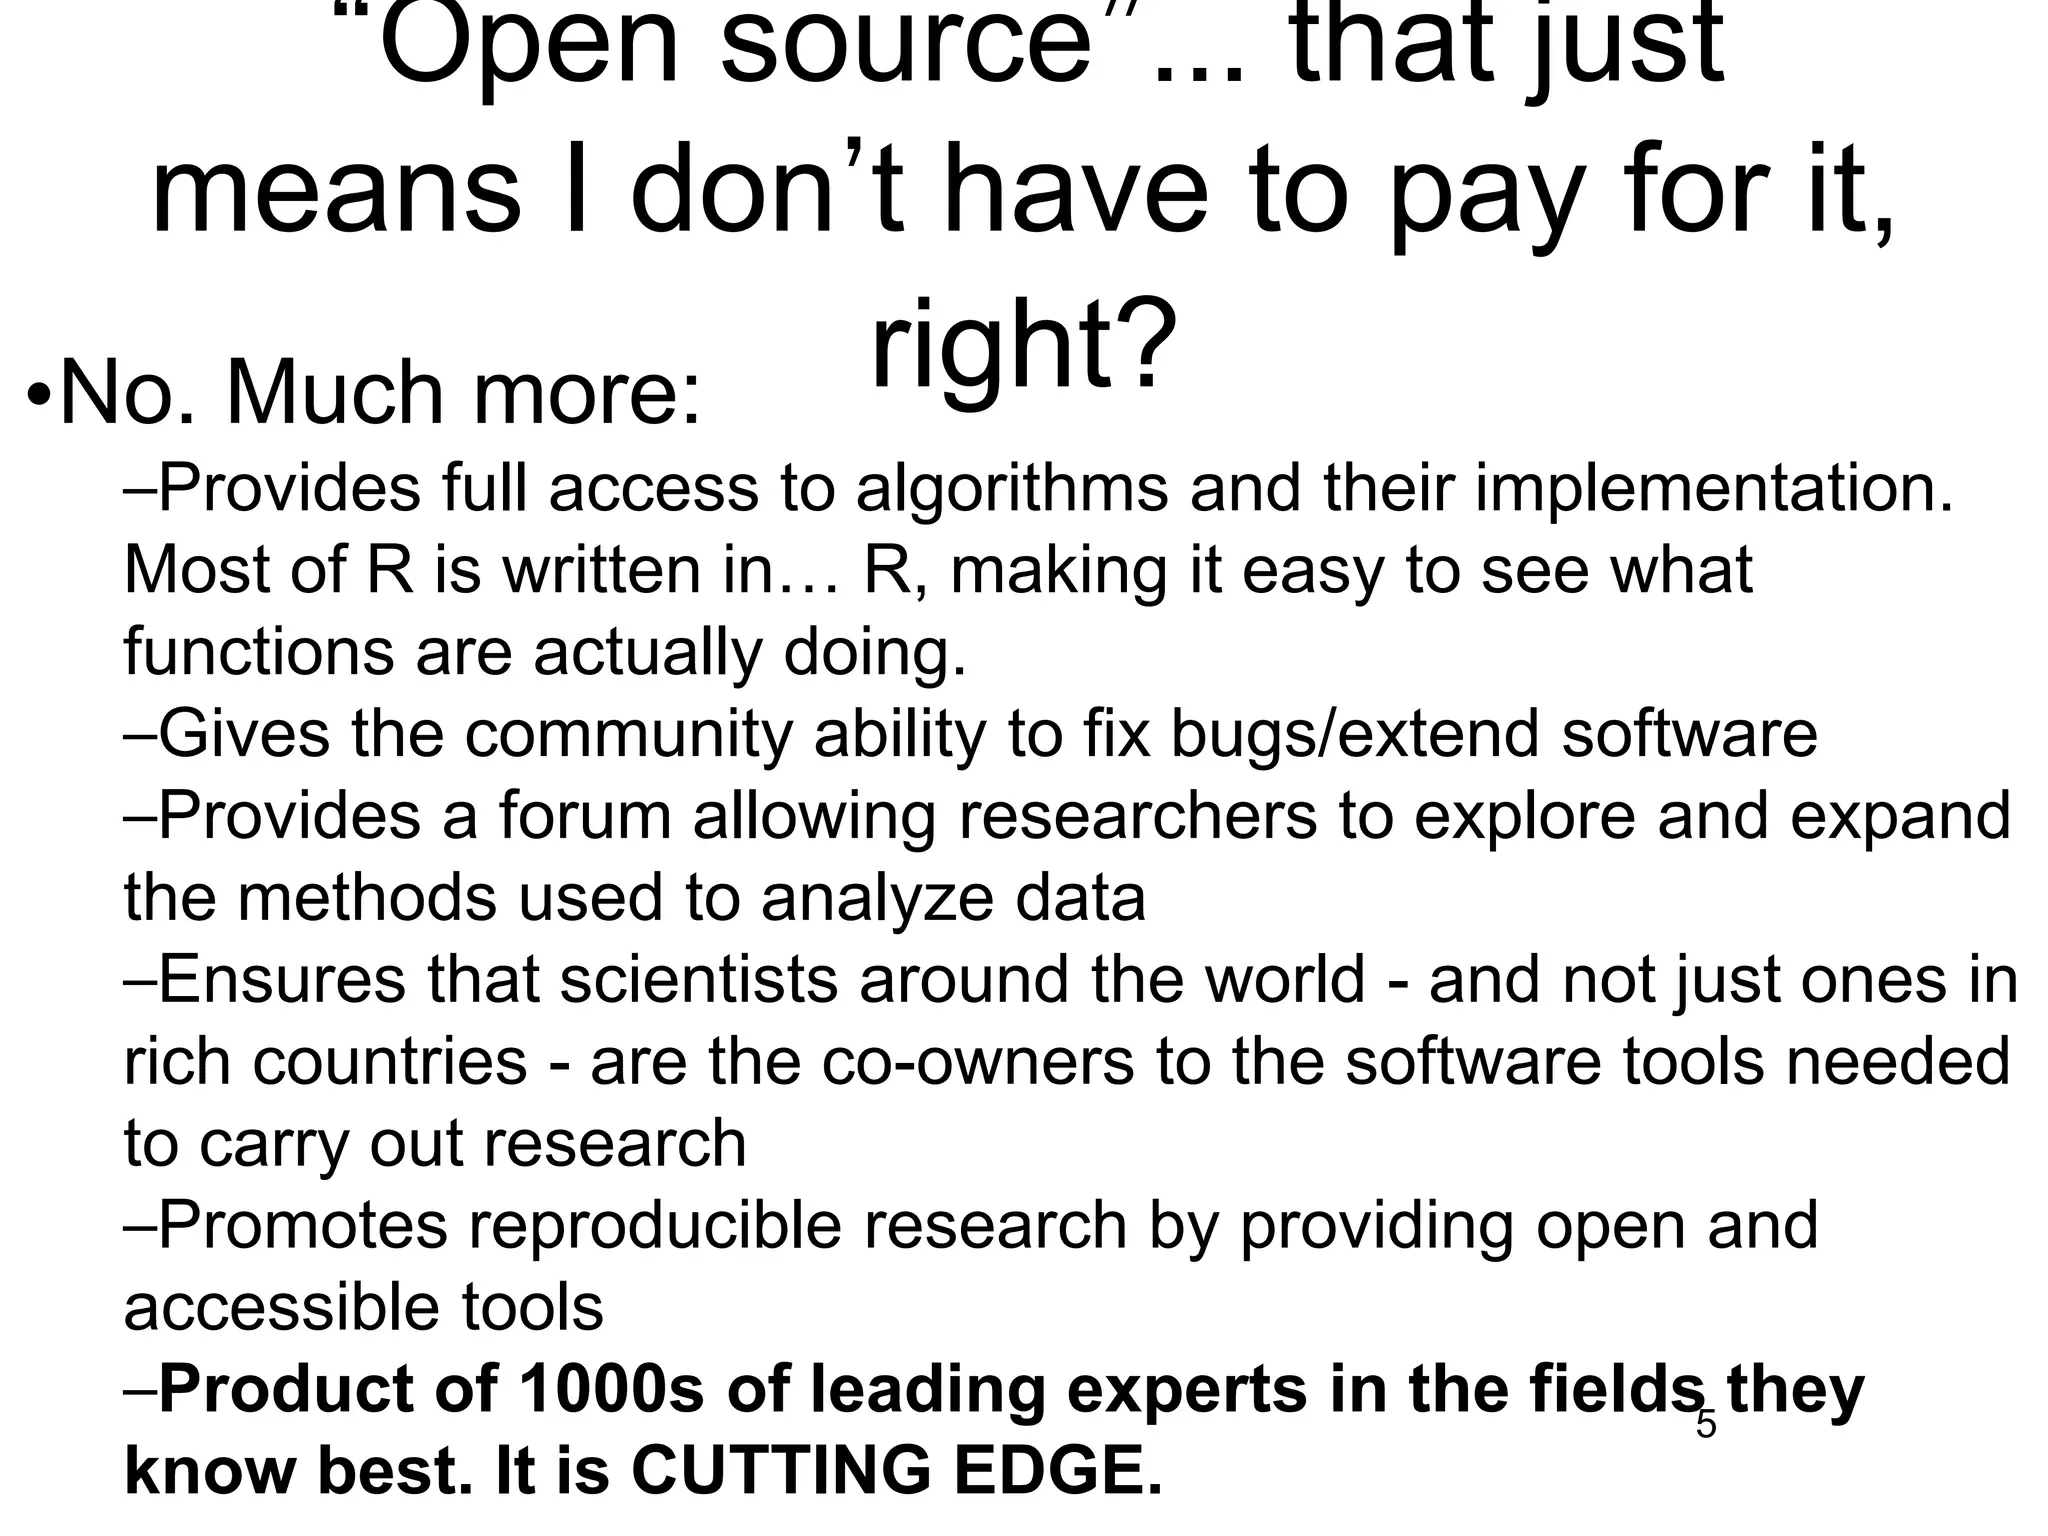
The document is an introduction to the R programming language, highlighting its advantages over proprietary software like SPSS and SAS by allowing users more flexibility and access to advanced statistical methods without cost. R's open-source nature enables a vibrant community of researchers to share and develop a vast array of packages, promoting reproducible research. Despite its steep learning curve and some usability challenges, R is regarded as a powerful tool for data analysis and graphical representation.
![R Objects
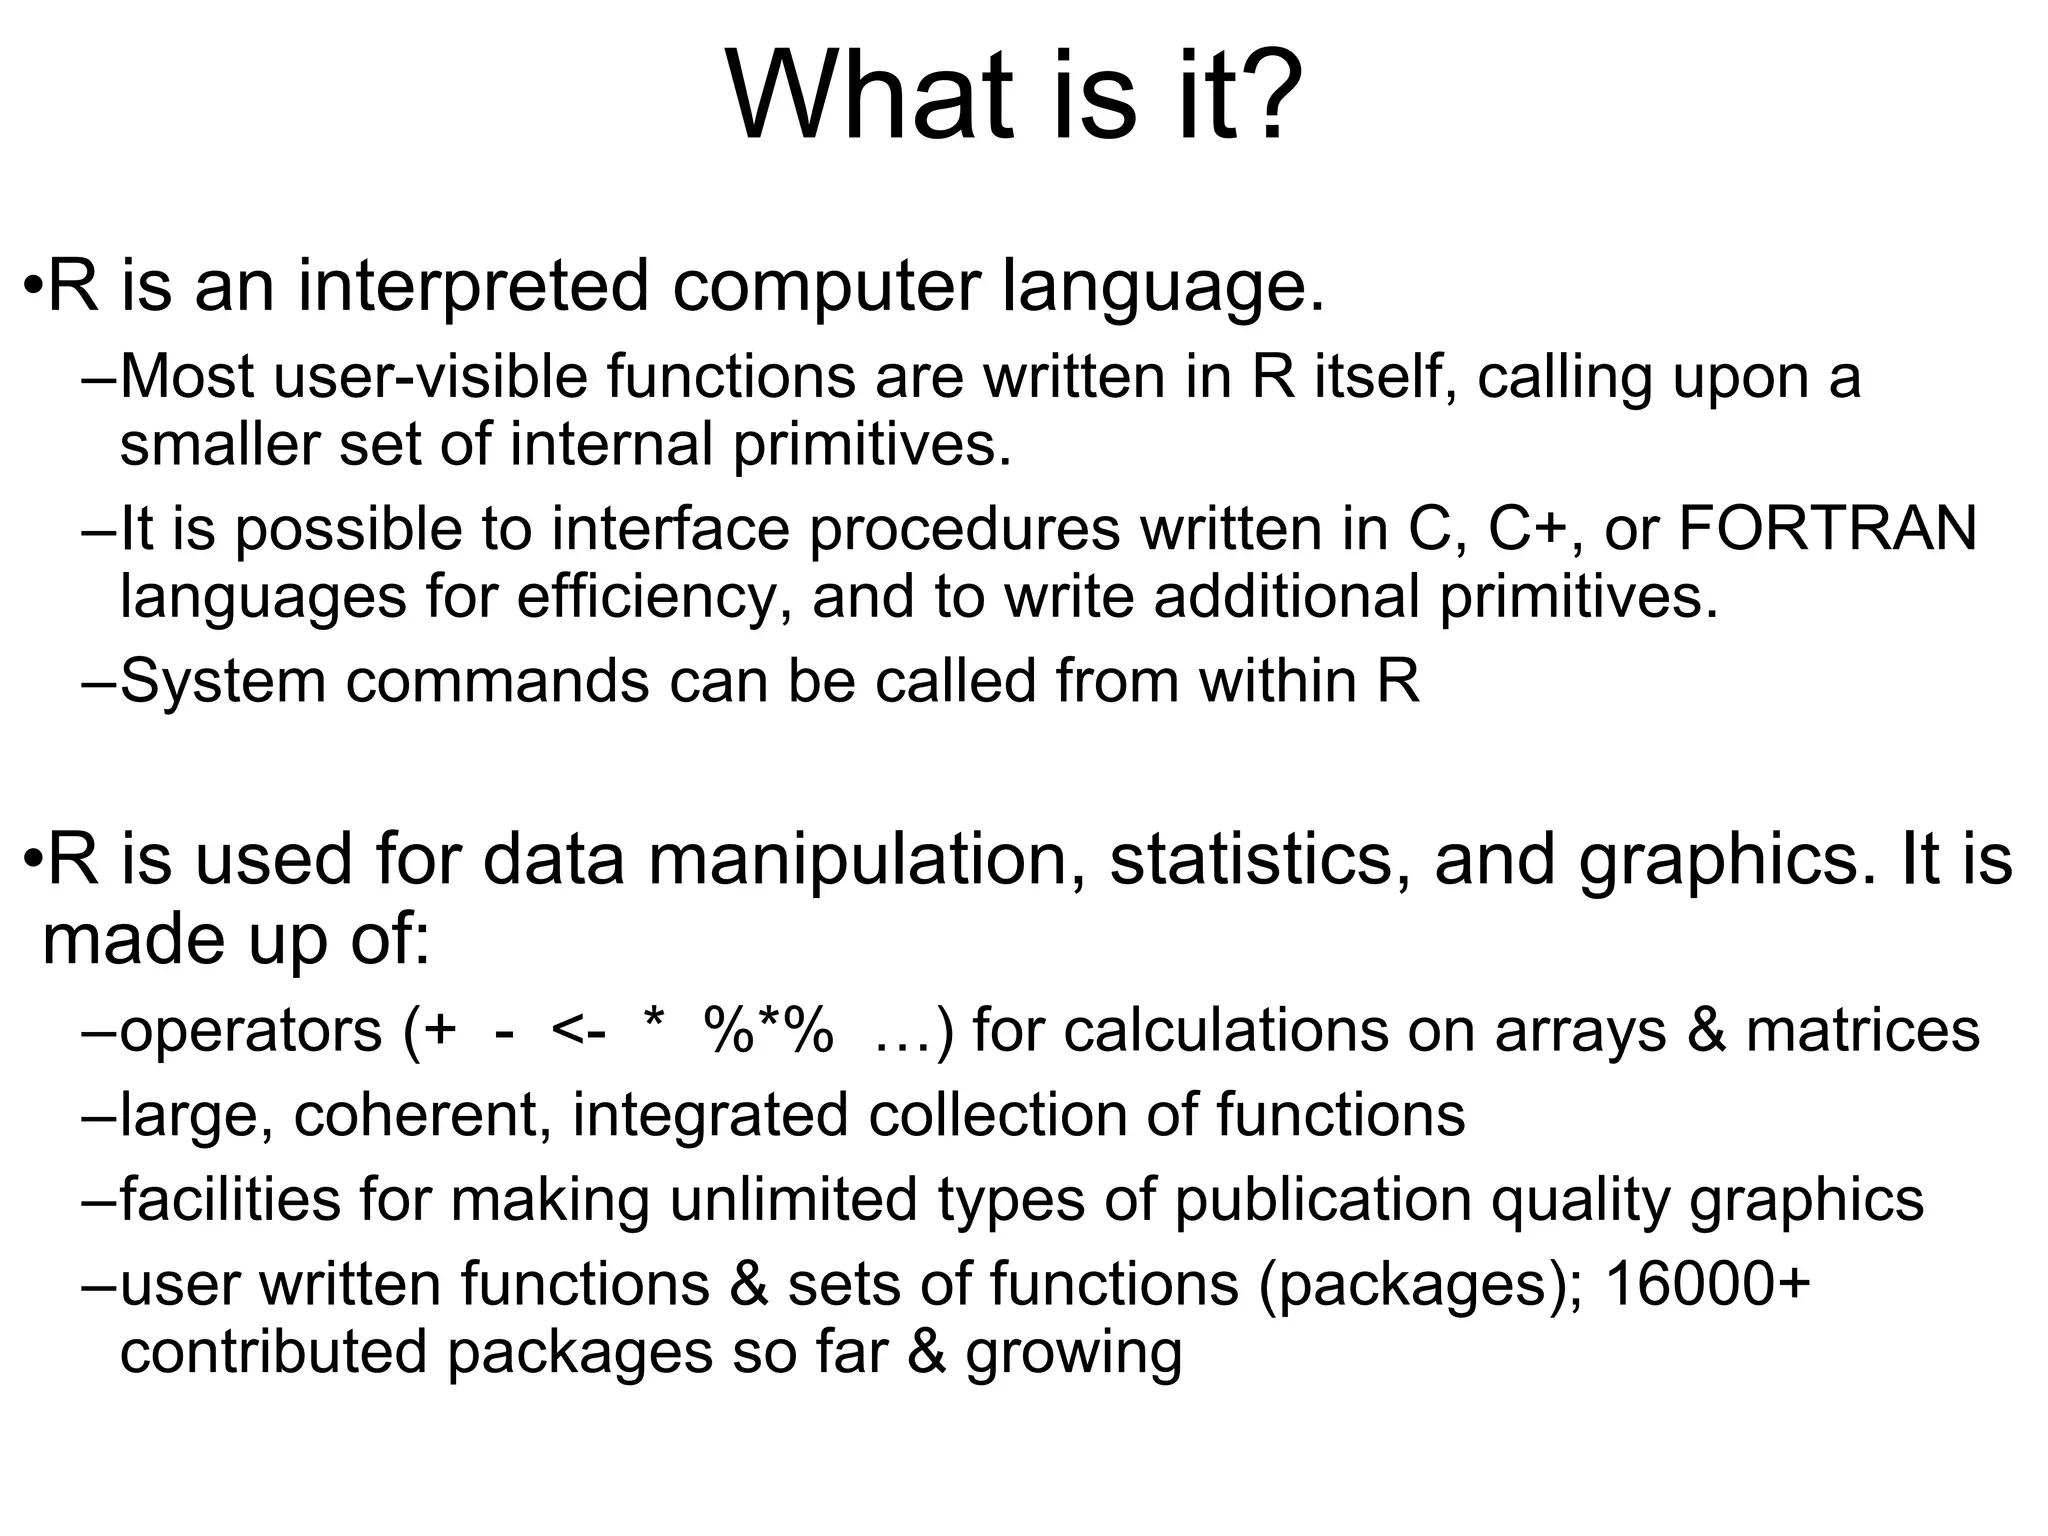
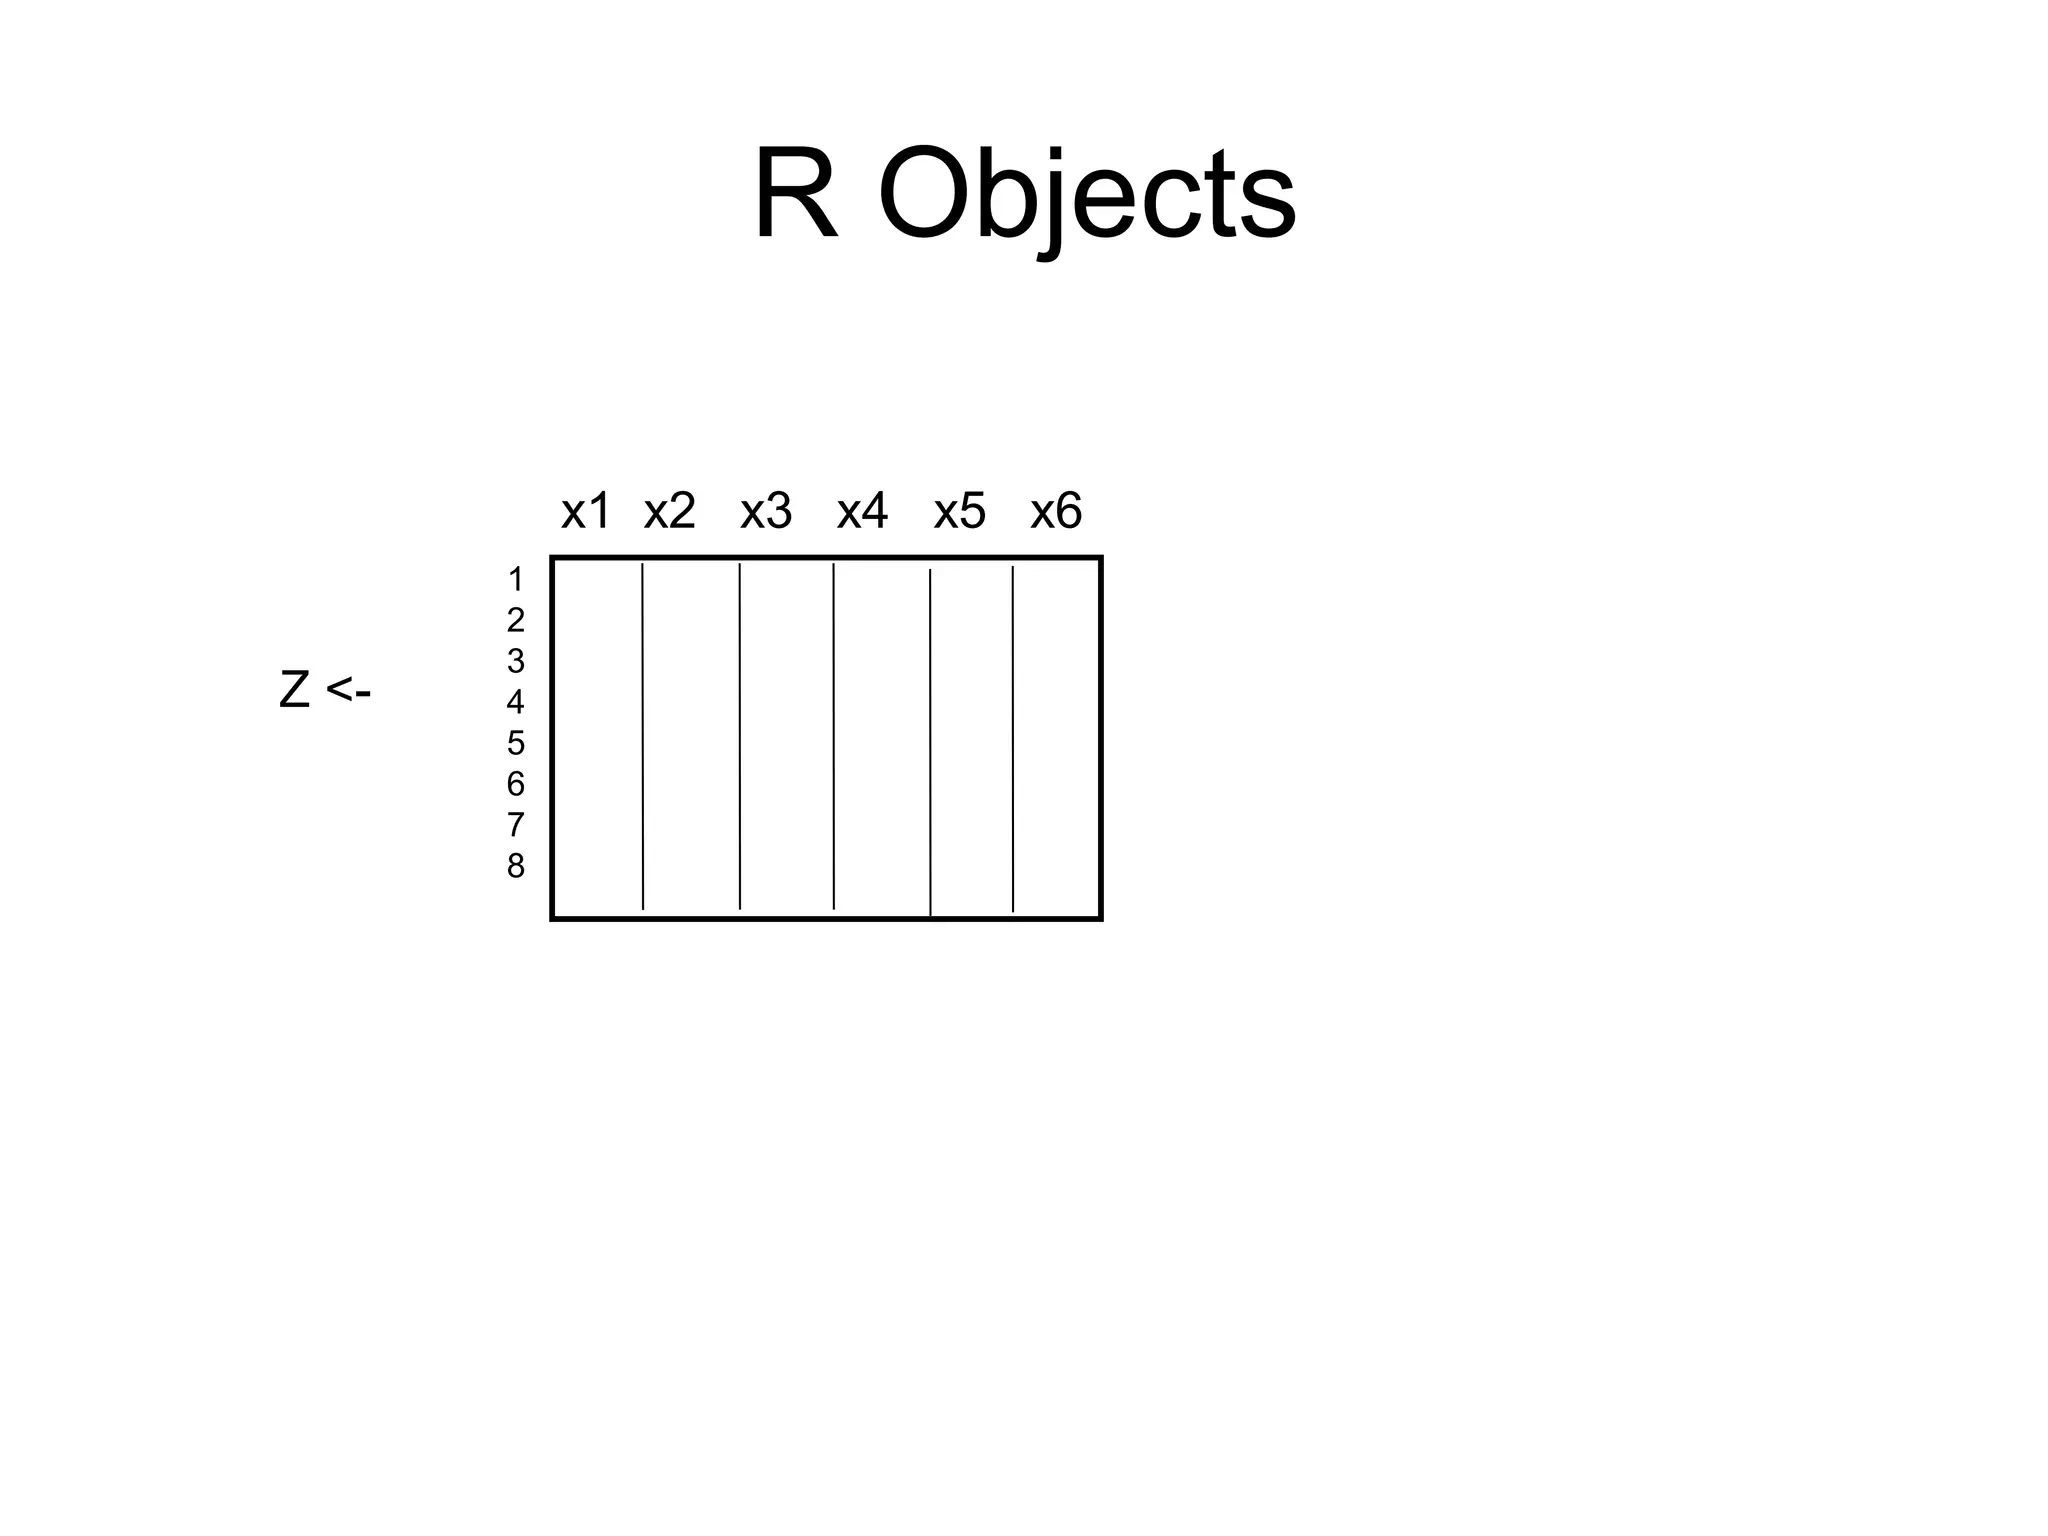
• Almost all things in R – functions, datasets, results,
etc. – are OBJECTS.
– (graphics are written out and are not stored as objects)
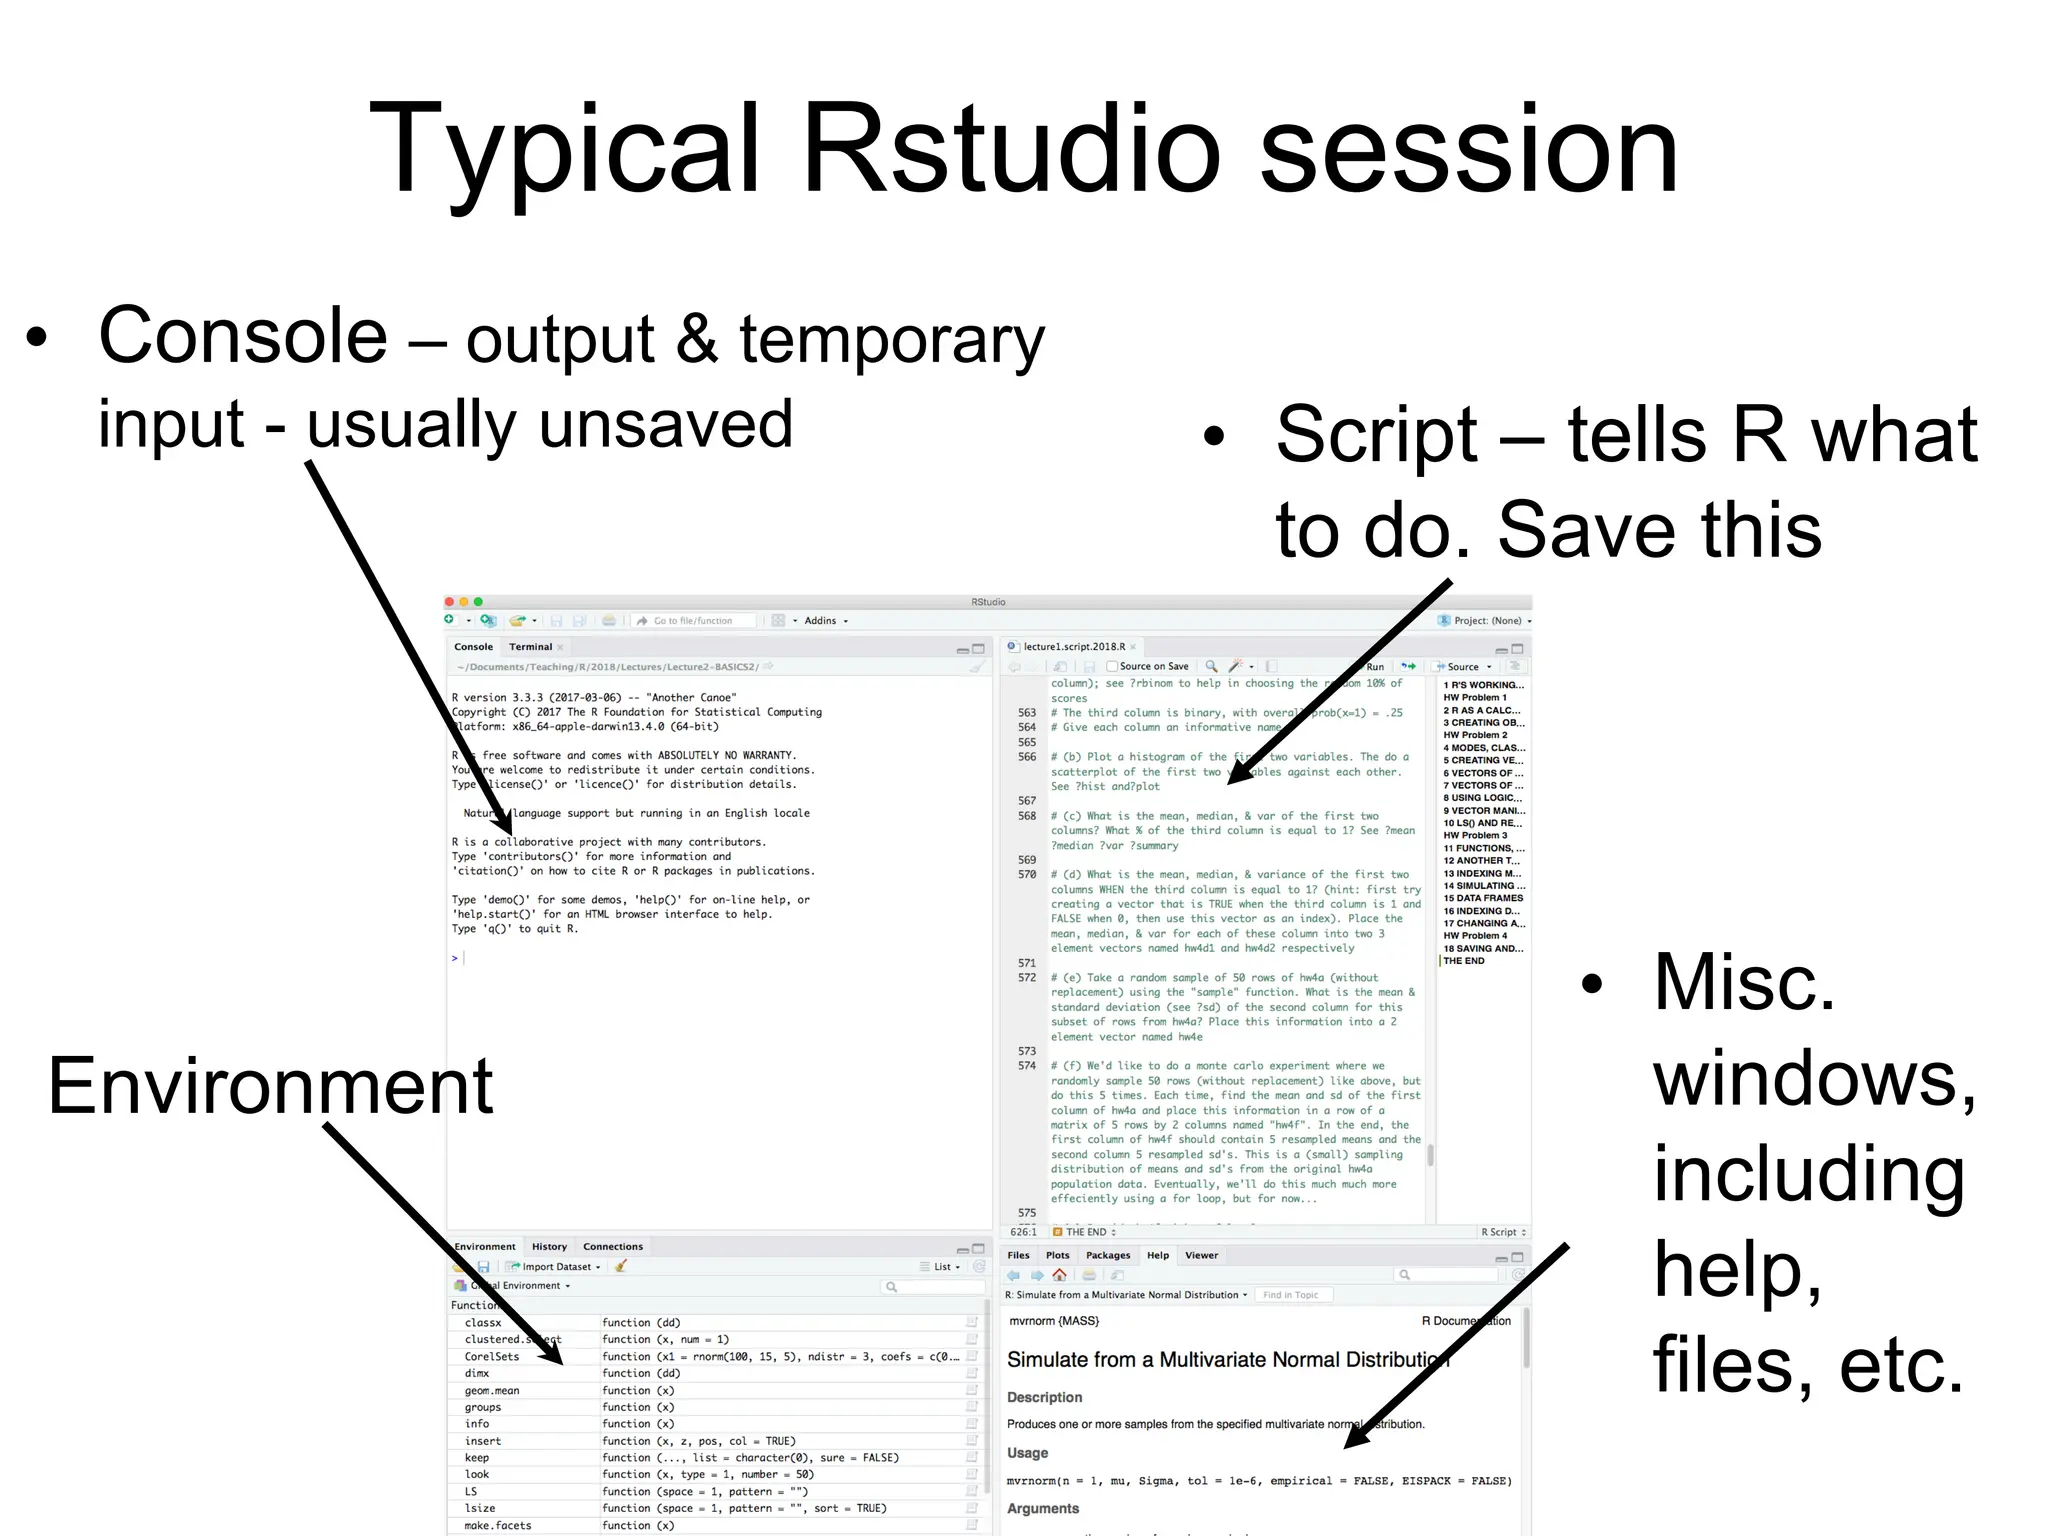
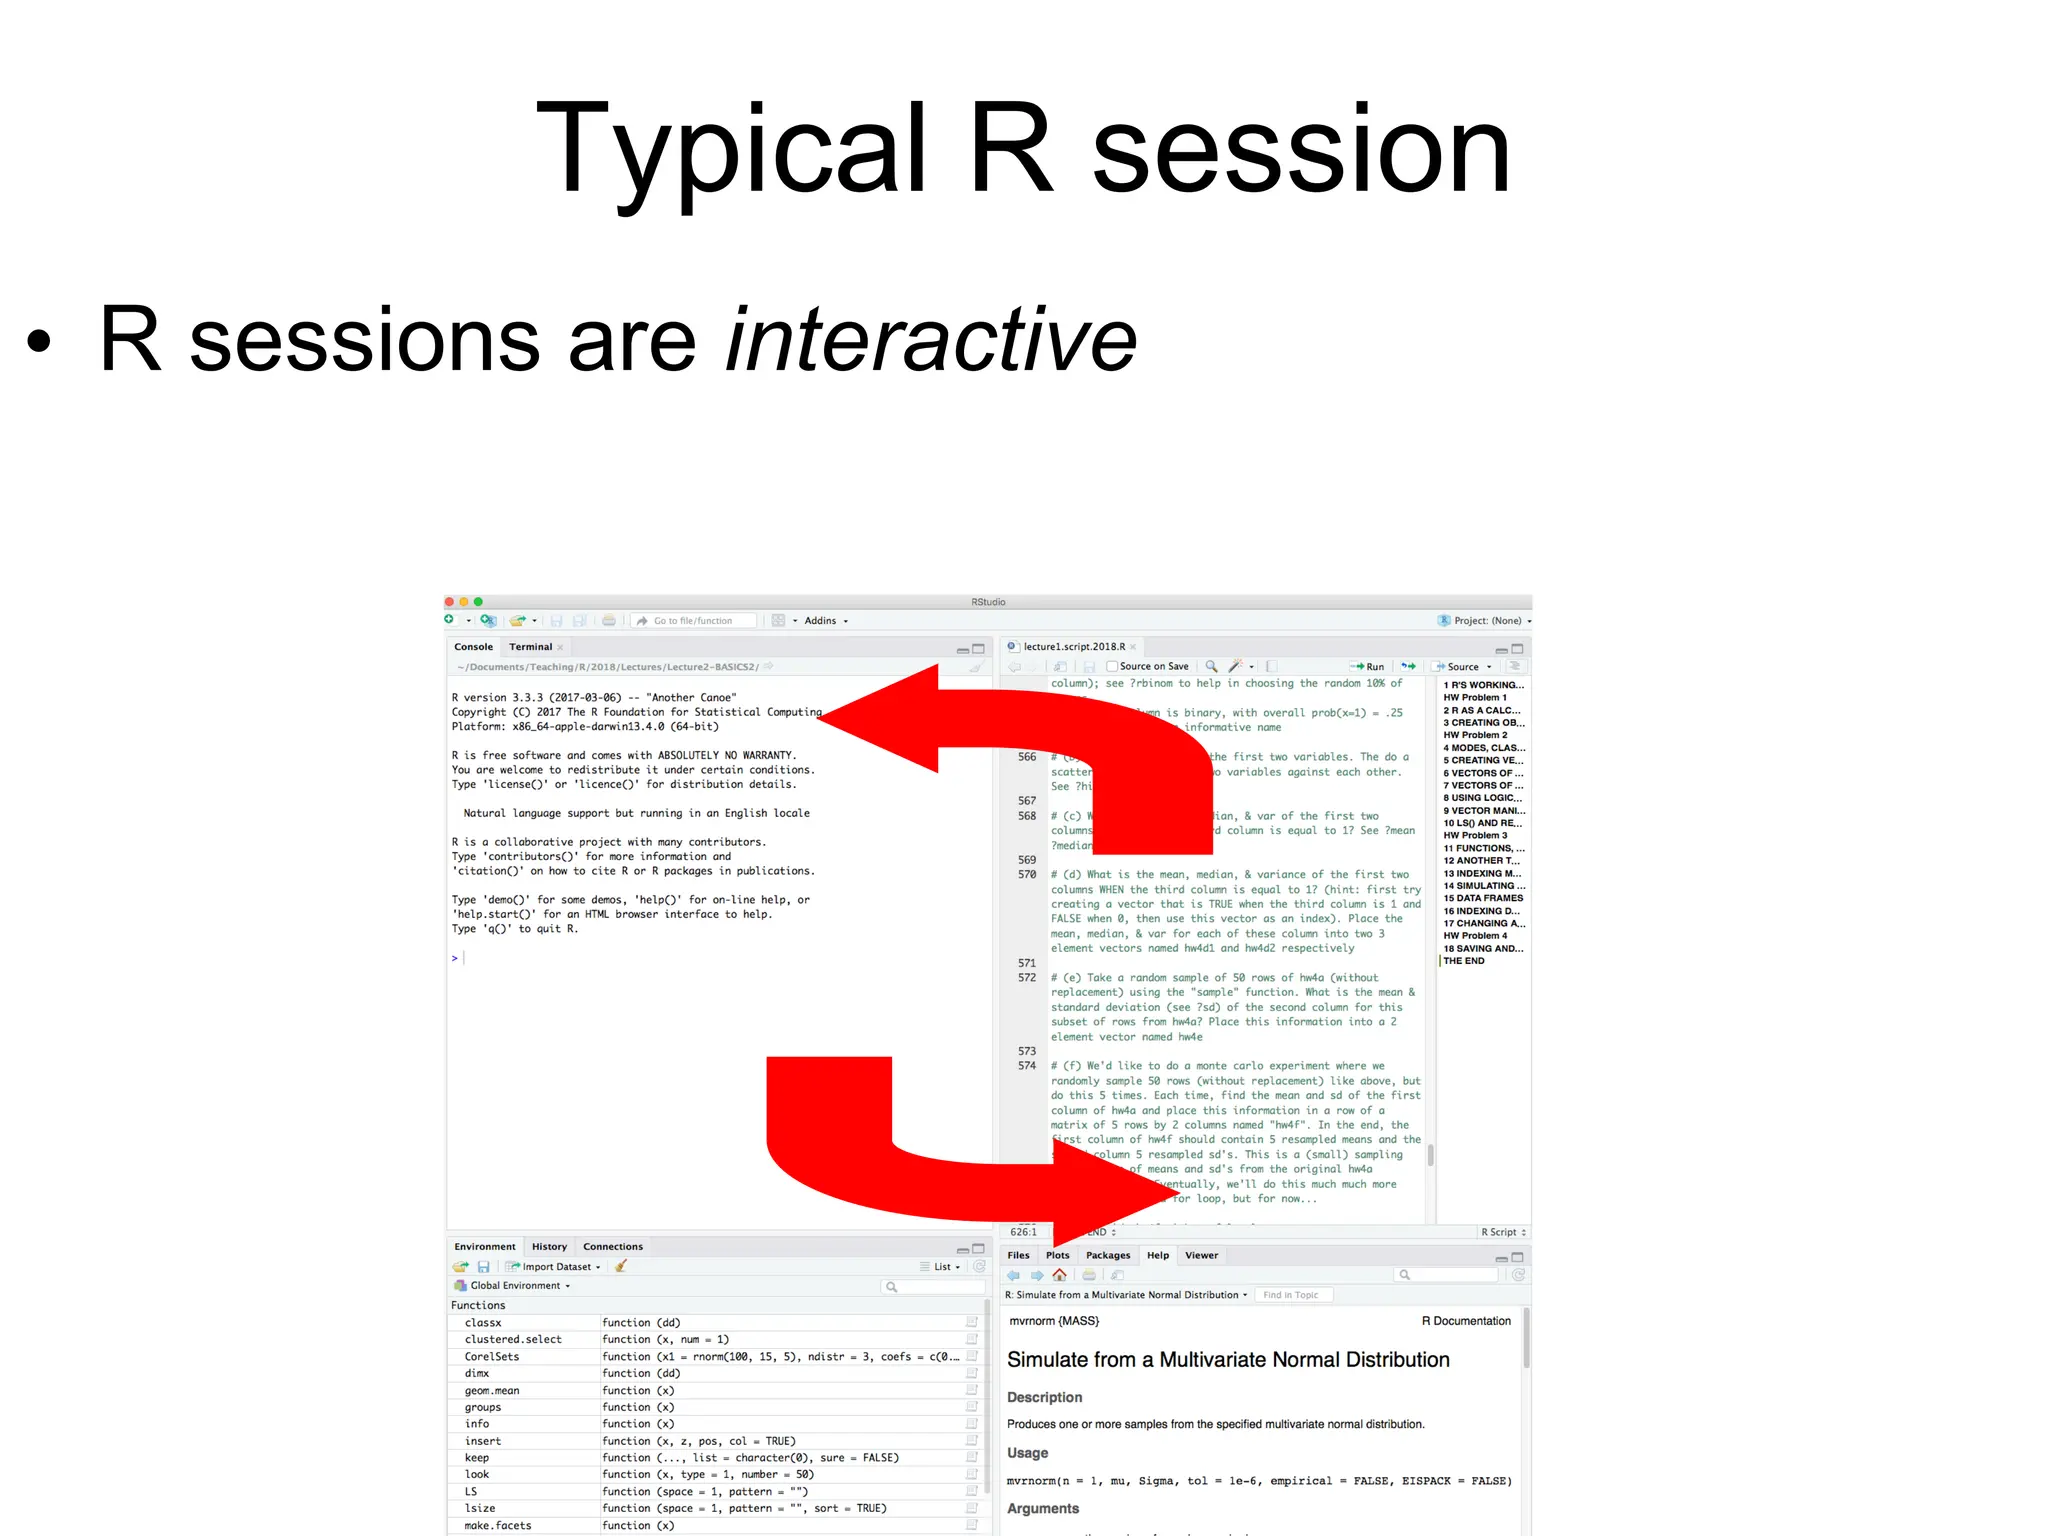
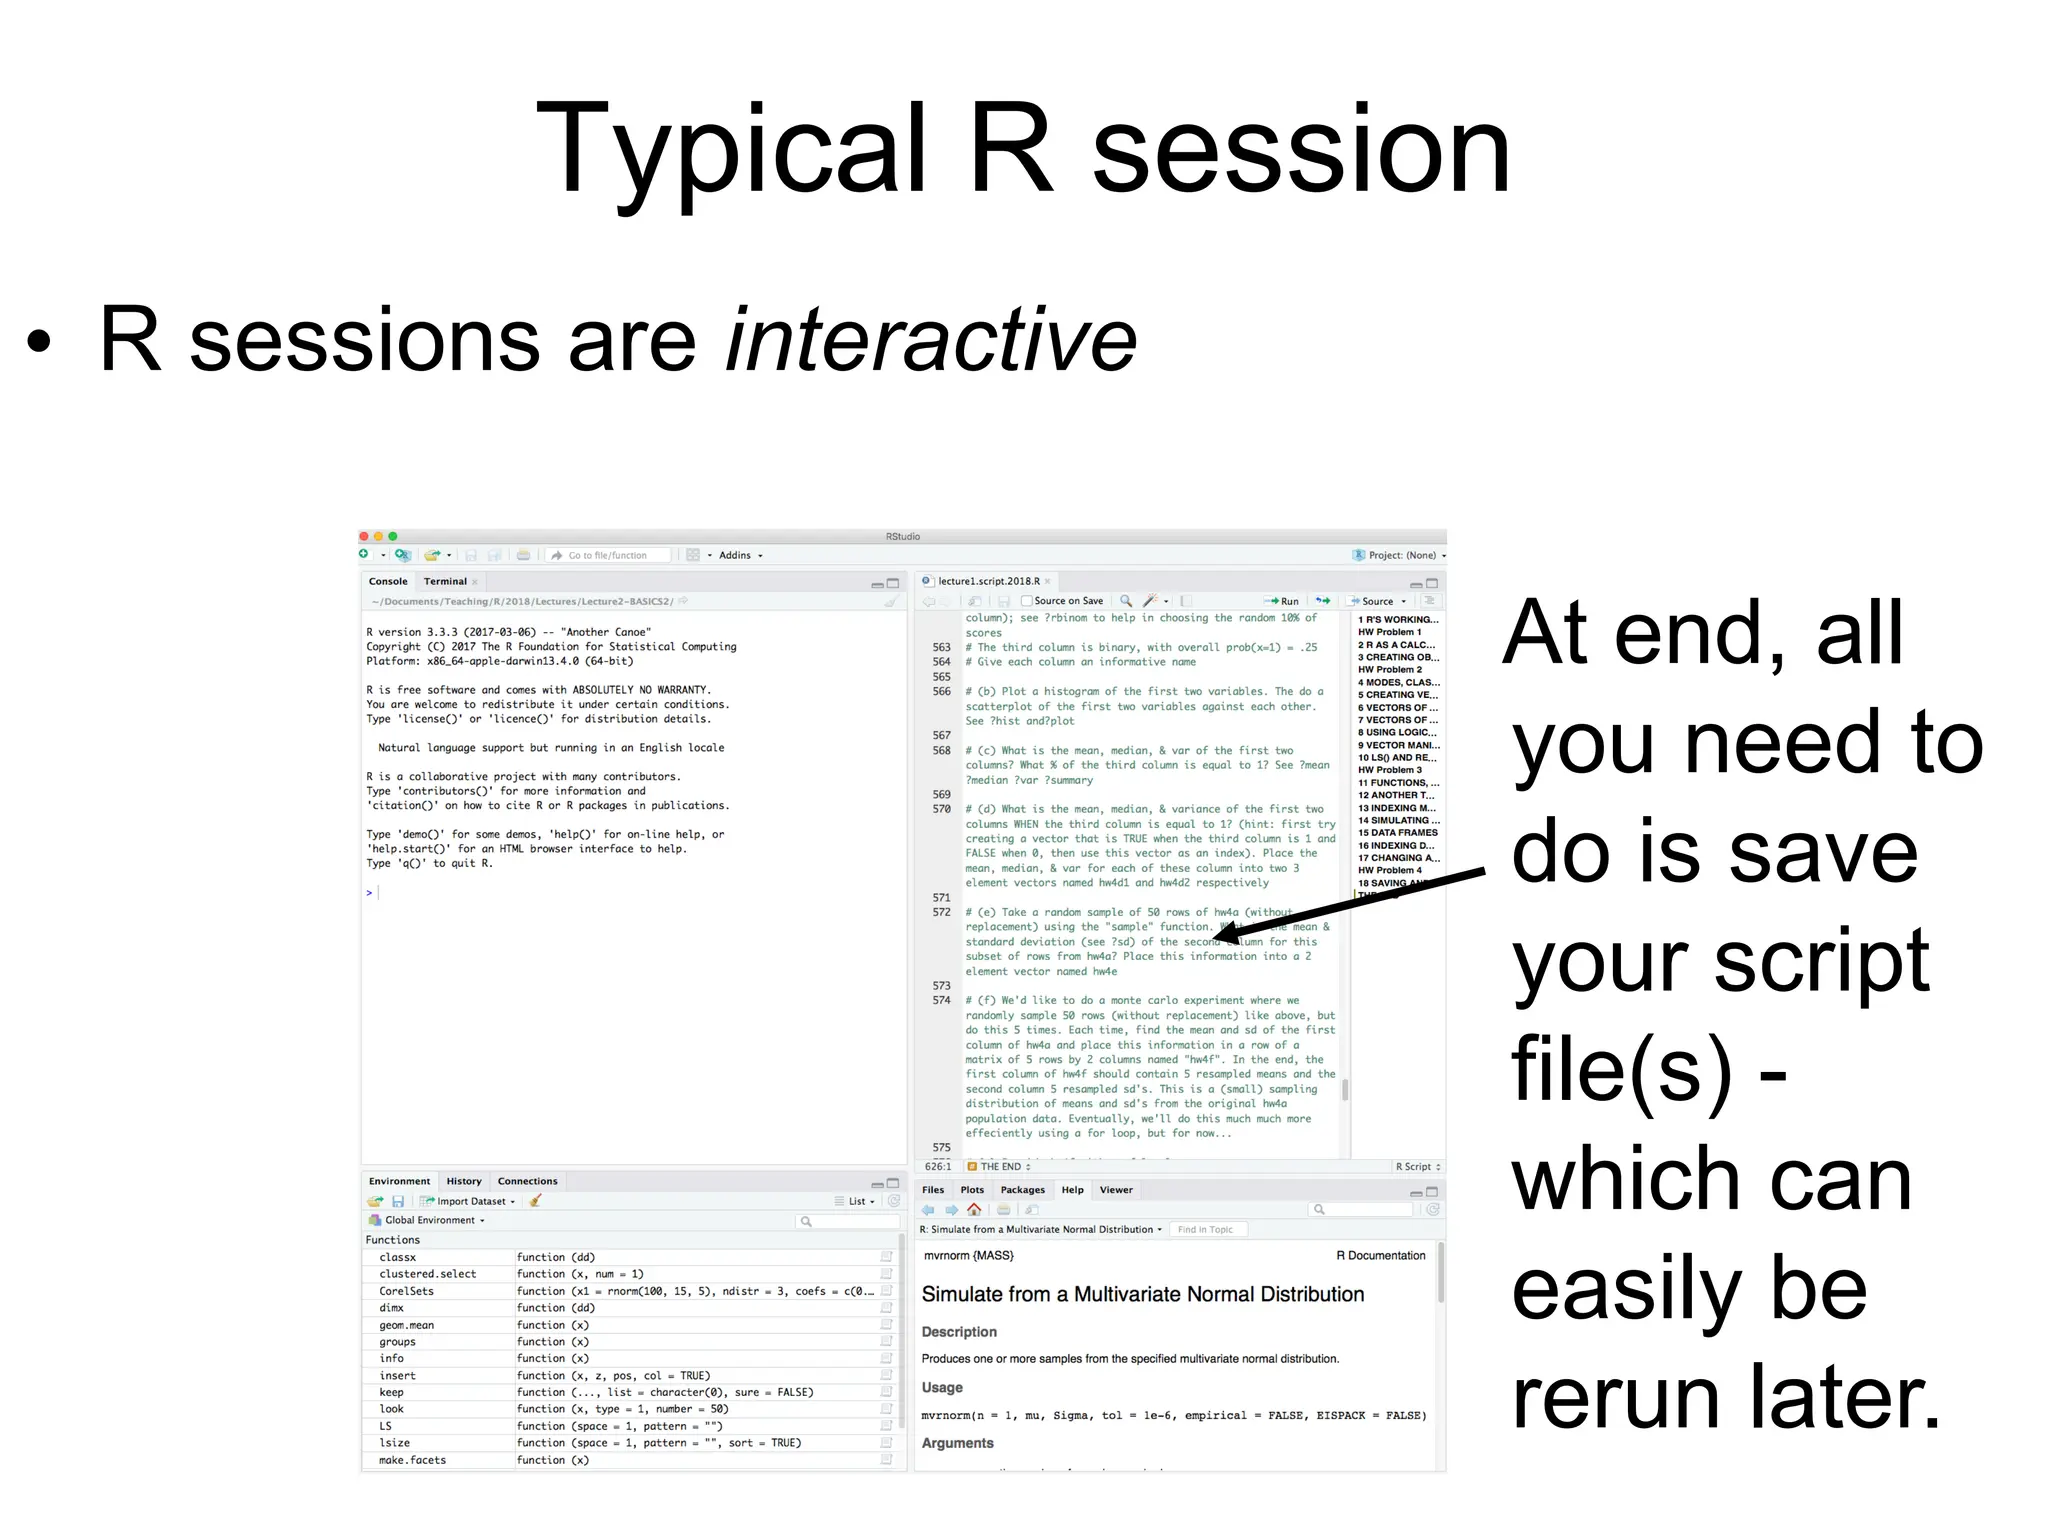
• Script can be thought of as a way to make objects.
Your goal is usually to write a script that, by its end,
has created the objects (e.g., statistical results) and
graphics you need.
• Objects are classified by two criteria:
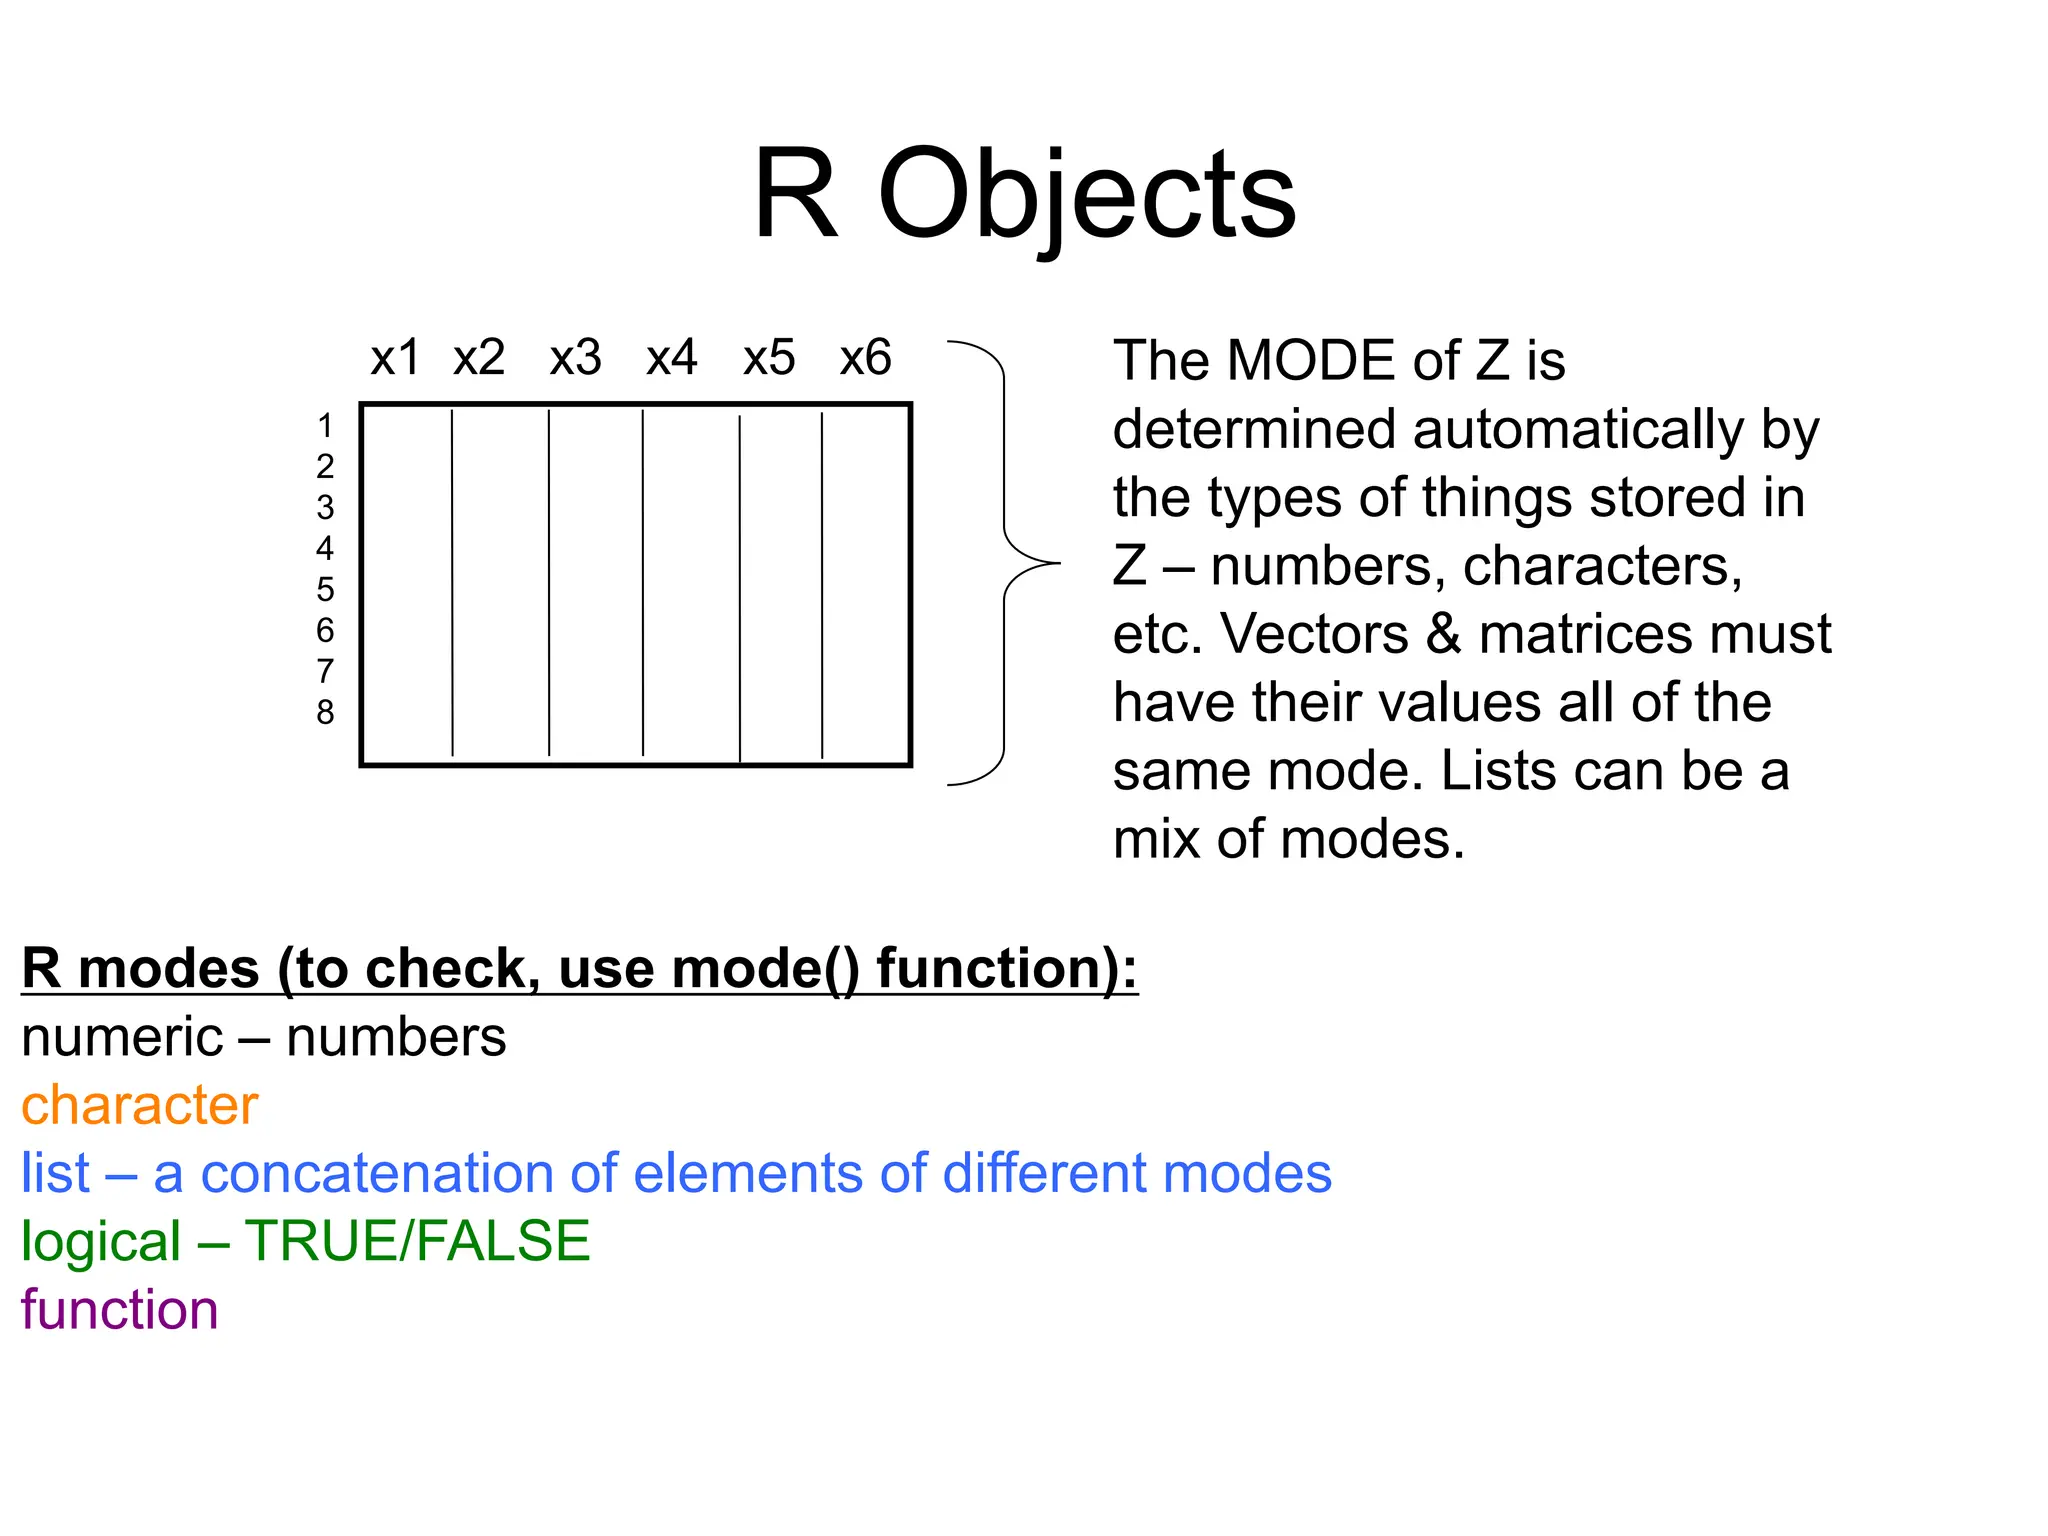
– MODE: how objects are stored in R - character, numeric,
logical, list, & function
– CLASS: how objects are treated by functions (important to
know!) - [vector], matrix, array, factor, data.frame, & 1000s of
special classes created by specific functions](https://image.slidesharecdn.com/averybriefintroductiontor-240907174606-3a76ff28/75/a_very_brief_introduction_to_r-pdfhshkdjdn-21-2048.jpg)
![R Classes
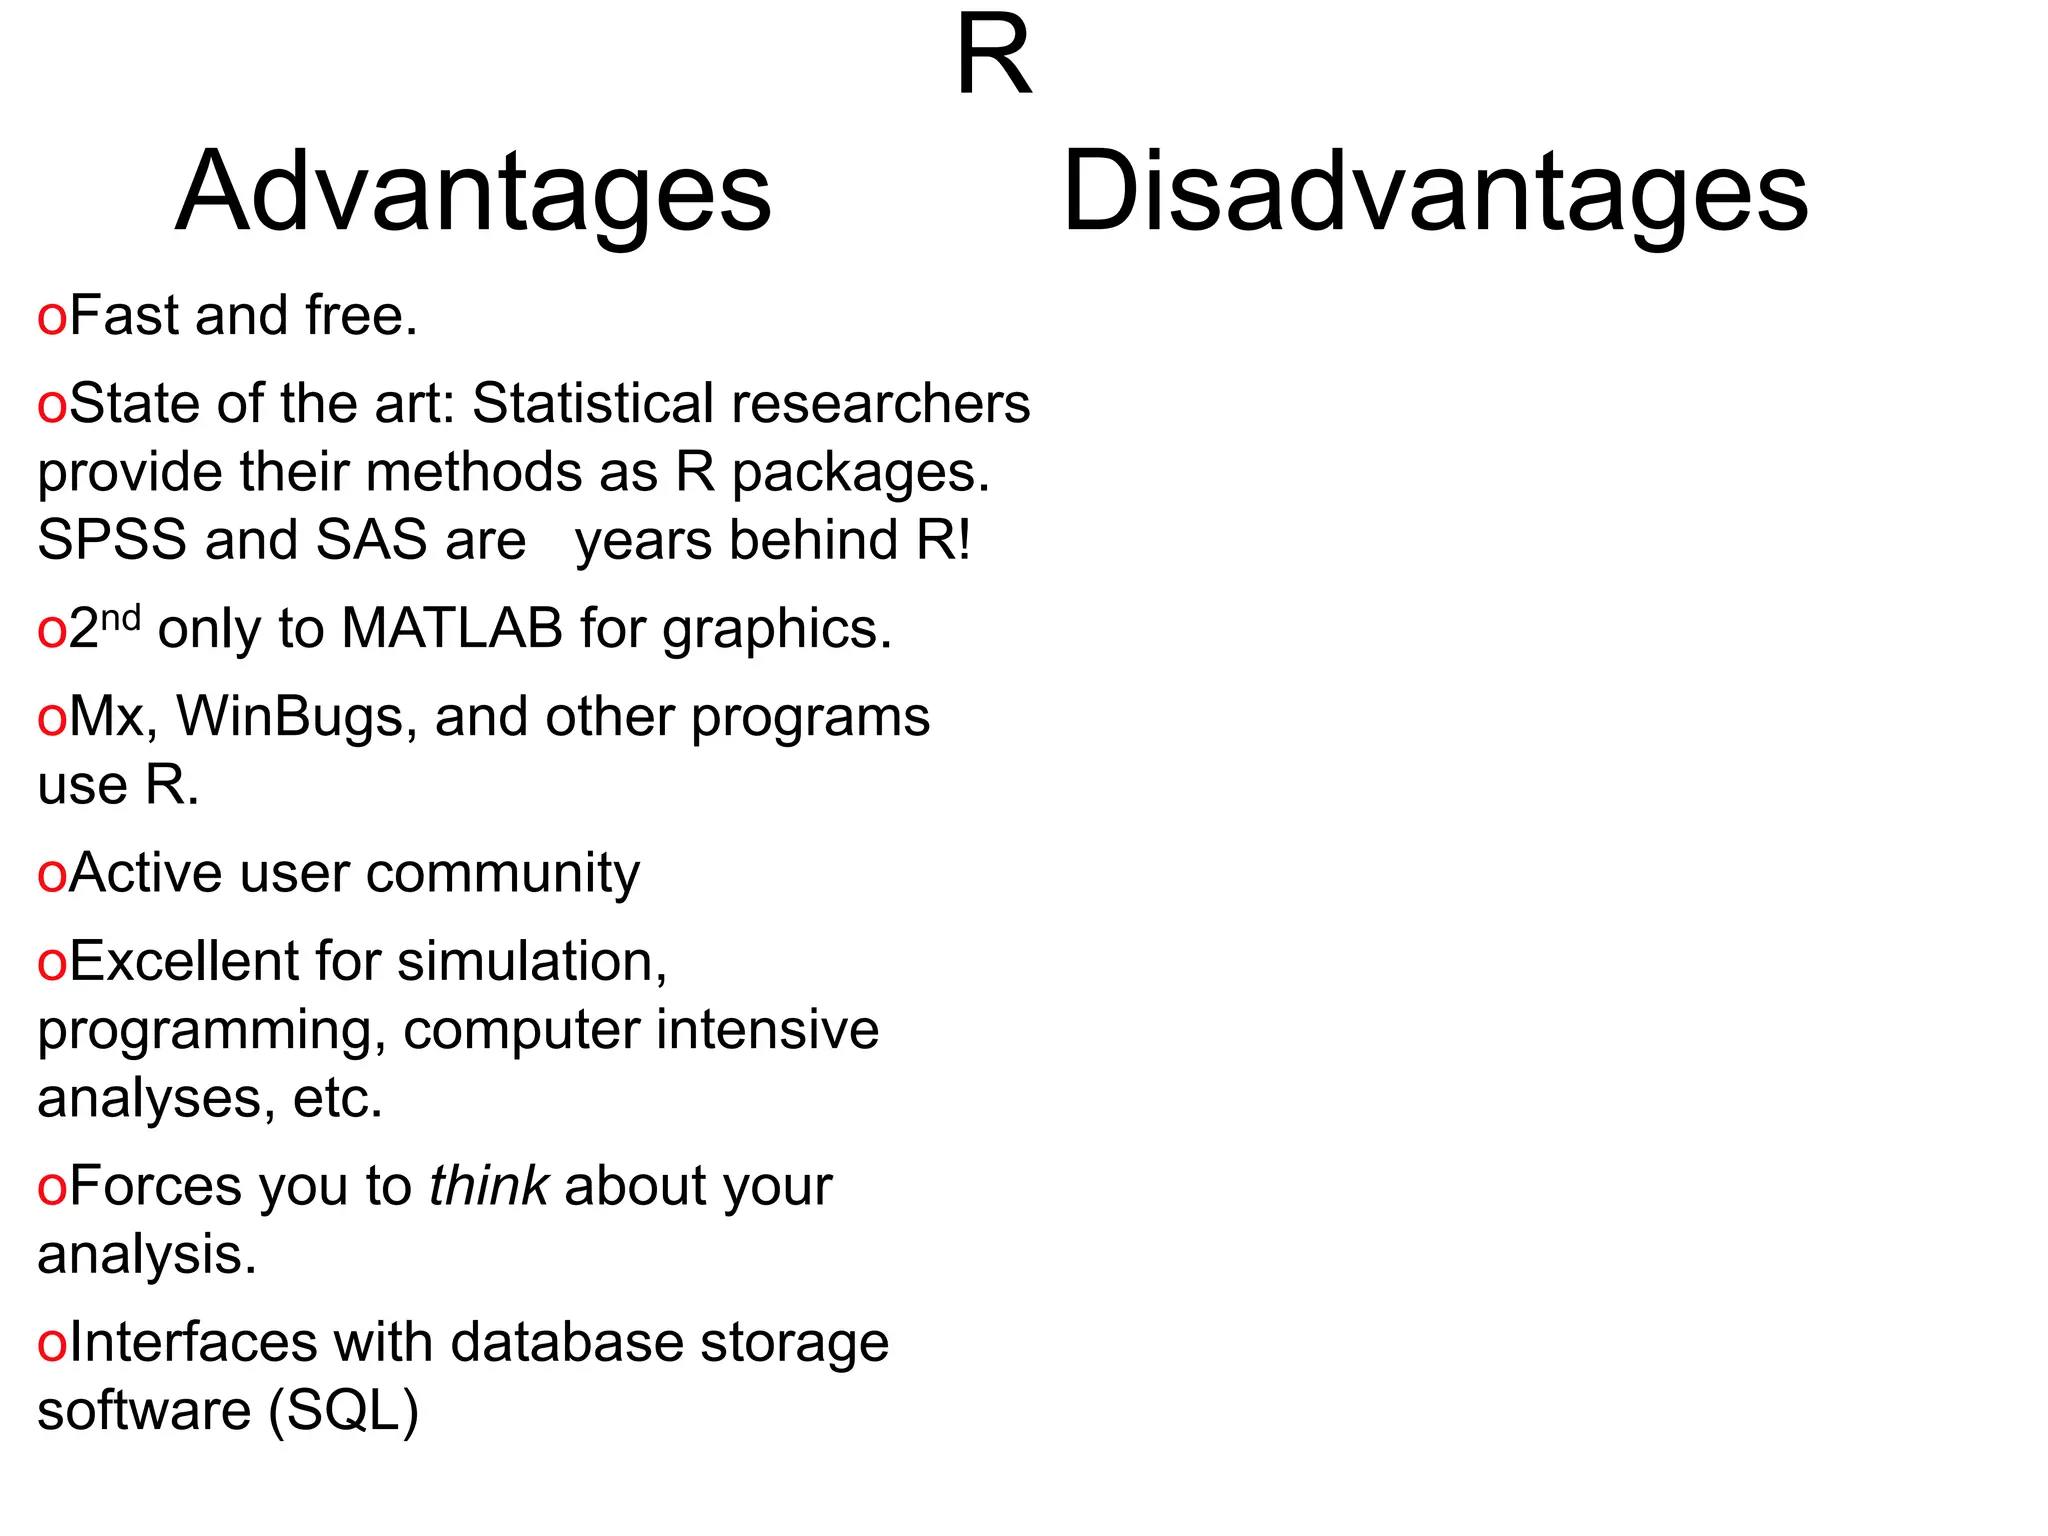
The CLASS of Z is either set by default
depending, on how it was created, or is
explicitly set by user. You can check the
objects’class and change it. It determines
how functions deal with Z. If of class “lm”,
R searches for a function fun.lm
x1 x2 x3 x4 x5 x6
1
2
3
4
5
6
7
8
R classes (to check, use class() function):
[for vectors, mode & class are same] - logical, numeric, character
[modes & class are same for these 2 as well] - function, list (when generic)
factor
matrix
array
data.frame
NOTE: If an object has two classes - c("first", "second") - R searches for a function
called fun.first and, if it finds it, applies it to the object. If no such function is found, a function called
fun.second is tried. If no class name produces a suitable function, the function fun.default is used.](https://image.slidesharecdn.com/averybriefintroductiontor-240907174606-3a76ff28/75/a_very_brief_introduction_to_r-pdfhshkdjdn-24-2048.jpg)


![R Objects
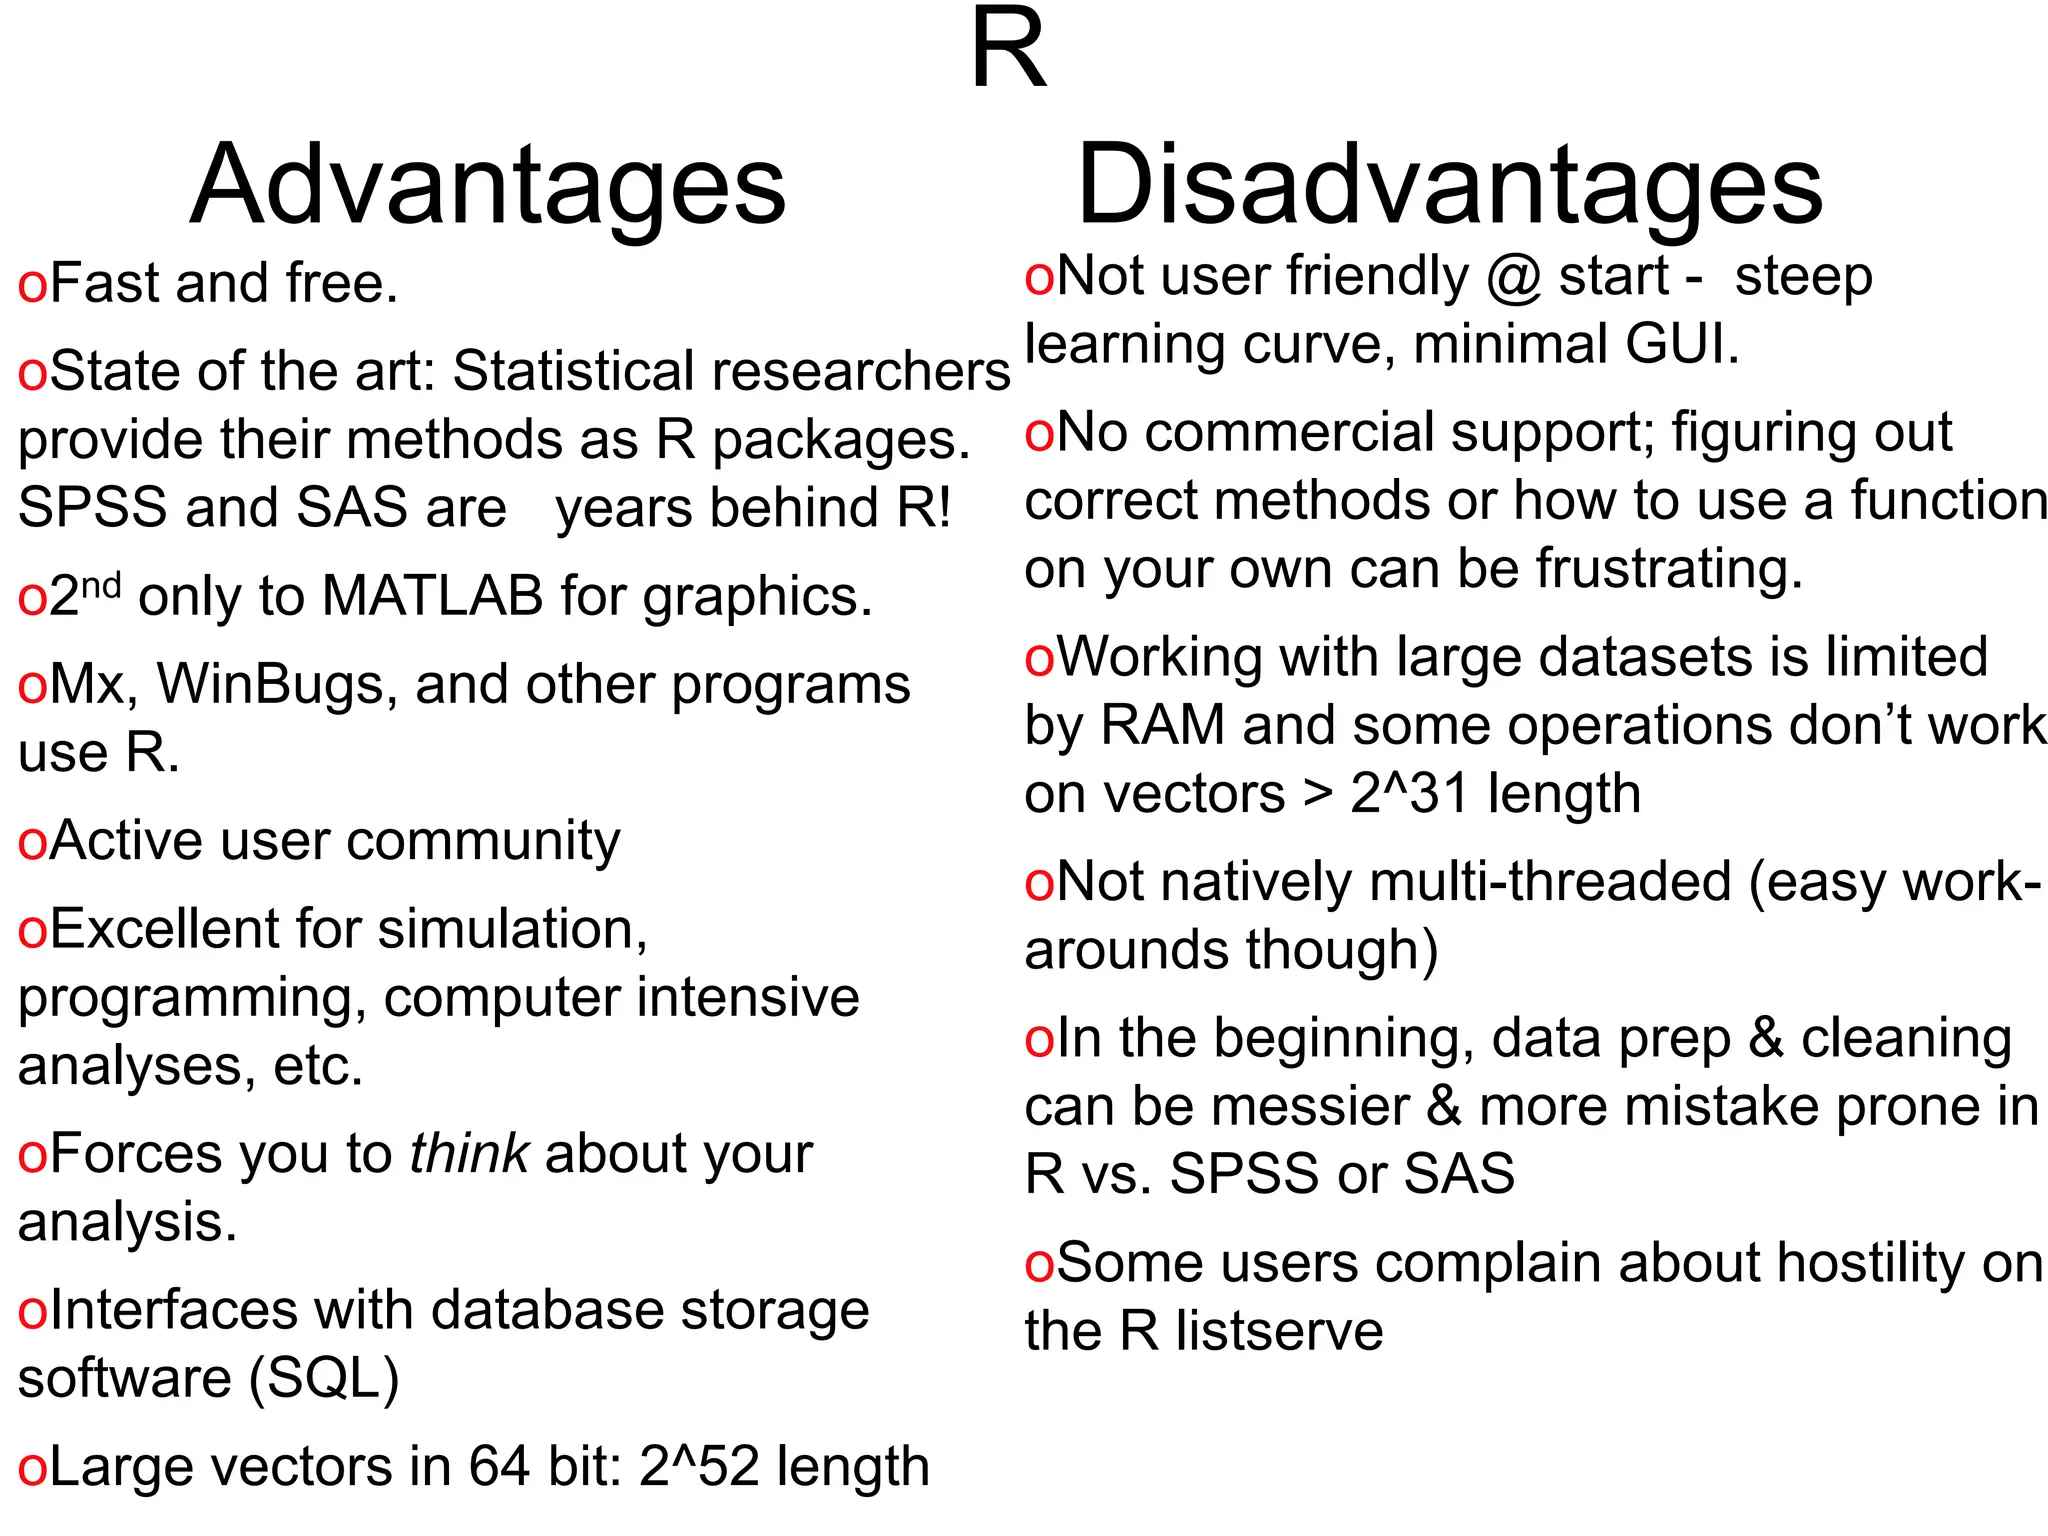
• Almost all things in R – functions, datasets, results,
etc. – are OBJECTS.
– (graphics are written out and are not stored as objects)
• Script can be thought of as a way to make objects.
Your goal is usually to write a script that, by its end,
has created the objects (e.g., statistical results) and
graphics you need.
• Objects are classified by two criteria:
– MODE: how objects are stored in R - character, numeric,
logical, list, & function
– CLASS: how objects are treated by functions (important to
know!) - [vector], matrix, array, factor, data.frame, & 1000s of
special classes created by specific functions](https://crownmelresort.com/image.slidesharecdn.com/averybriefintroductiontor-240907174606-3a76ff28/75/a_very_brief_introduction_to_r-pdfhshkdjdn-21-2048.jpg)


![R Classes
The CLASS of Z is either set by default
depending, on how it was created, or is
explicitly set by user. You can check the
objects’class and change it. It determines
how functions deal with Z. If of class “lm”,
R searches for a function fun.lm
x1 x2 x3 x4 x5 x6
1
2
3
4
5
6
7
8
R classes (to check, use class() function):
[for vectors, mode & class are same] - logical, numeric, character
[modes & class are same for these 2 as well] - function, list (when generic)
factor
matrix
array
data.frame
NOTE: If an object has two classes - c("first", "second") - R searches for a function
called fun.first and, if it finds it, applies it to the object. If no such function is found, a function called
fun.second is tried. If no class name produces a suitable function, the function fun.default is used.](https://crownmelresort.com/image.slidesharecdn.com/averybriefintroductiontor-240907174606-3a76ff28/75/a_very_brief_introduction_to_r-pdfhshkdjdn-24-2048.jpg)