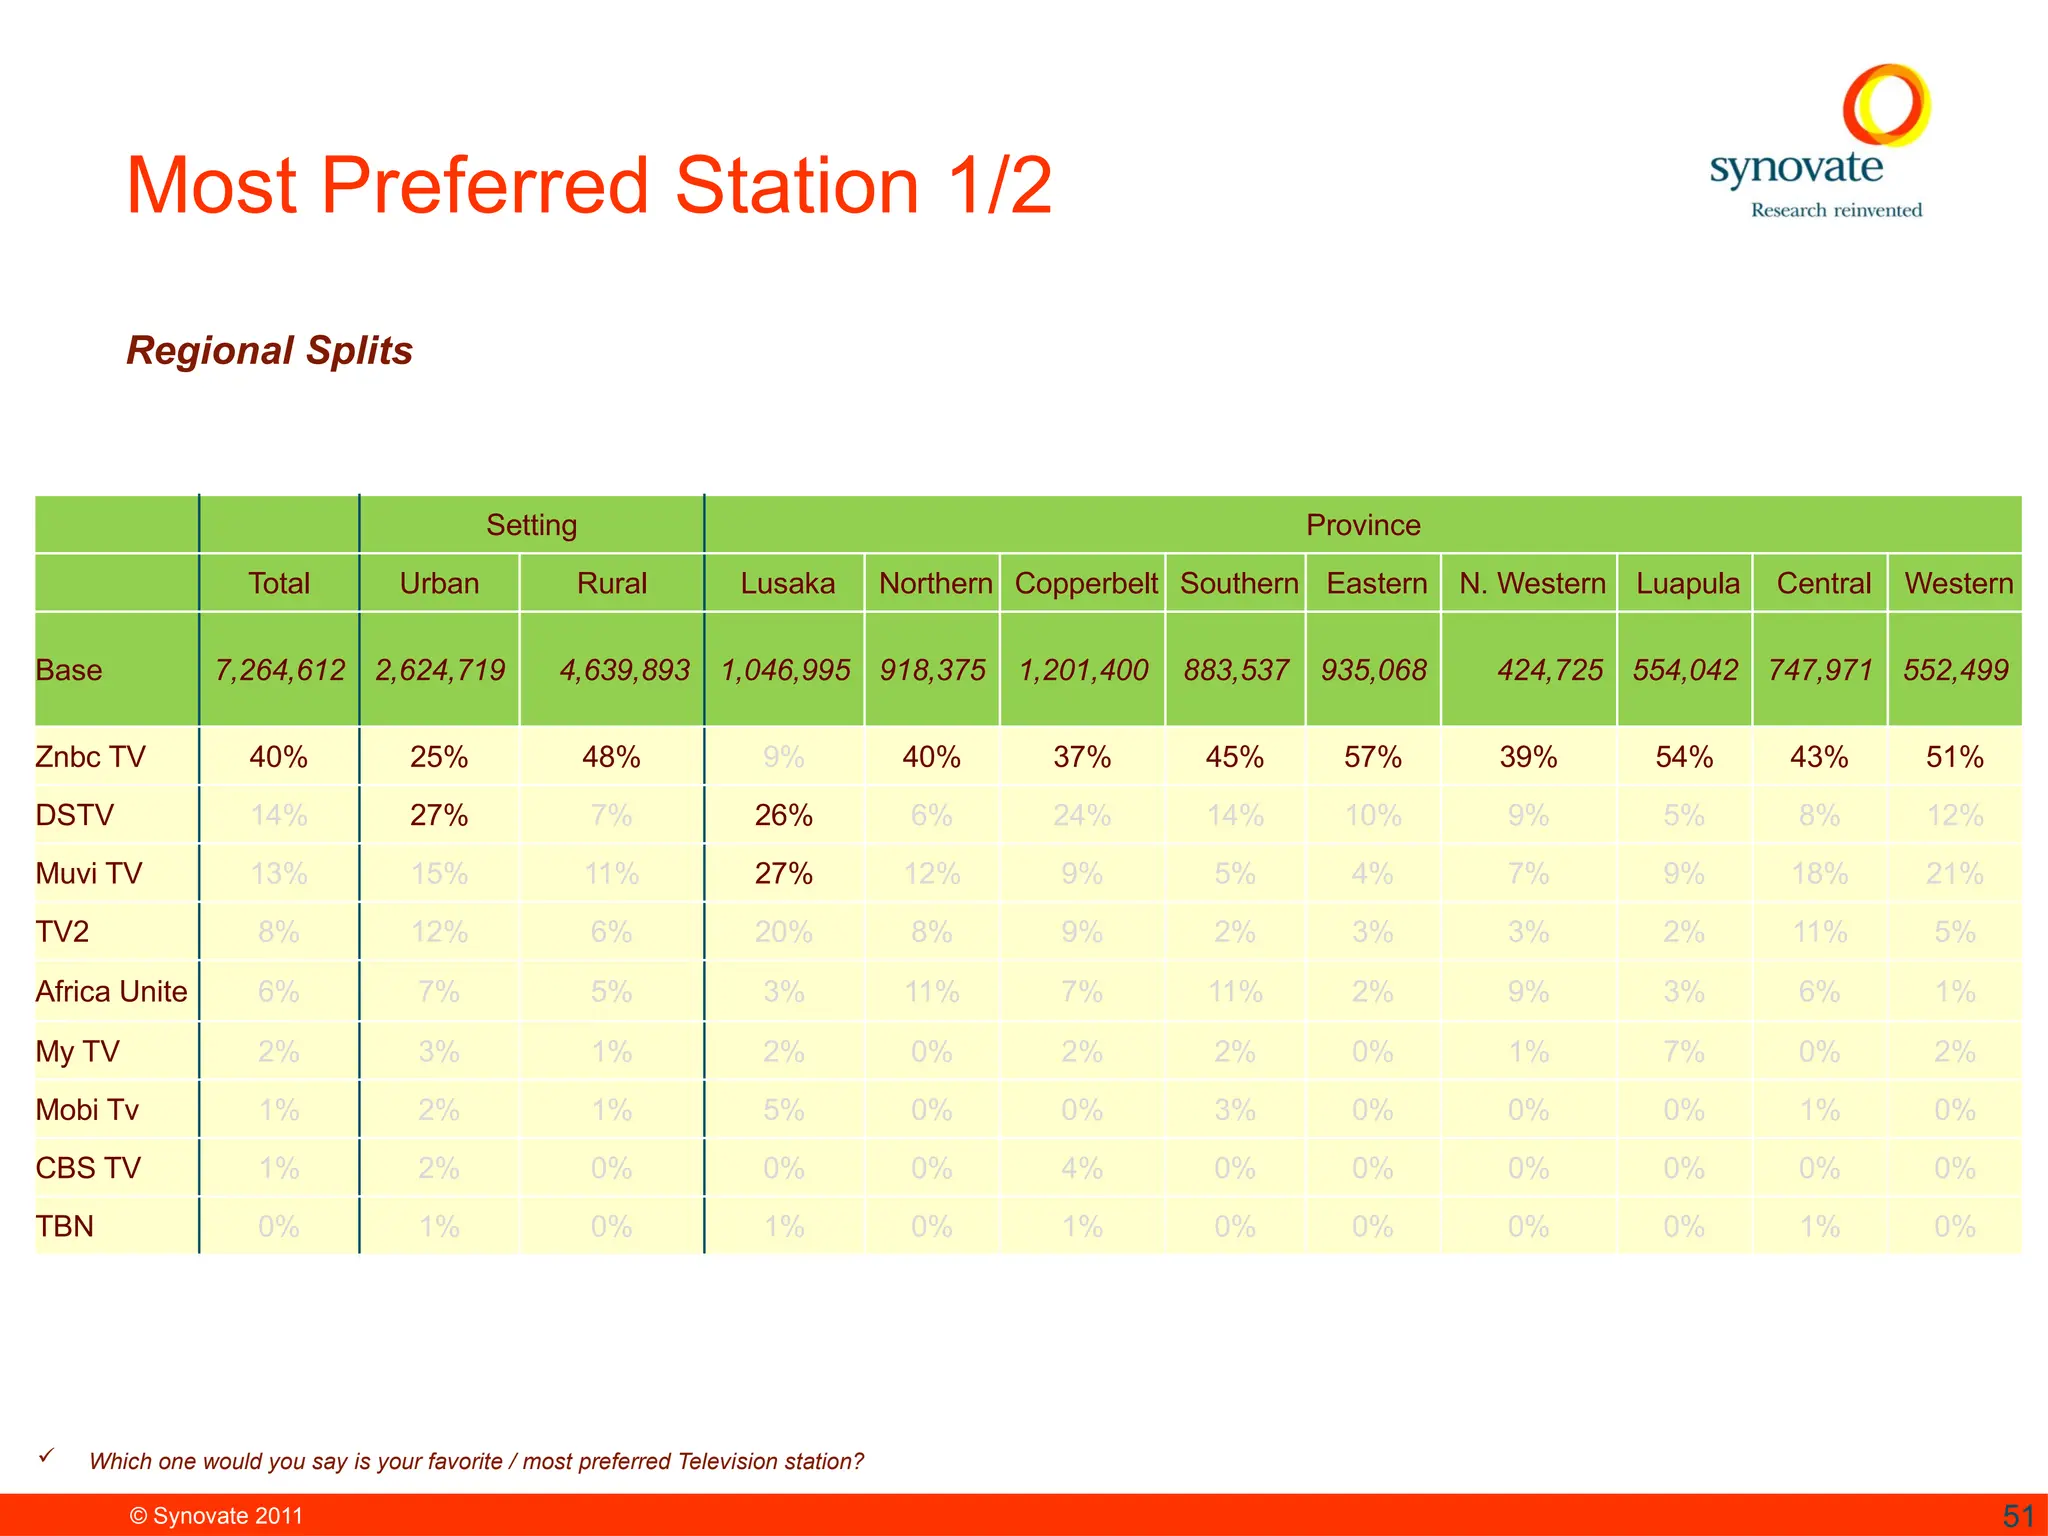
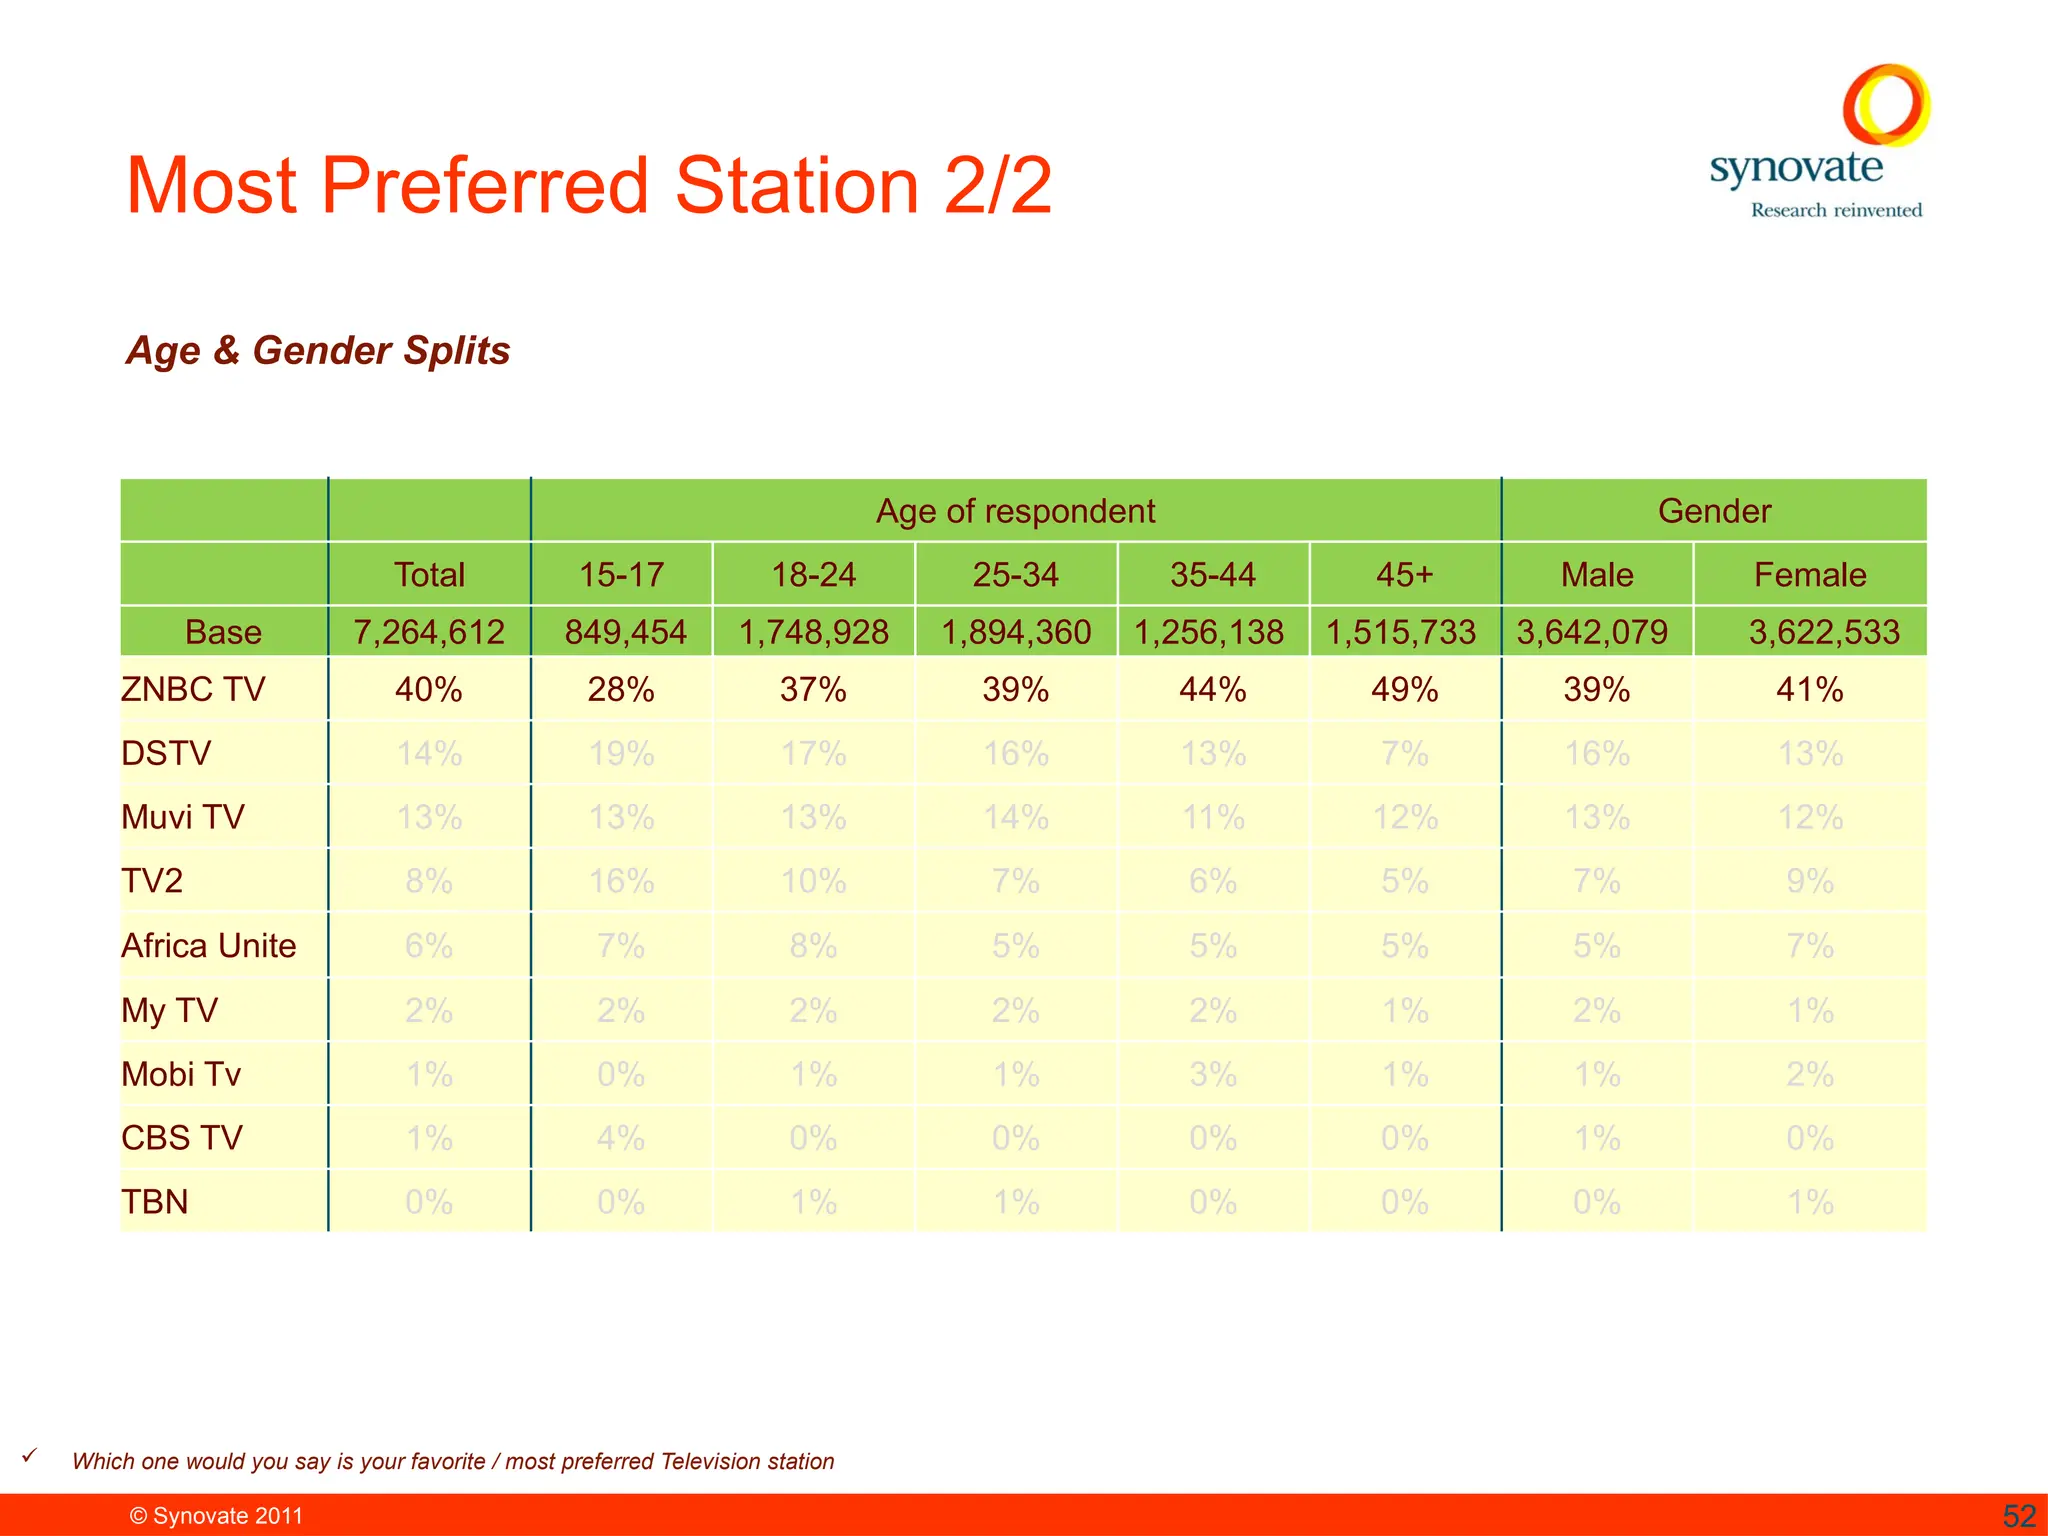
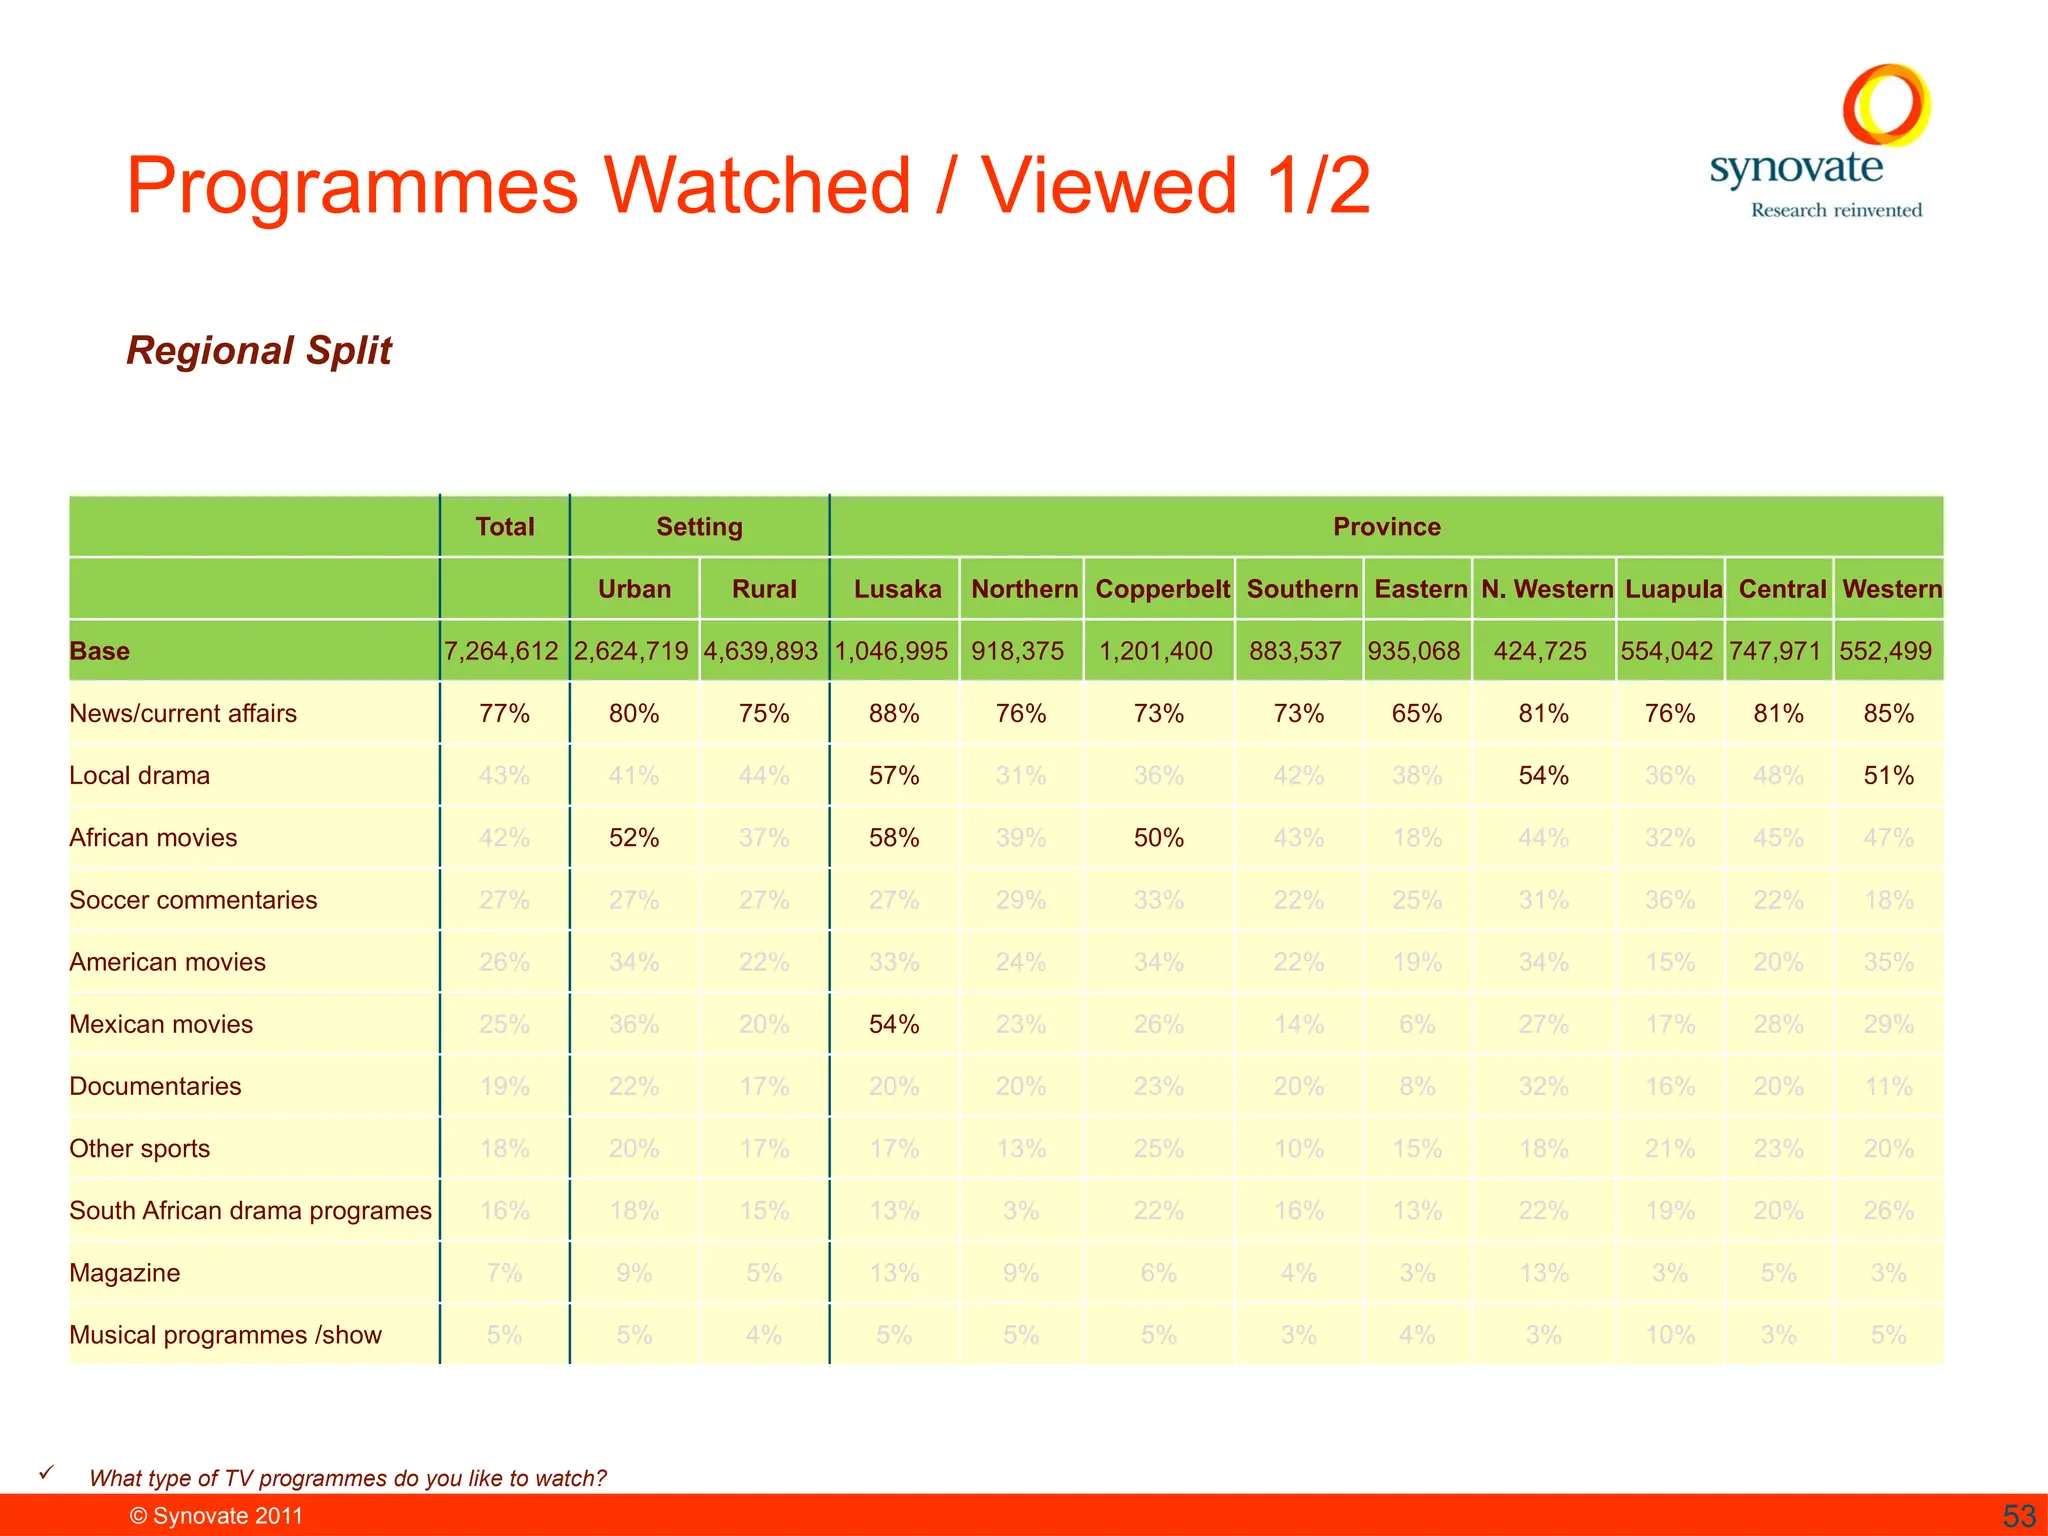
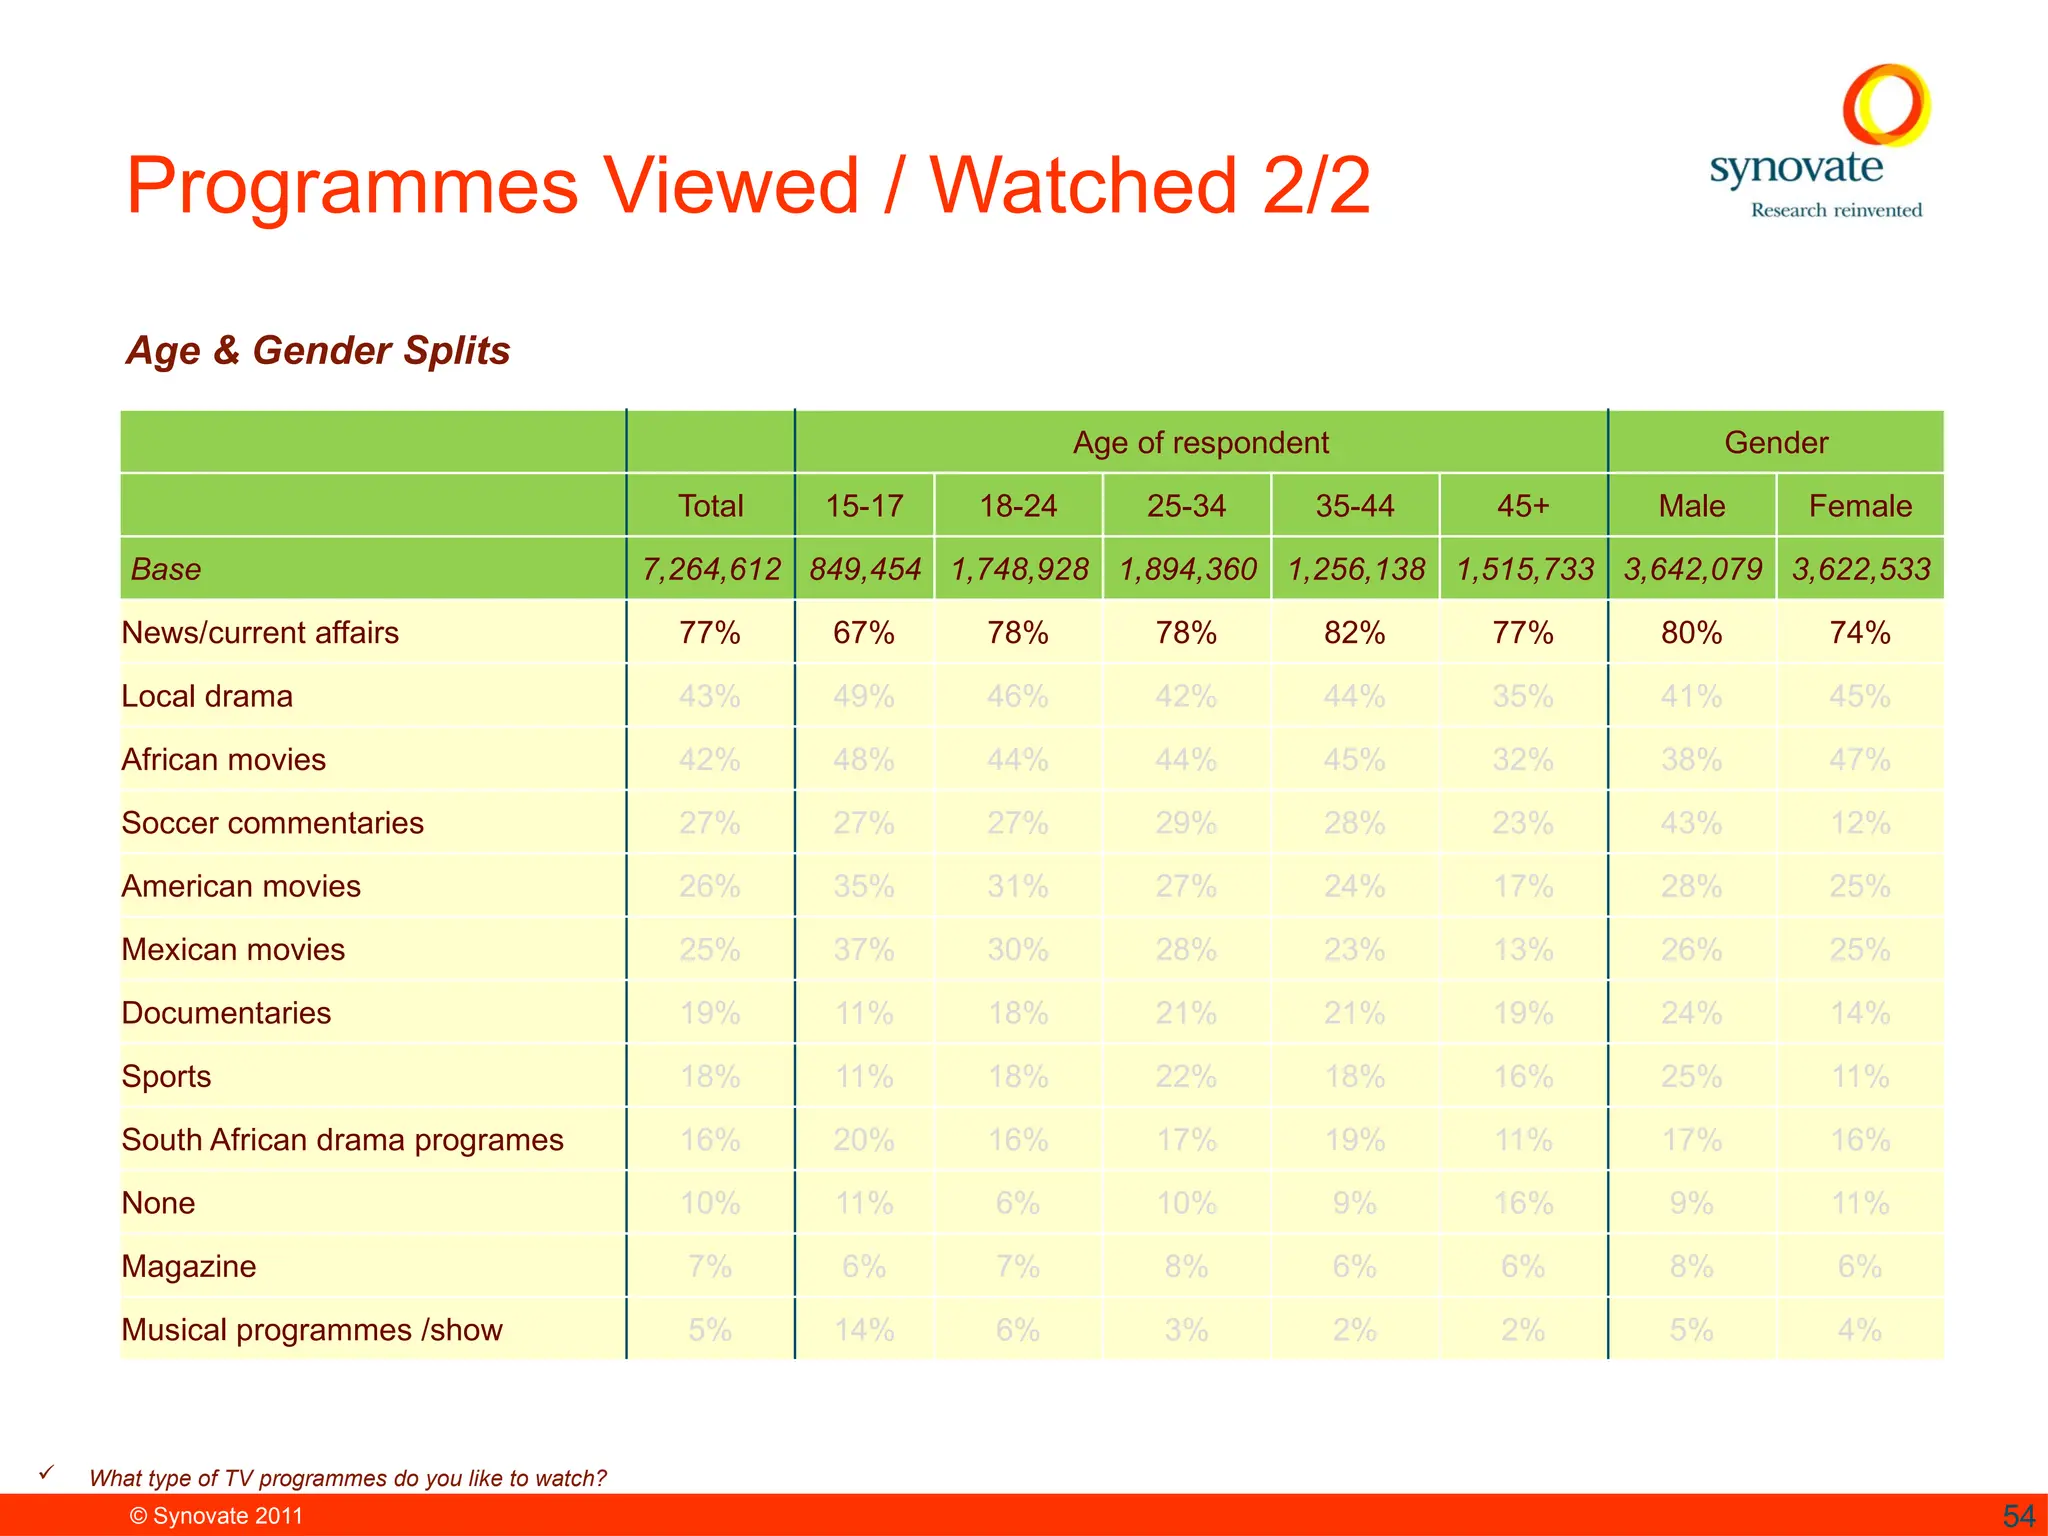
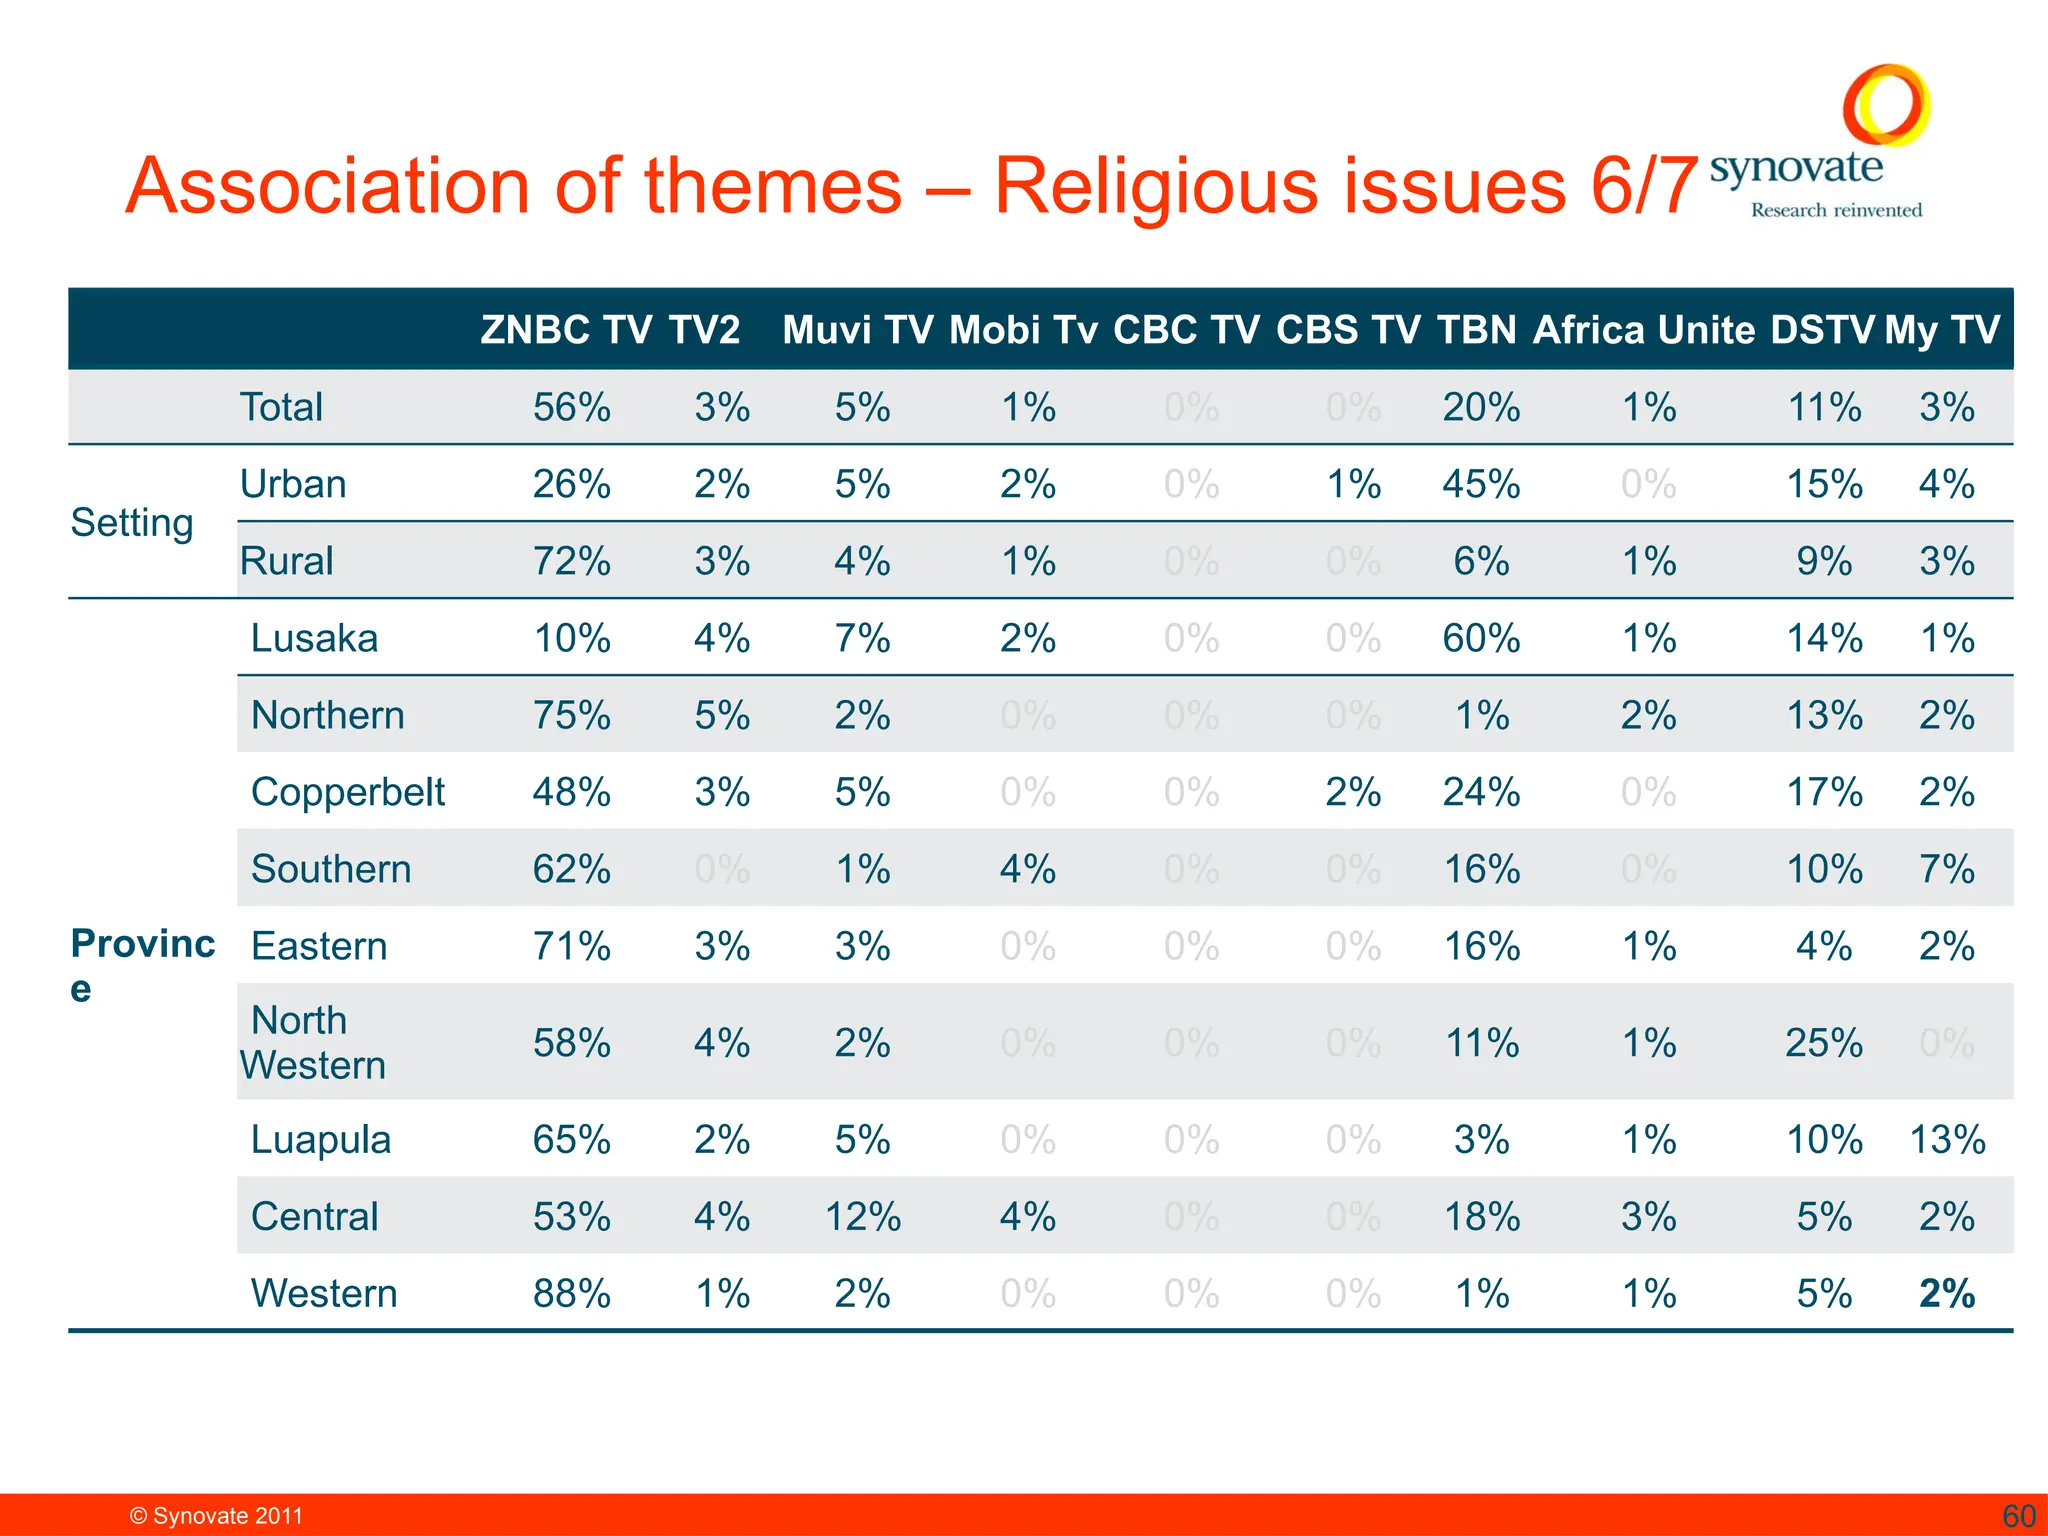
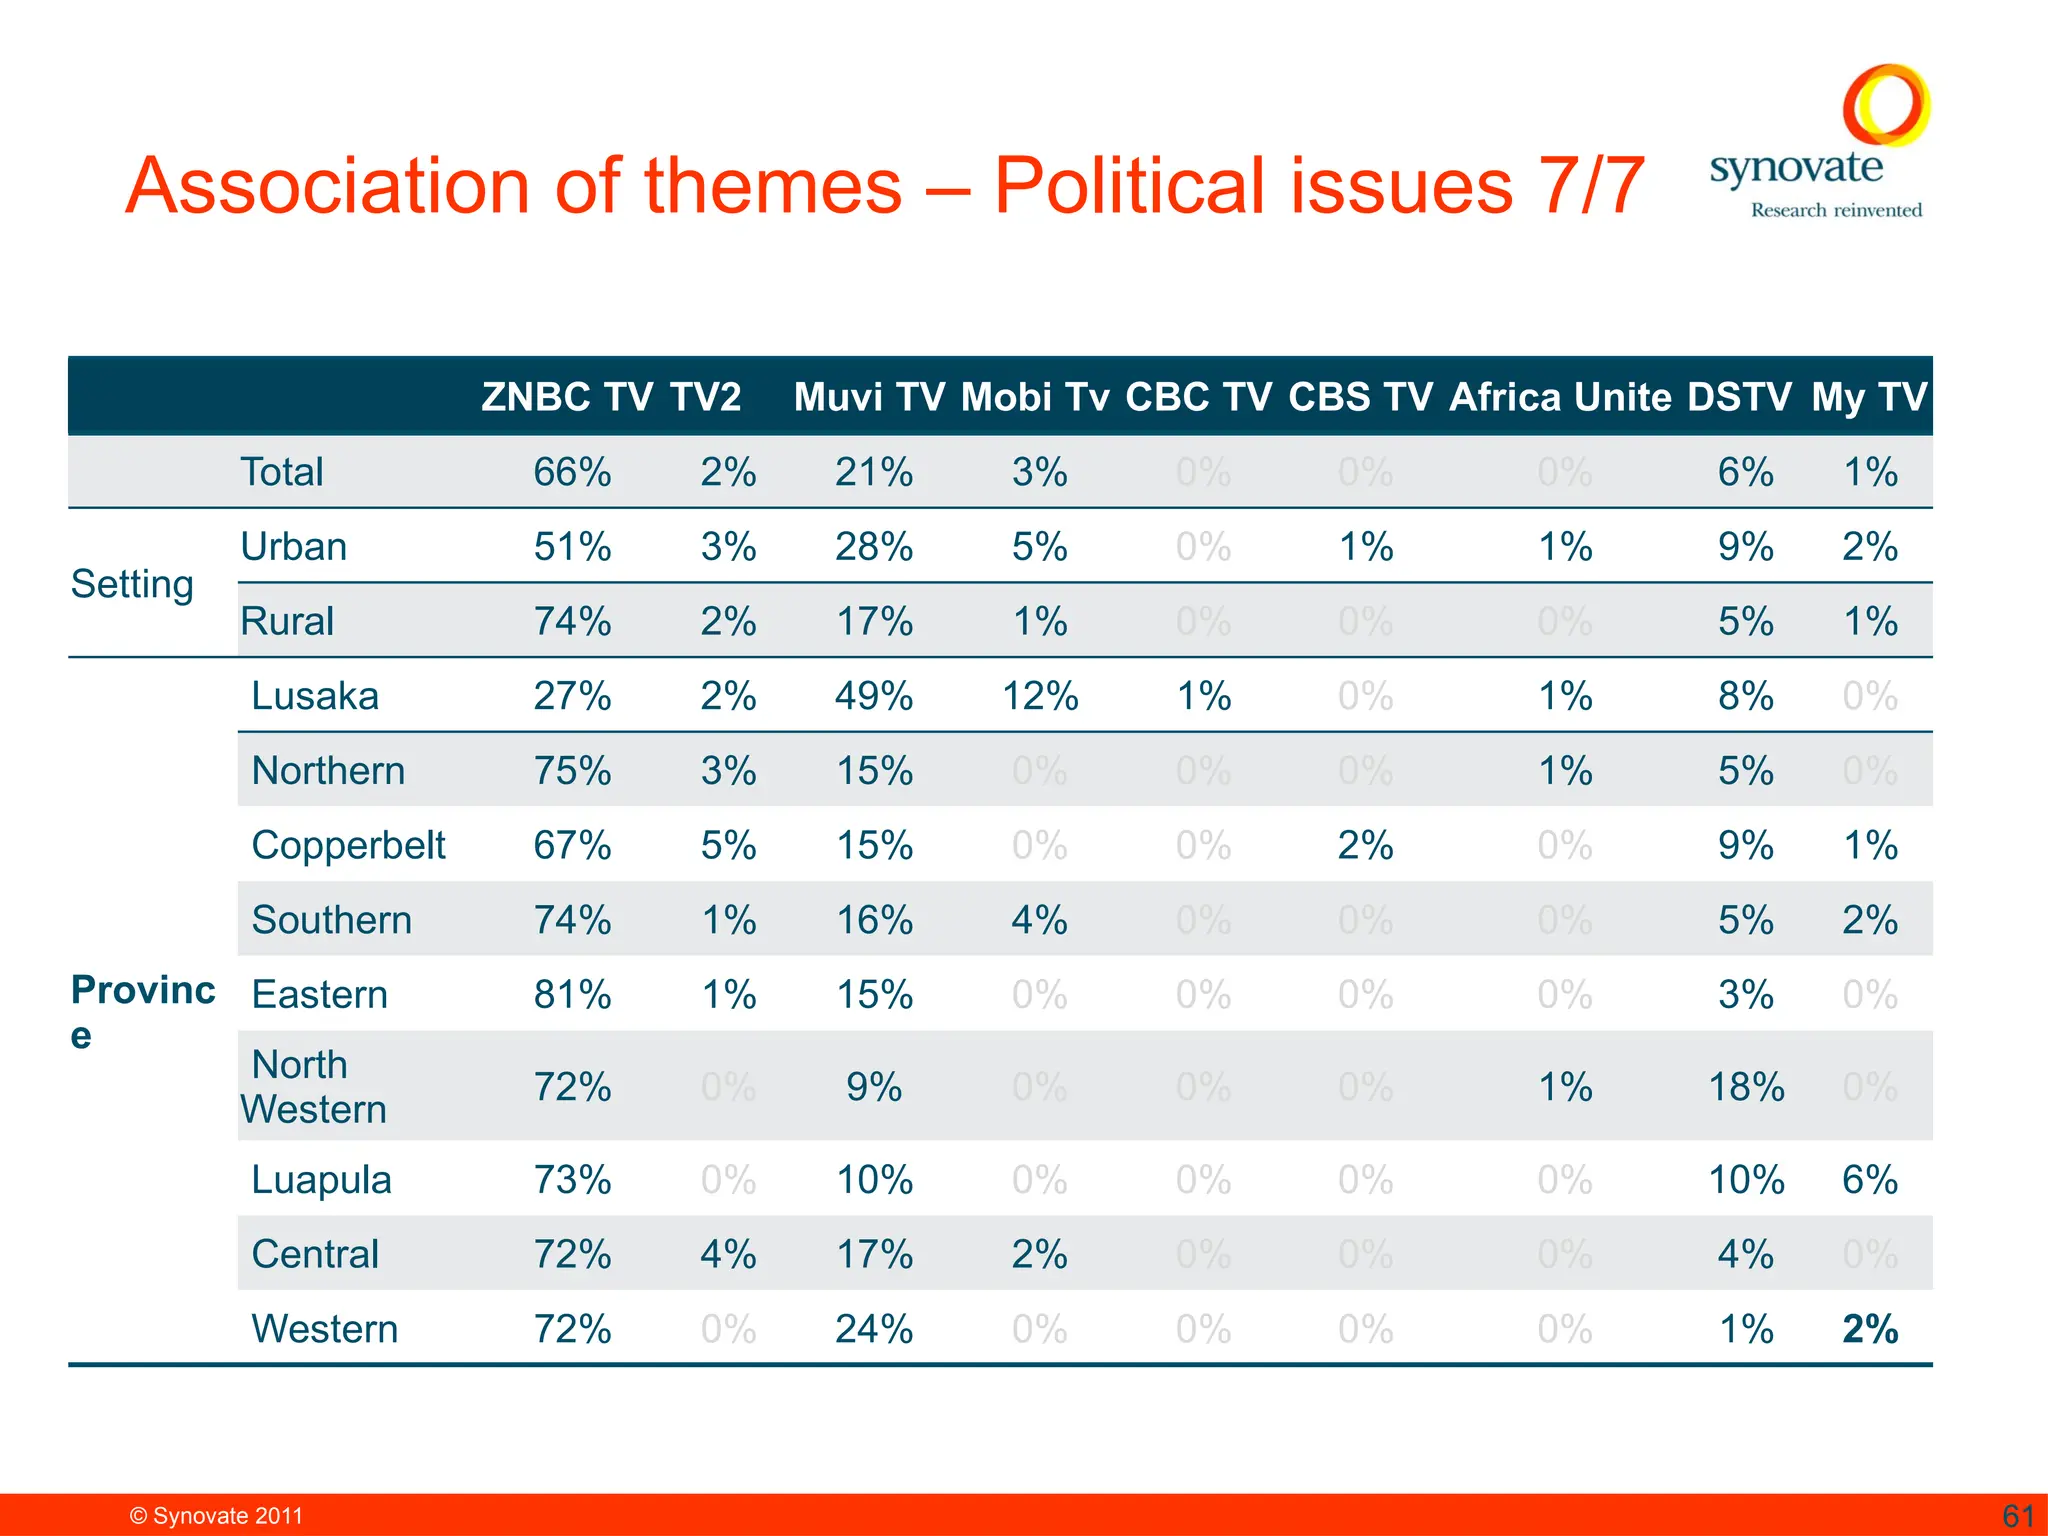
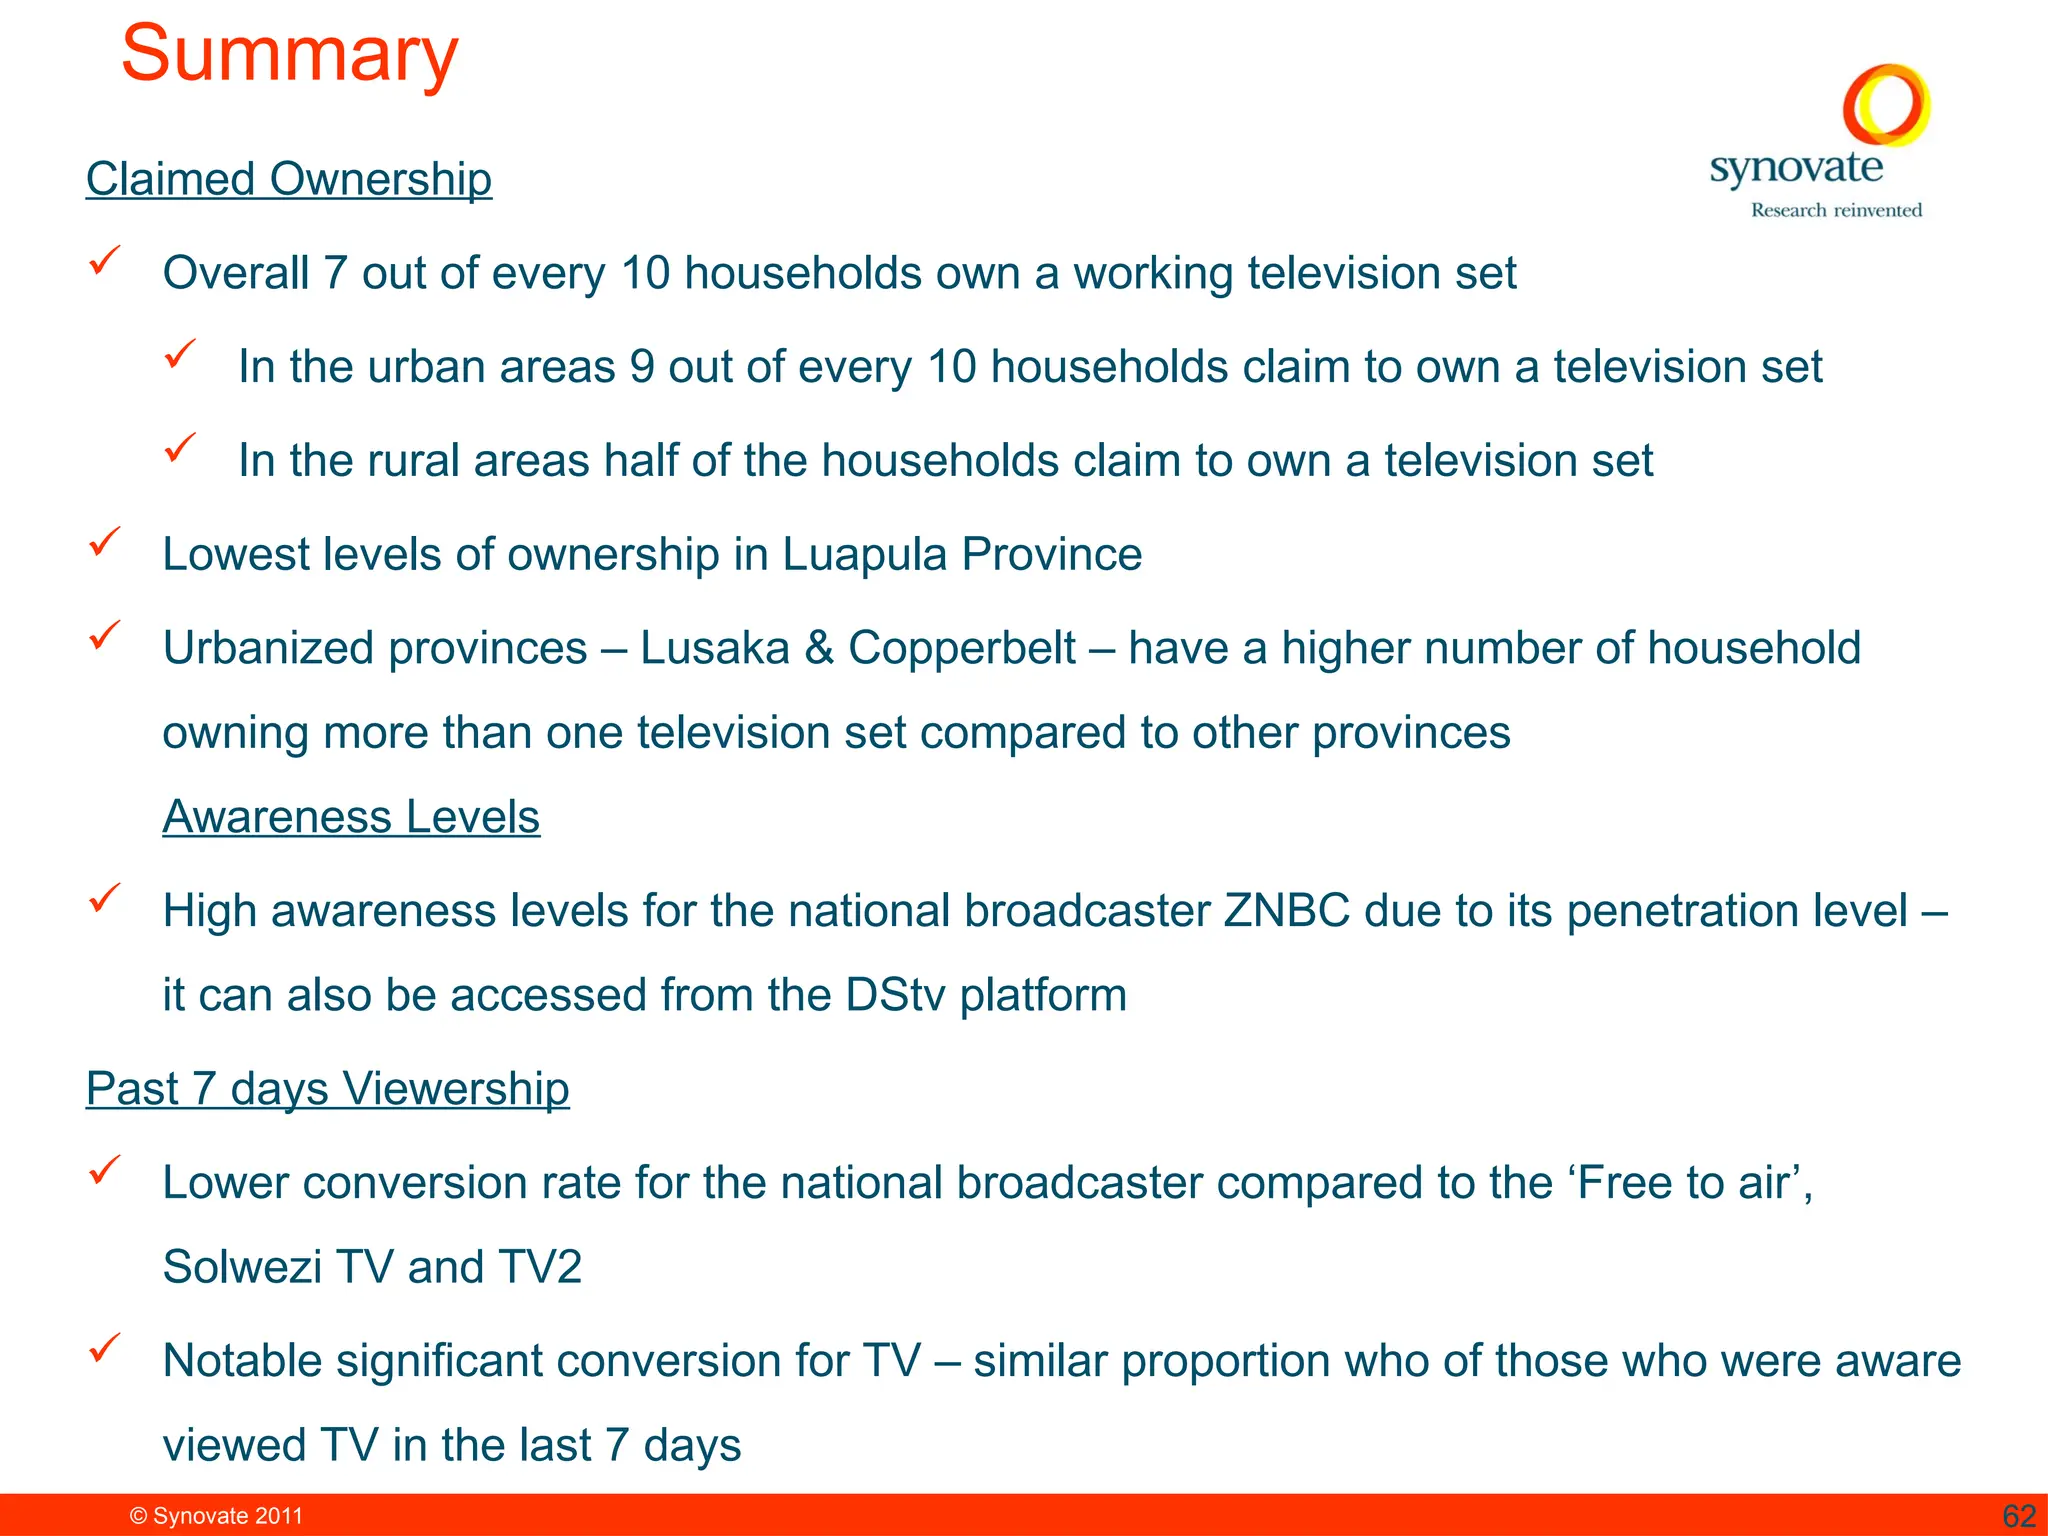
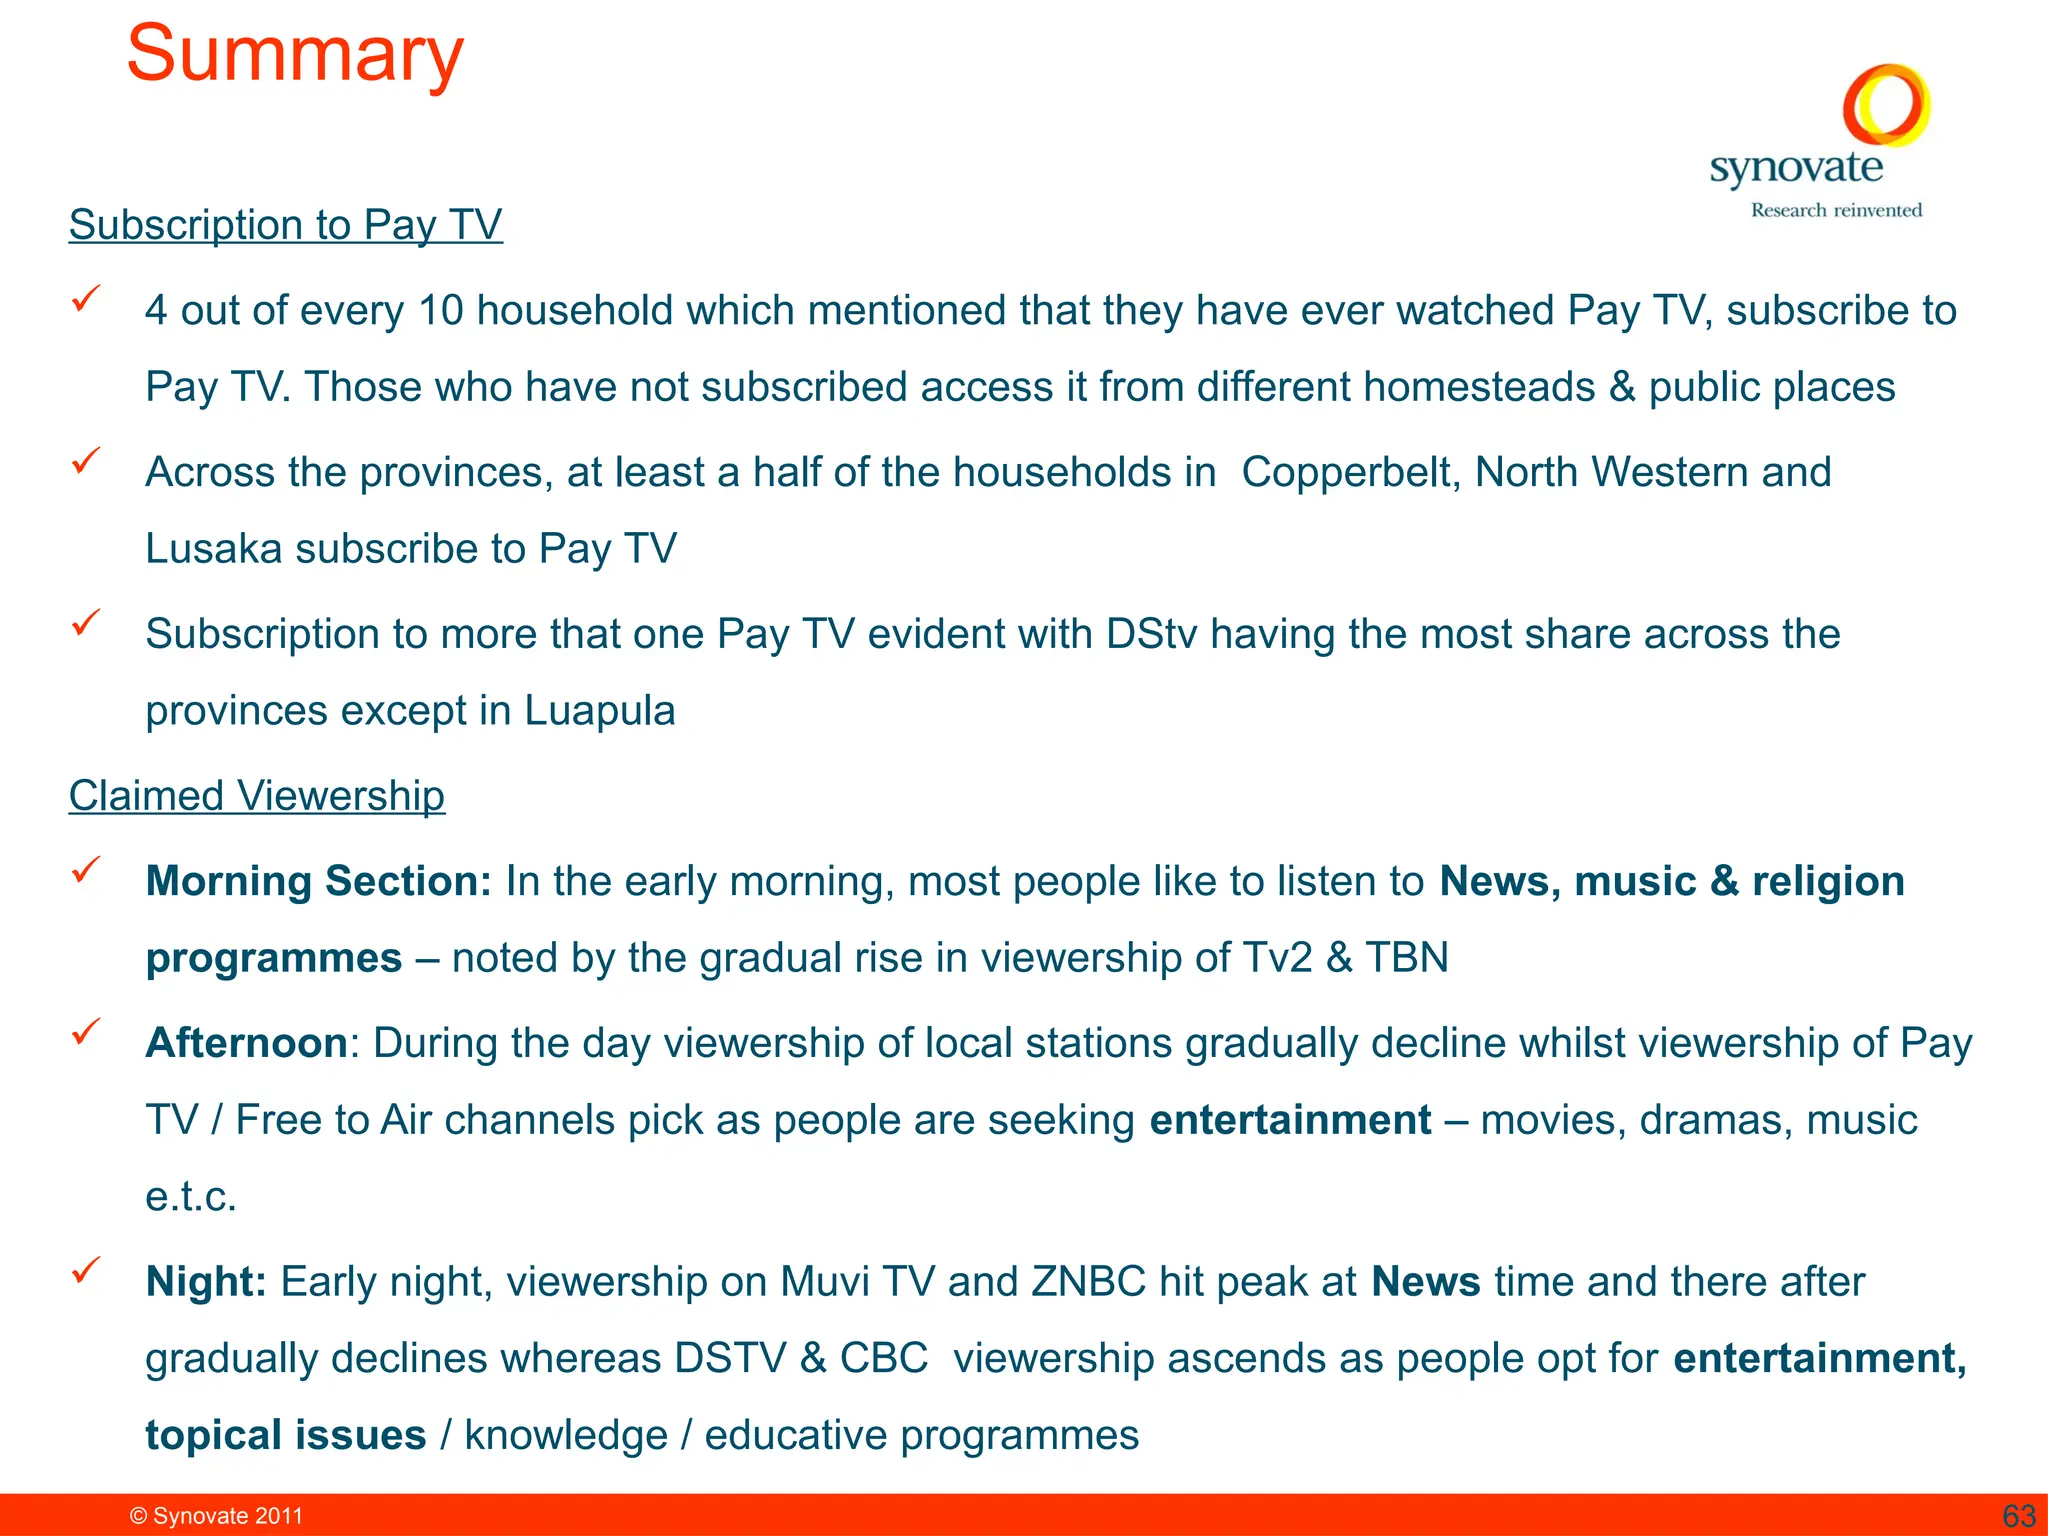
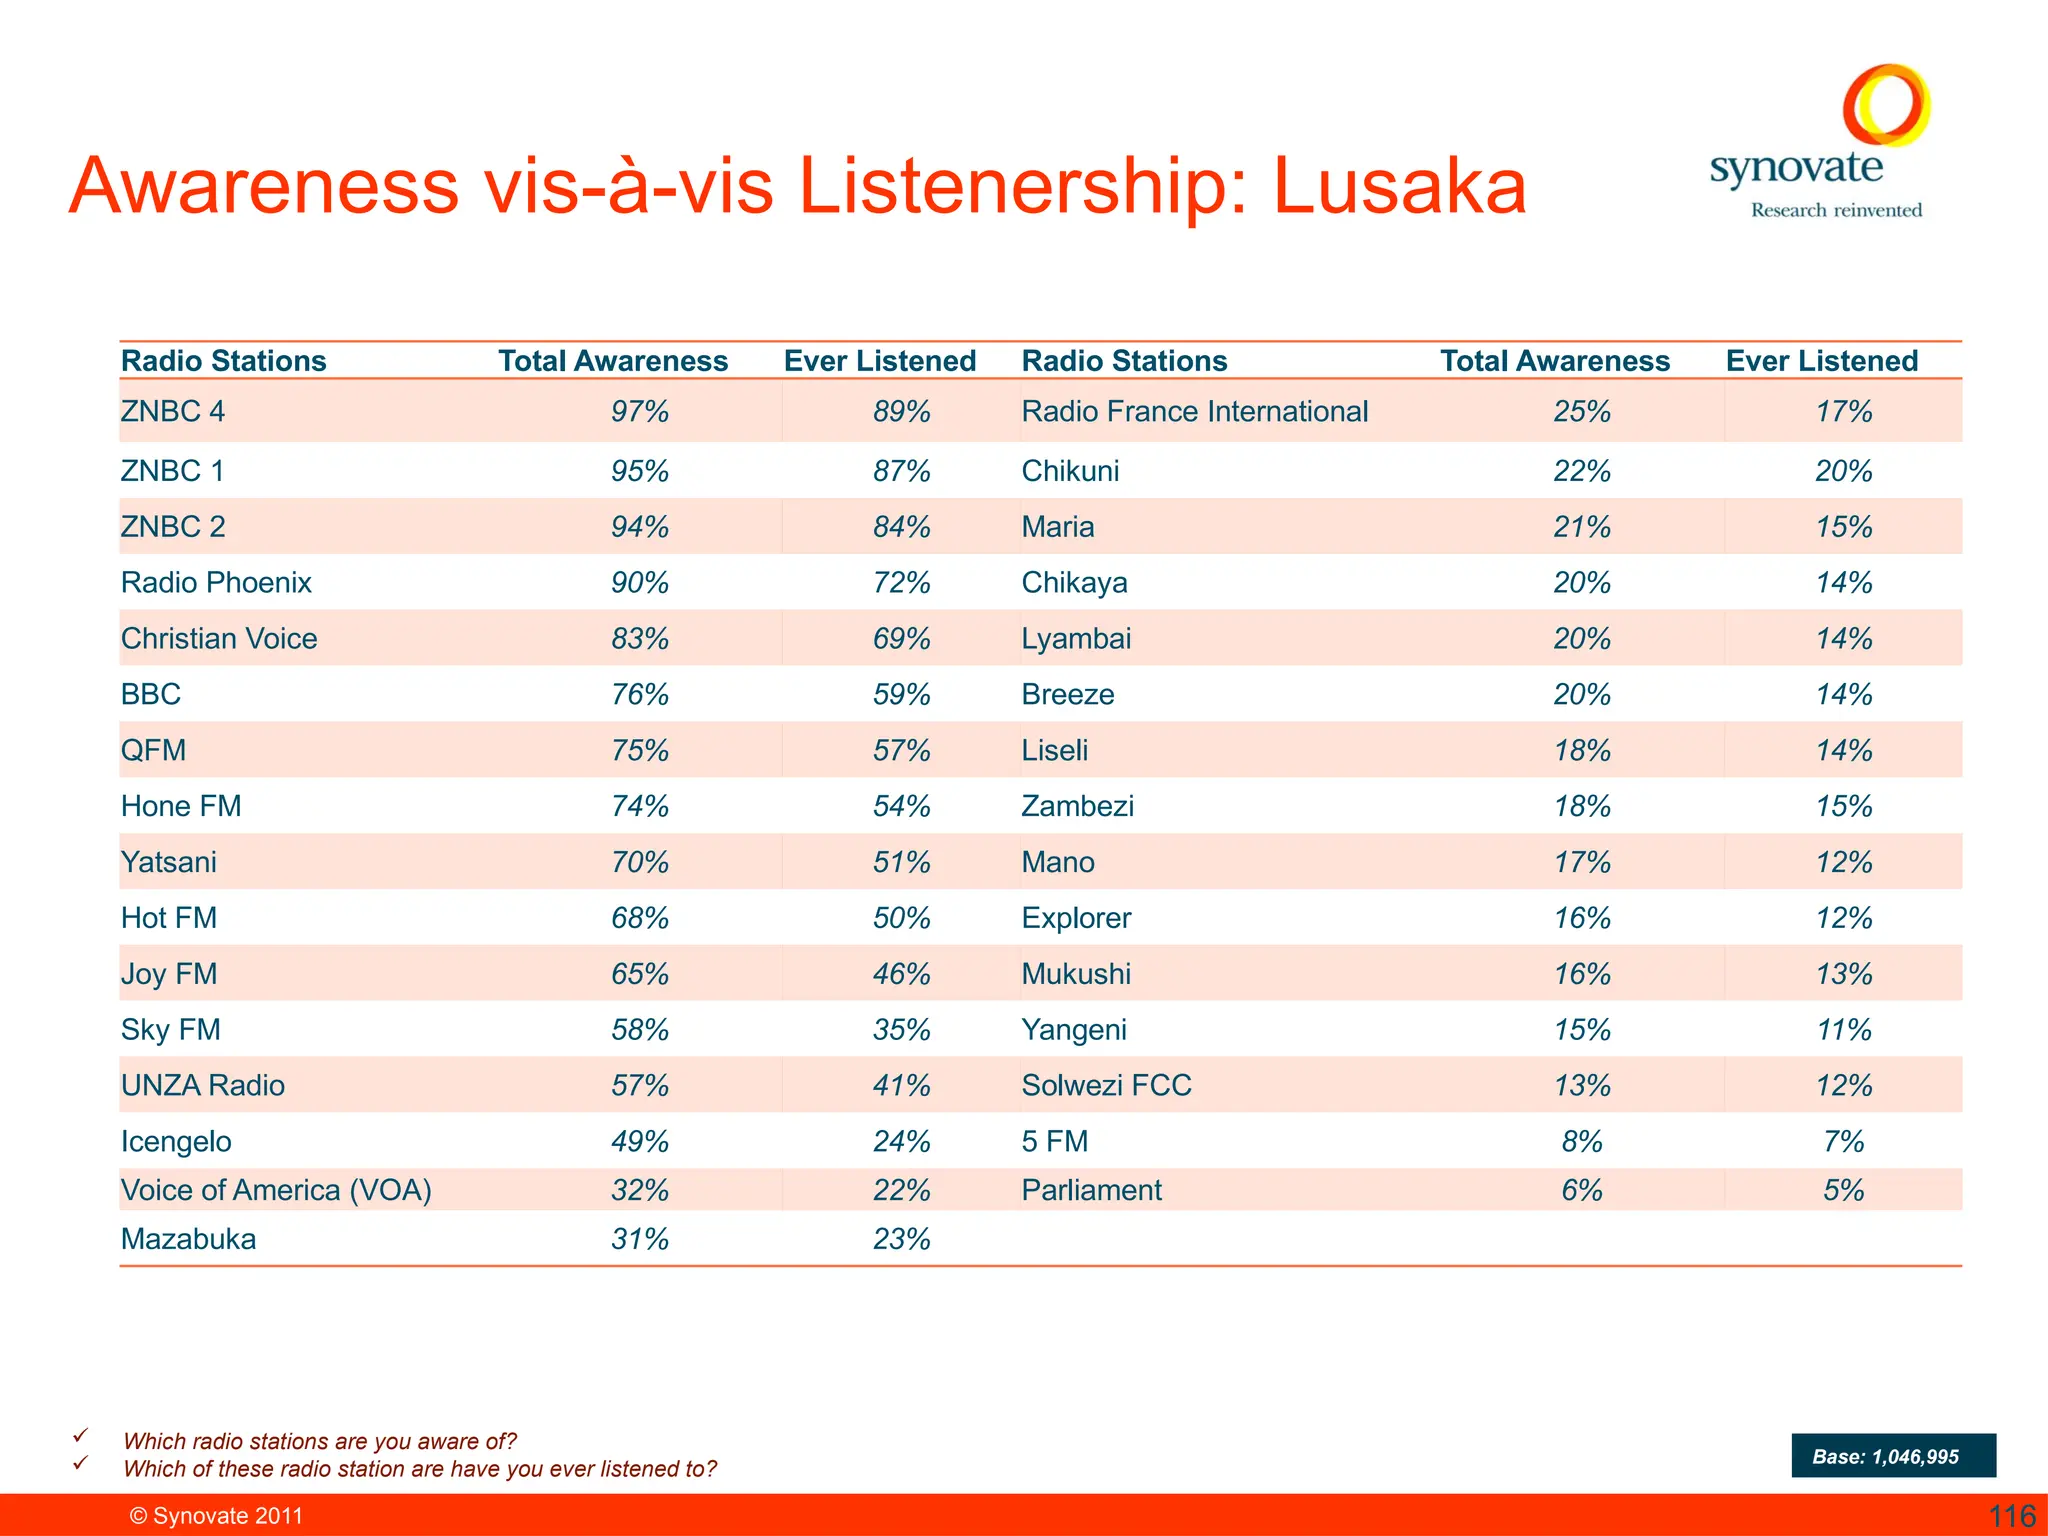
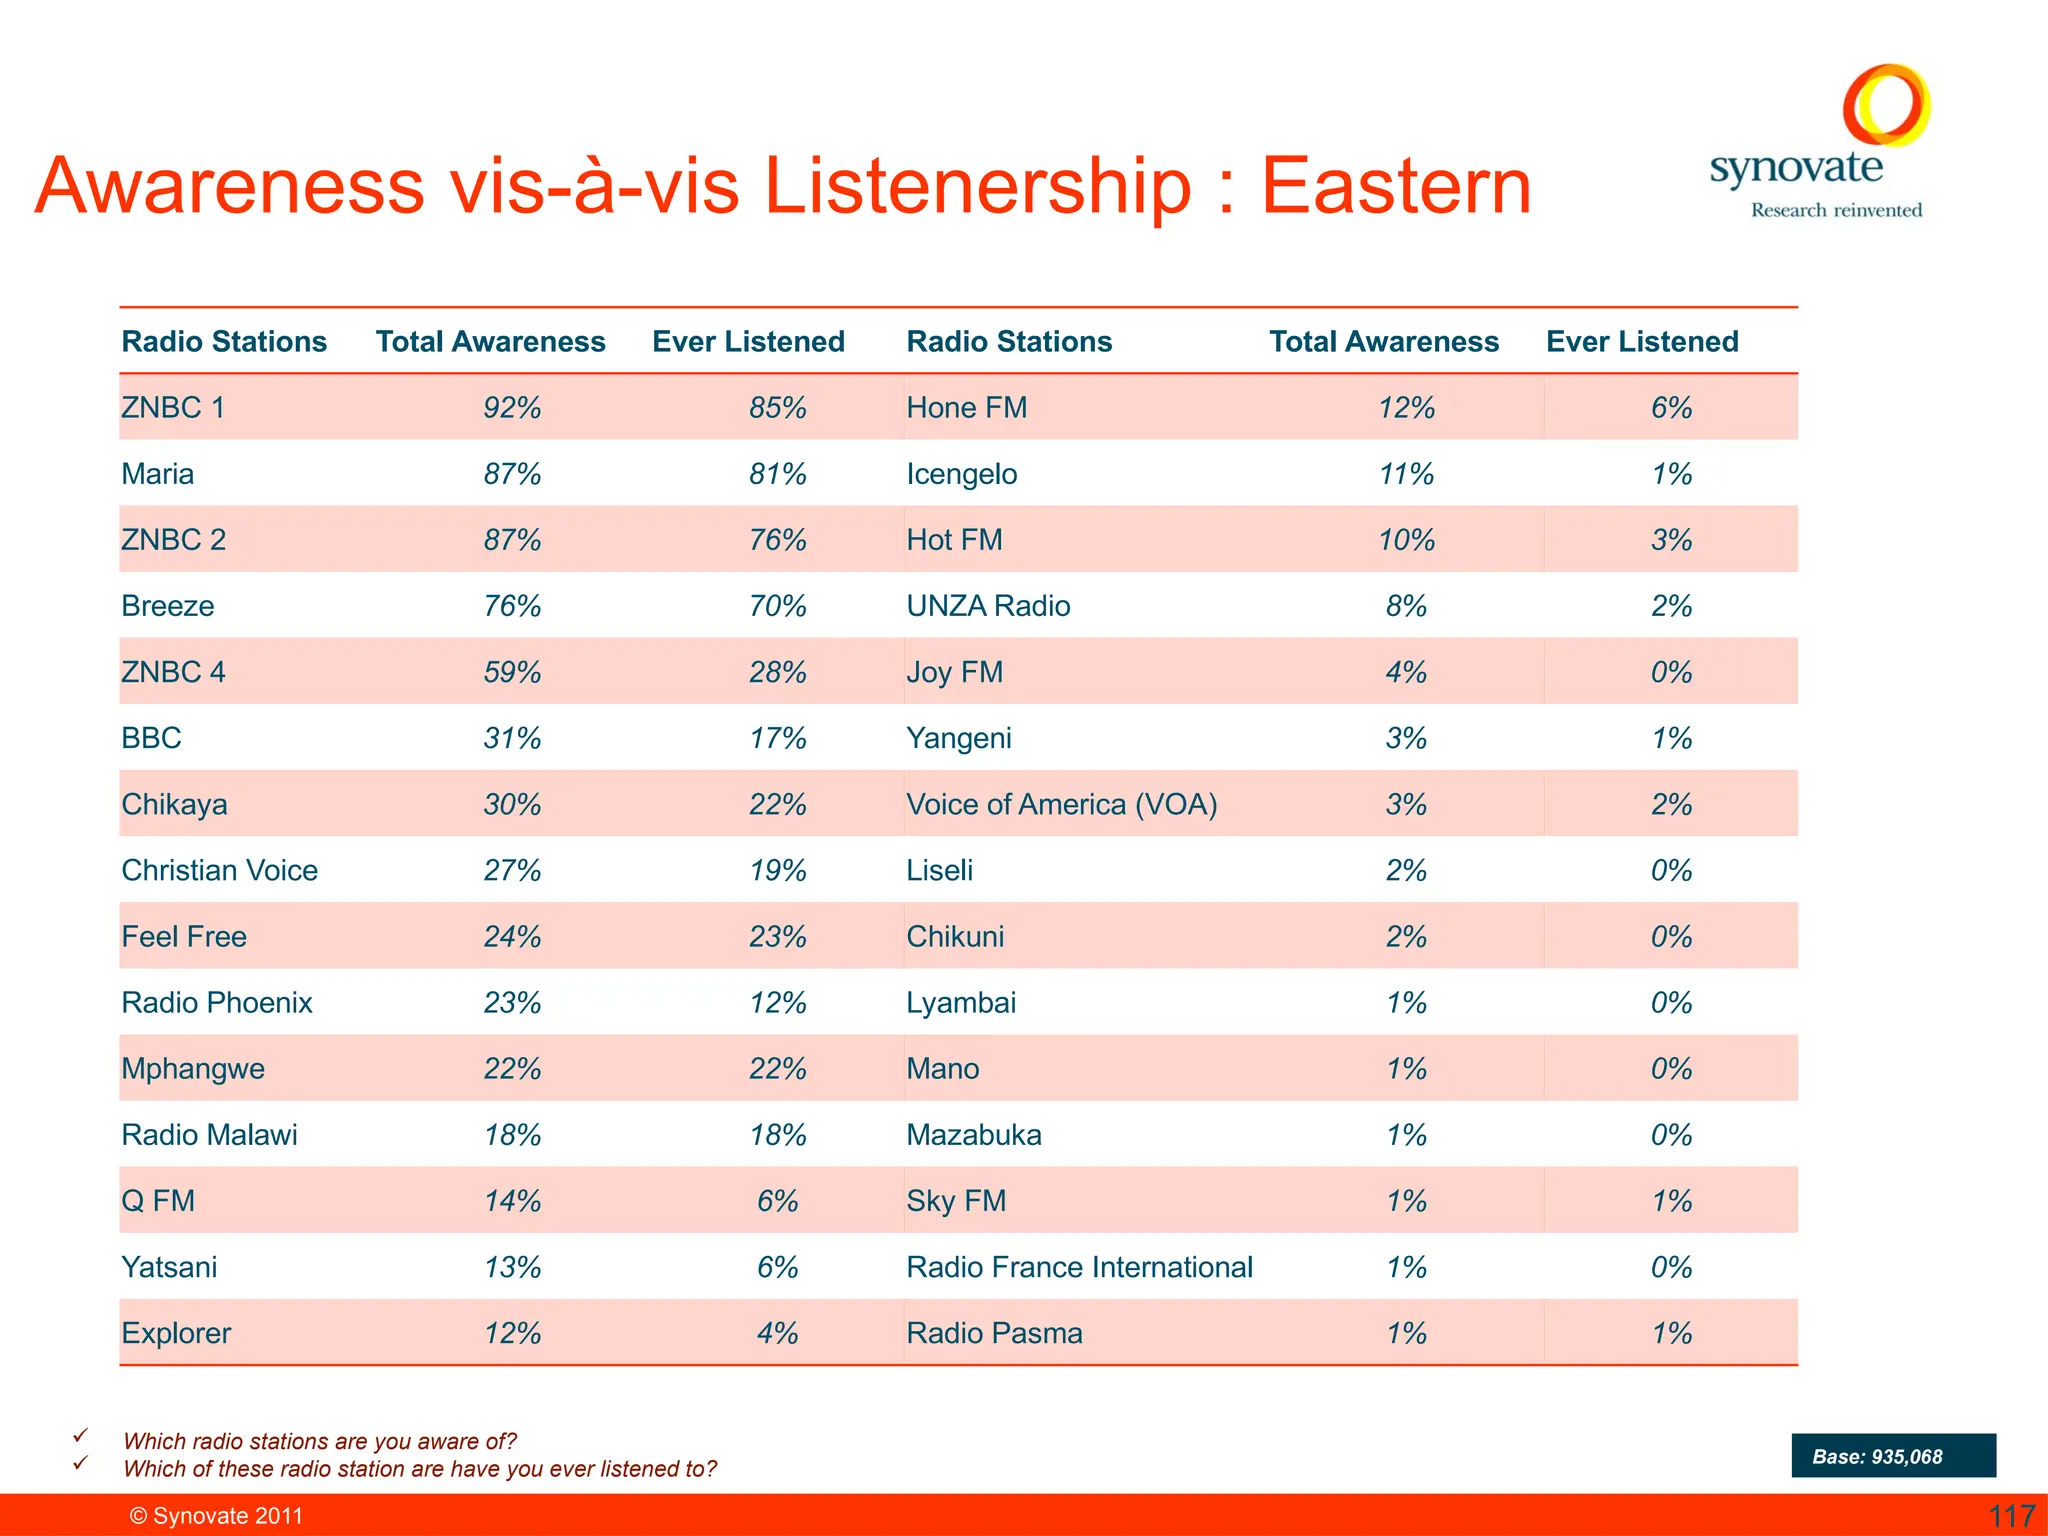
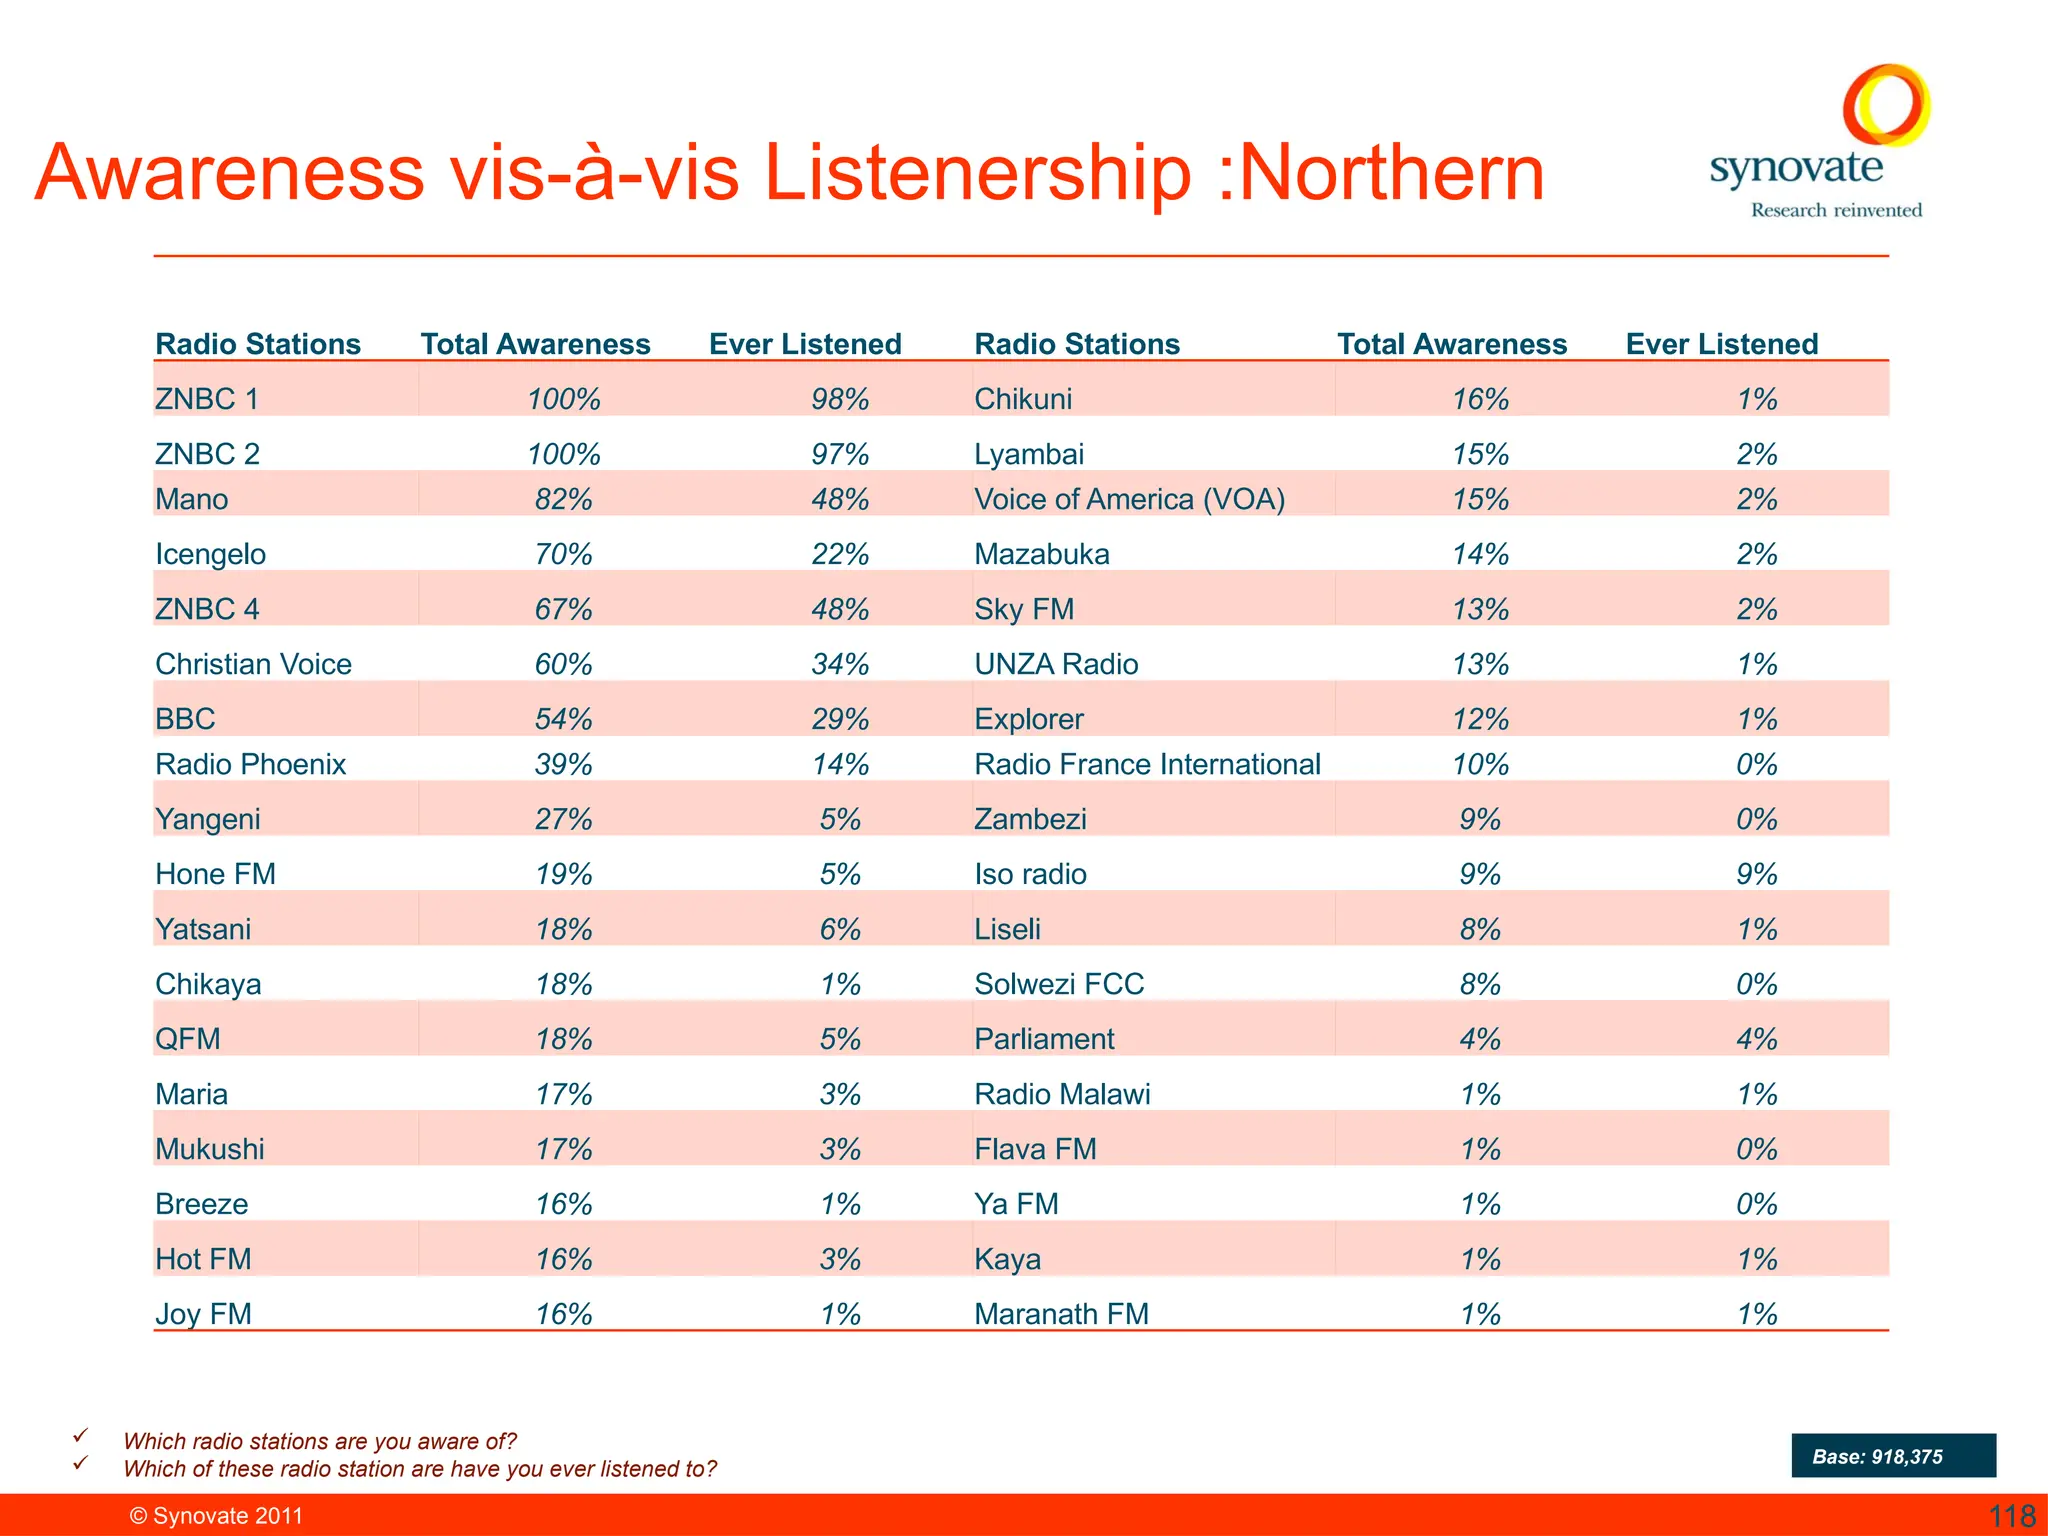
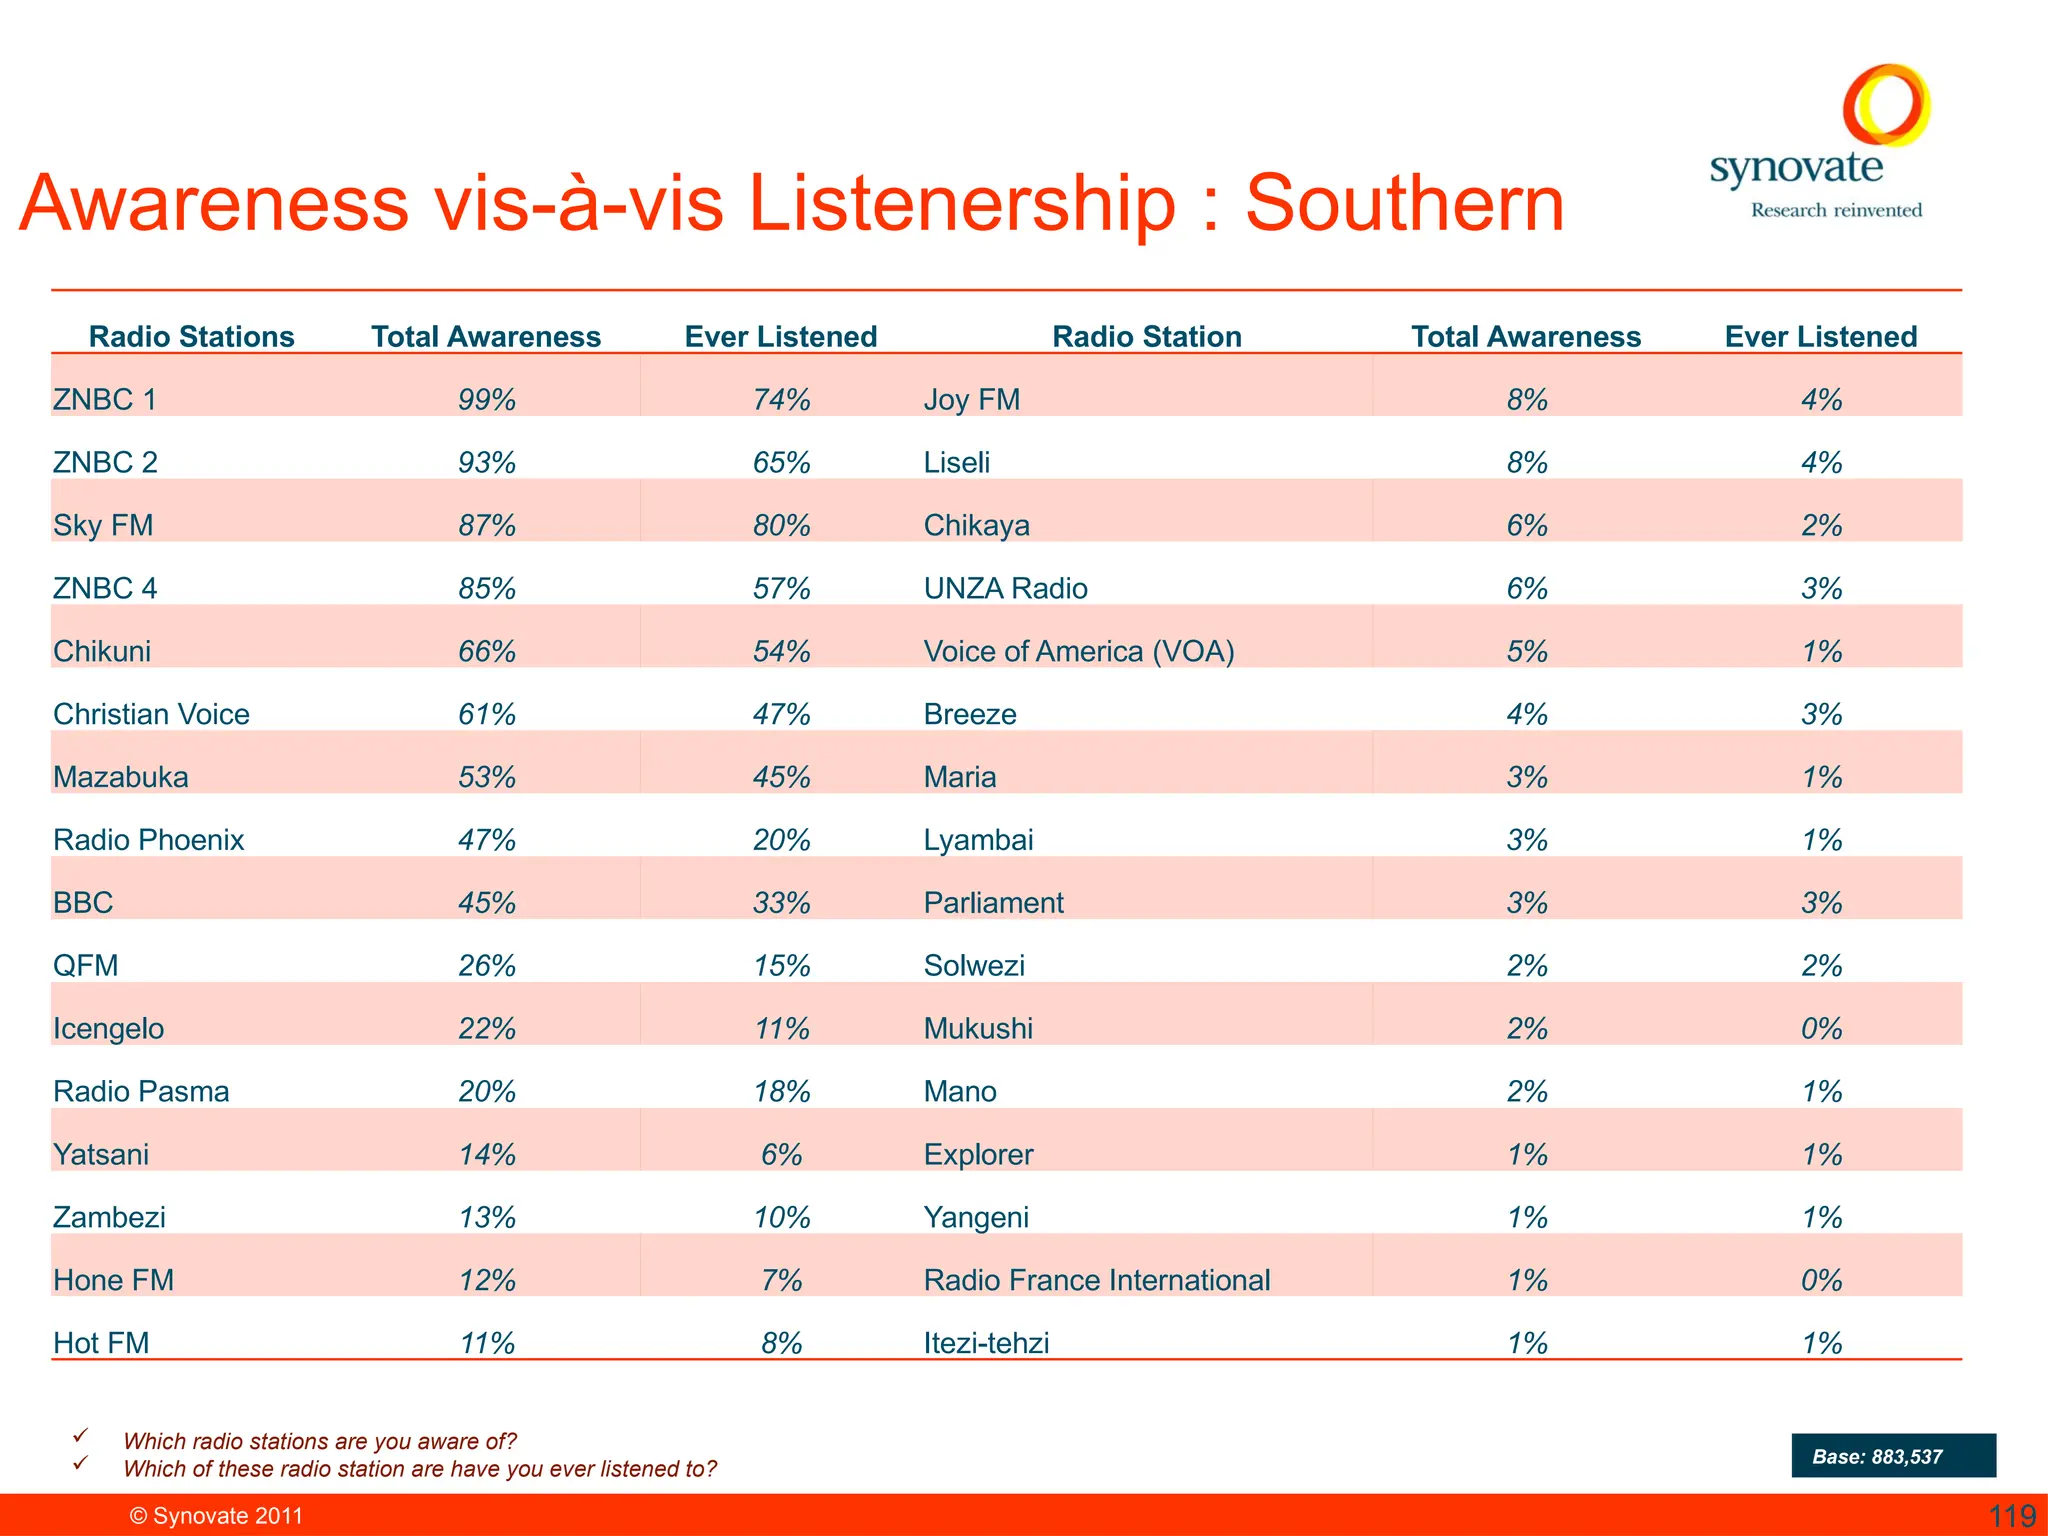
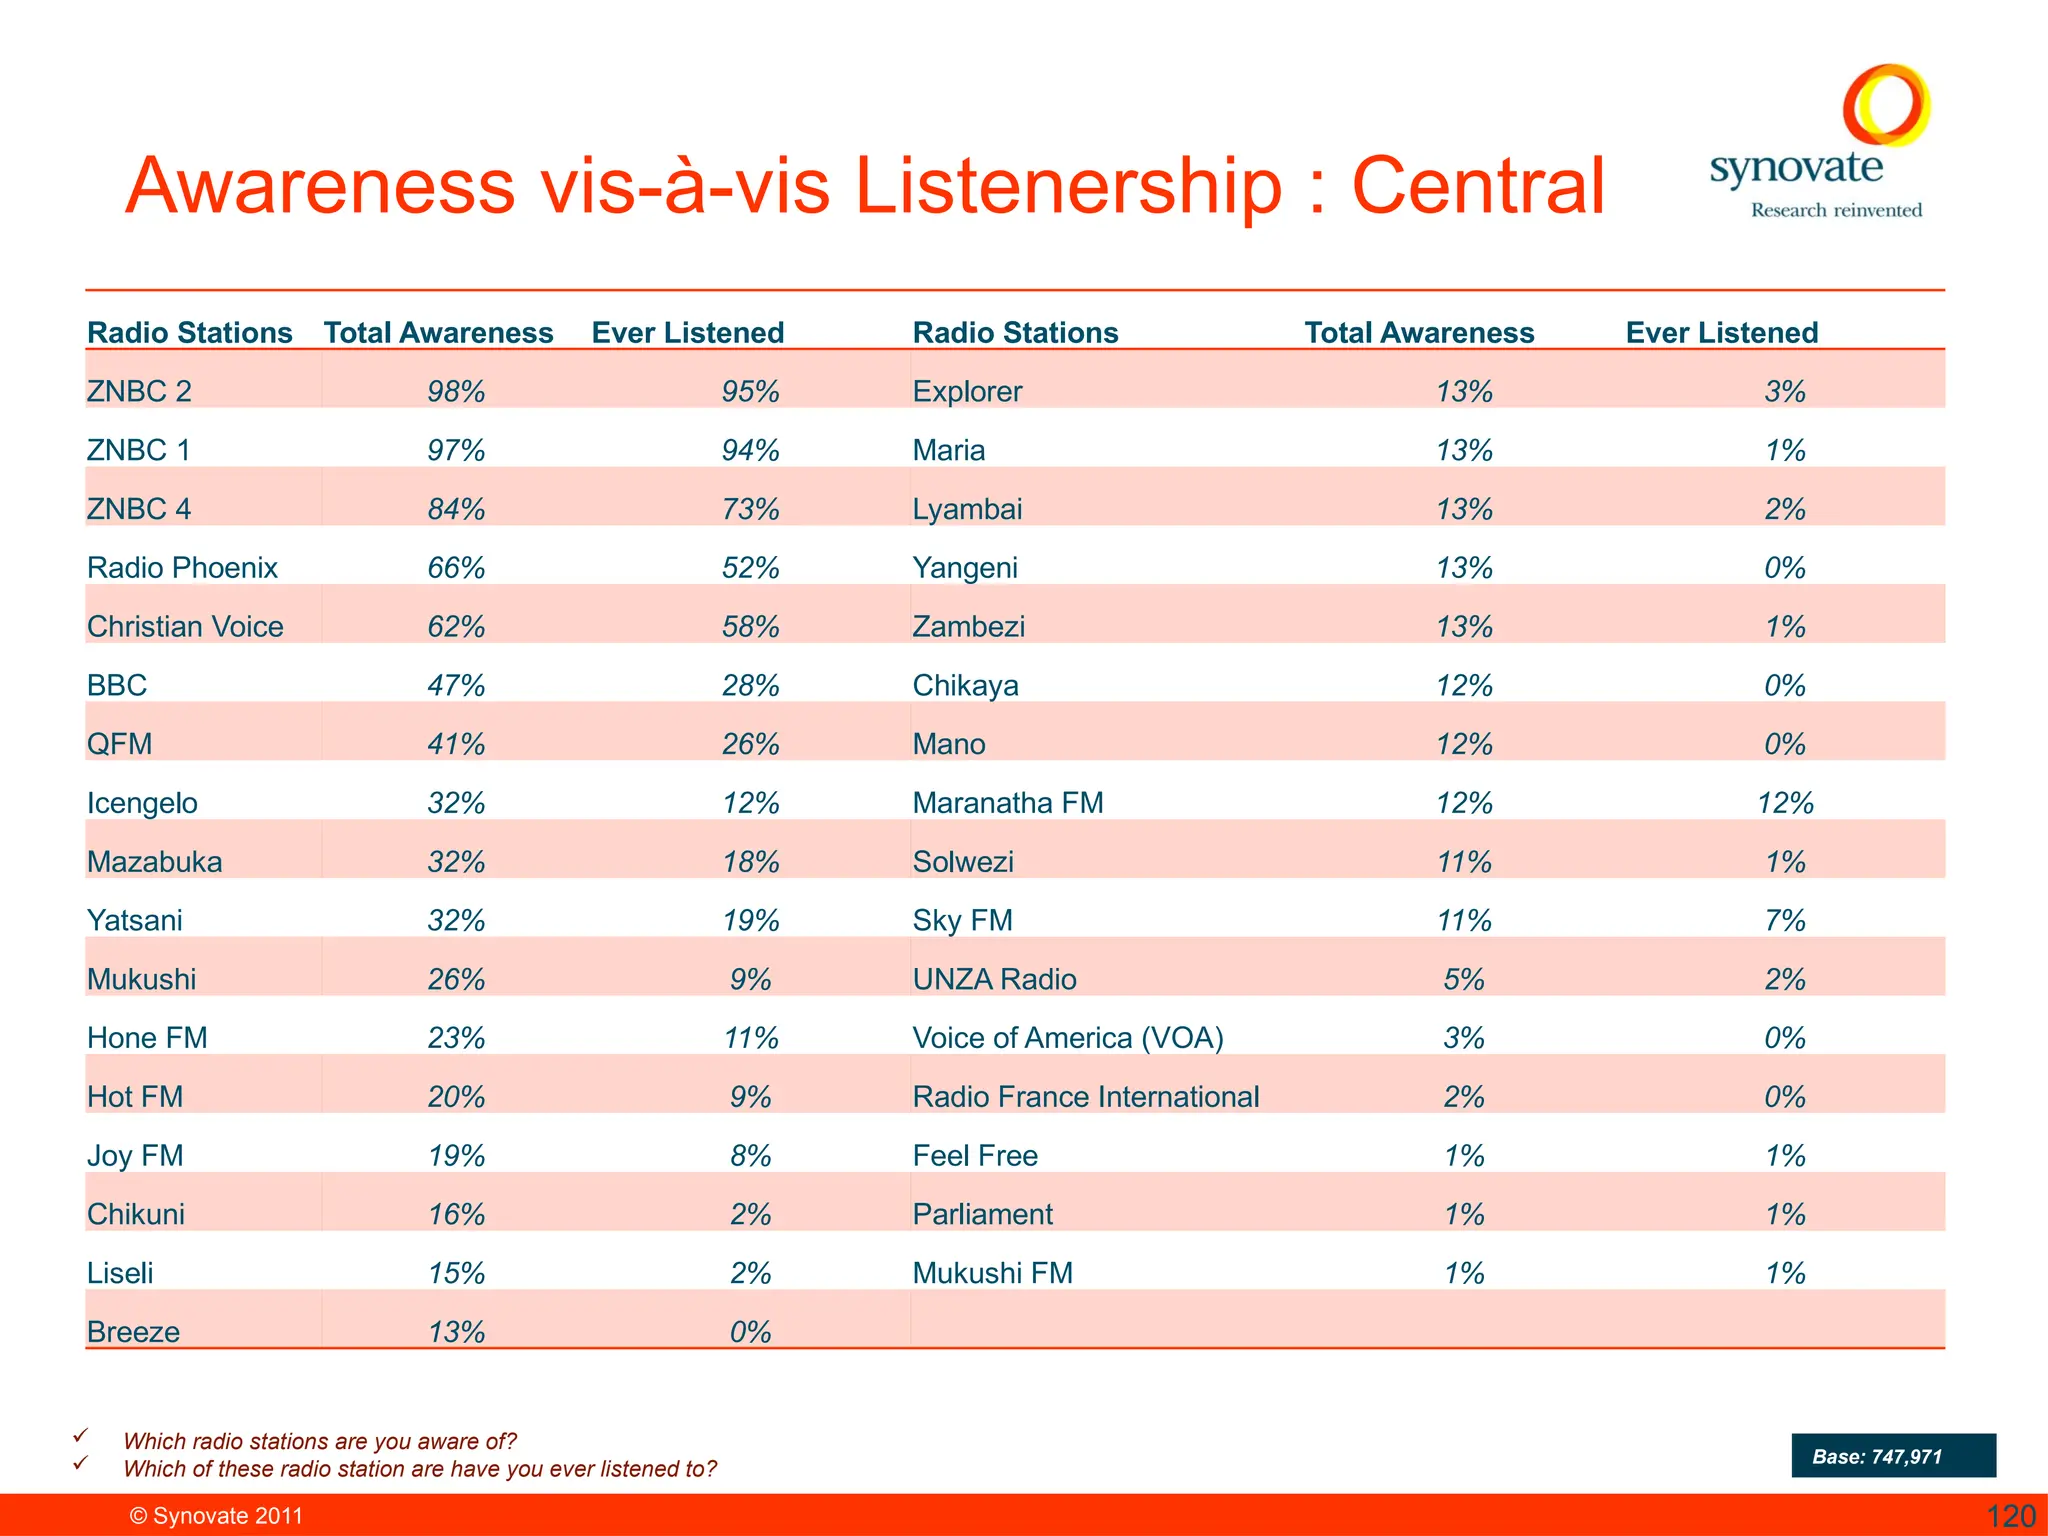
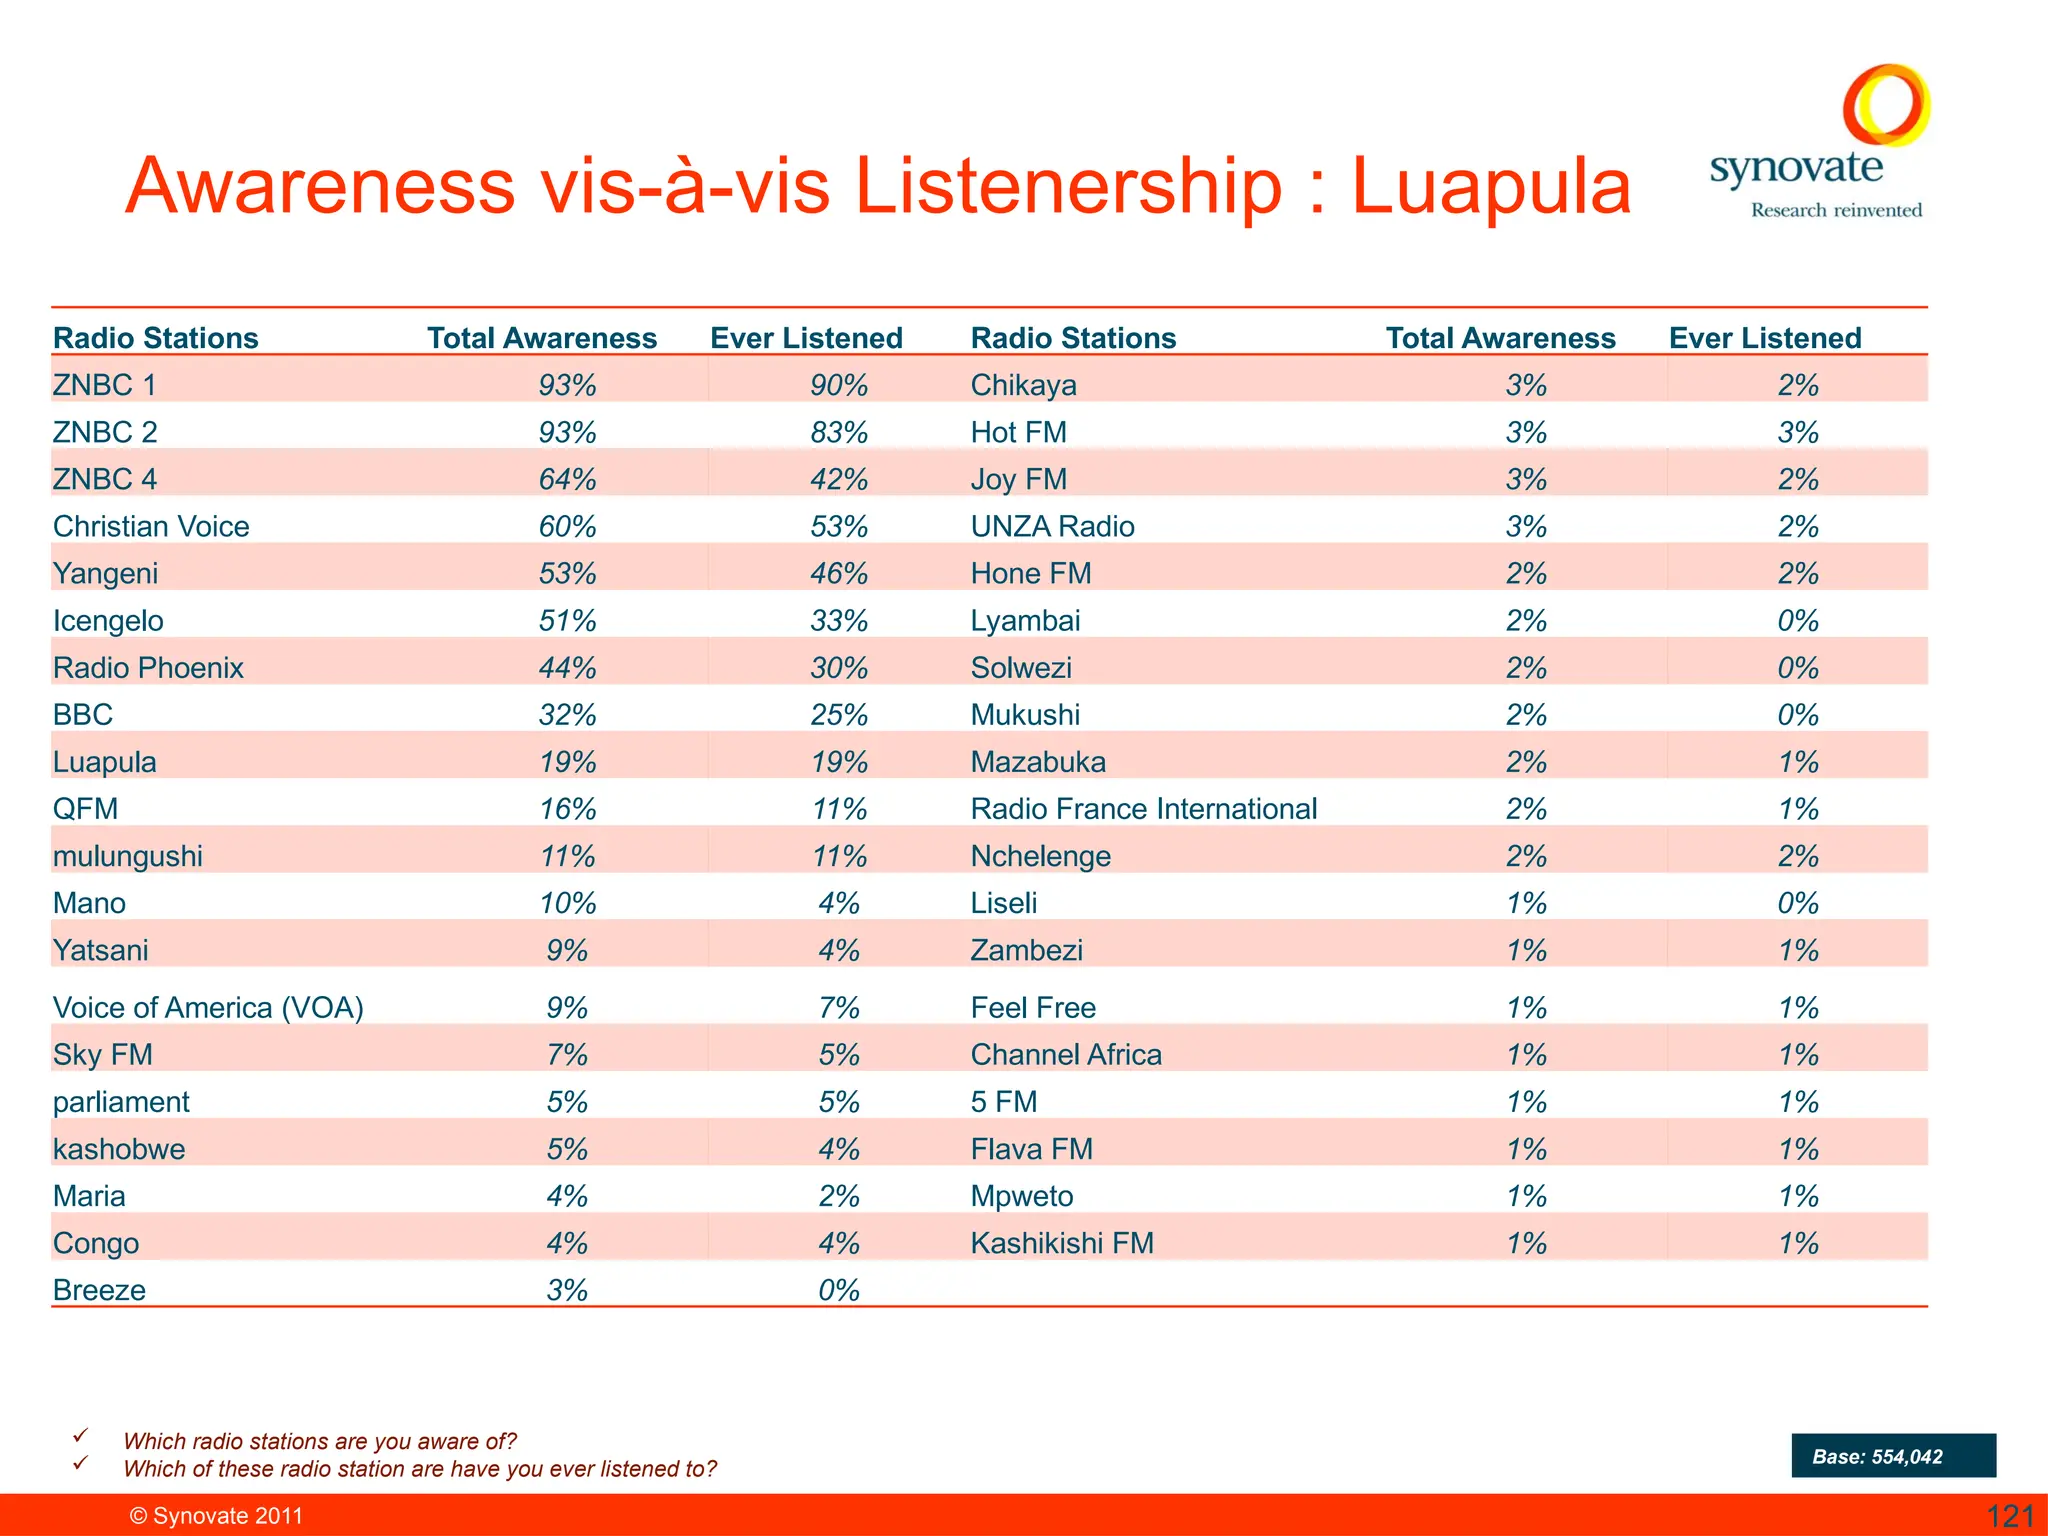
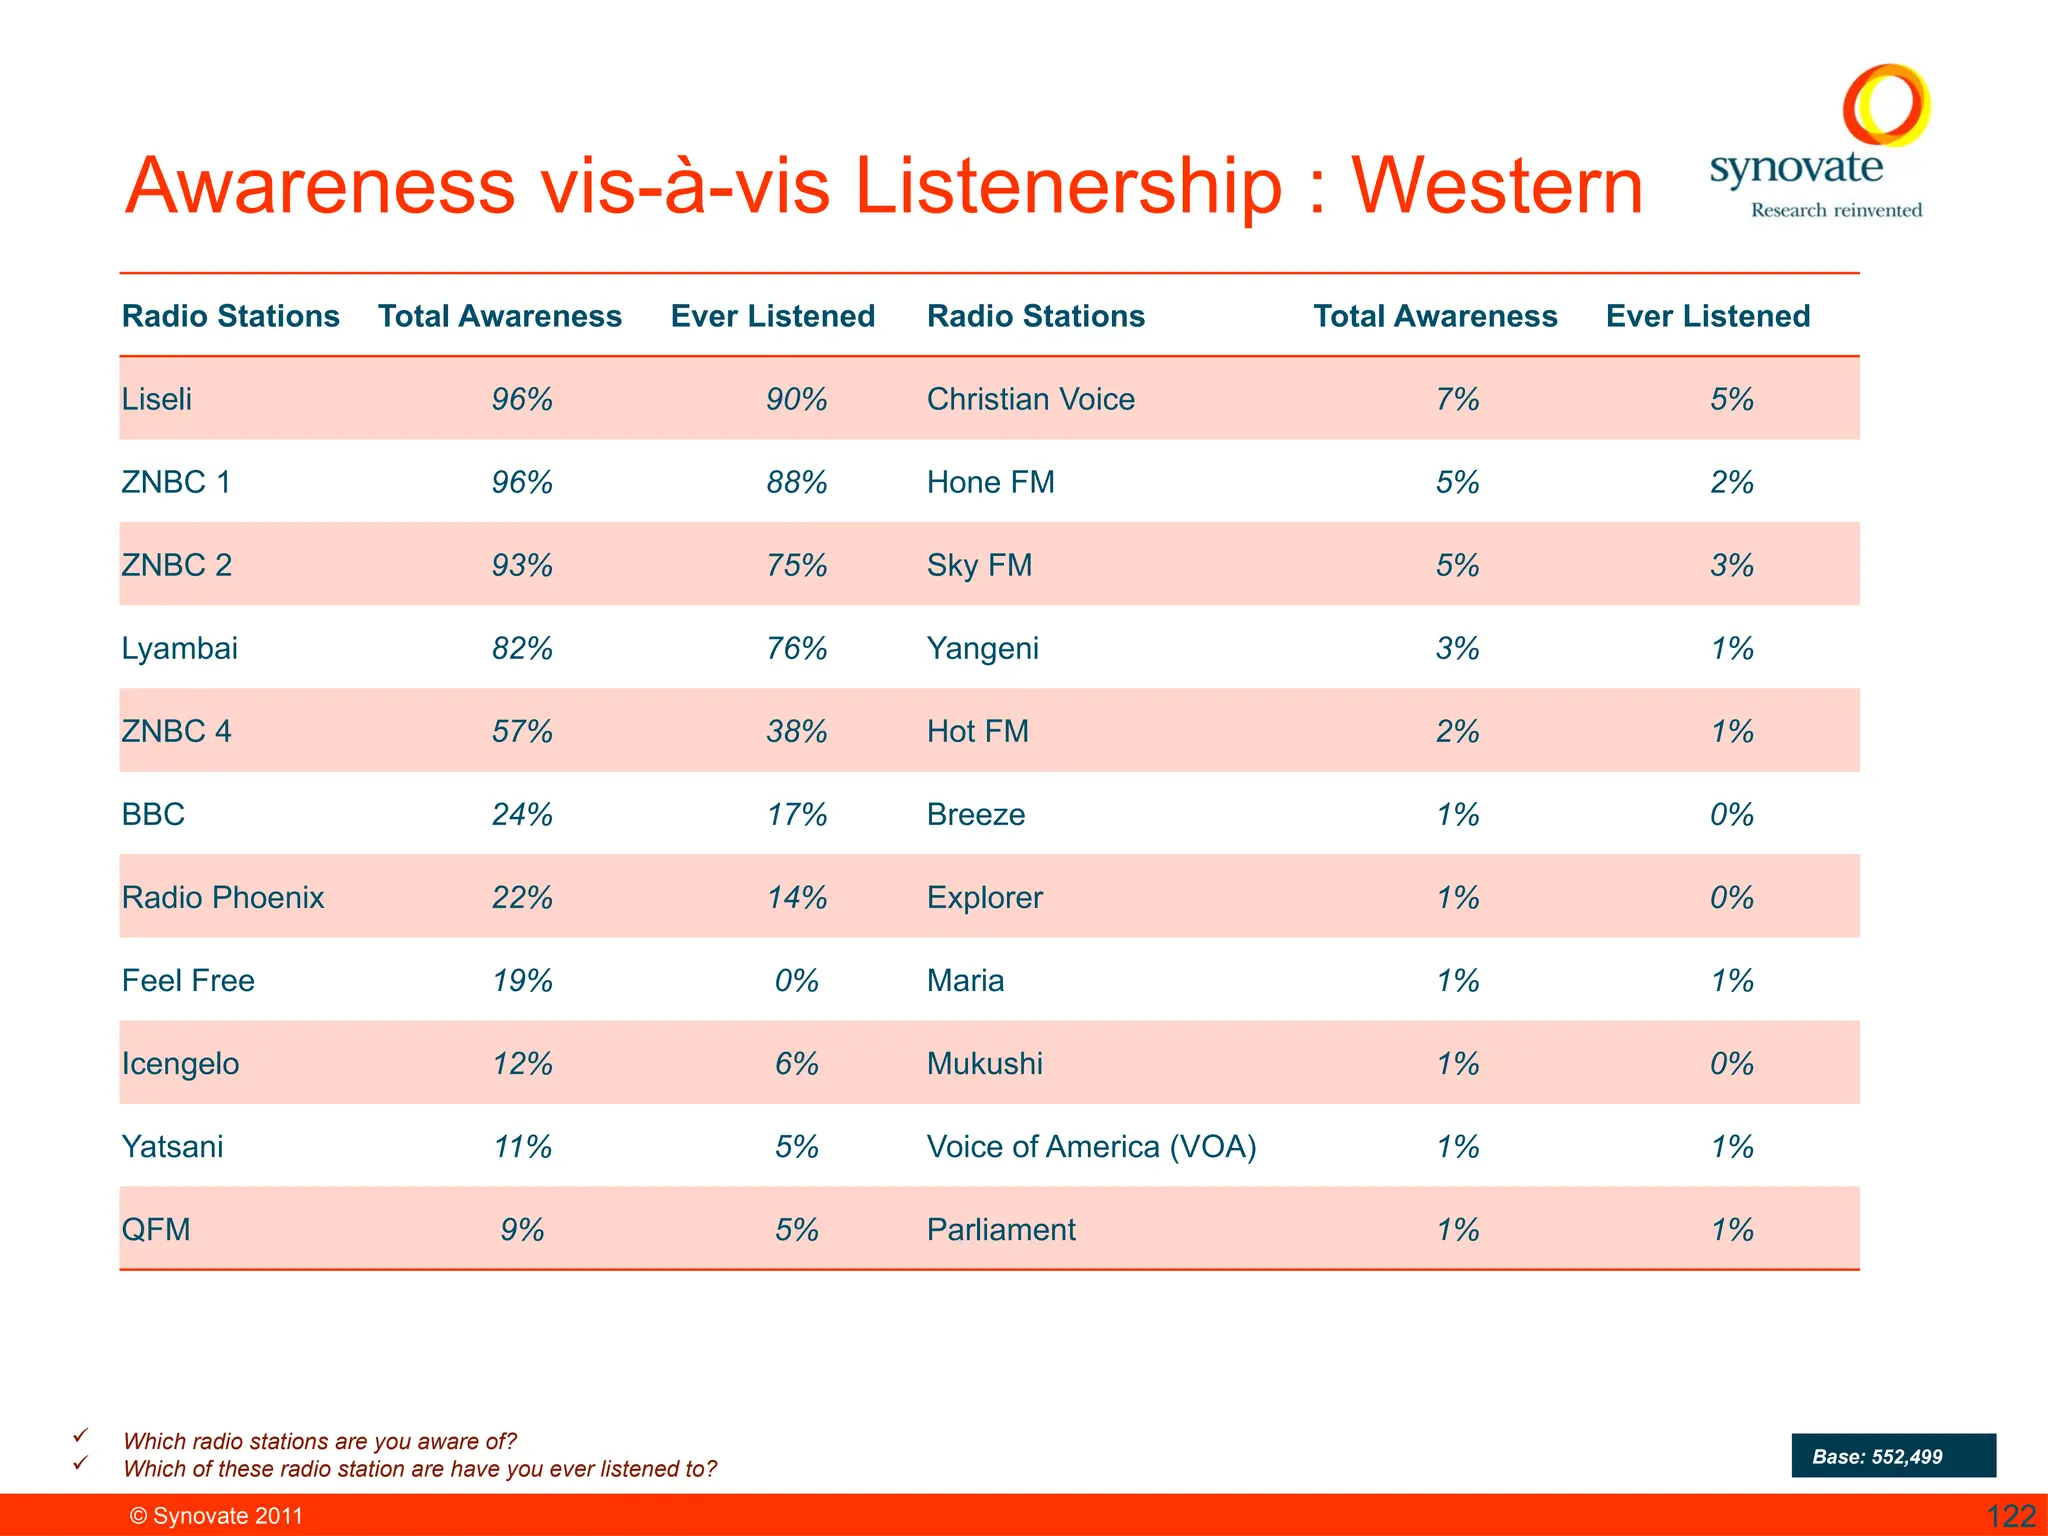
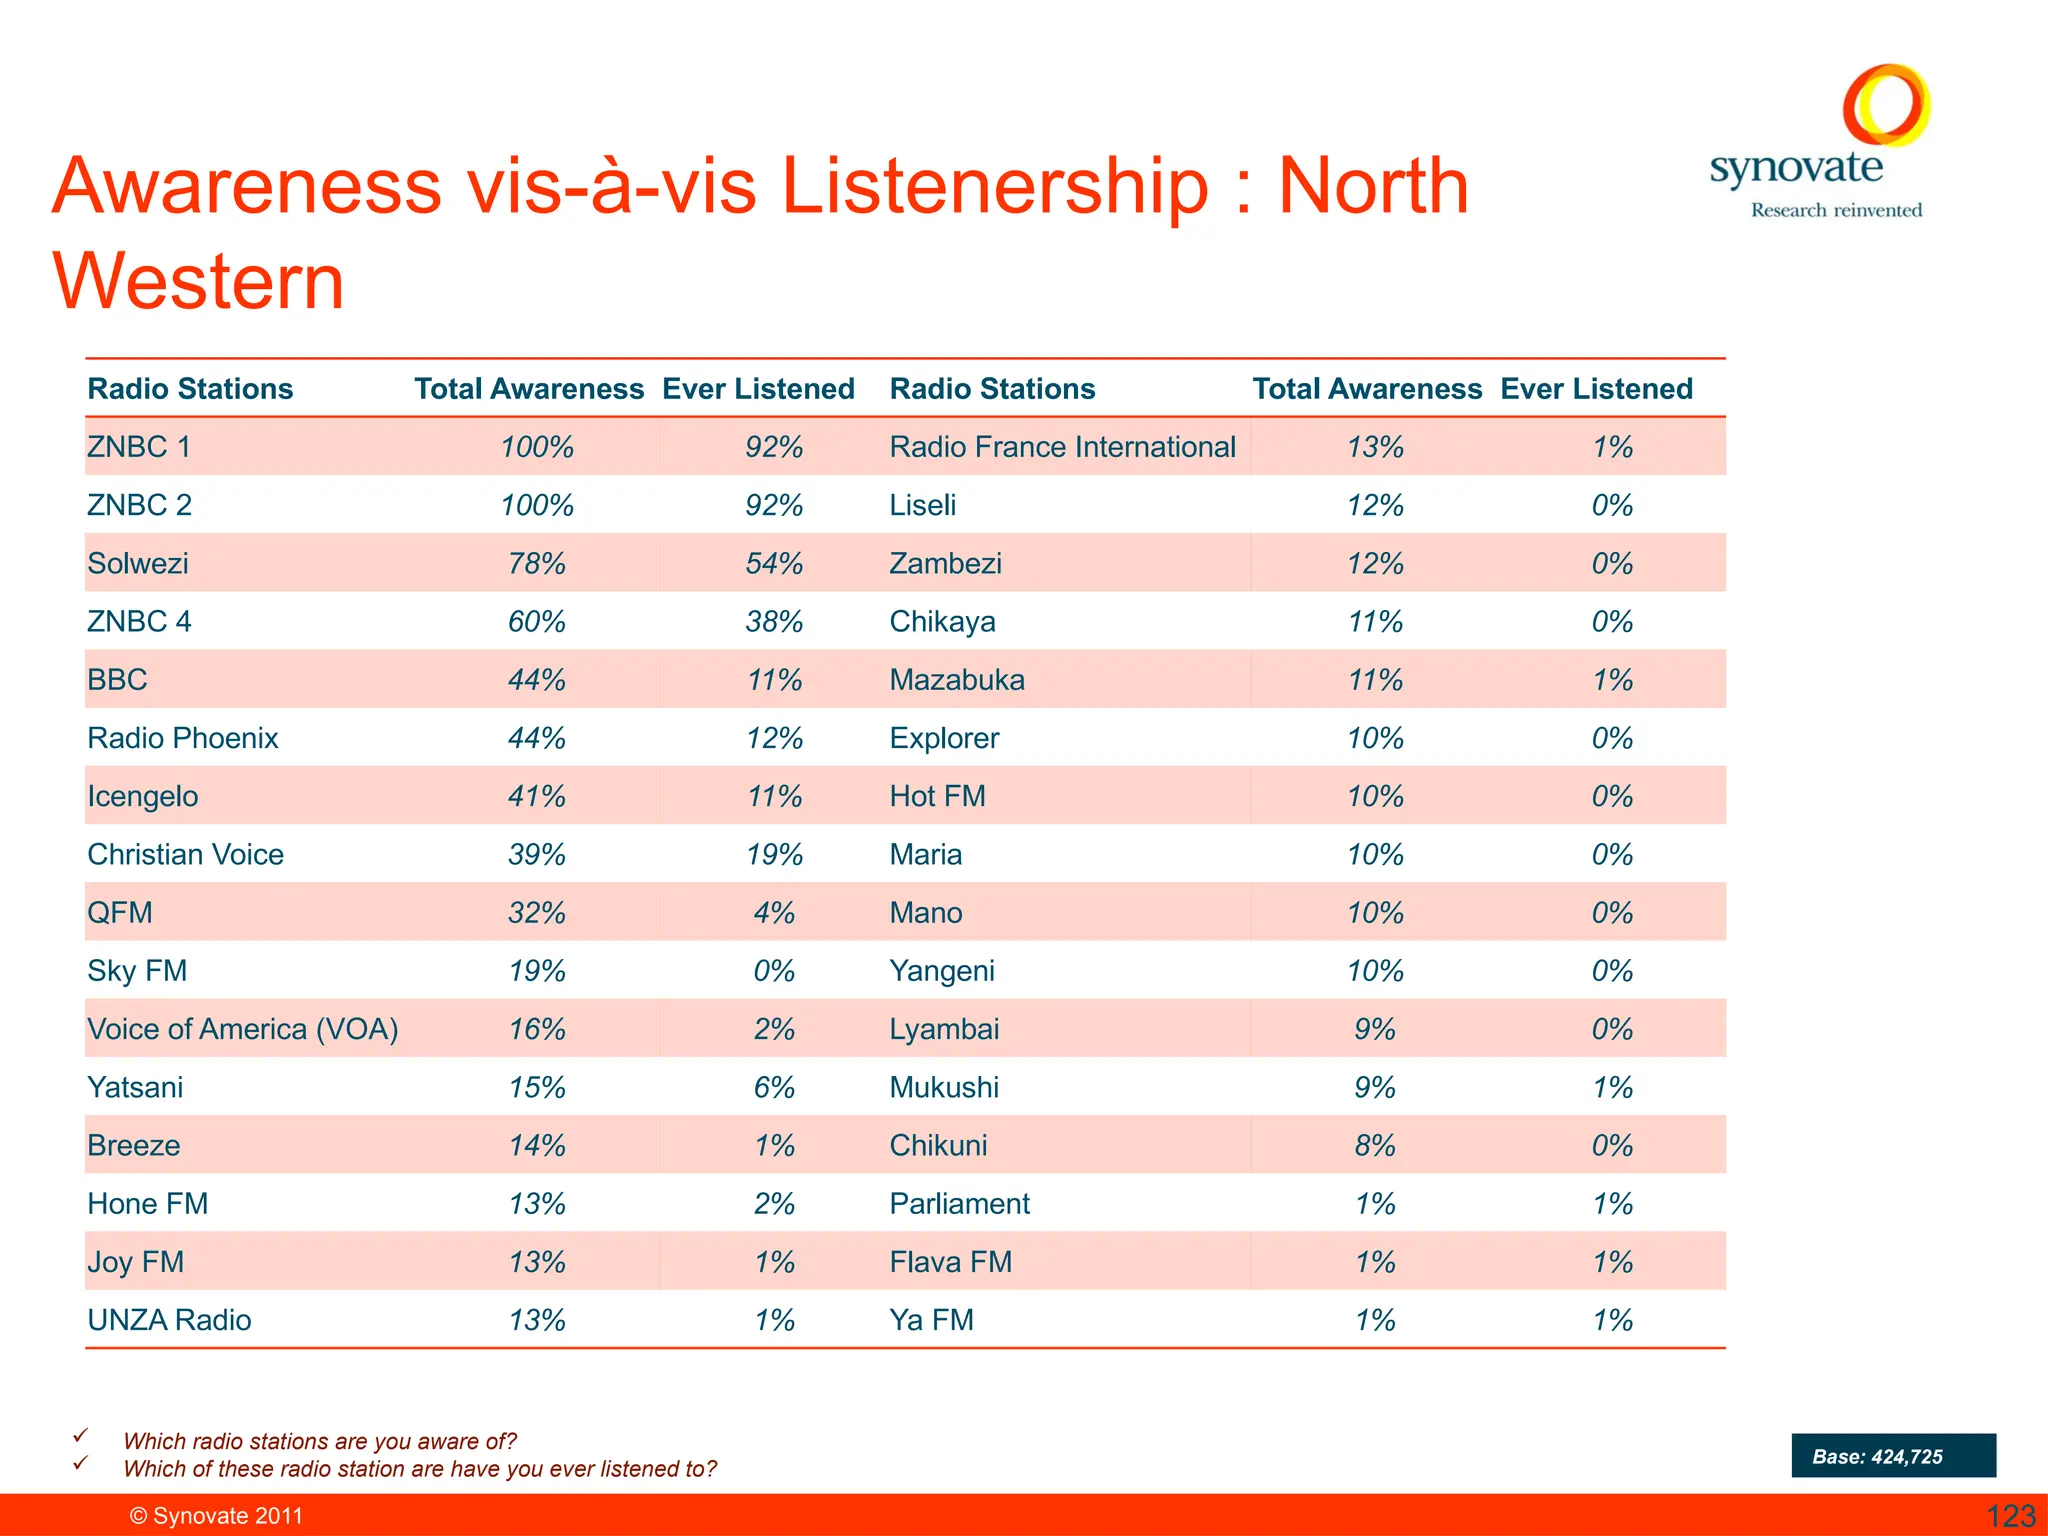
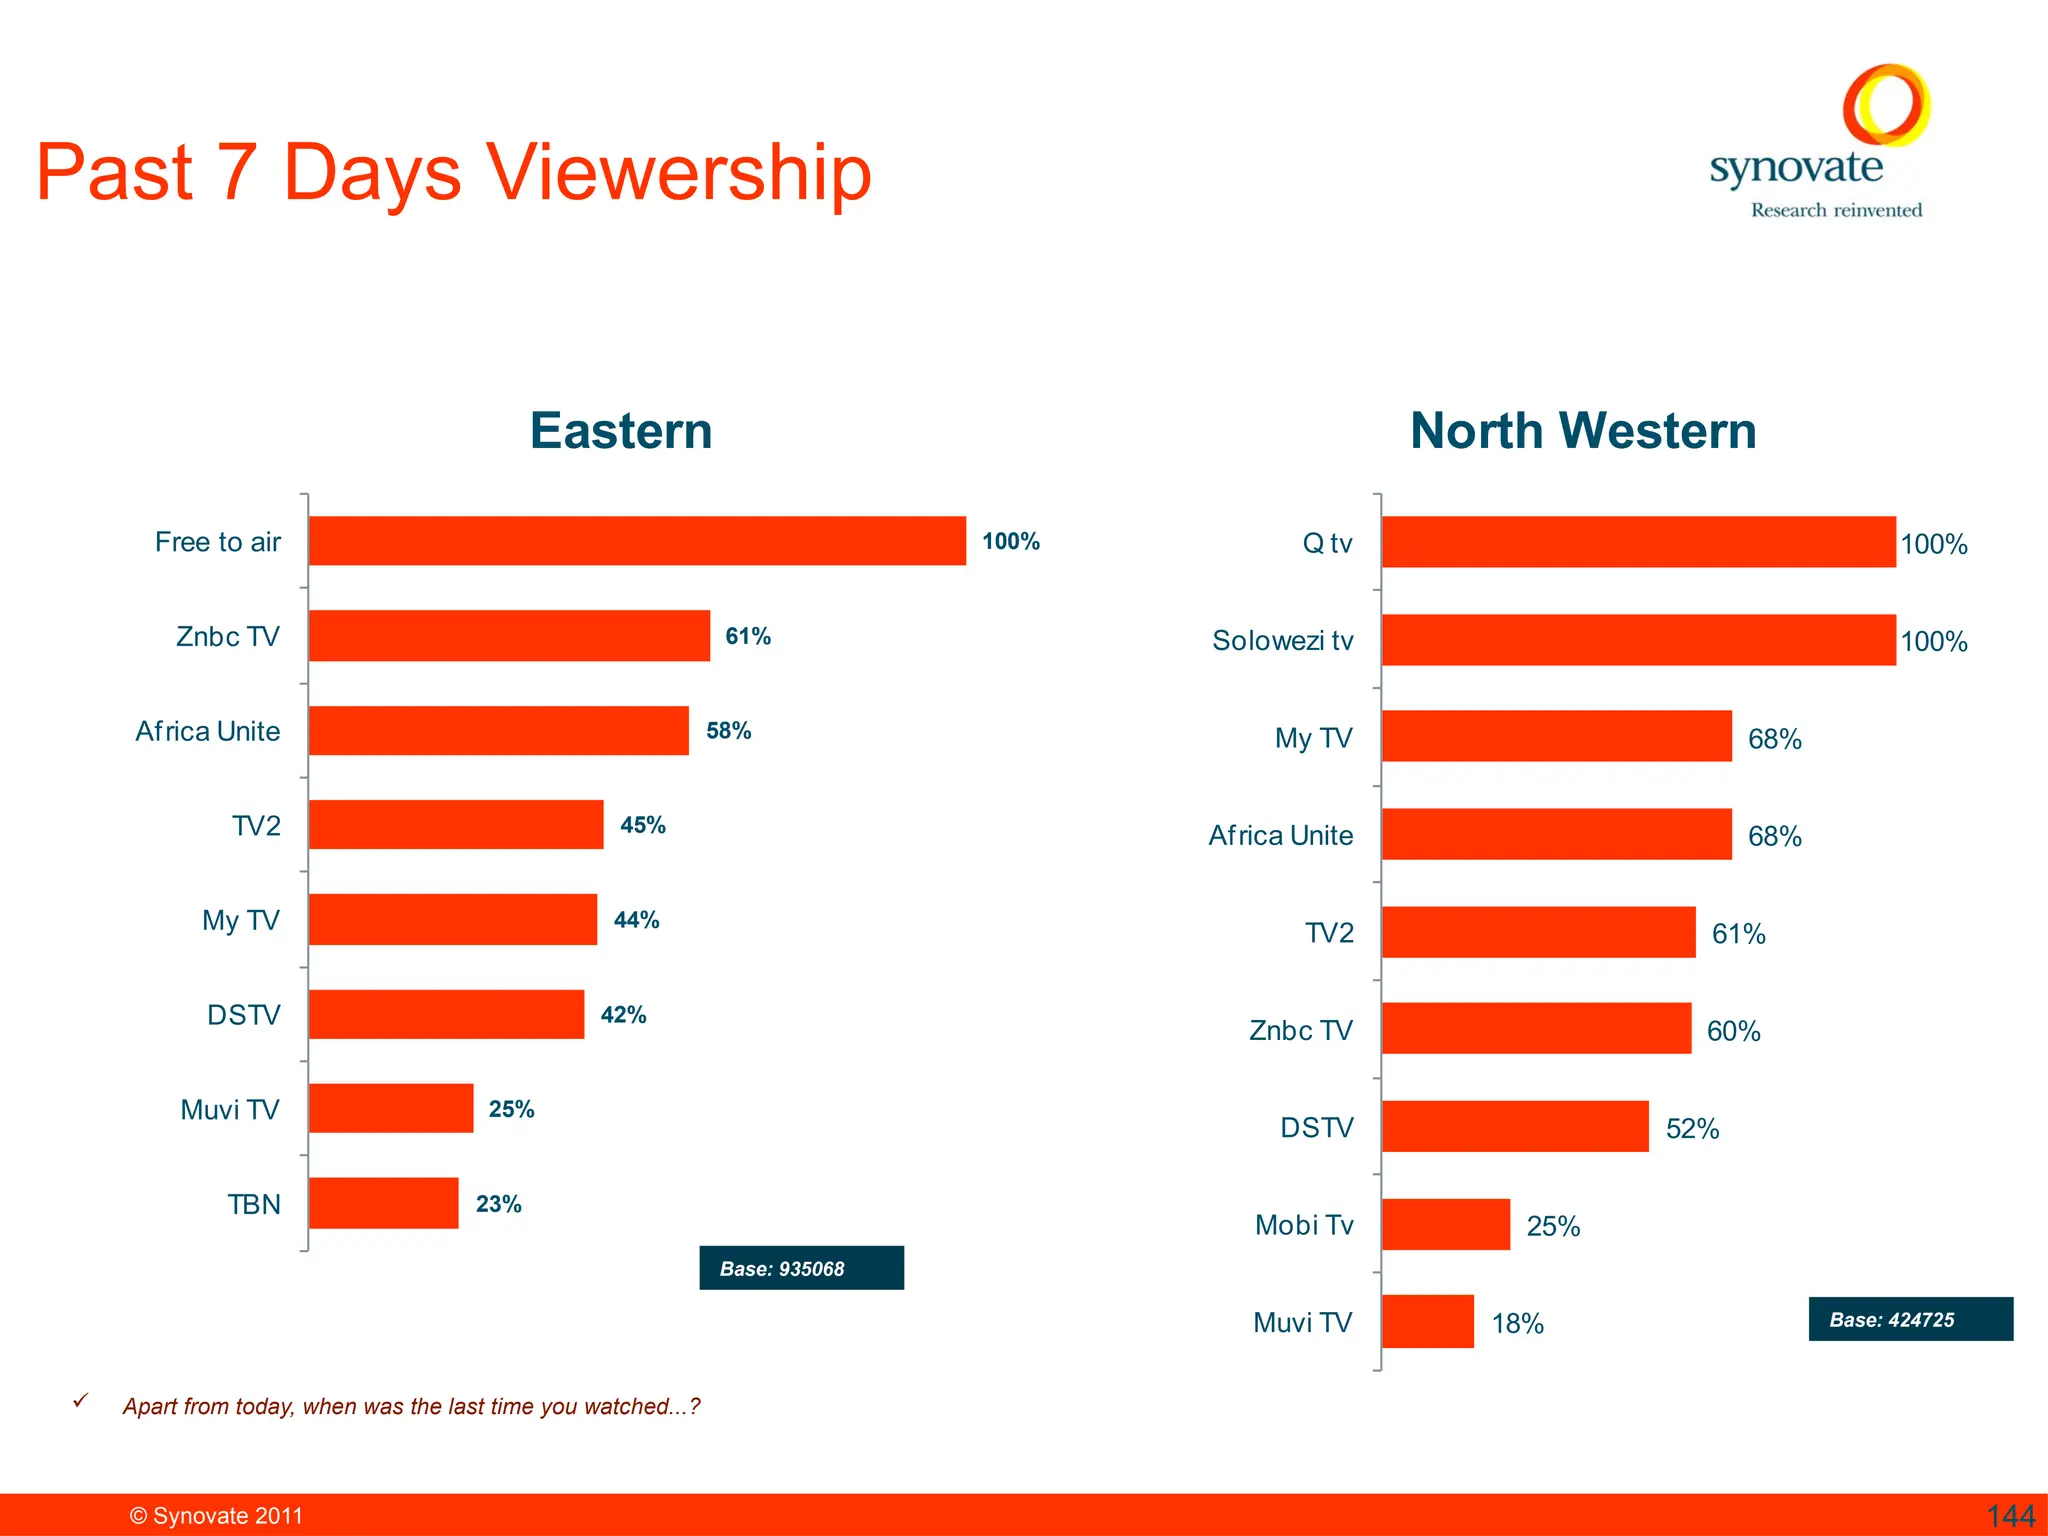
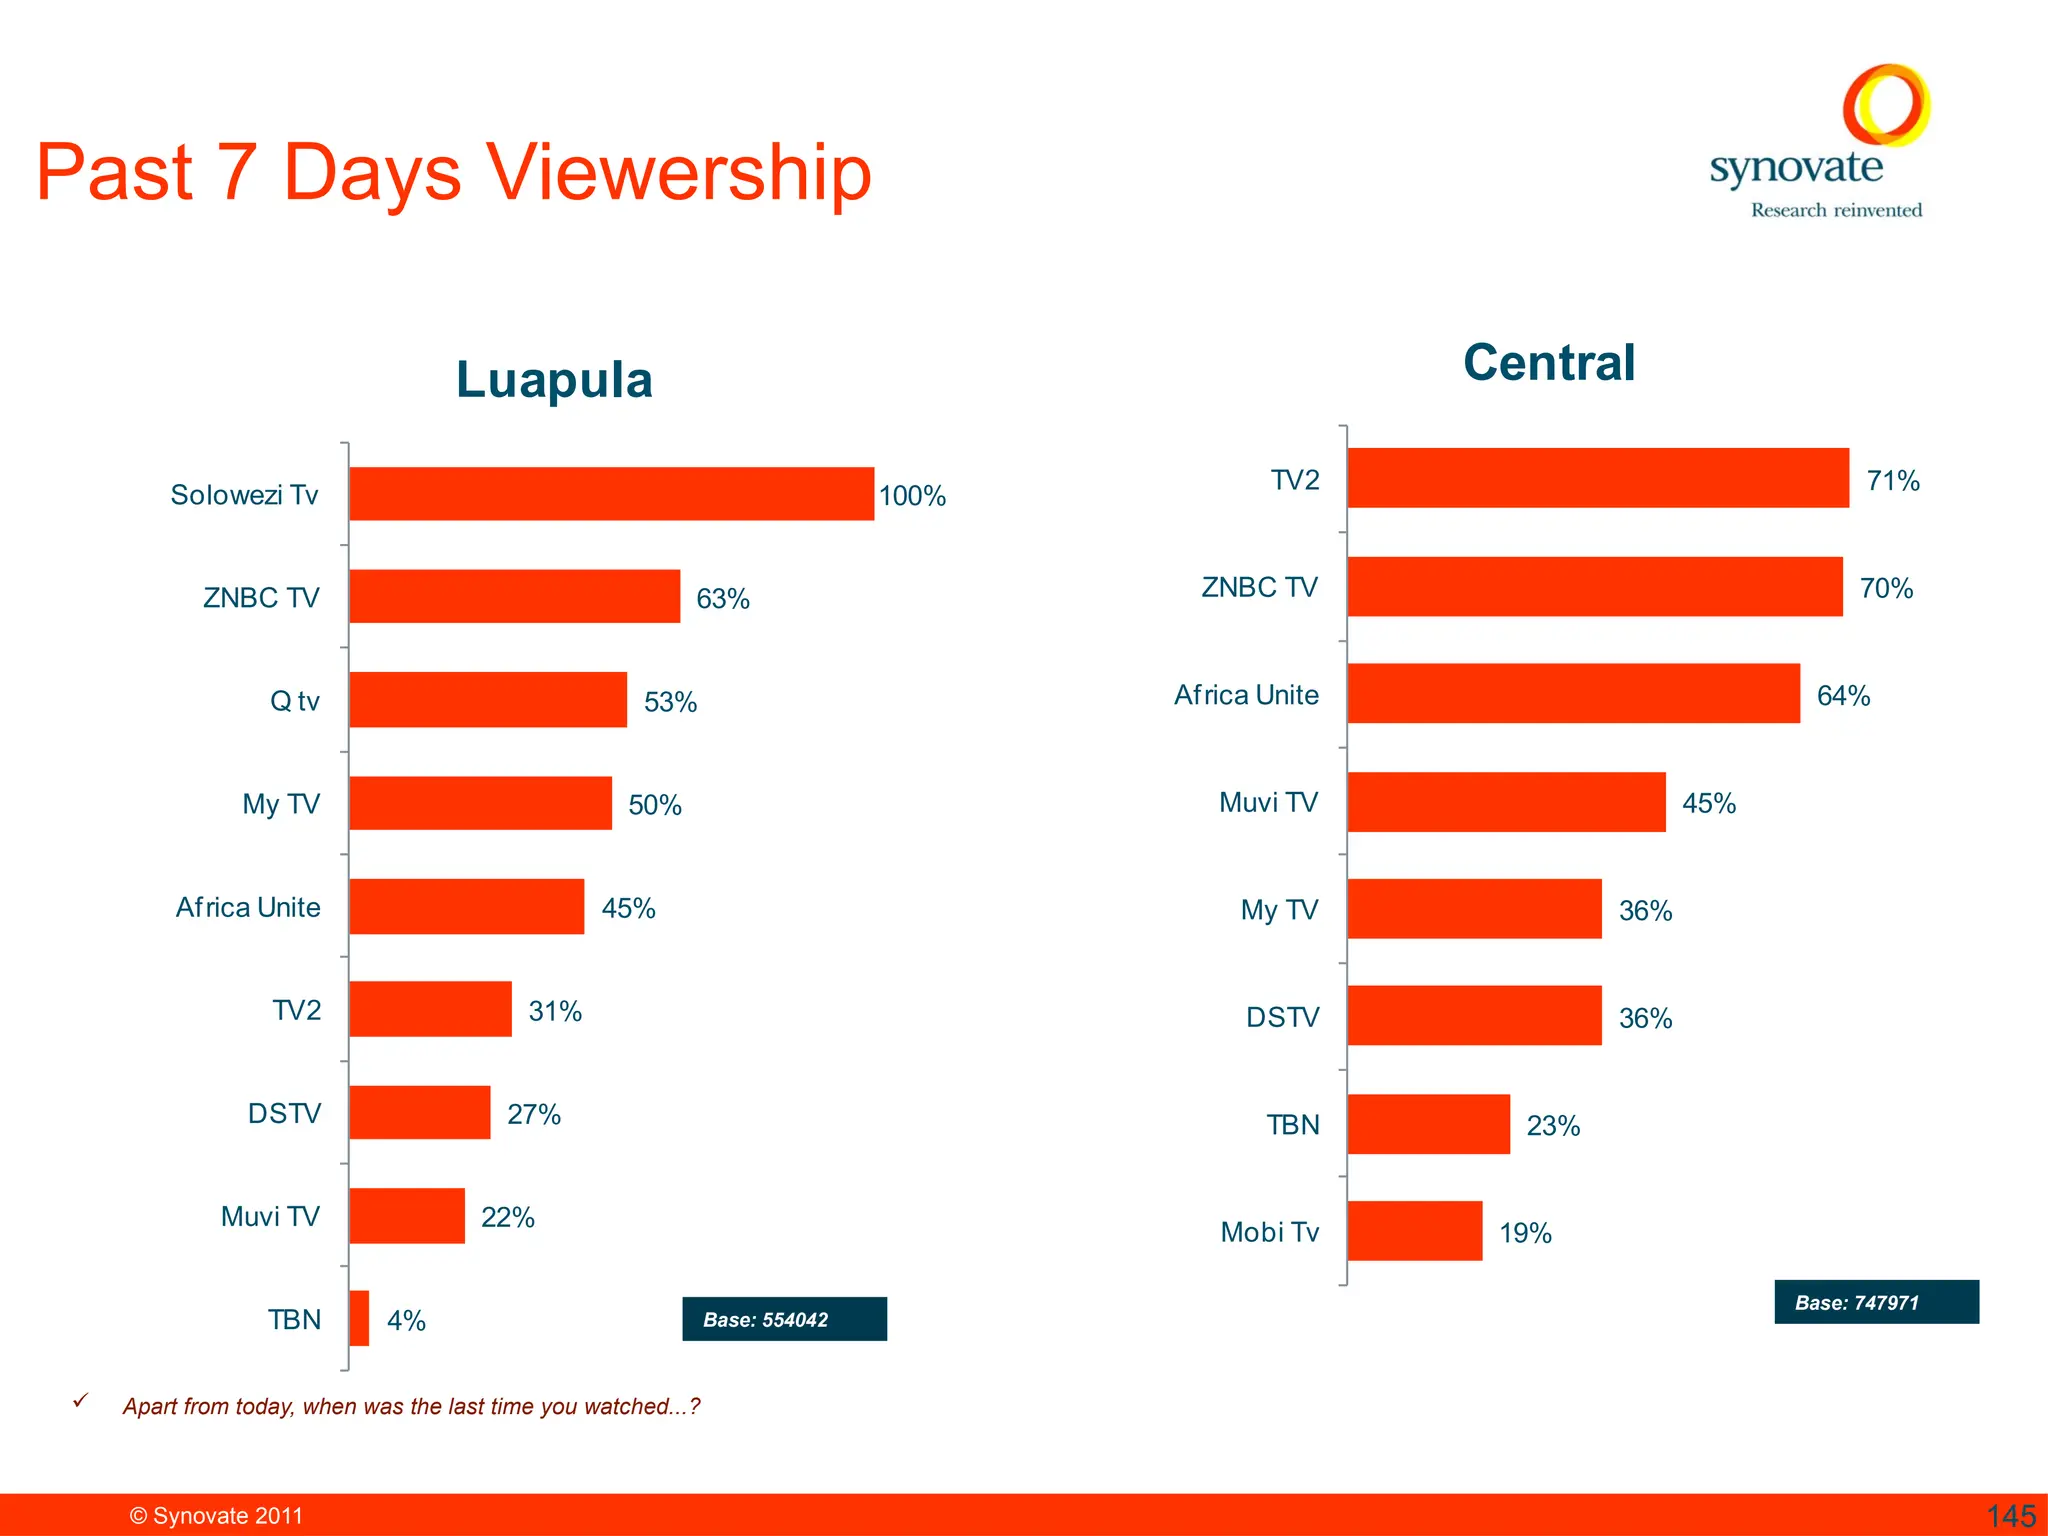
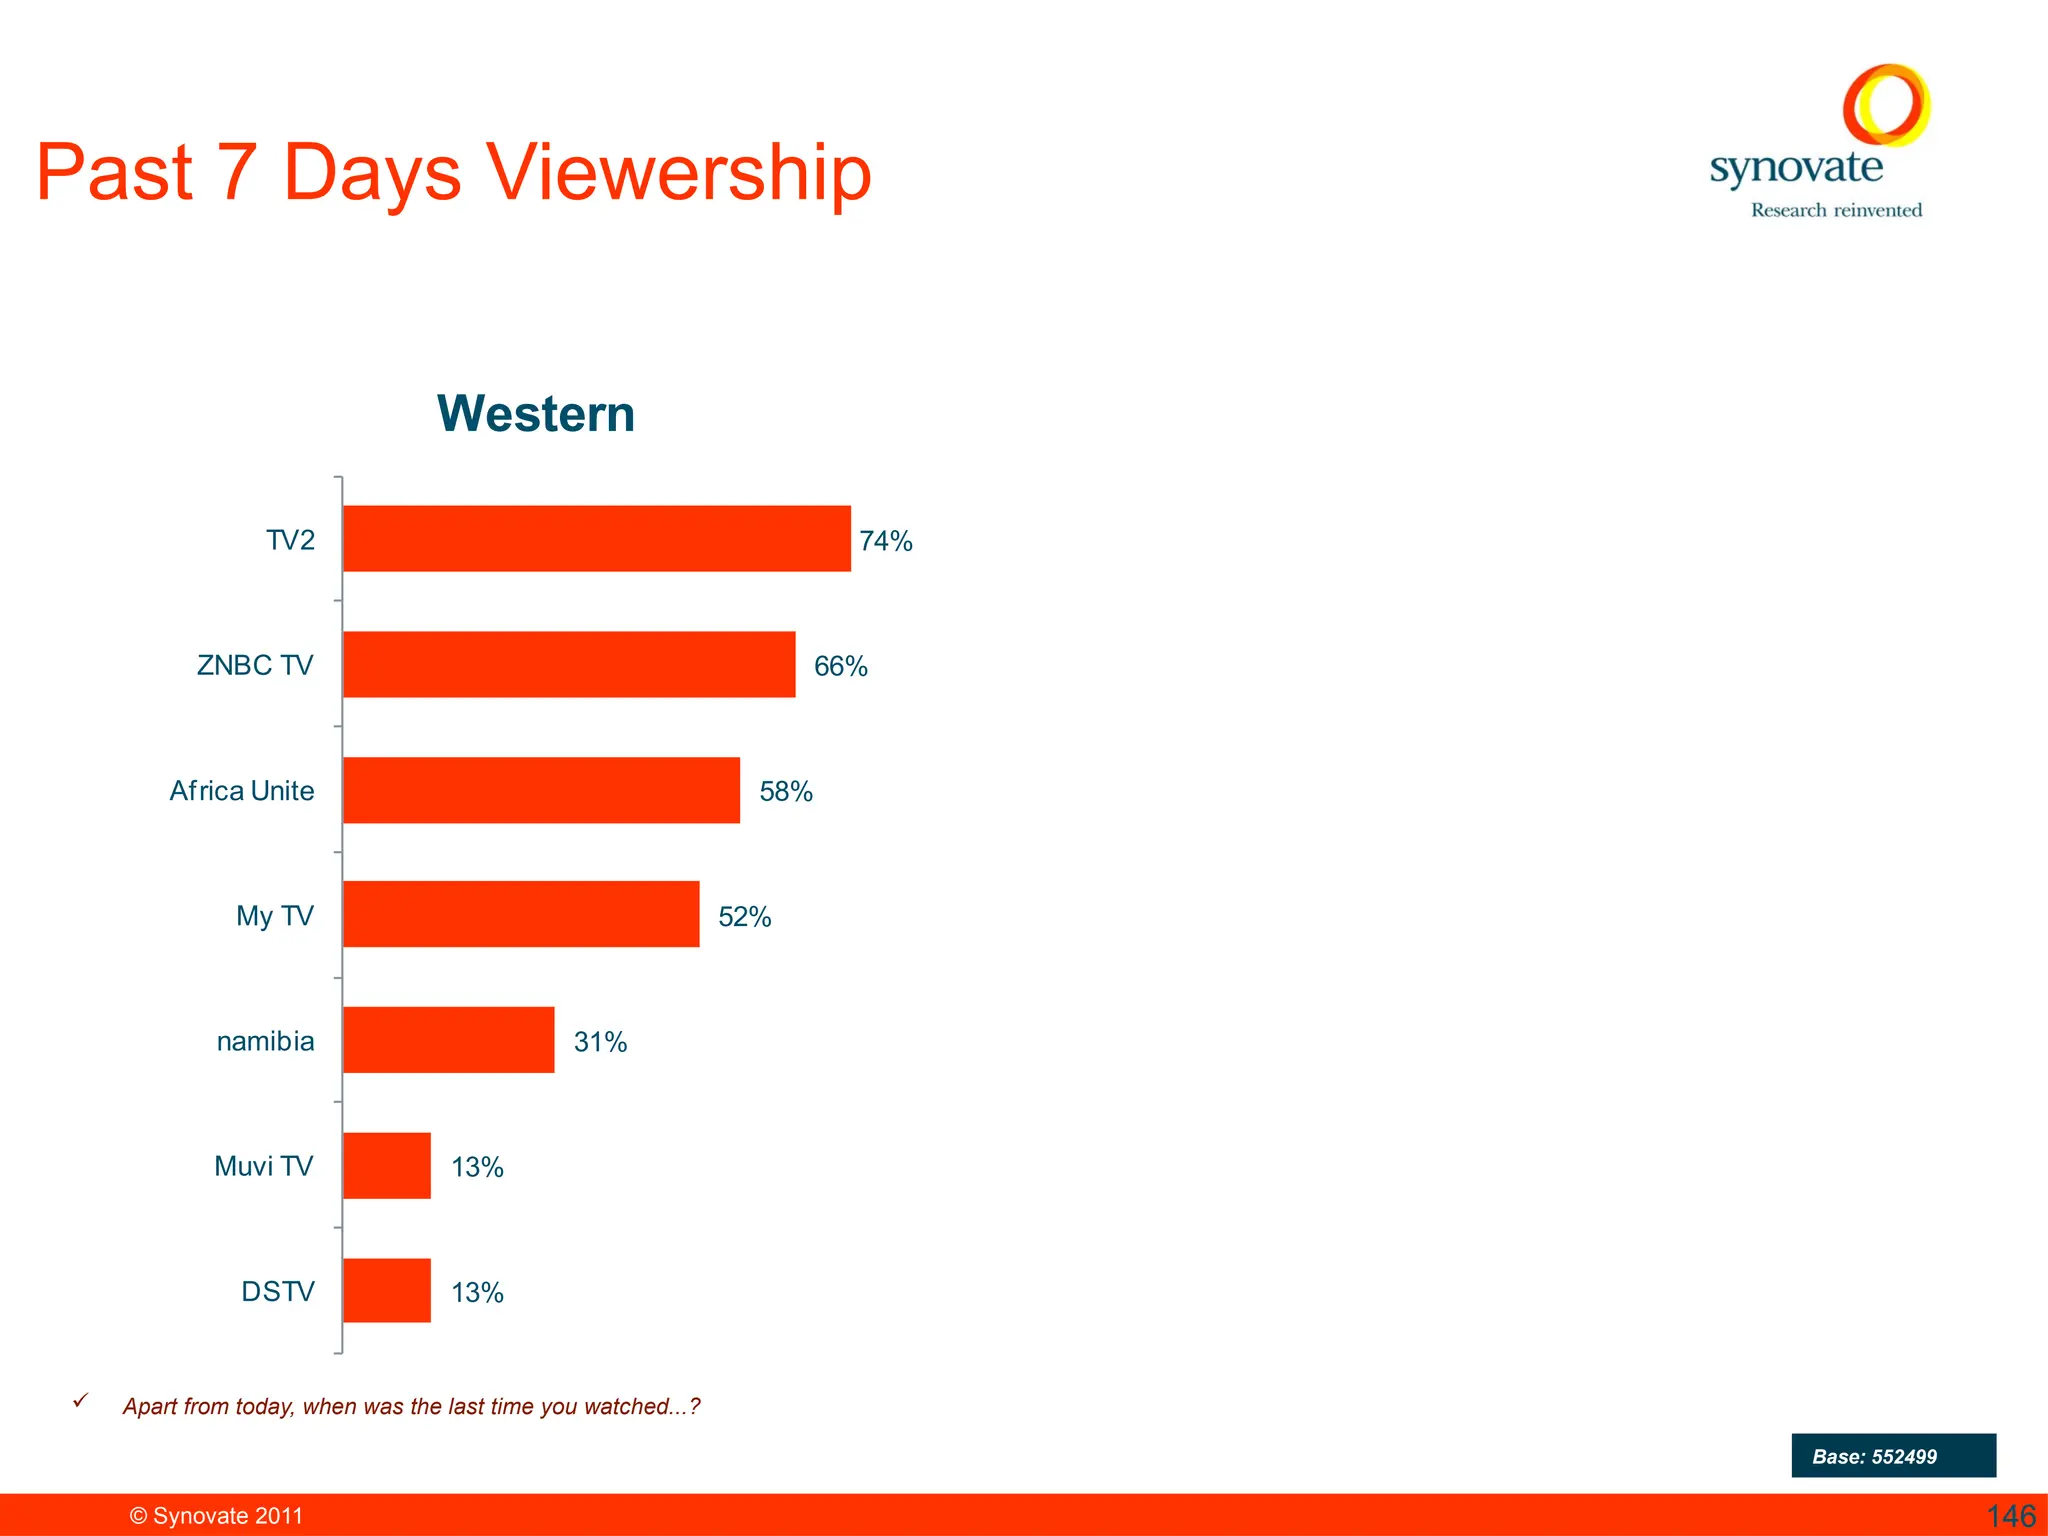
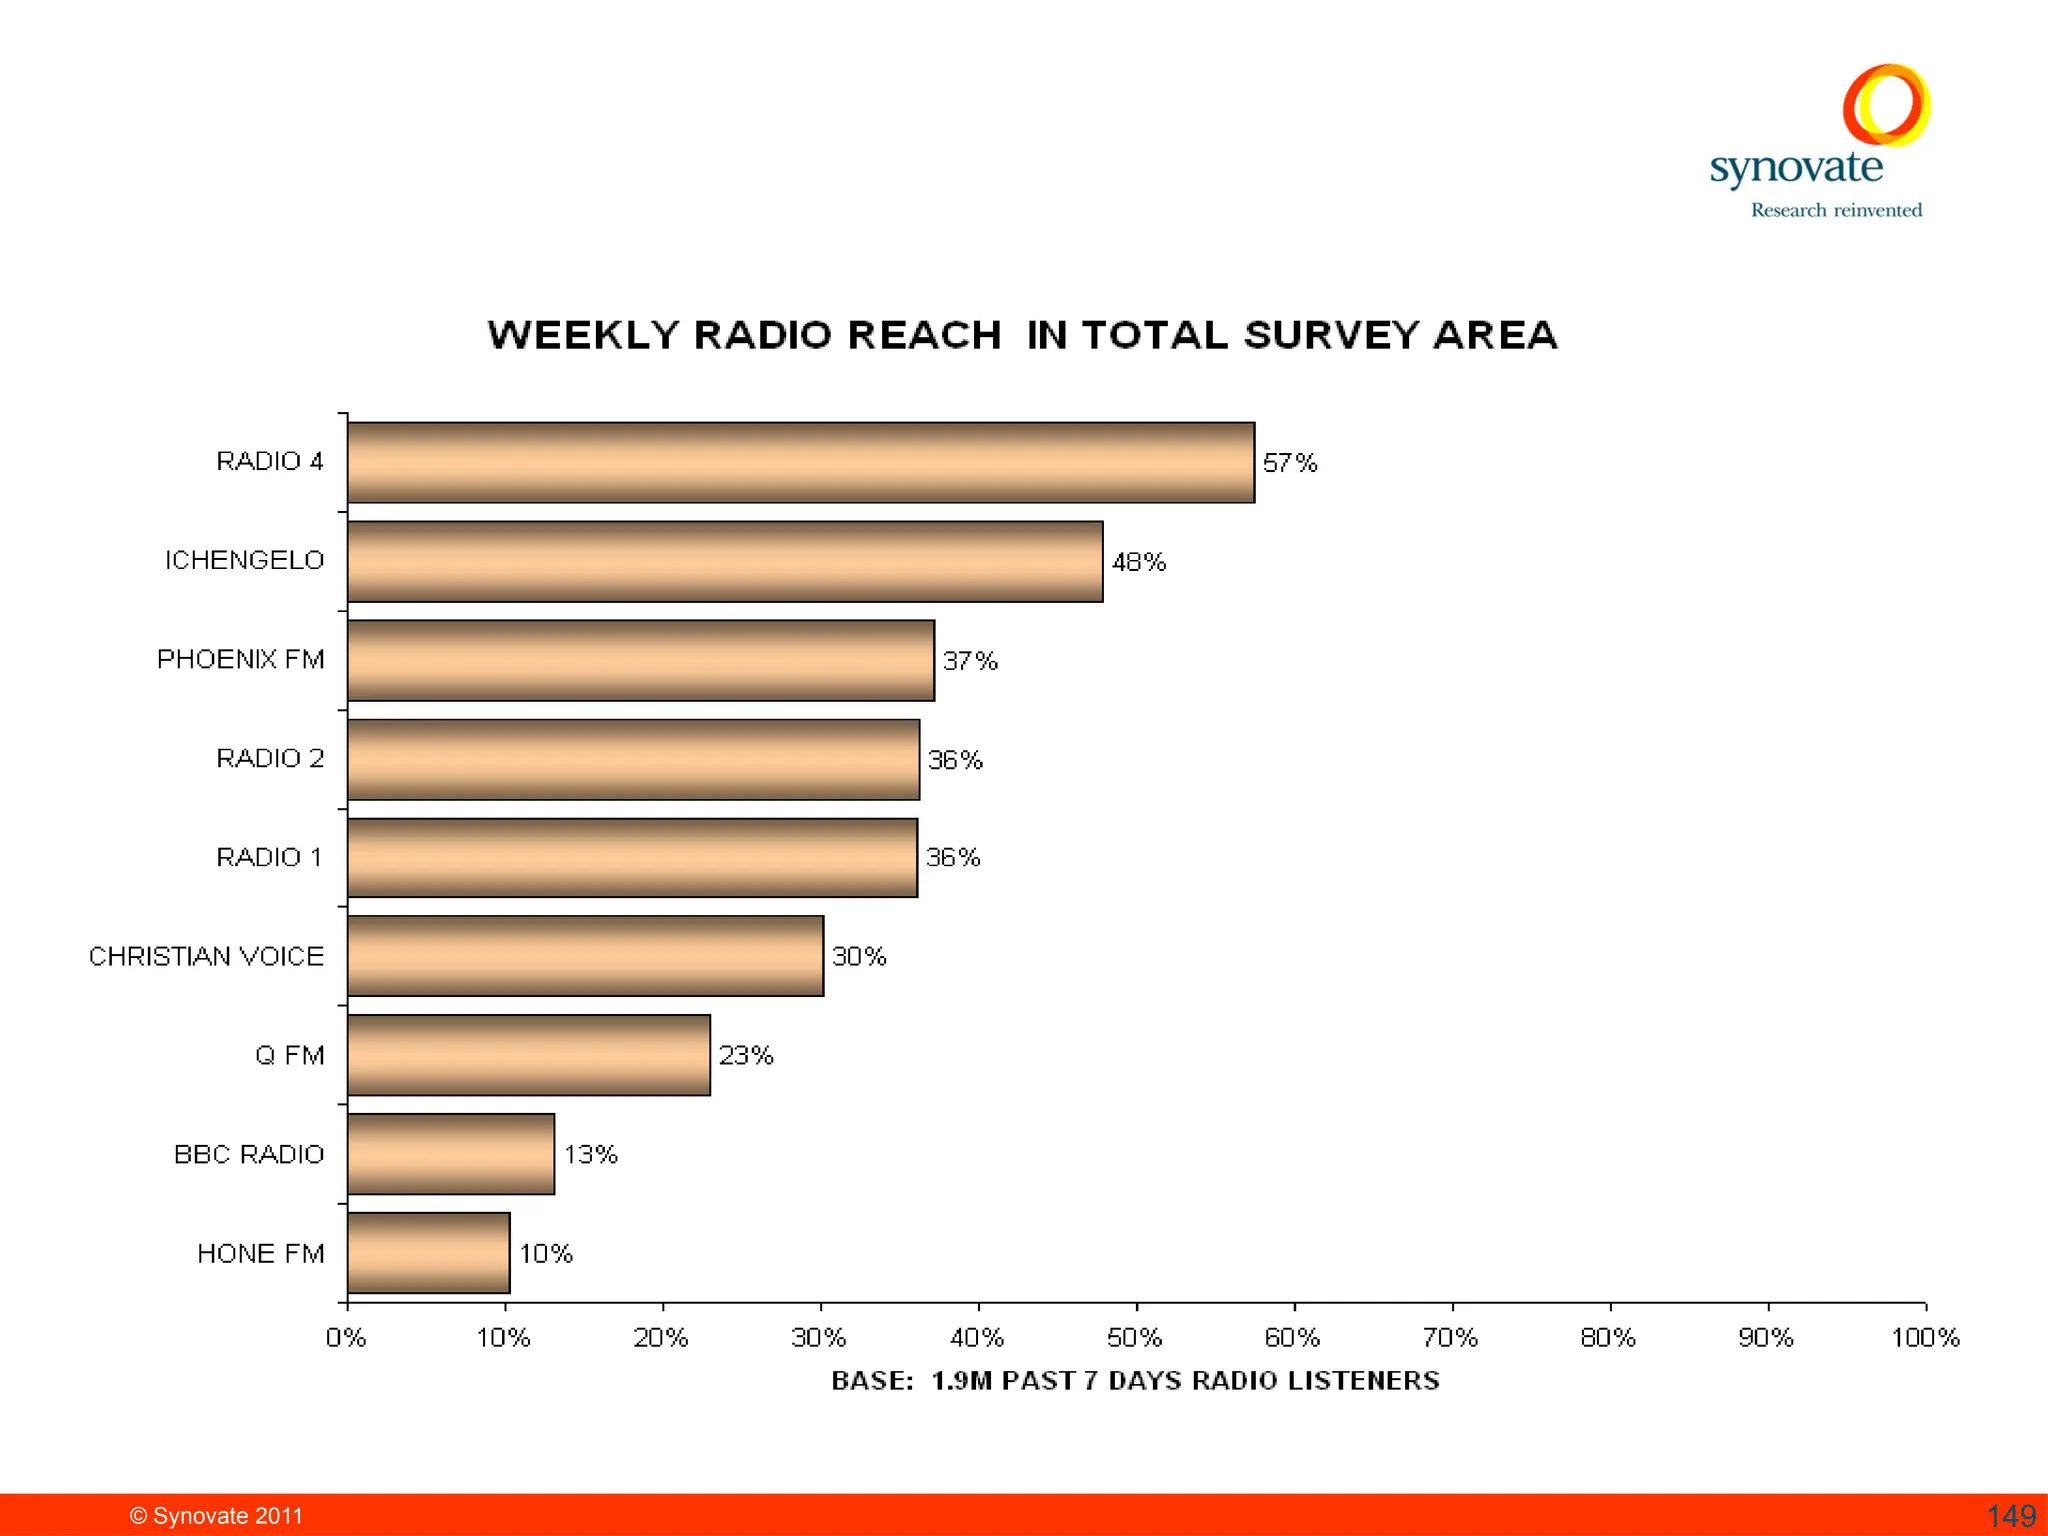
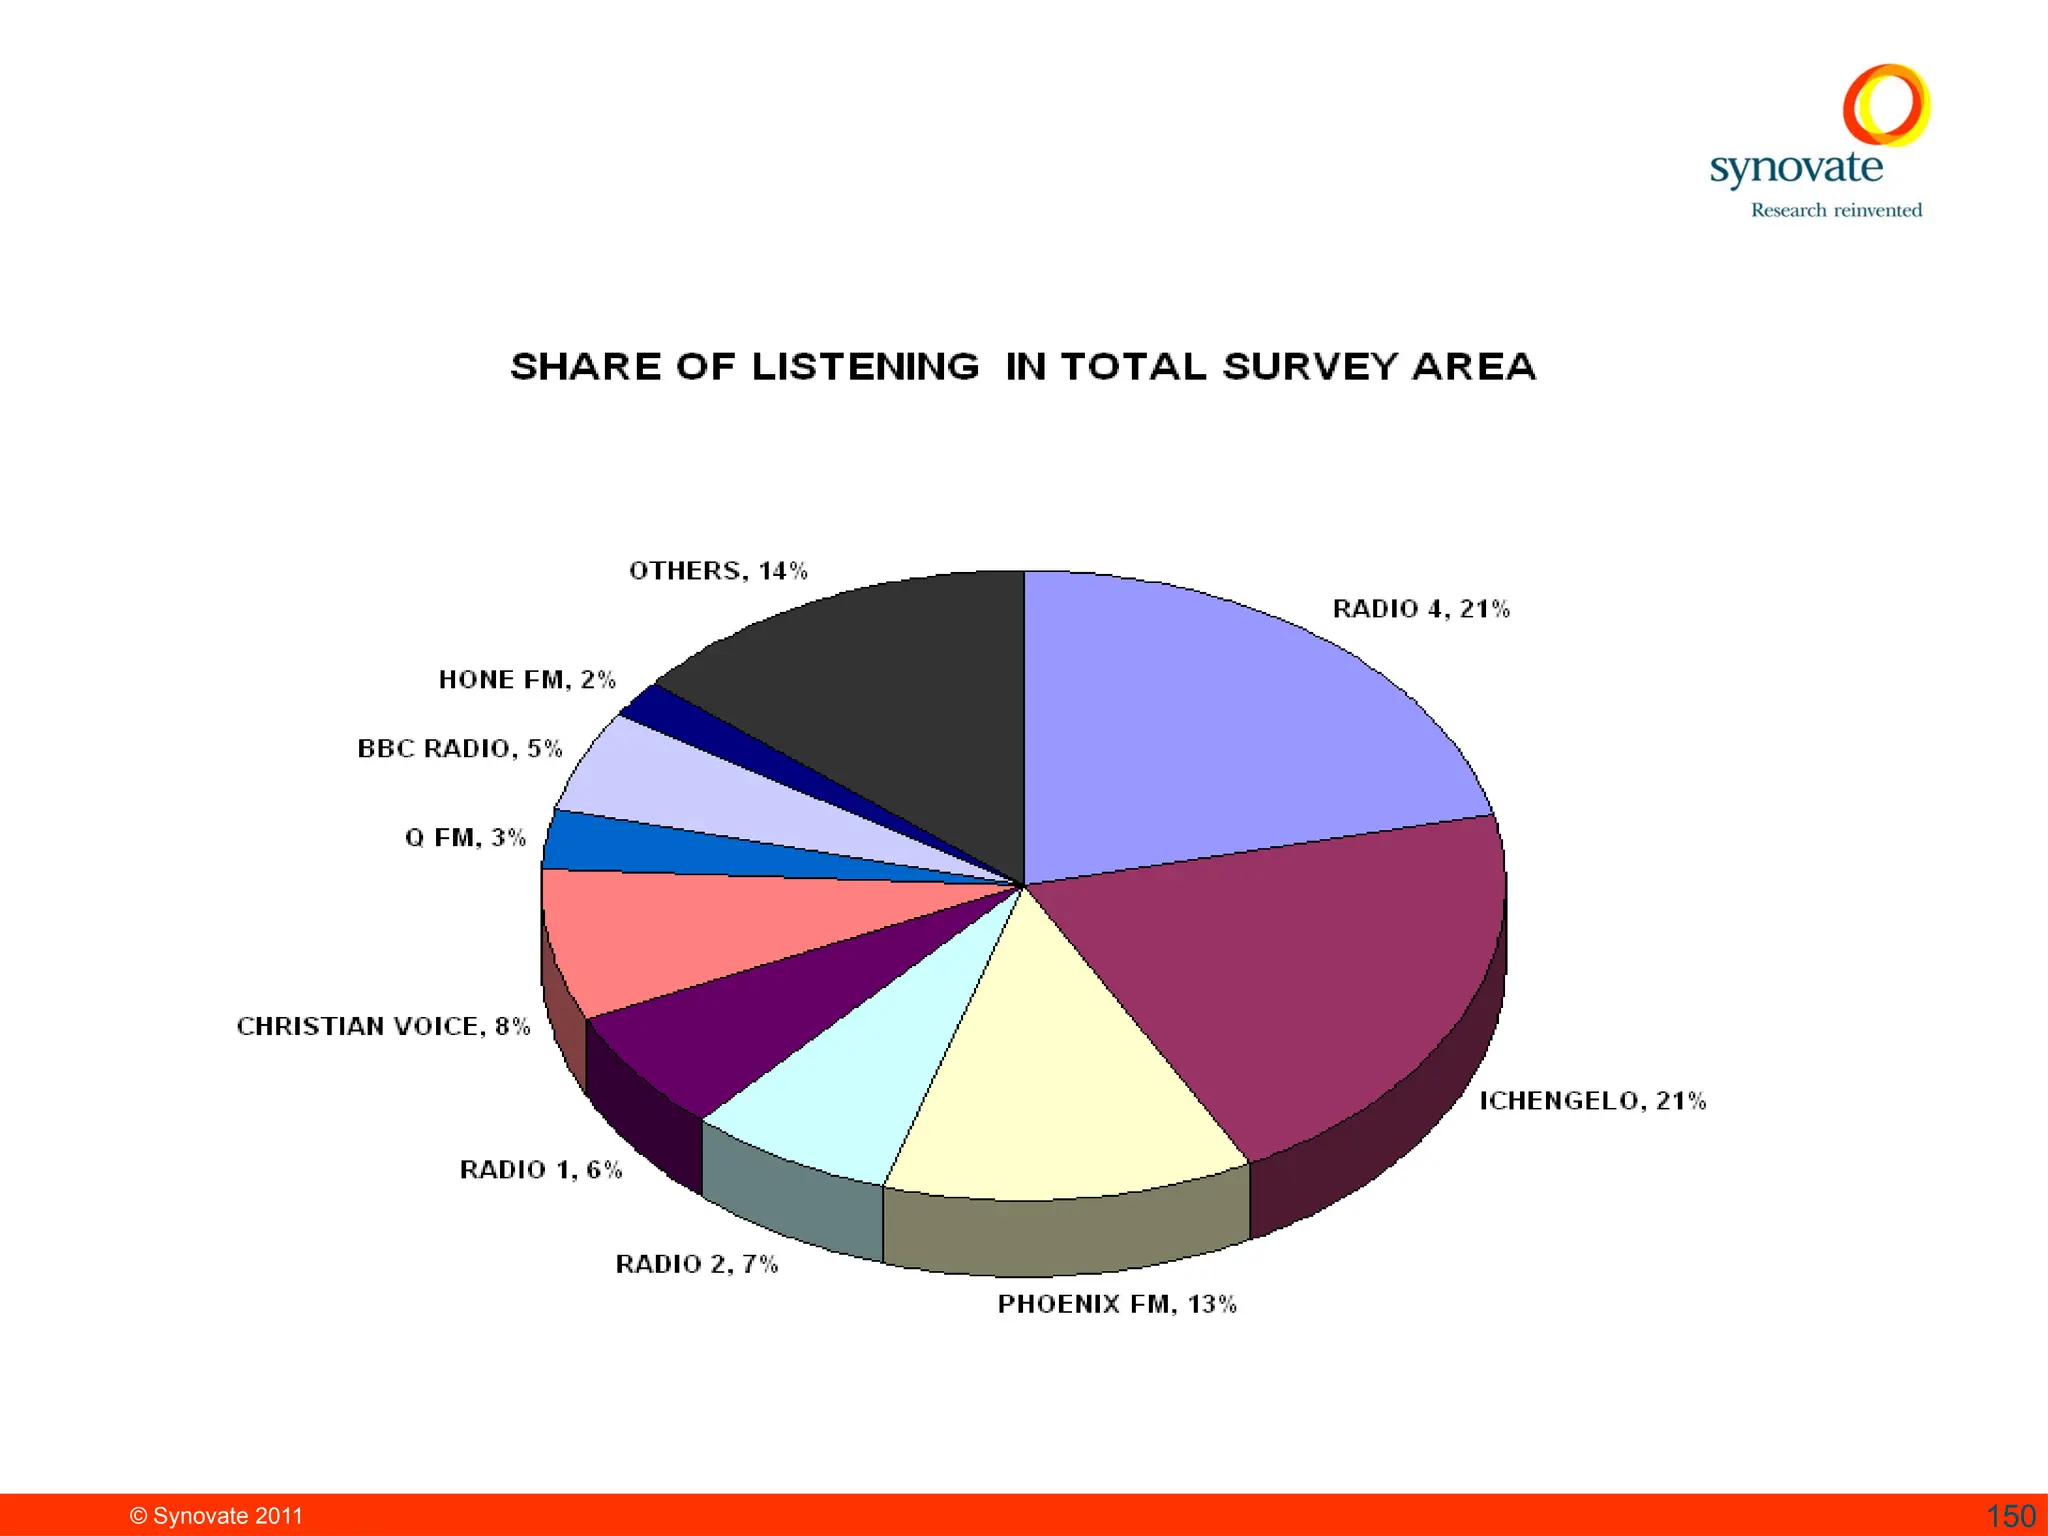
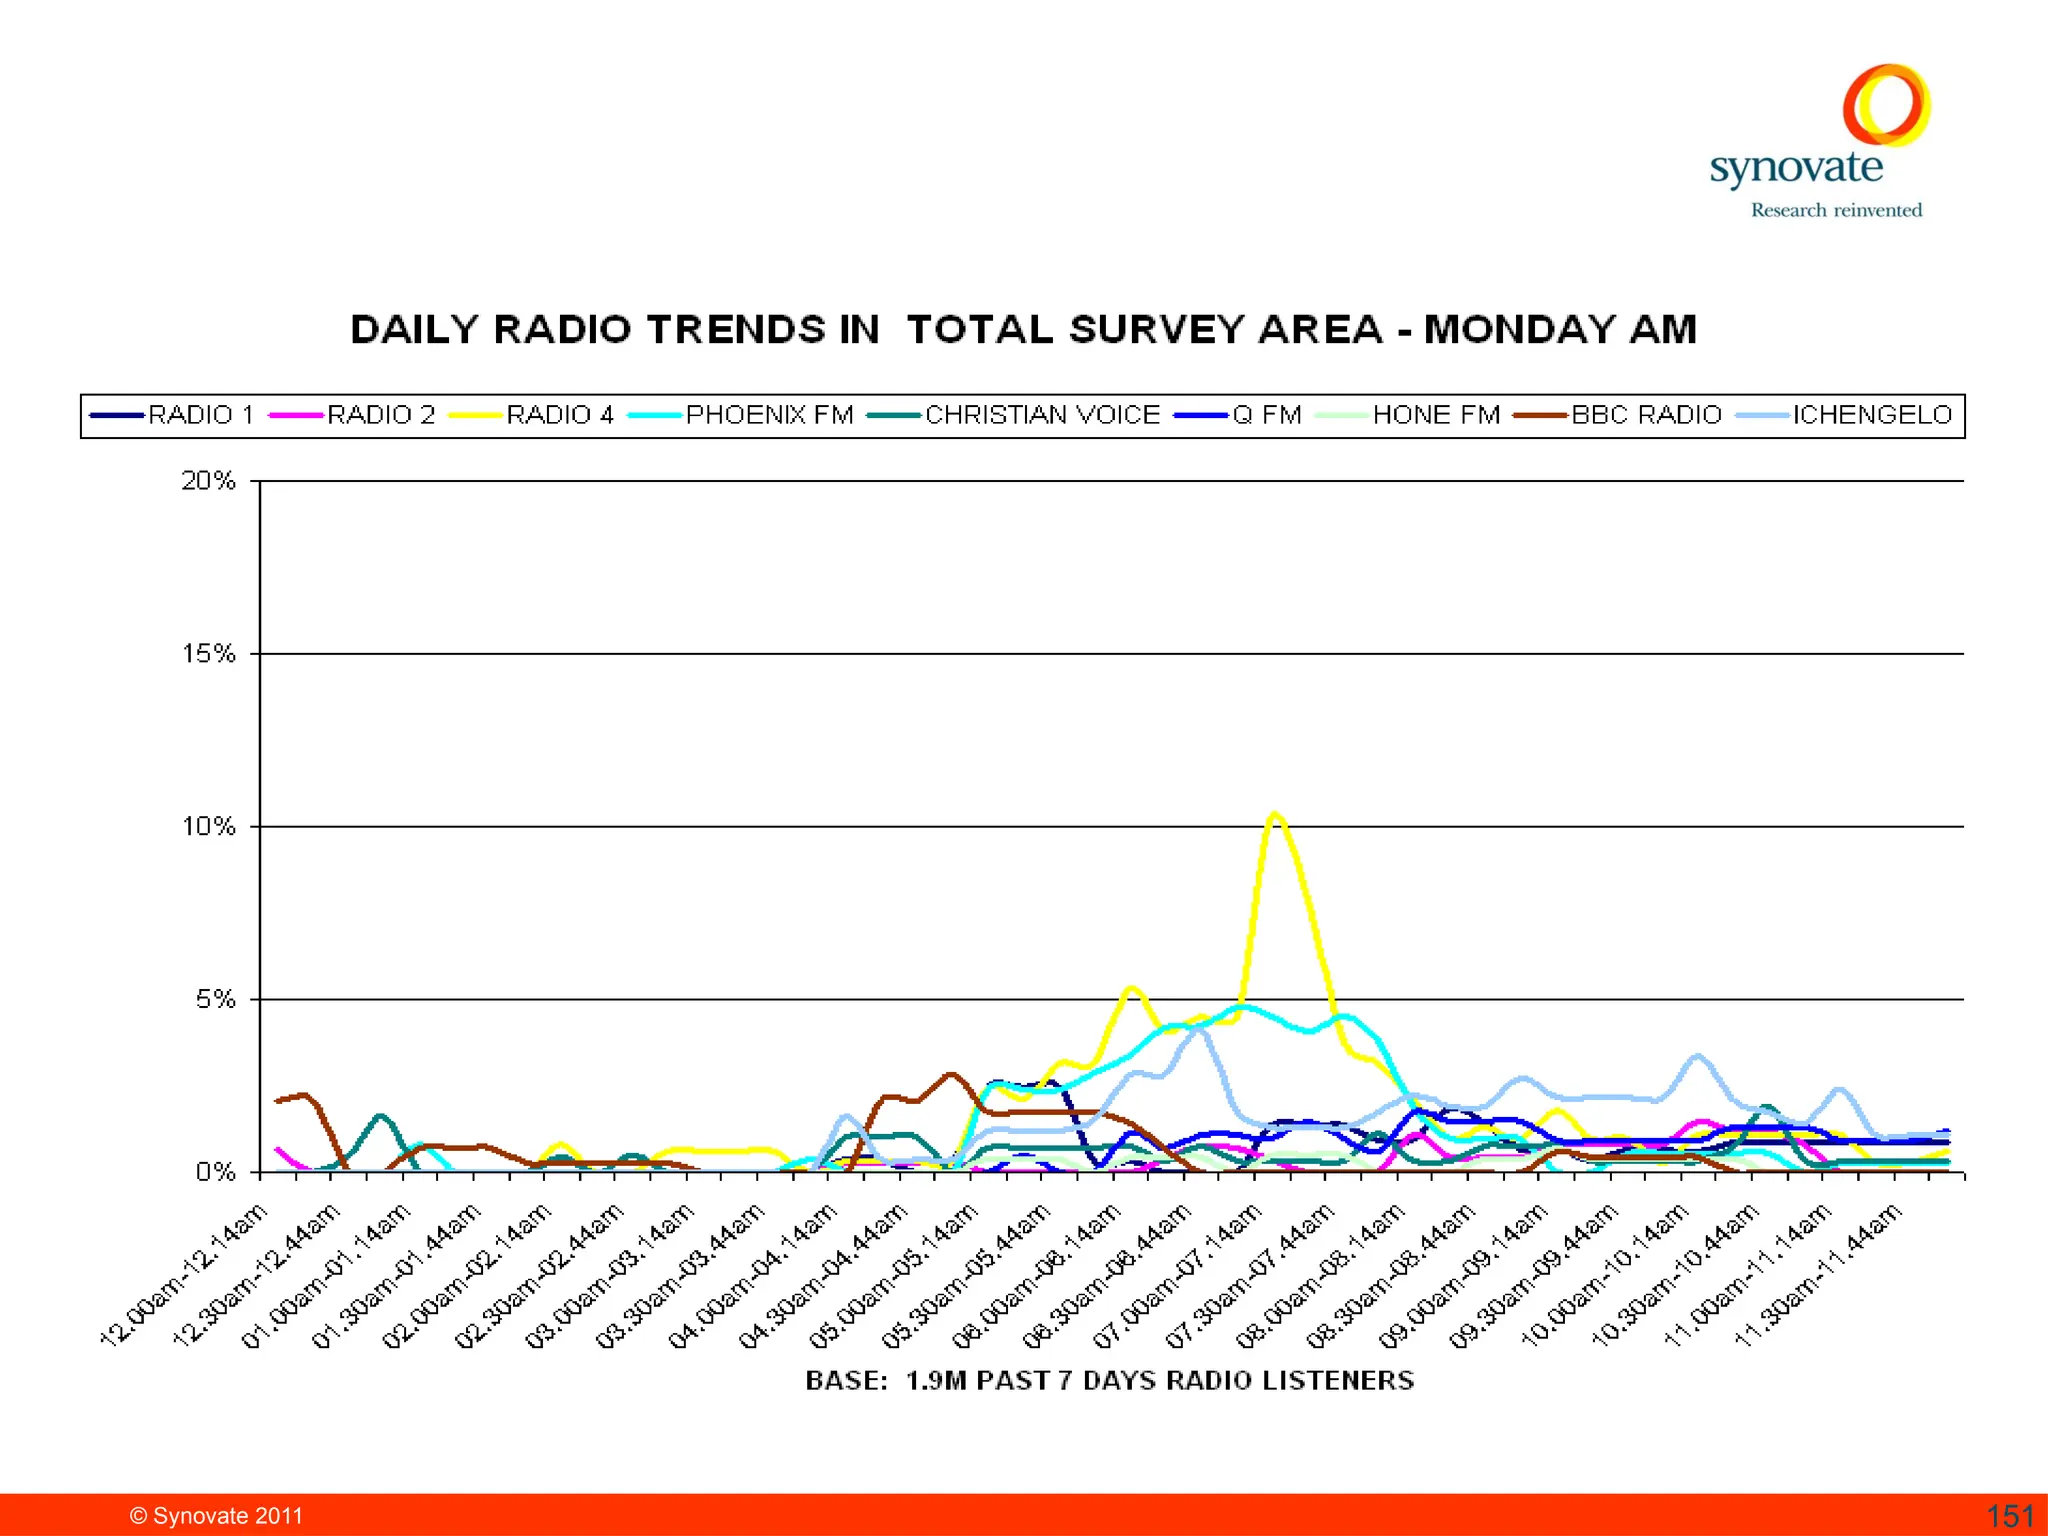
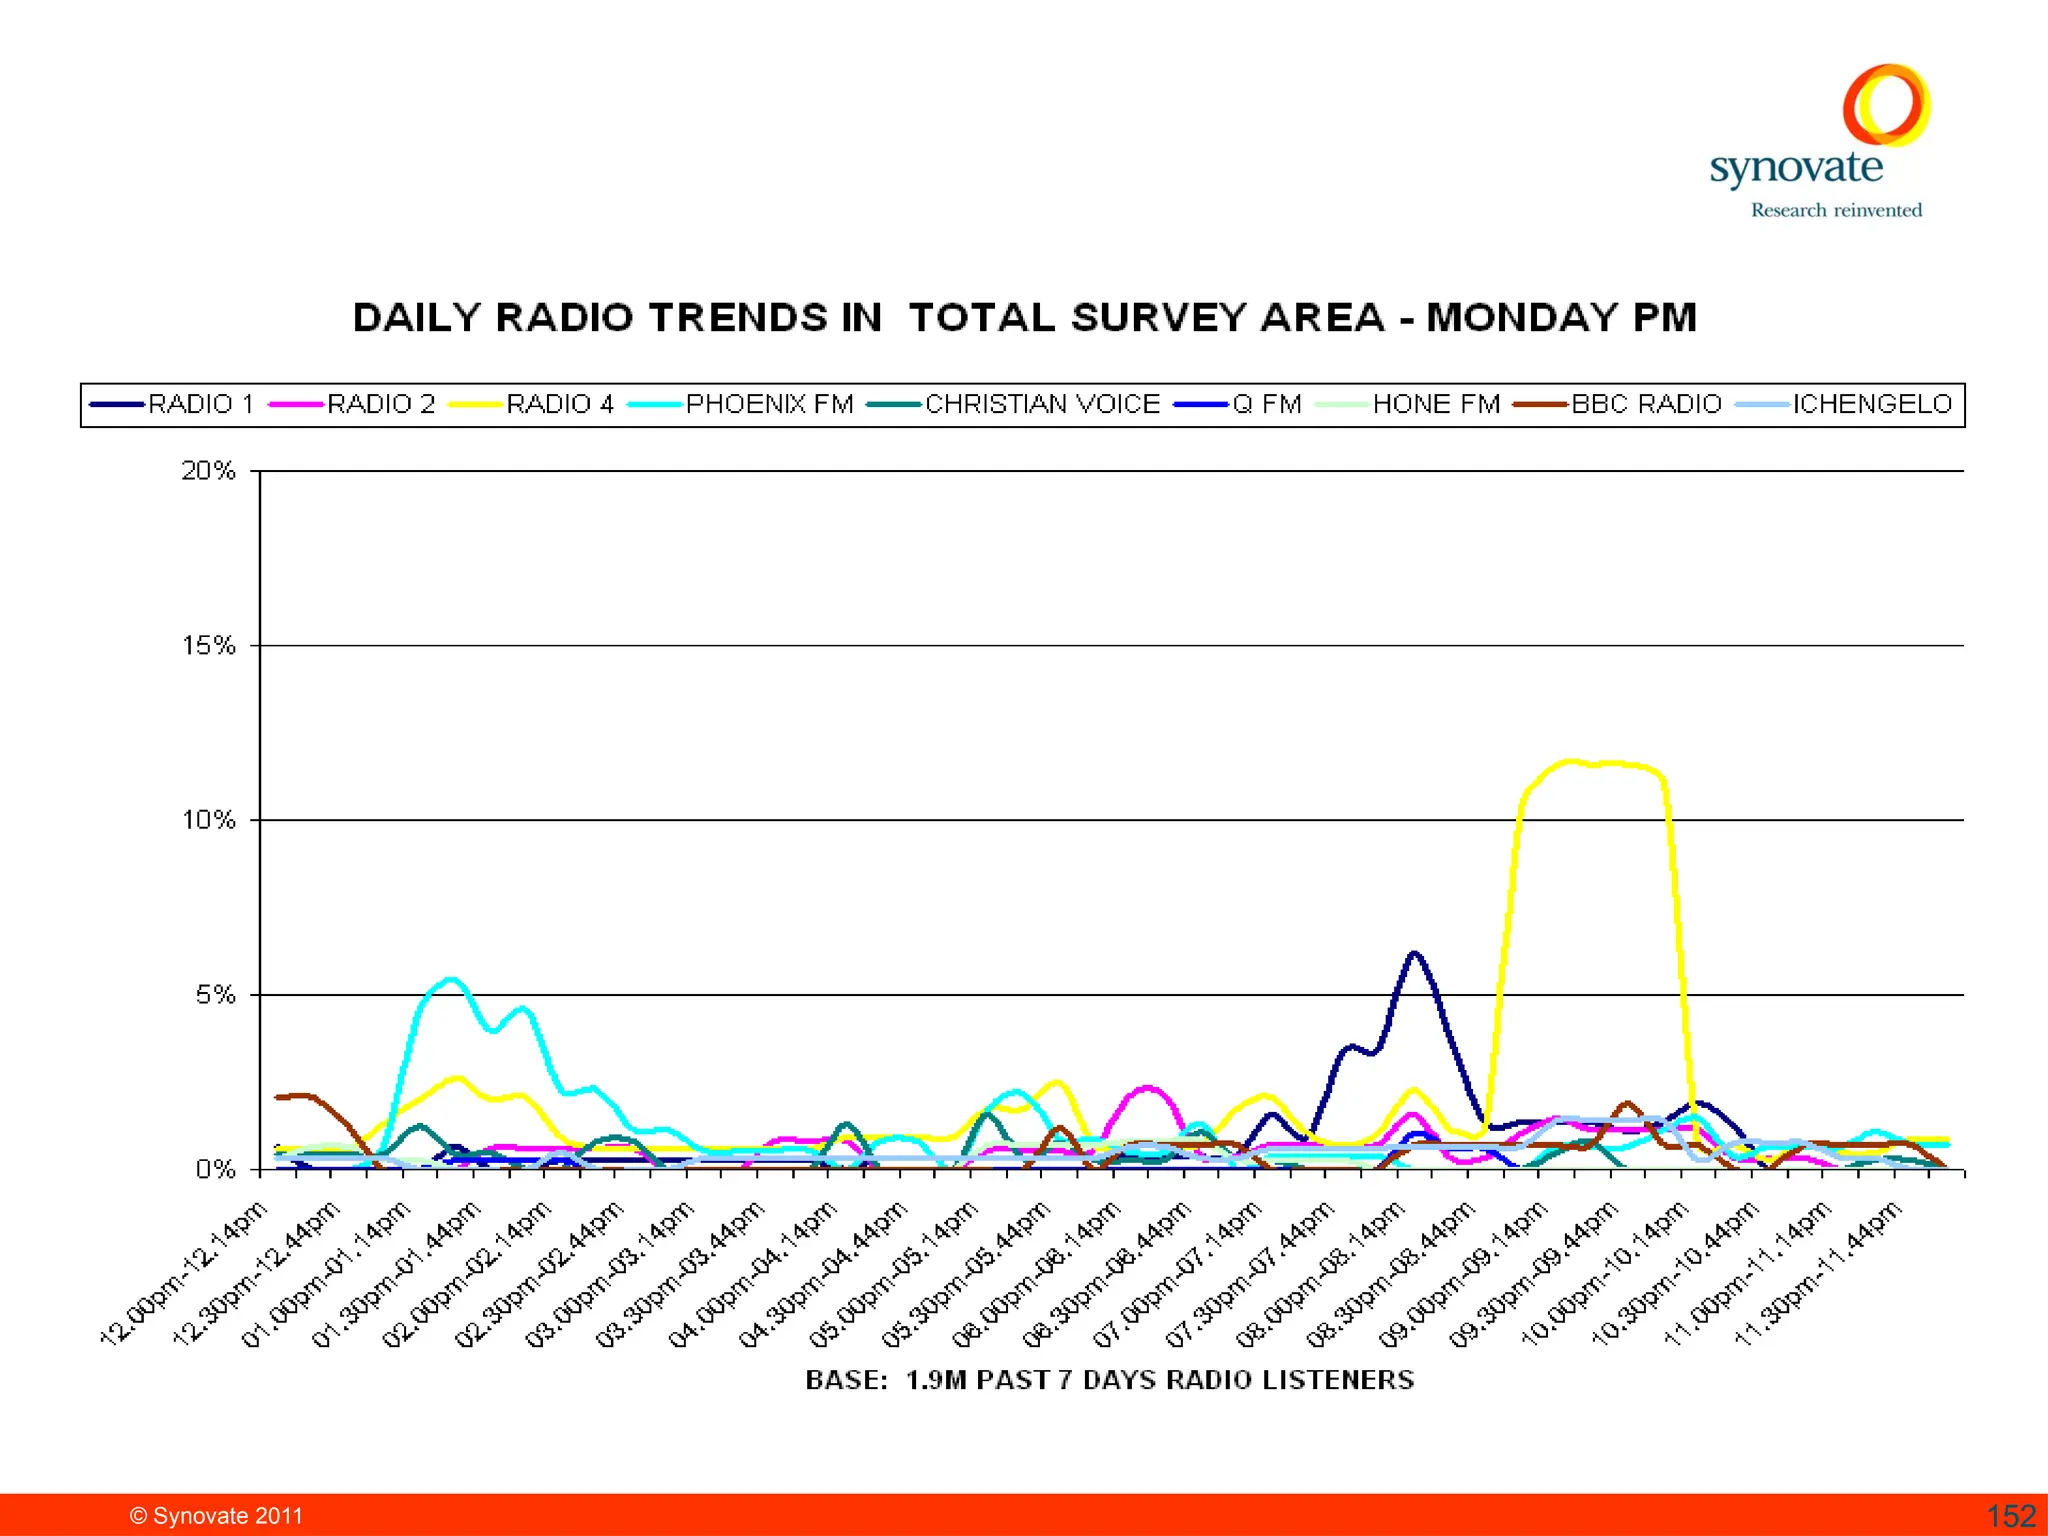
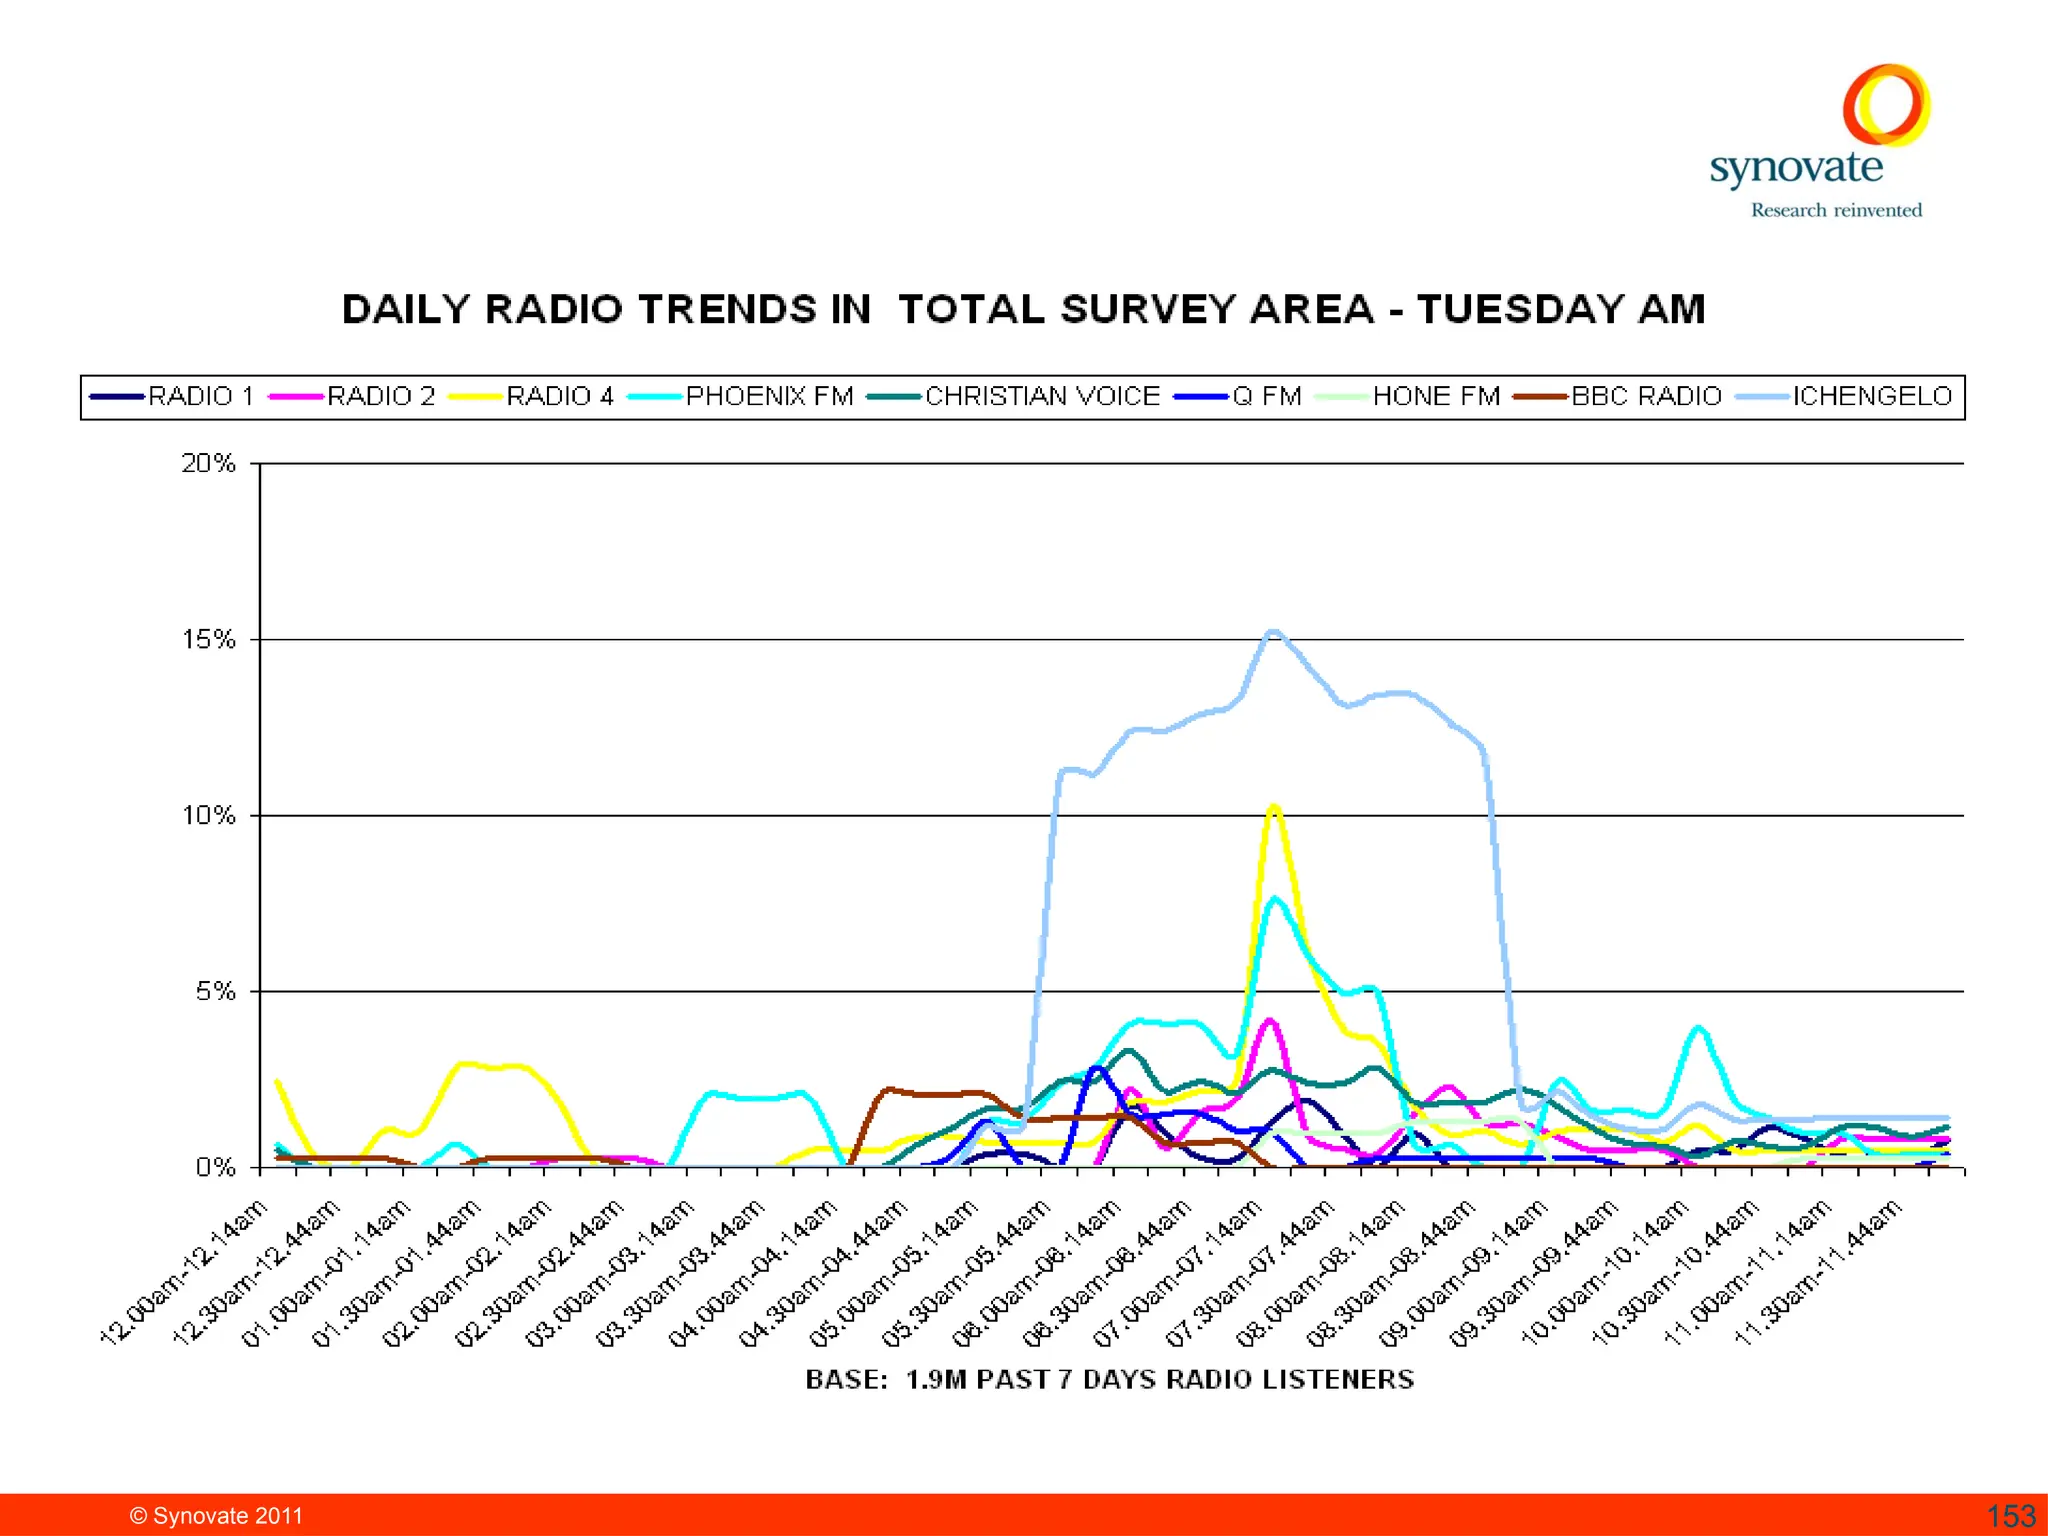
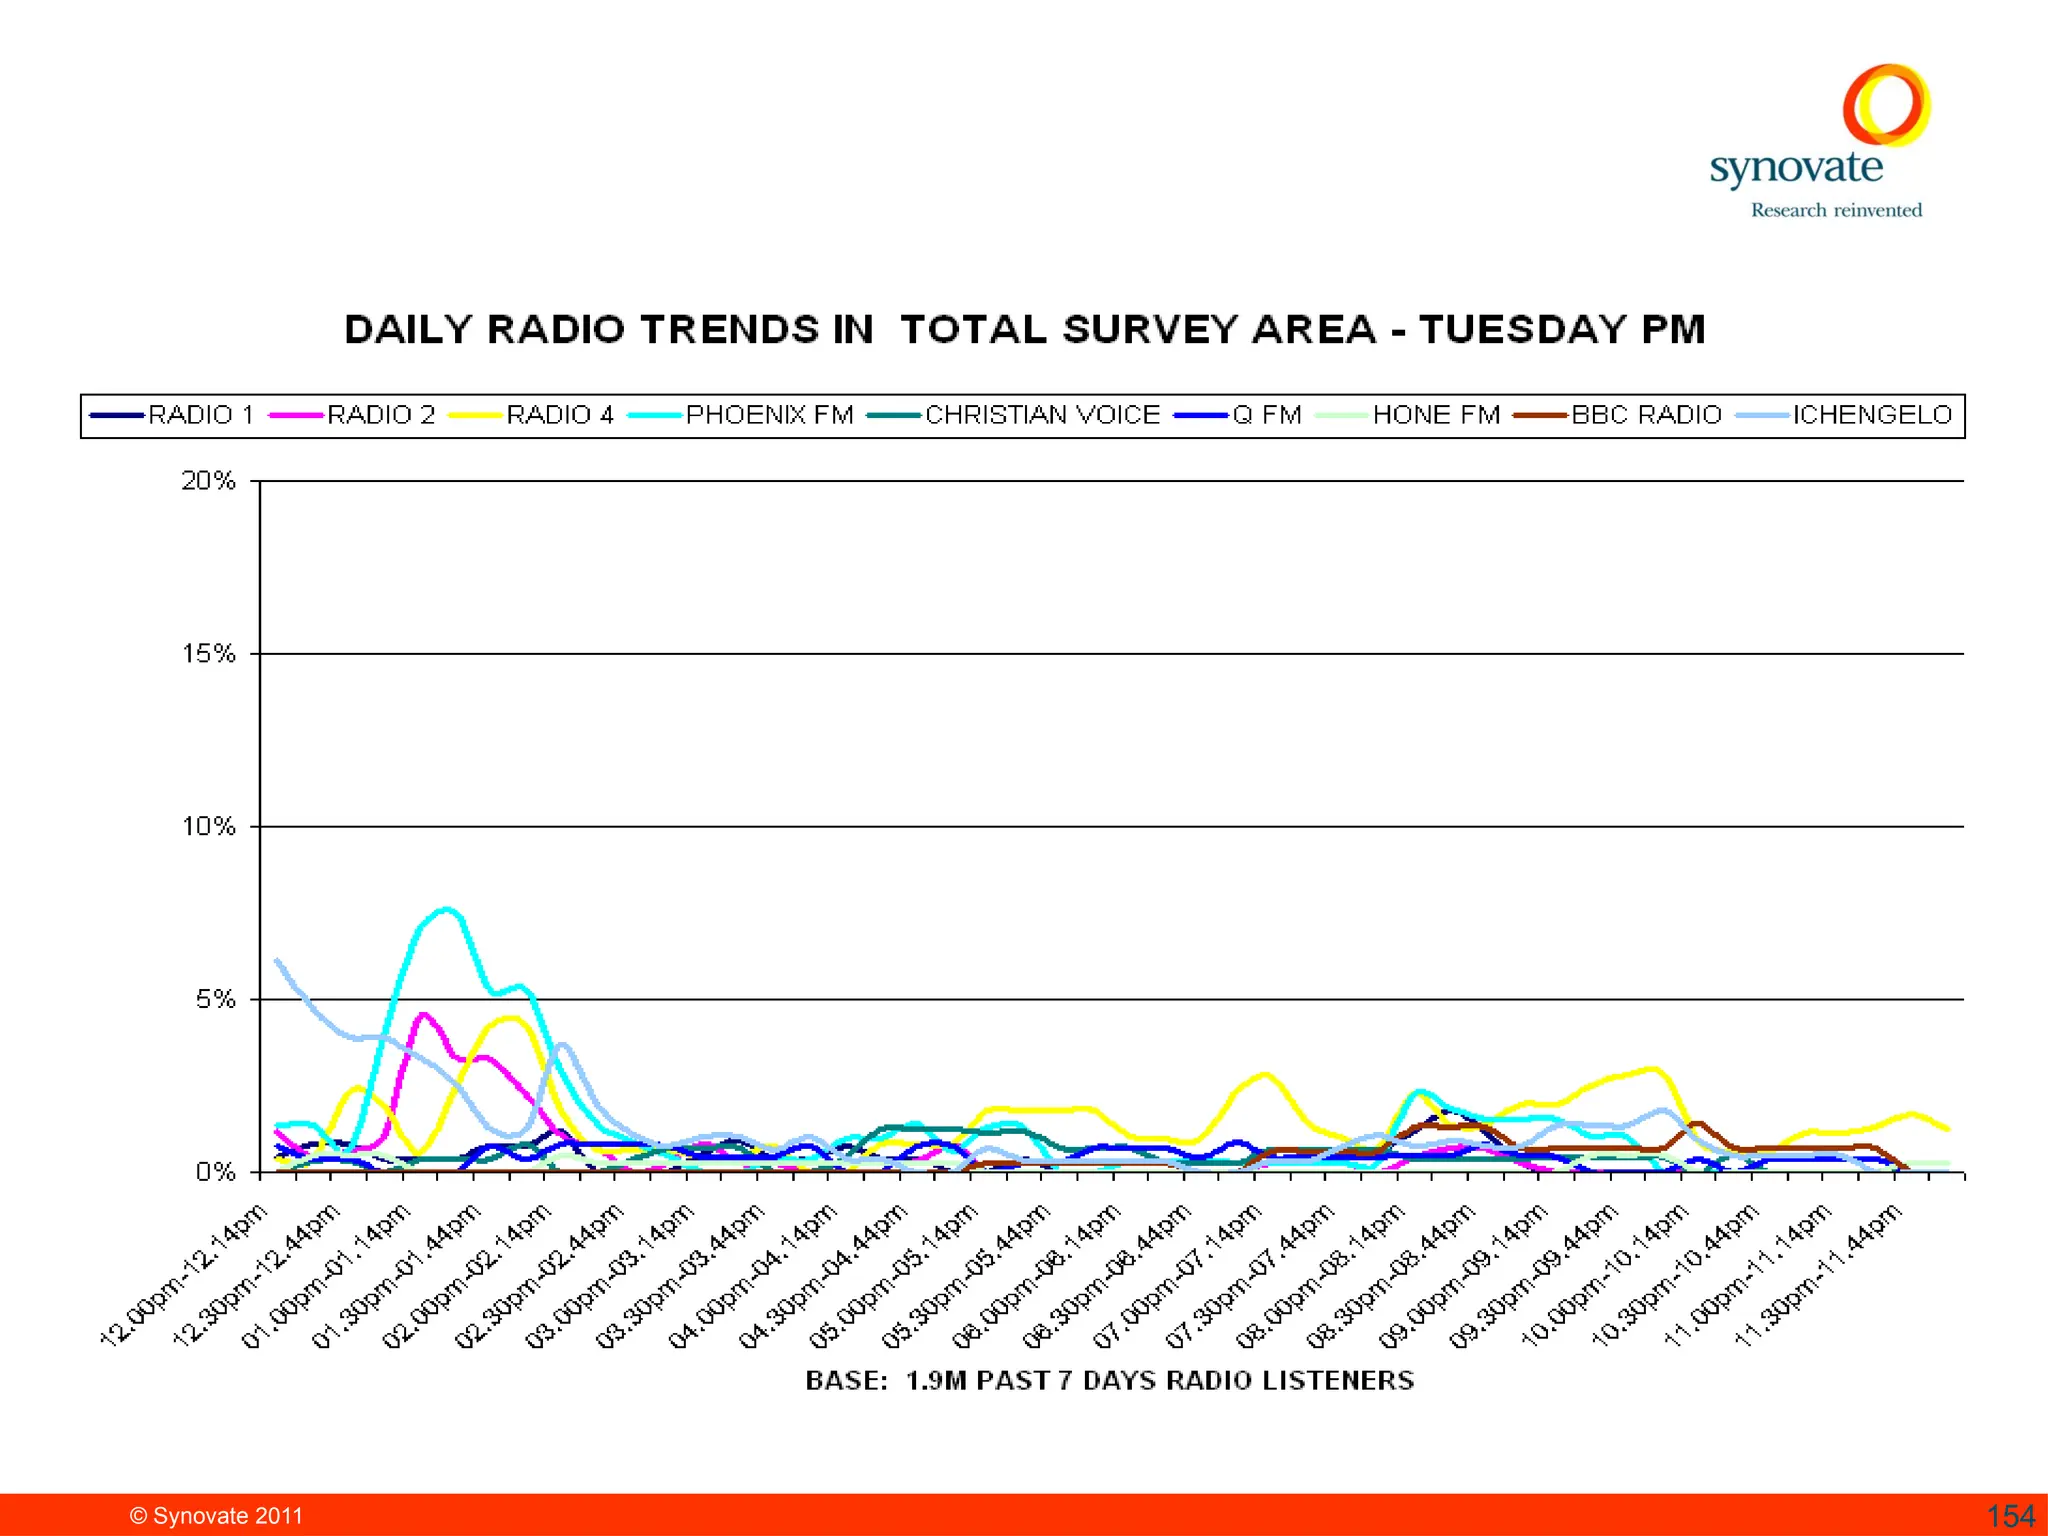
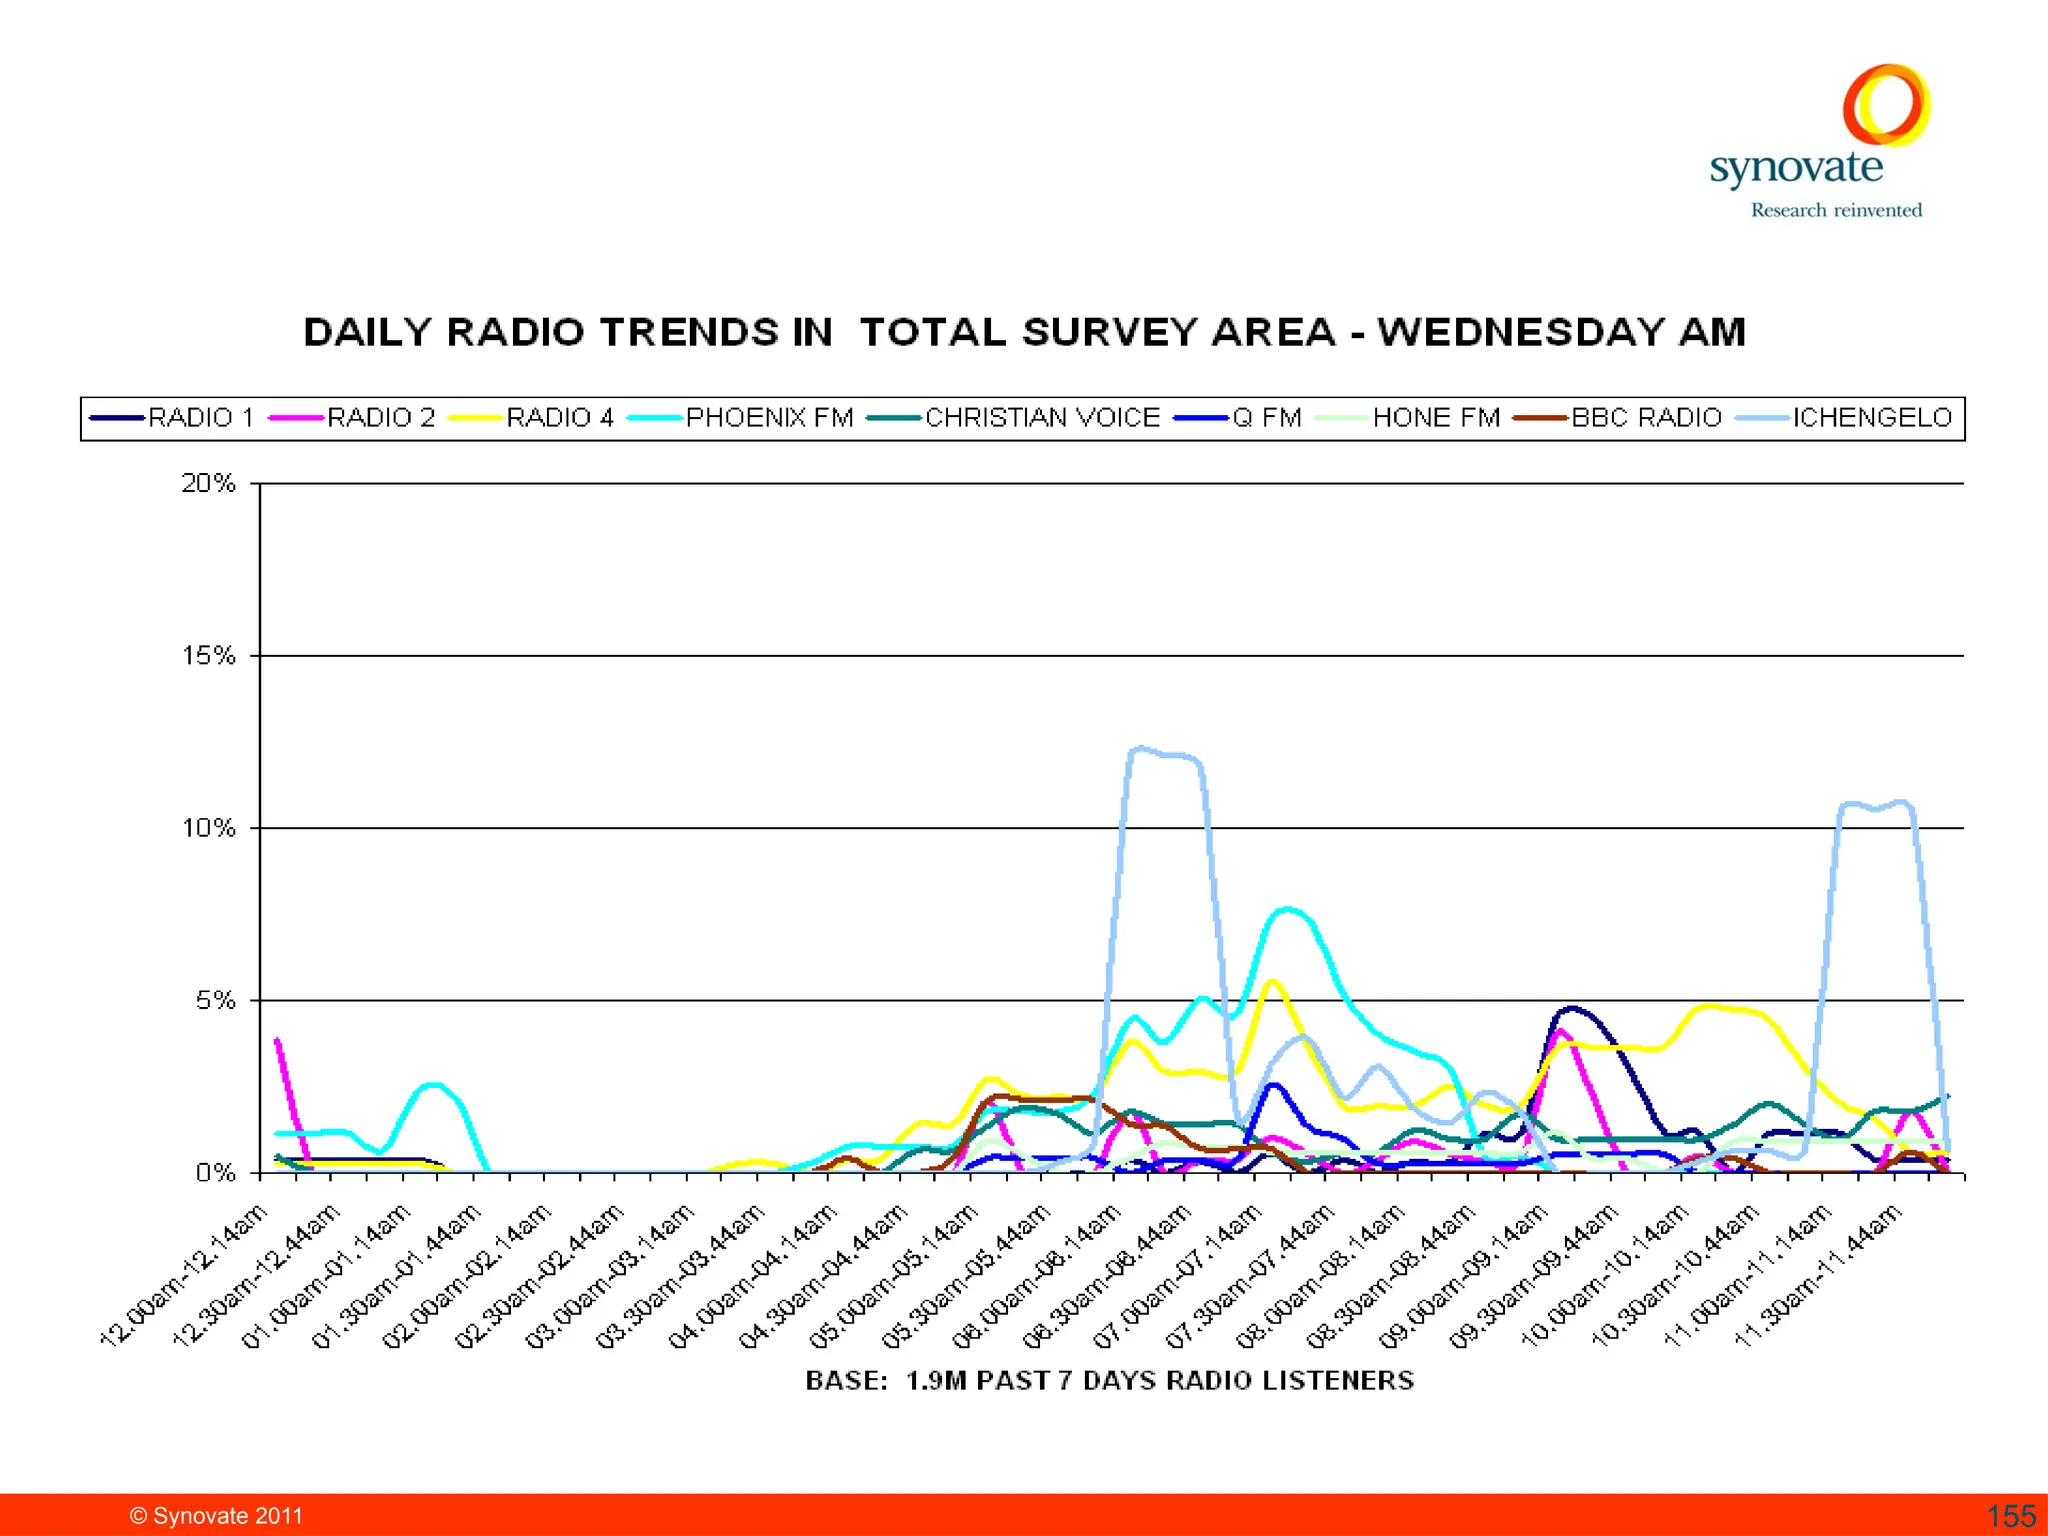
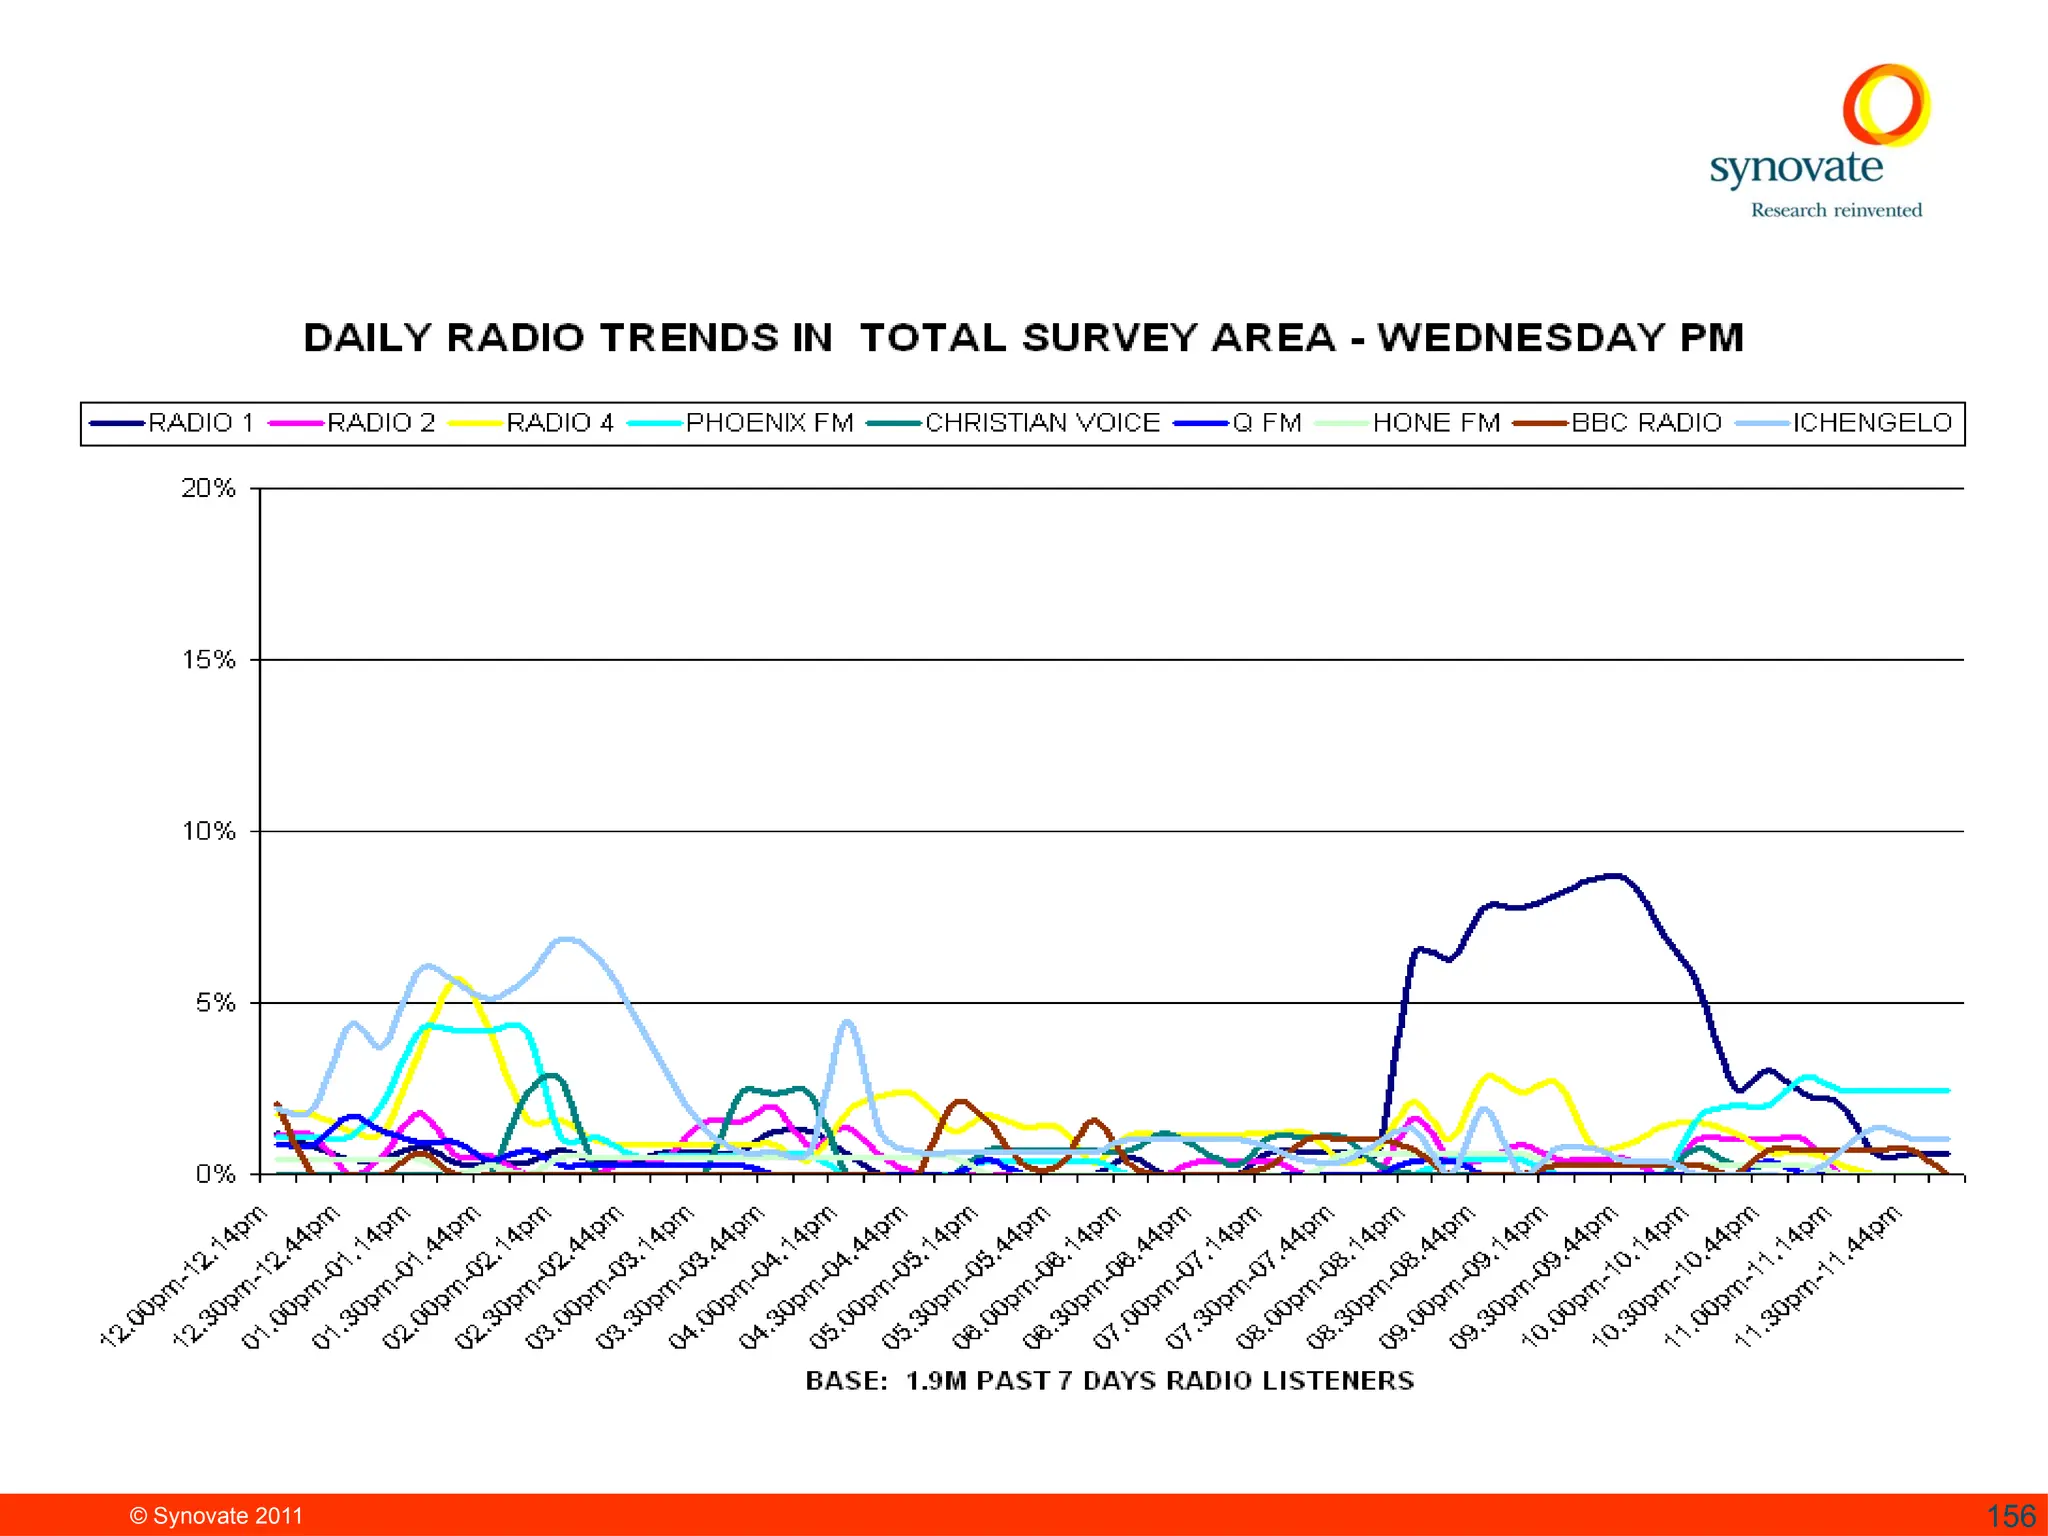
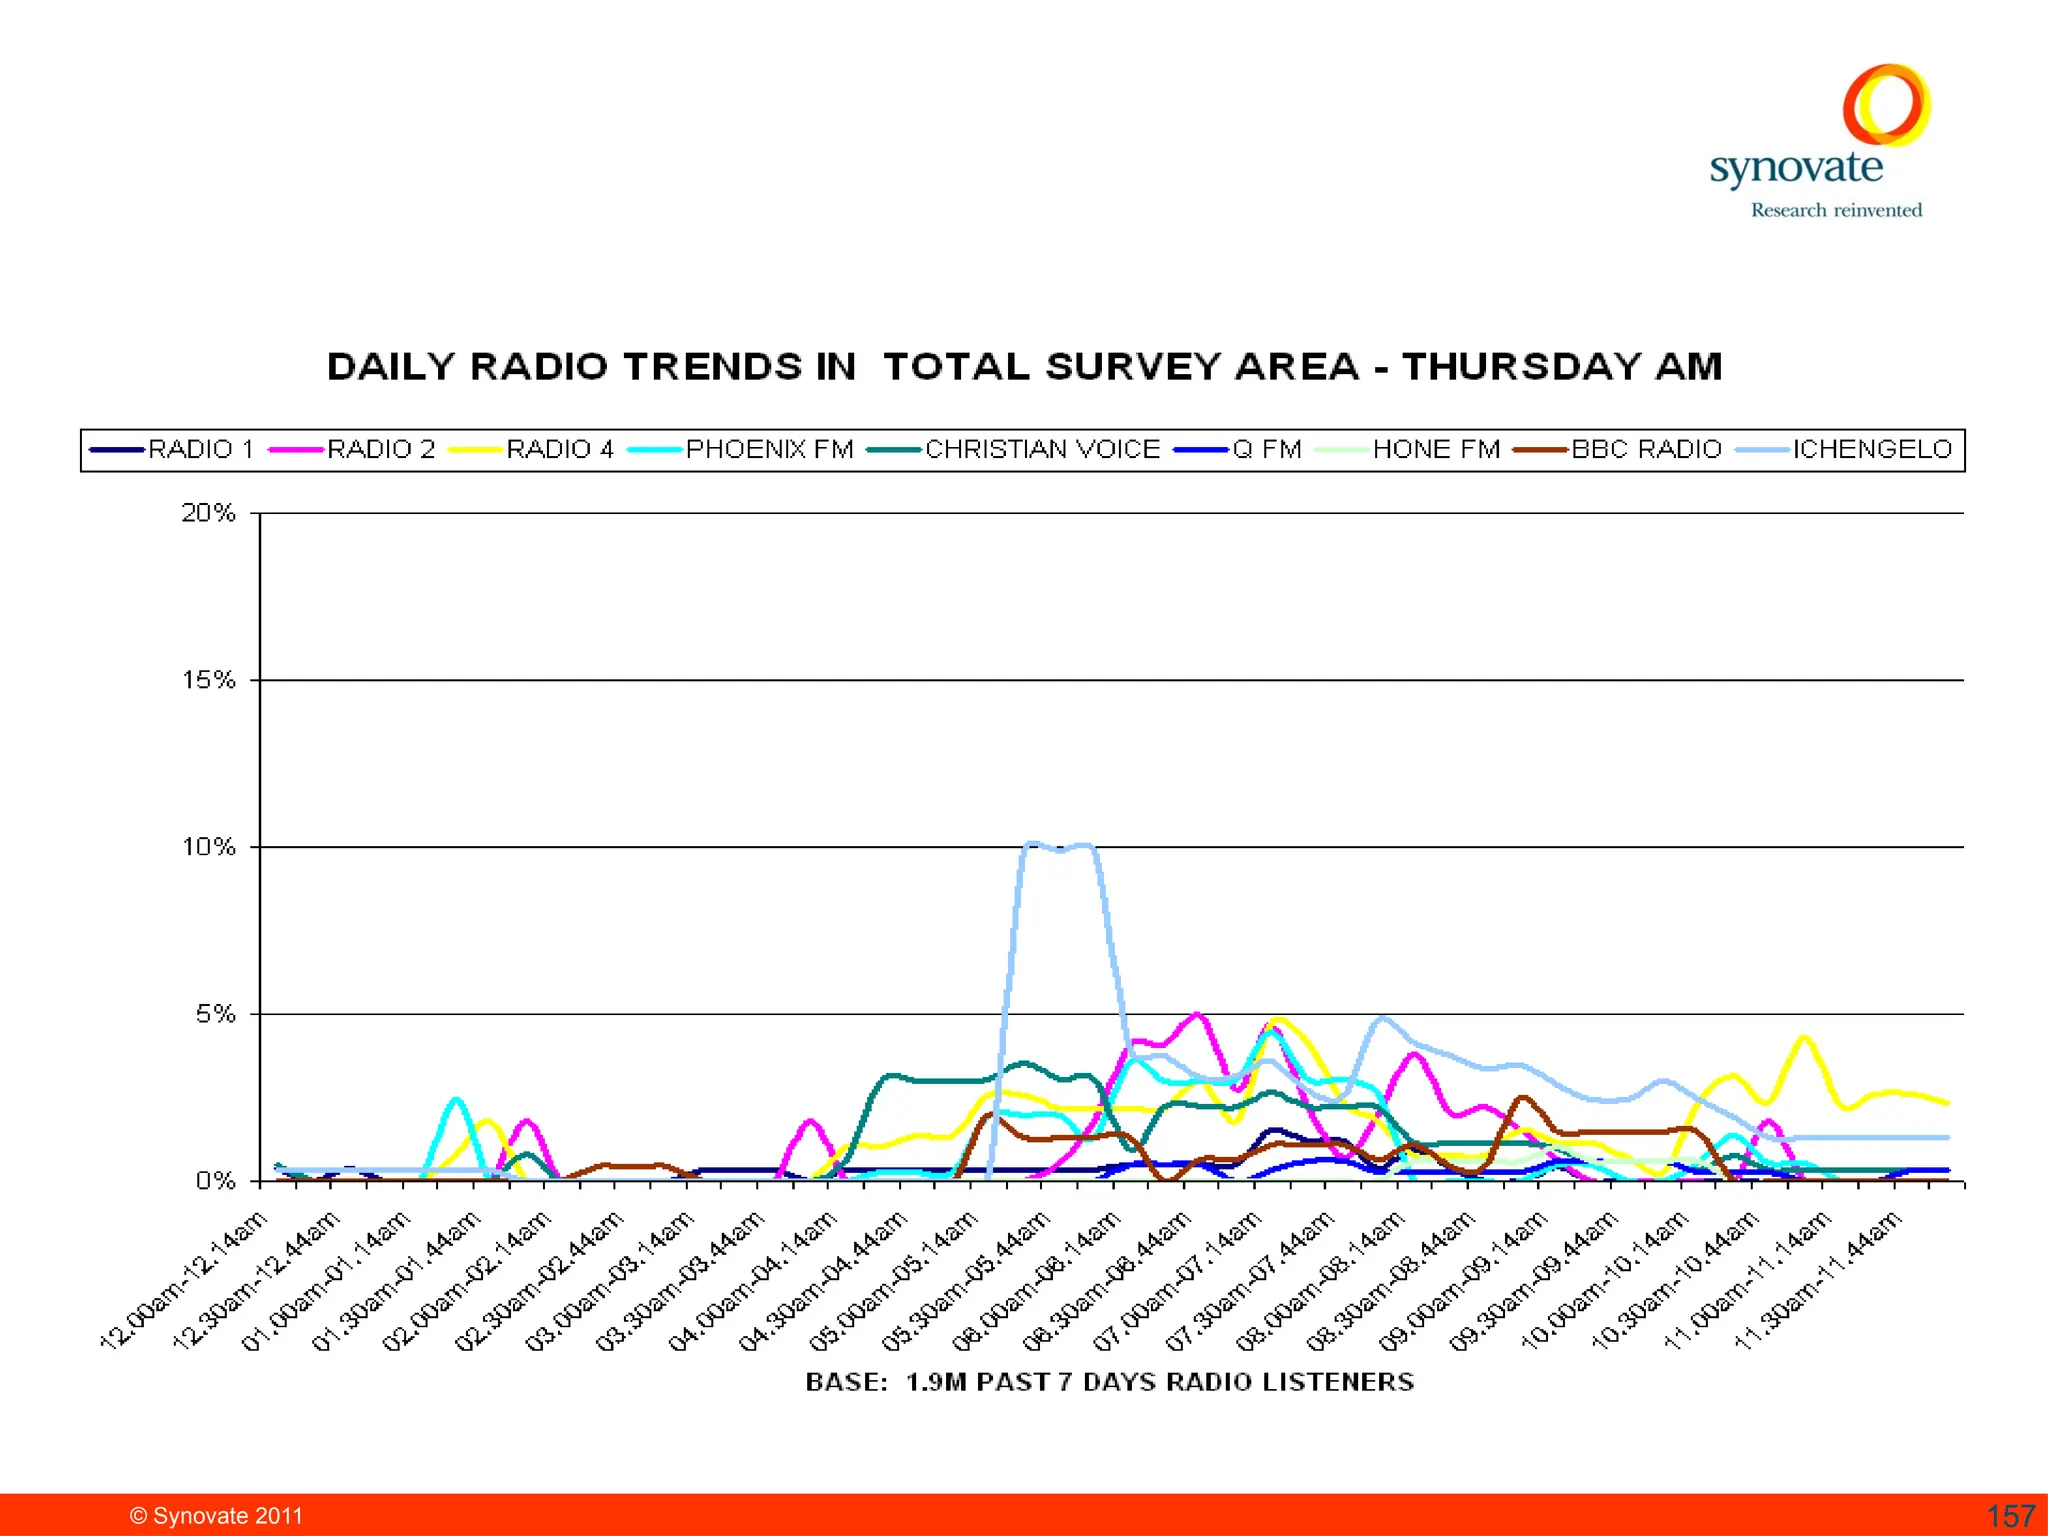
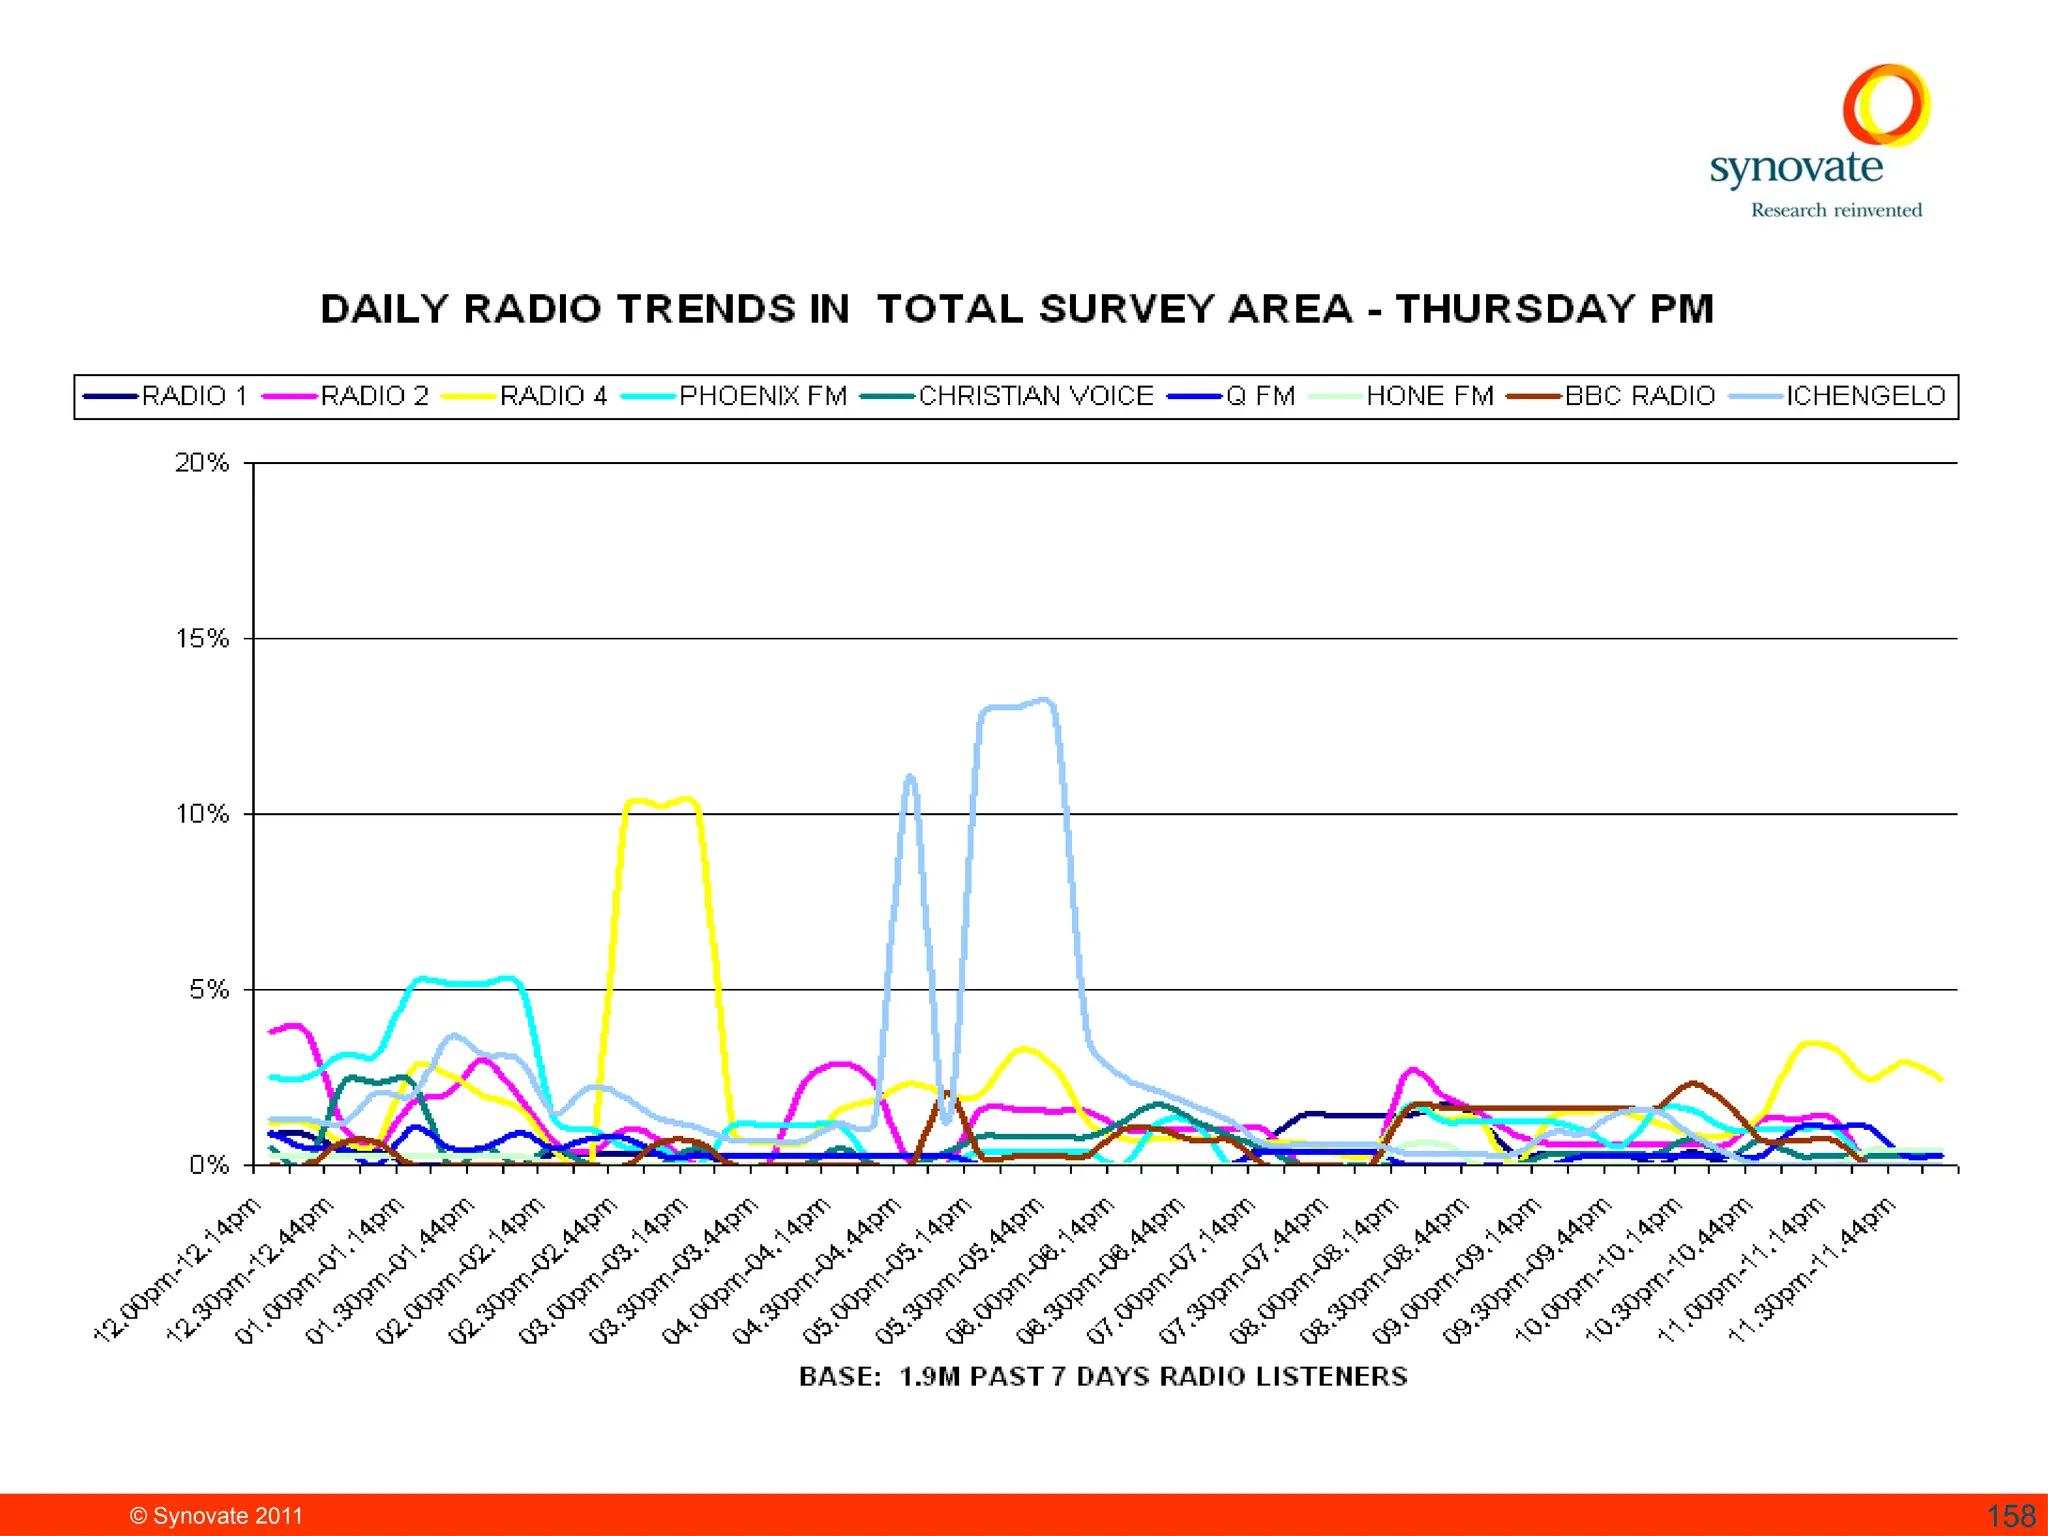
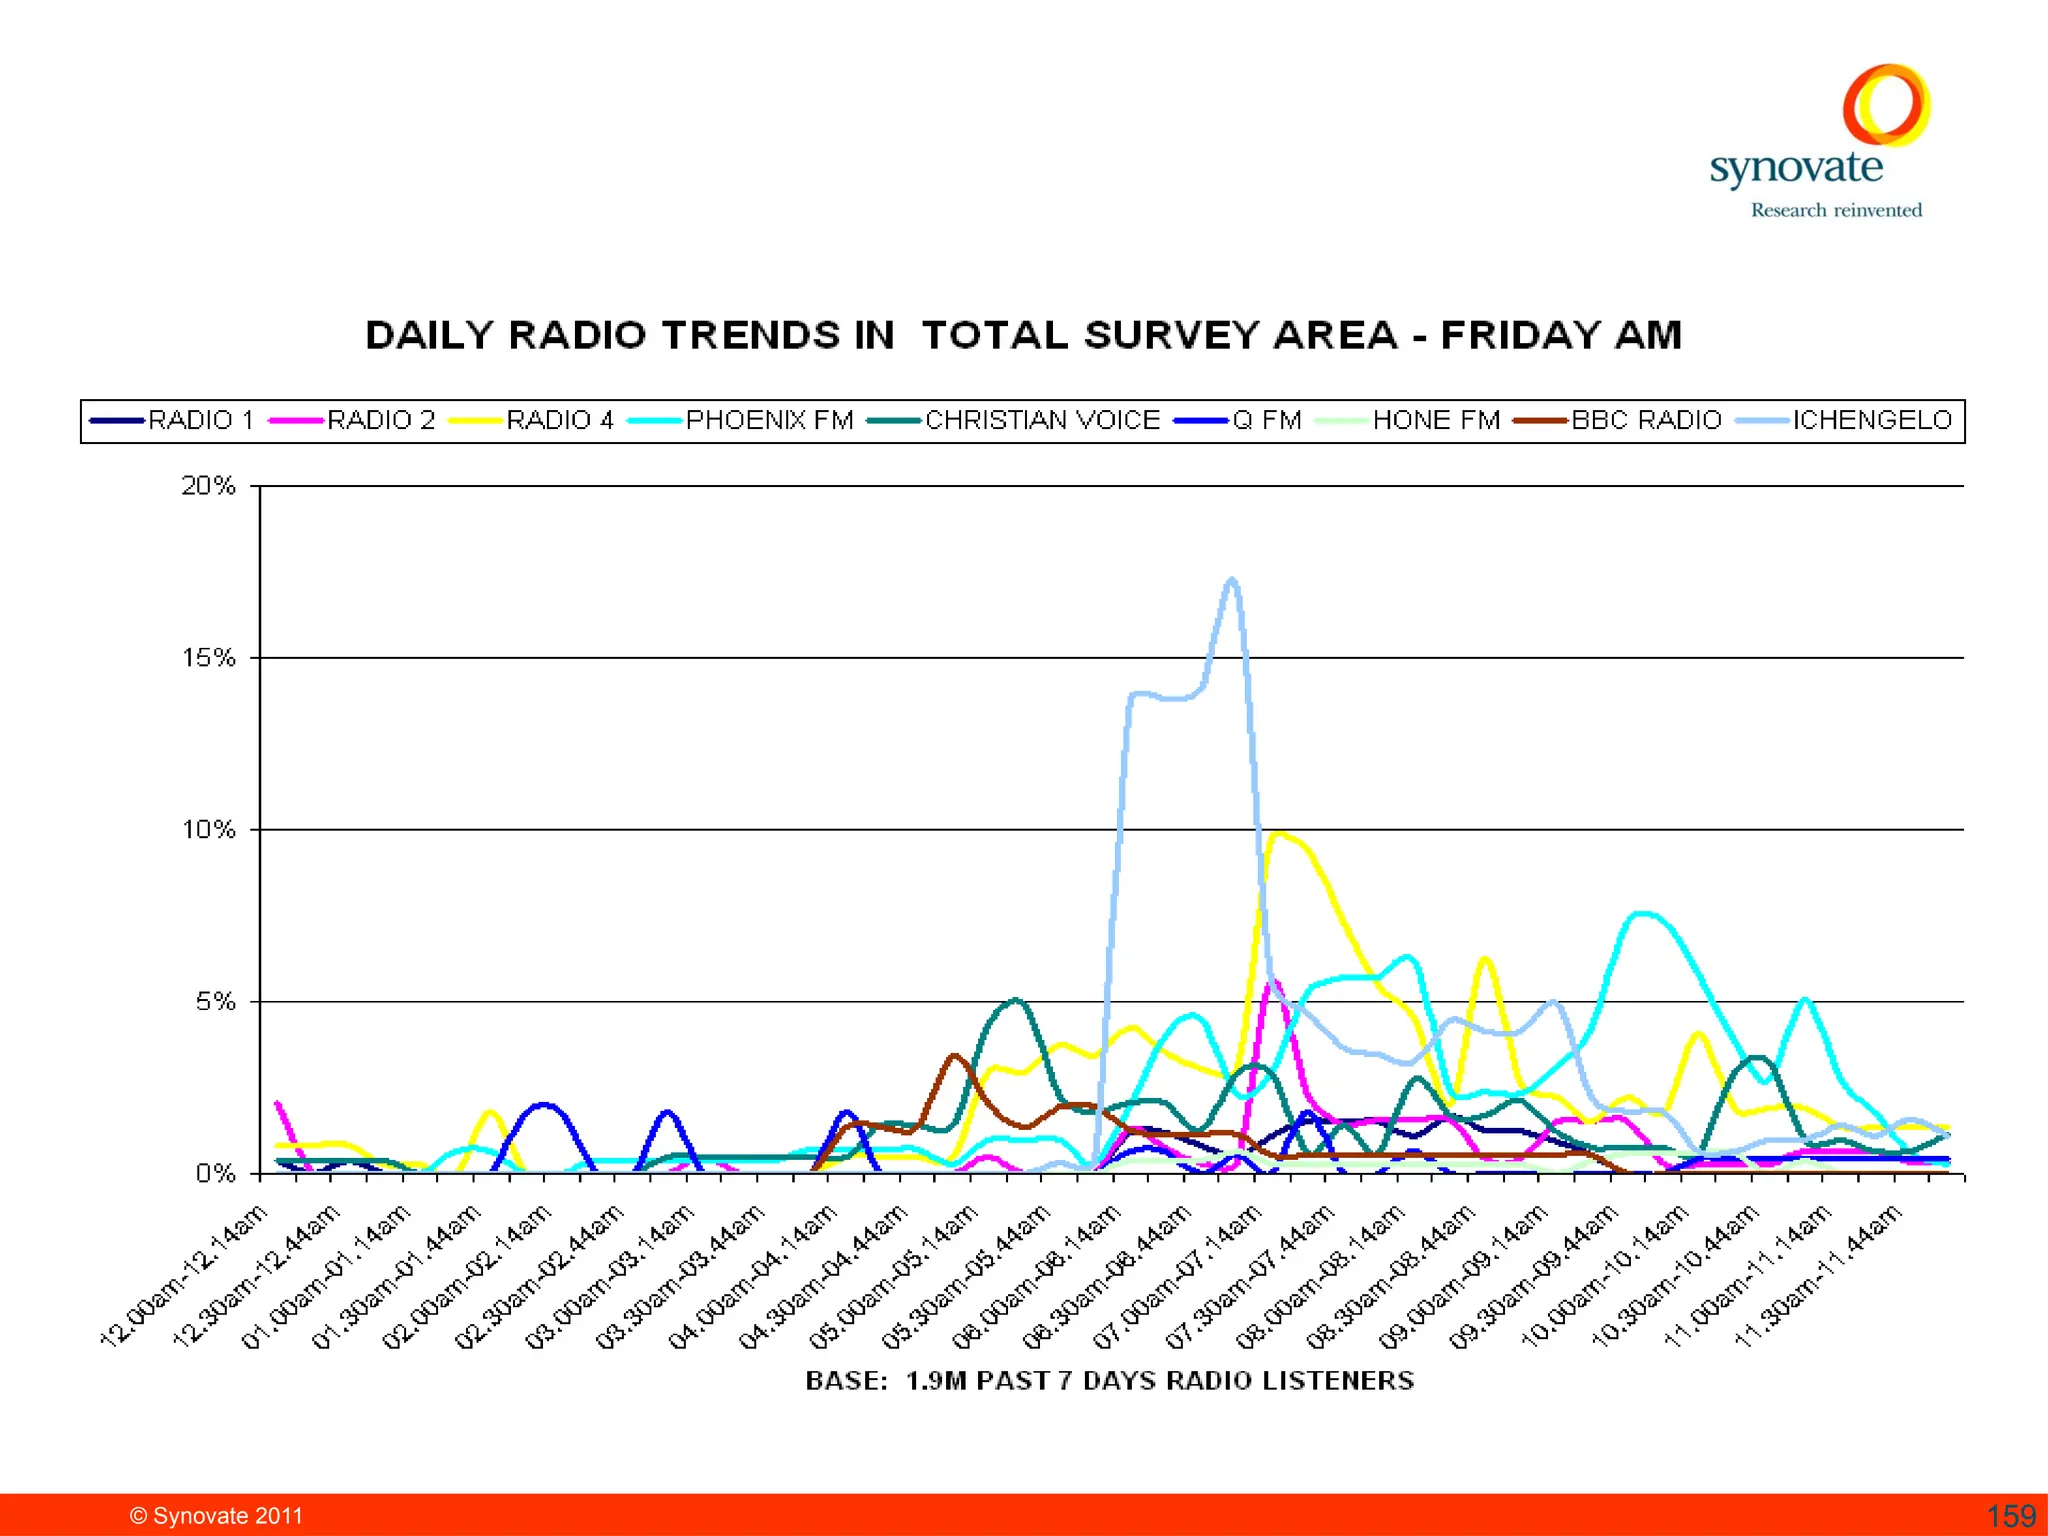
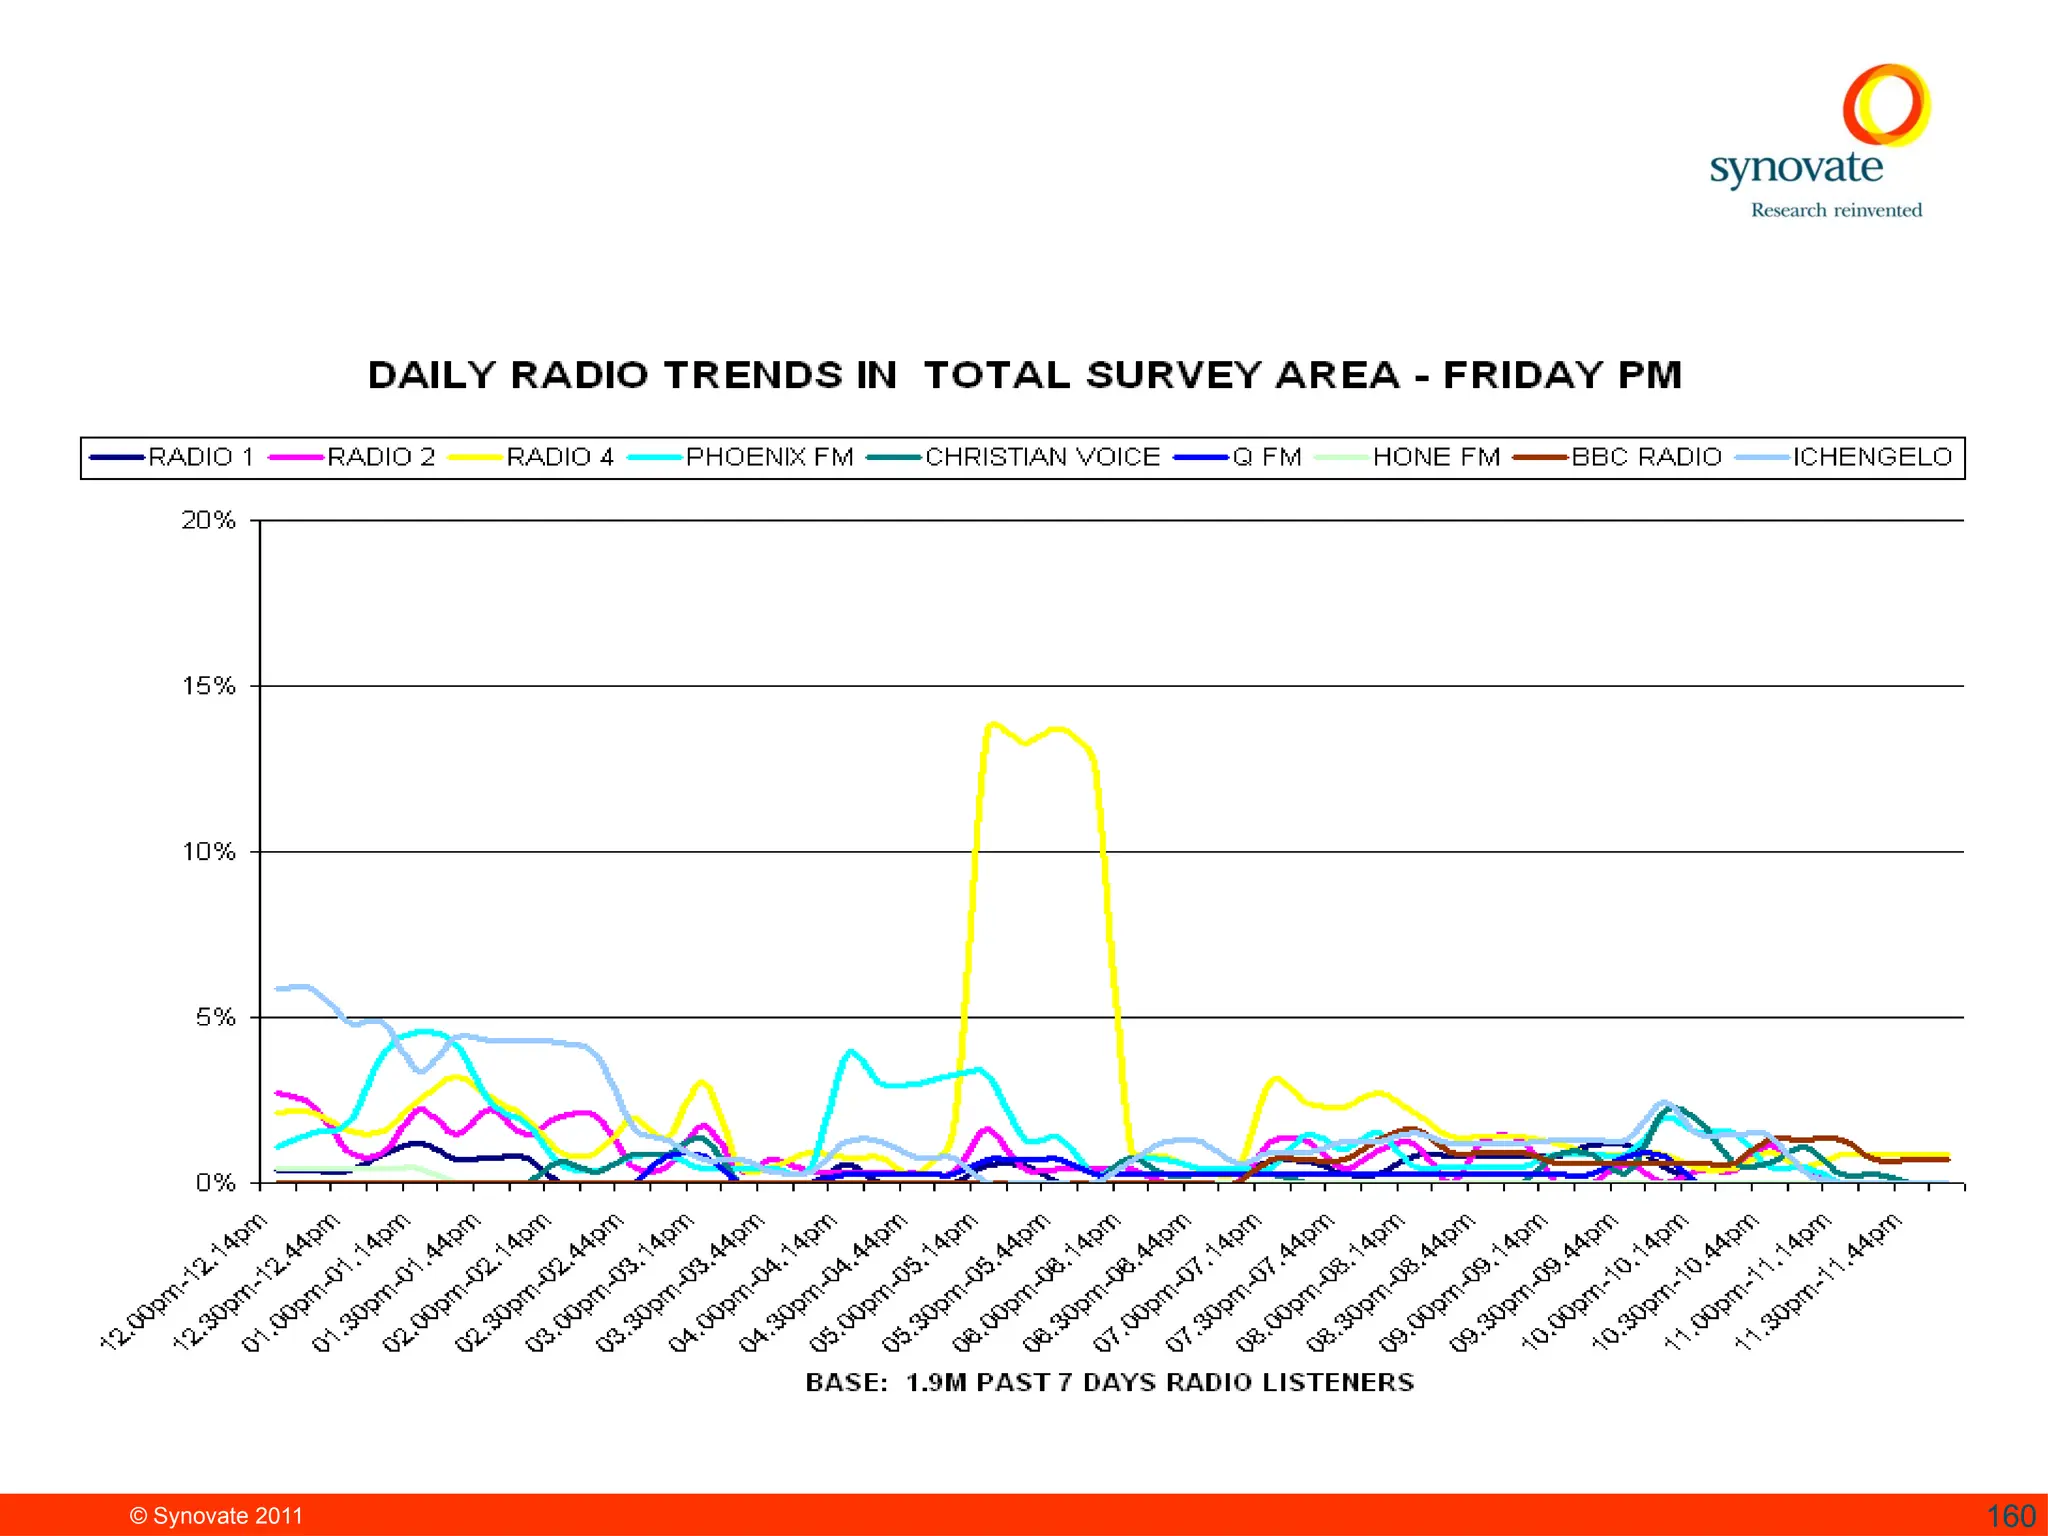
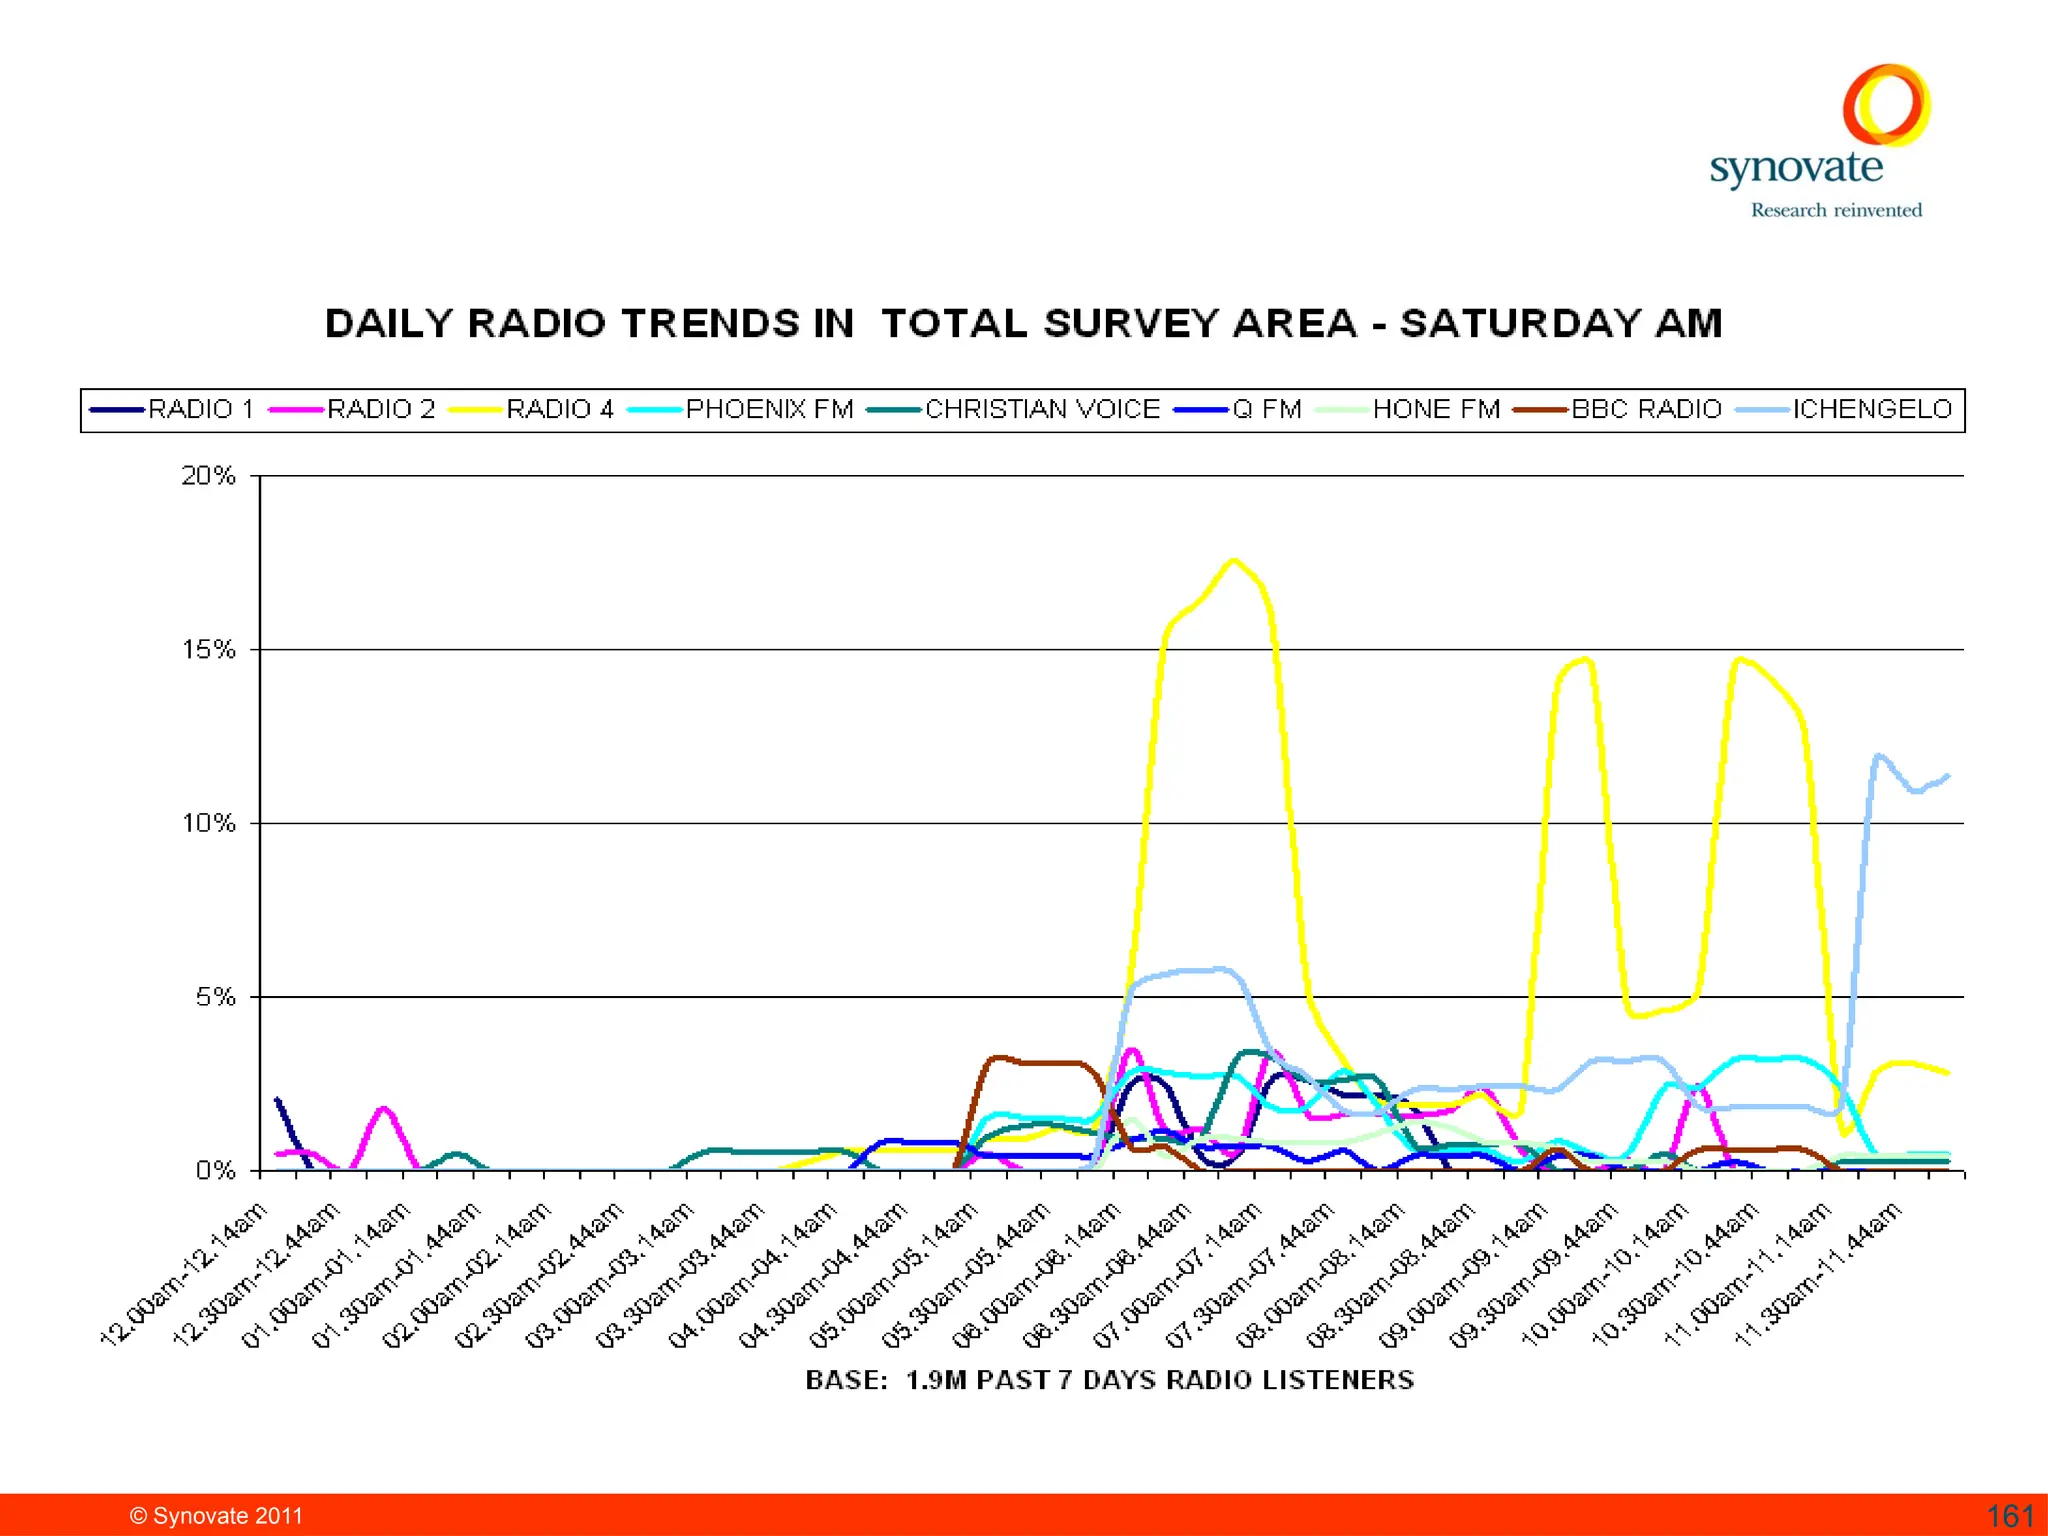
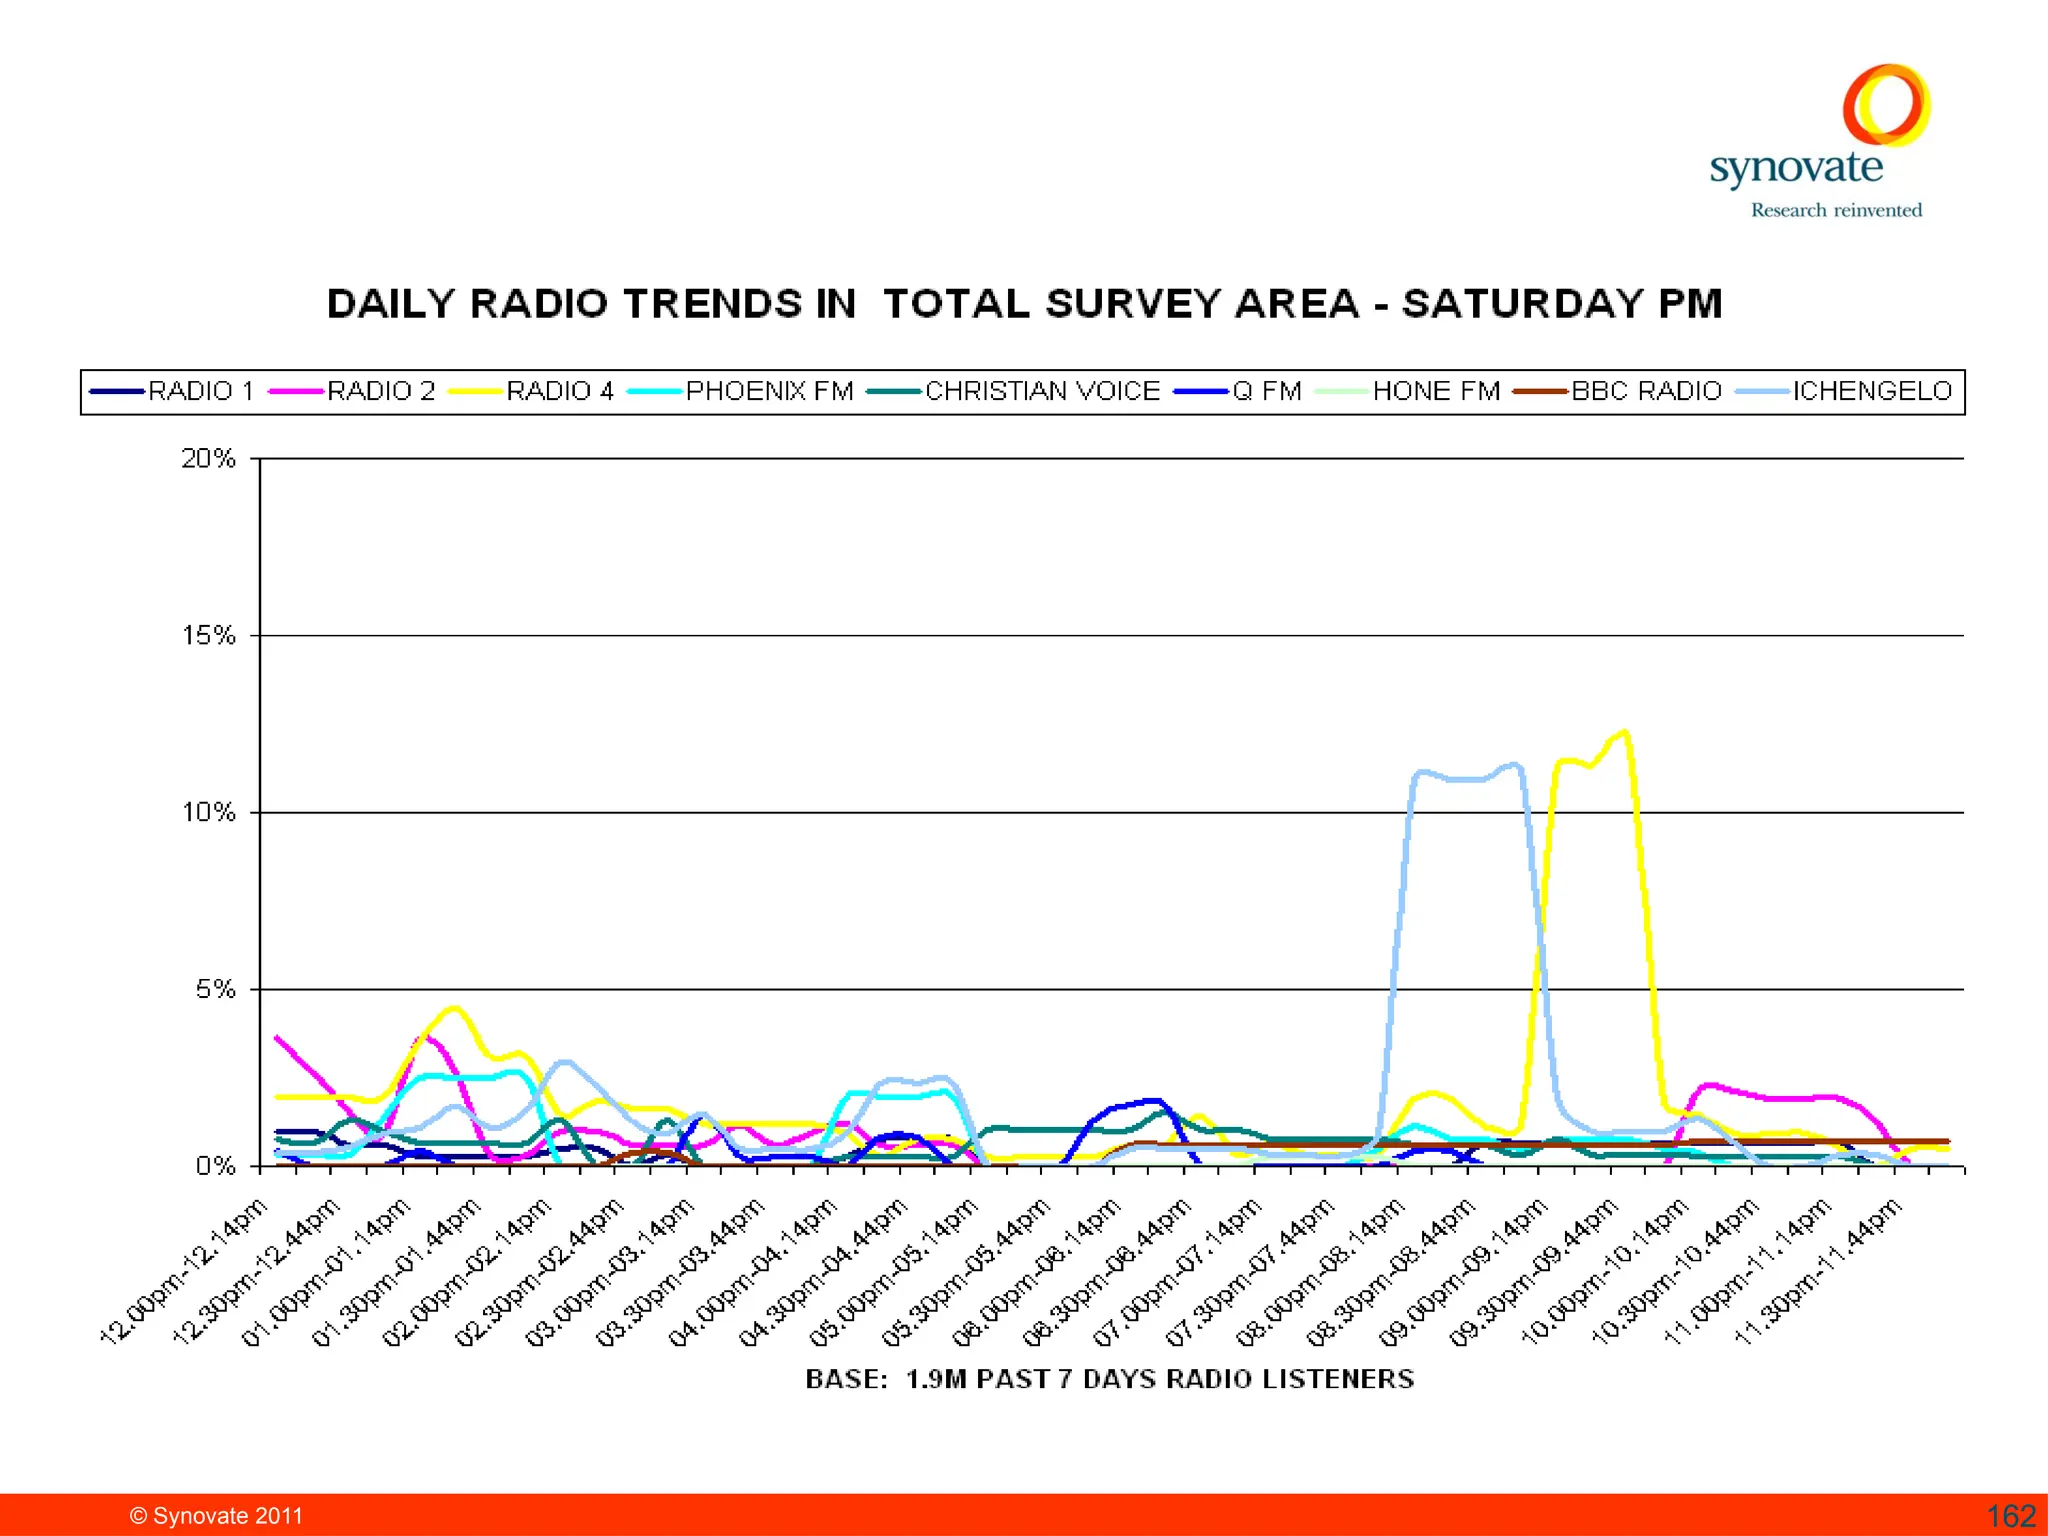
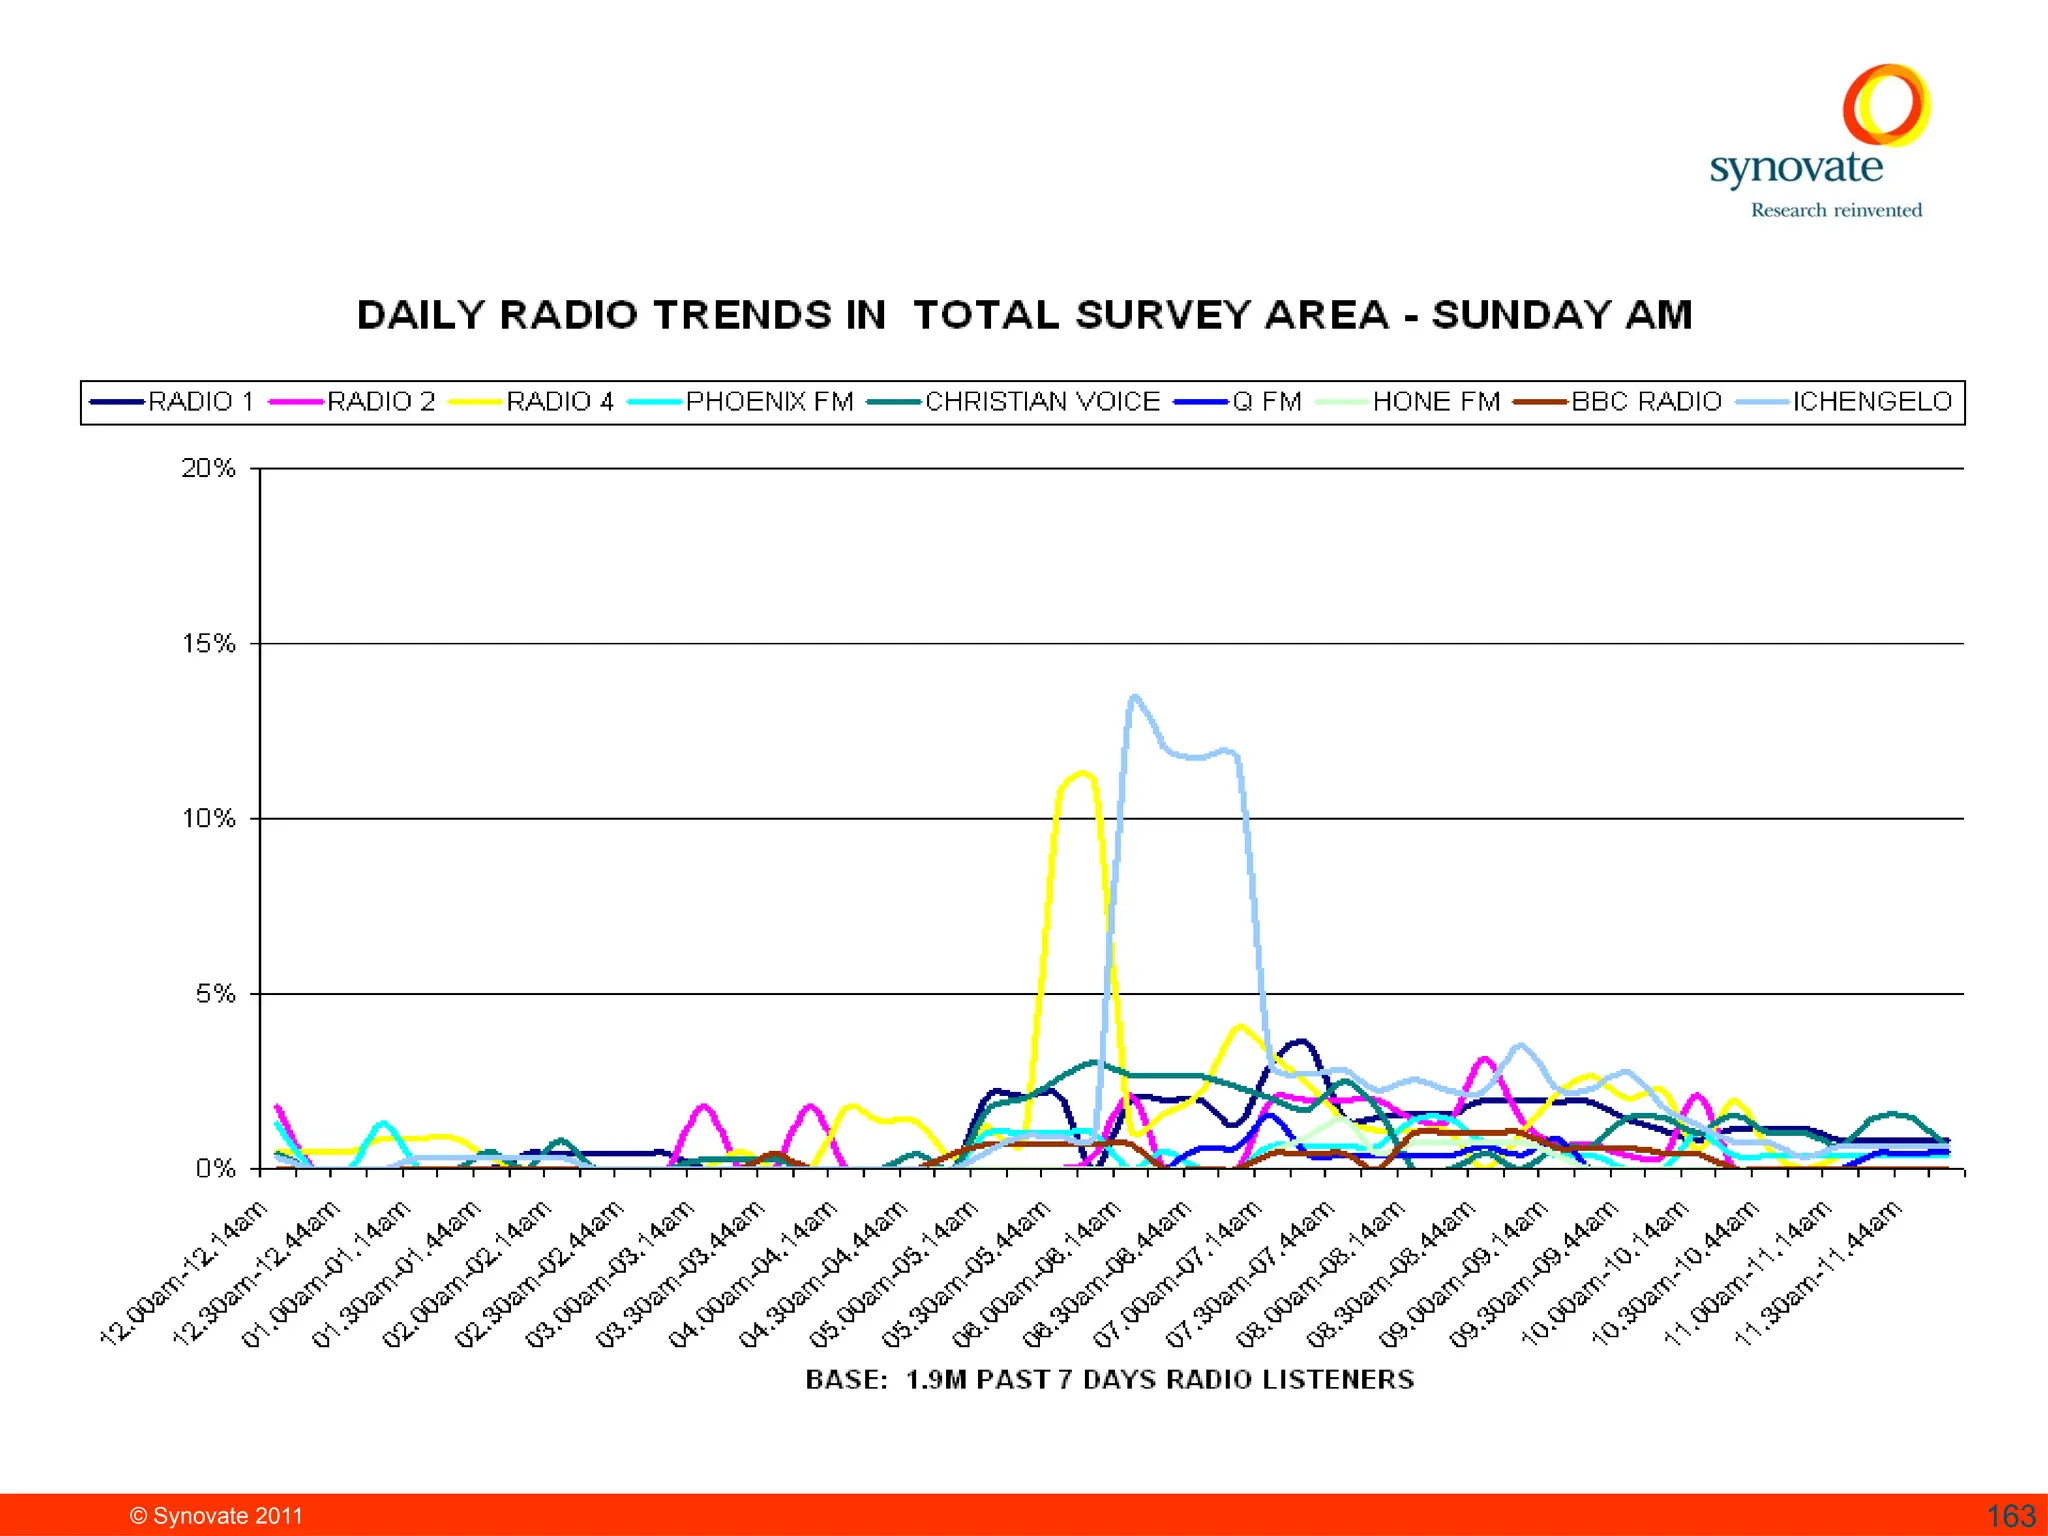
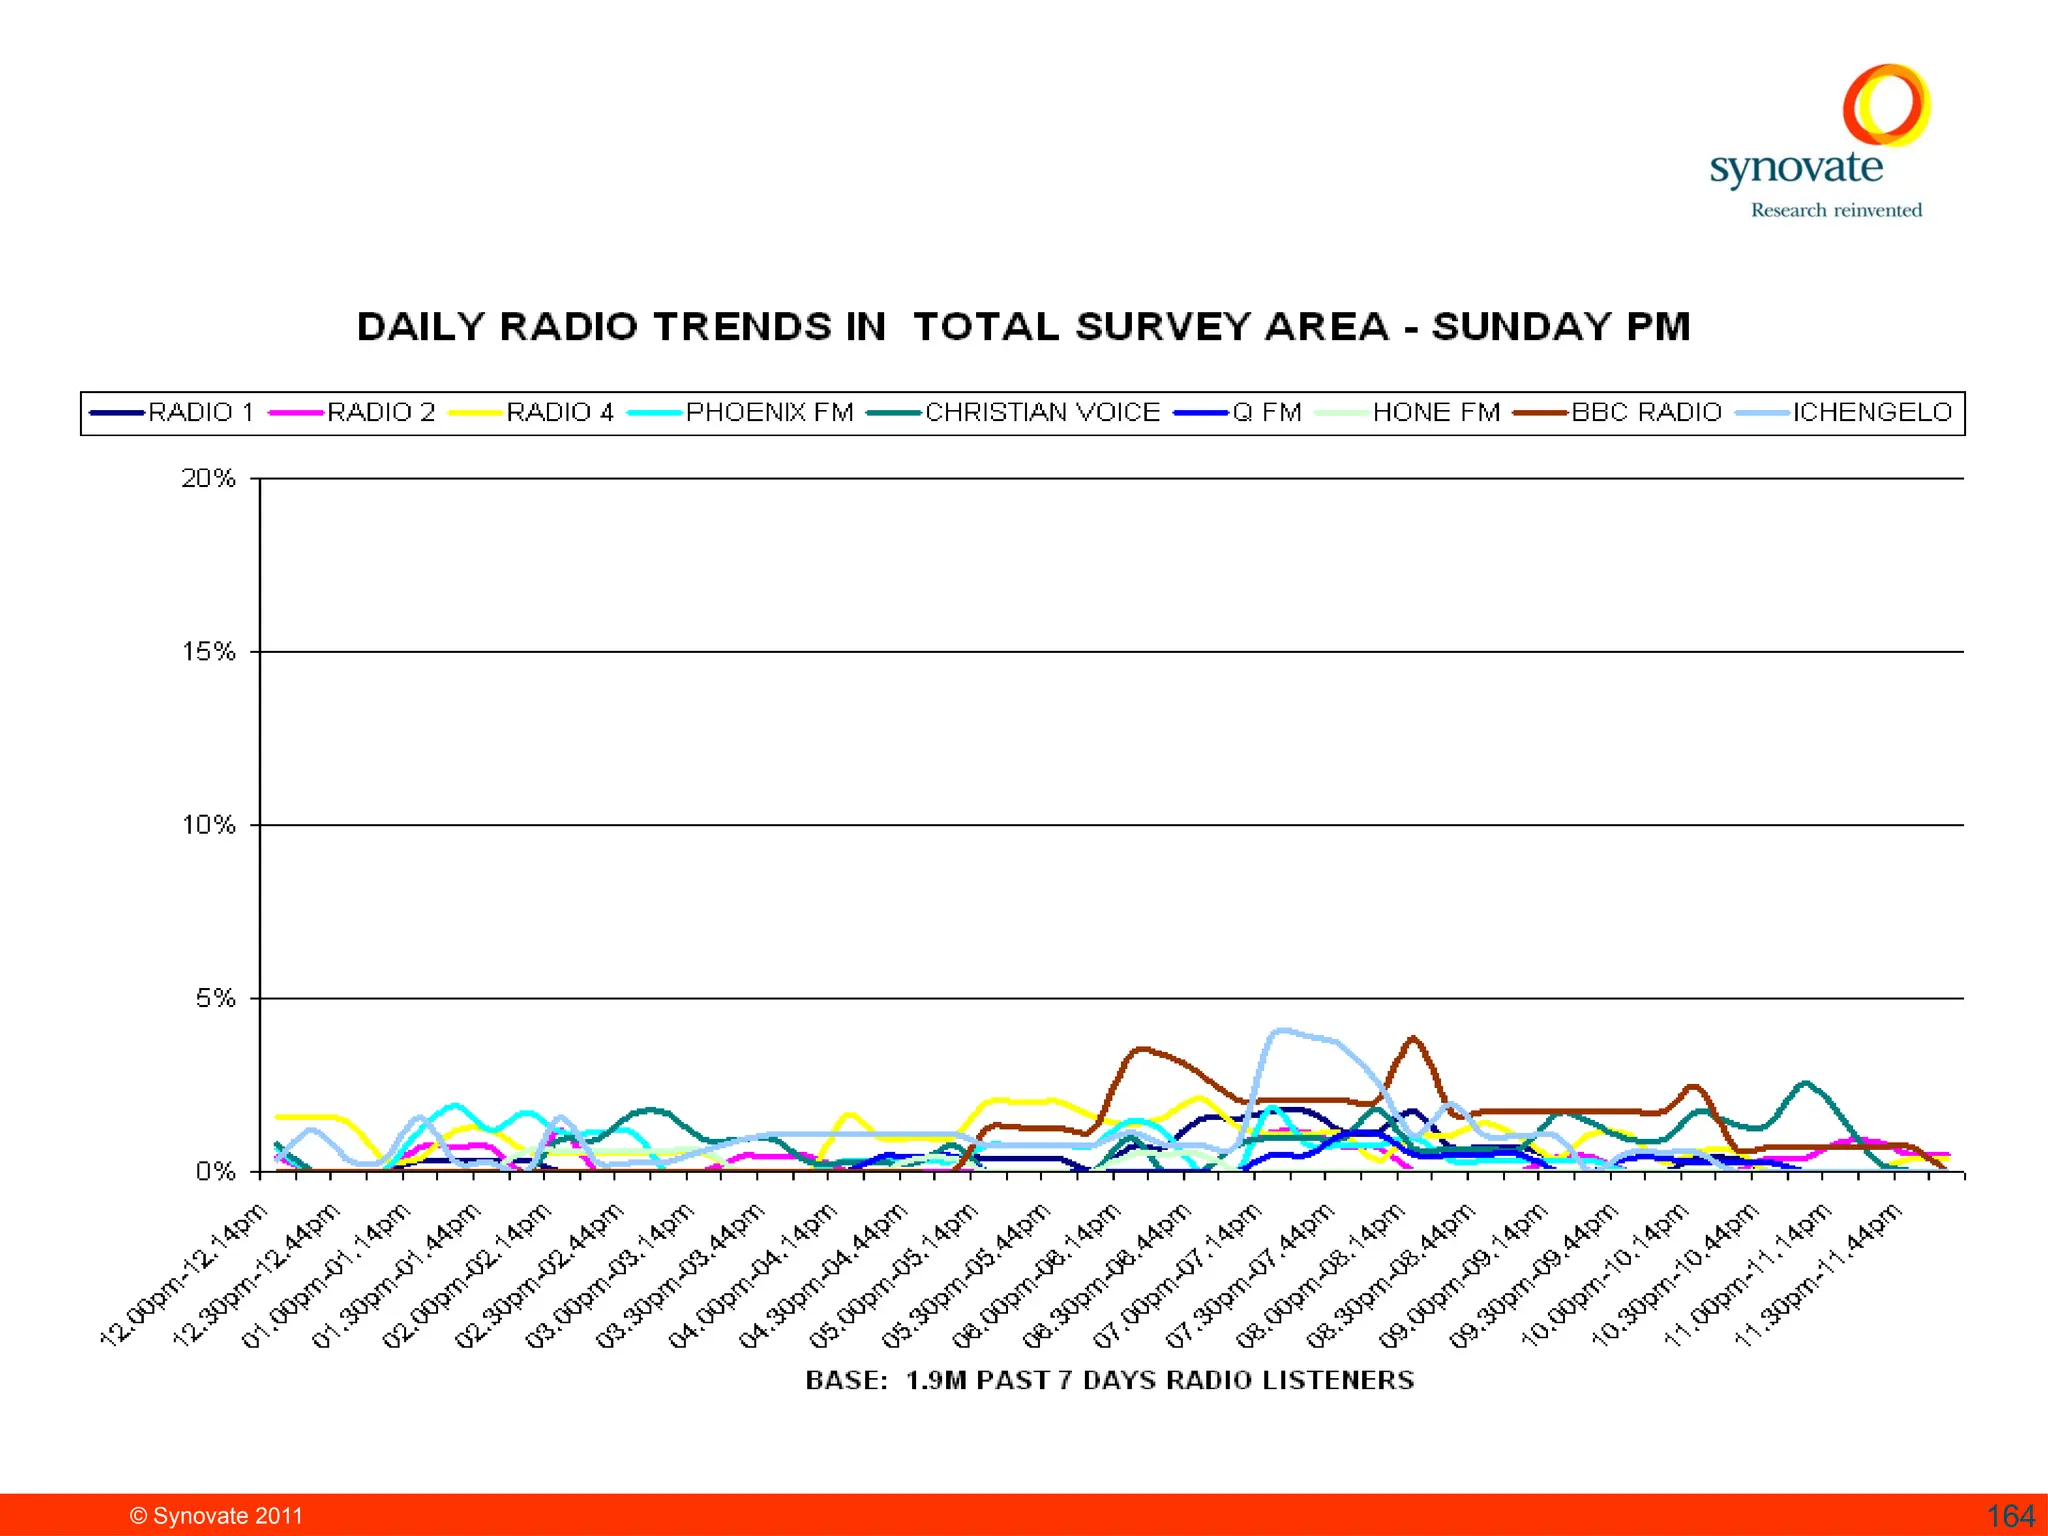
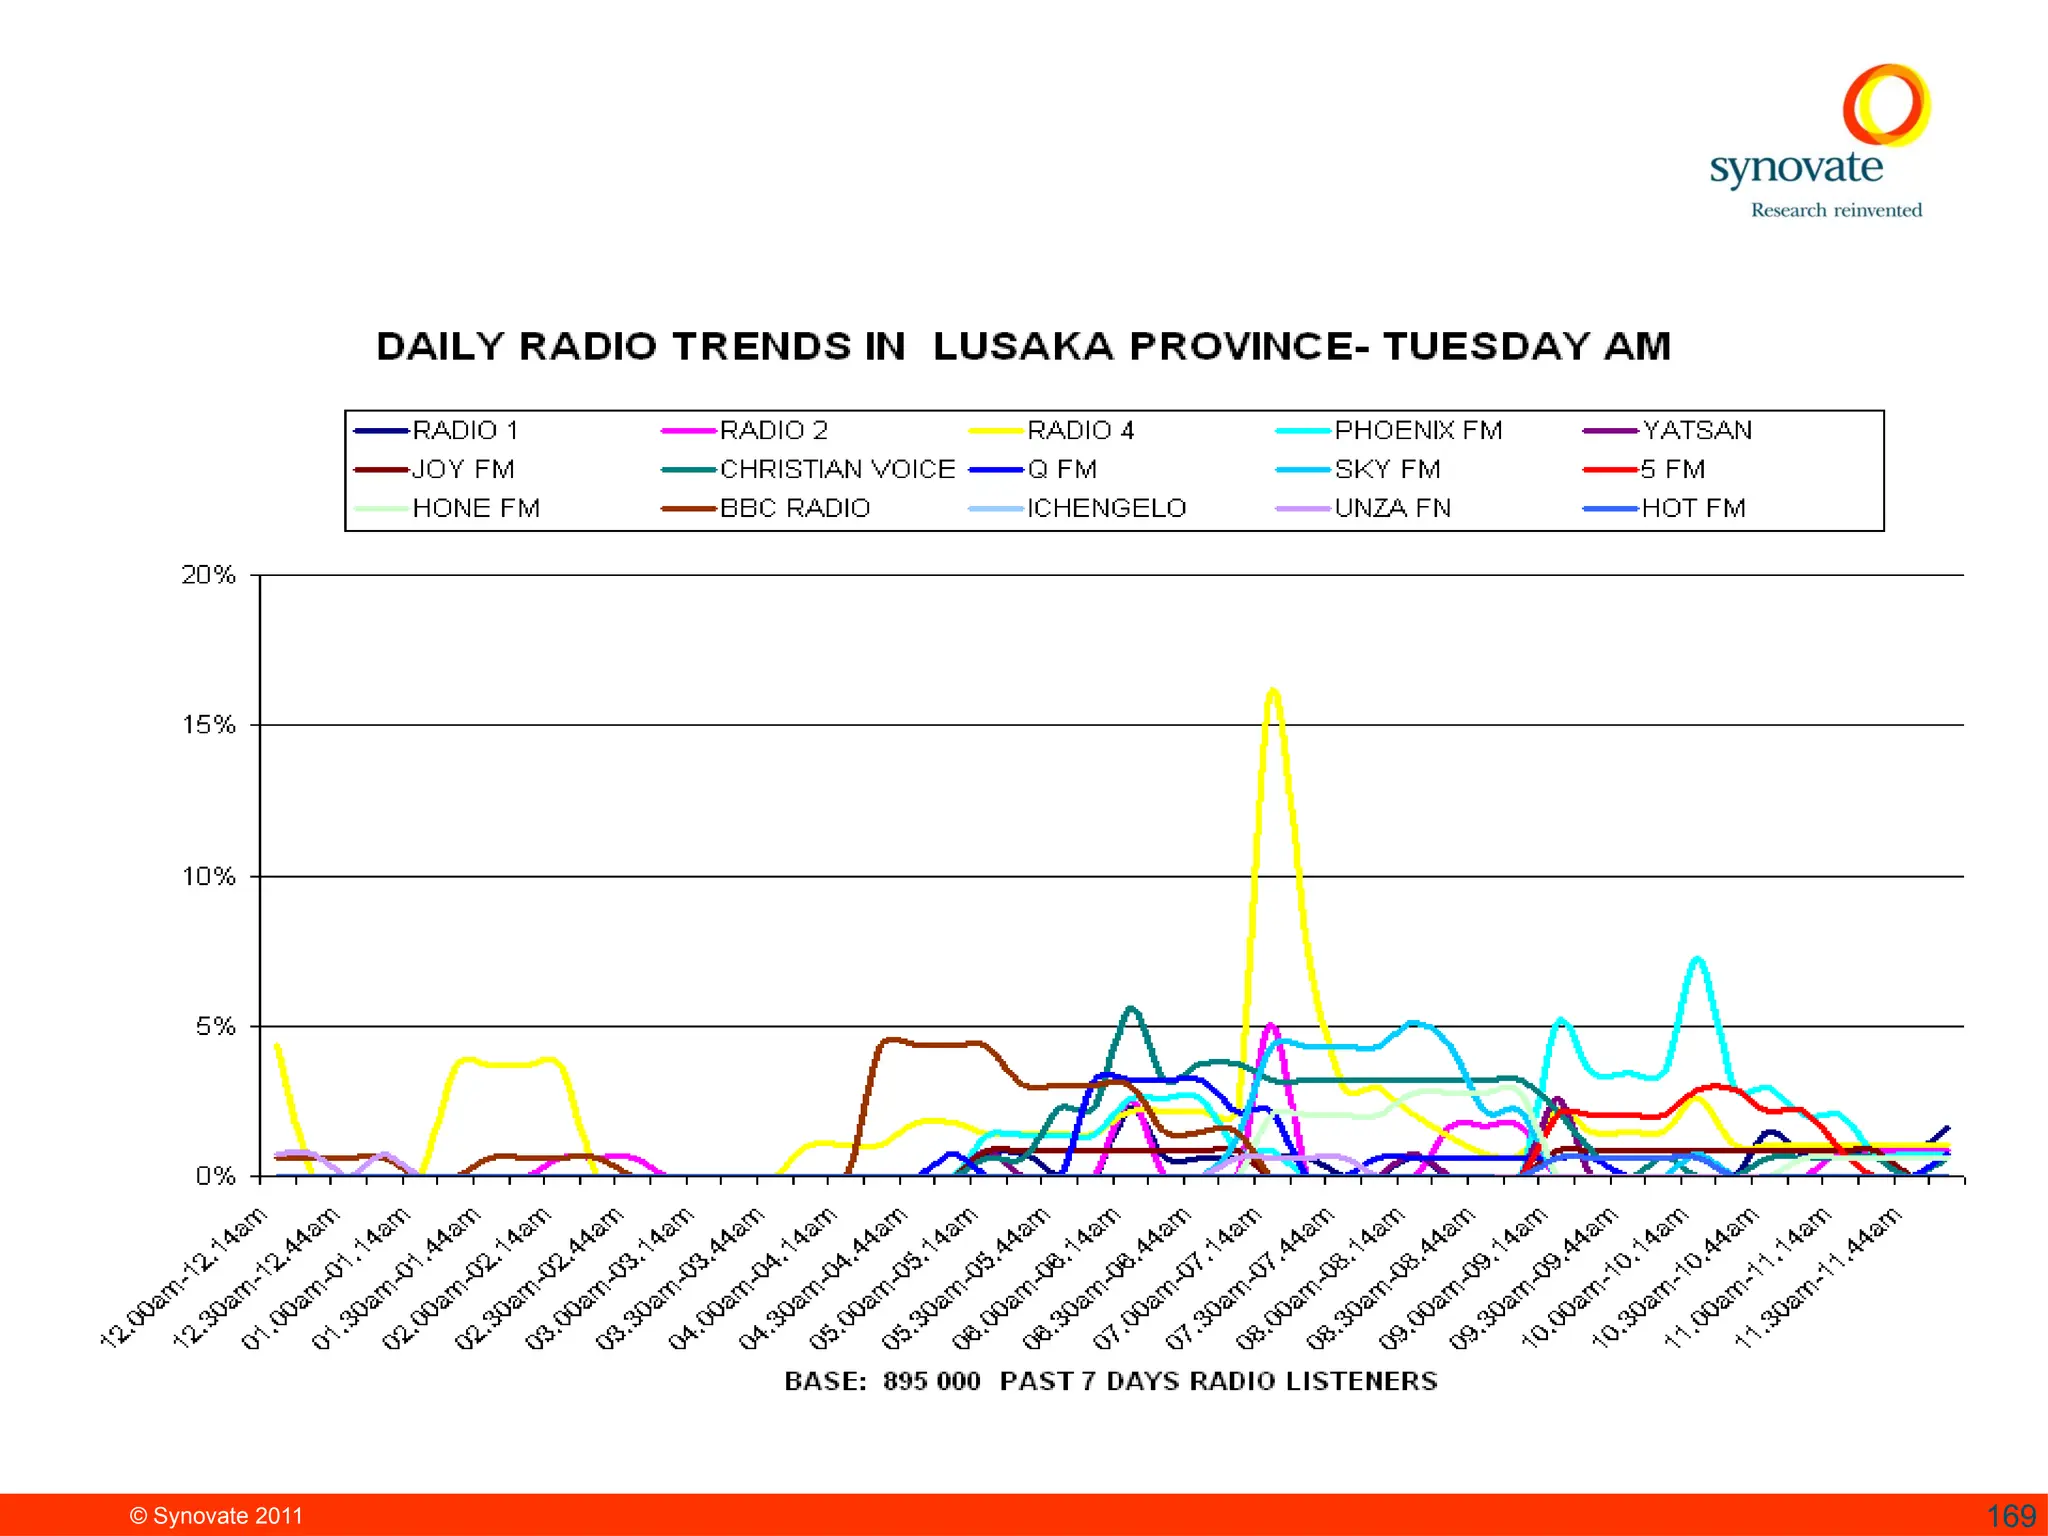
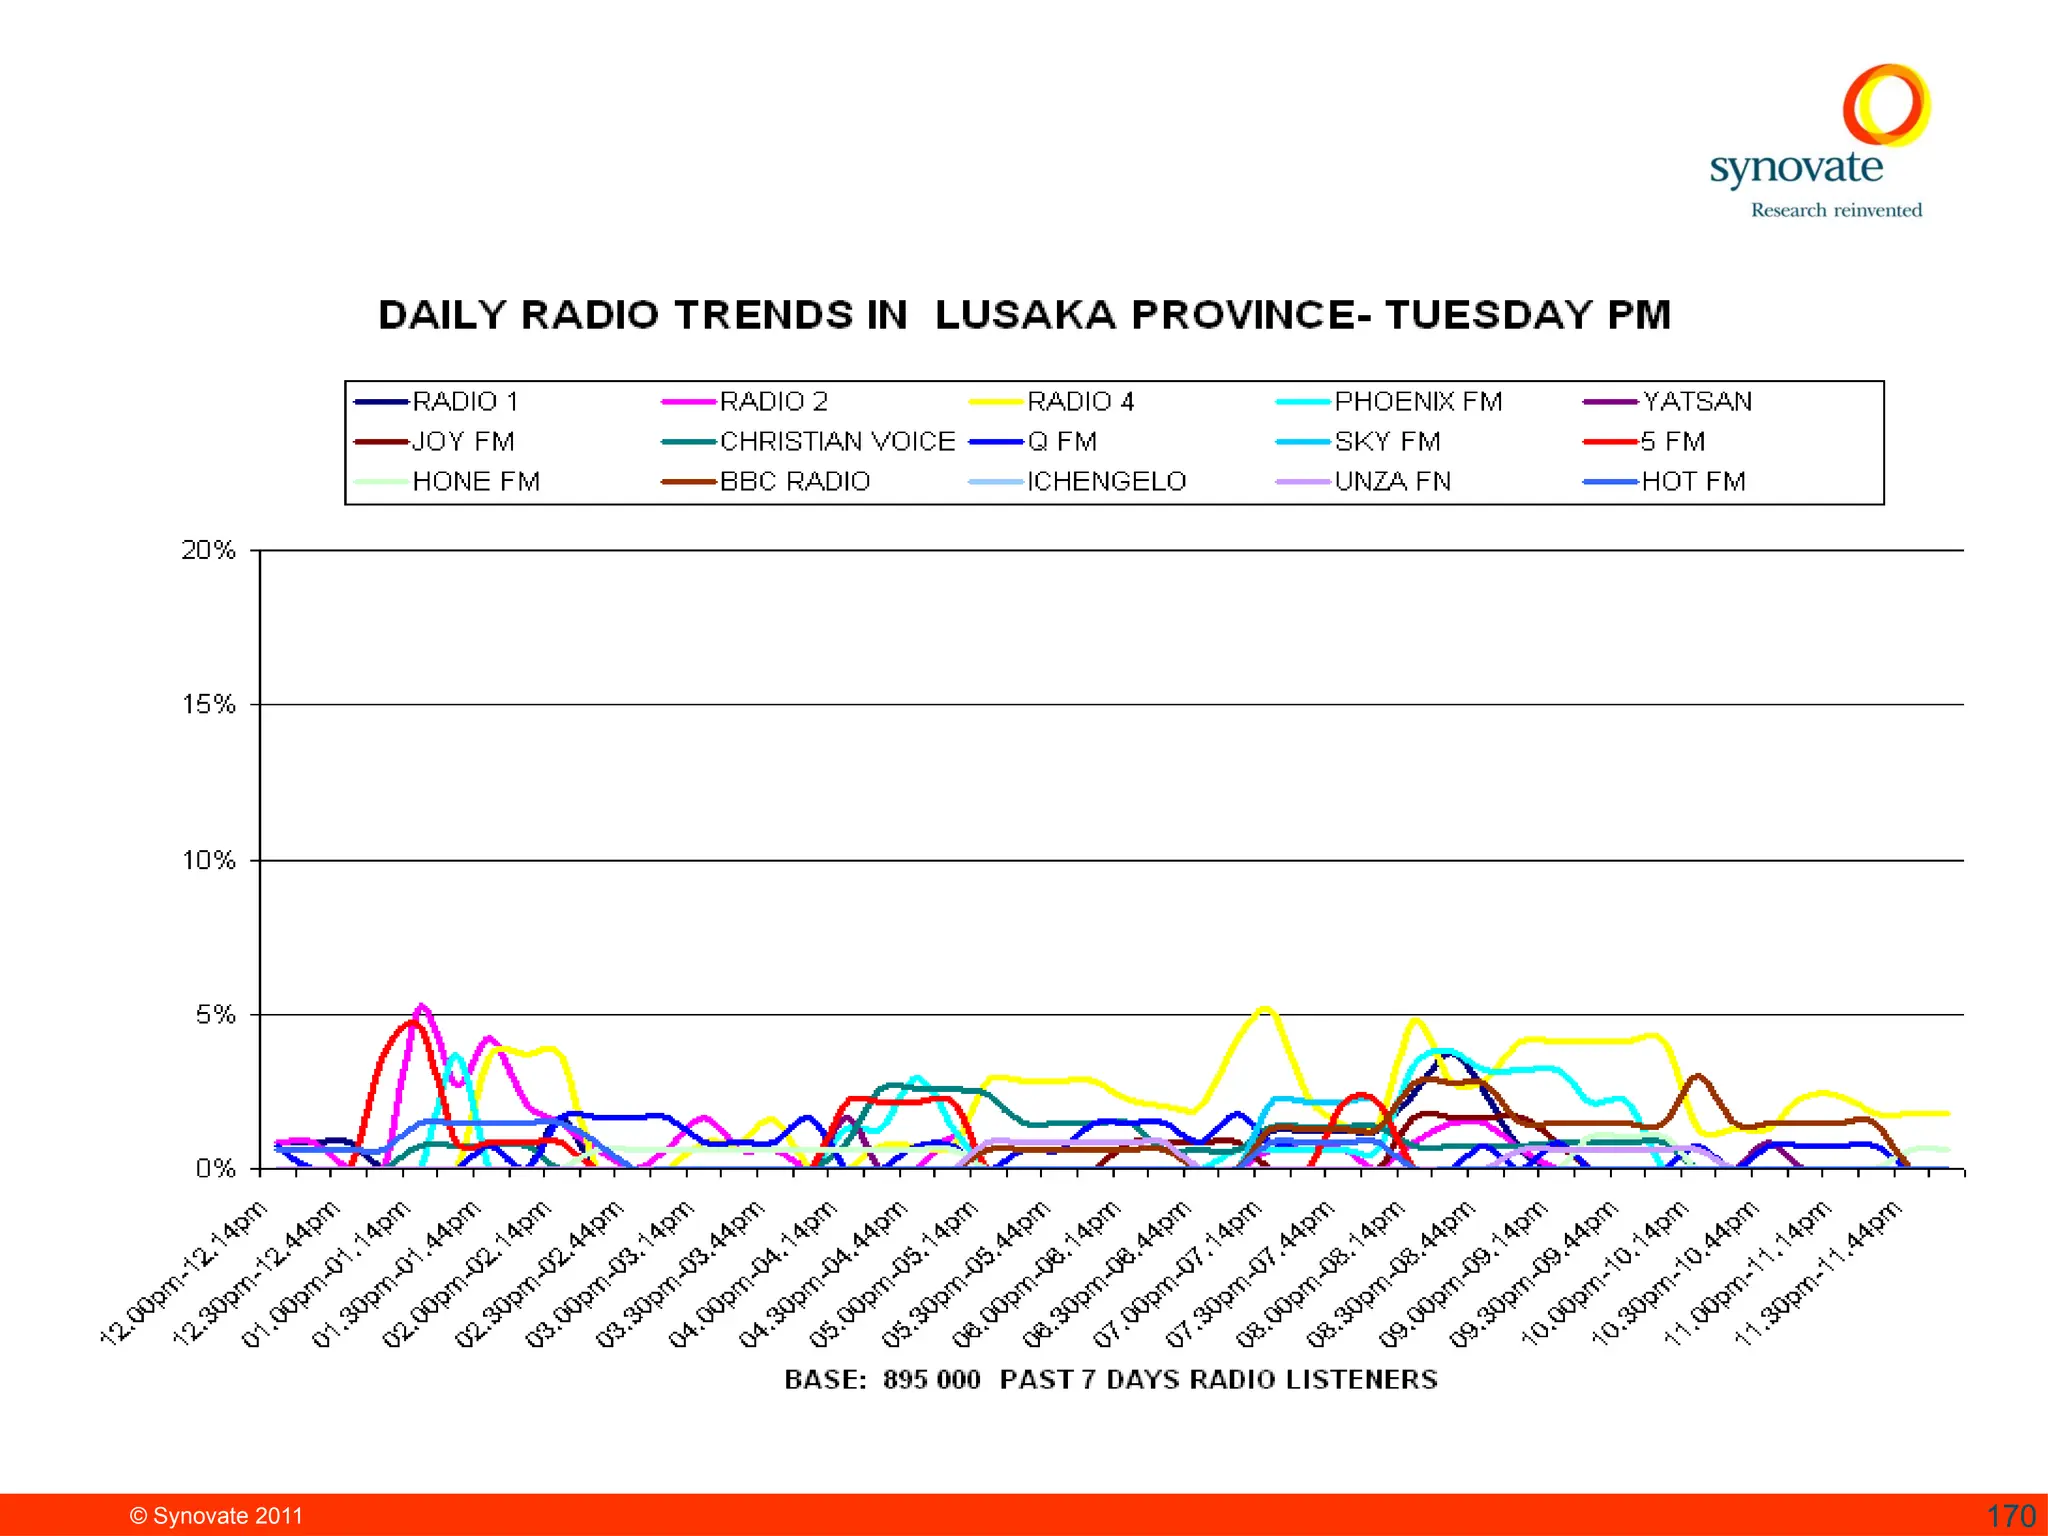
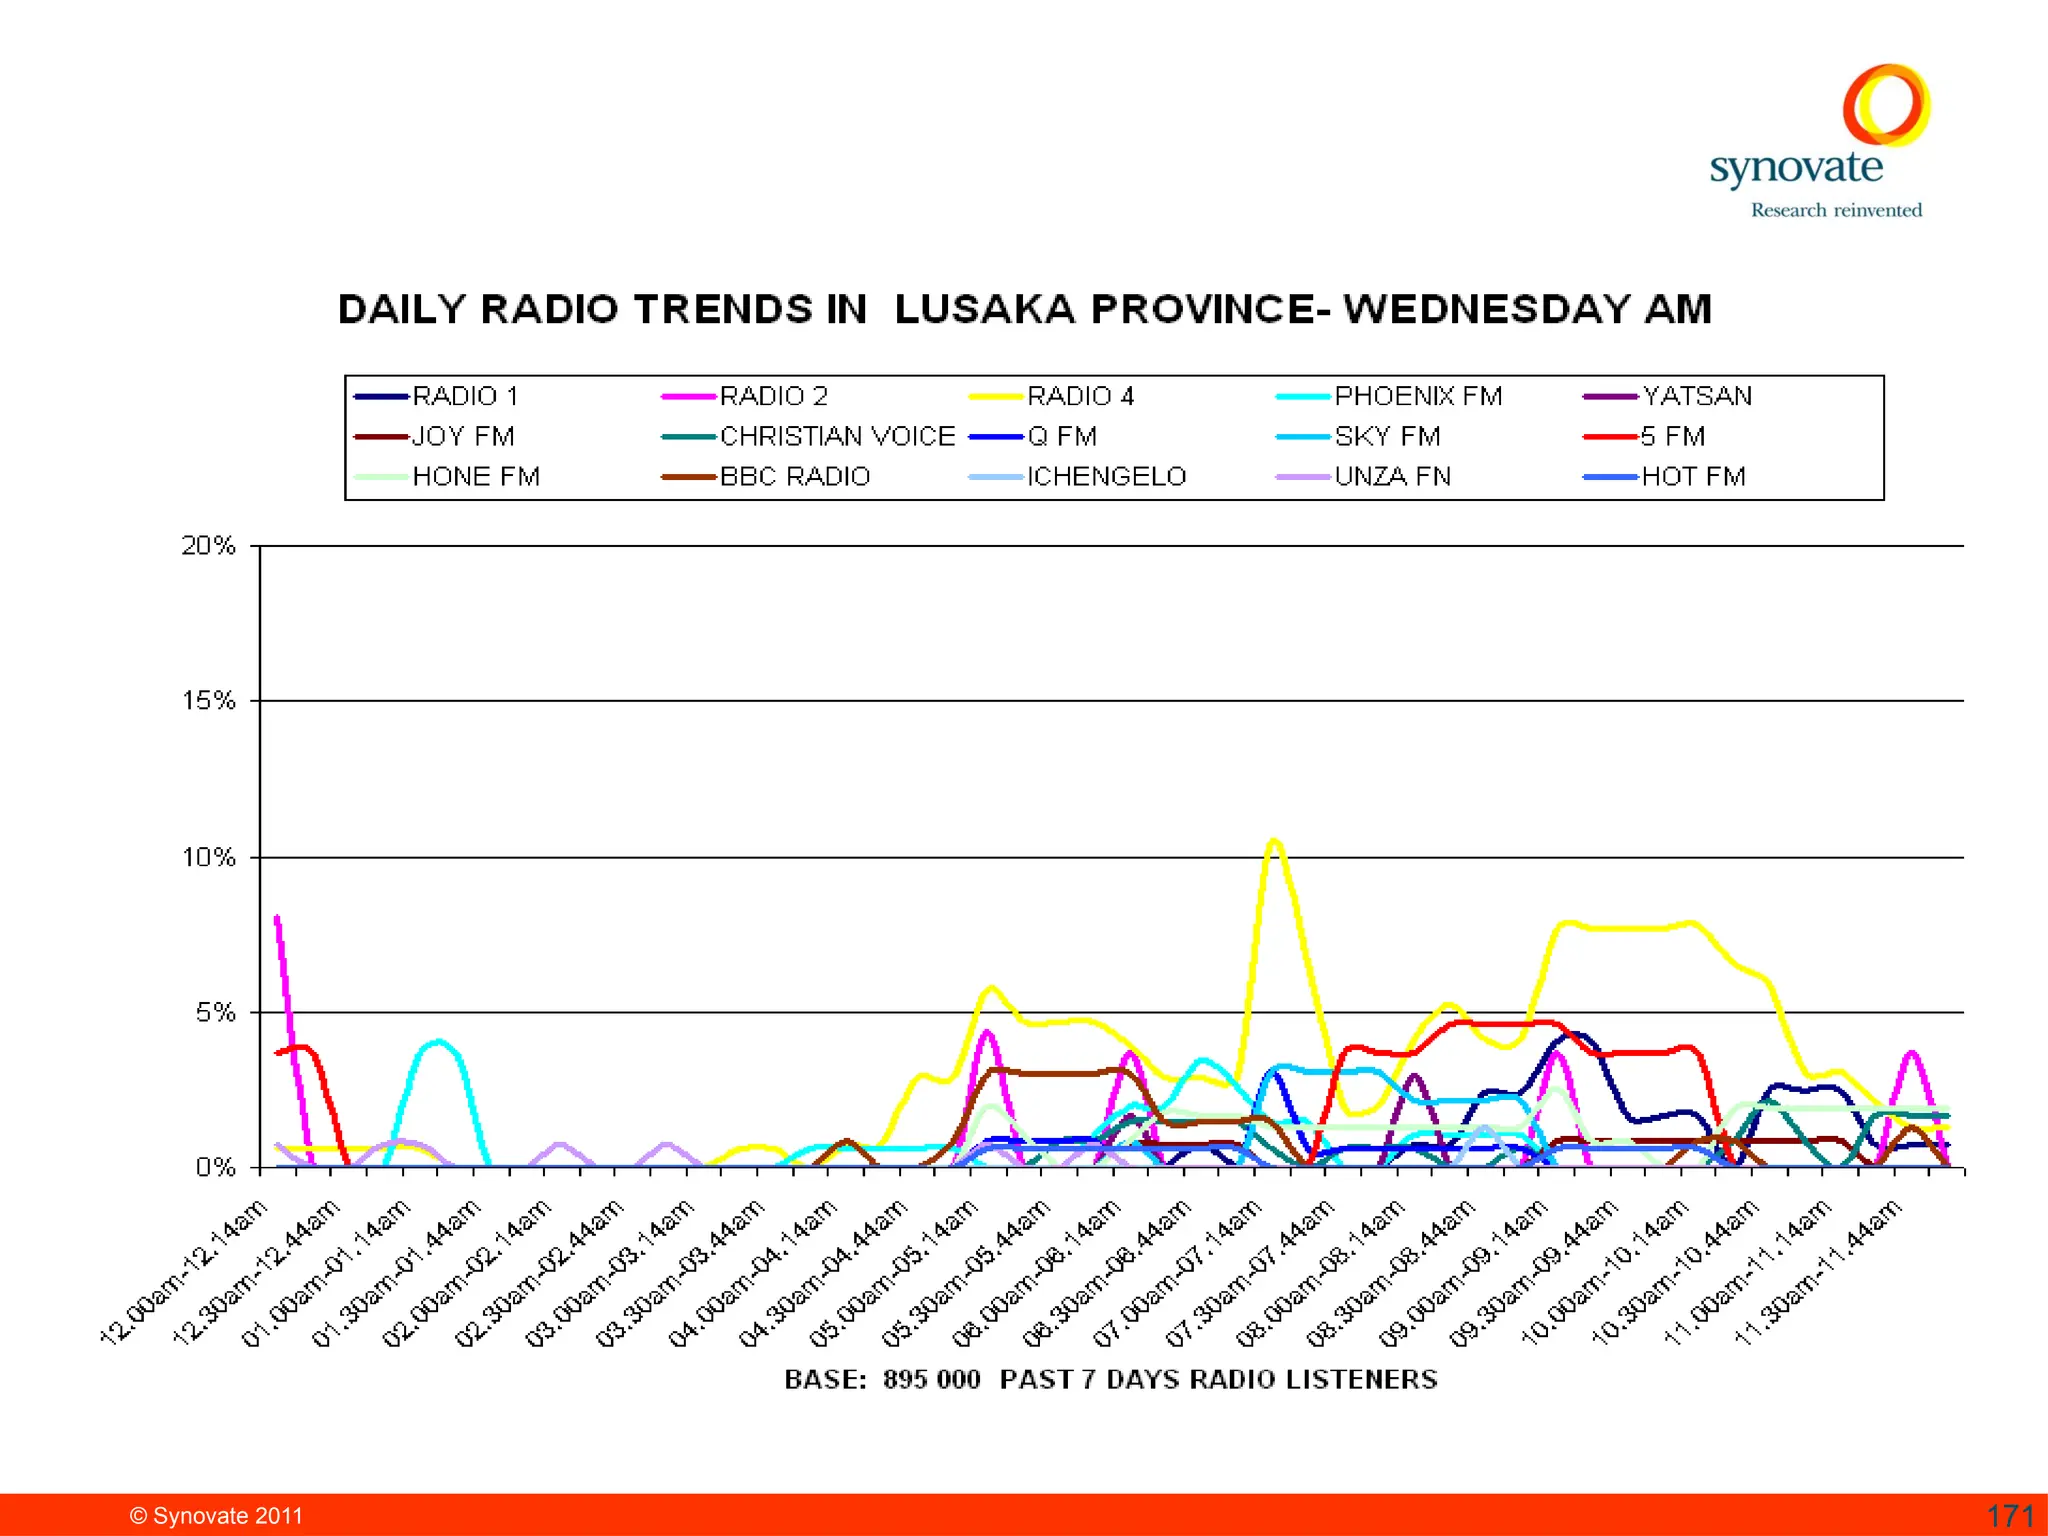
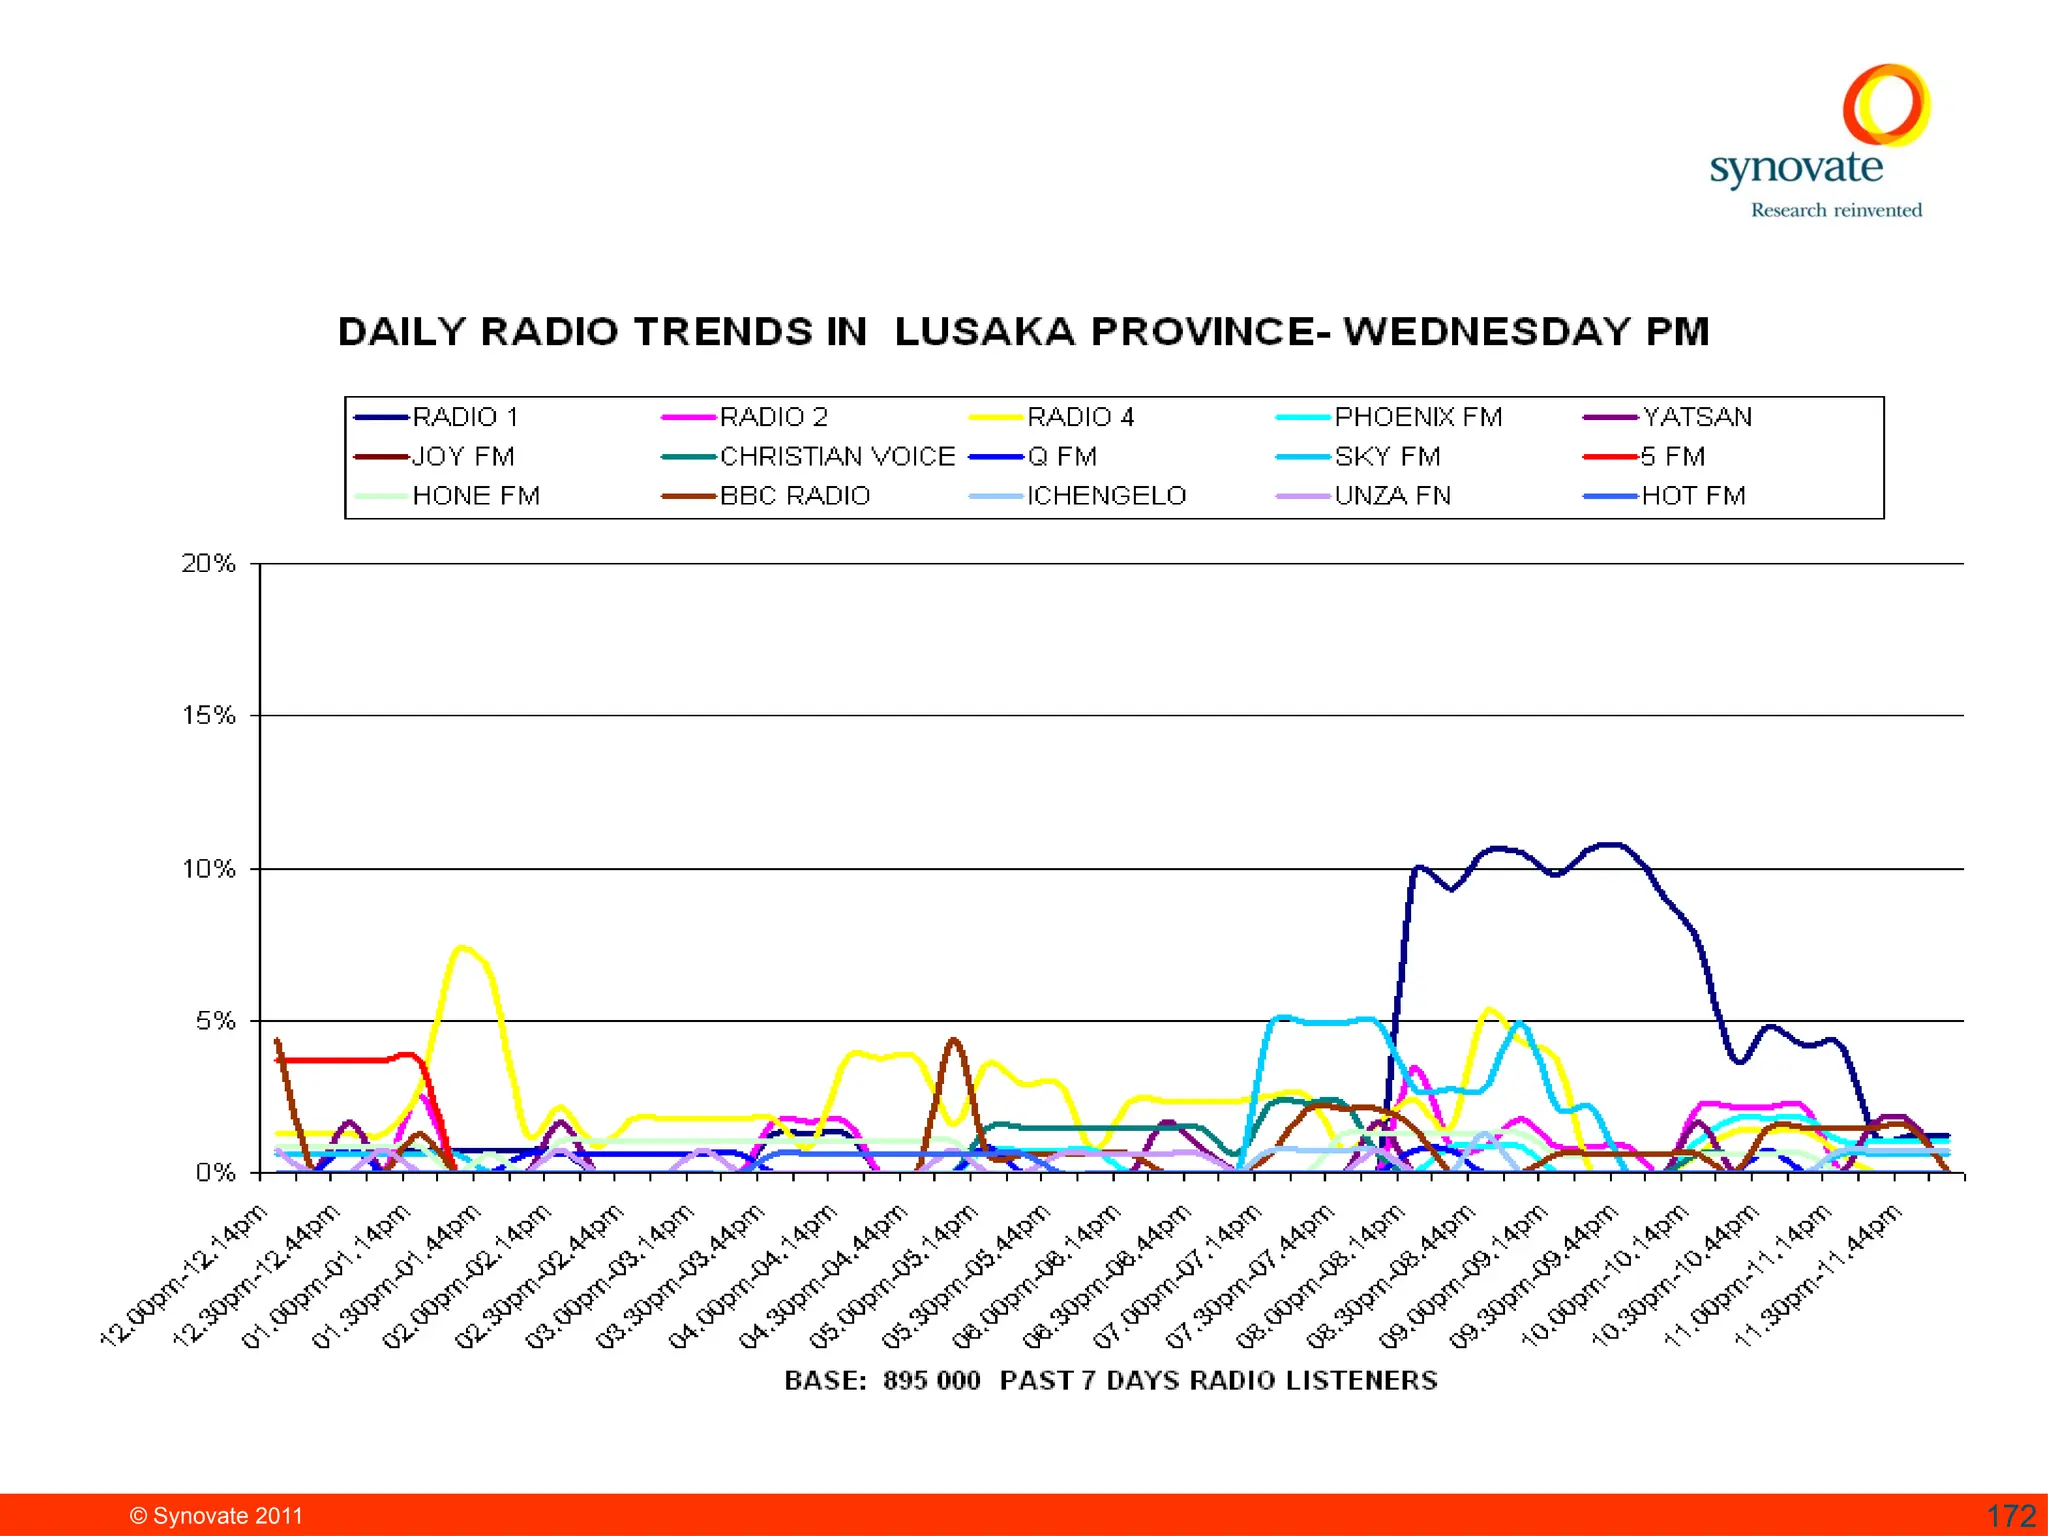
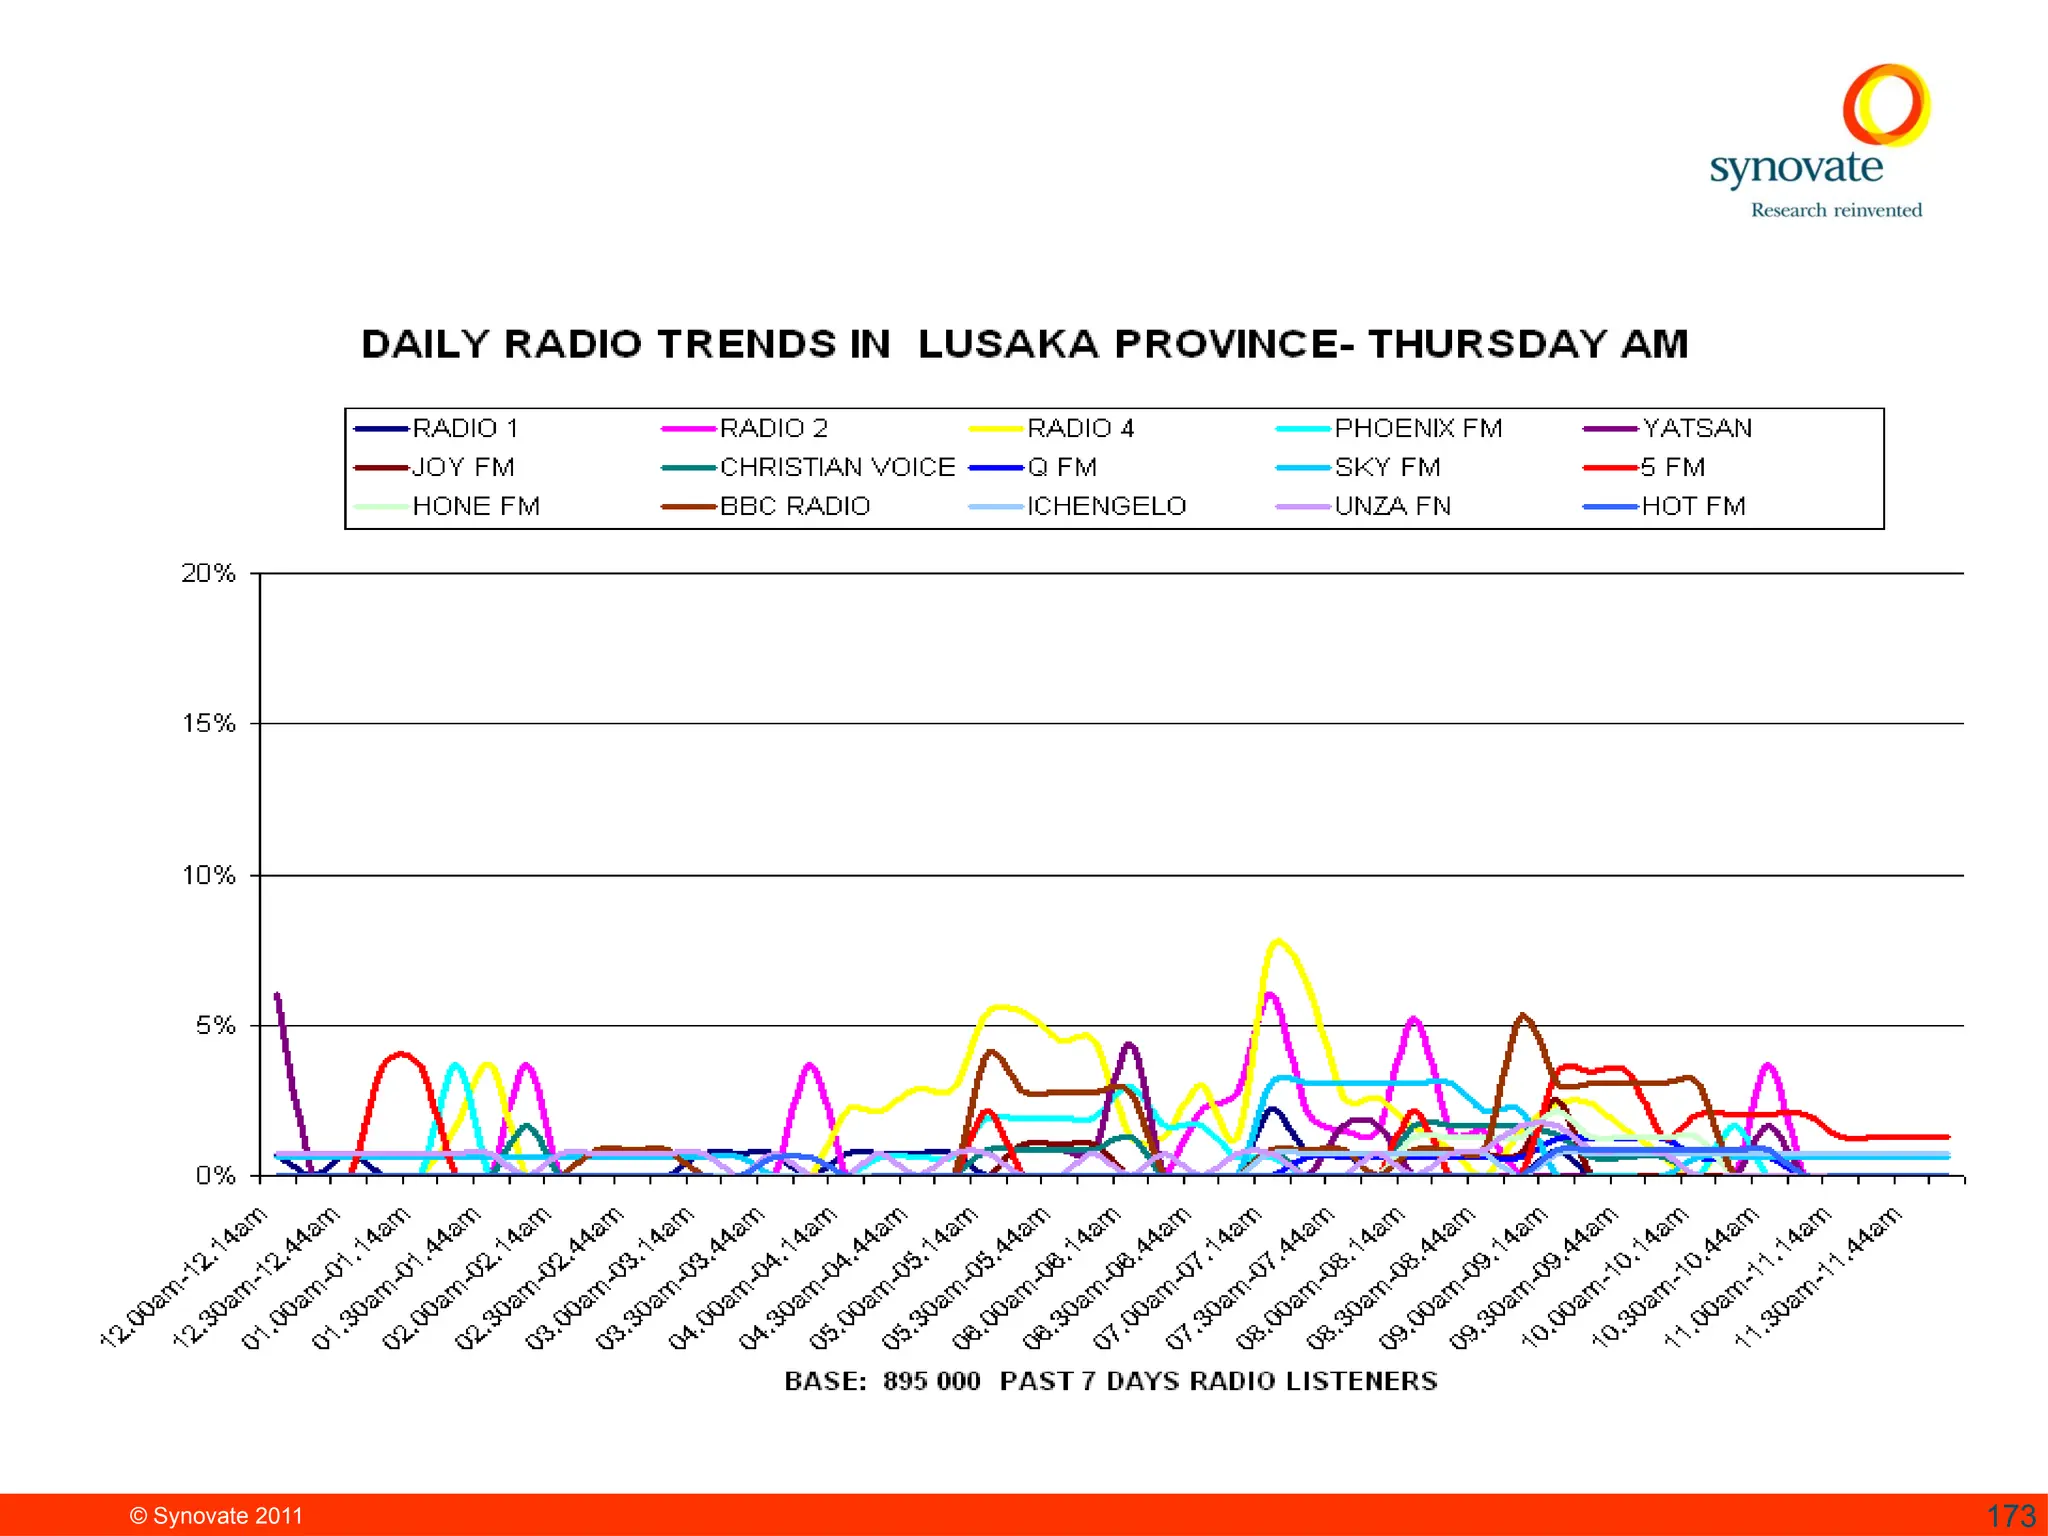
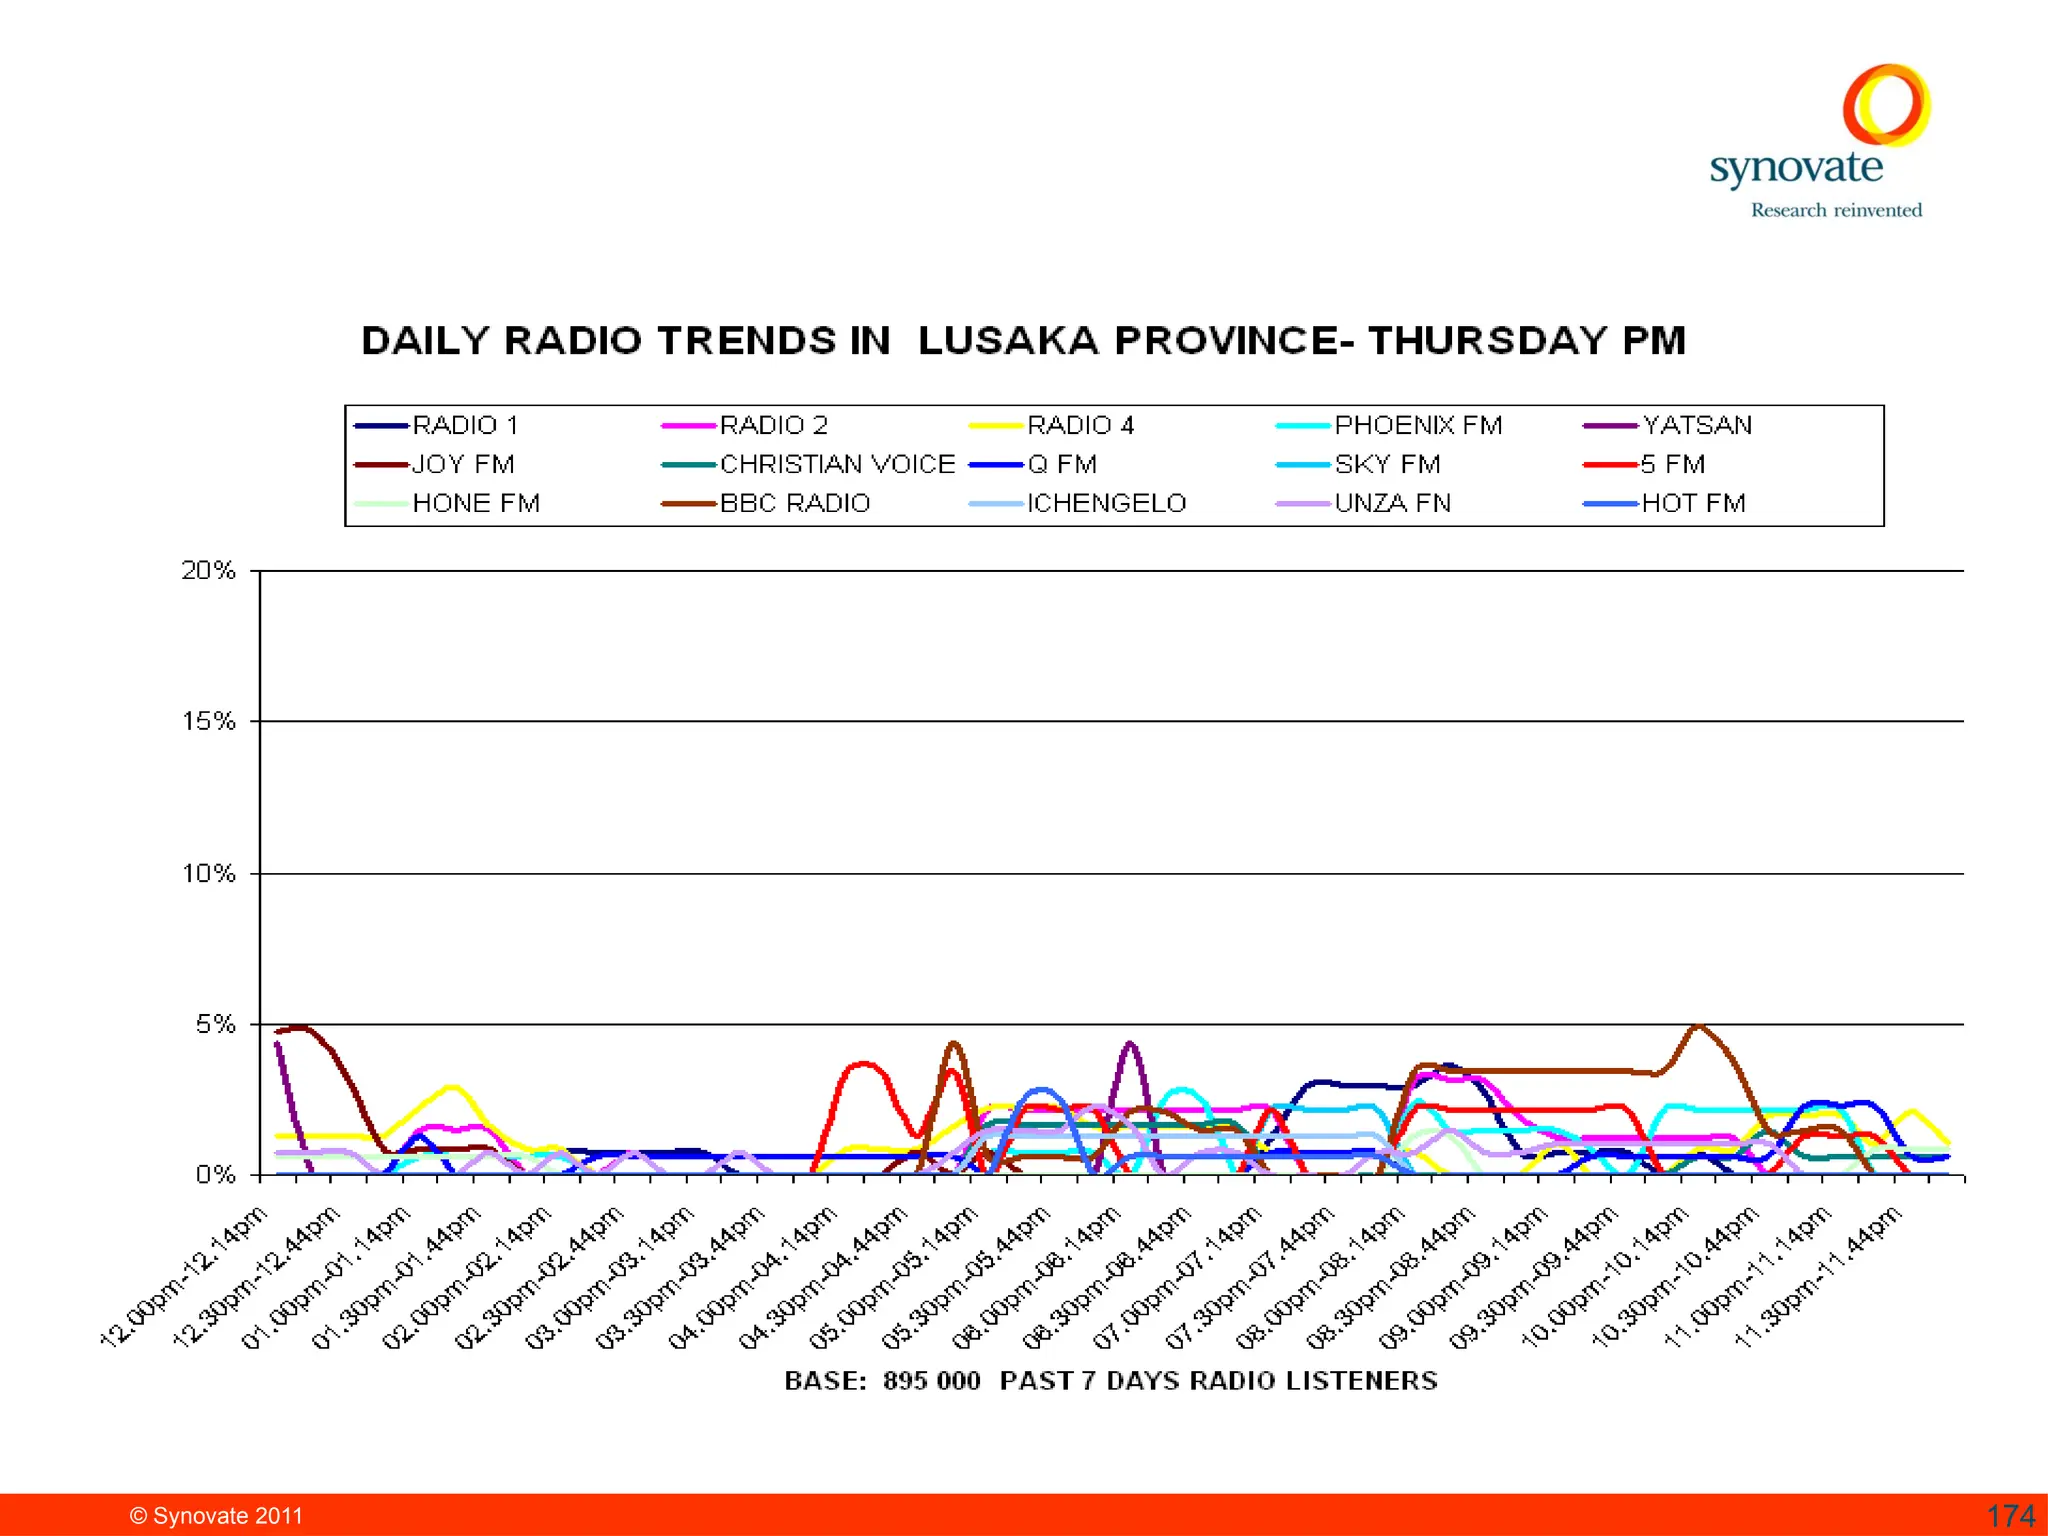
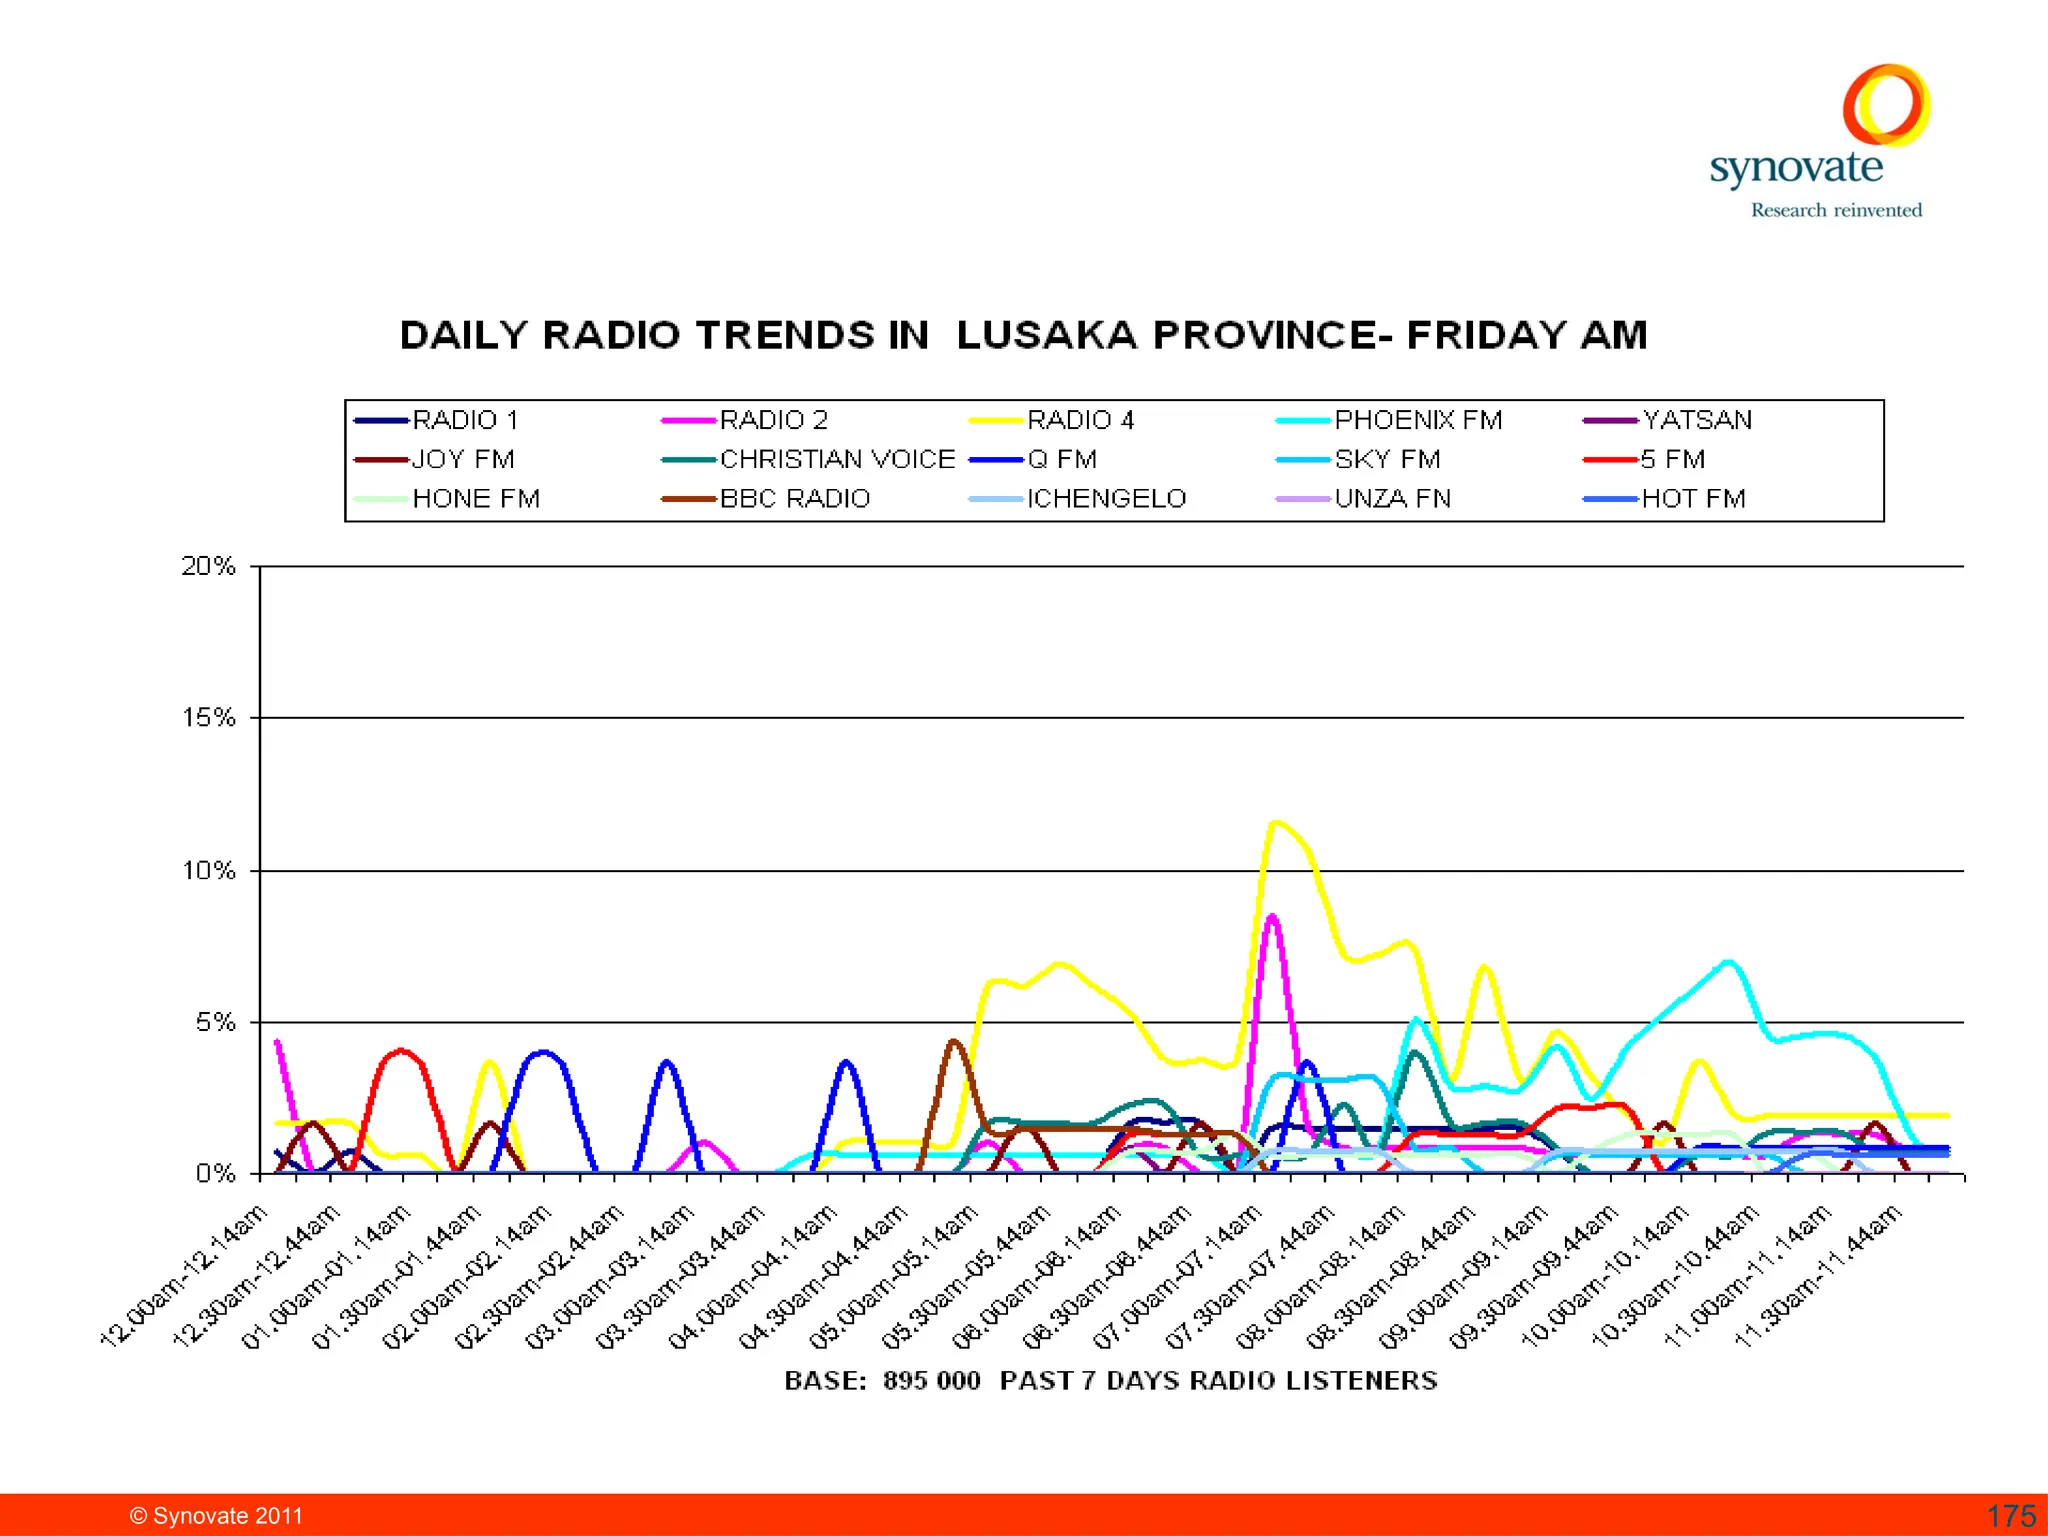
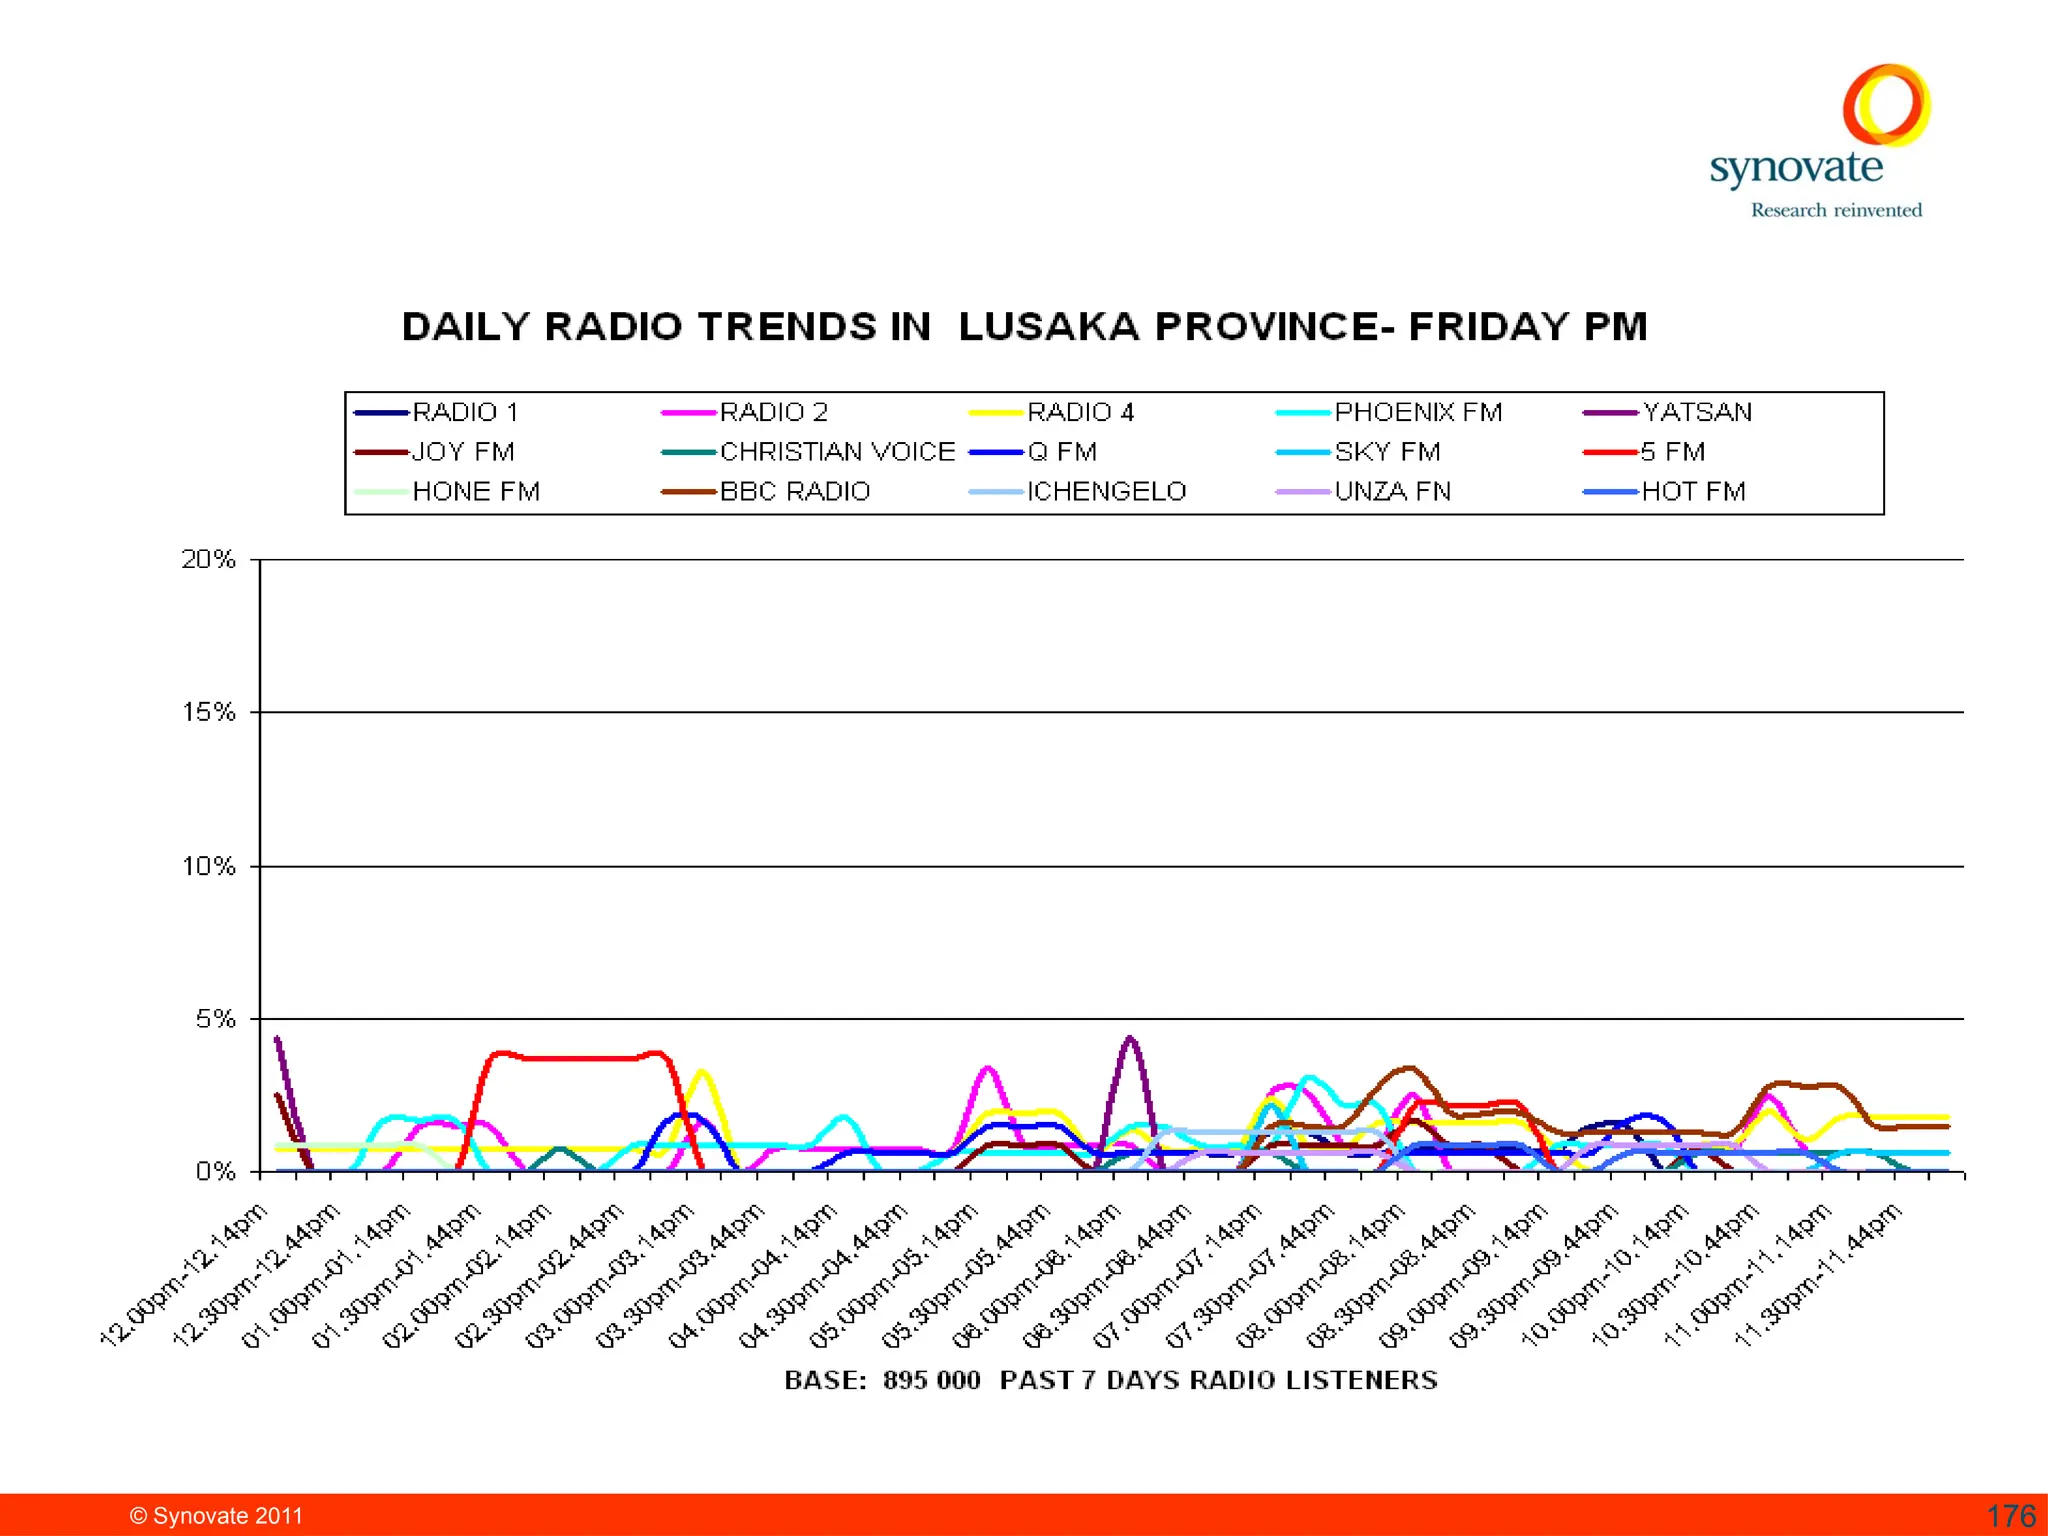
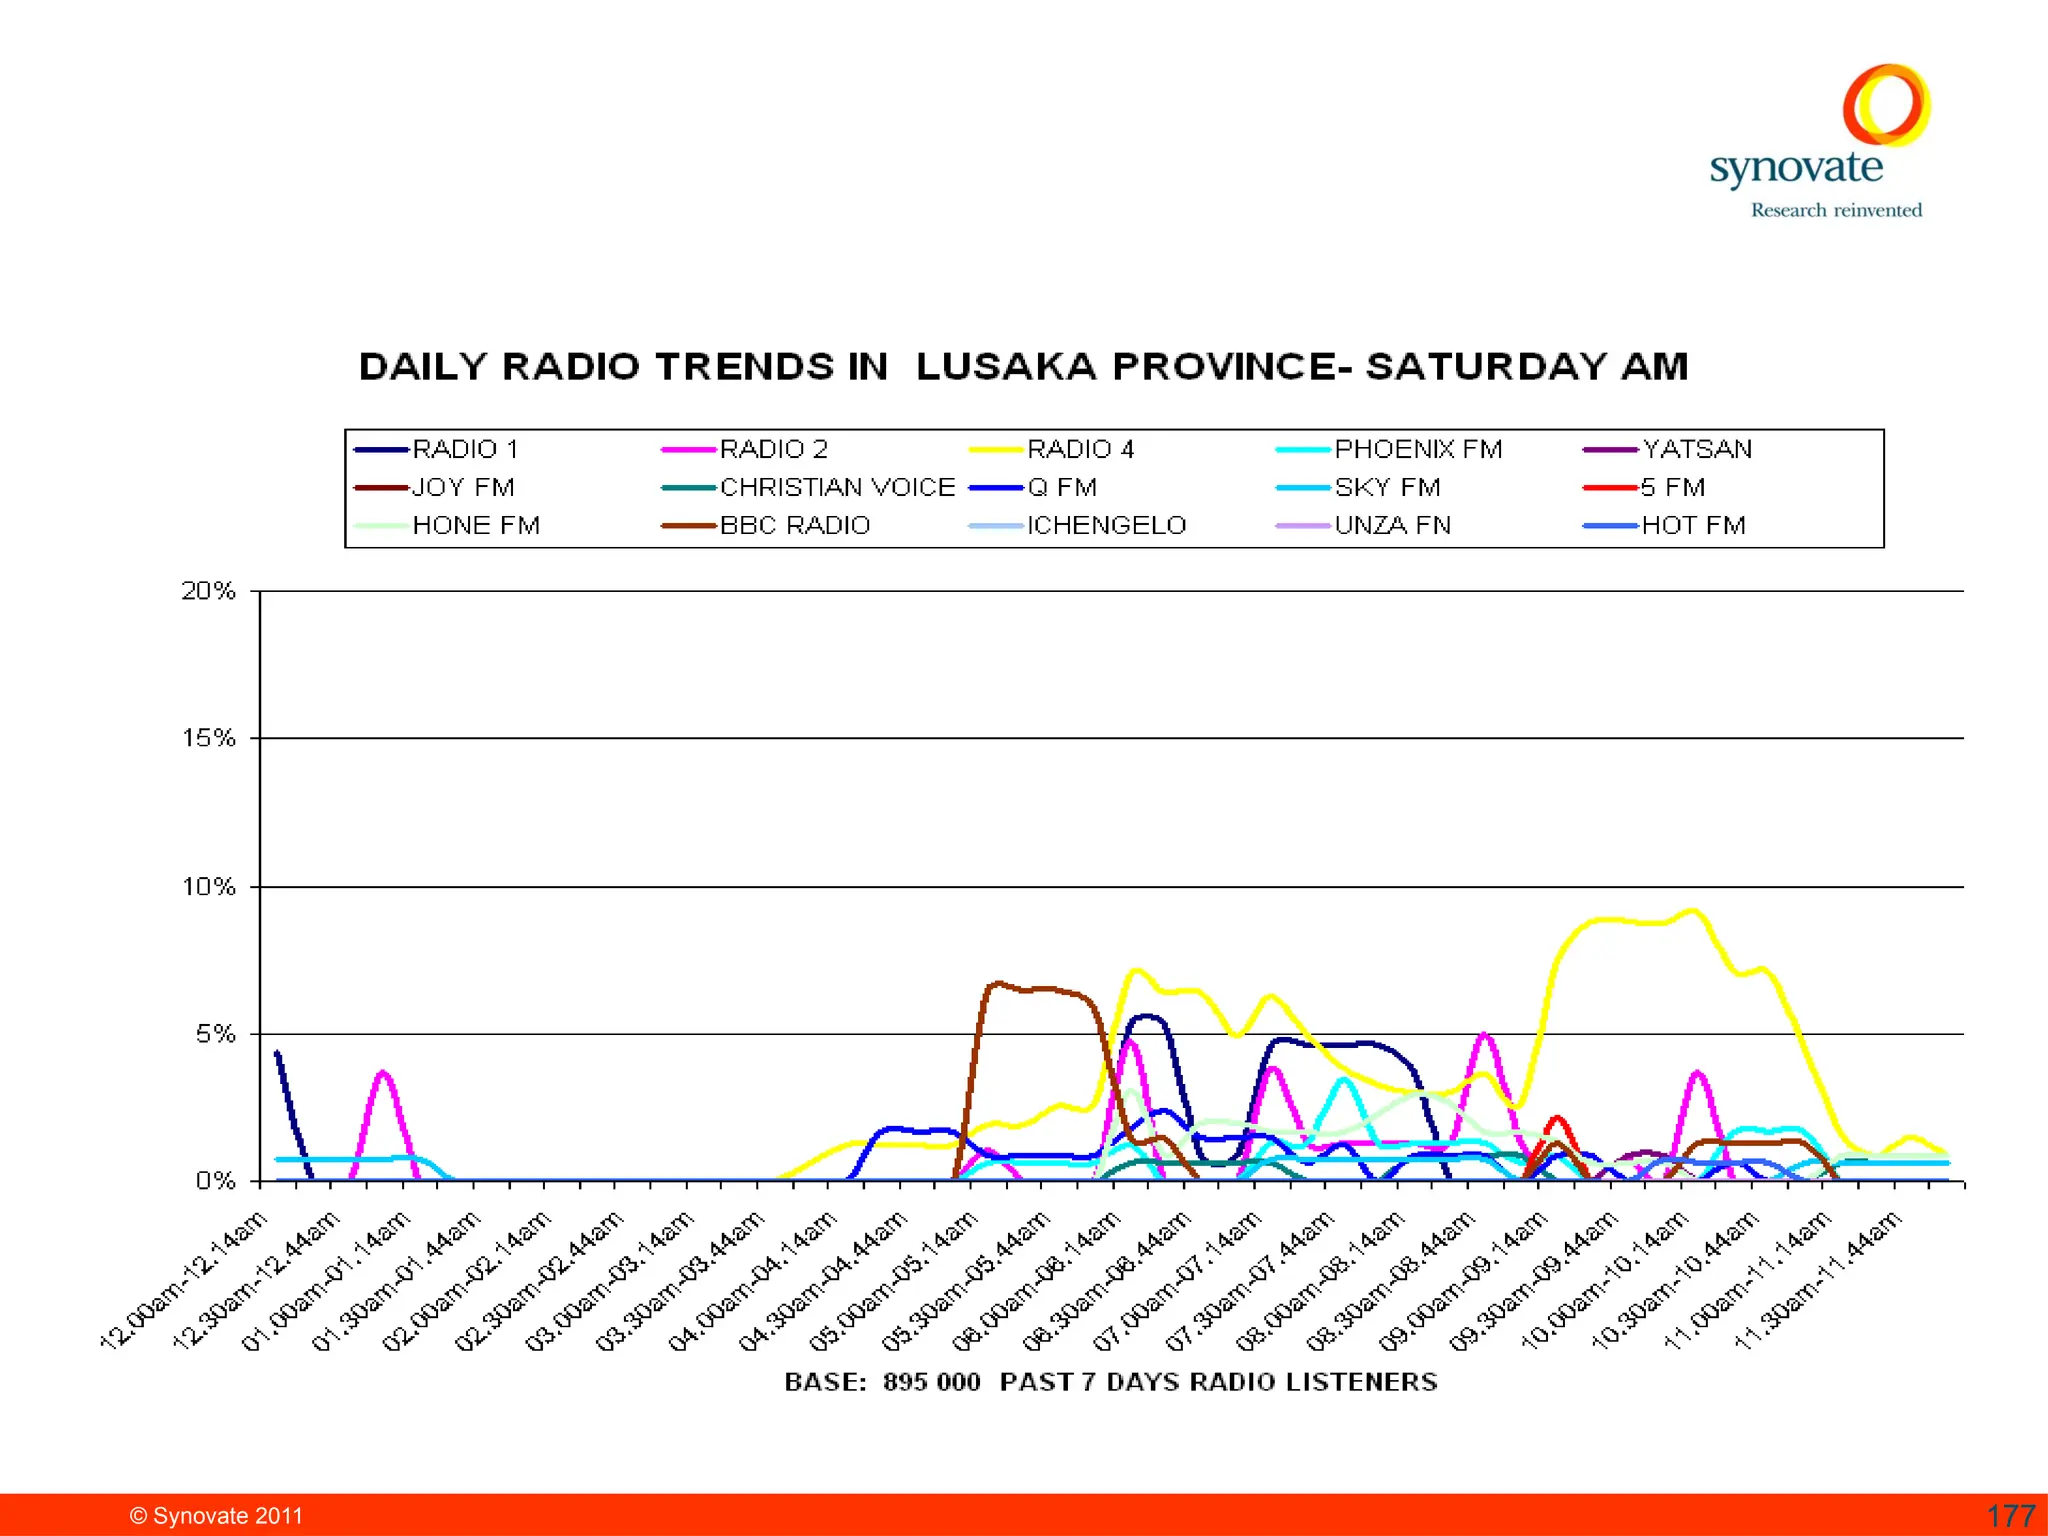
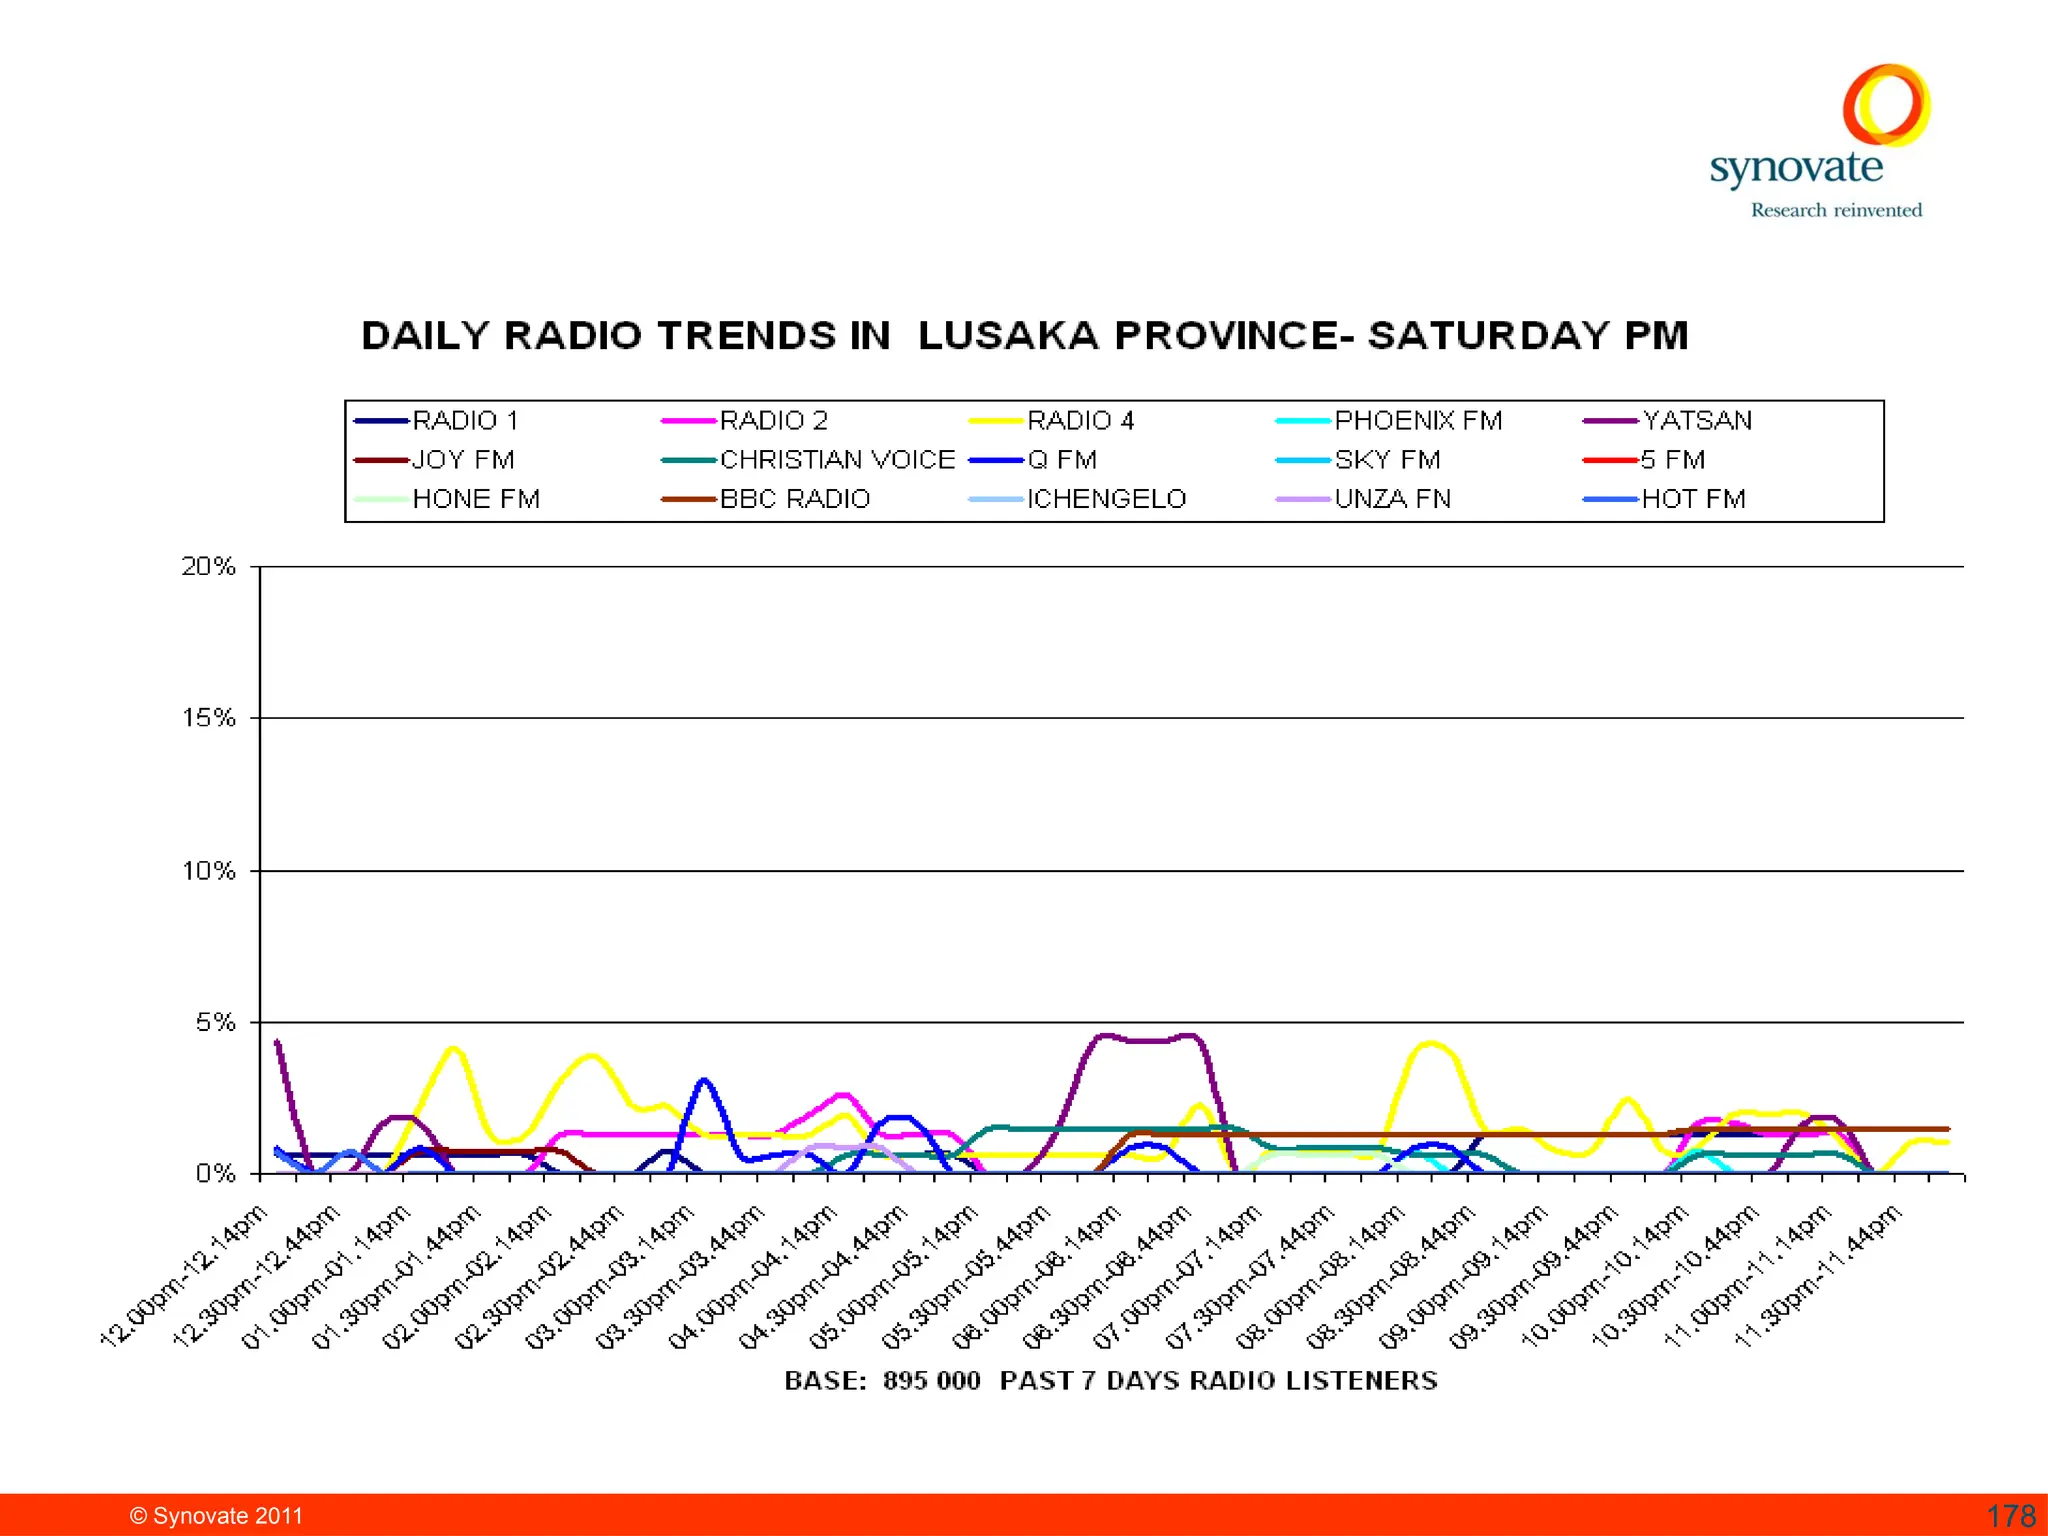
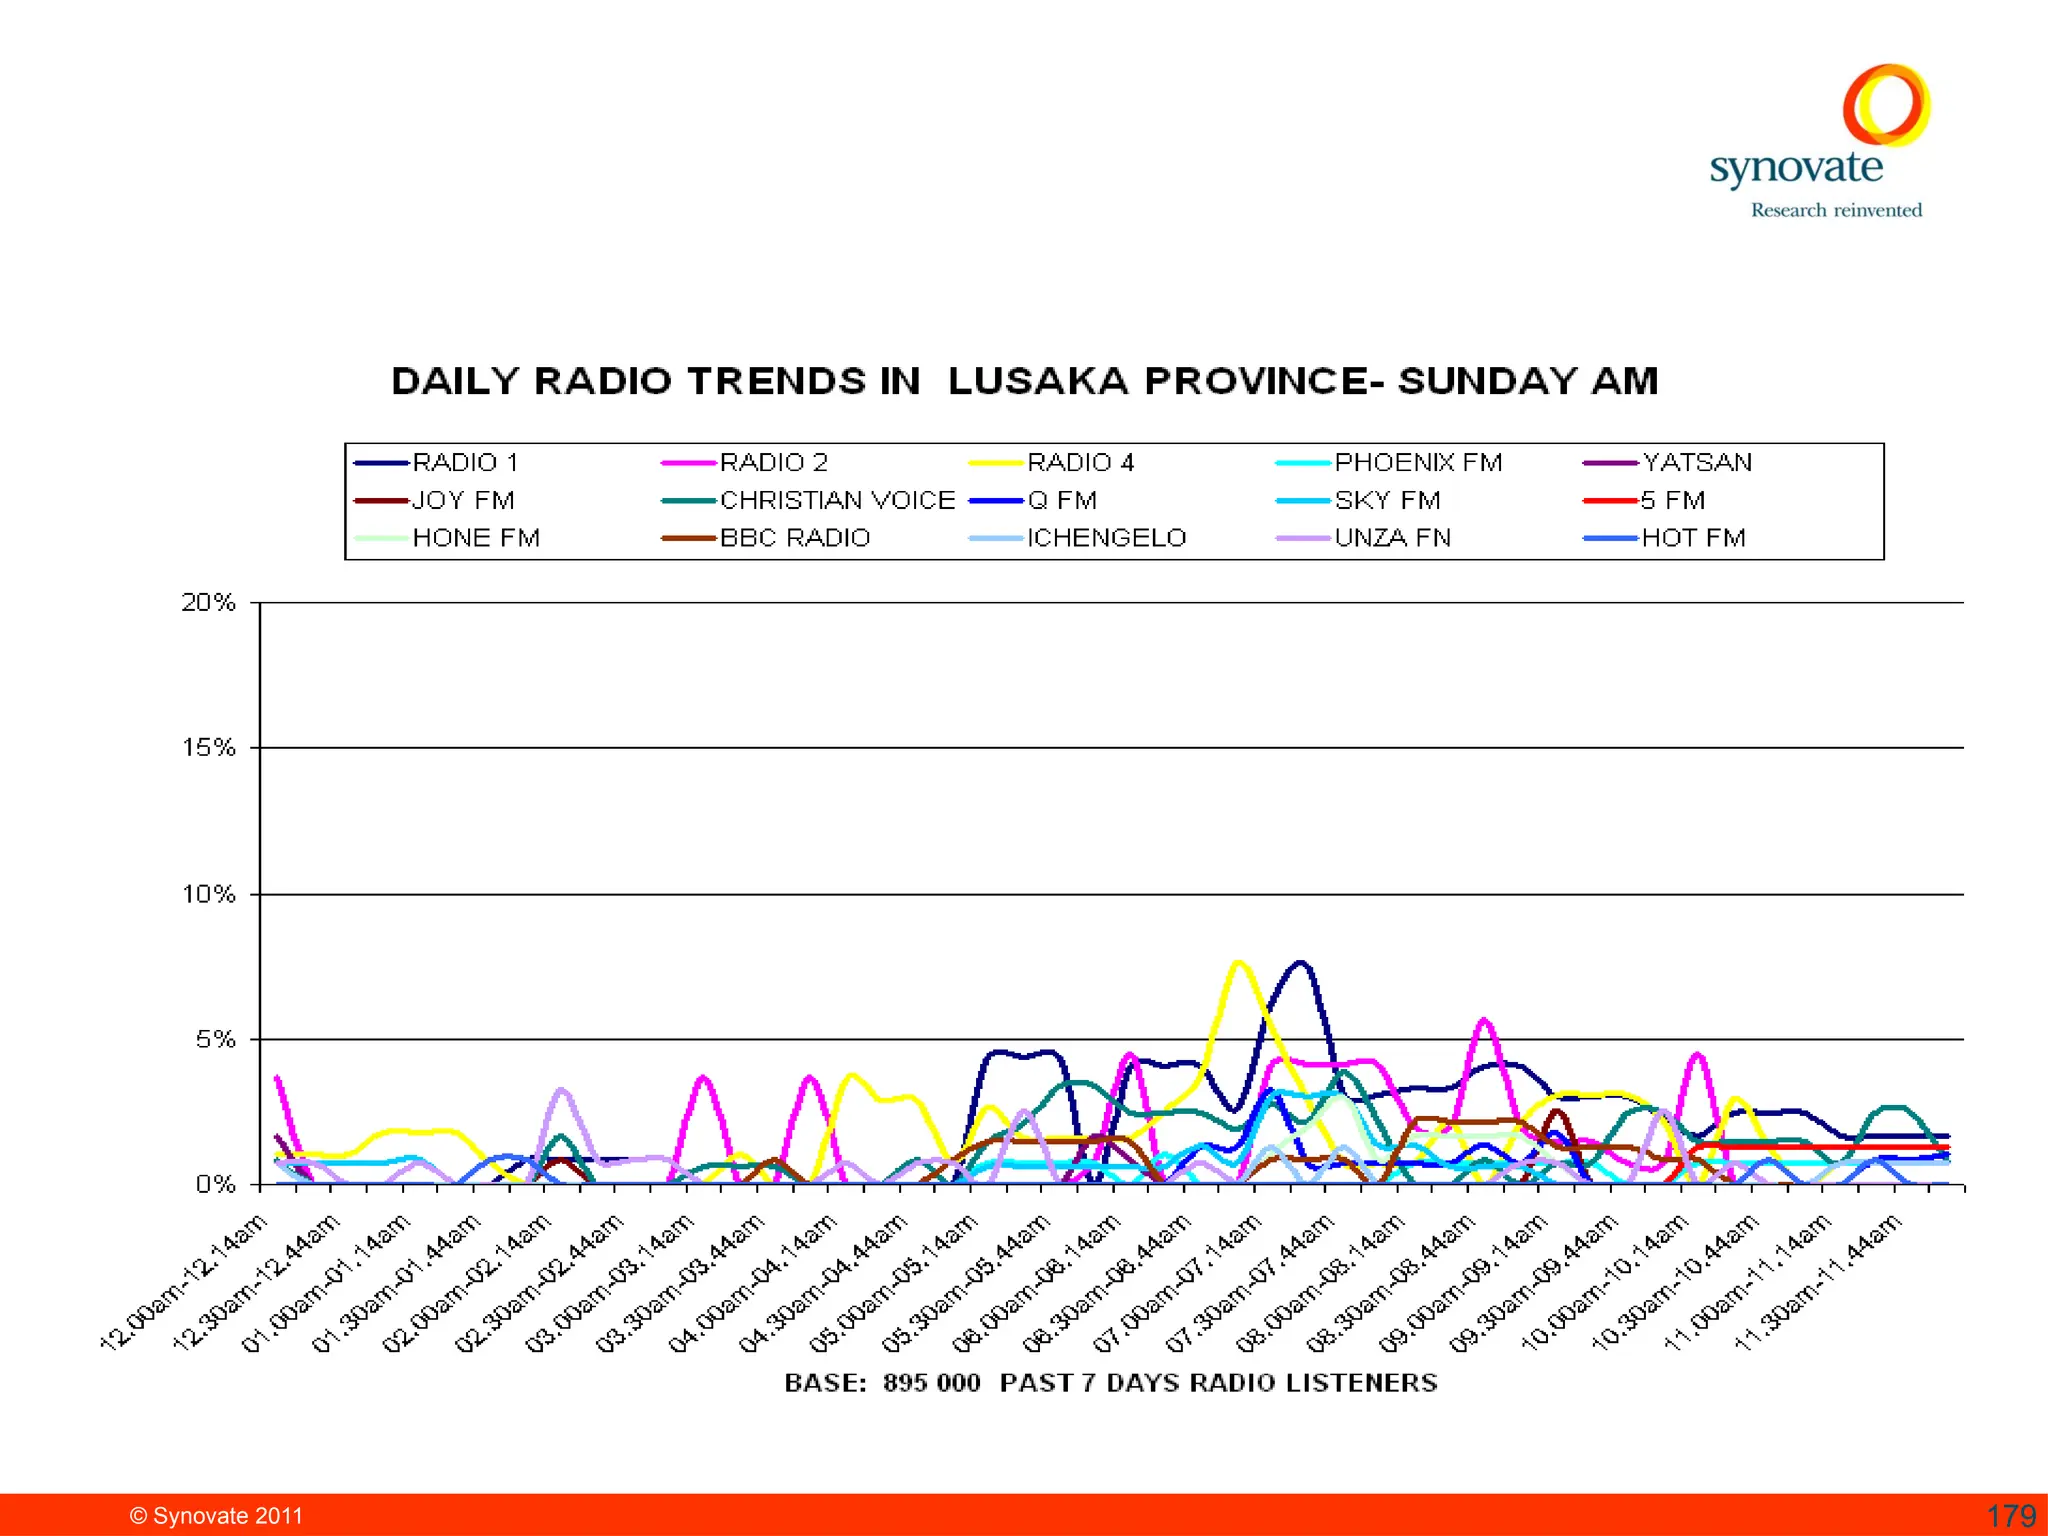
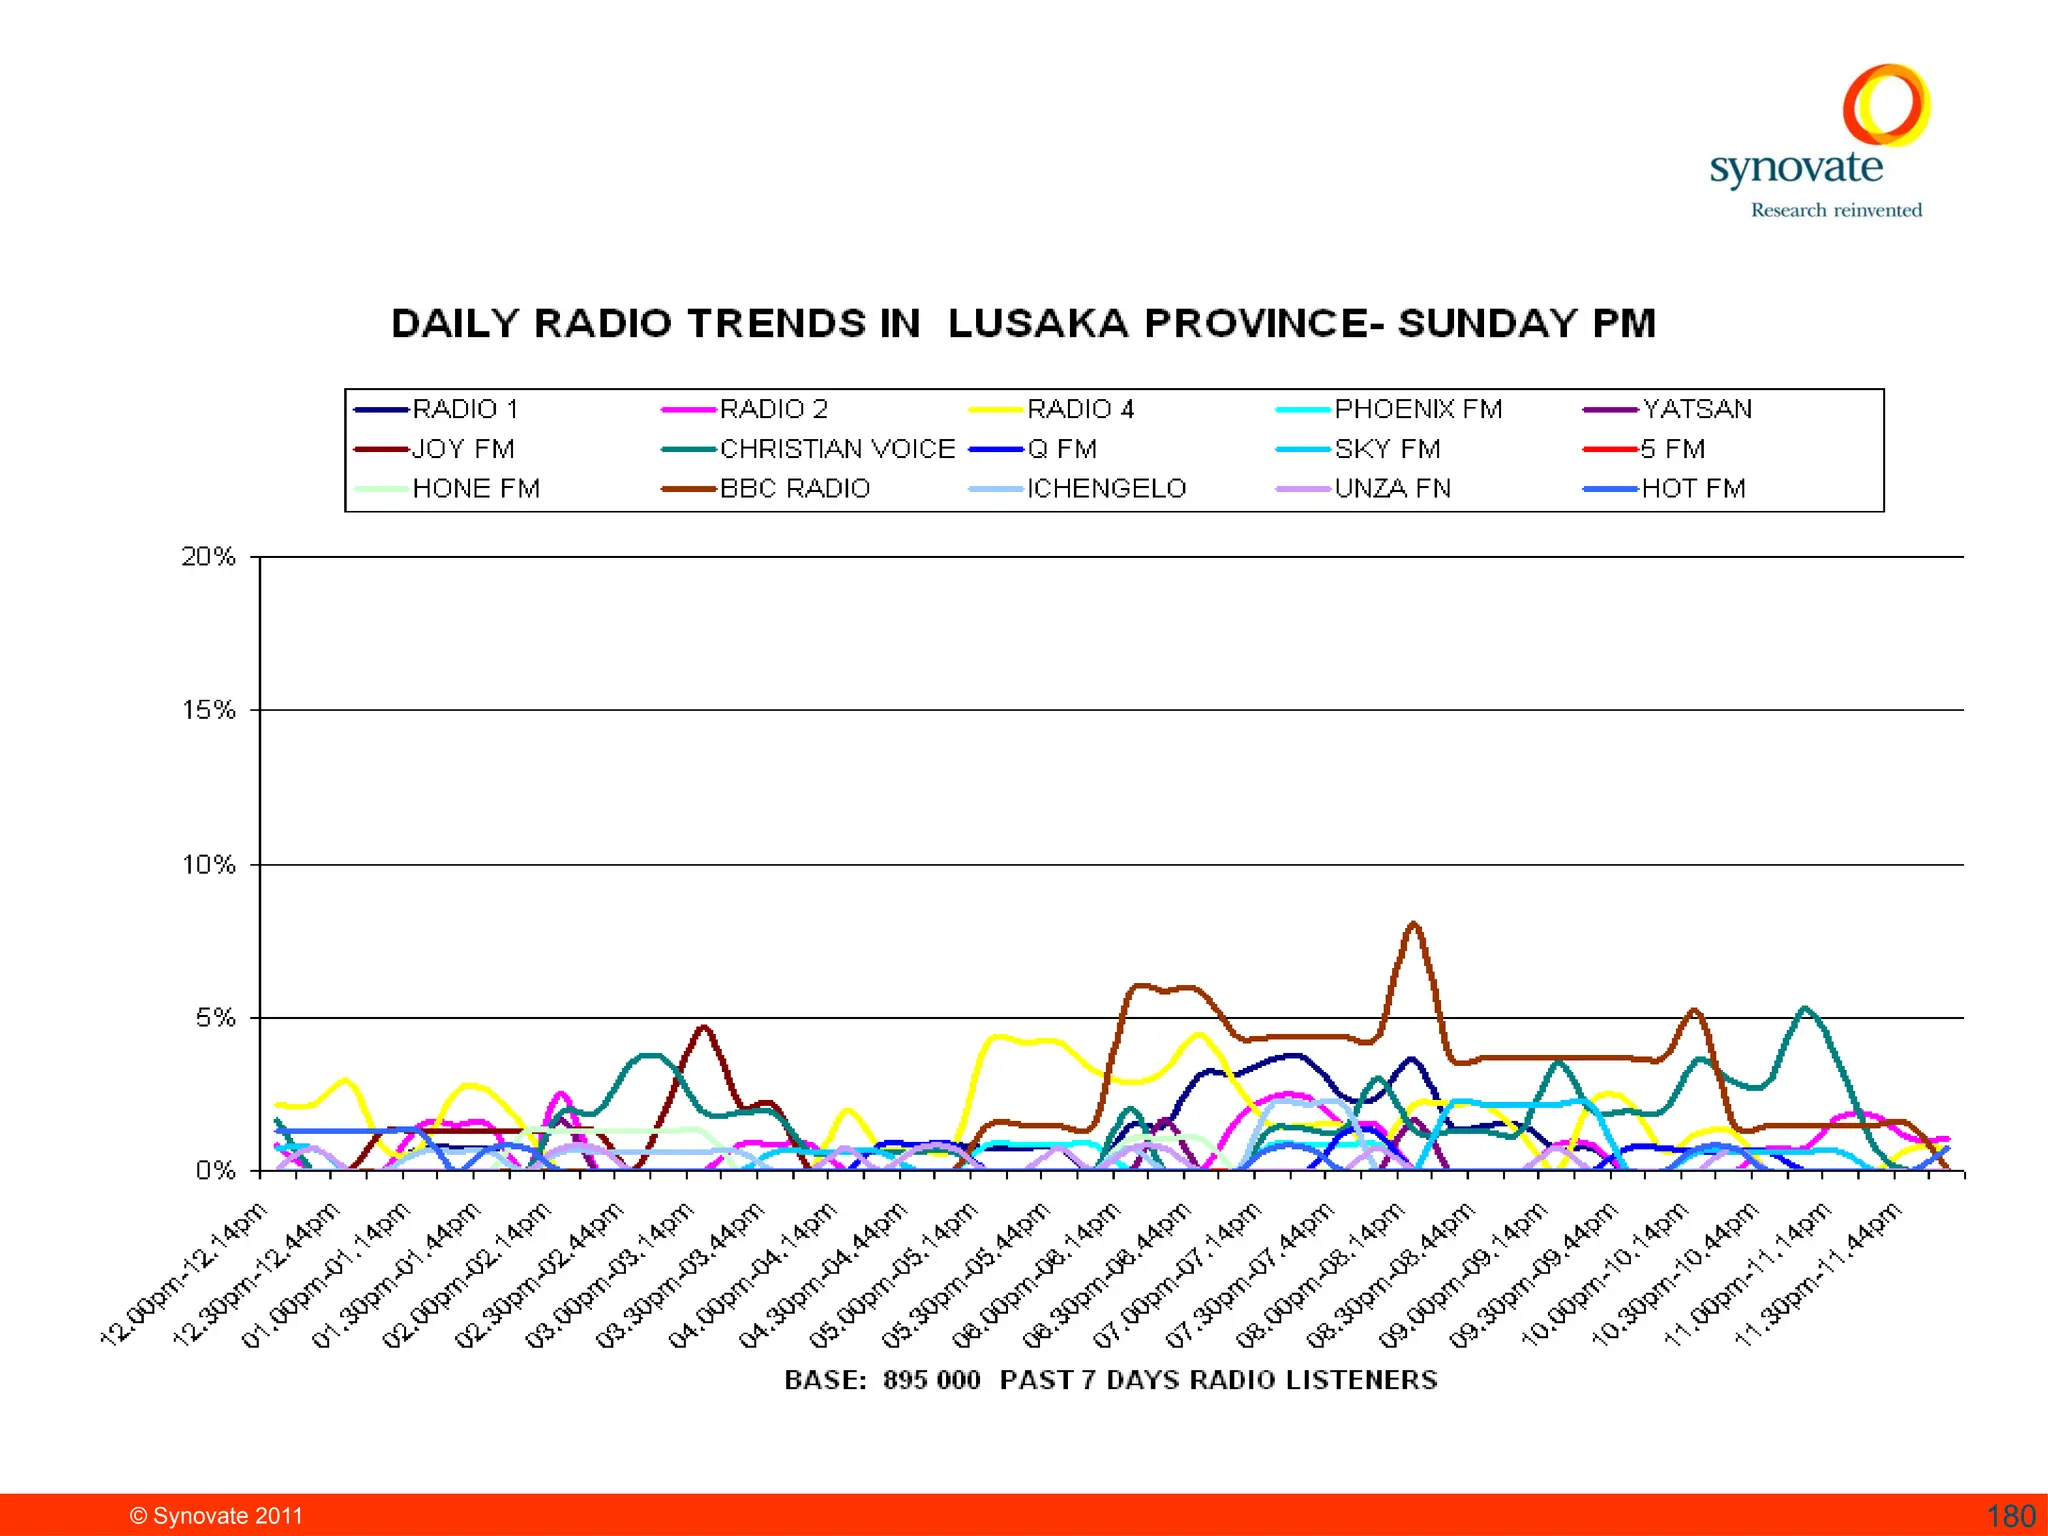
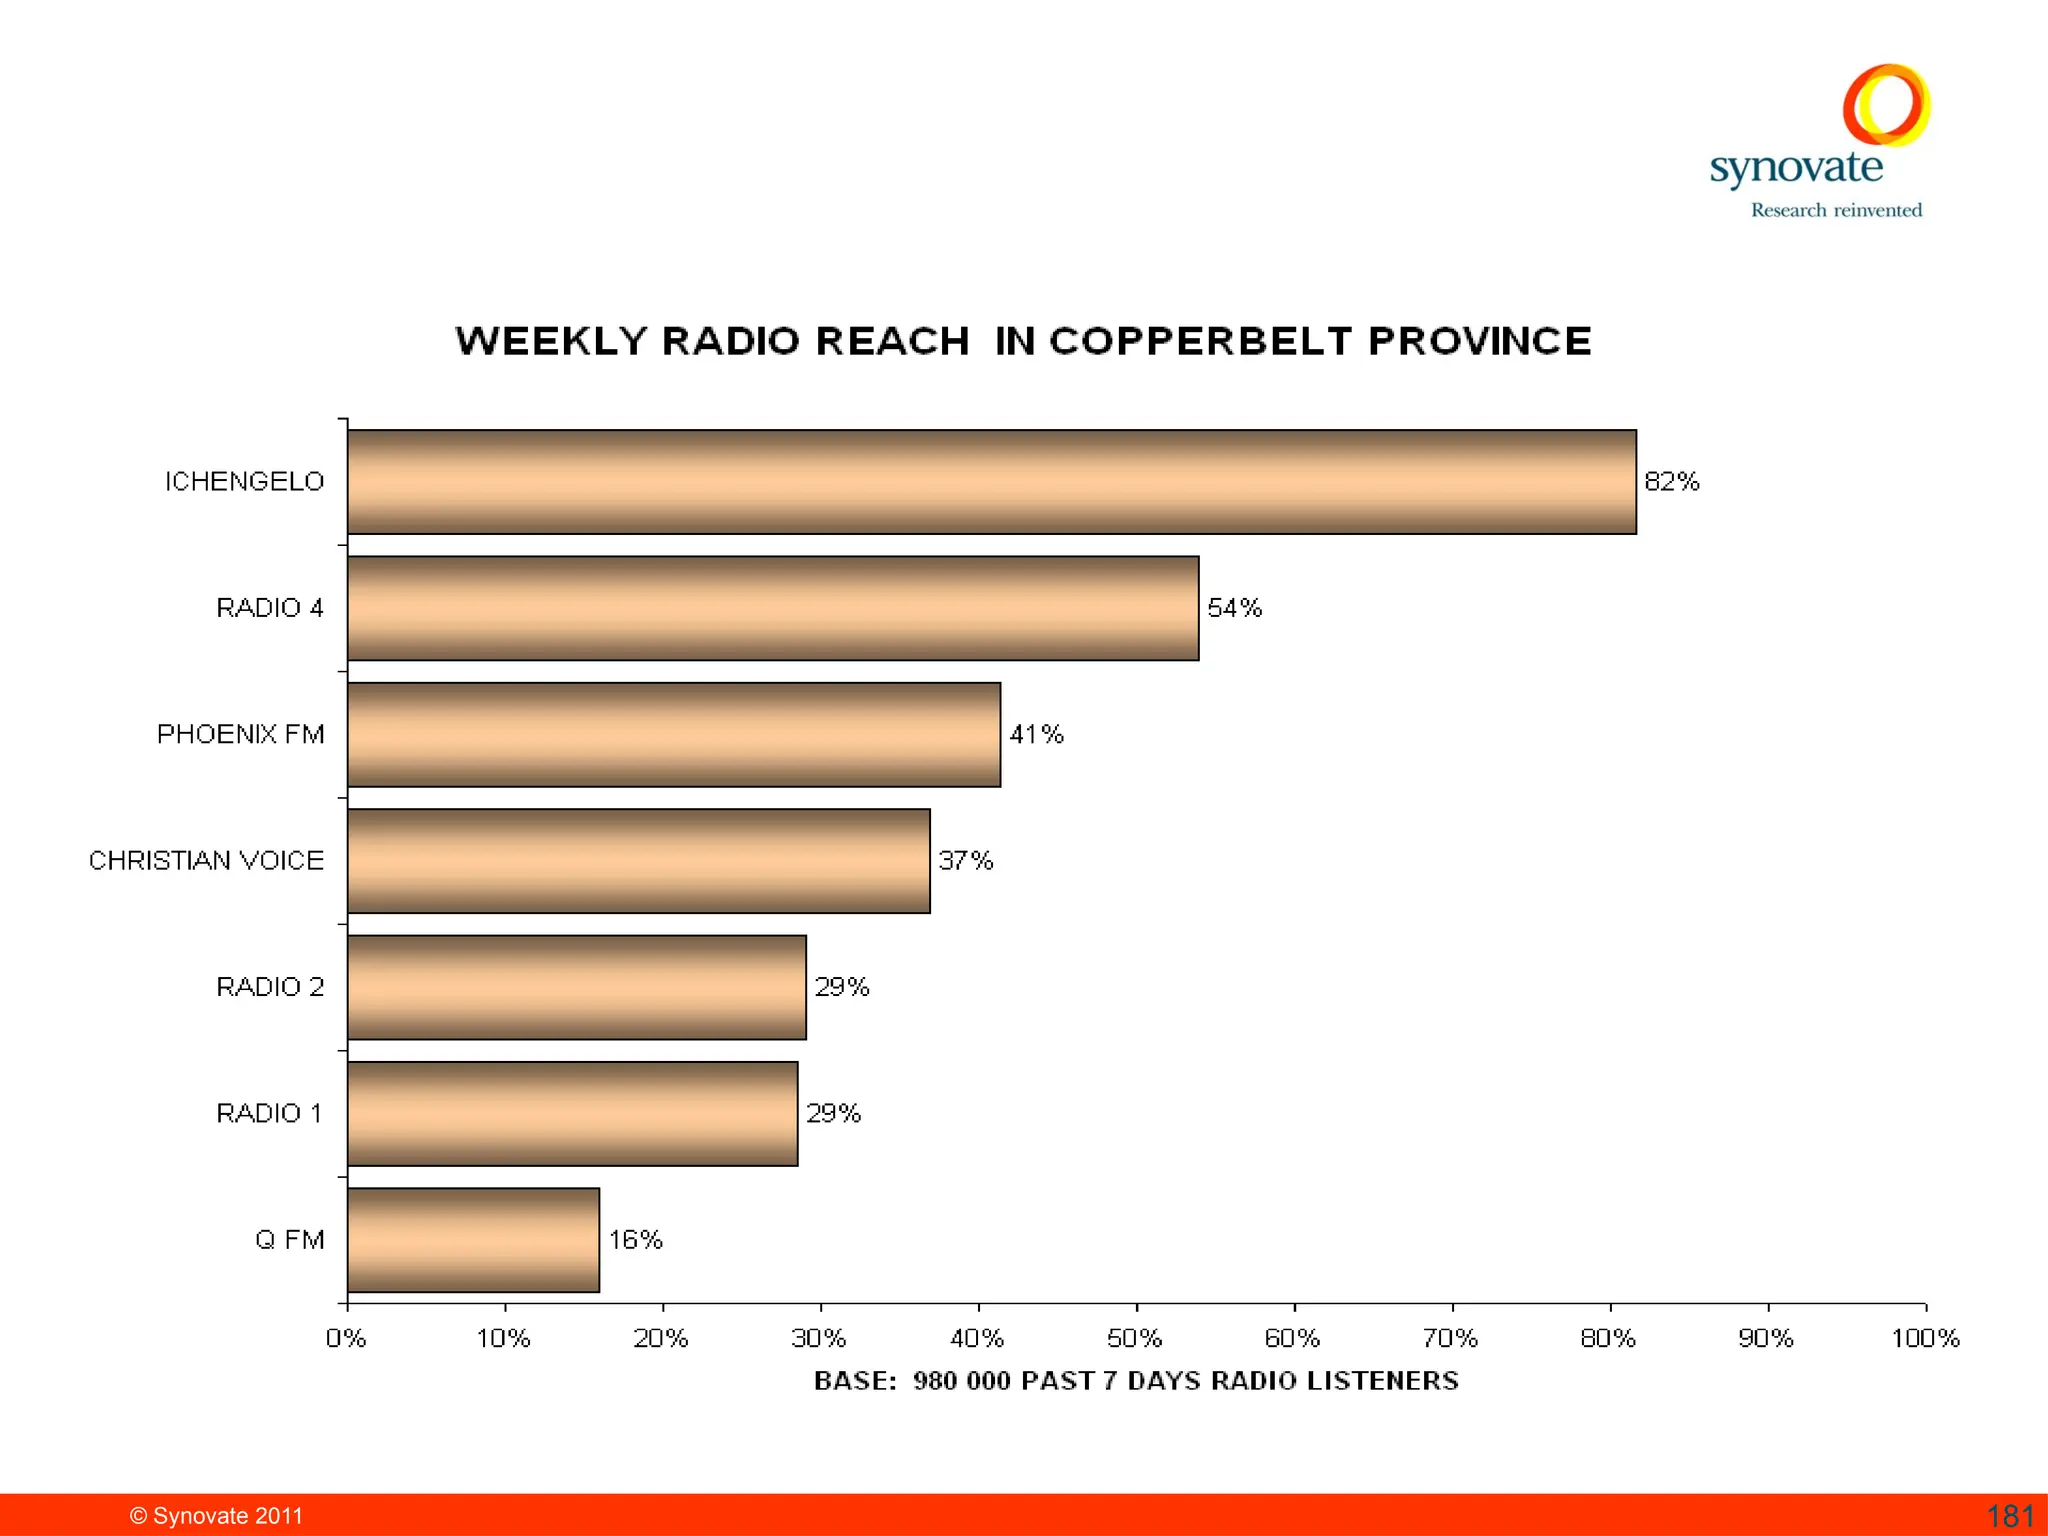
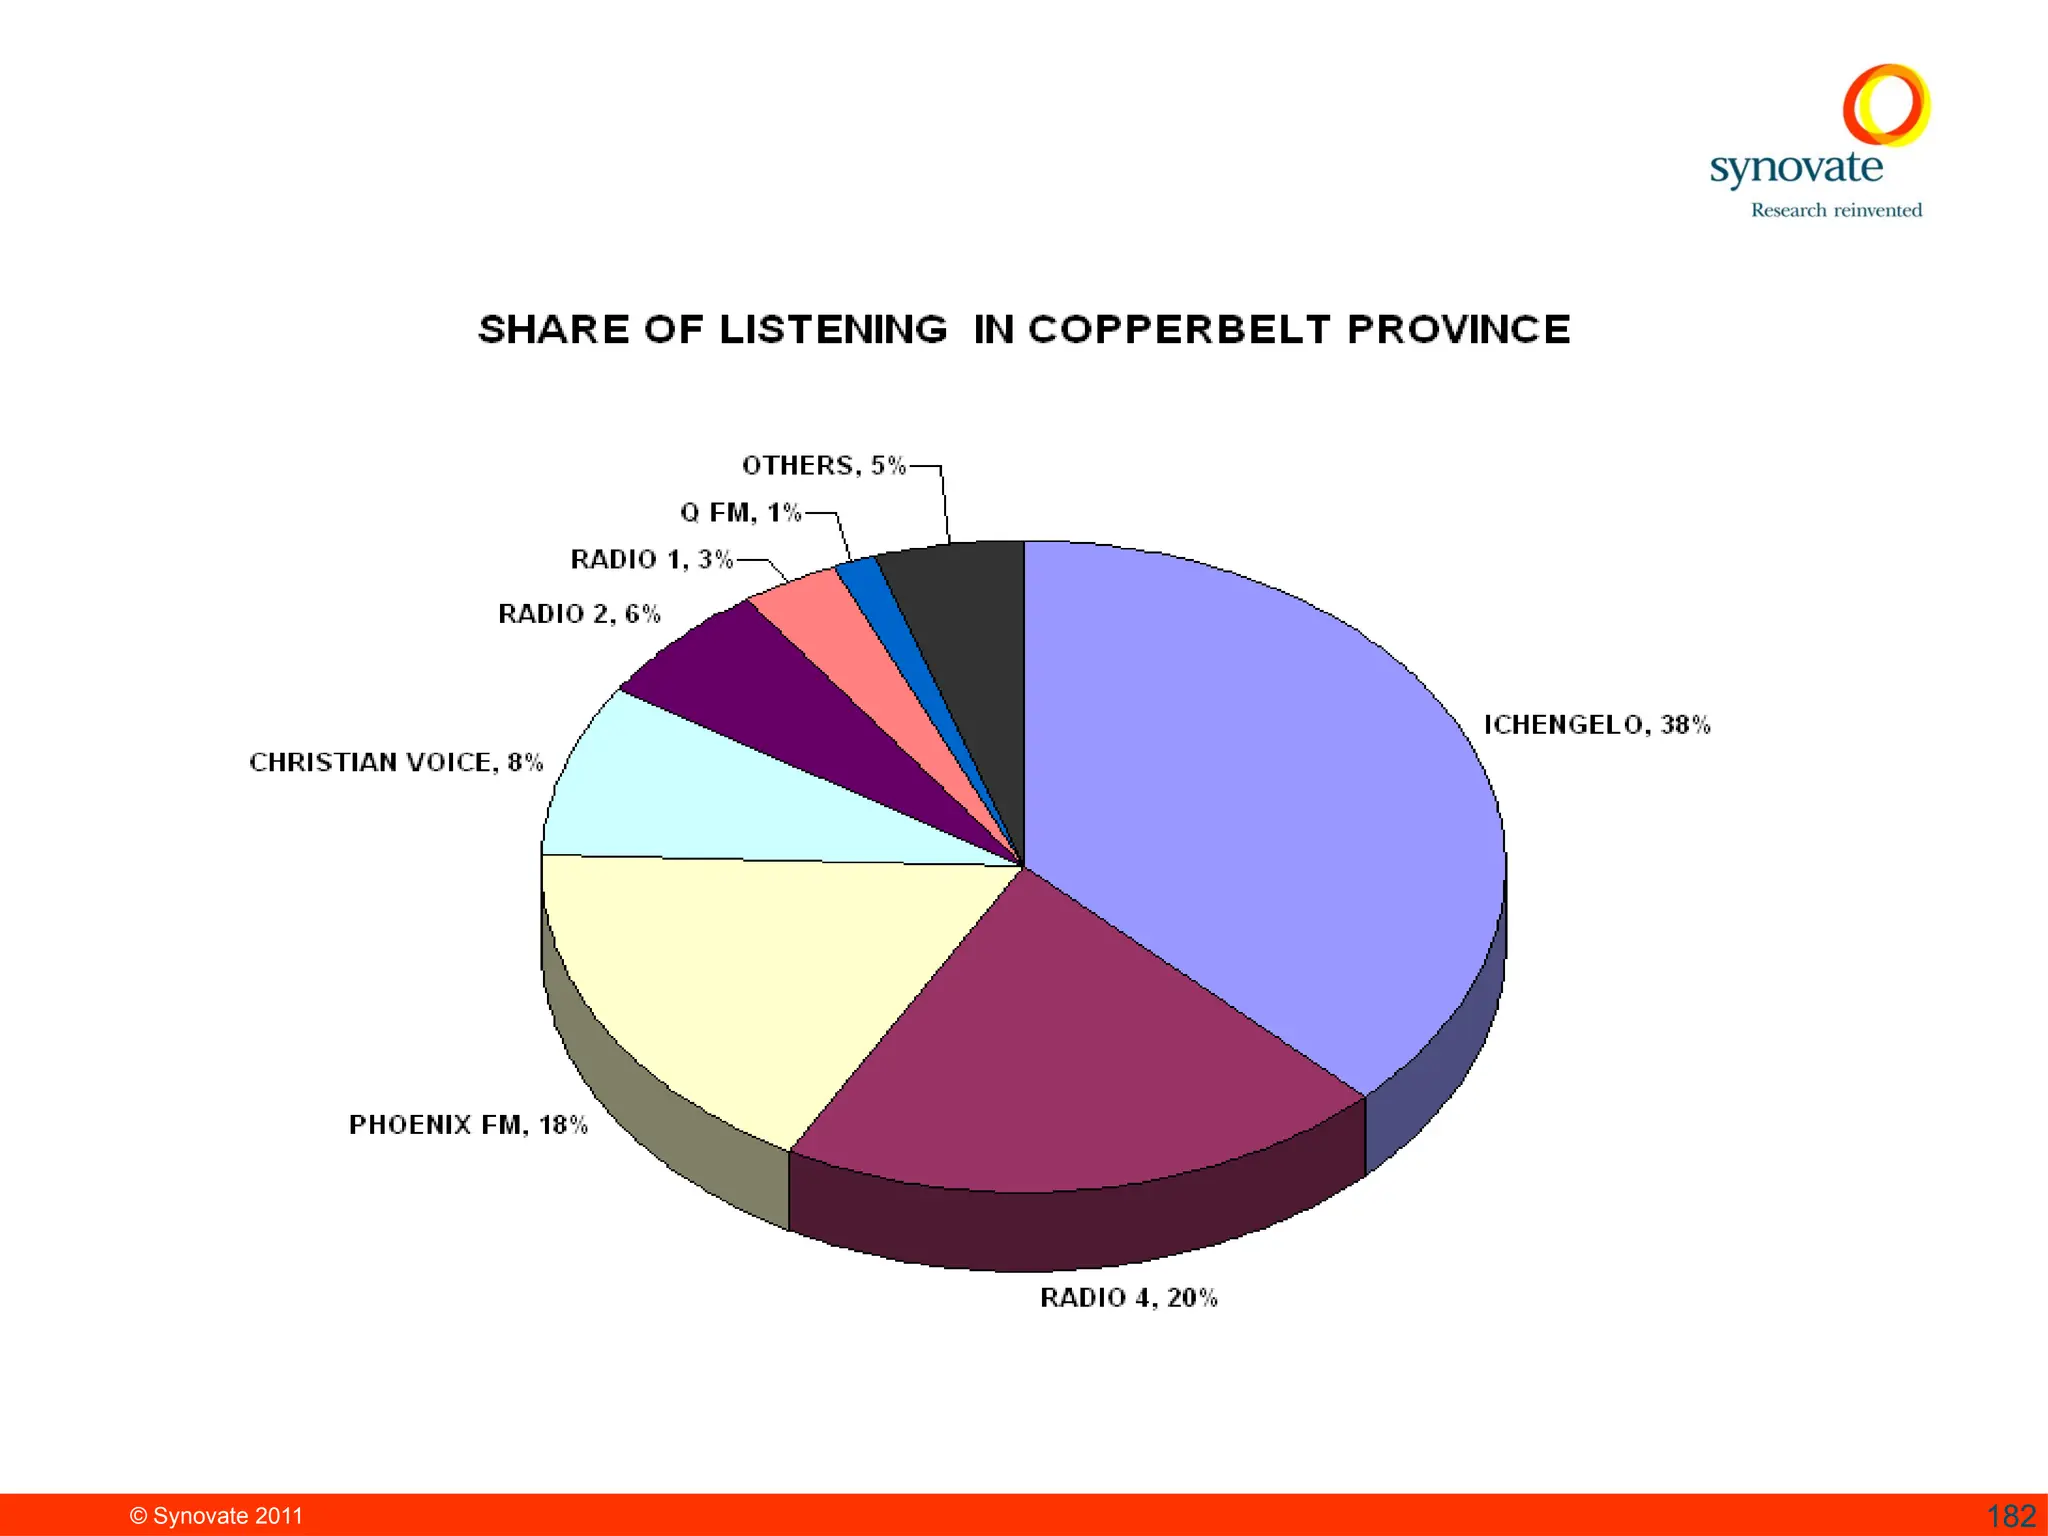
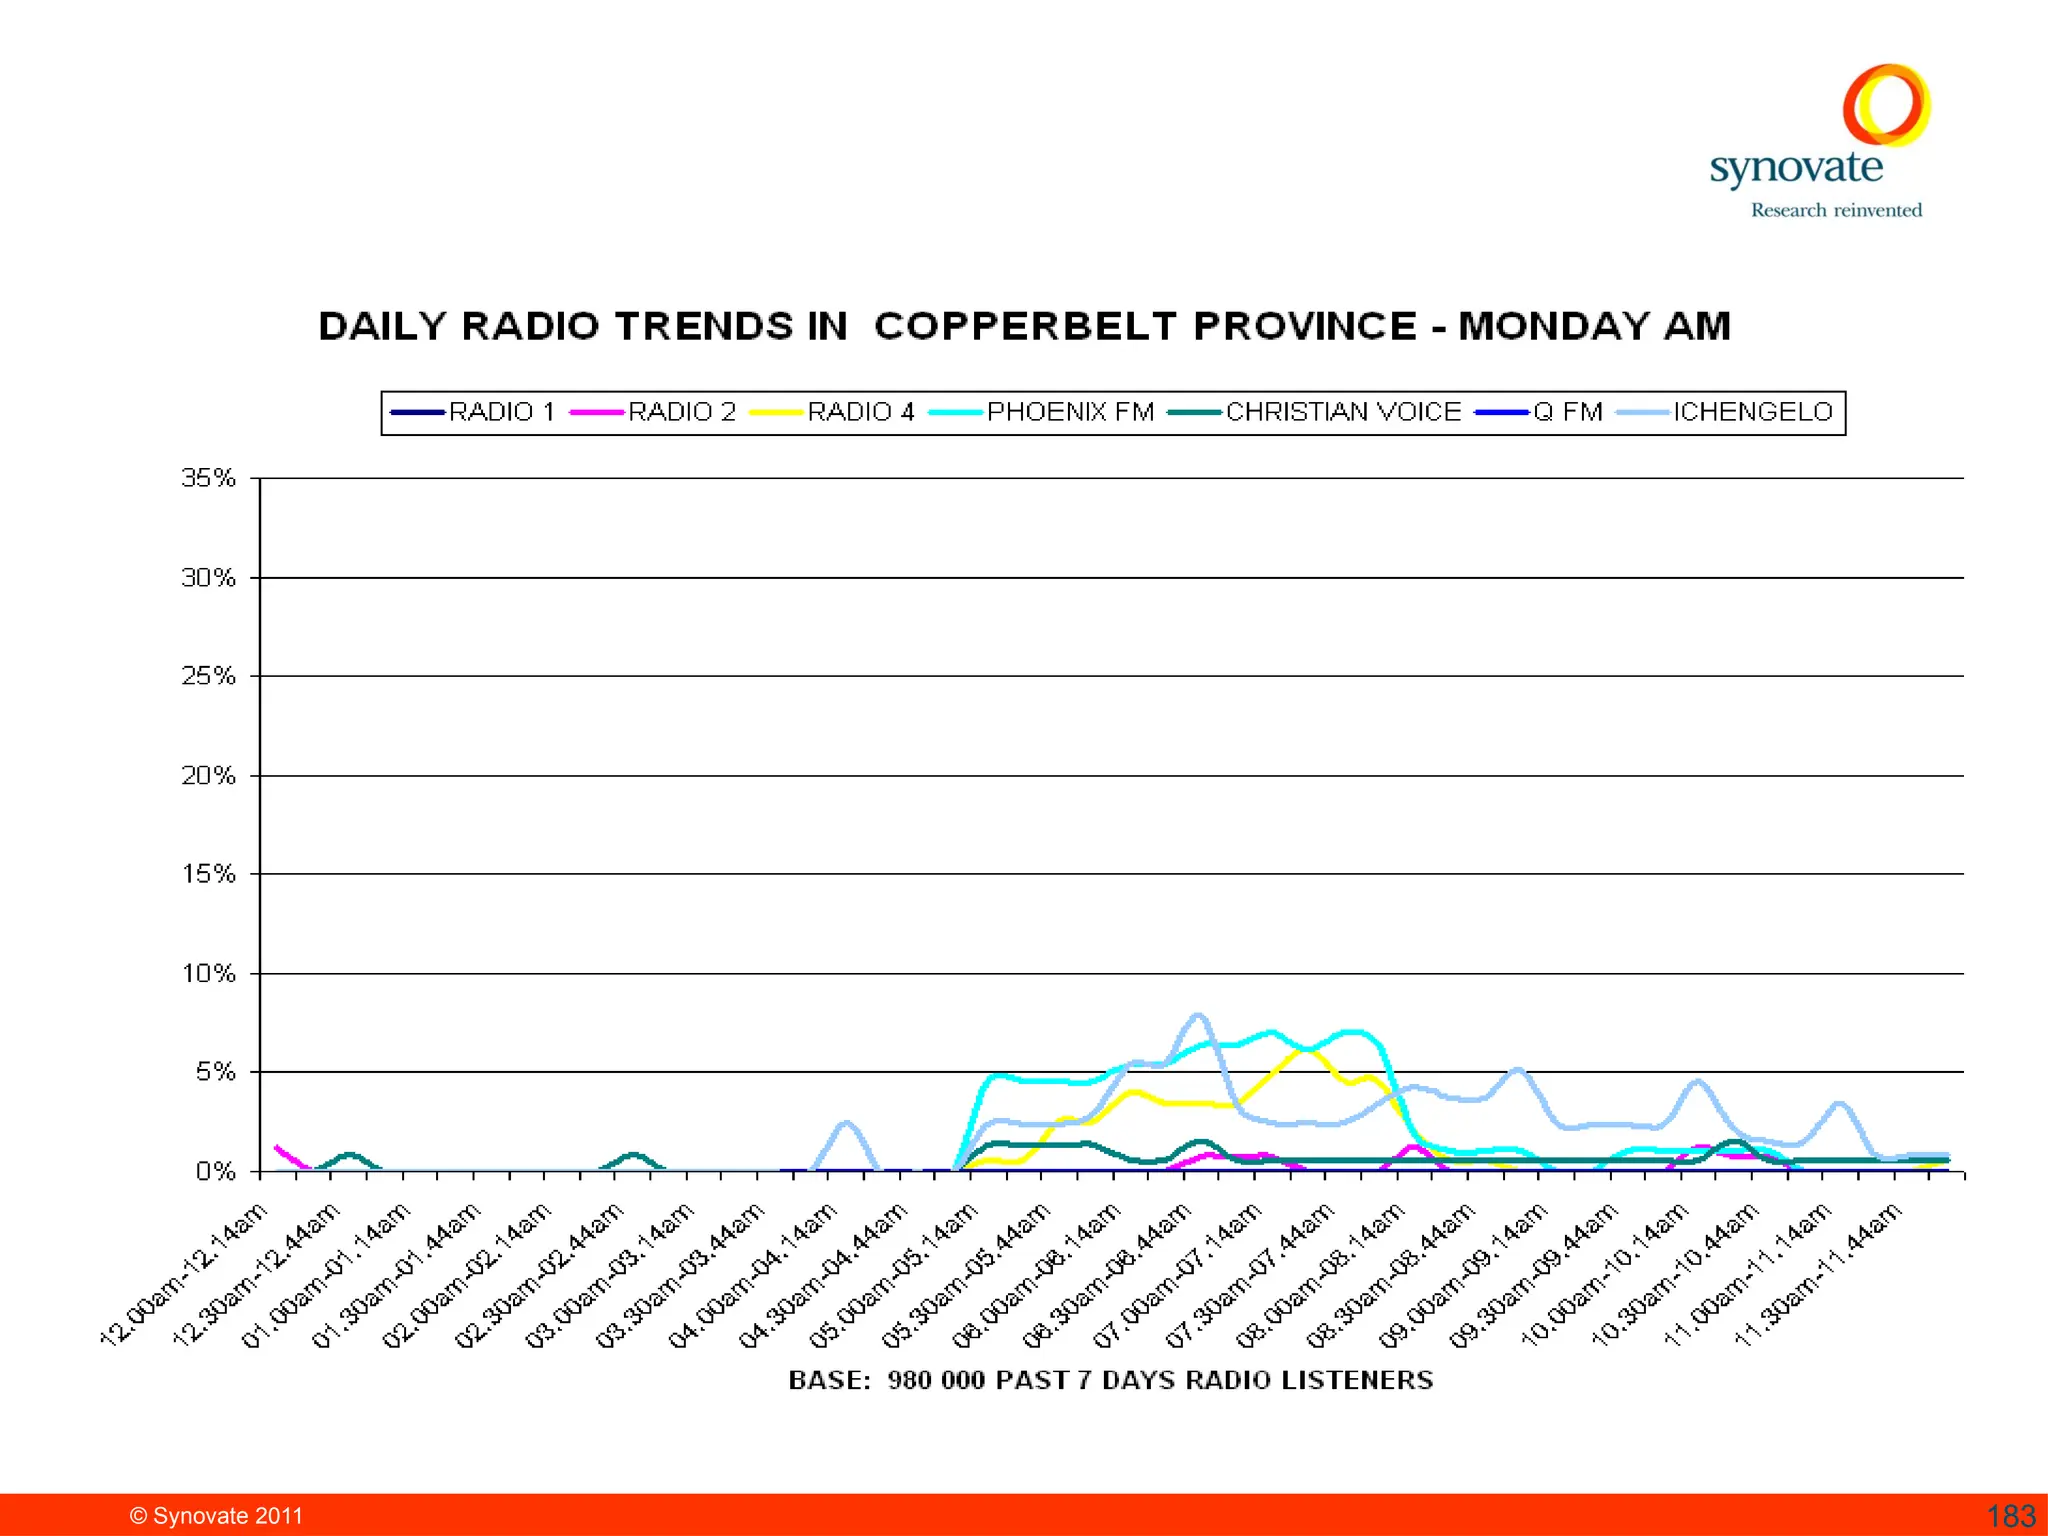
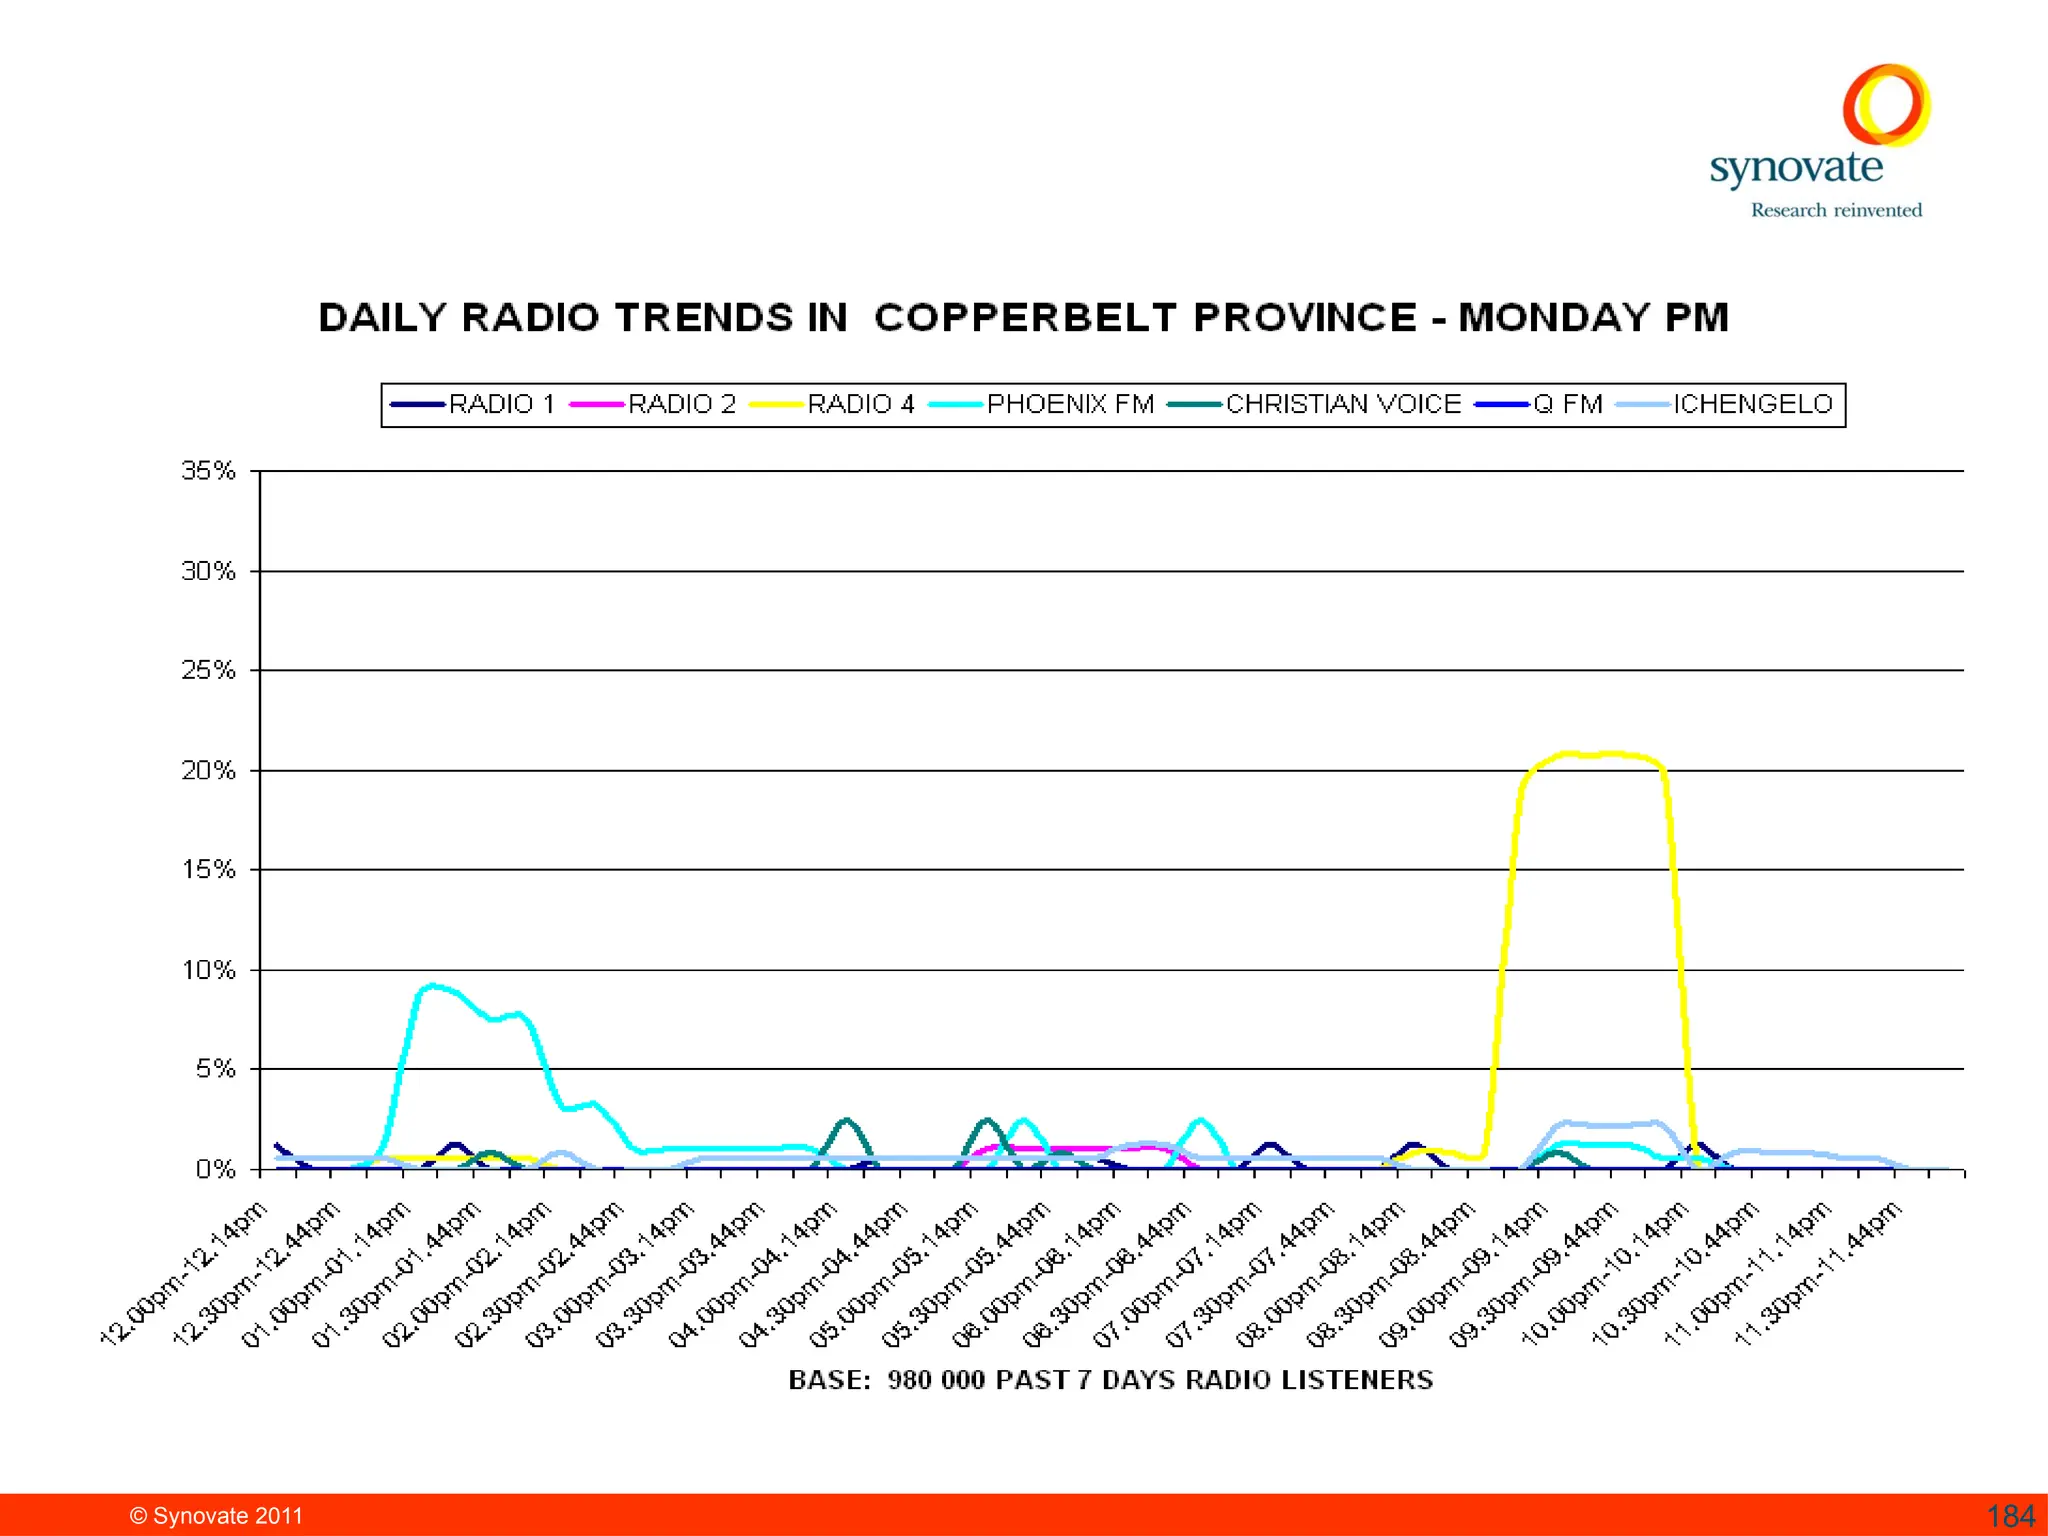
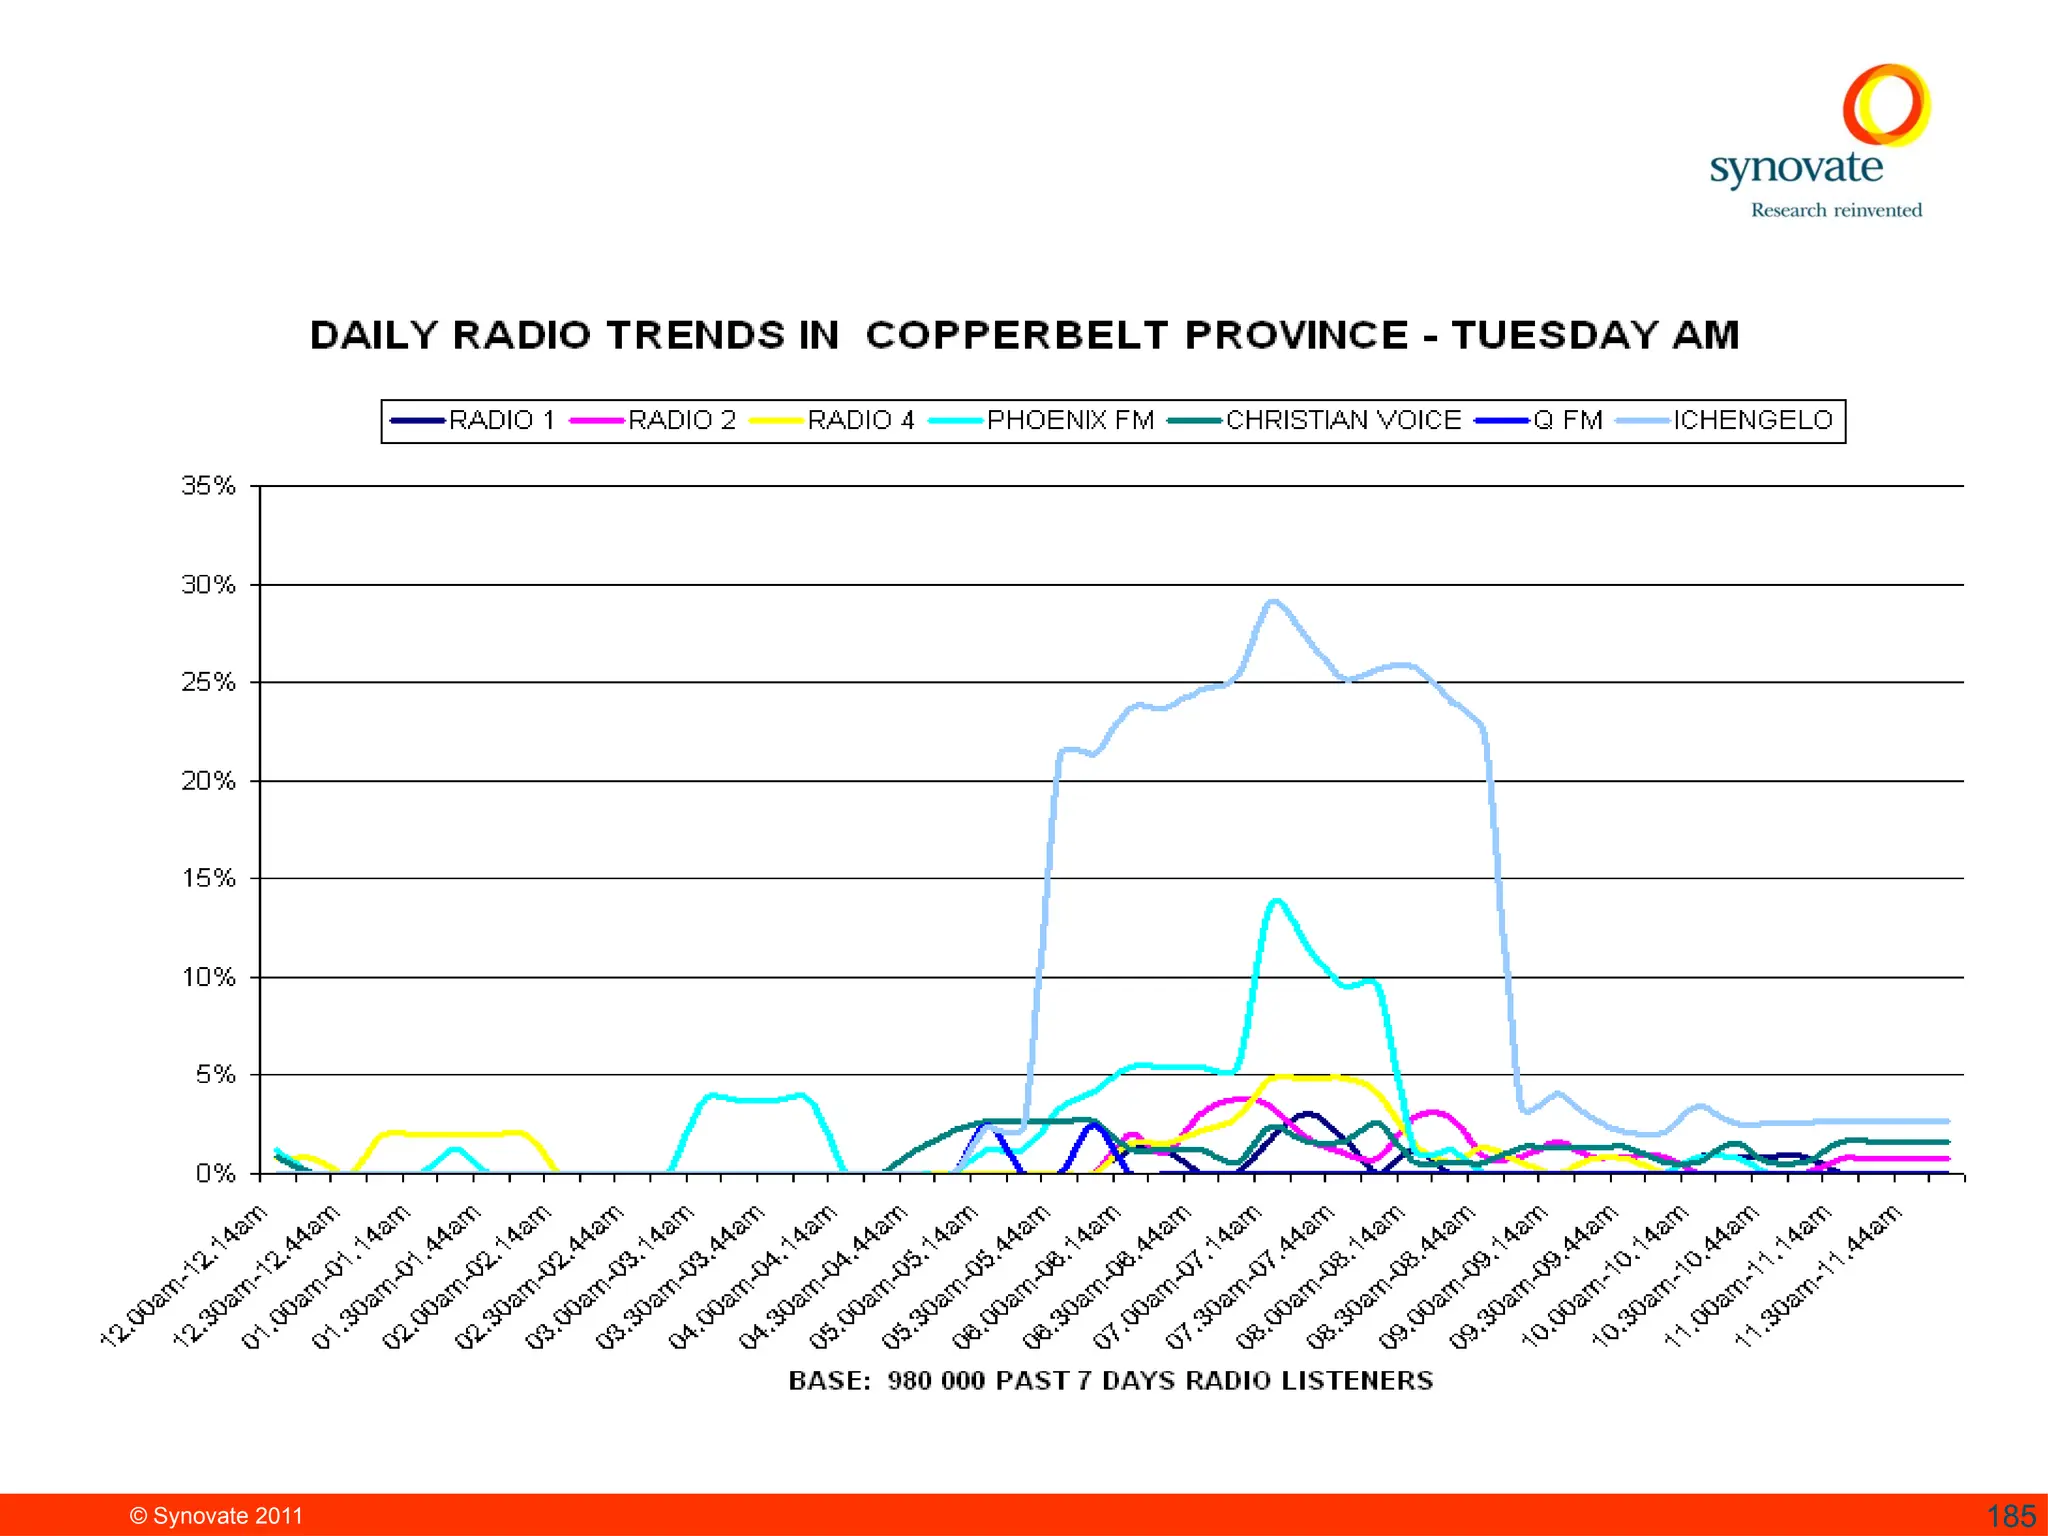
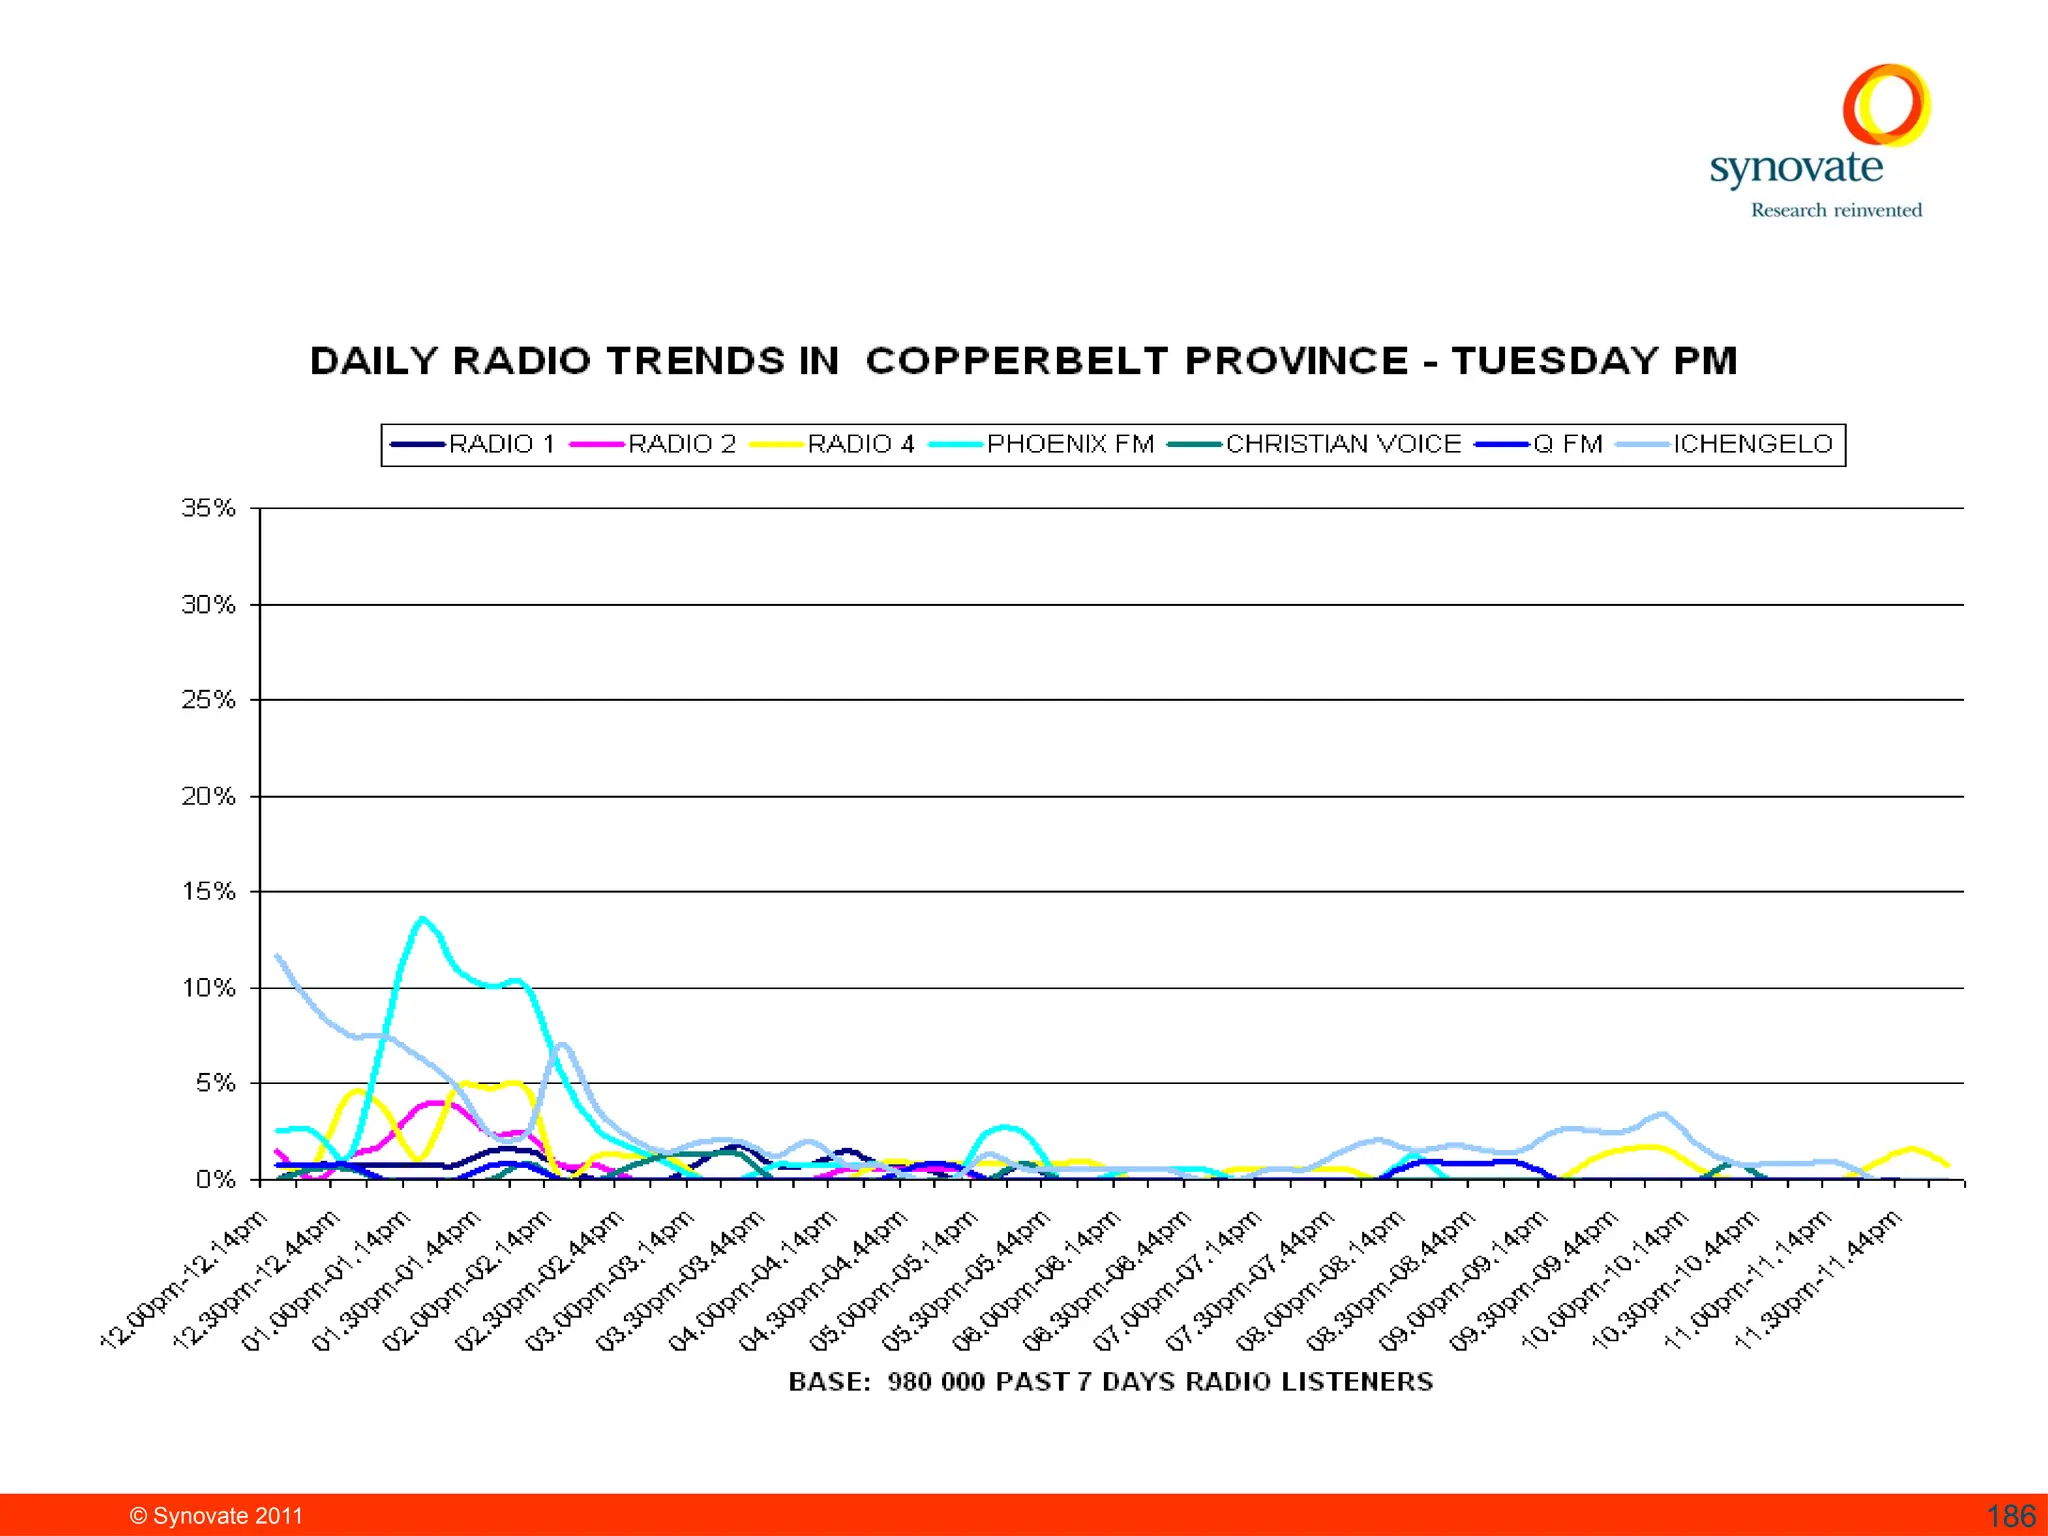
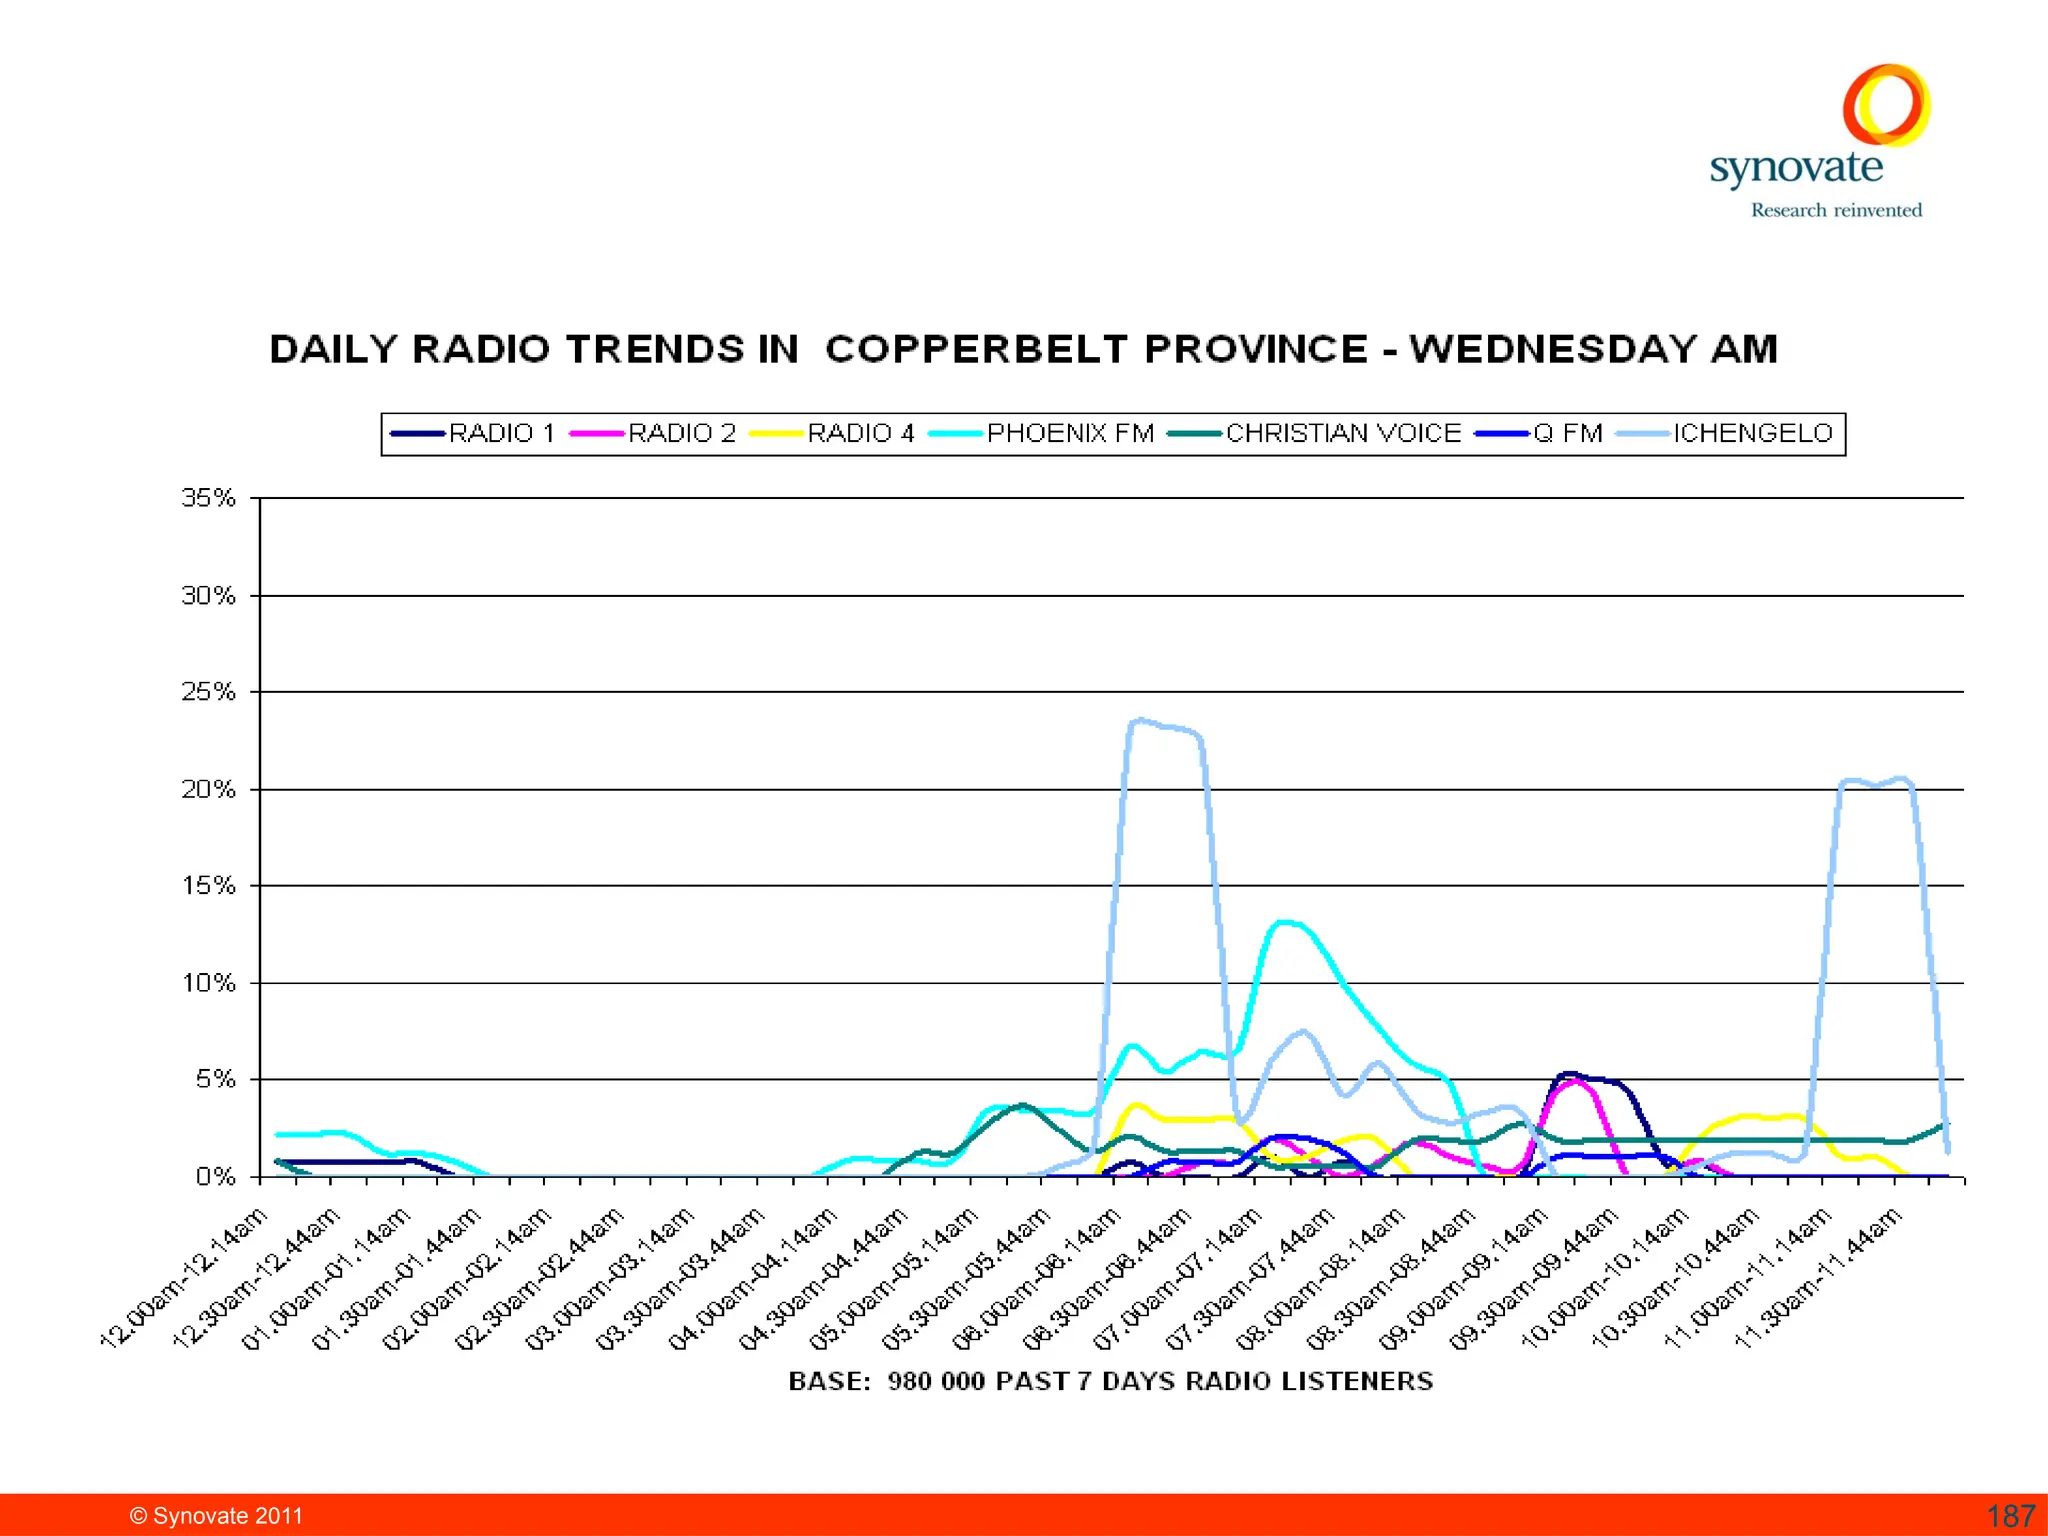
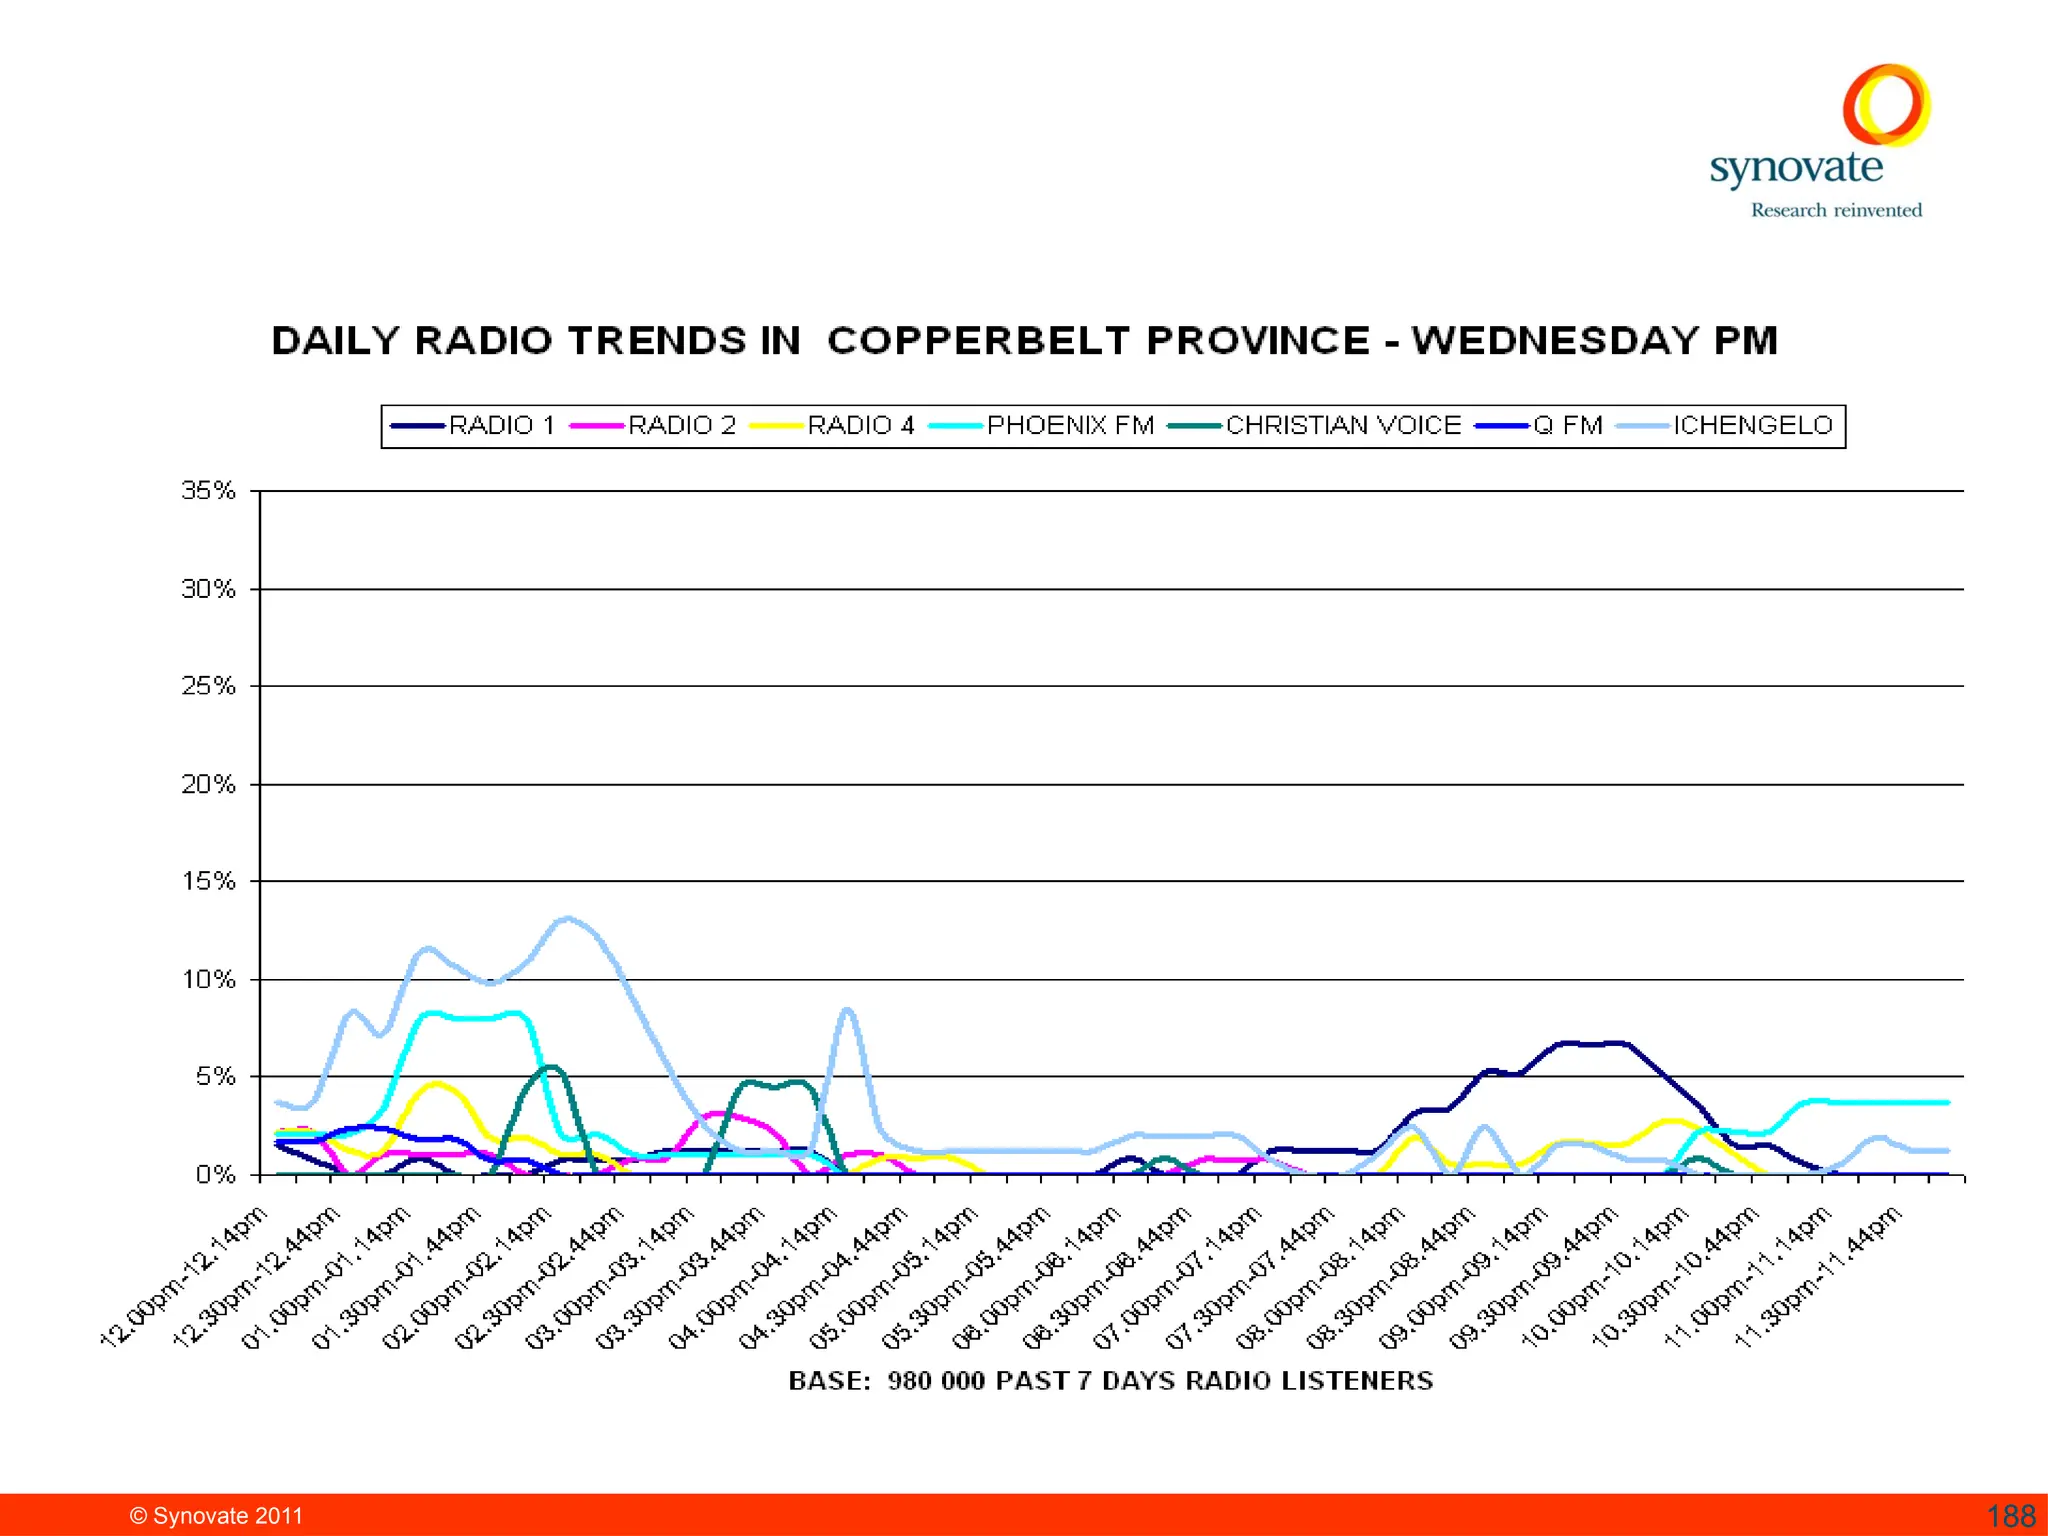
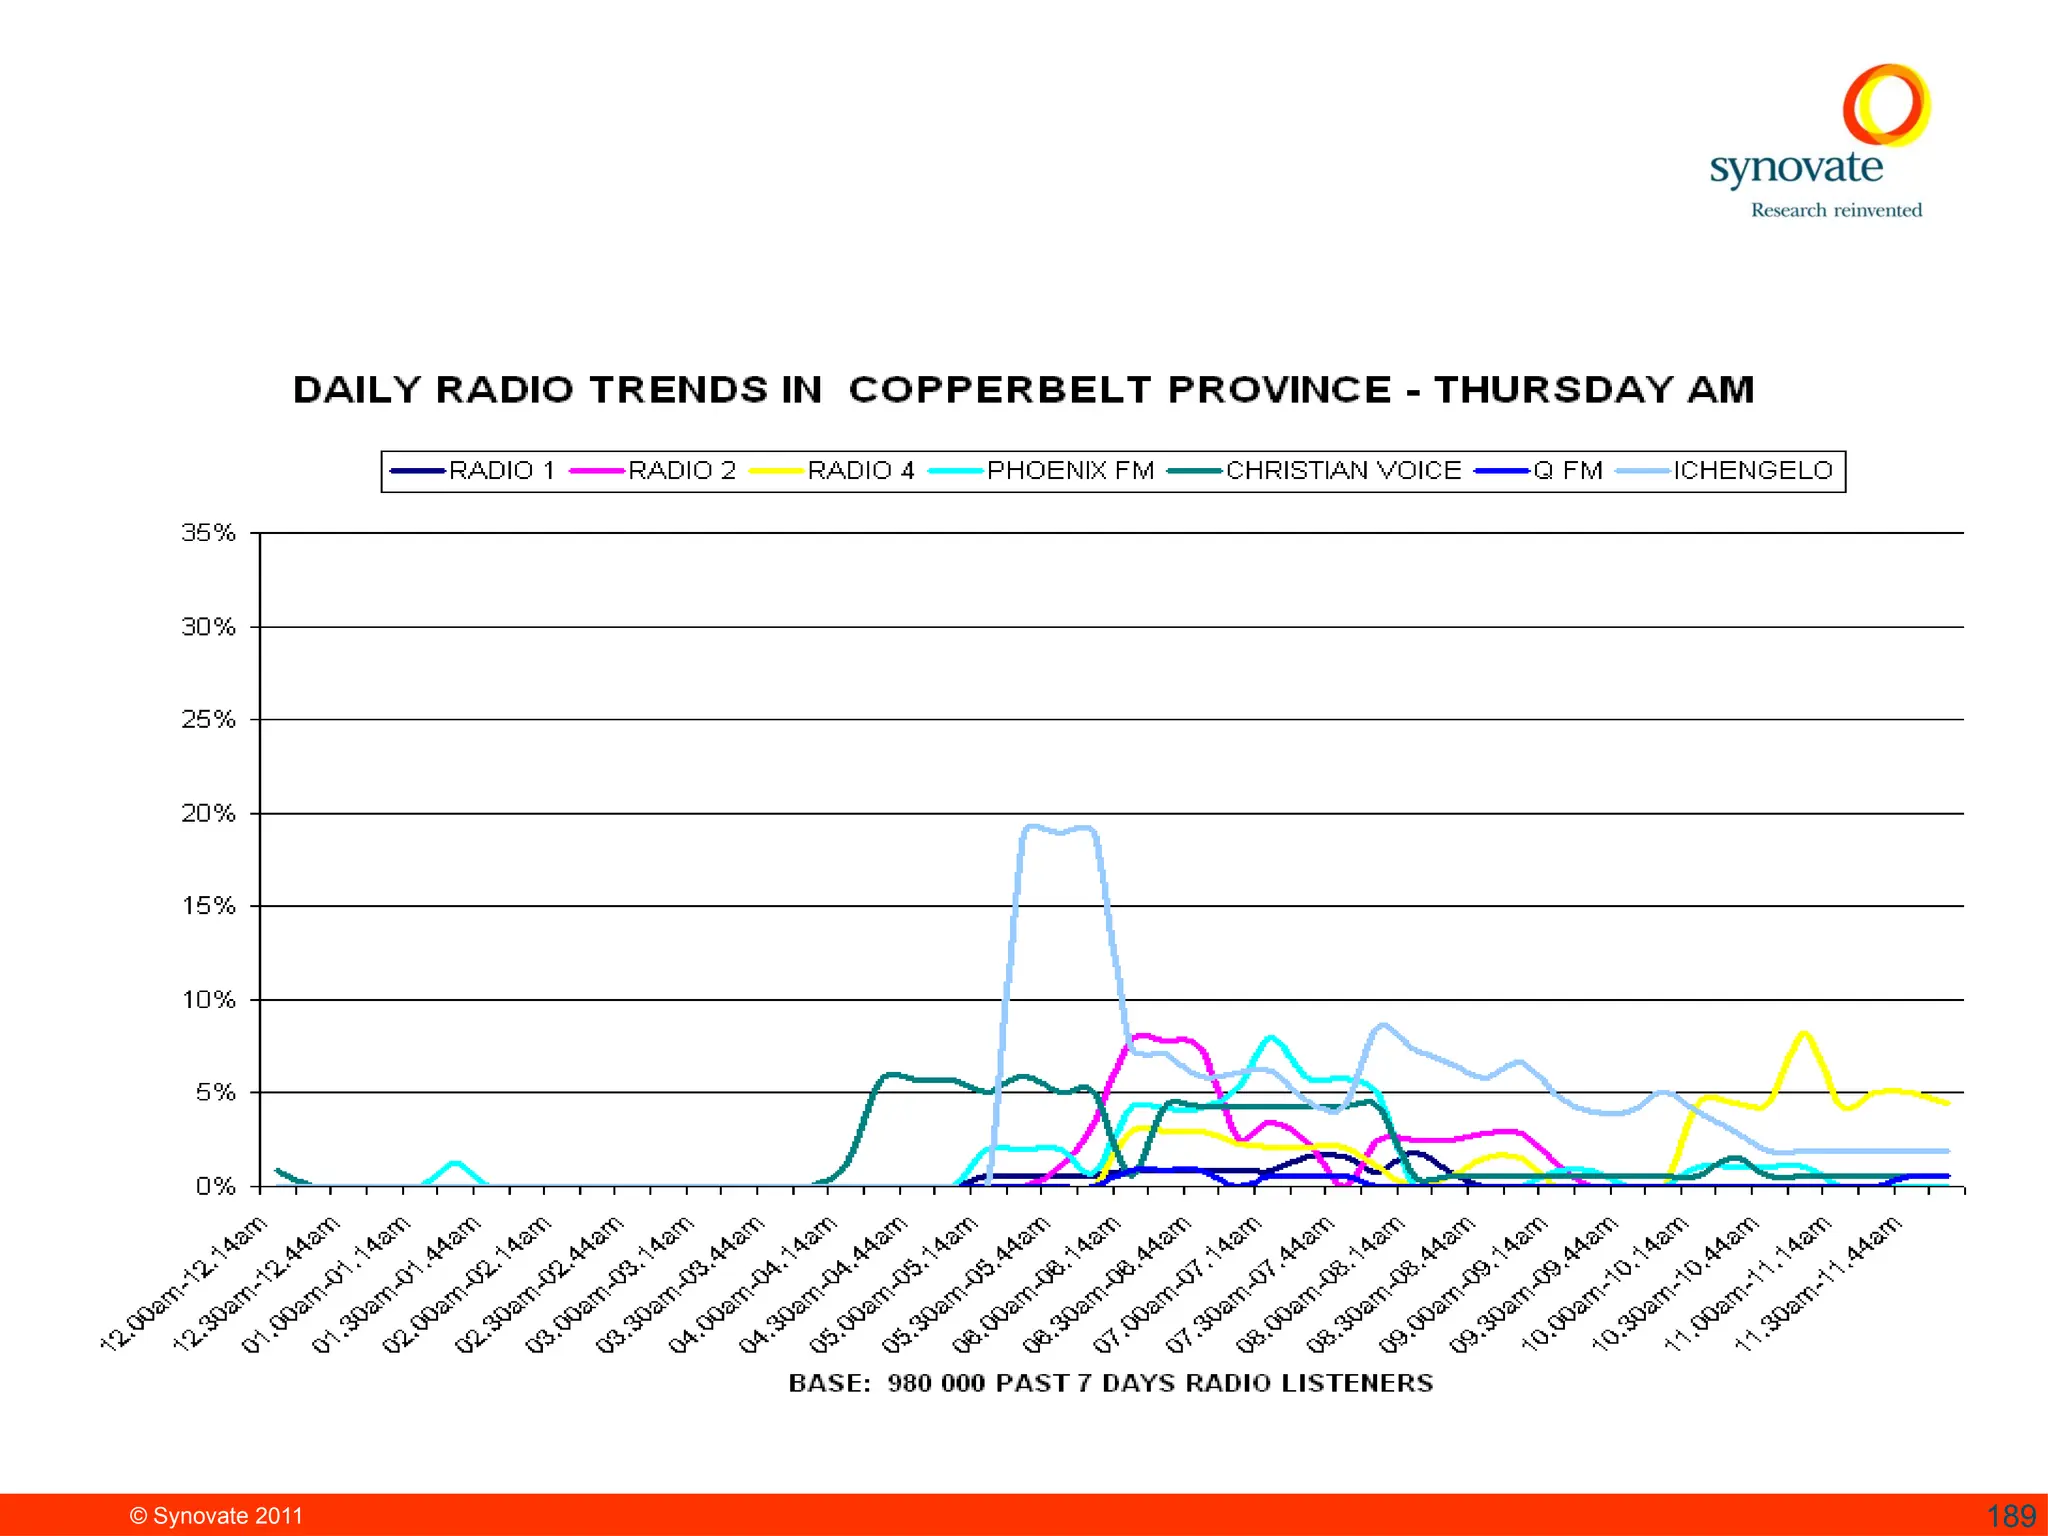
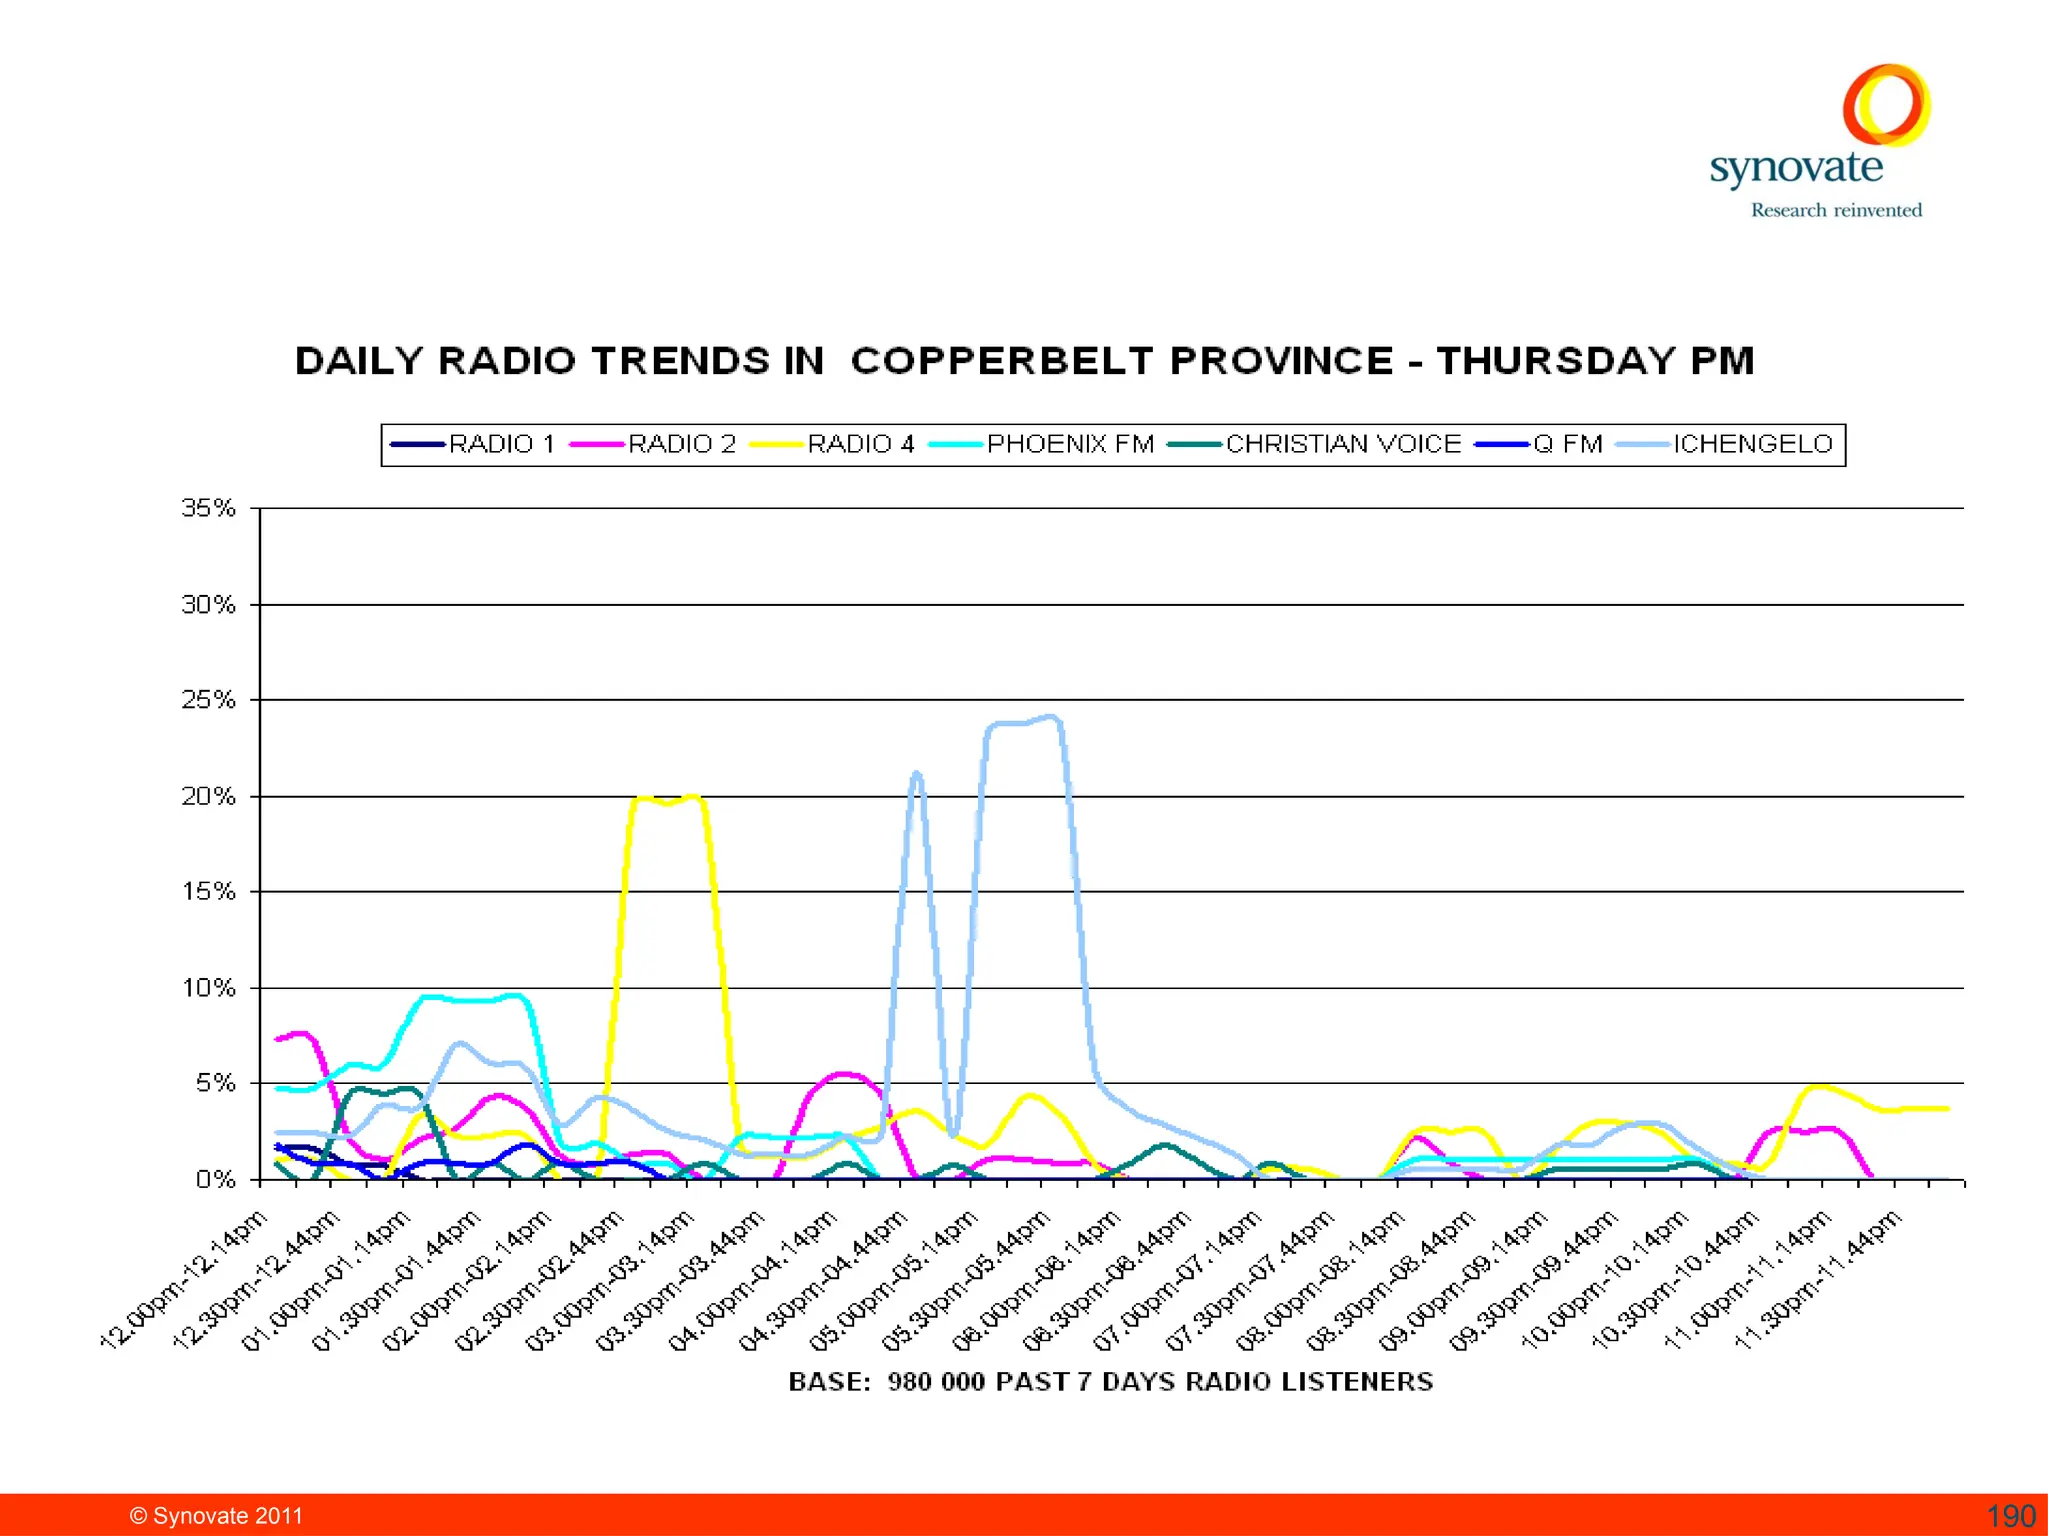
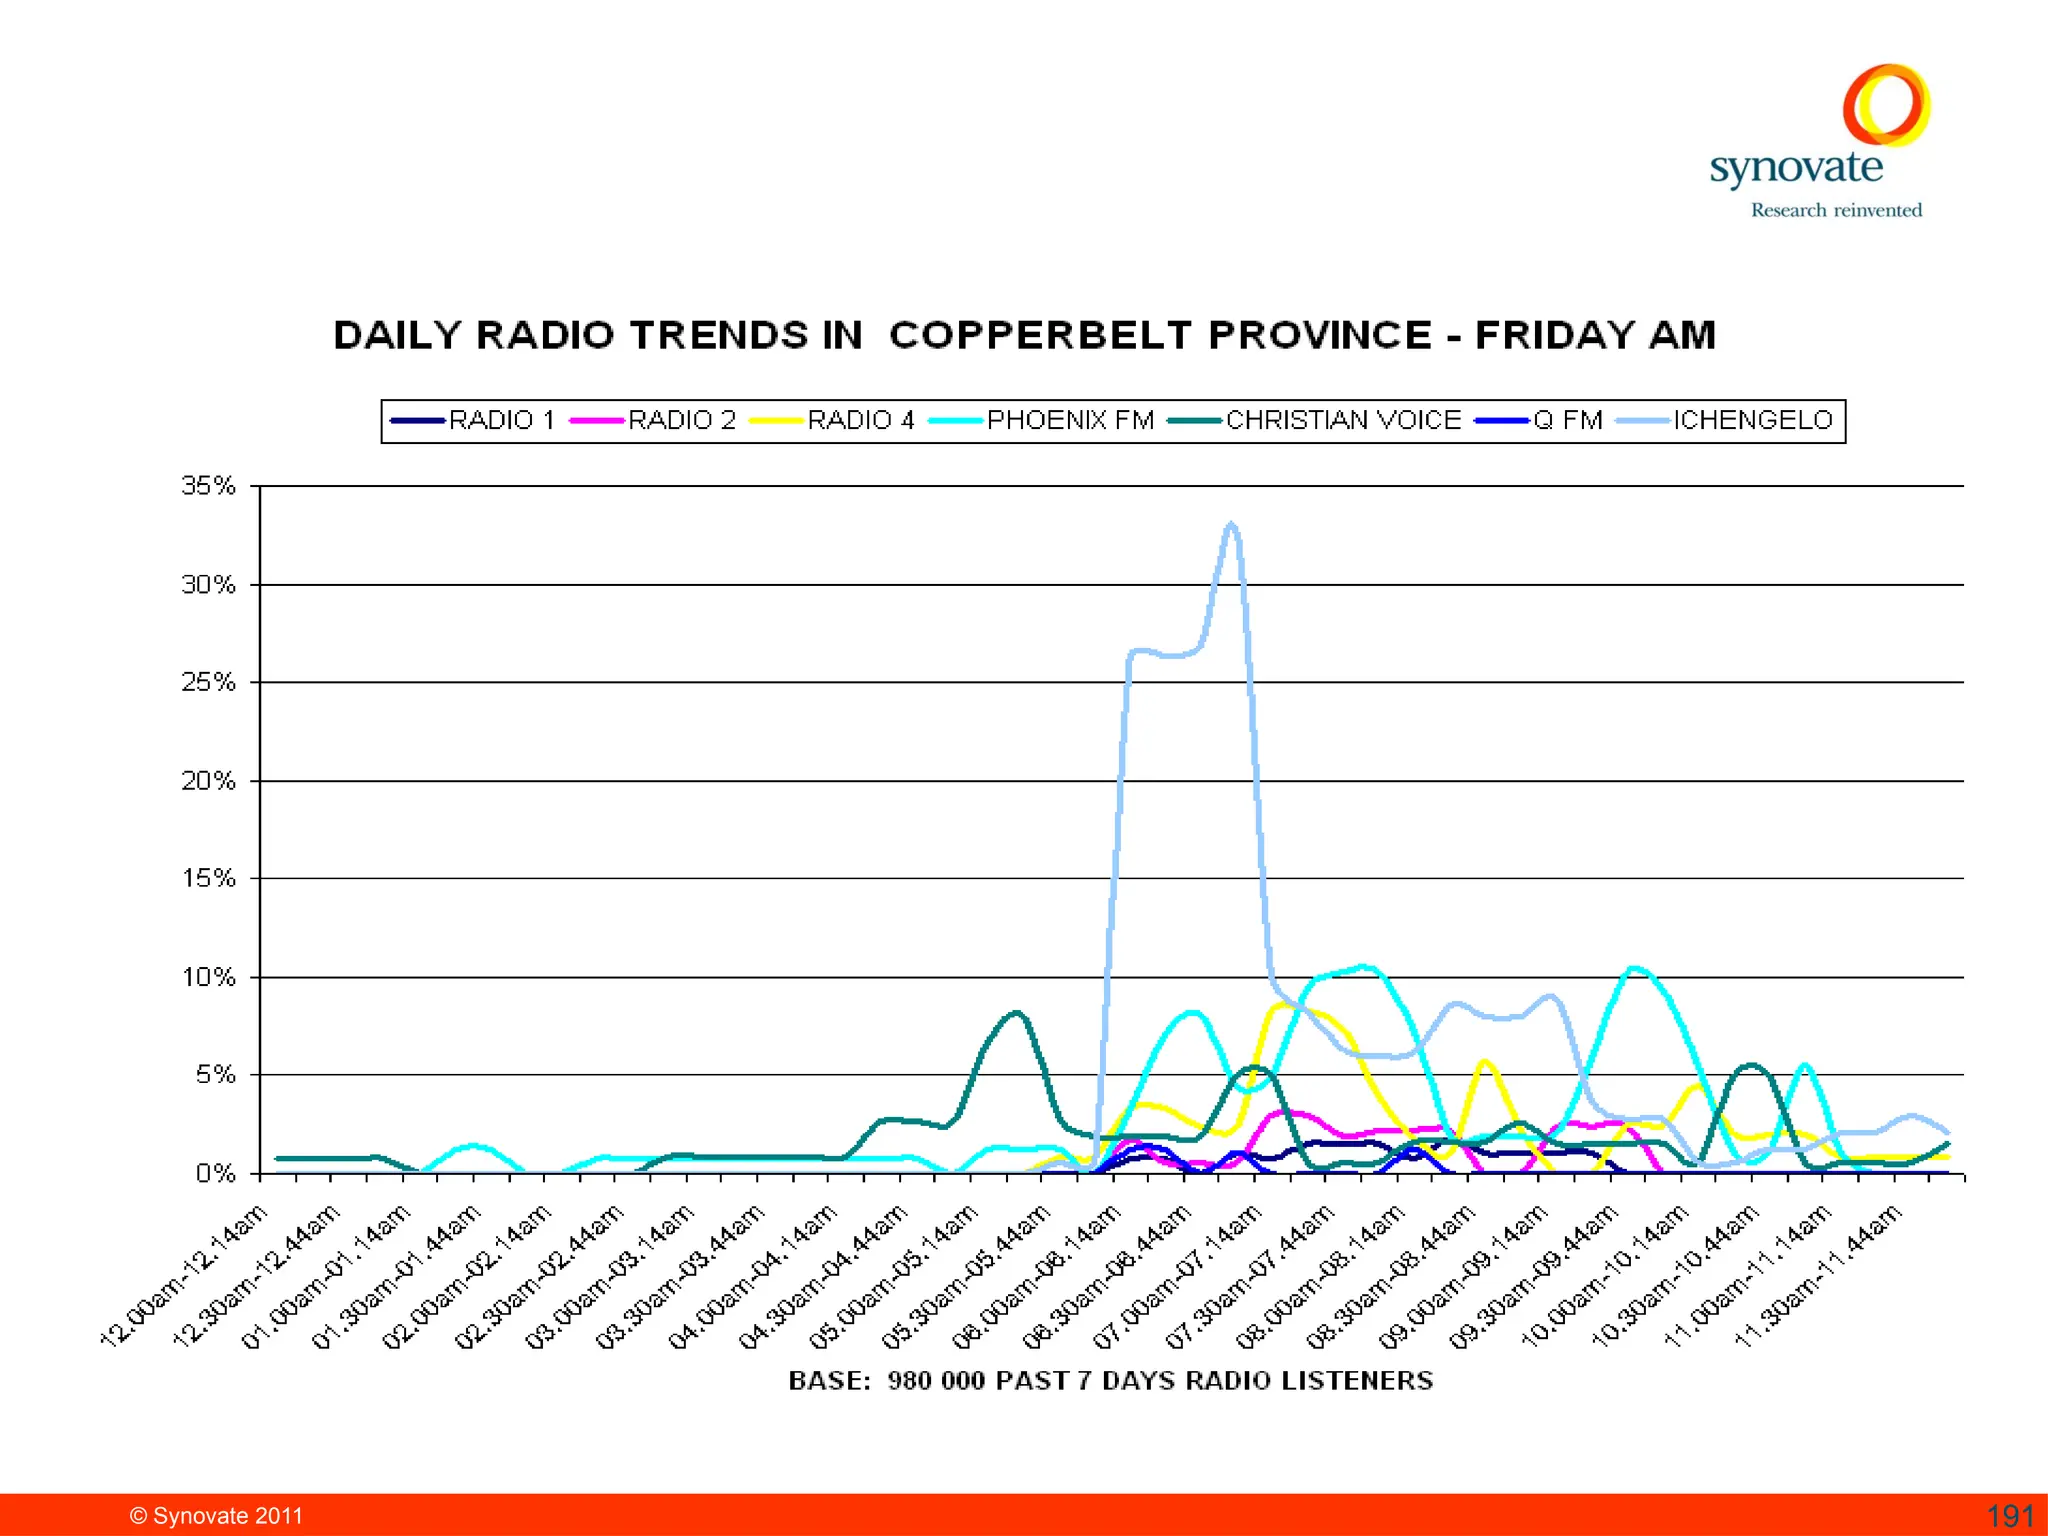
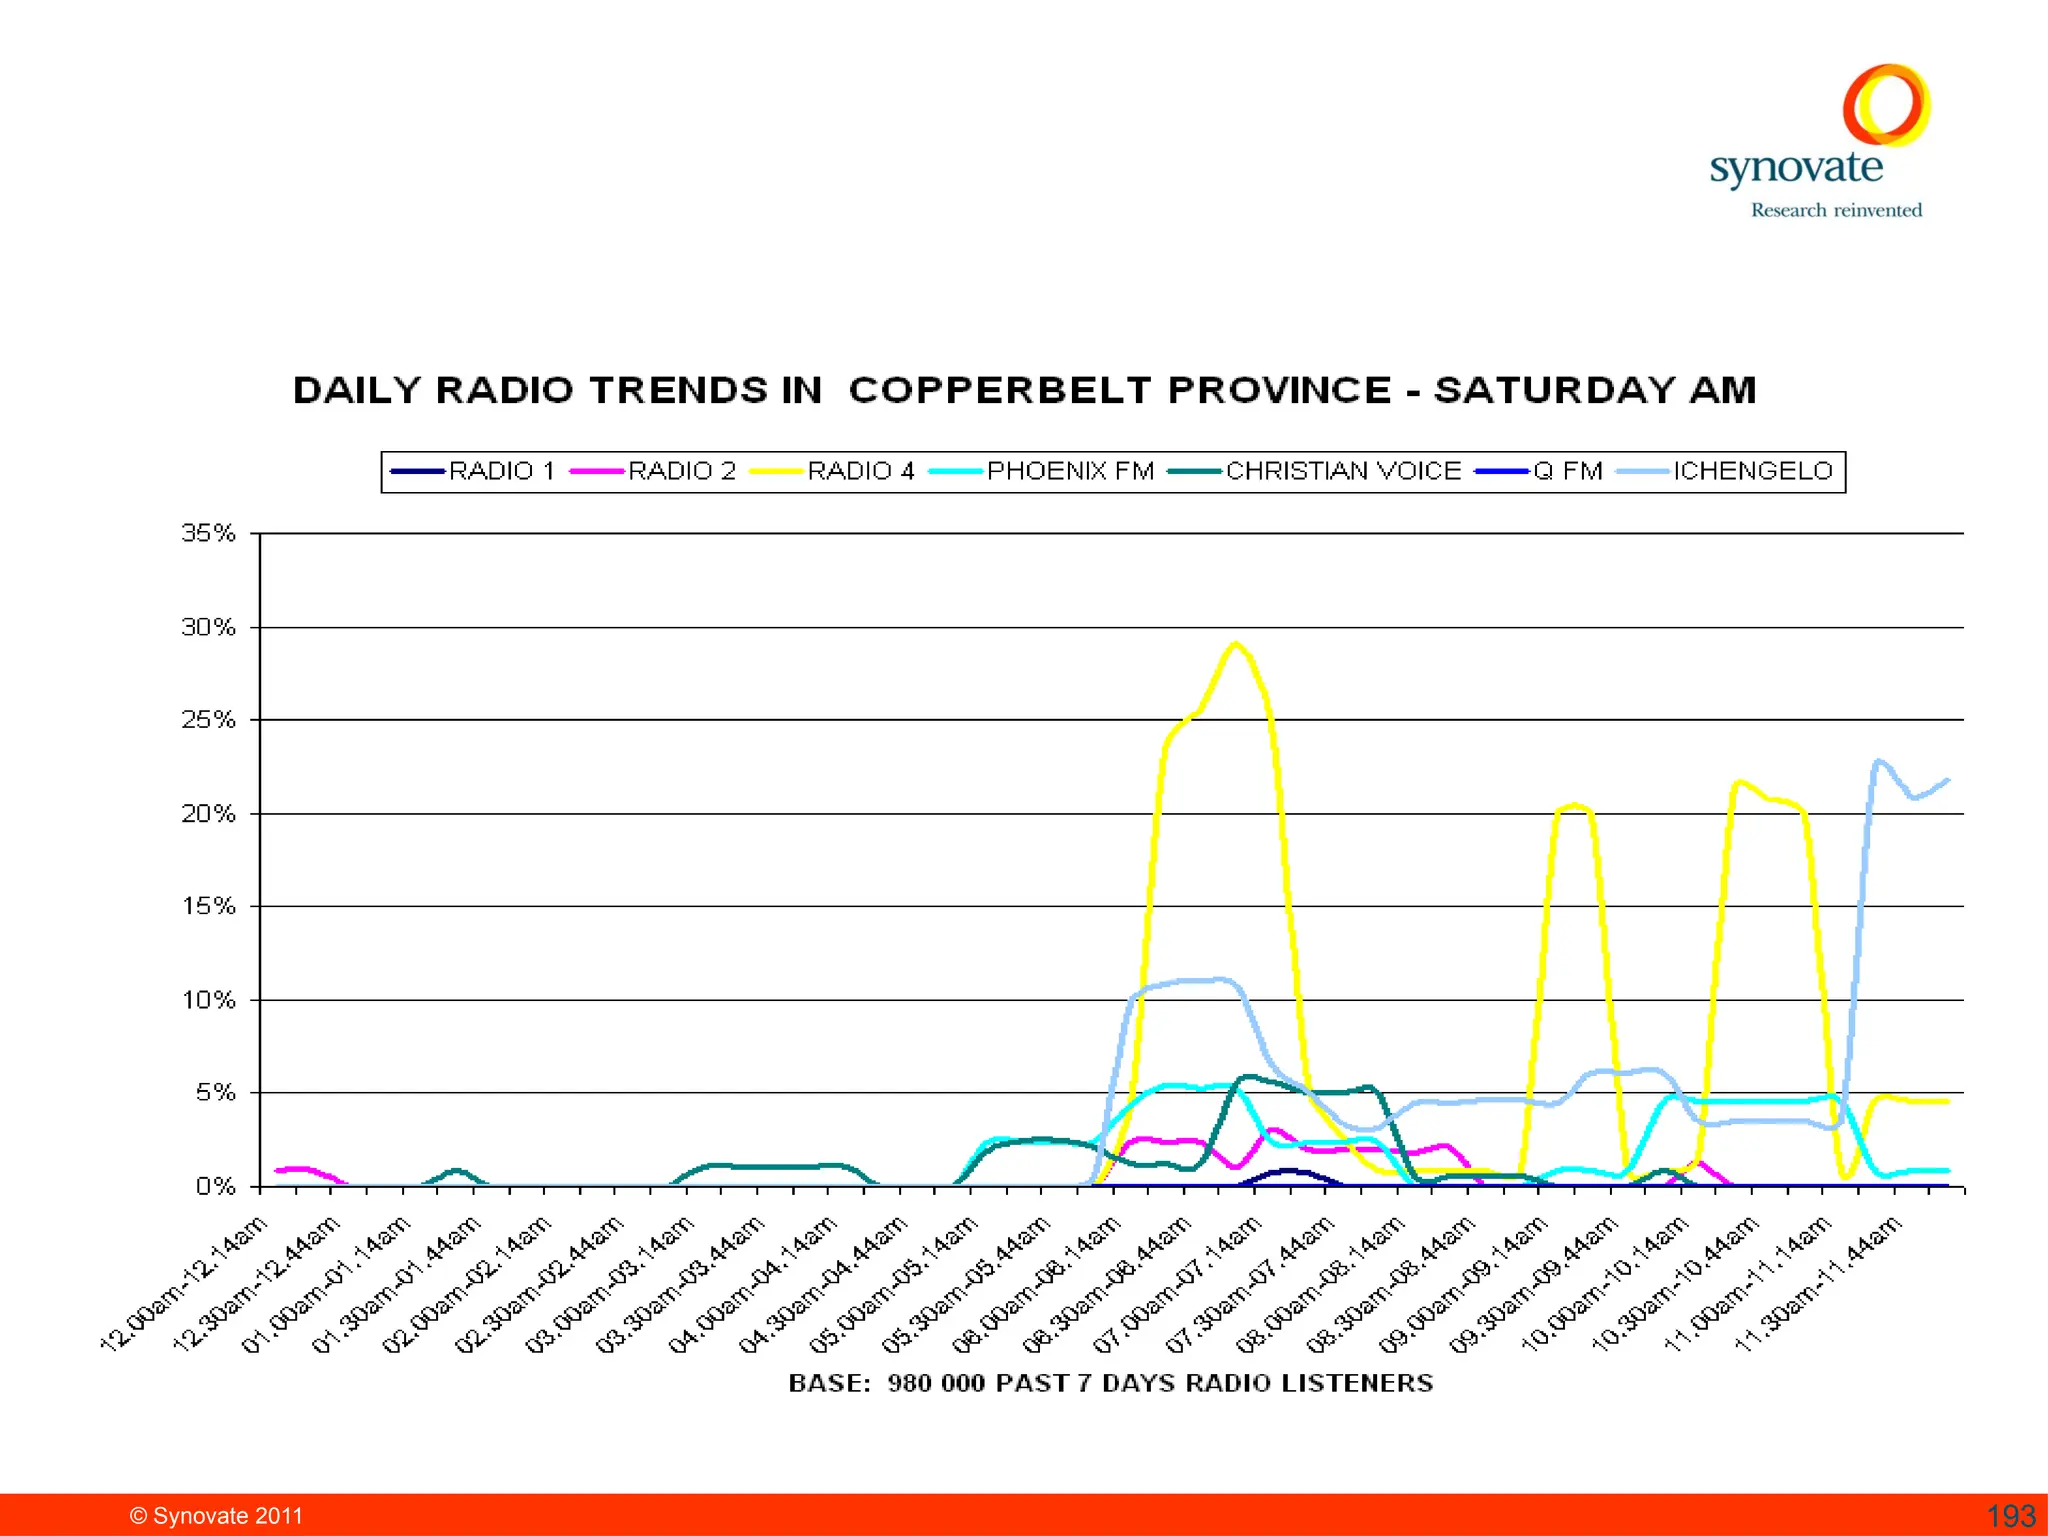
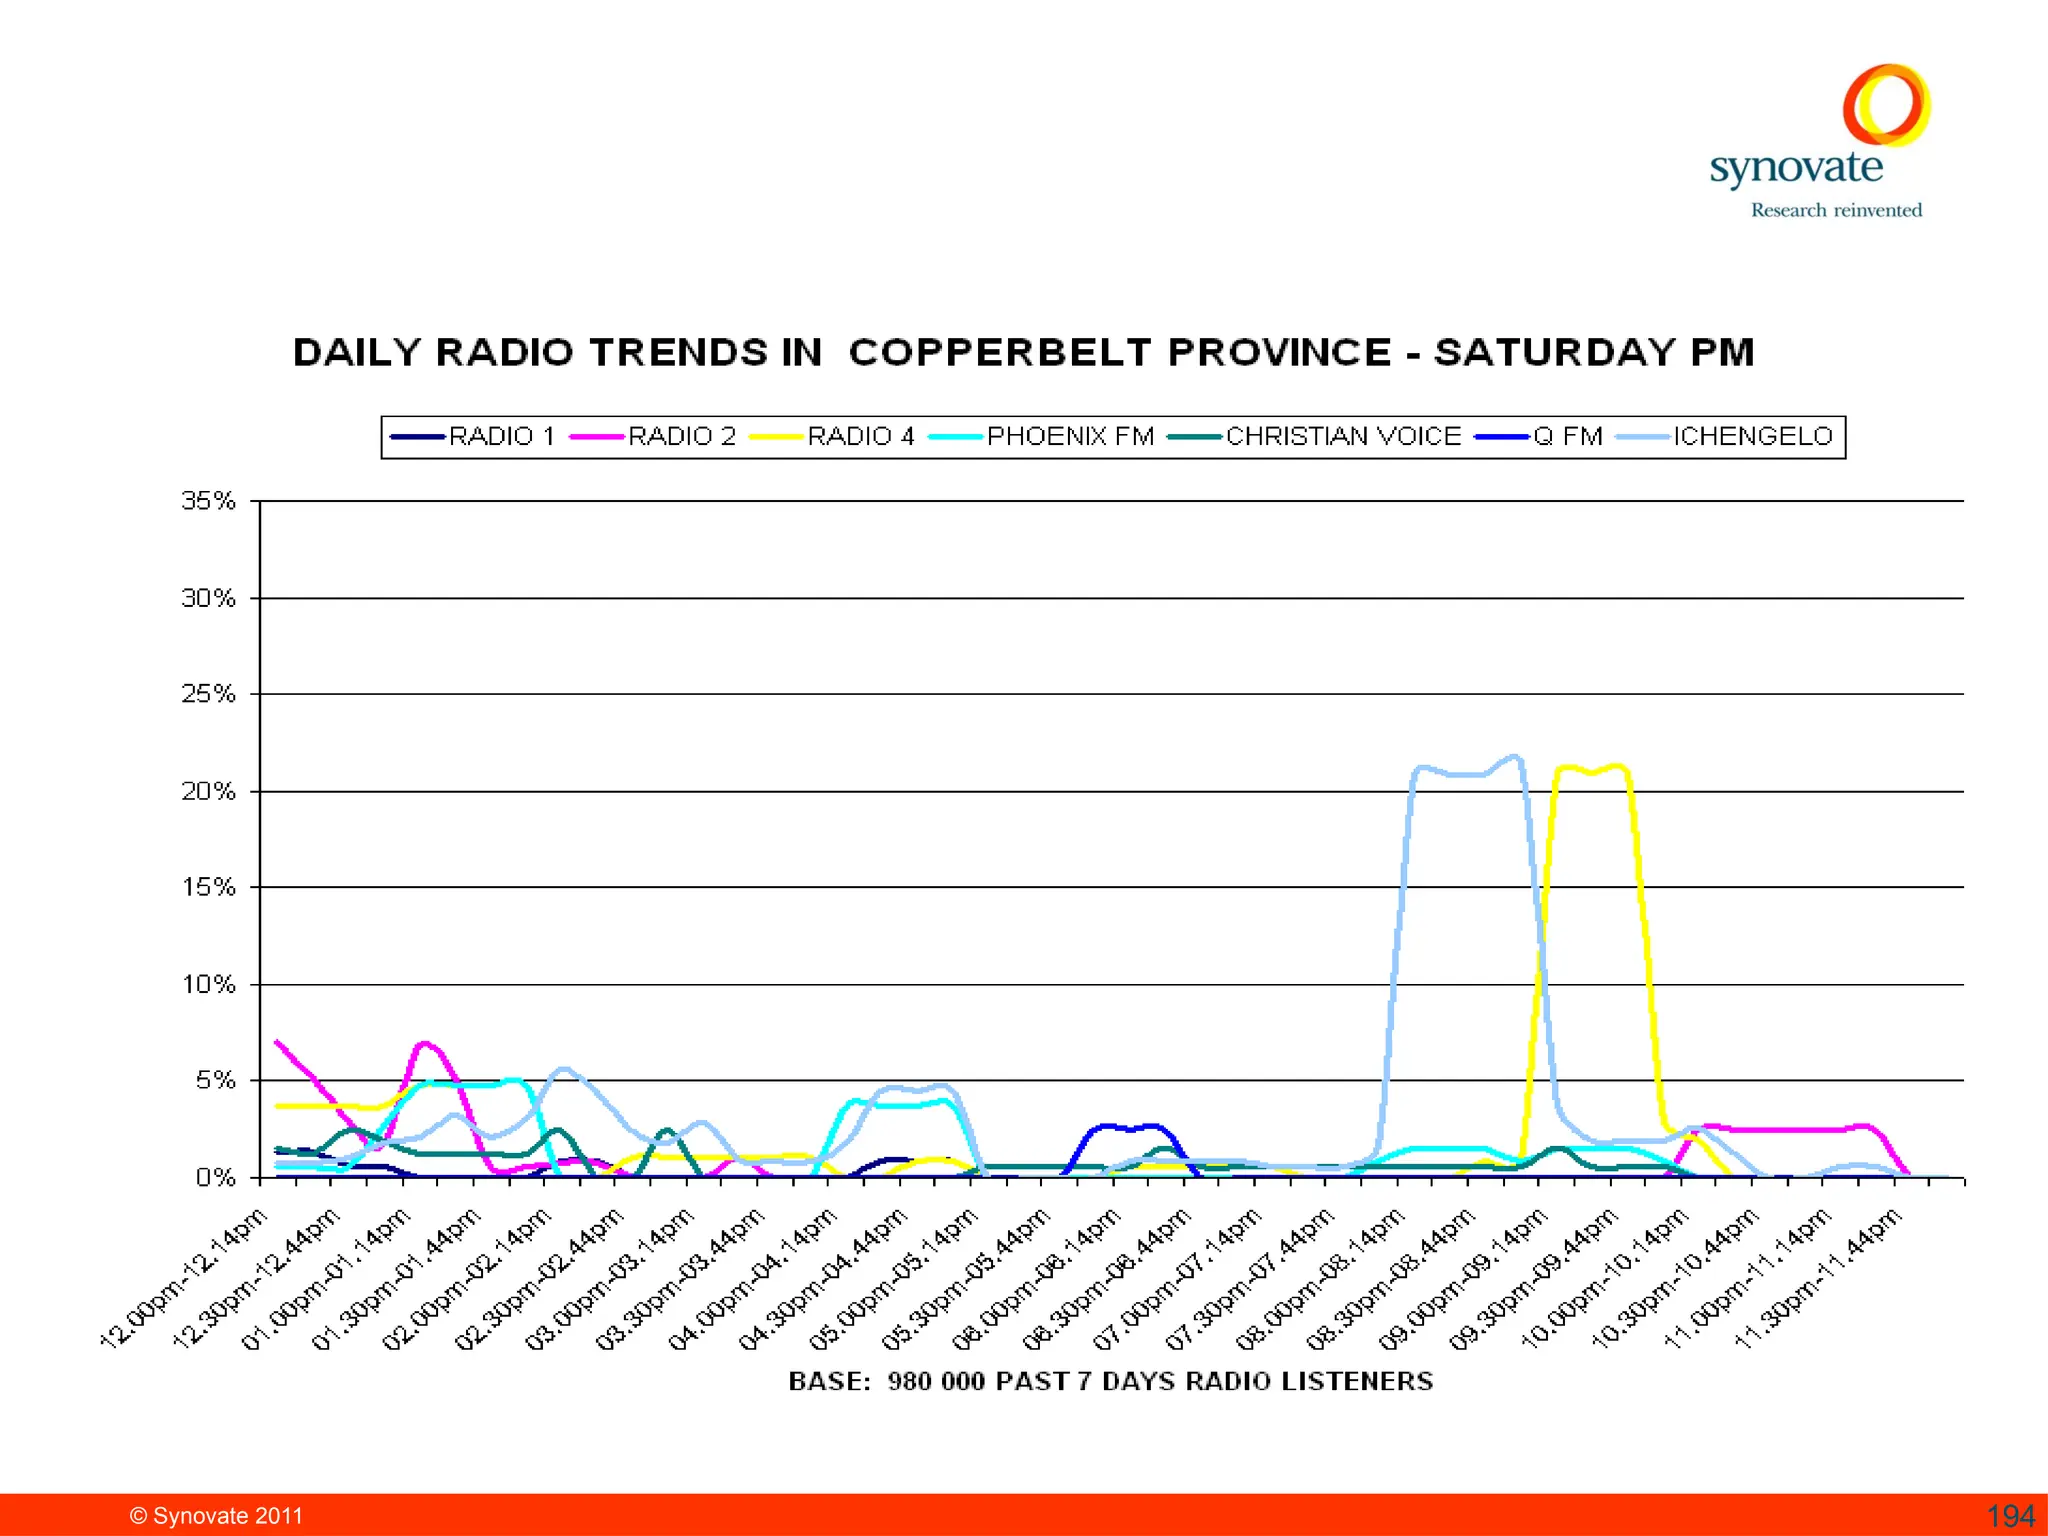
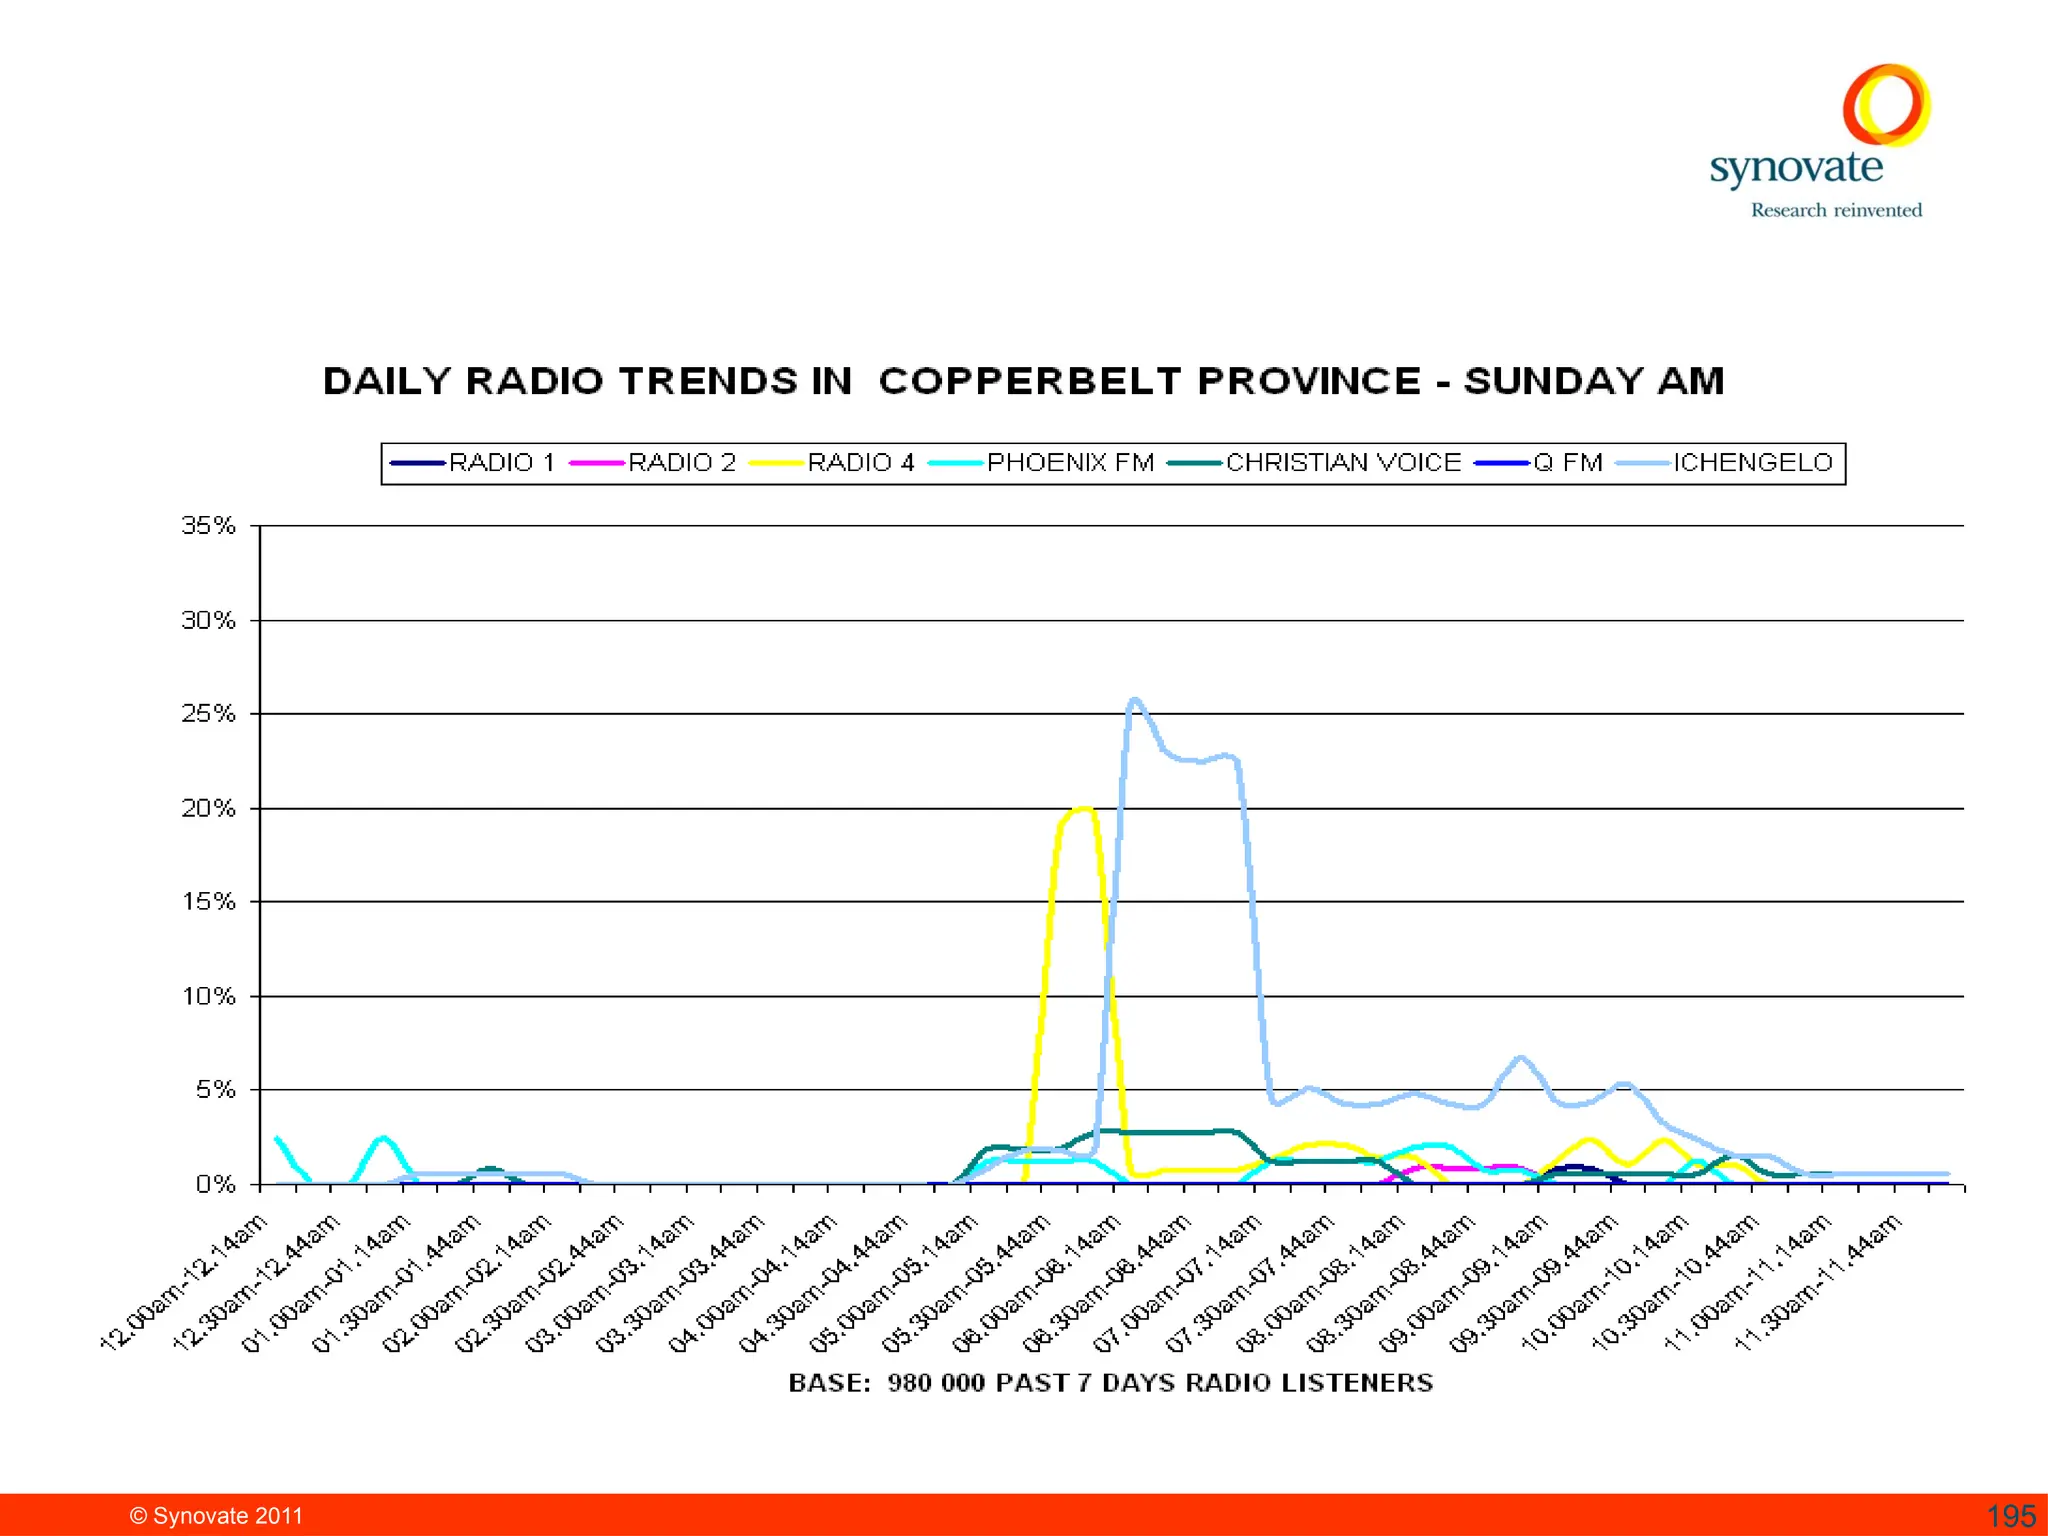
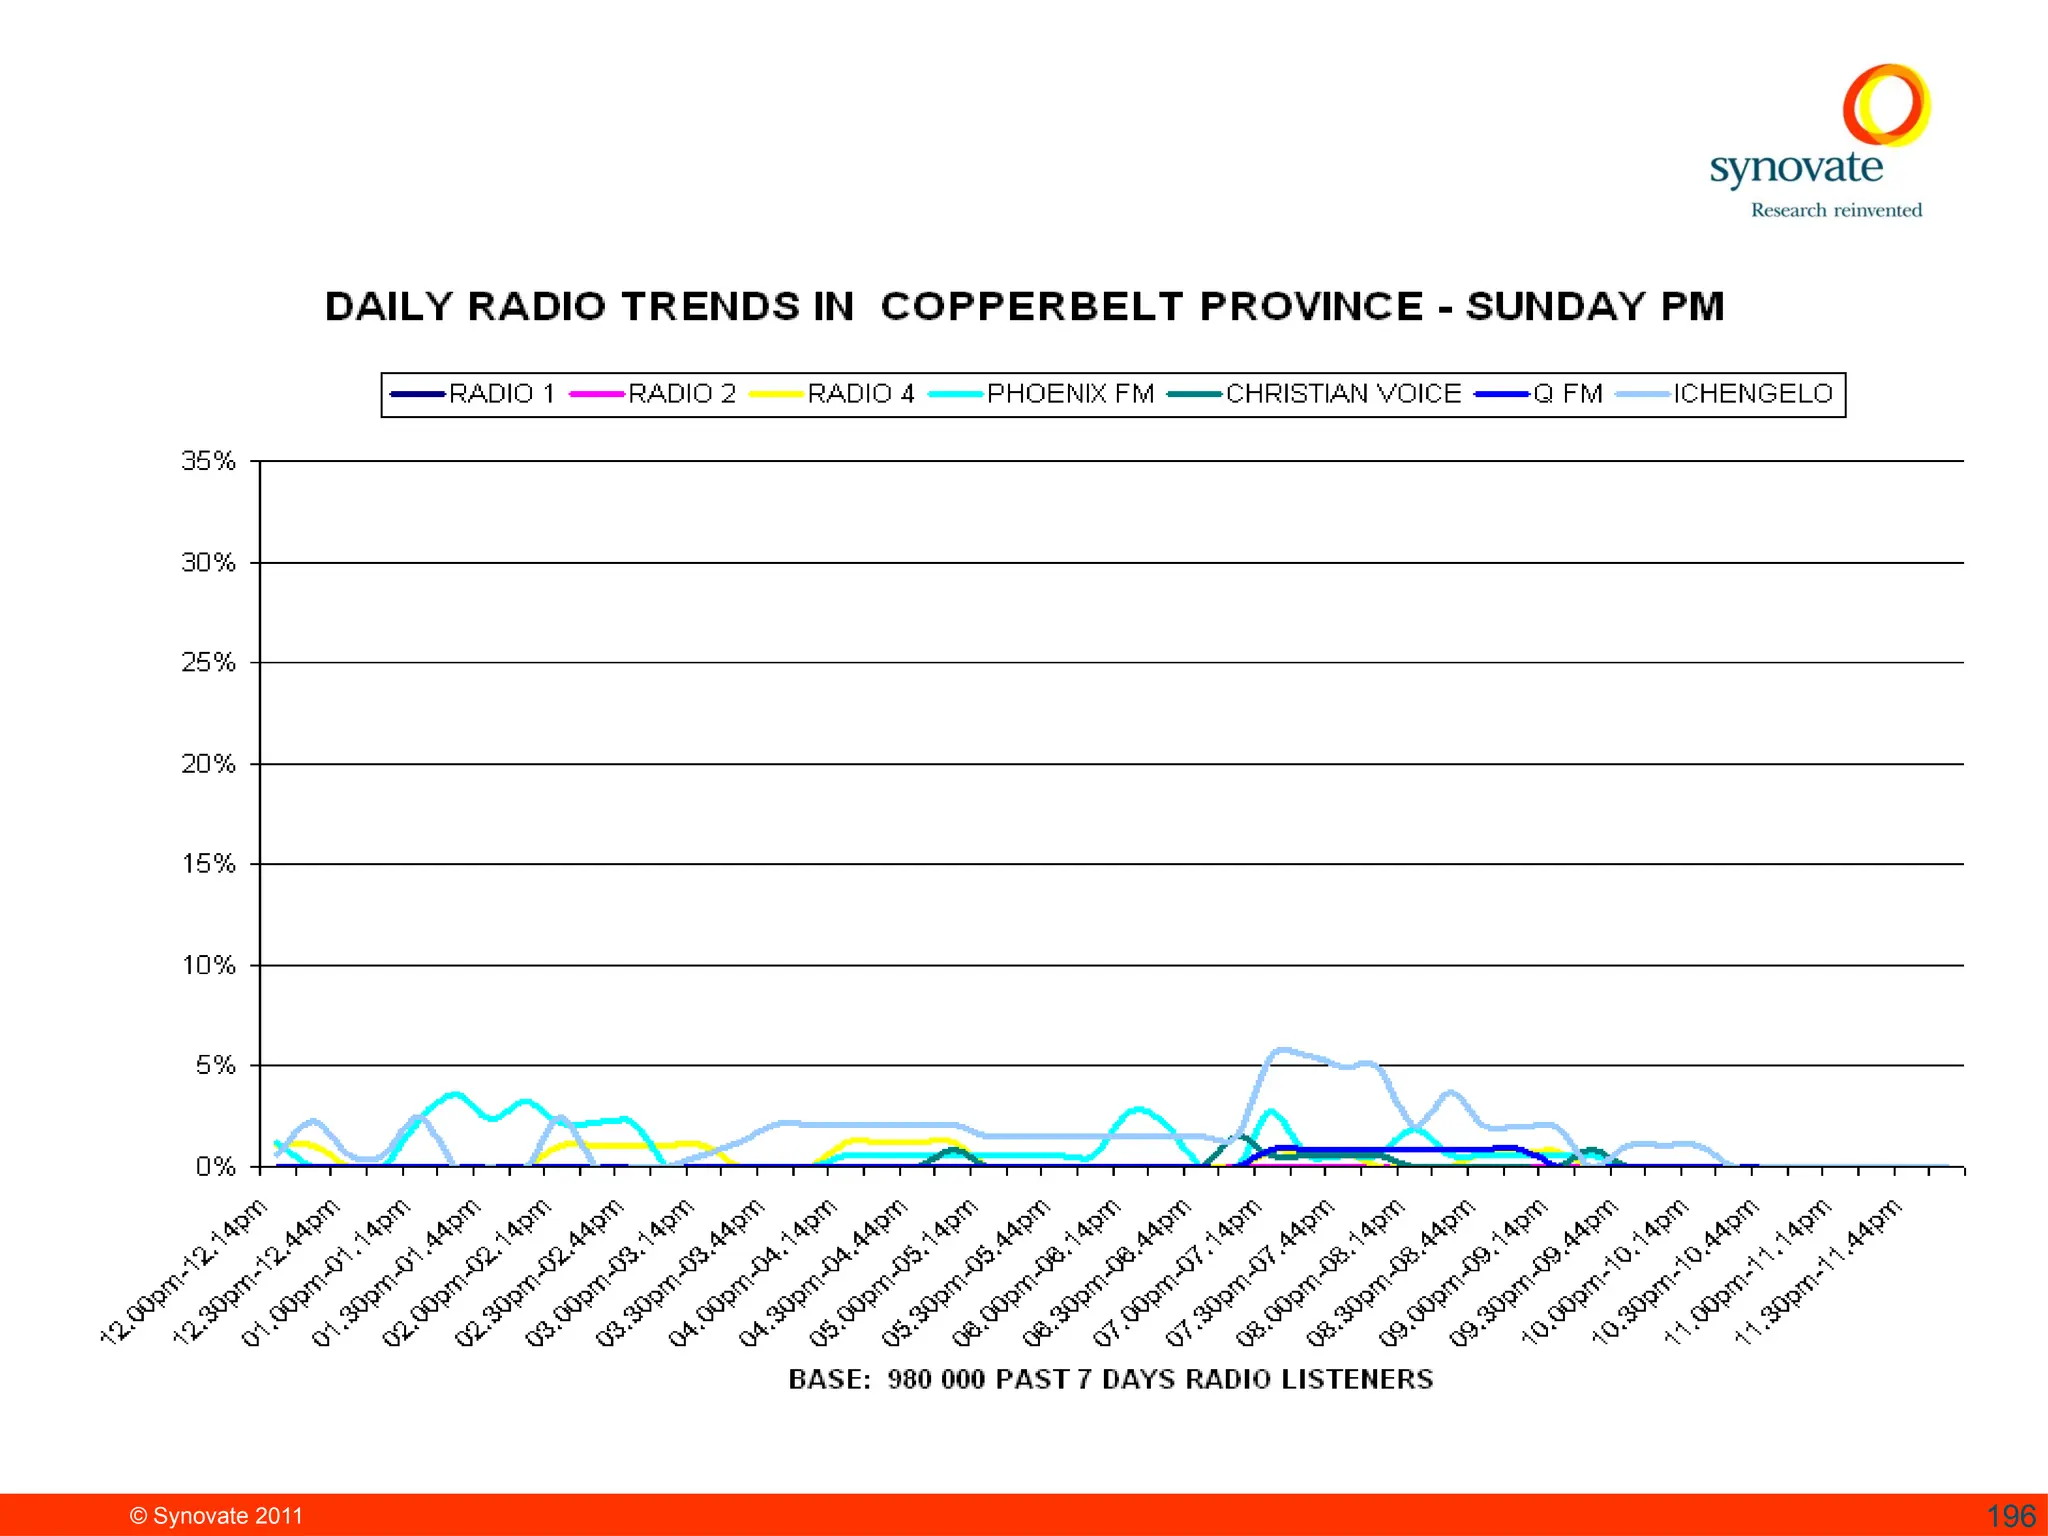
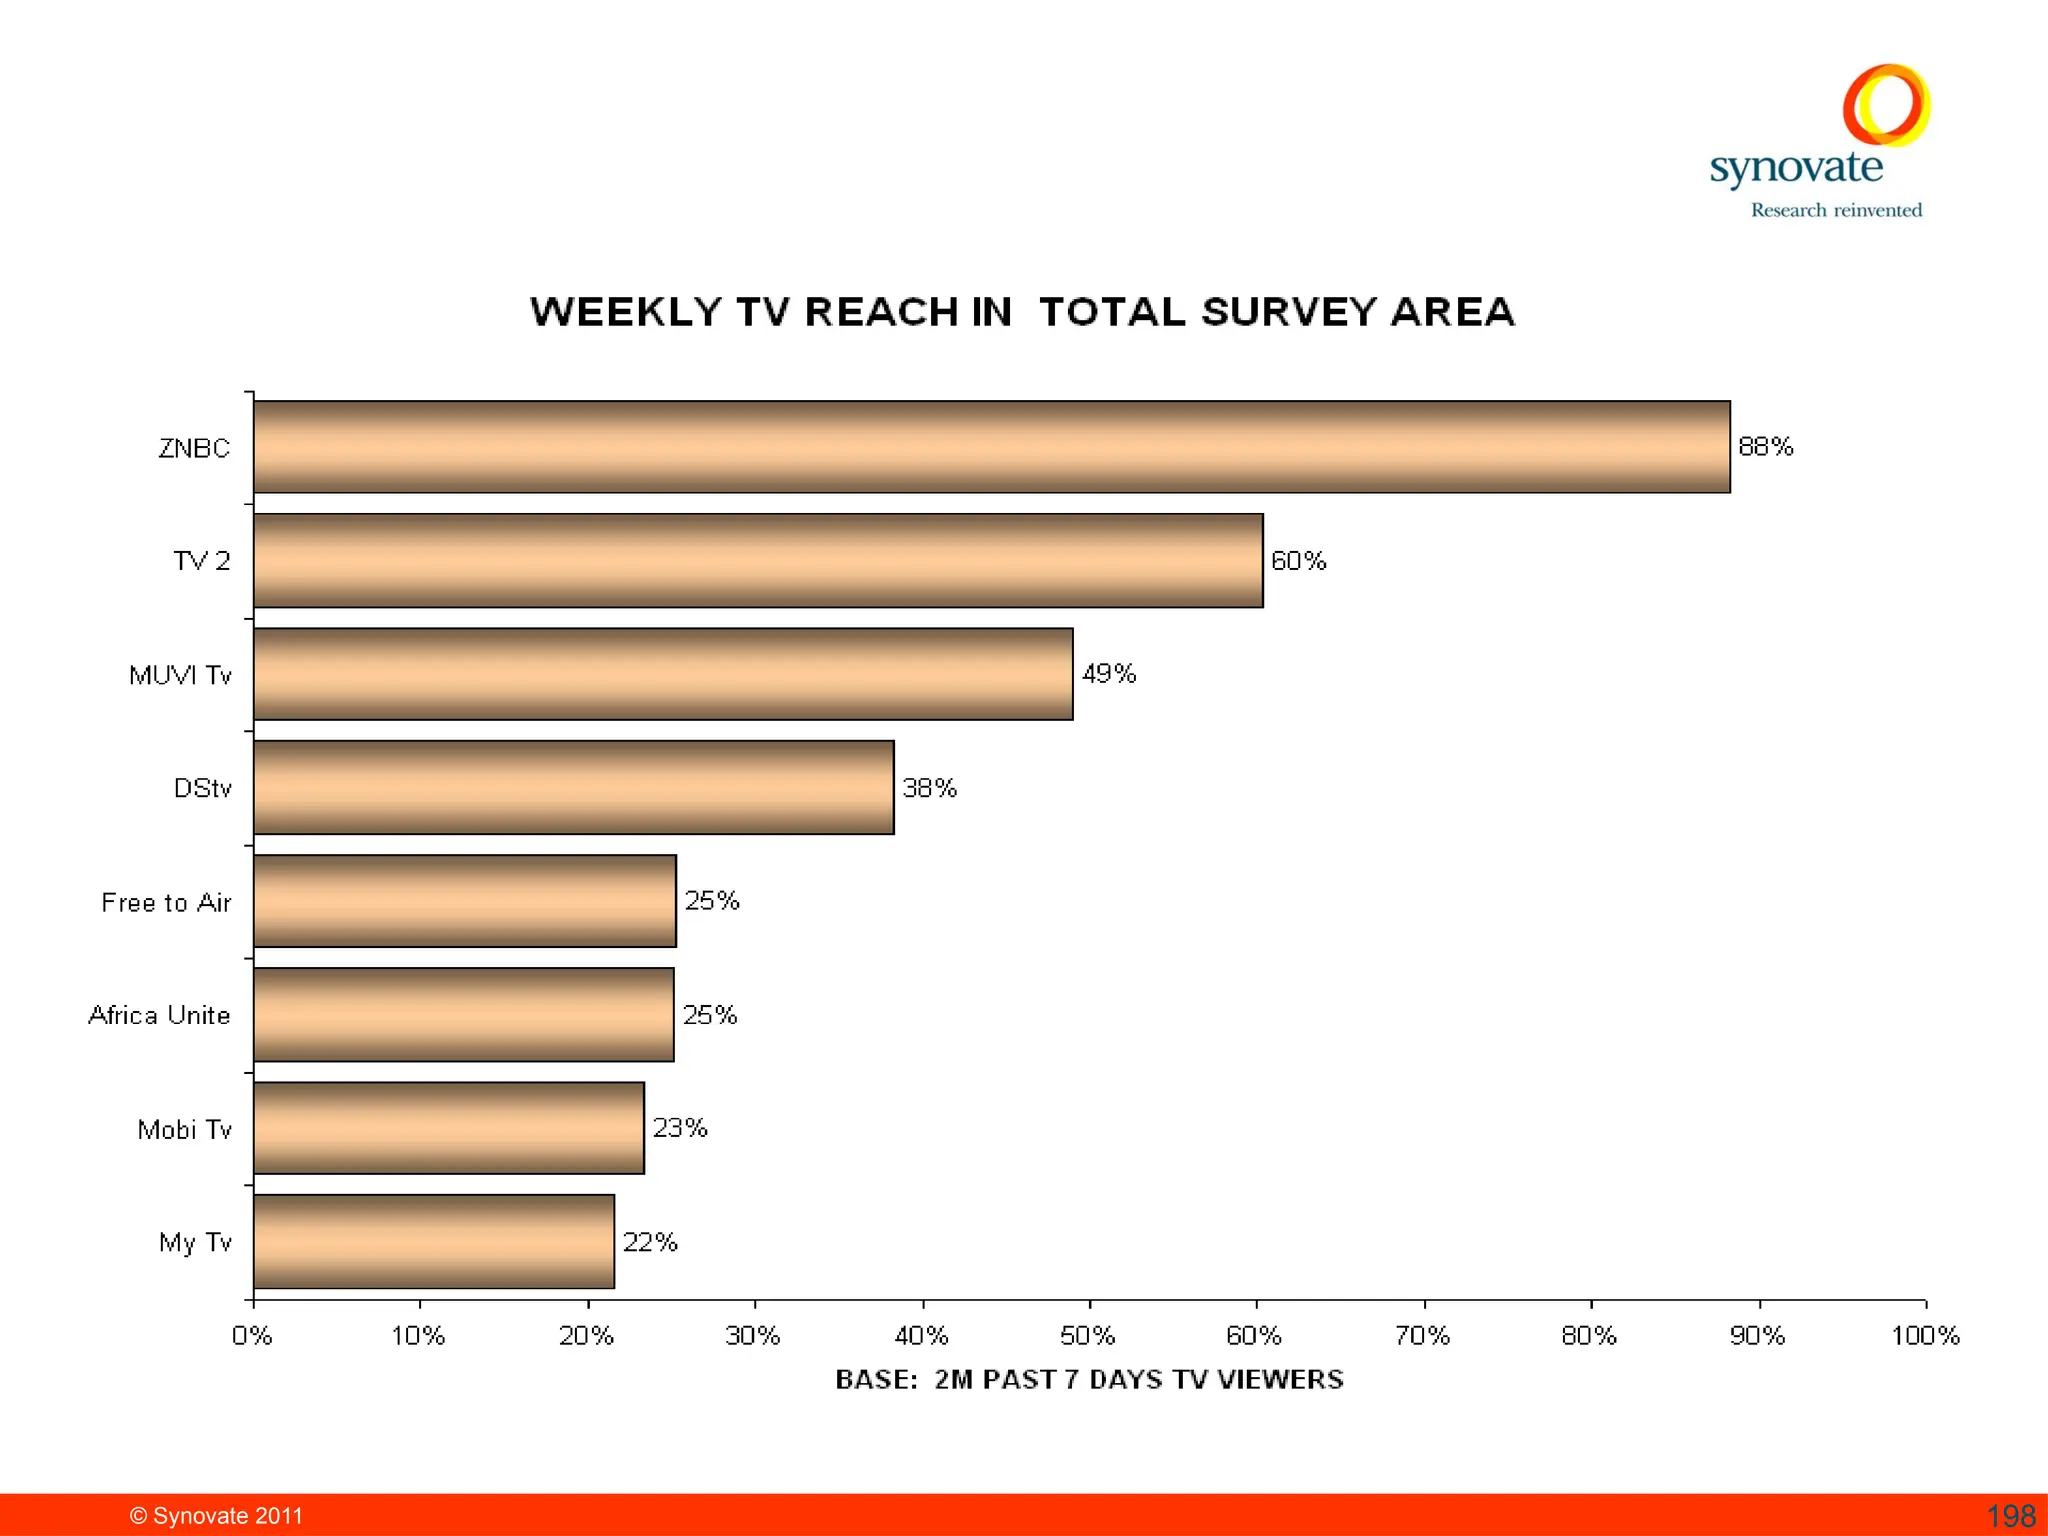
ZAMPS Final Report 09112011 -an analysis report featuring various radio stations in Zambia,in 2011
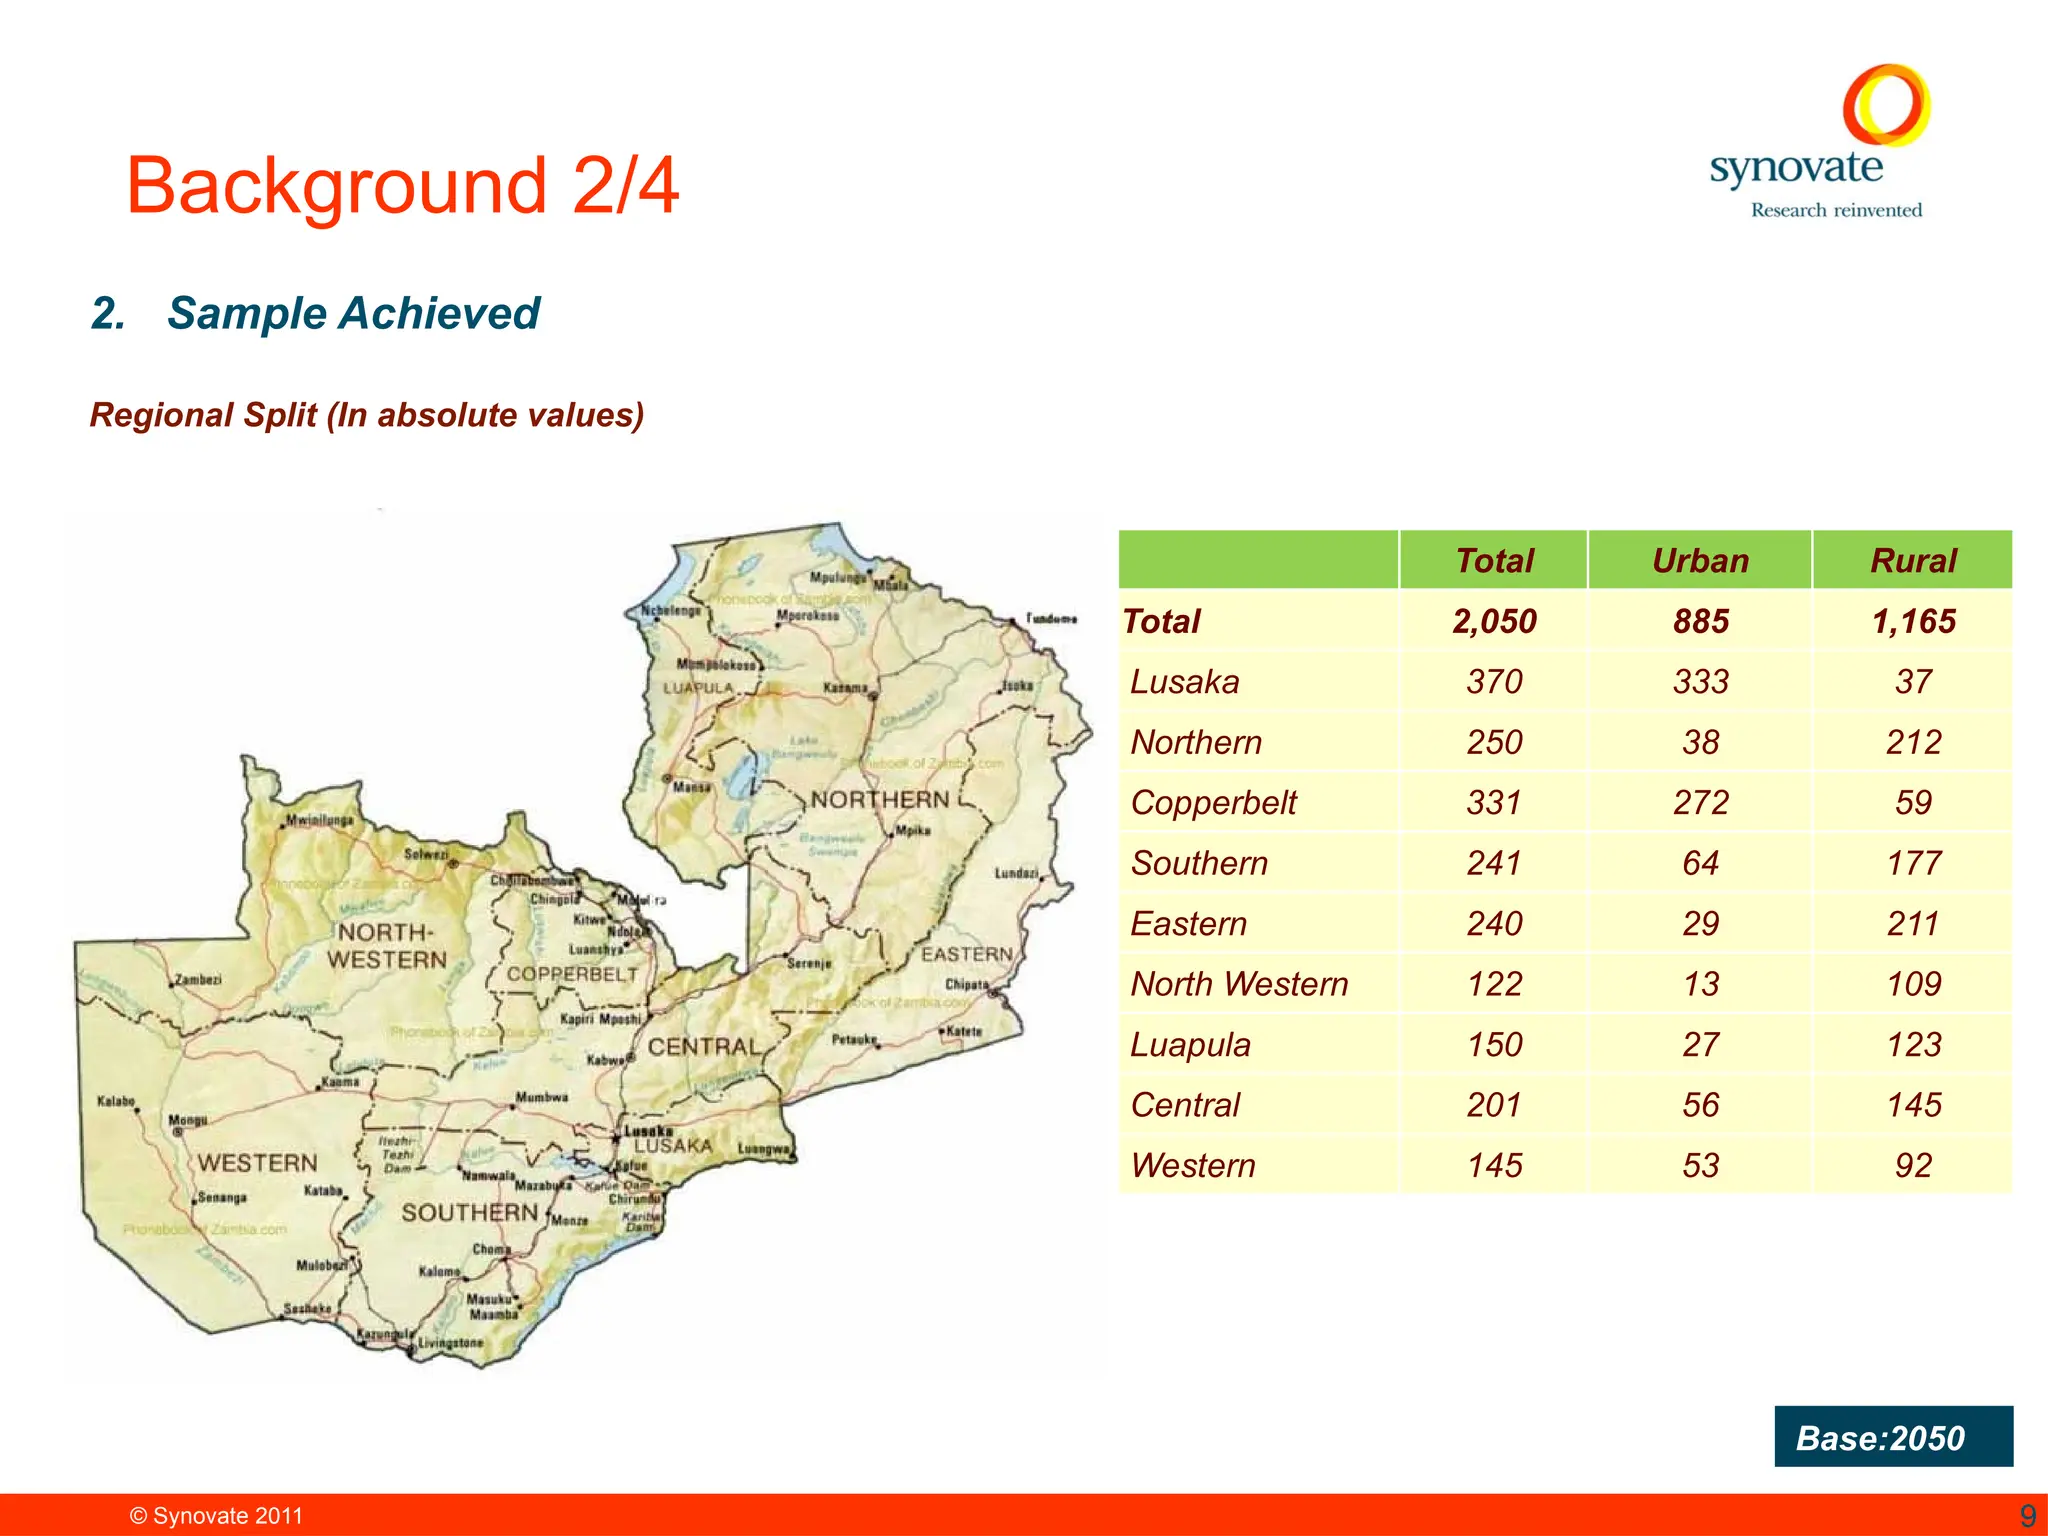
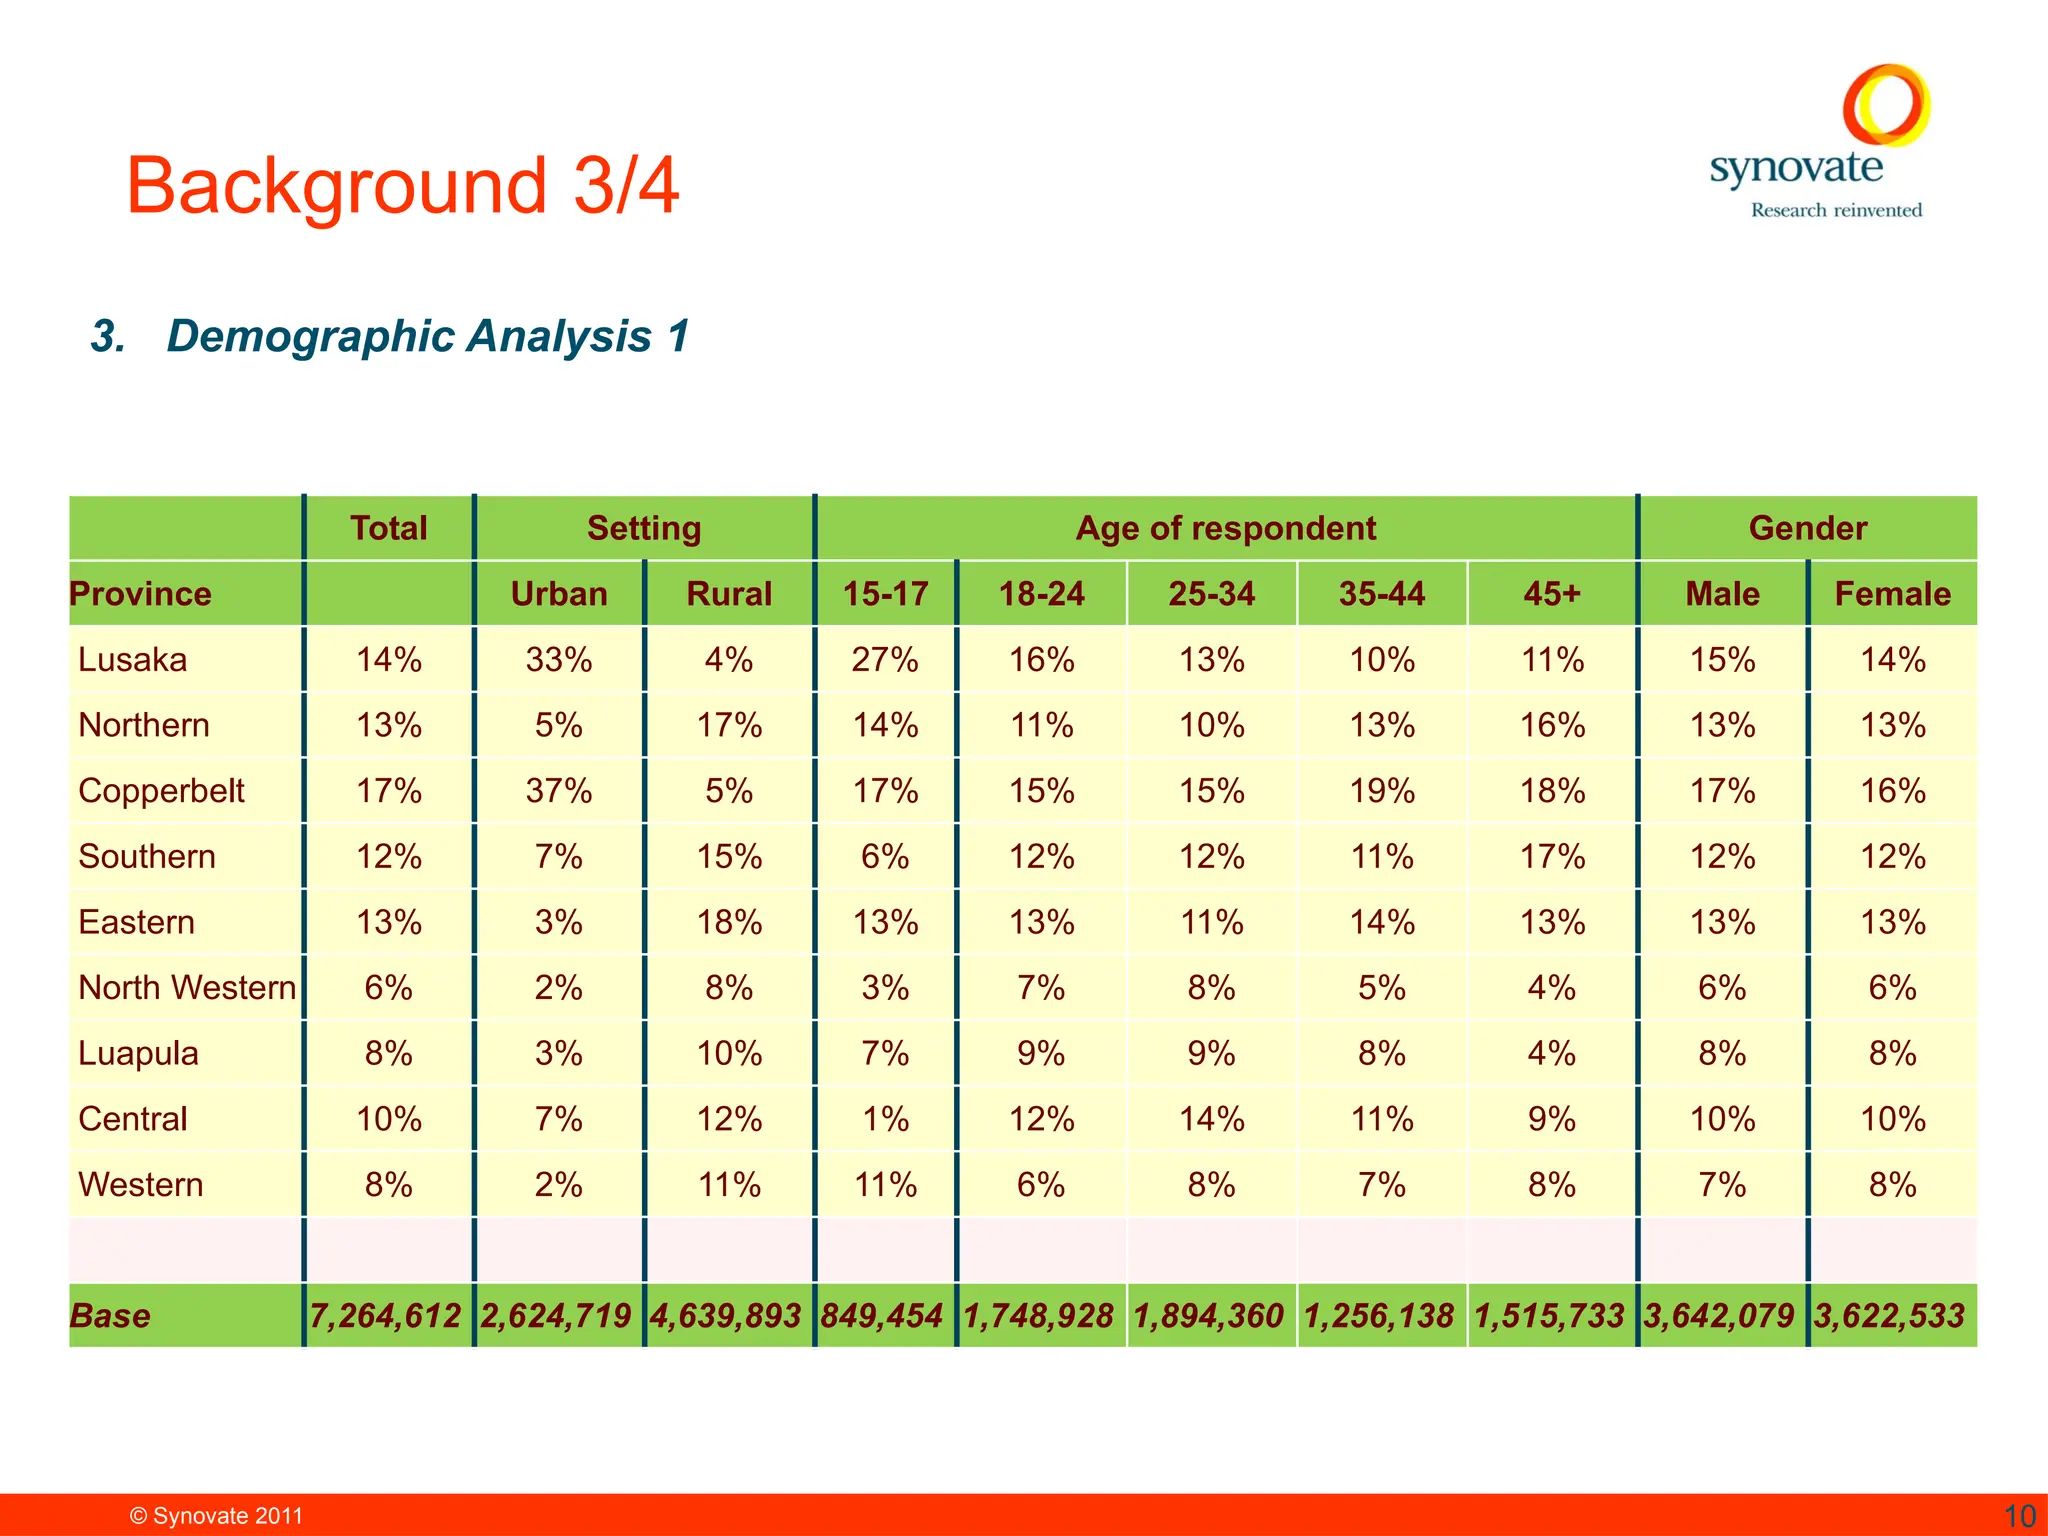
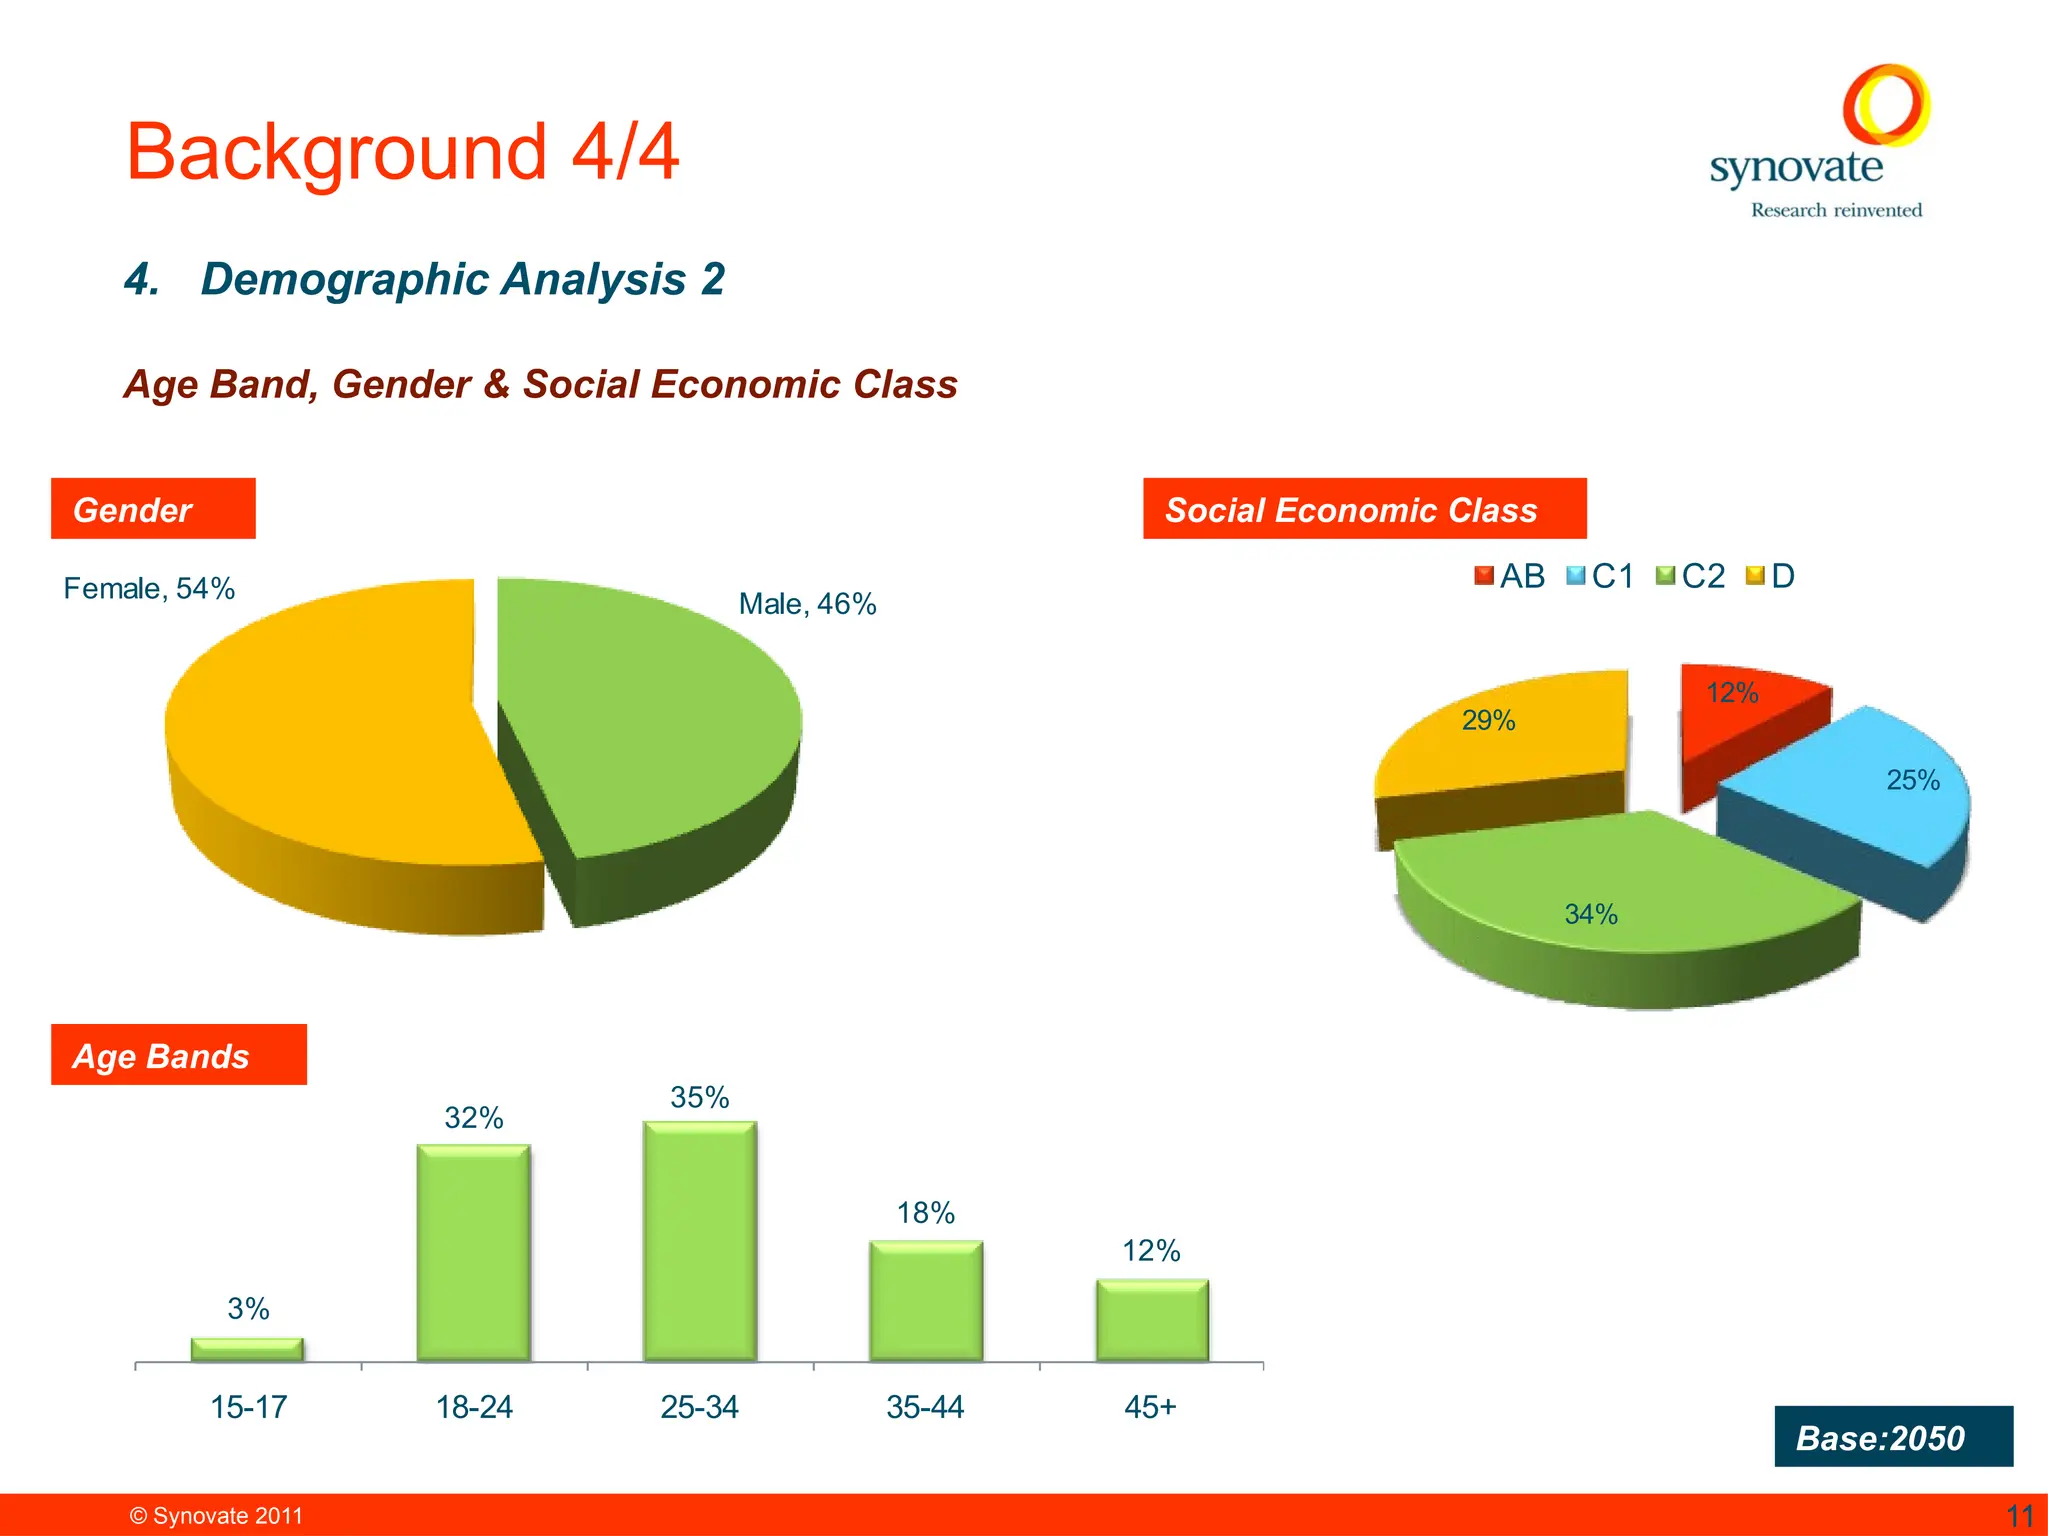
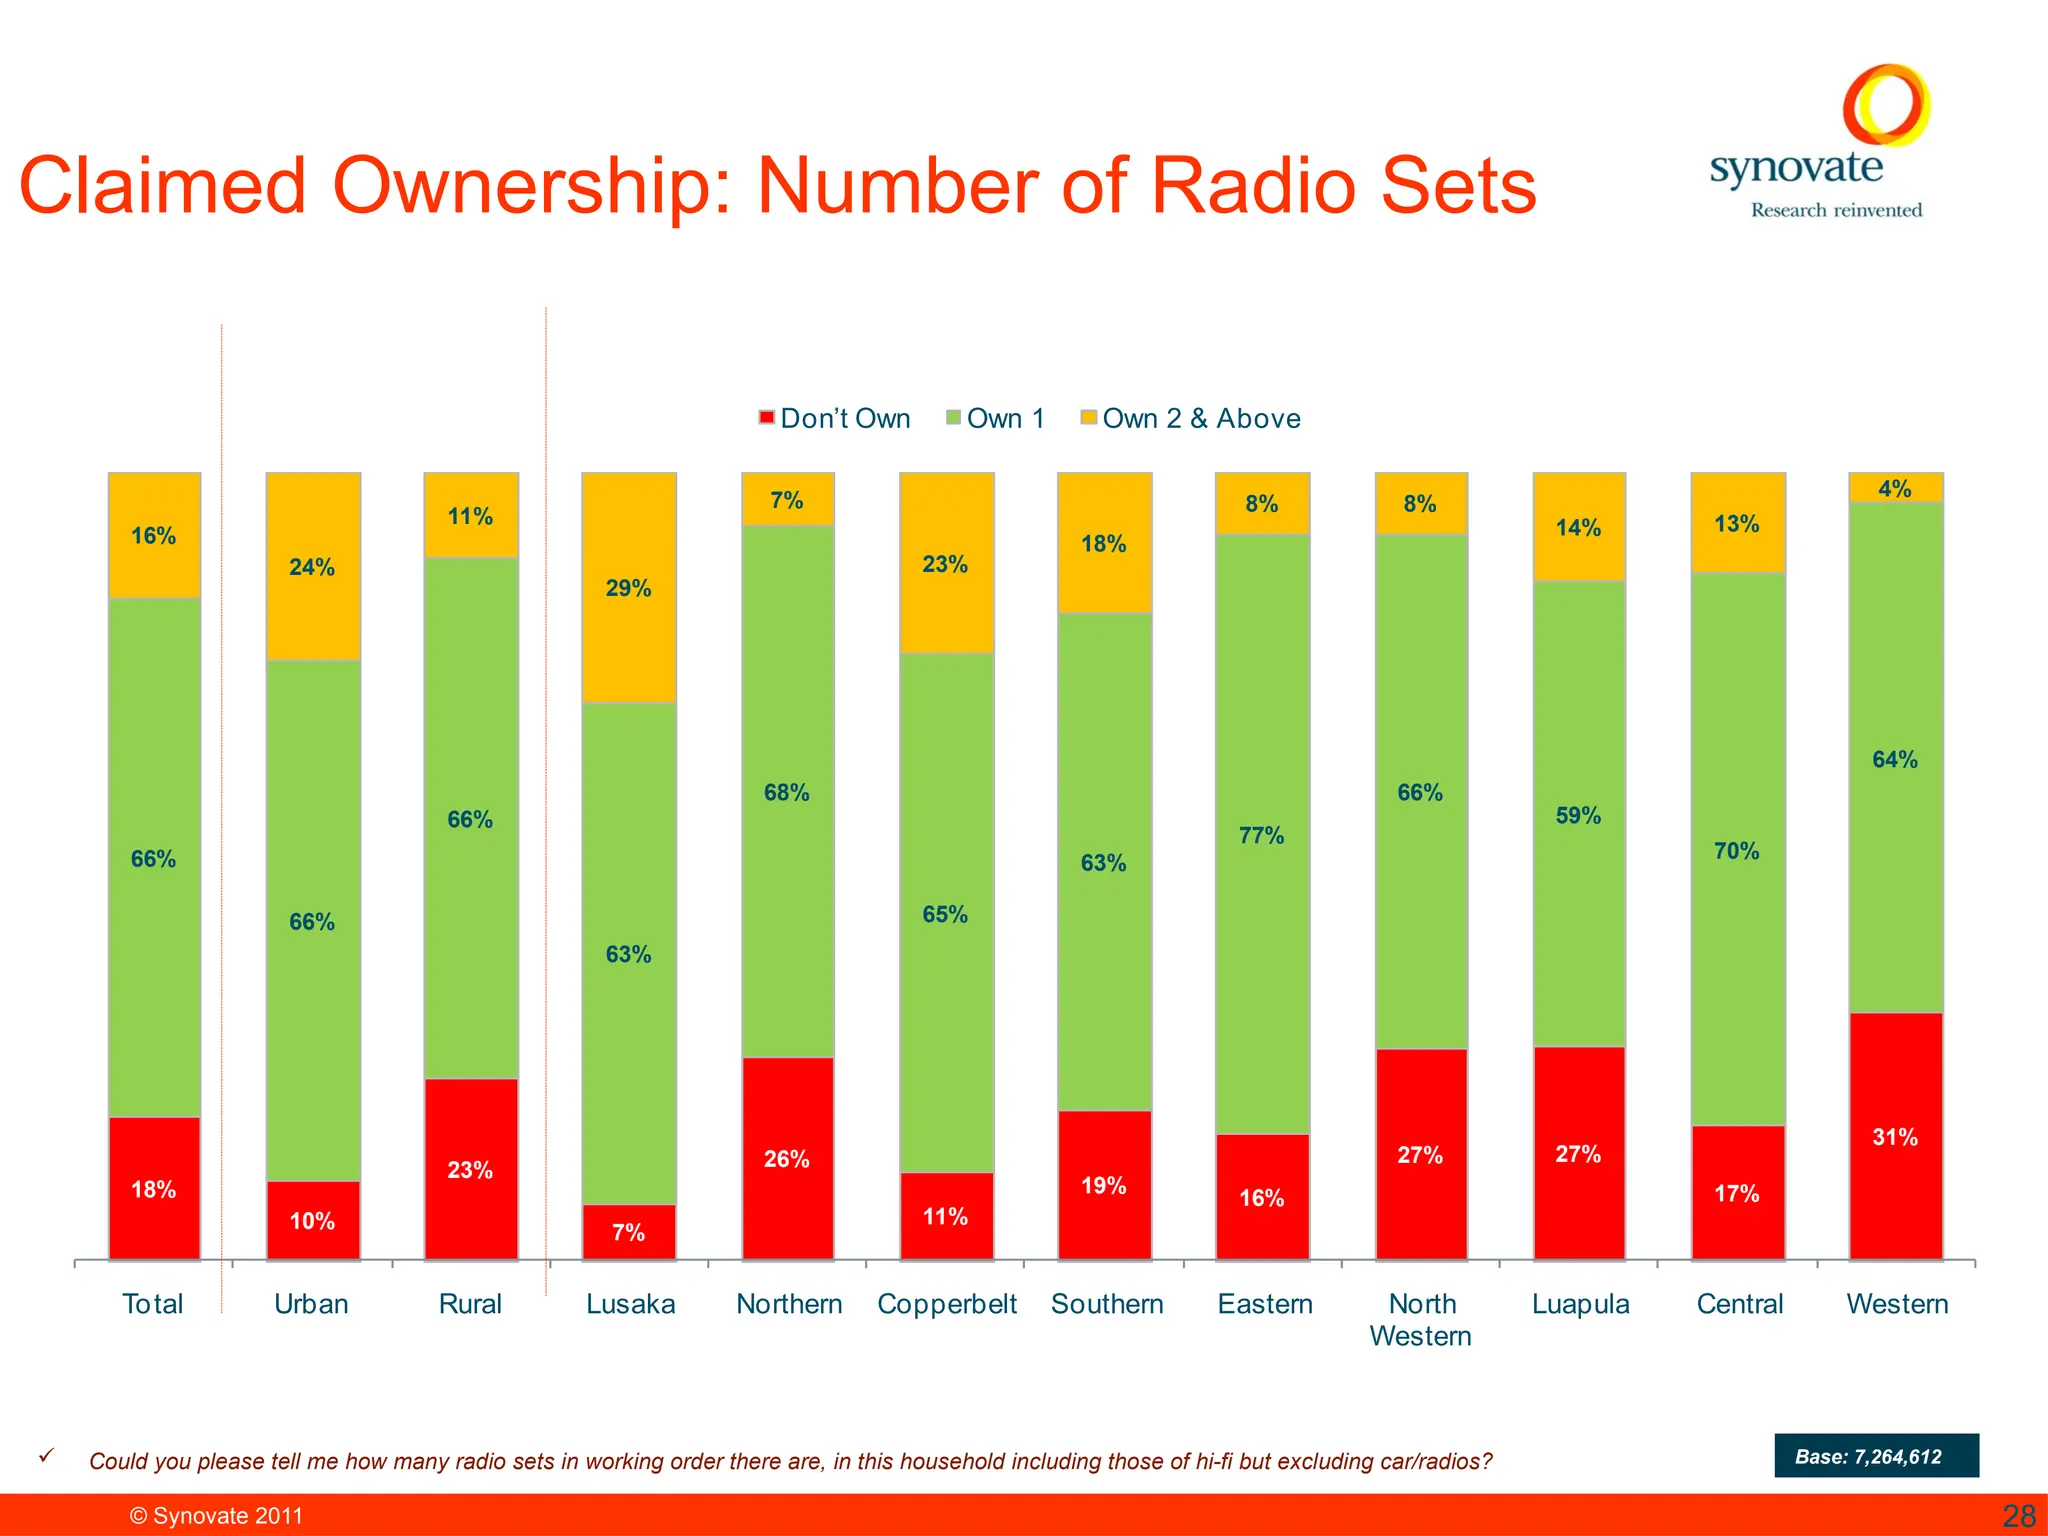
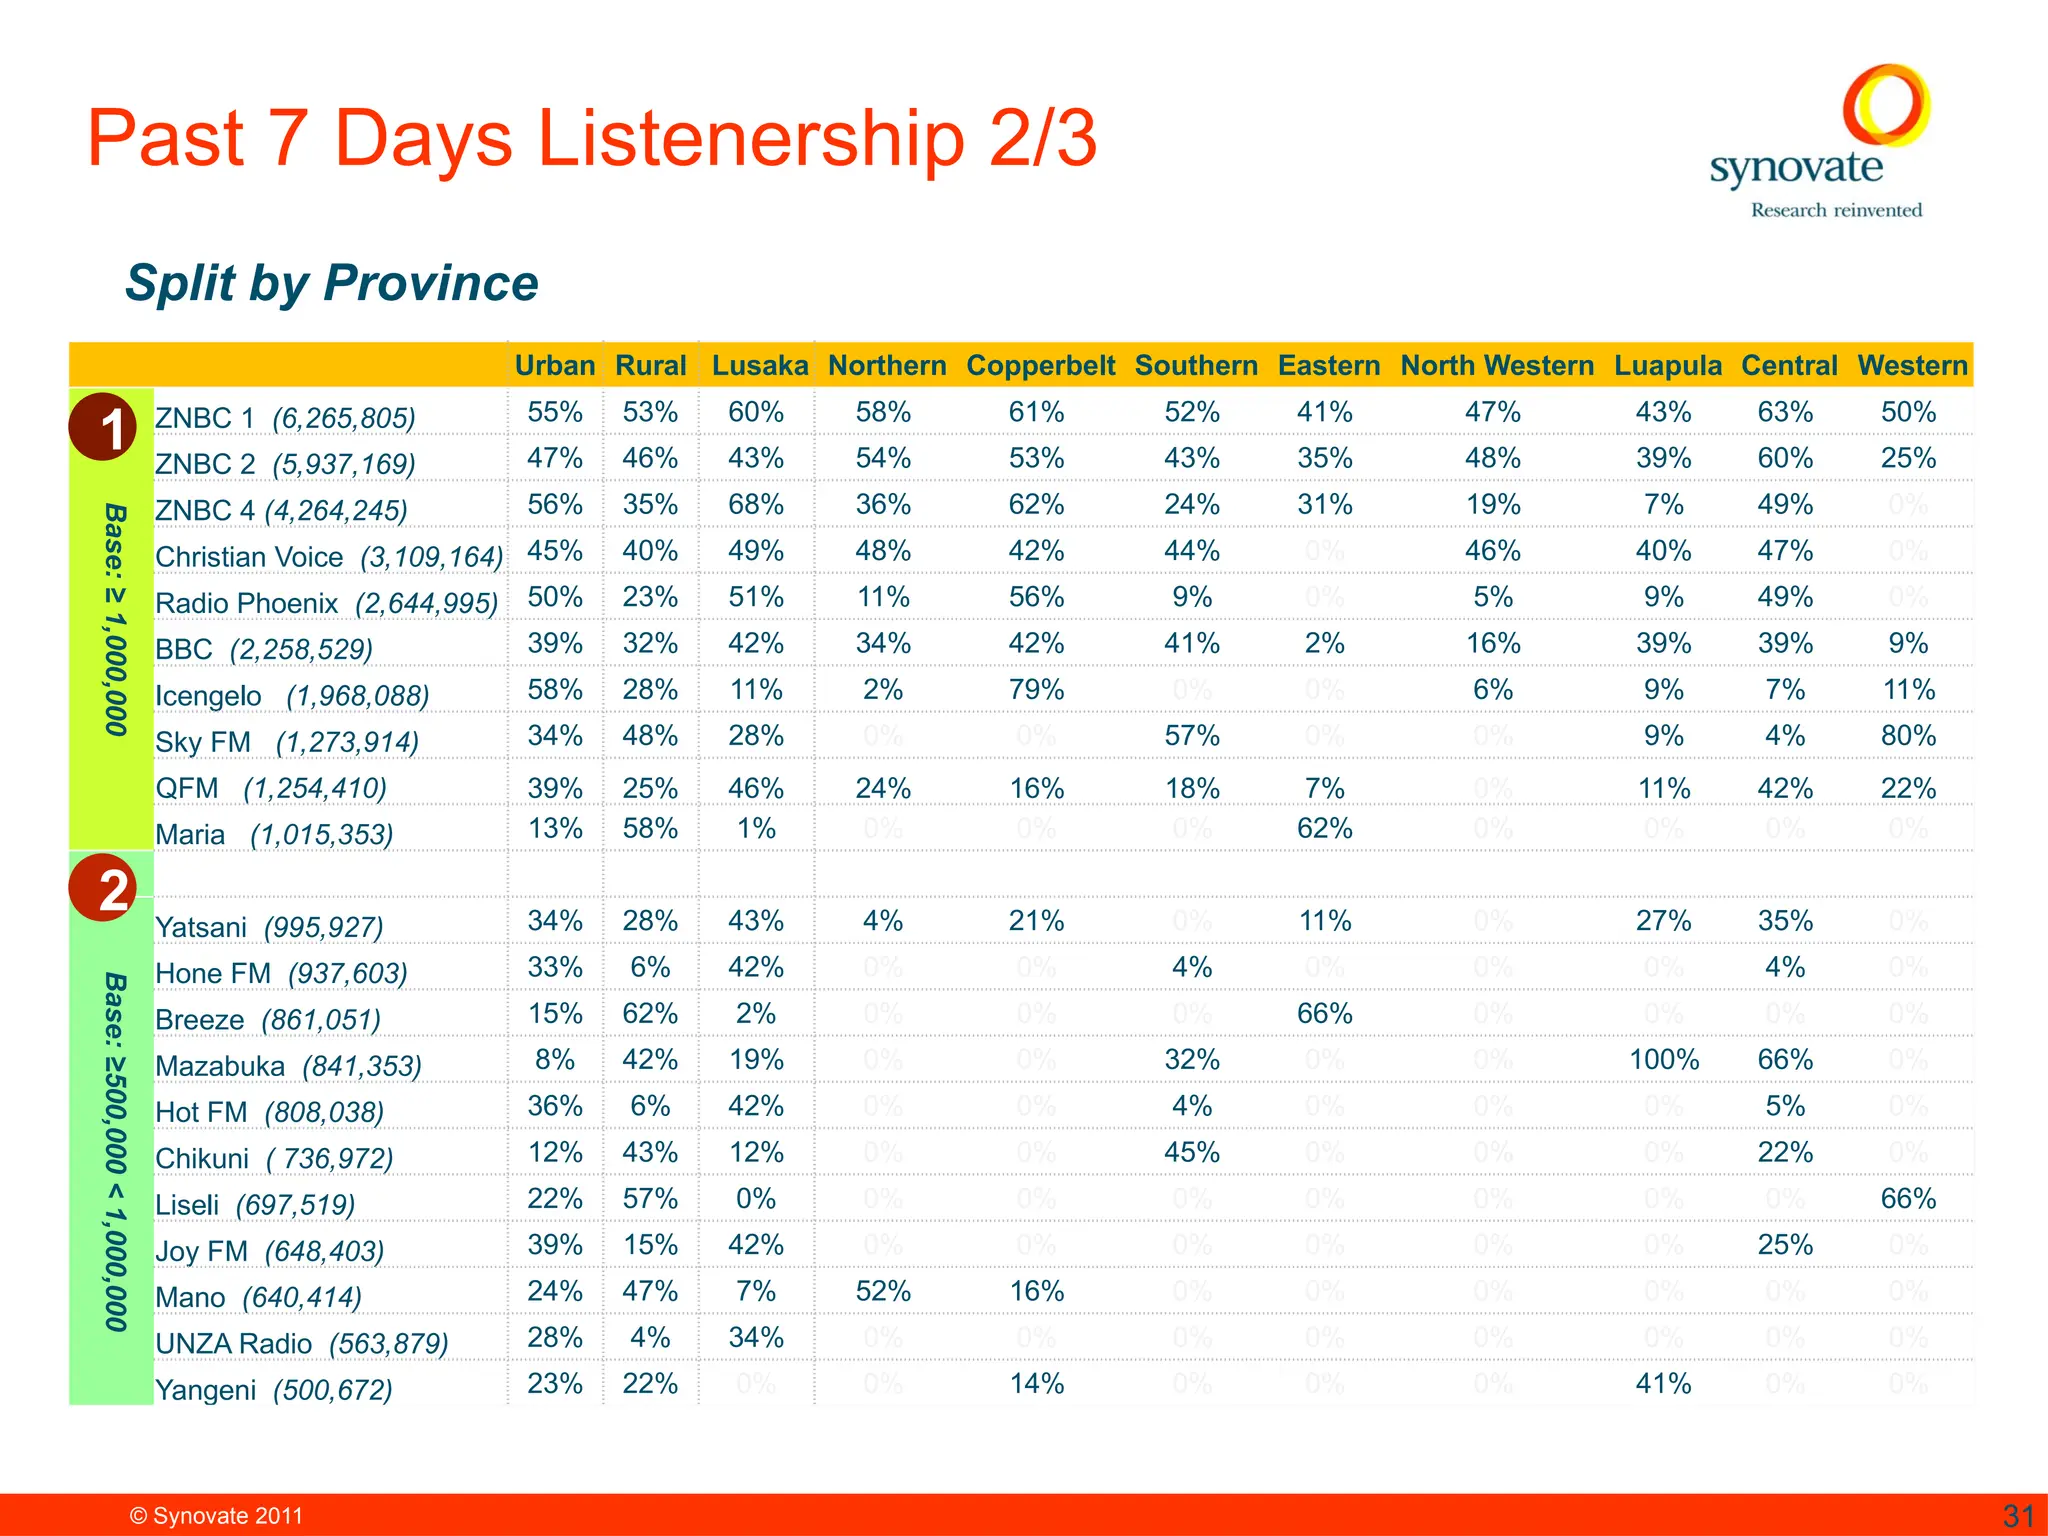
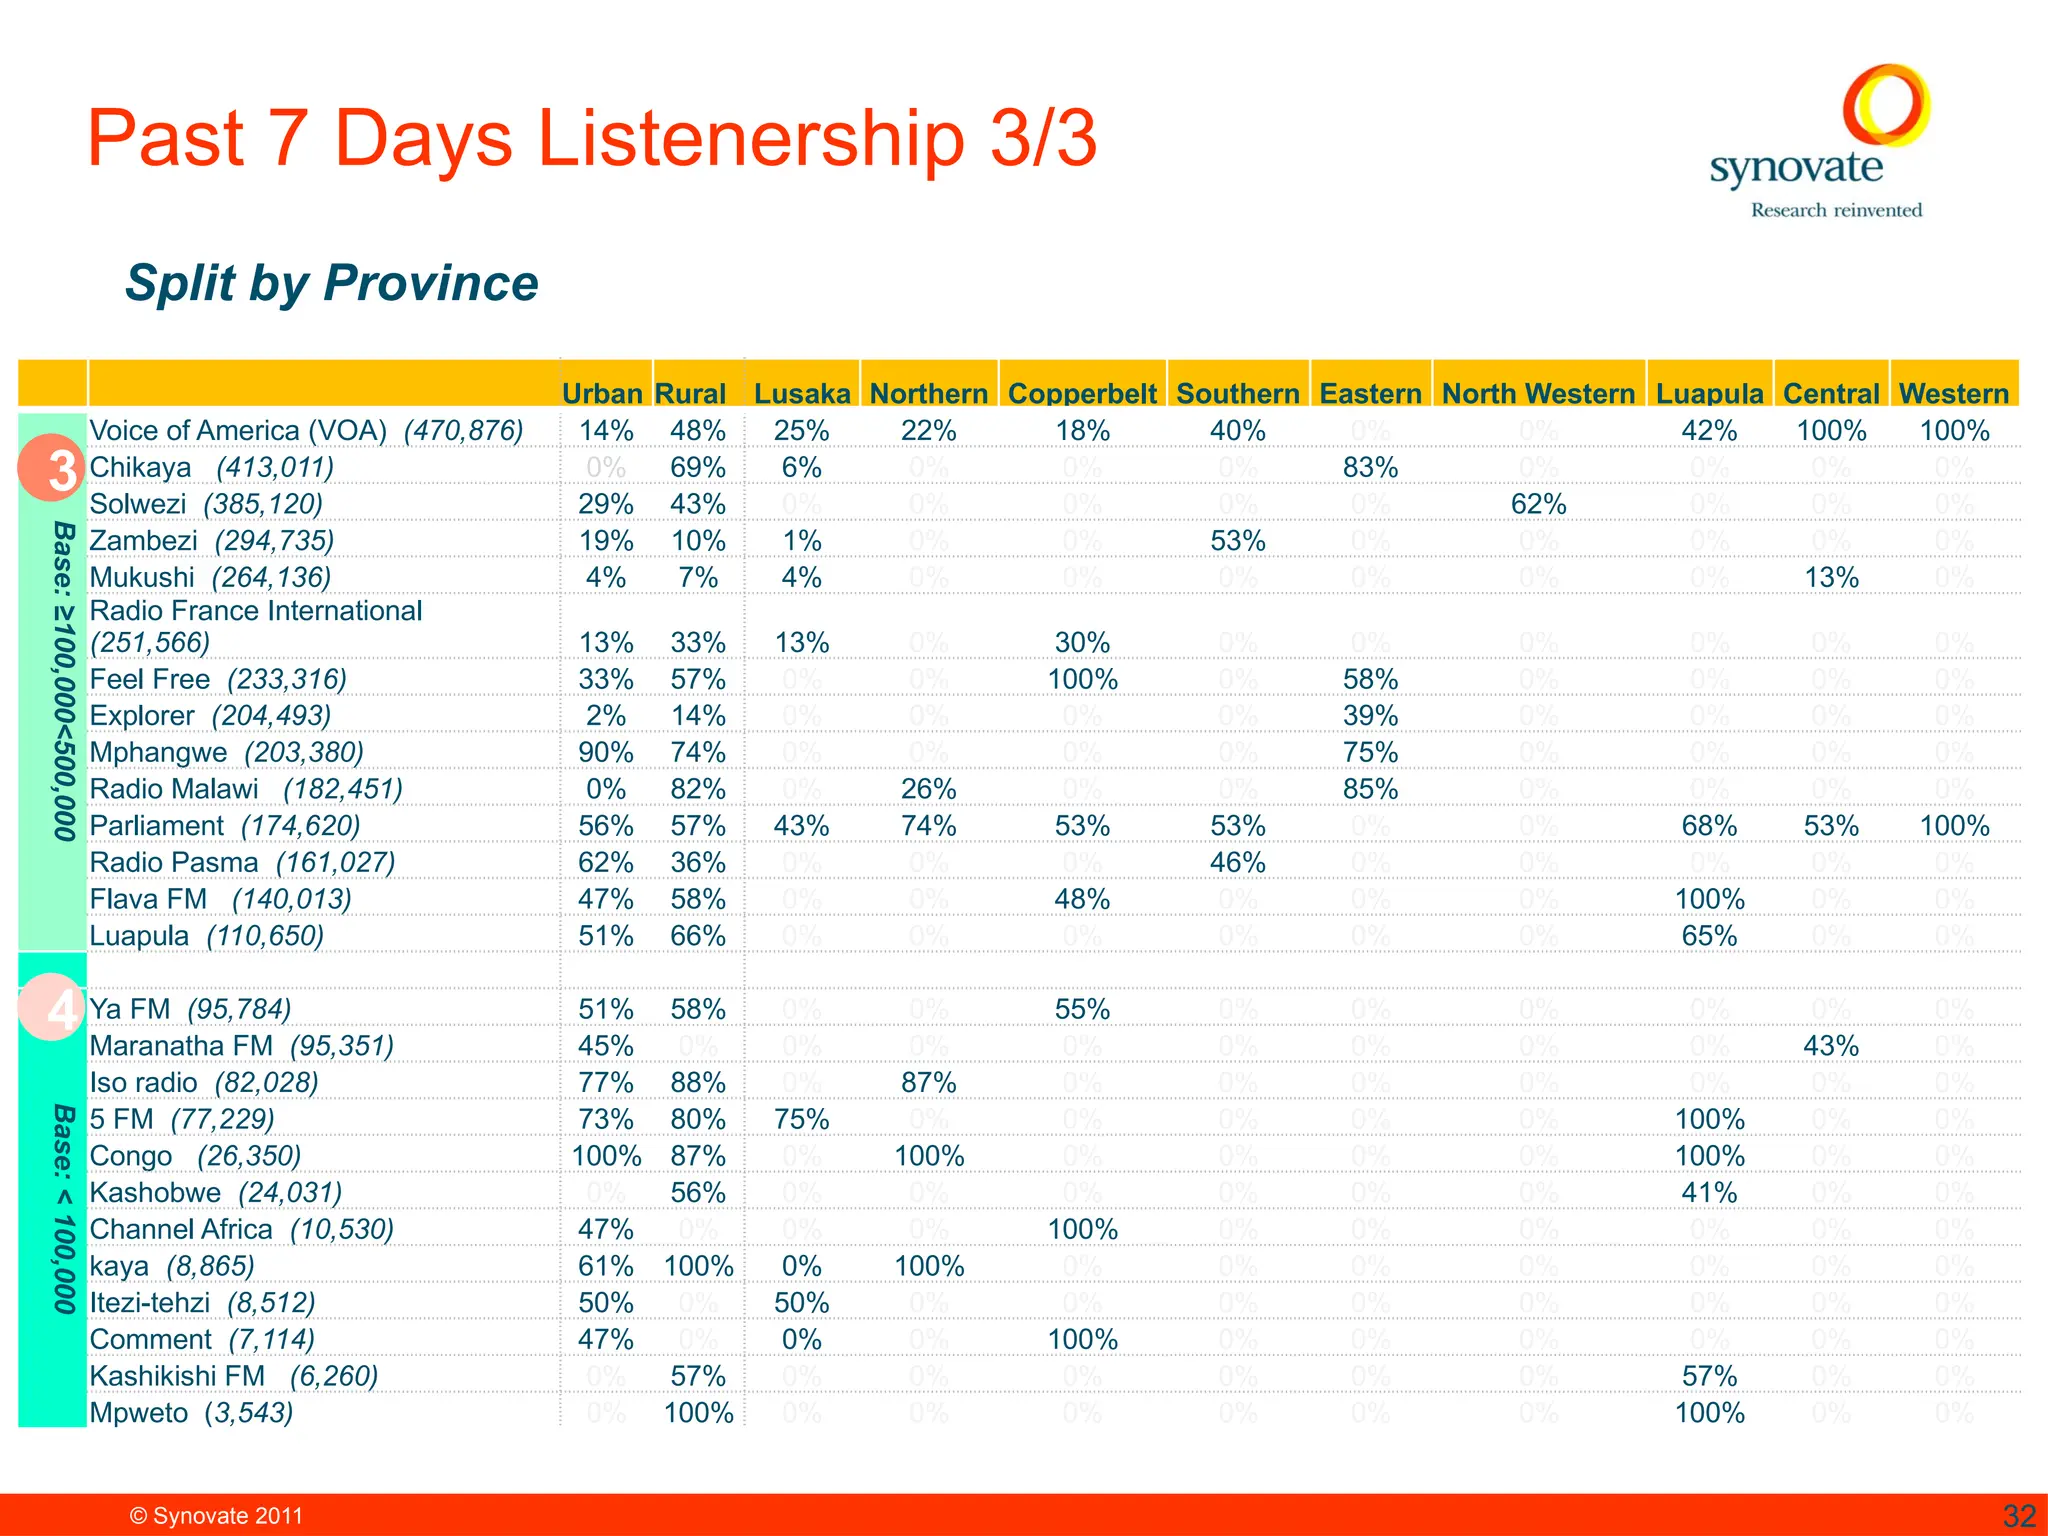
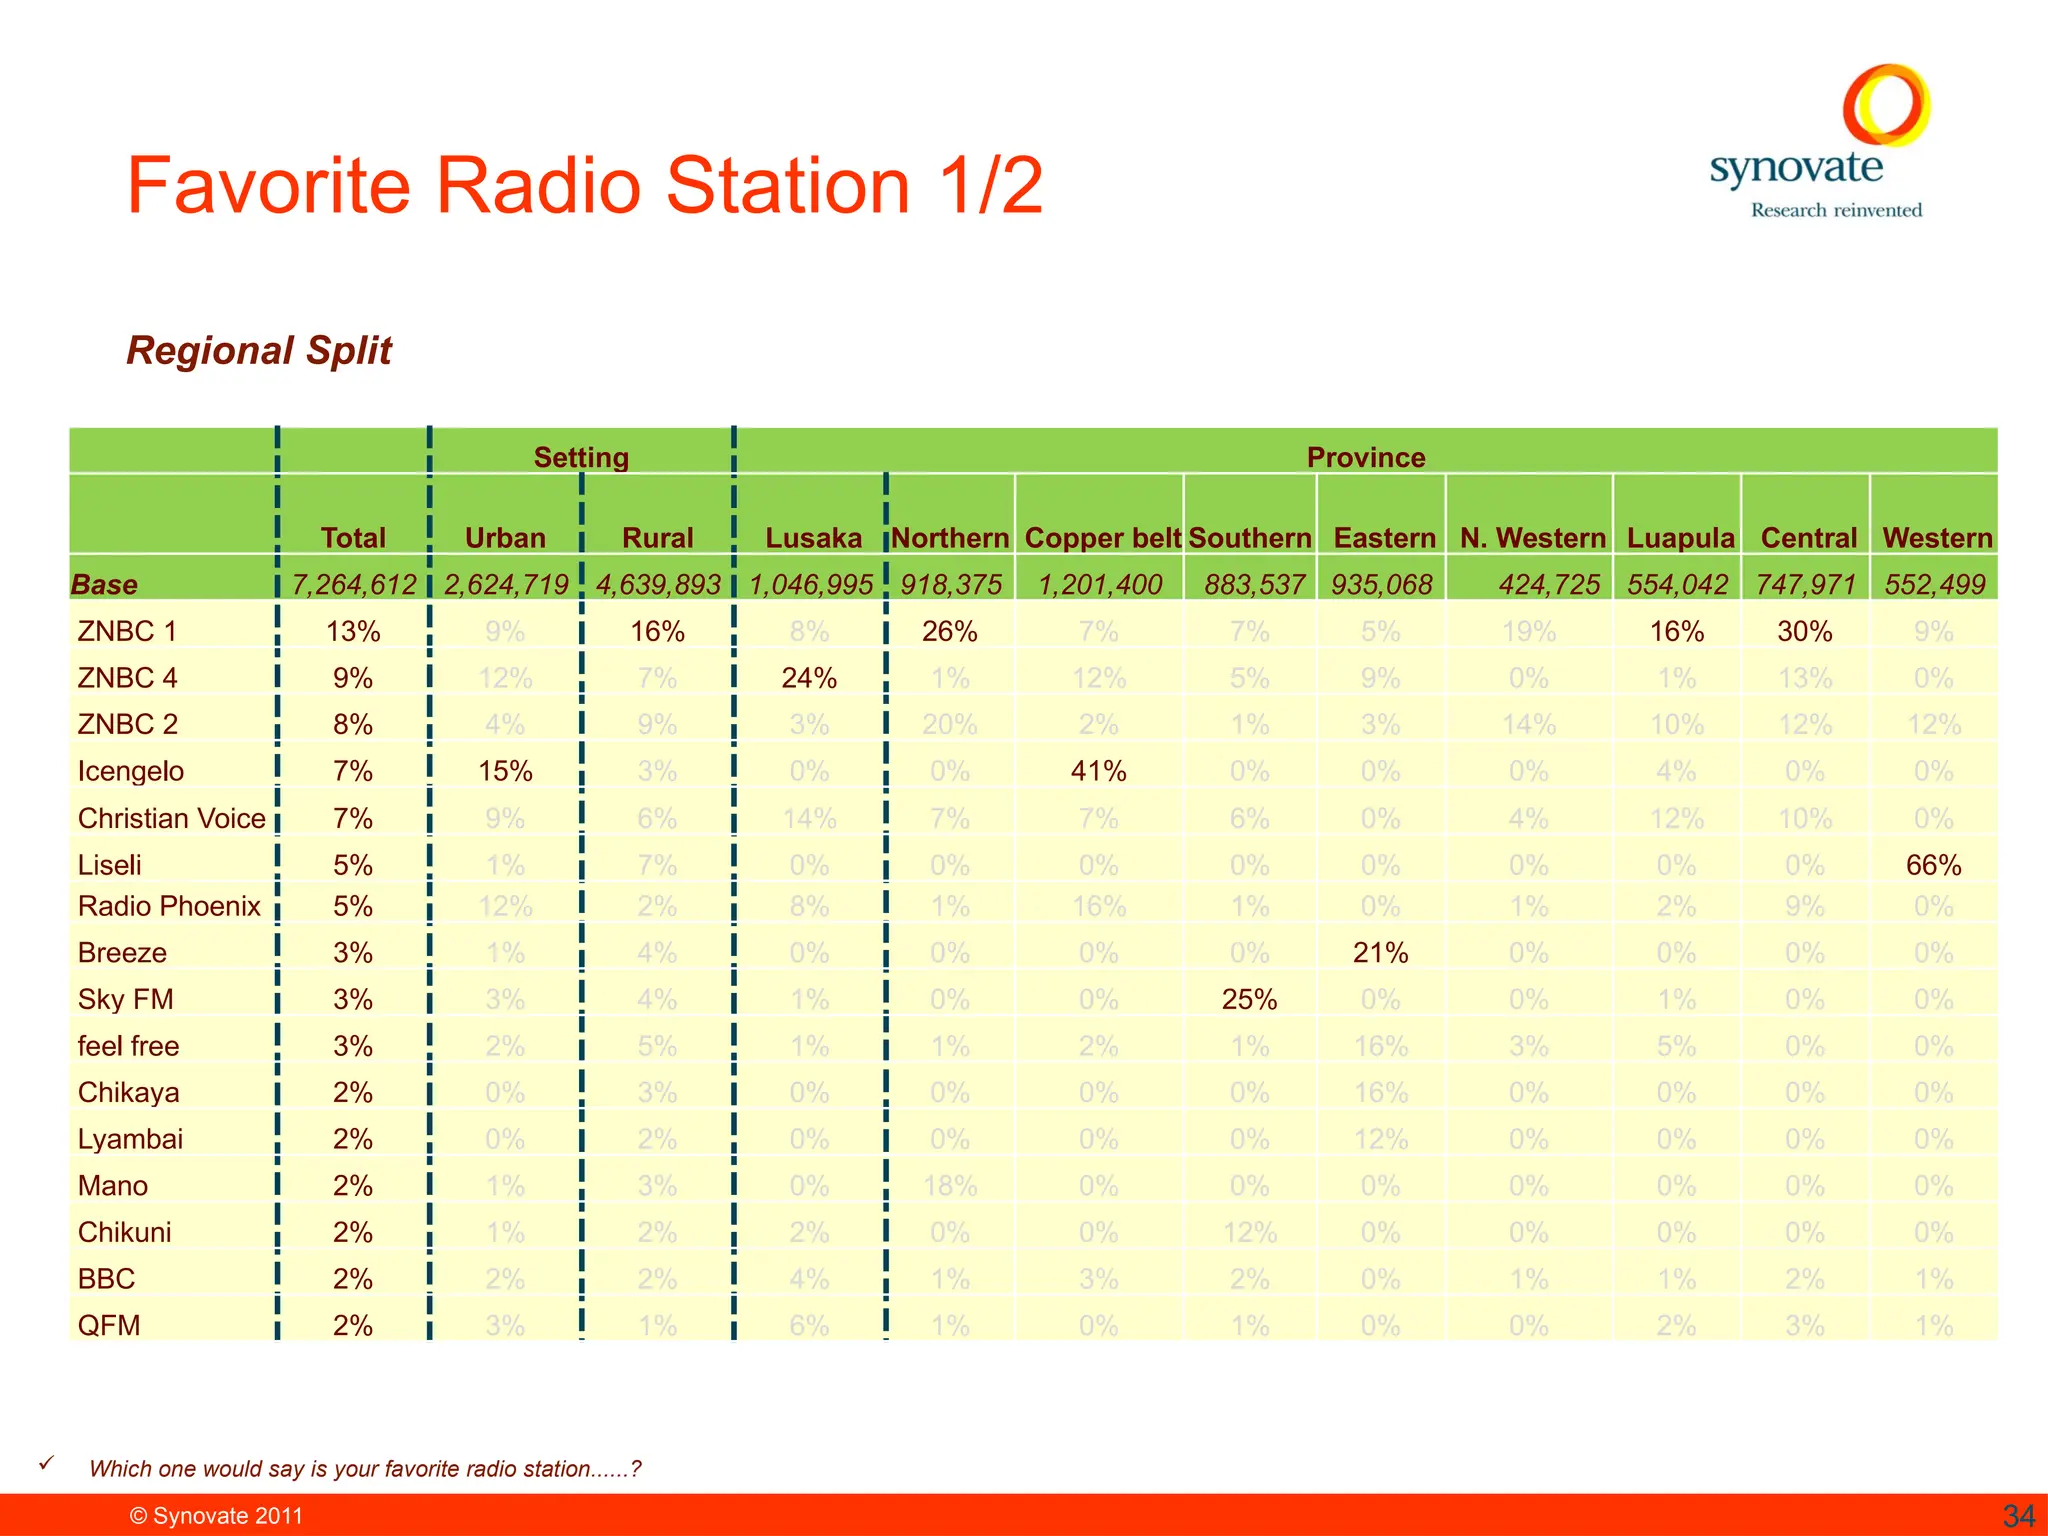
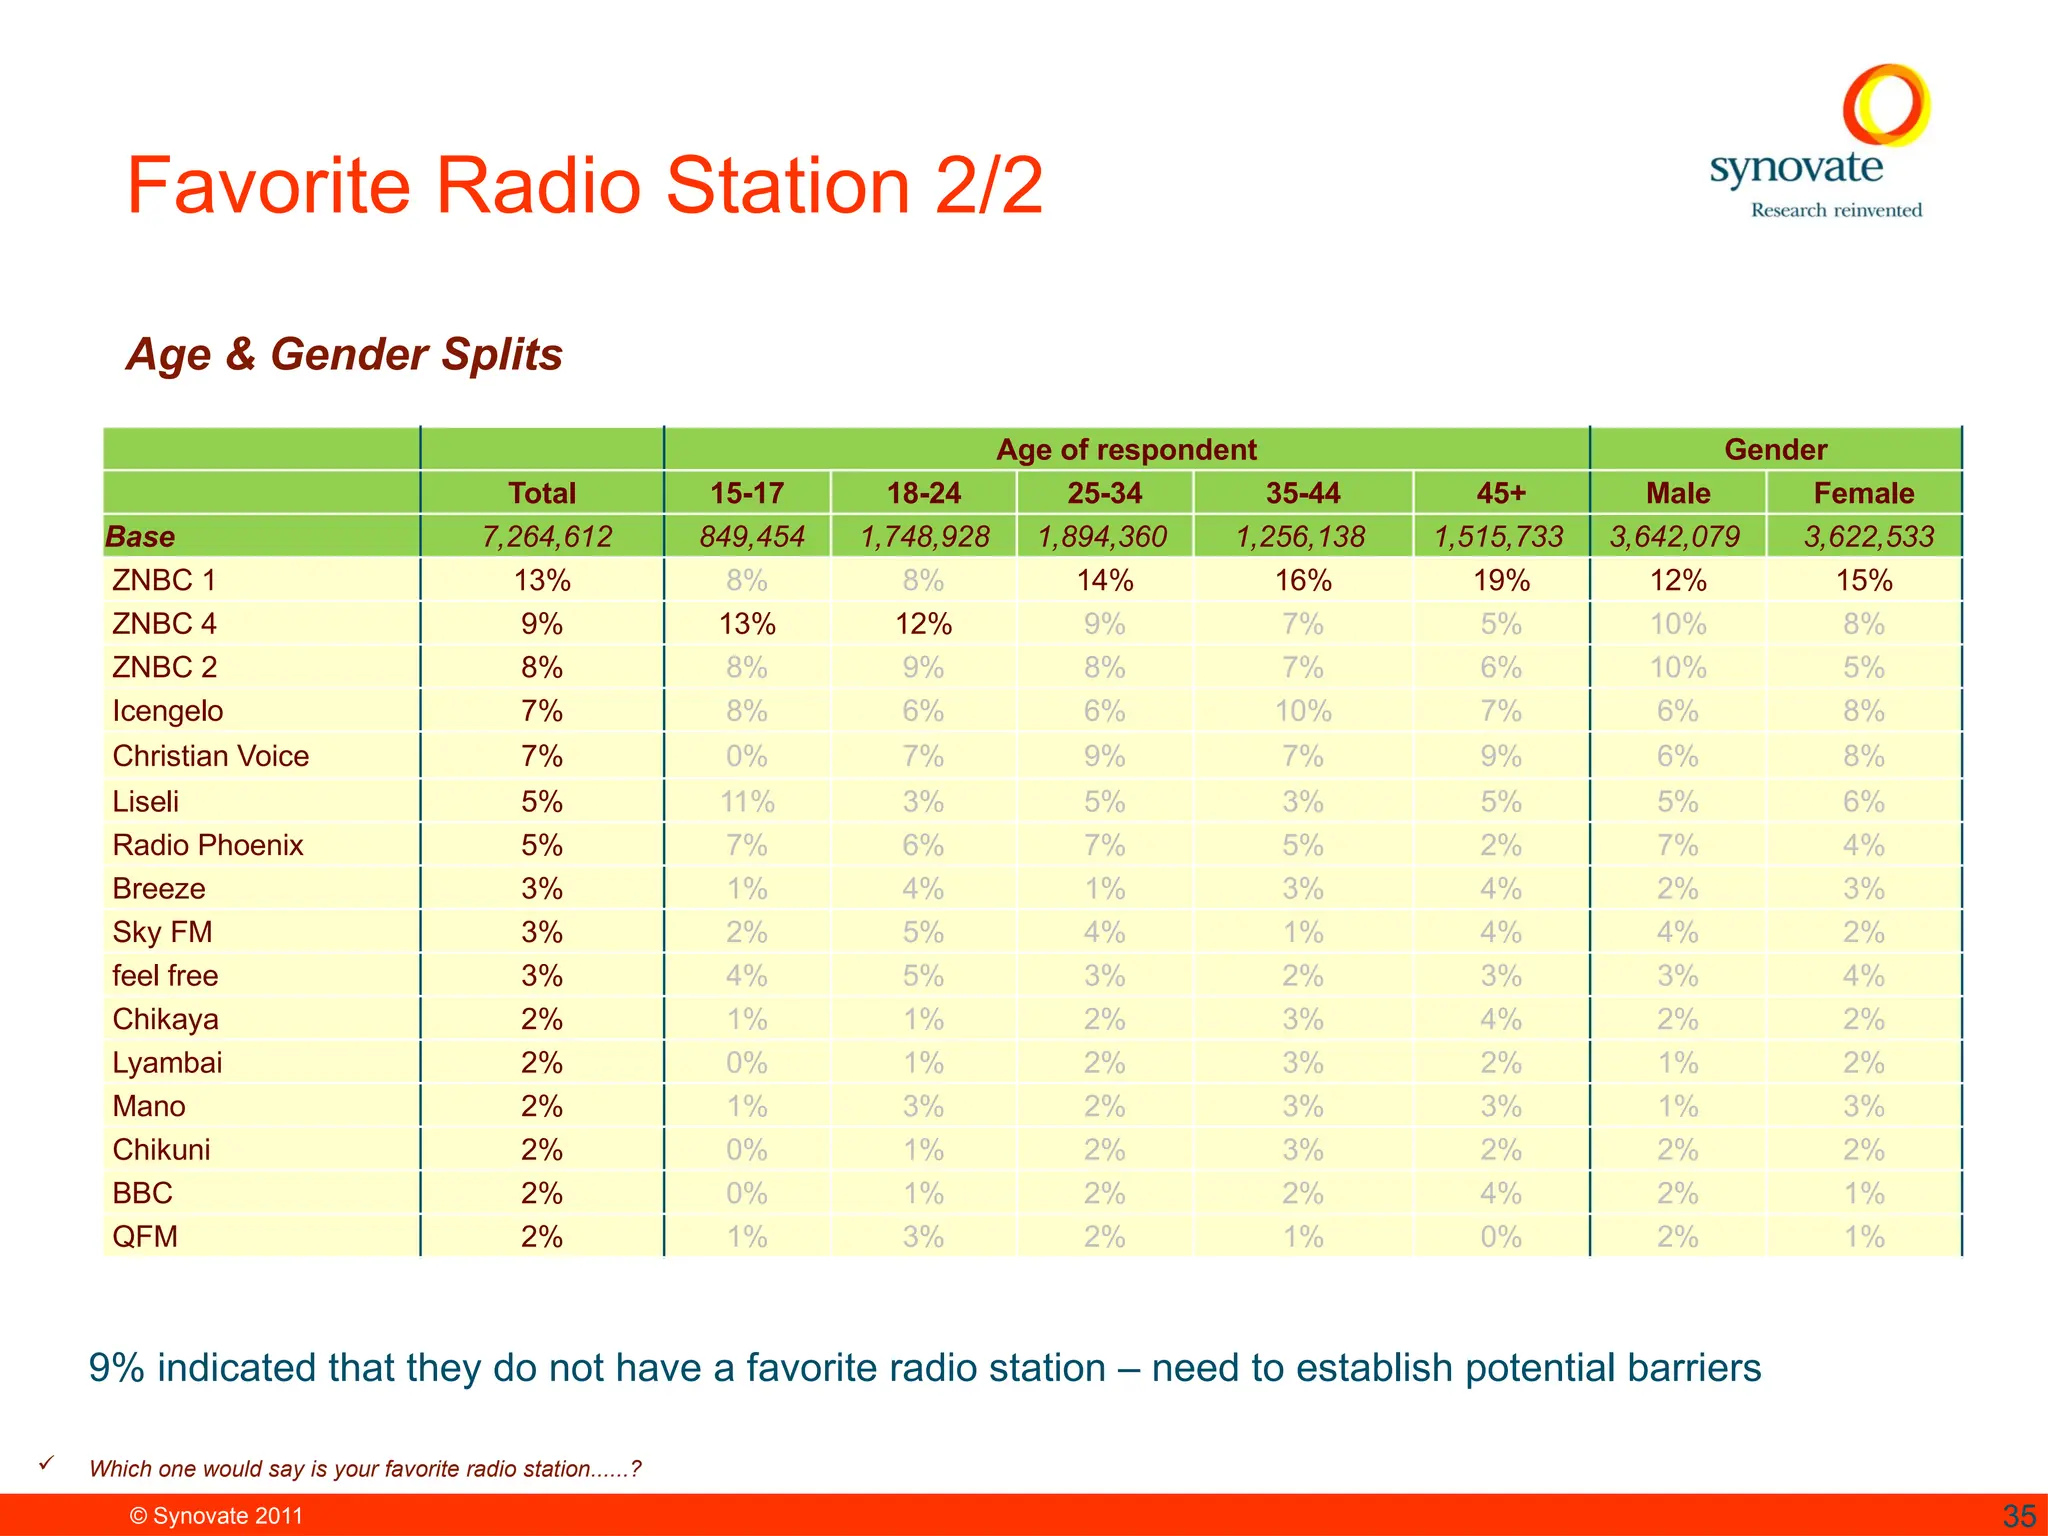
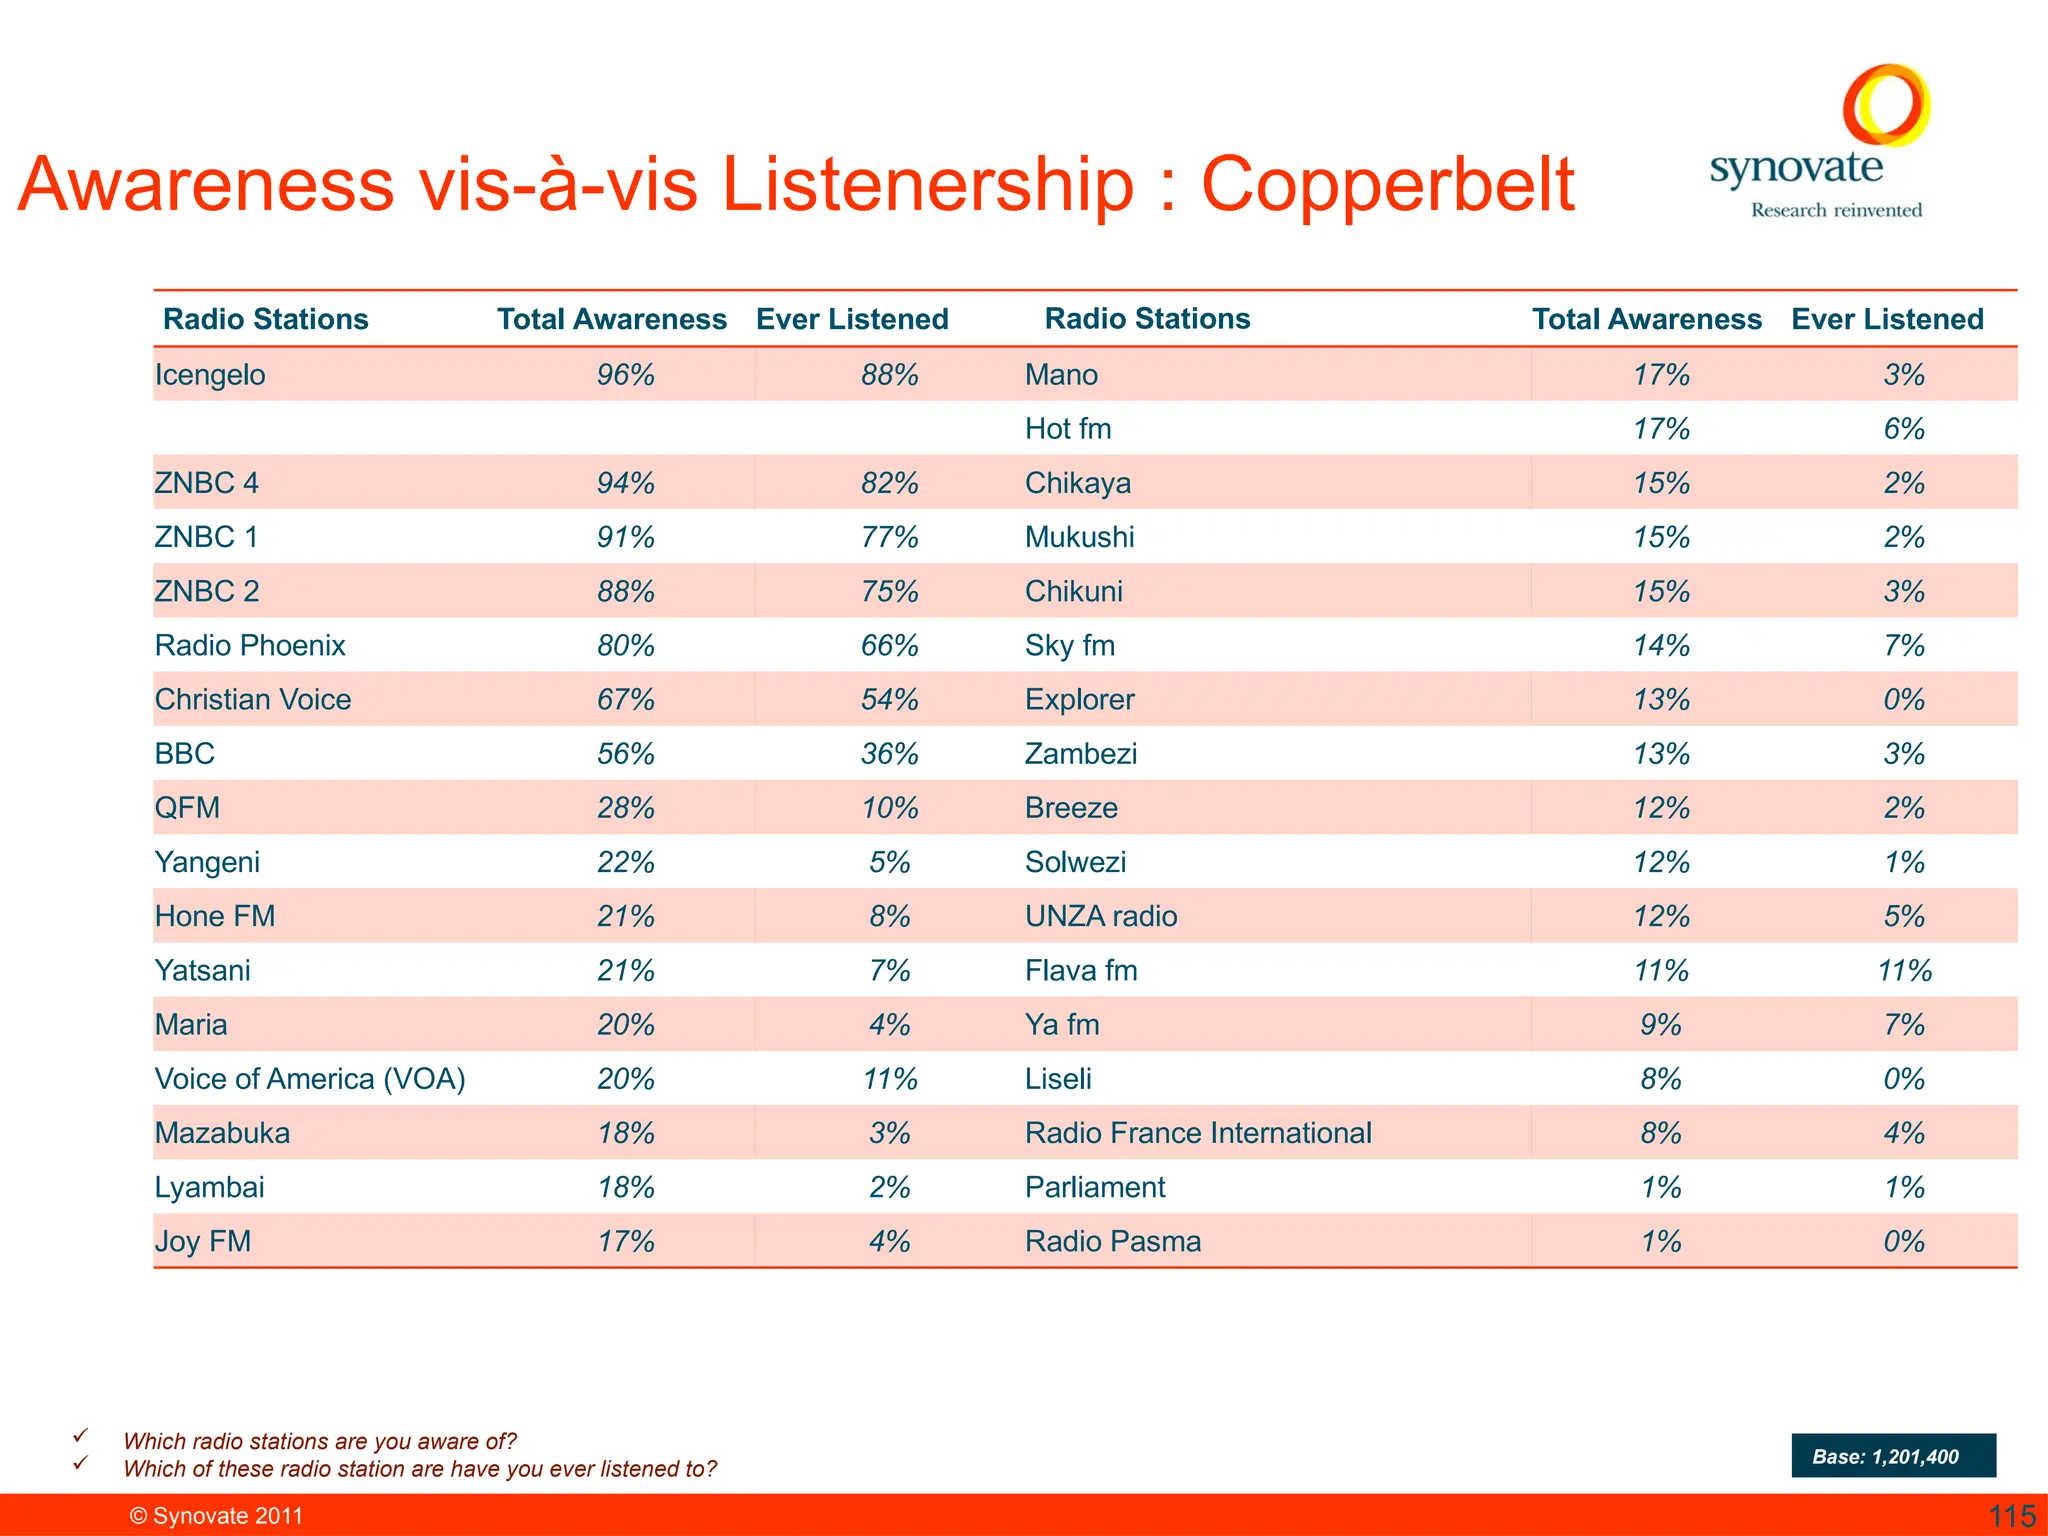
Analysis of a report featuring various radio stations in Zambia ,across all 10 provinces.
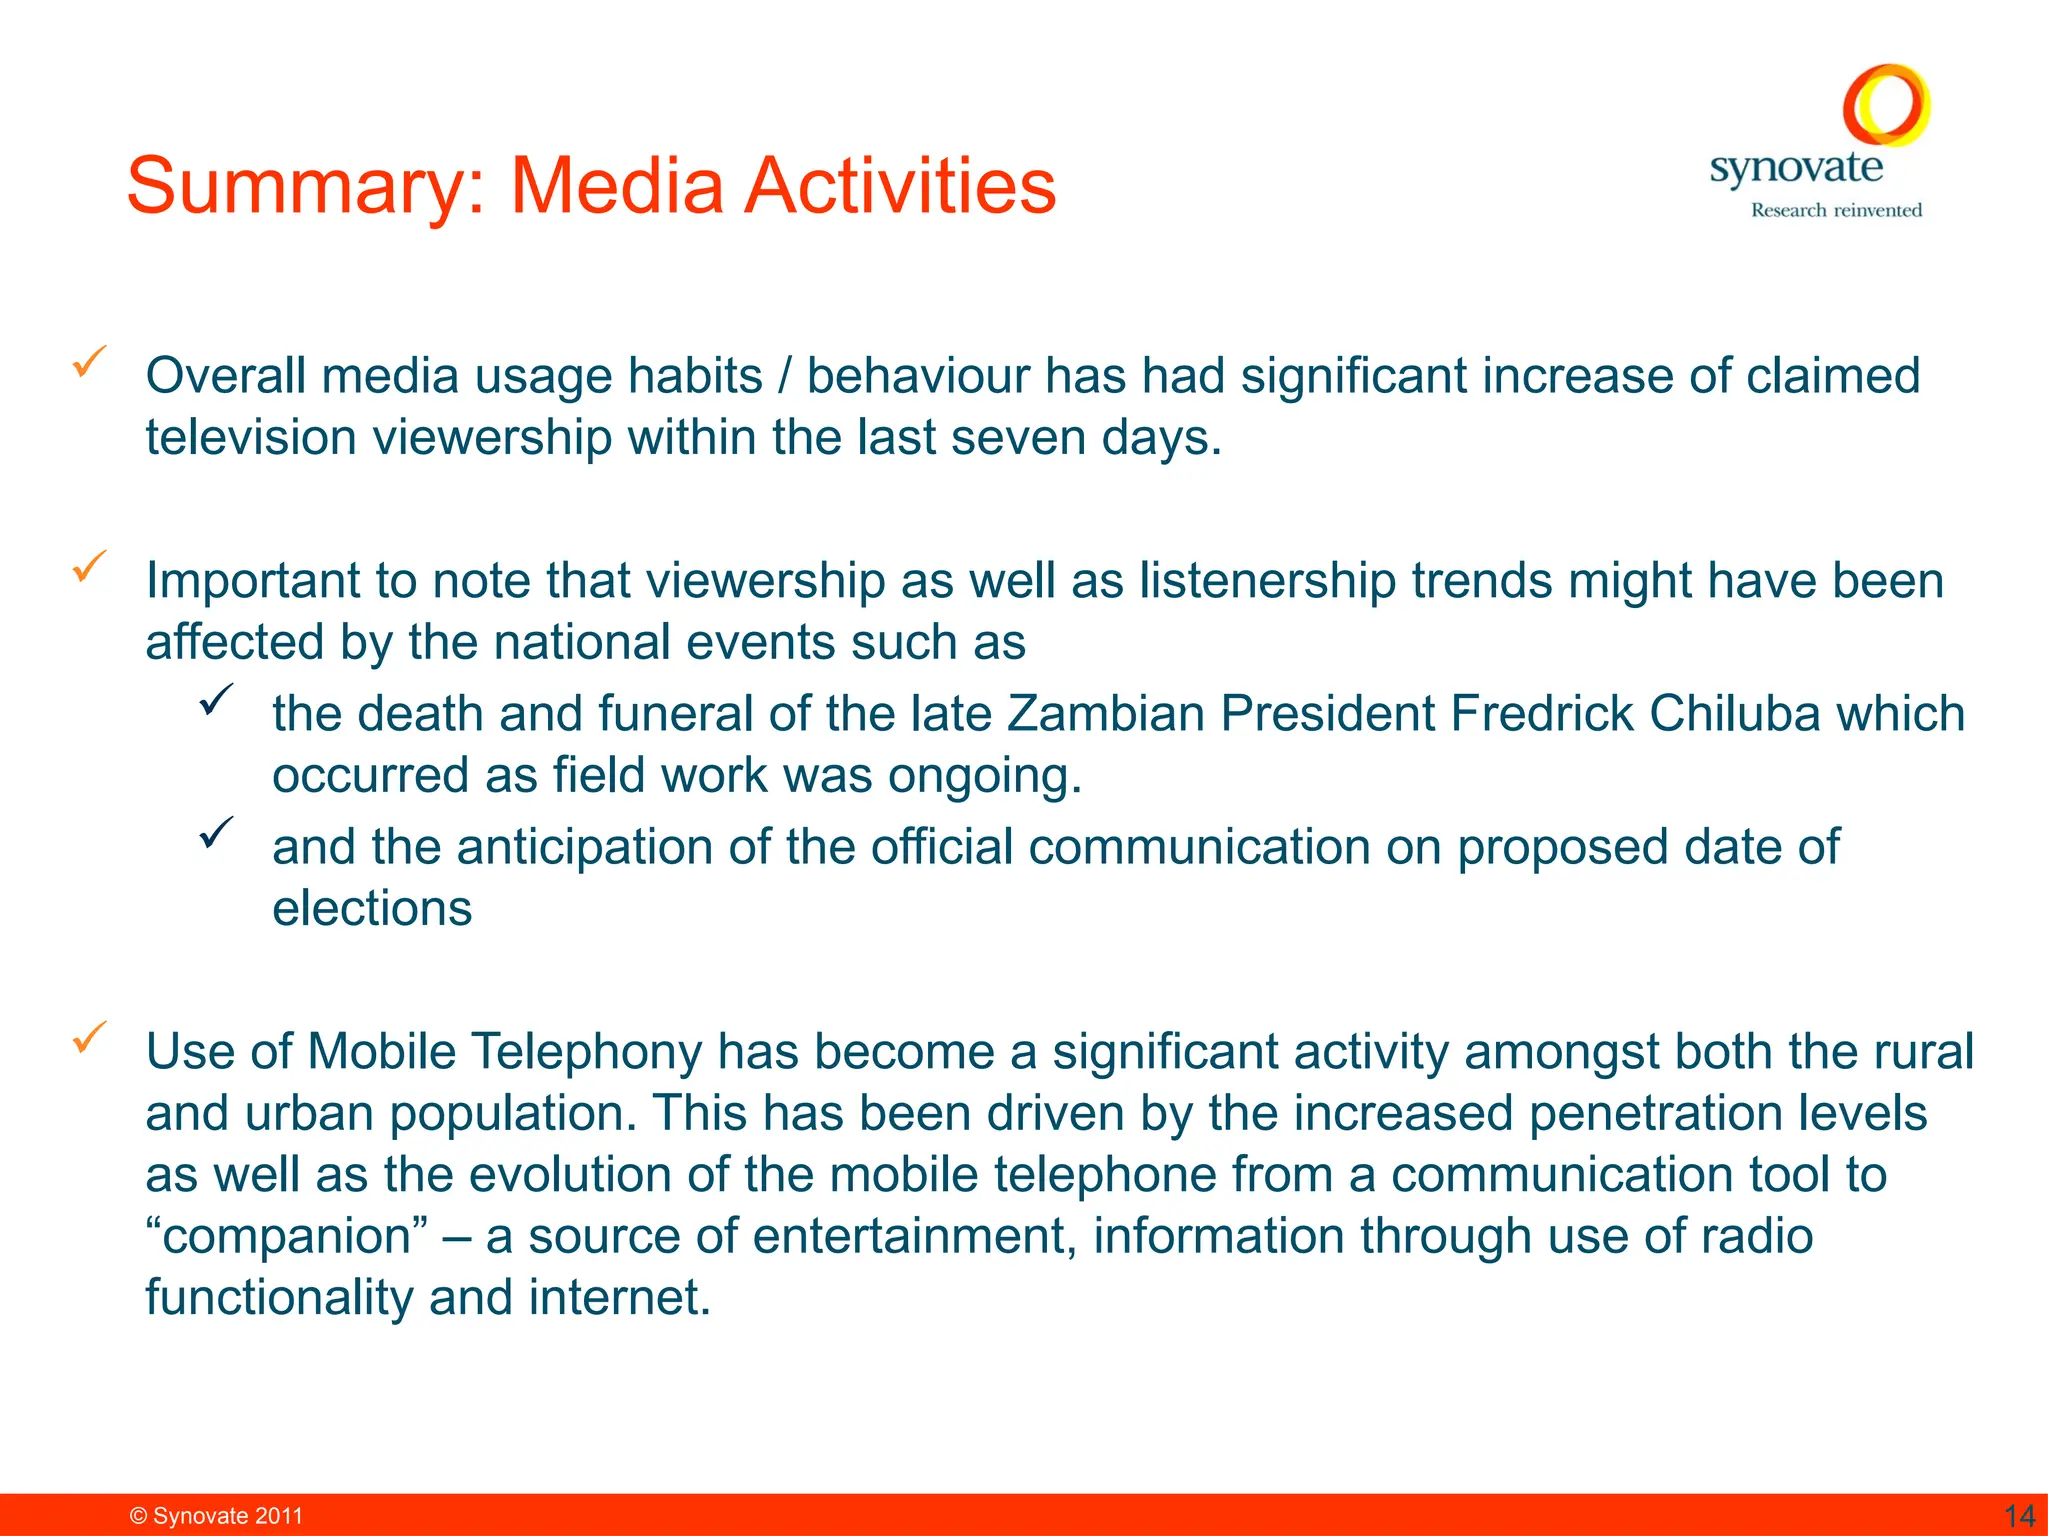
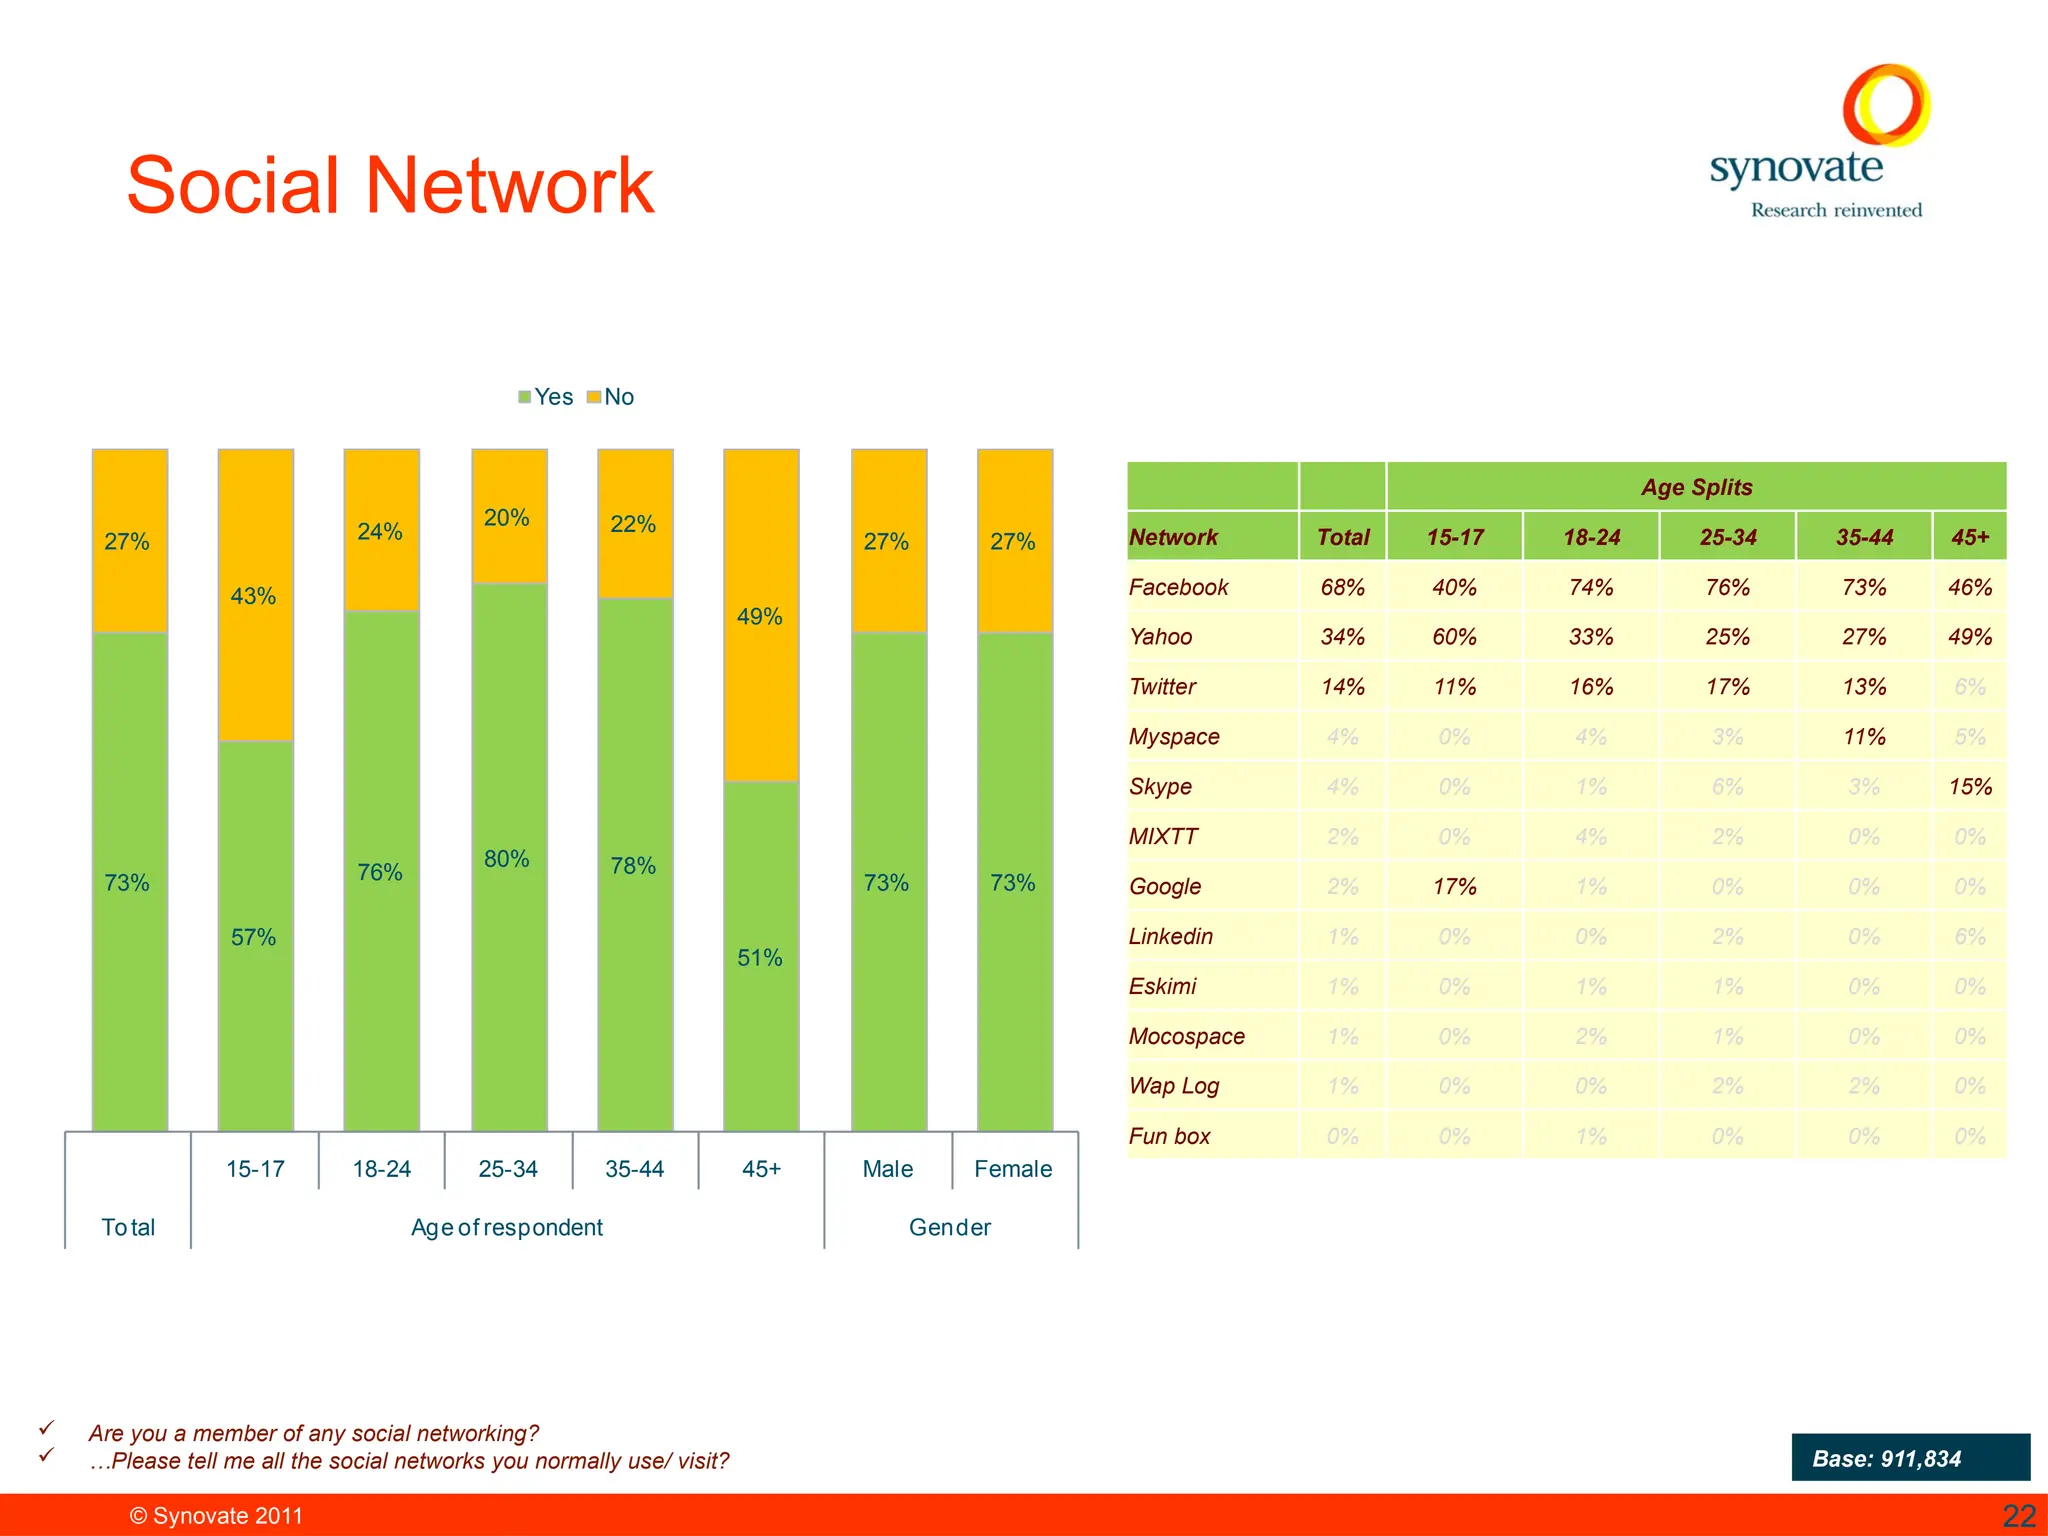
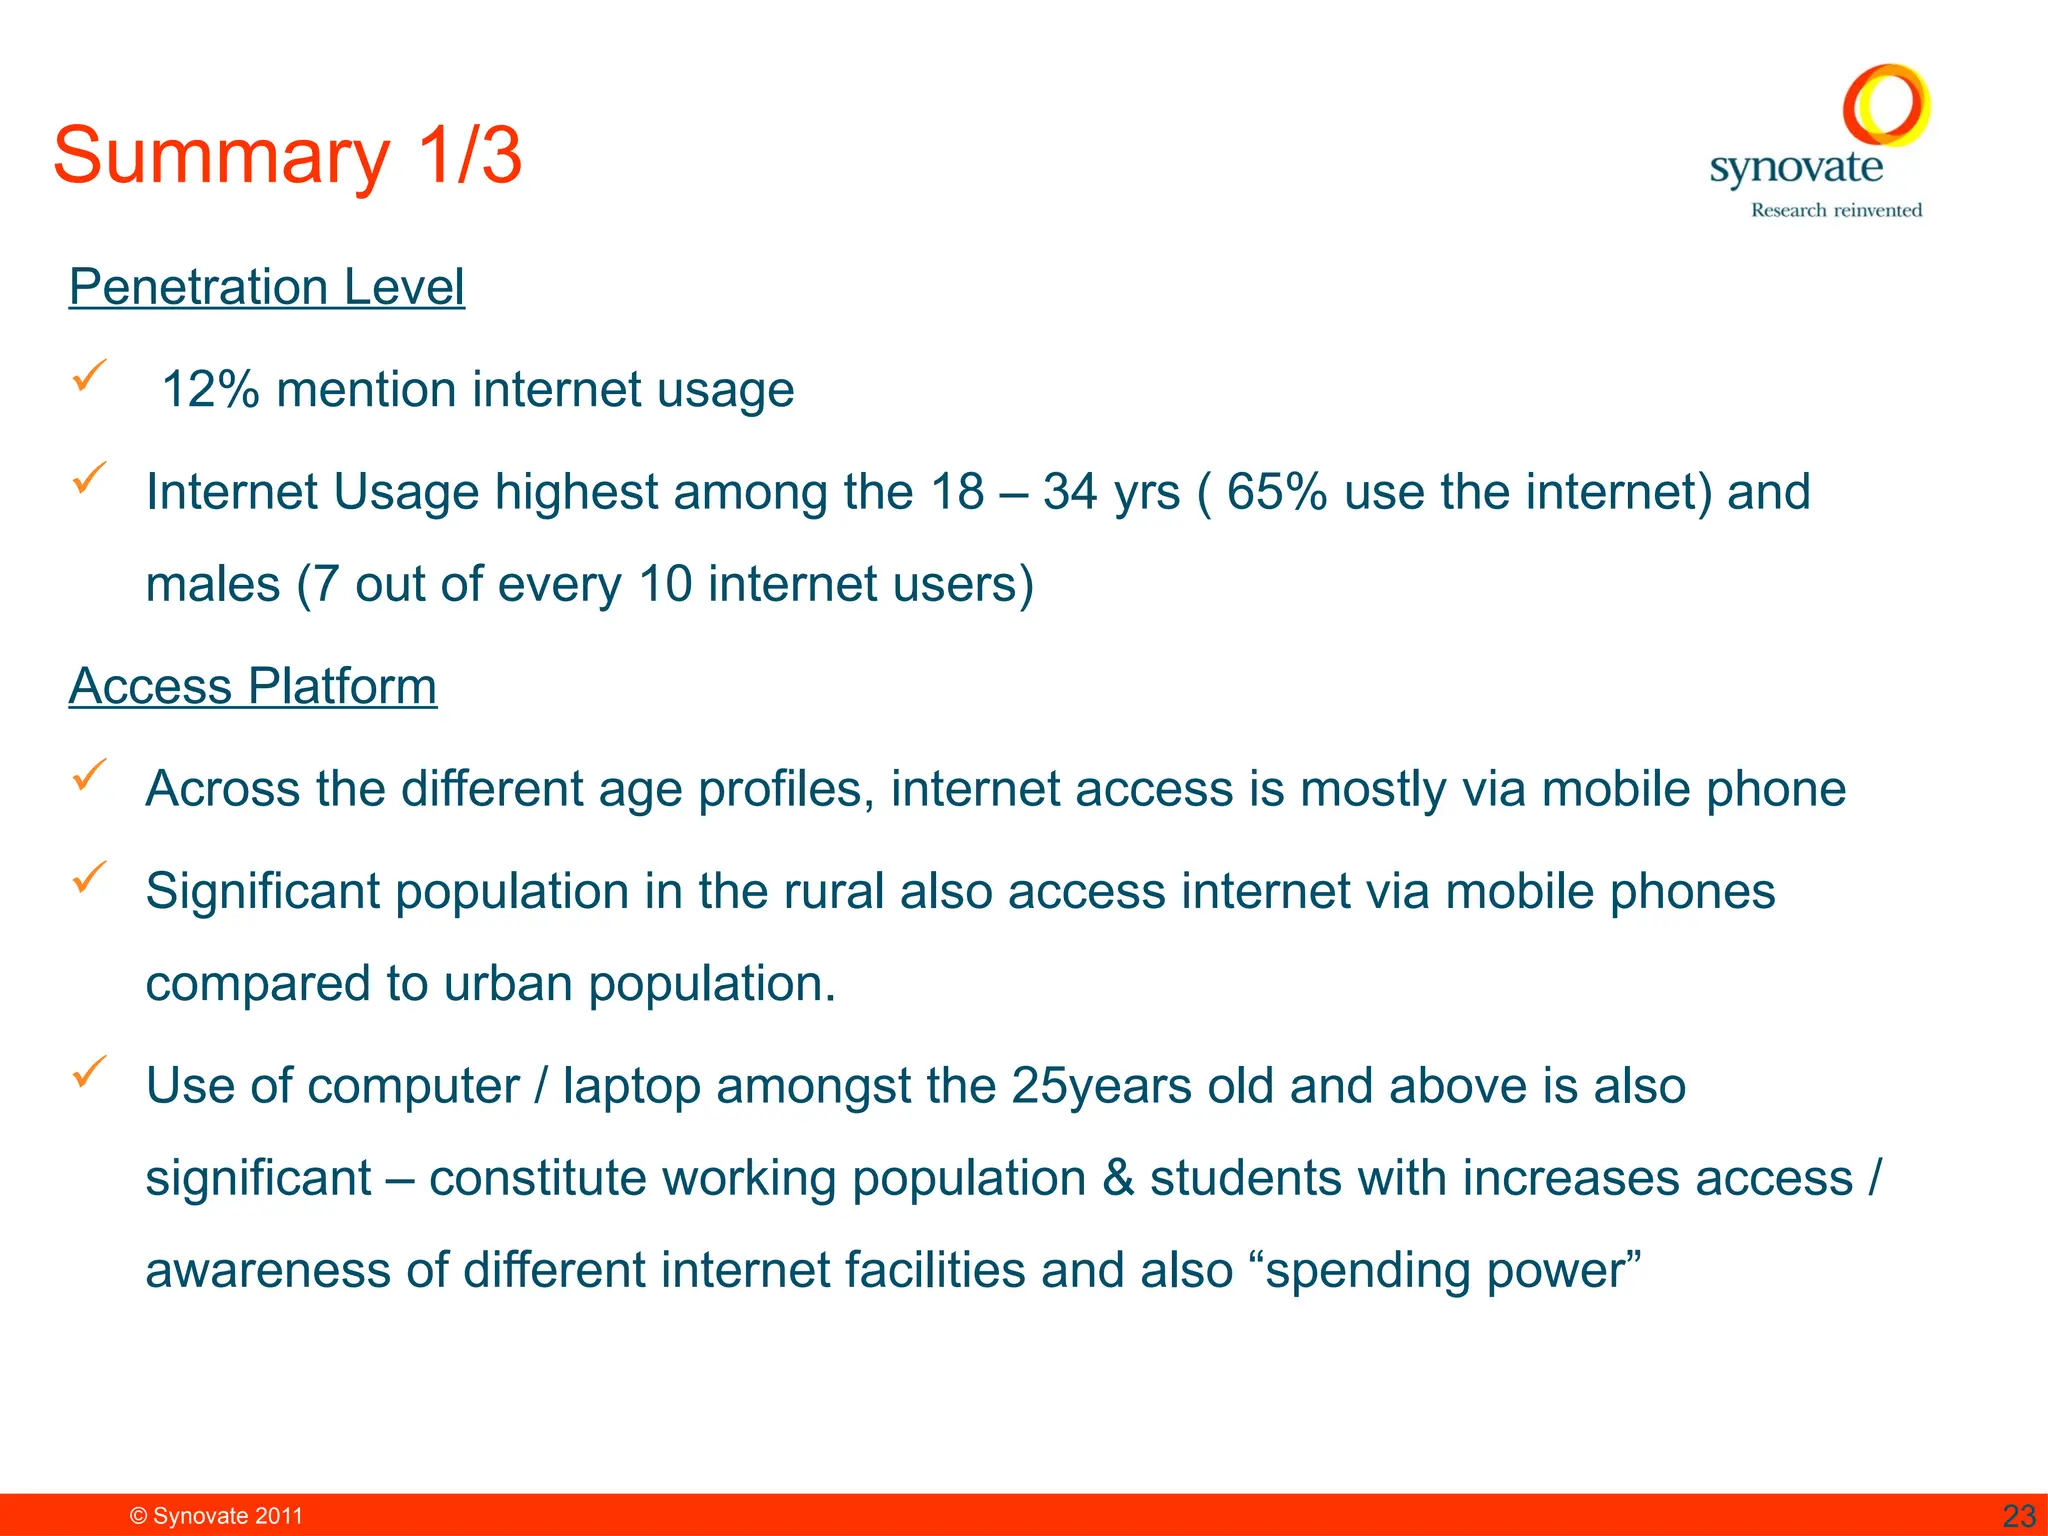
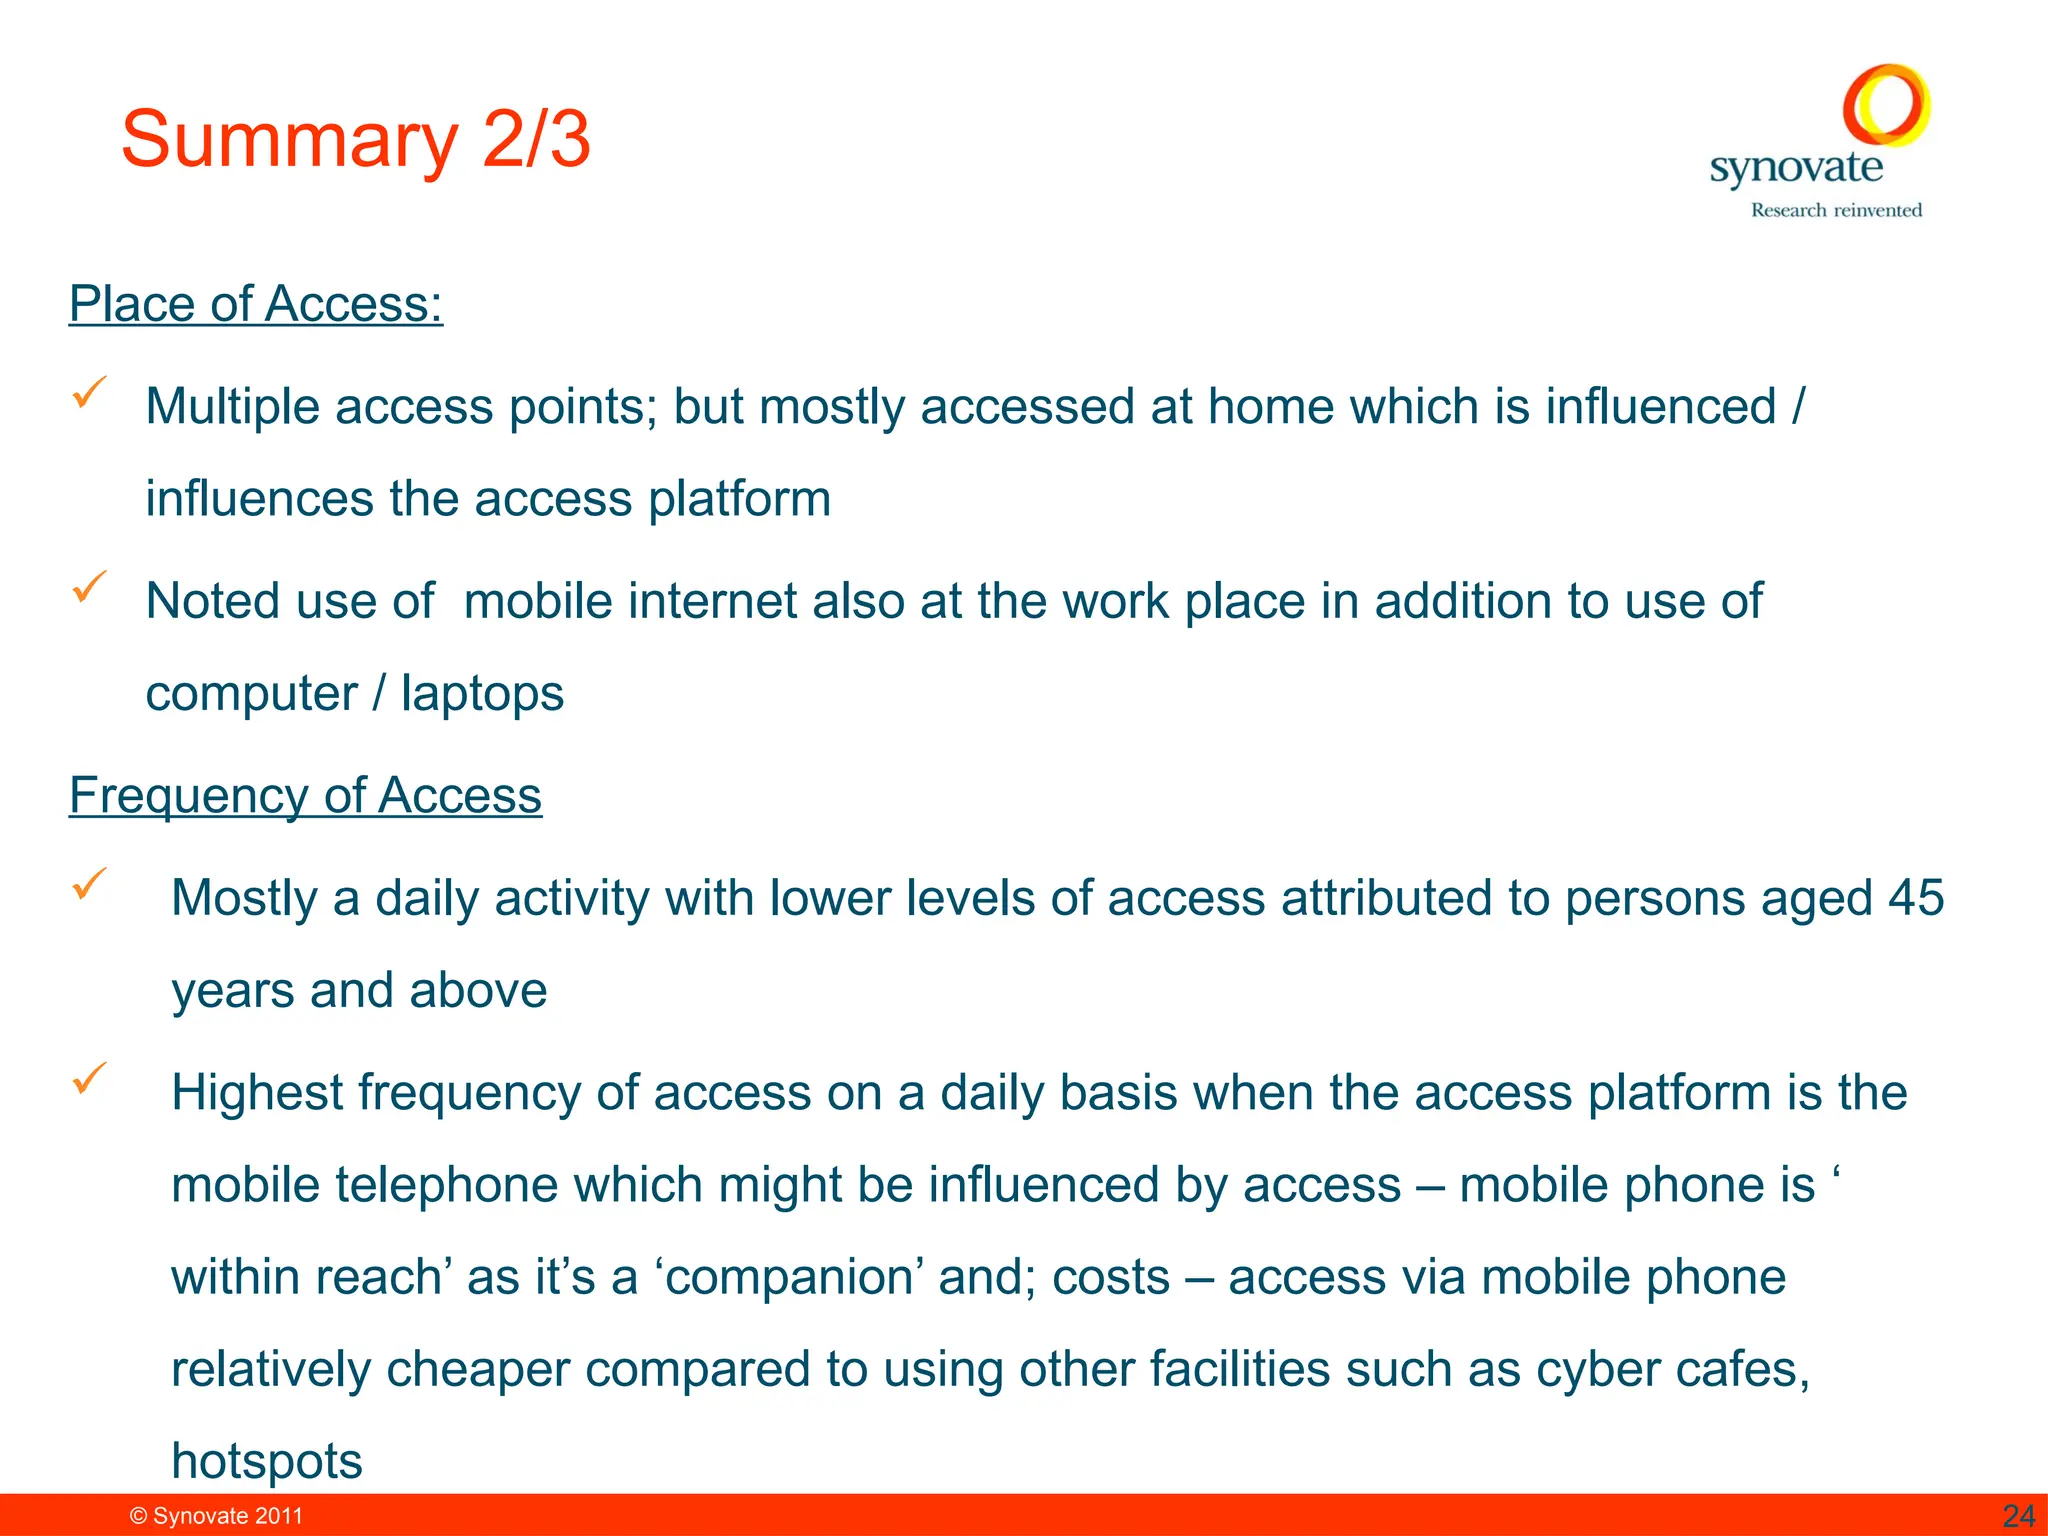
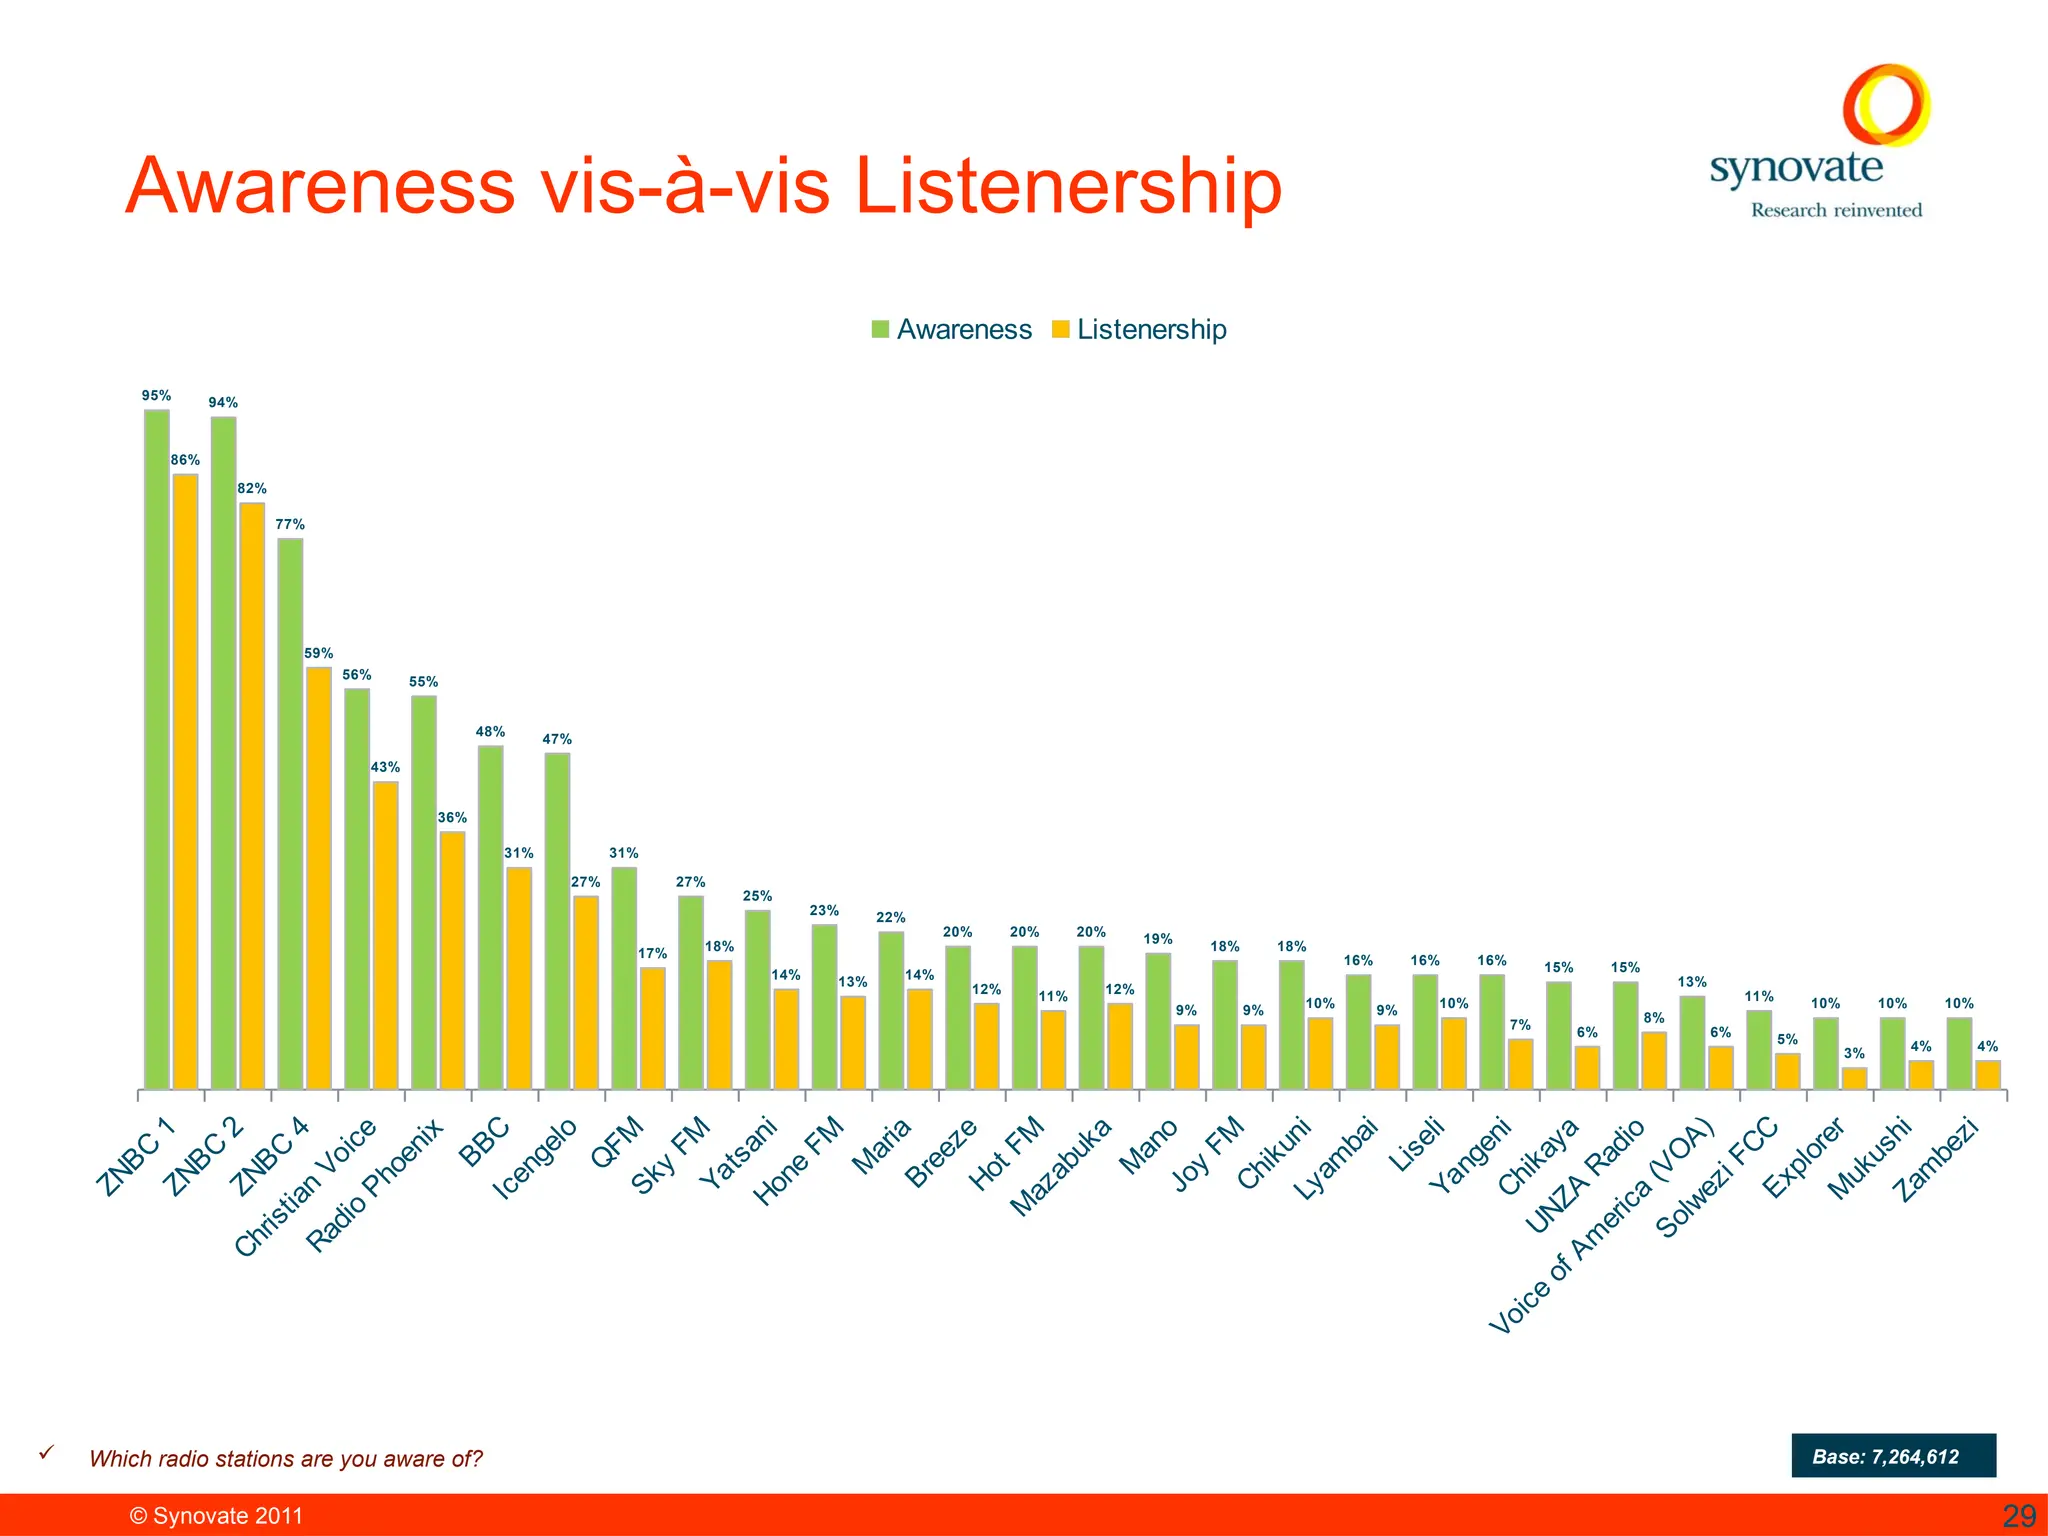
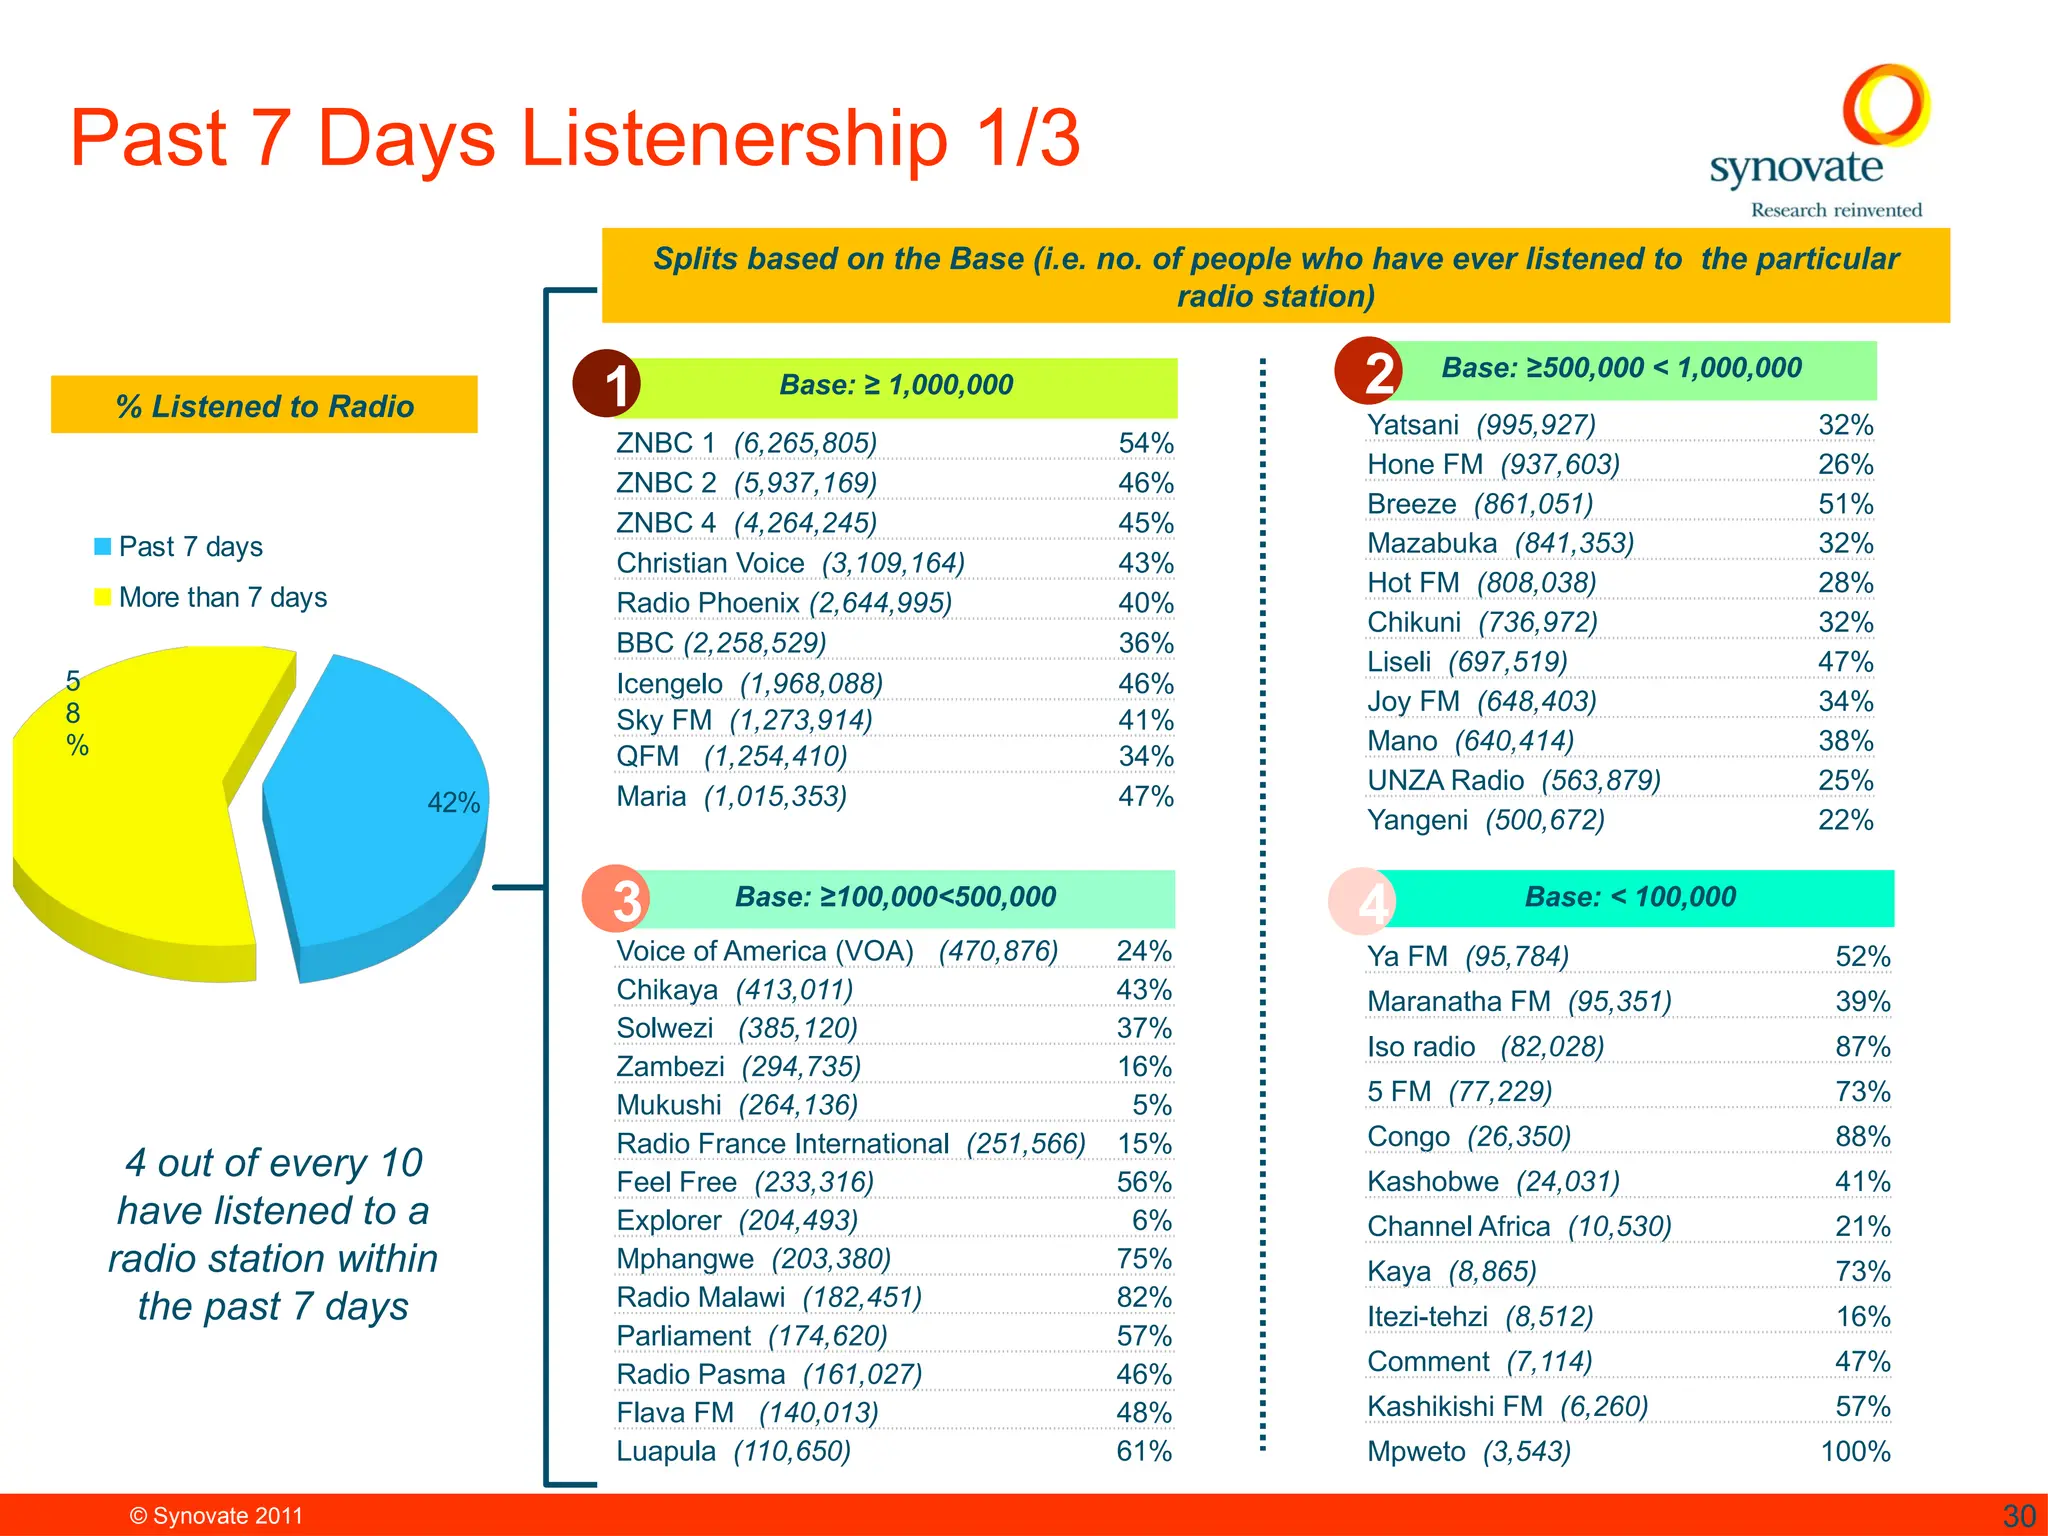
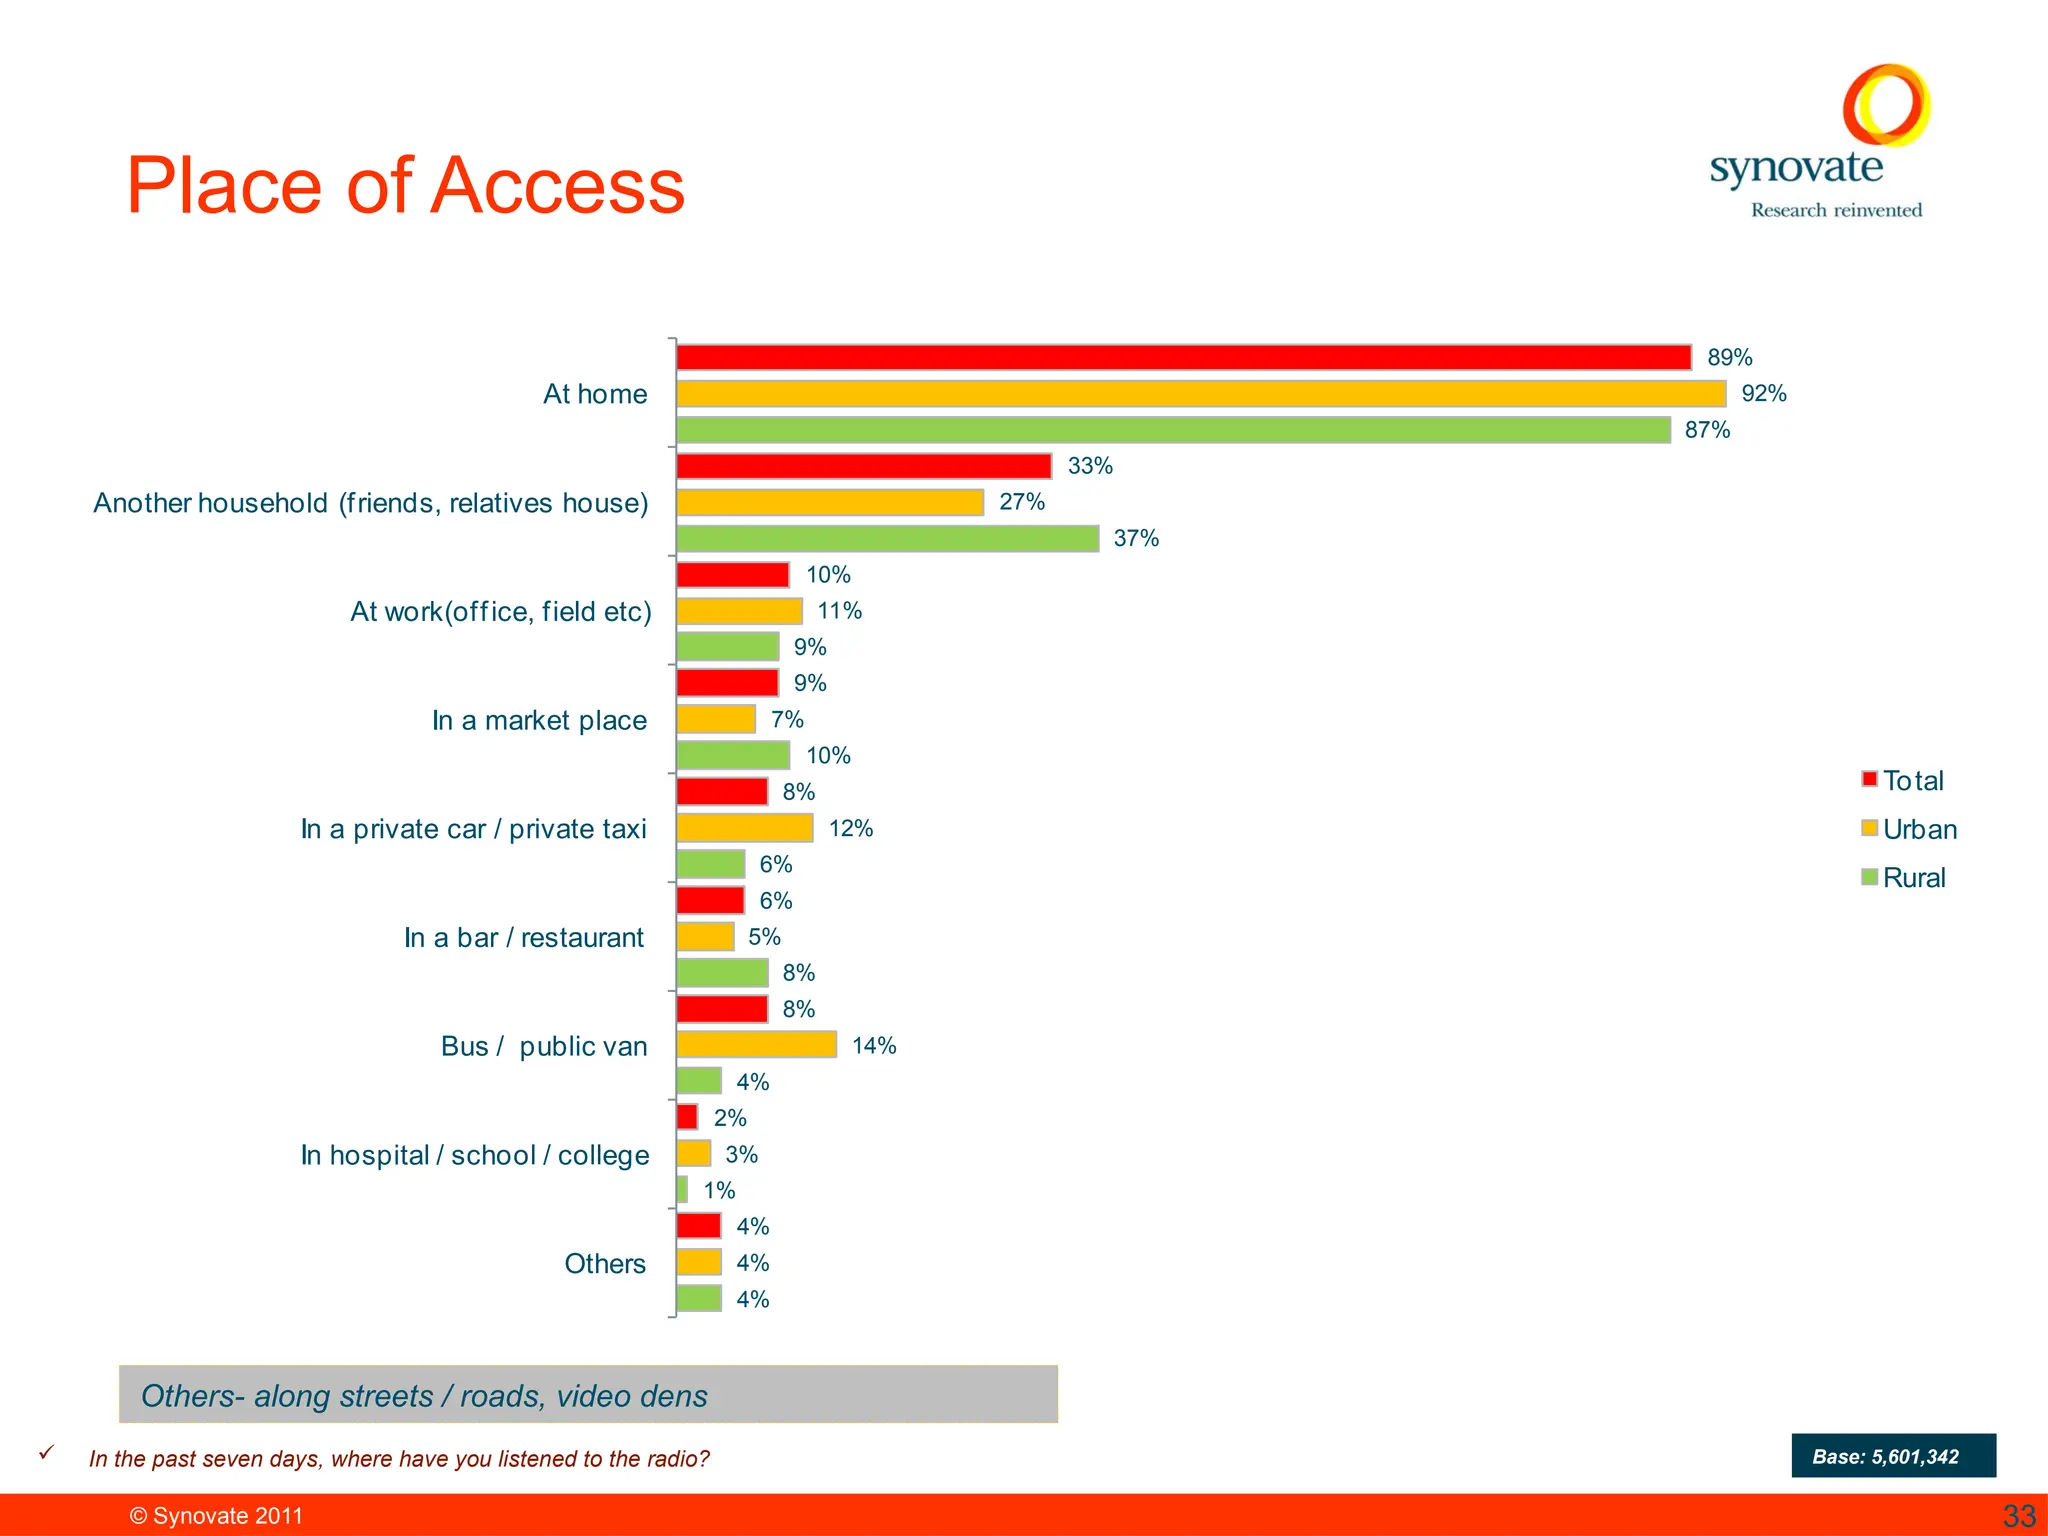
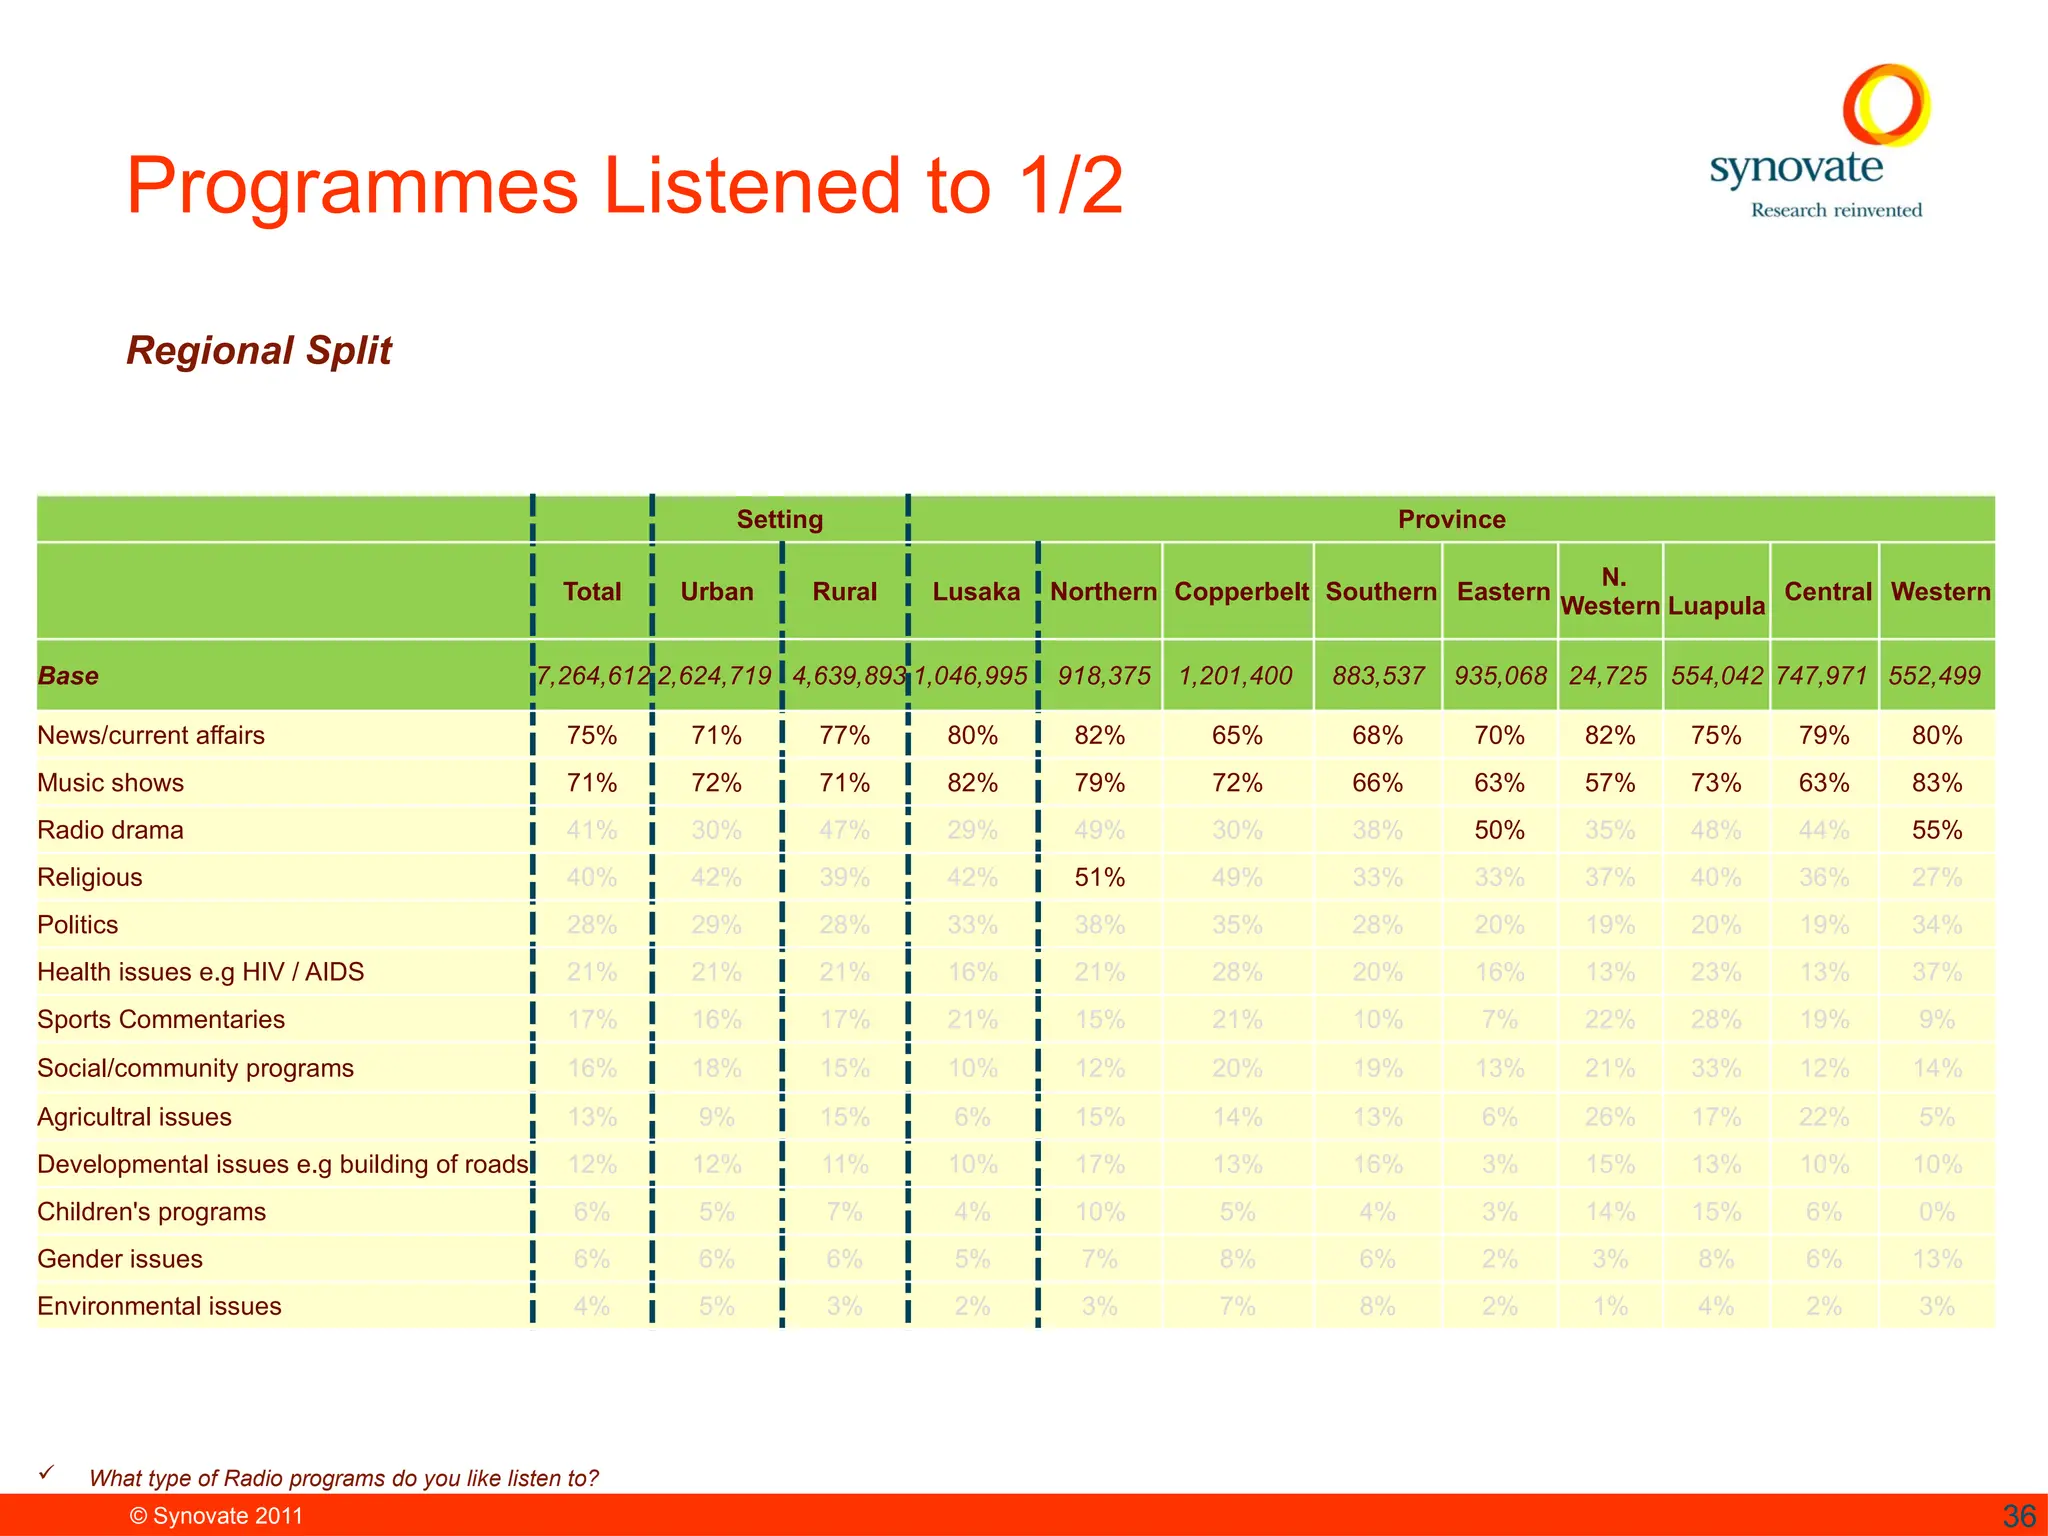
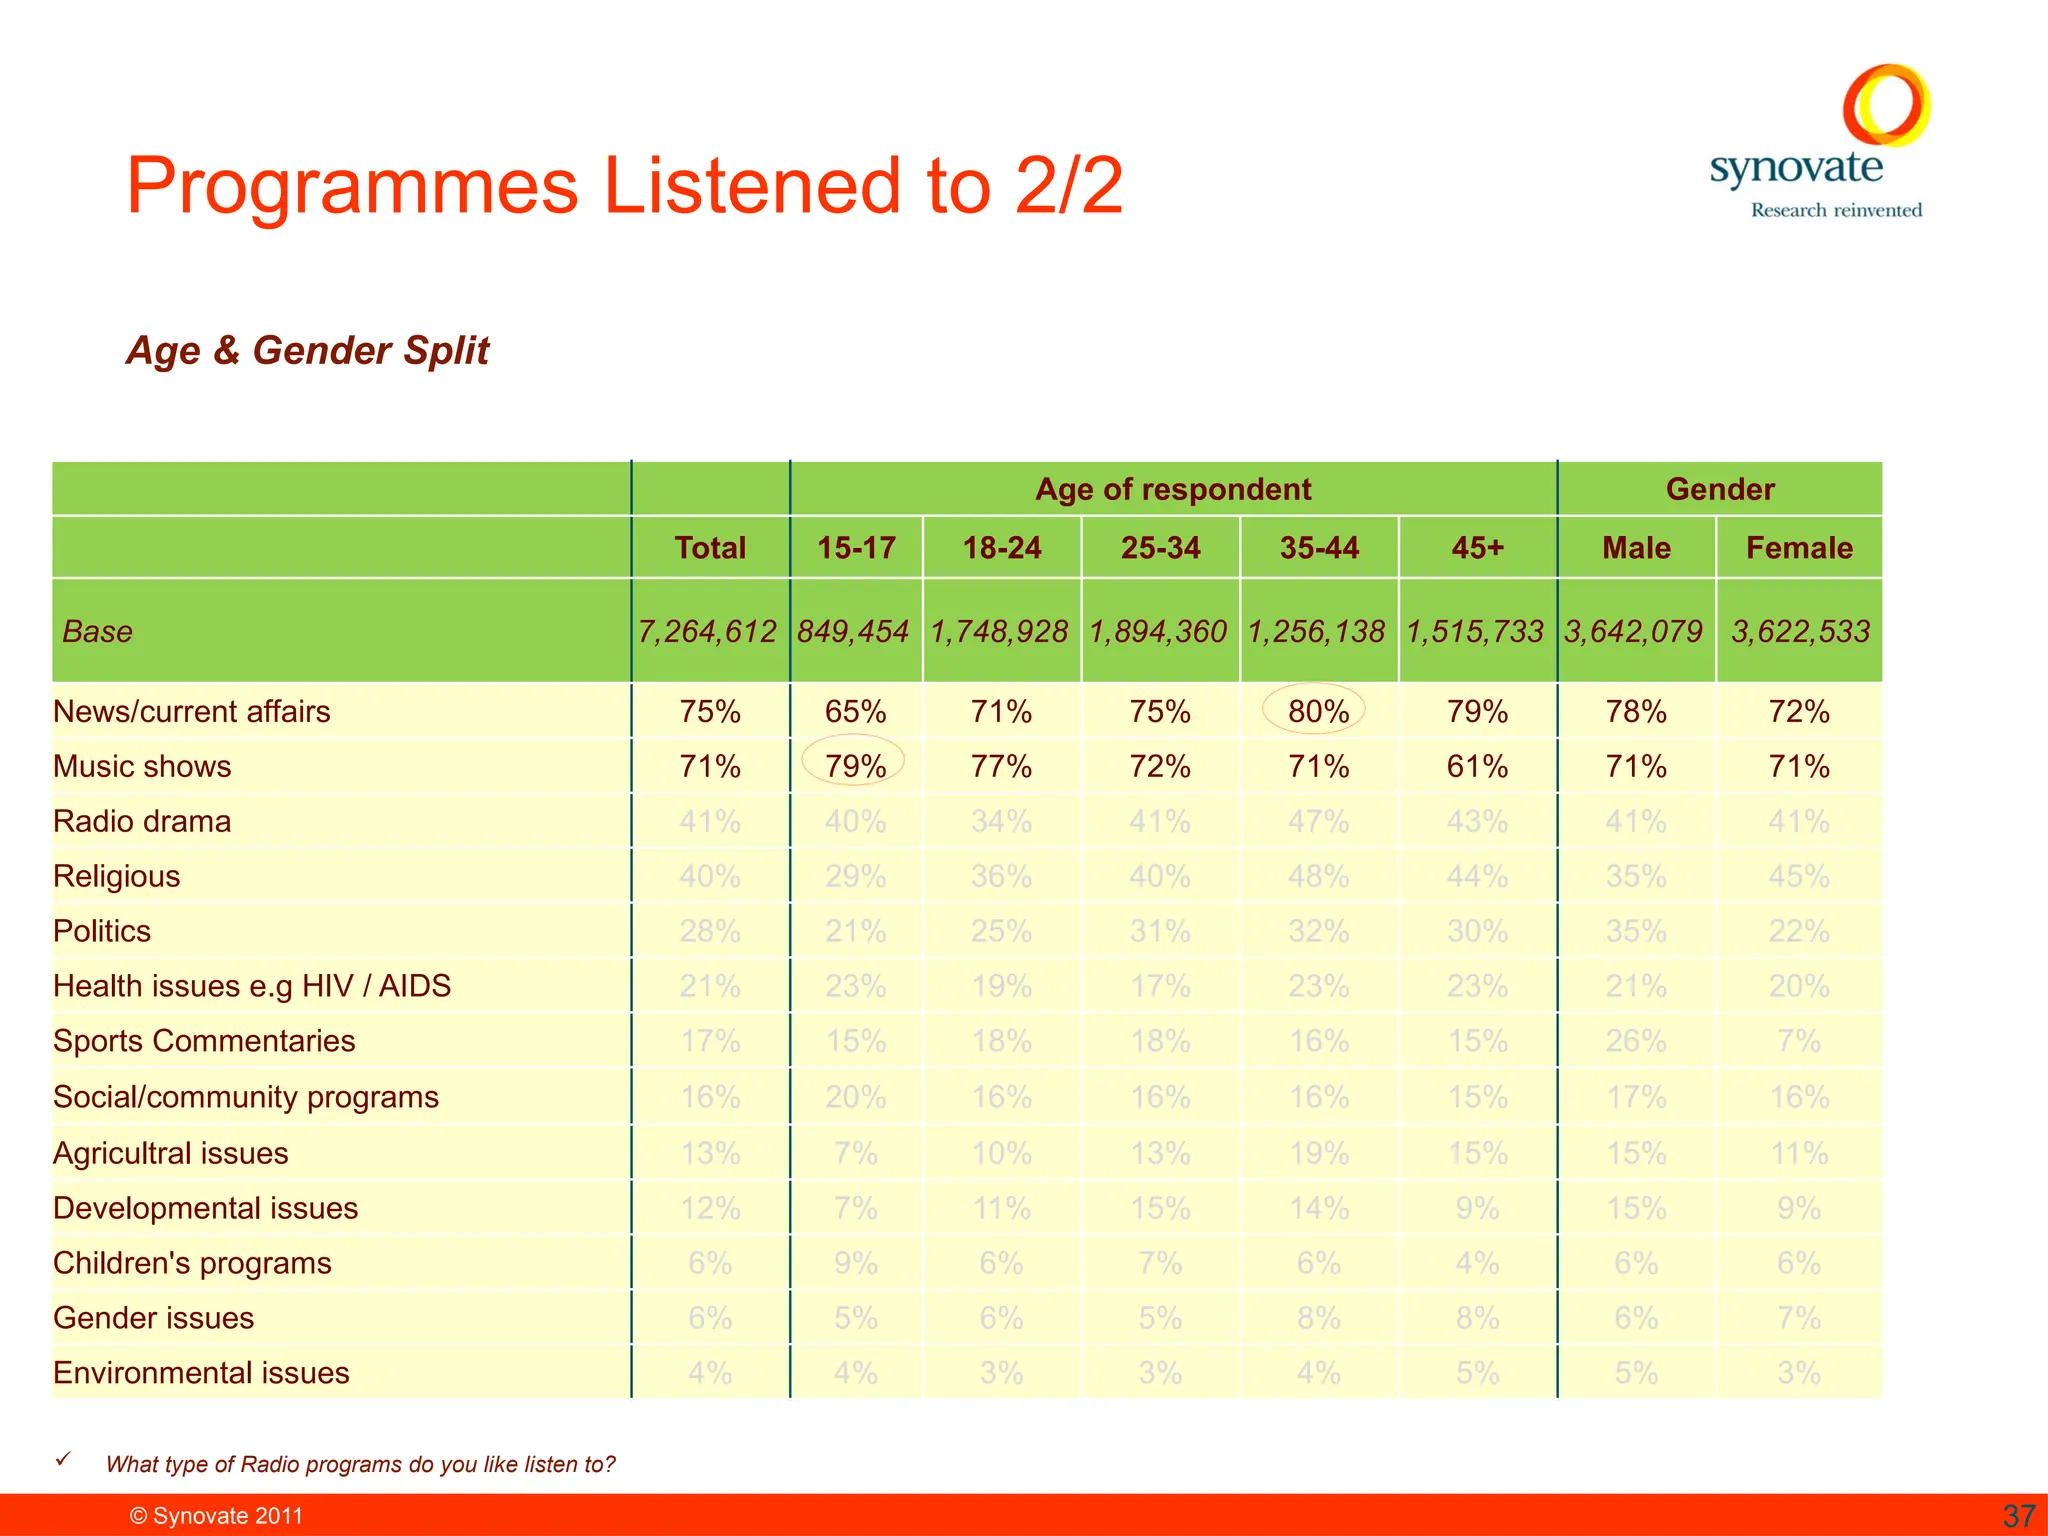
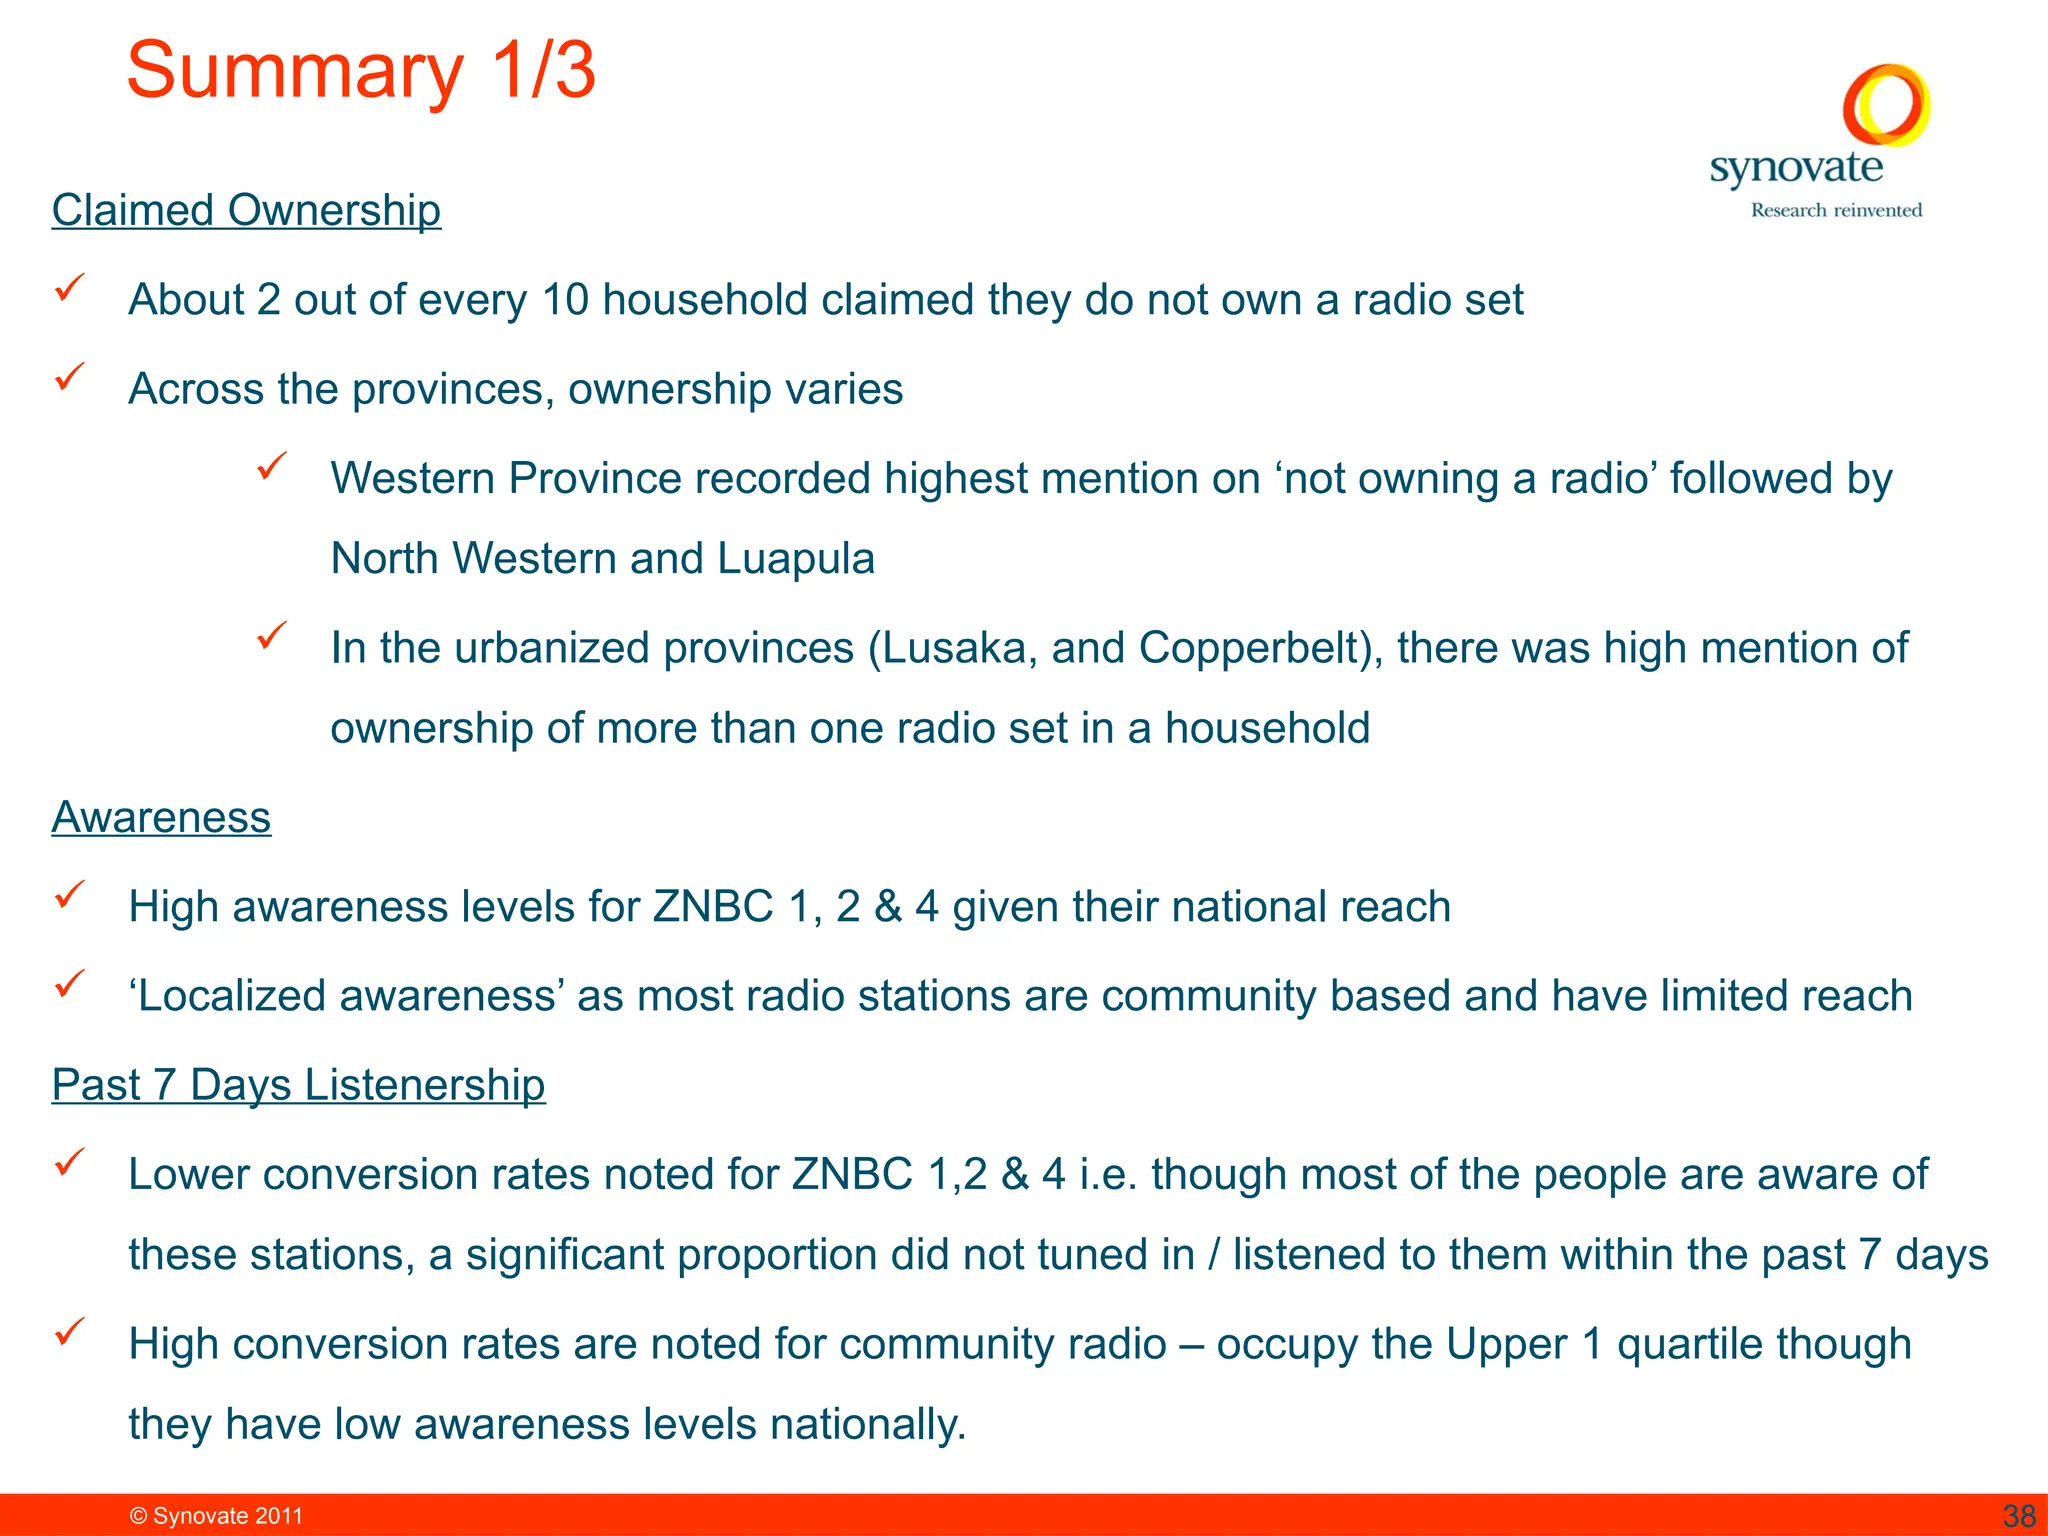
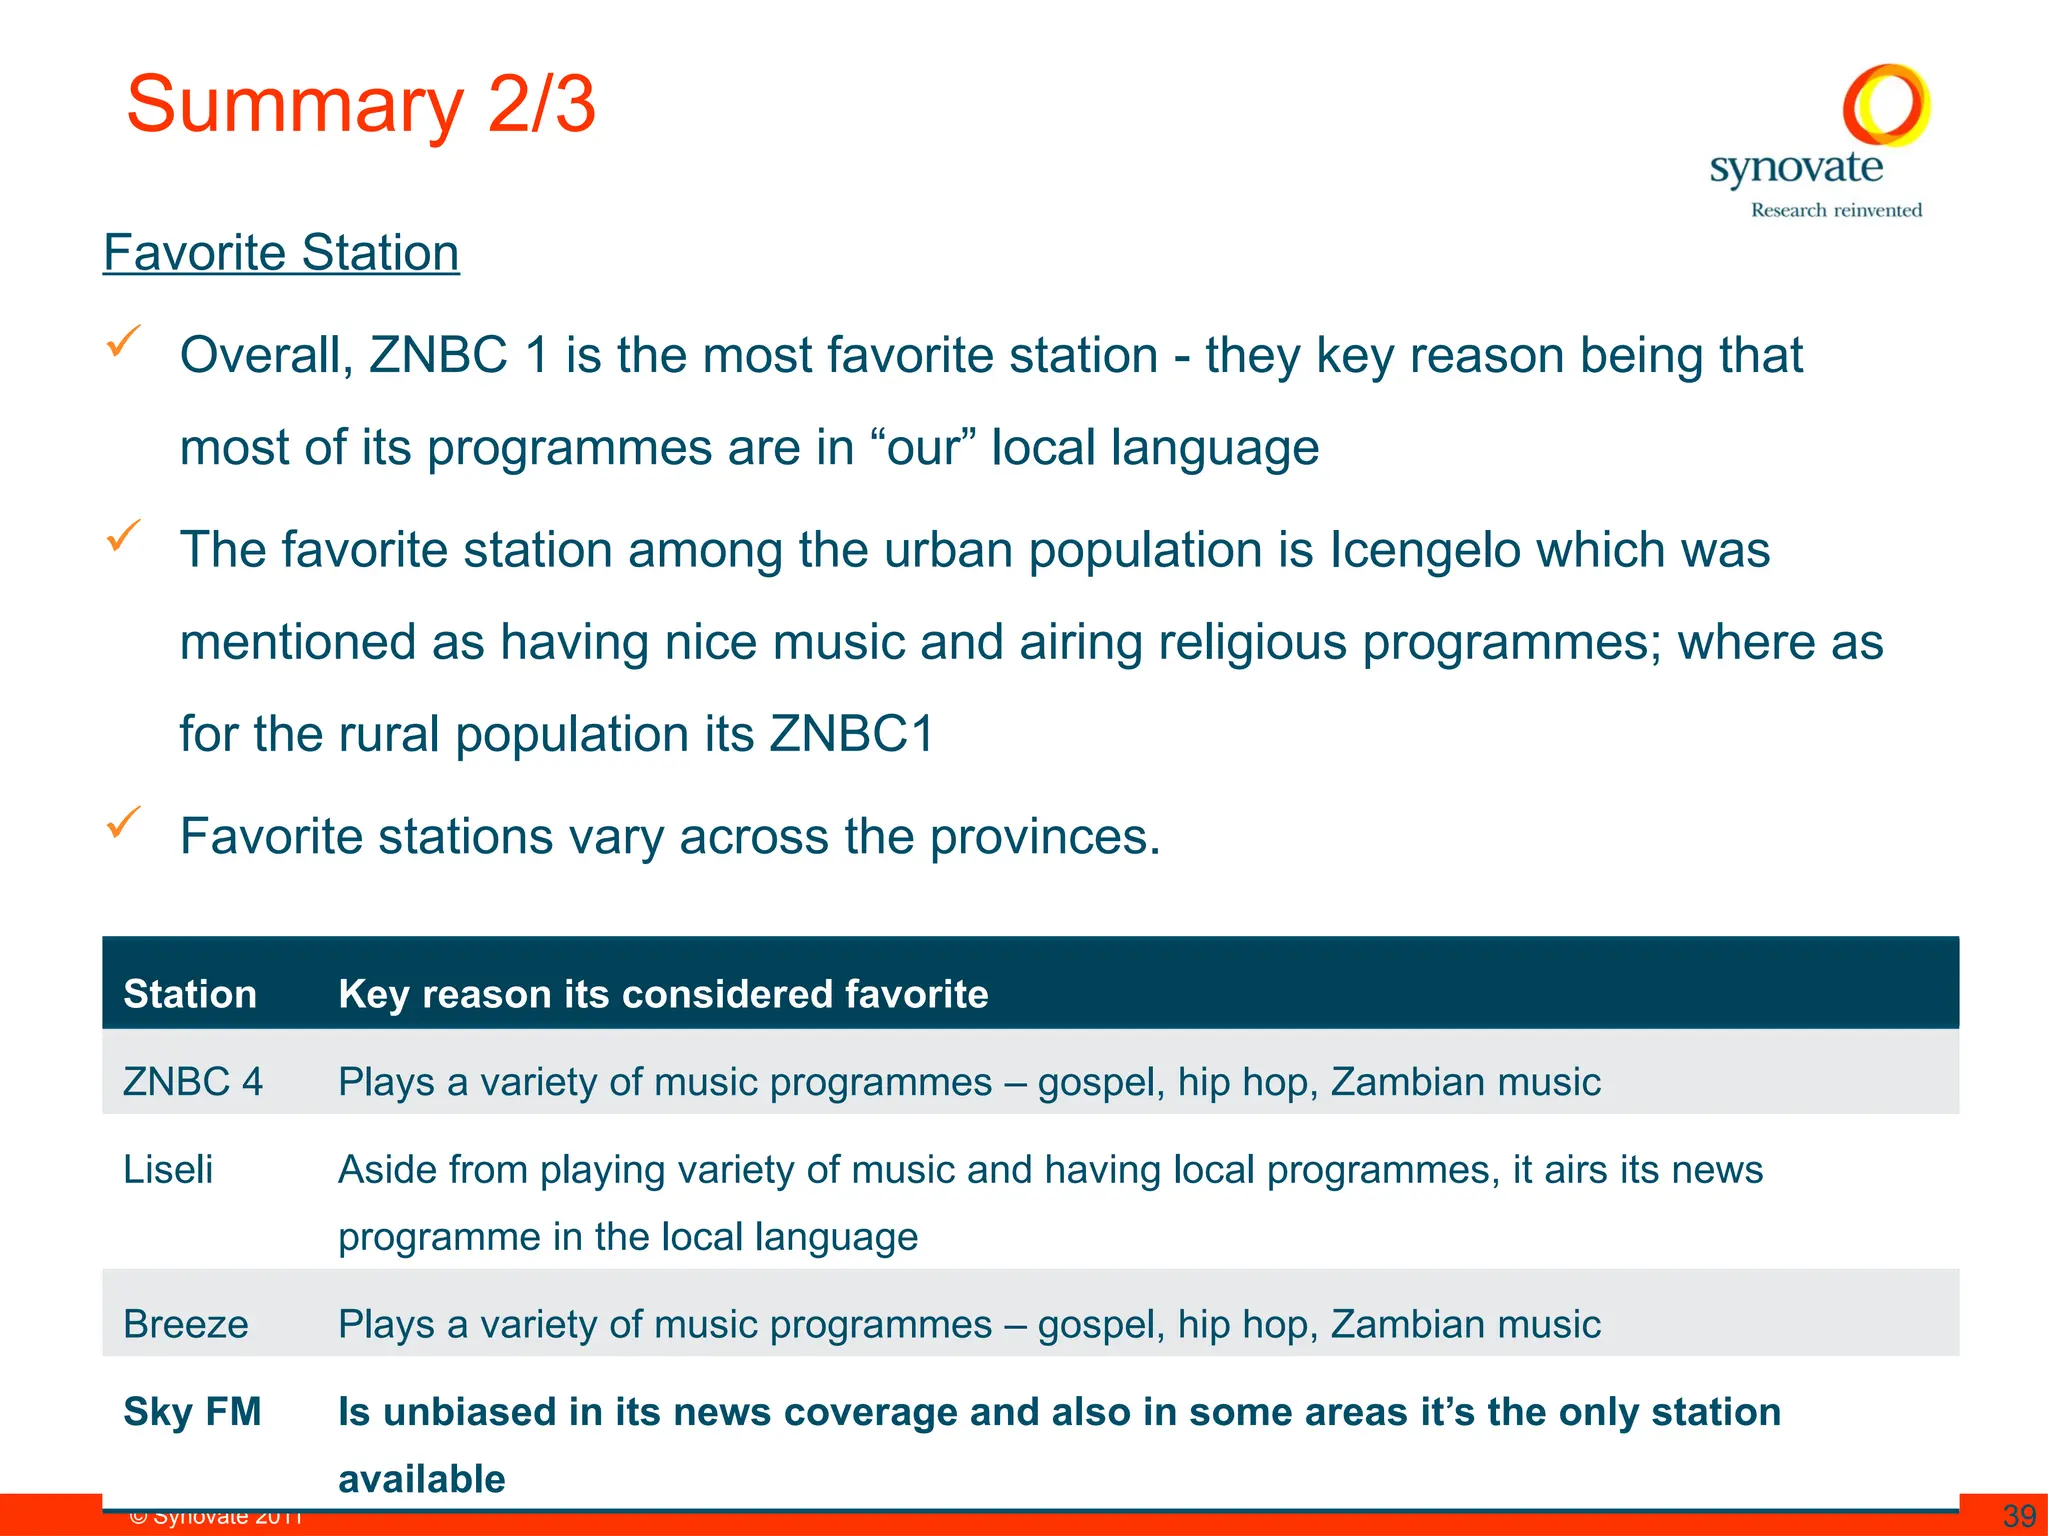
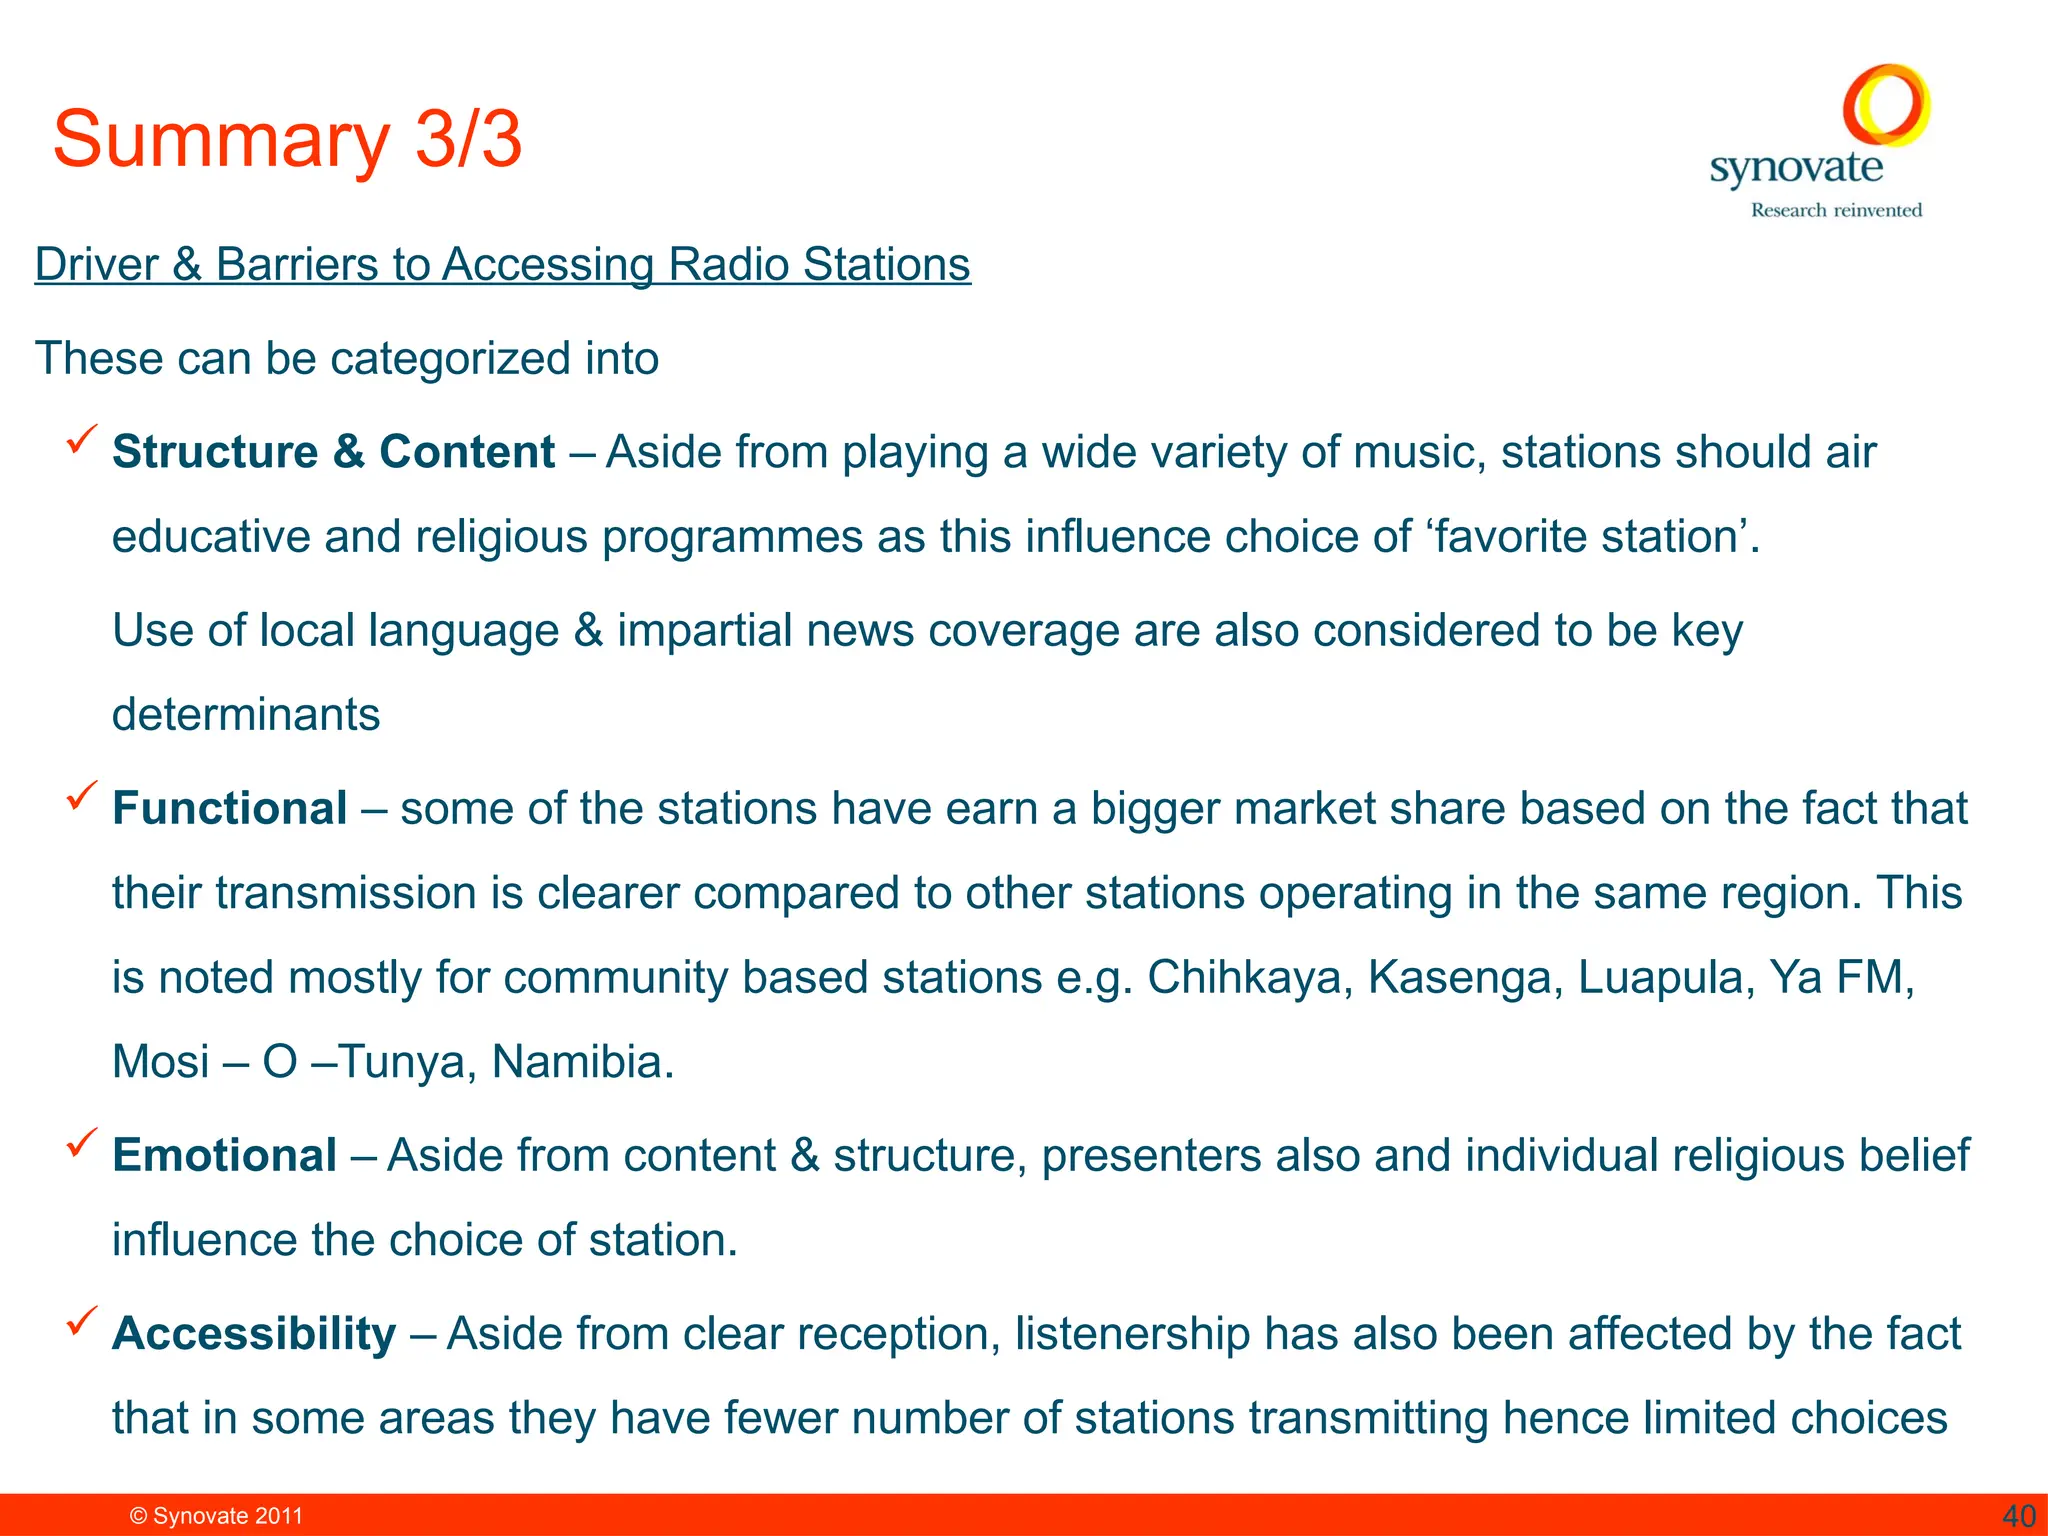
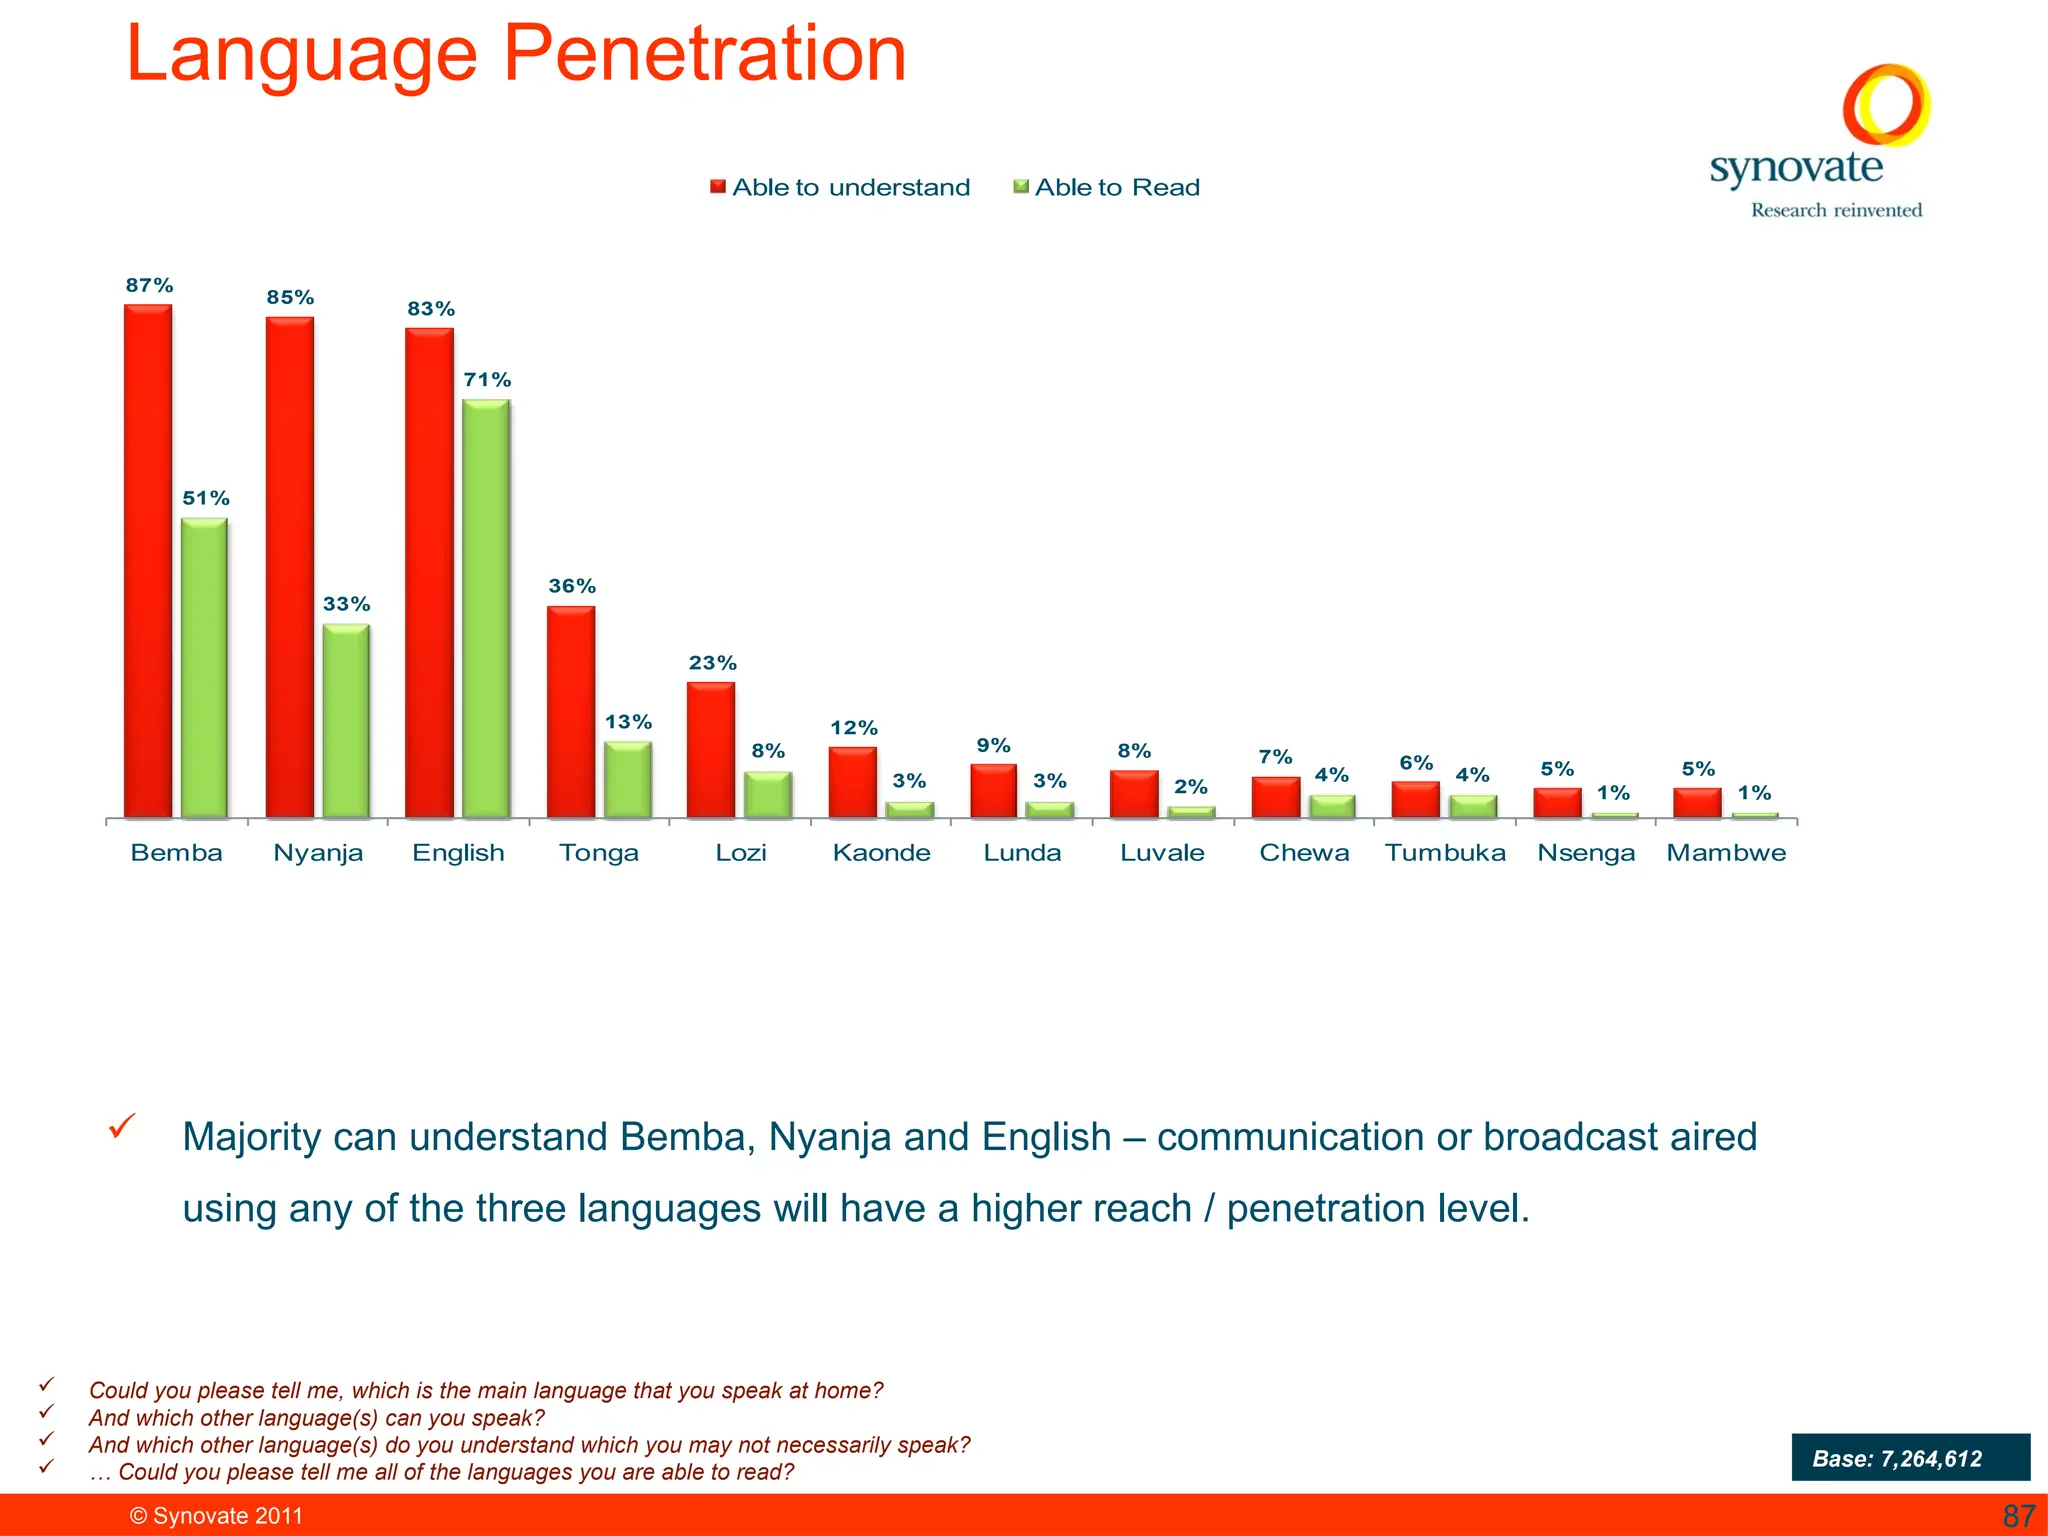
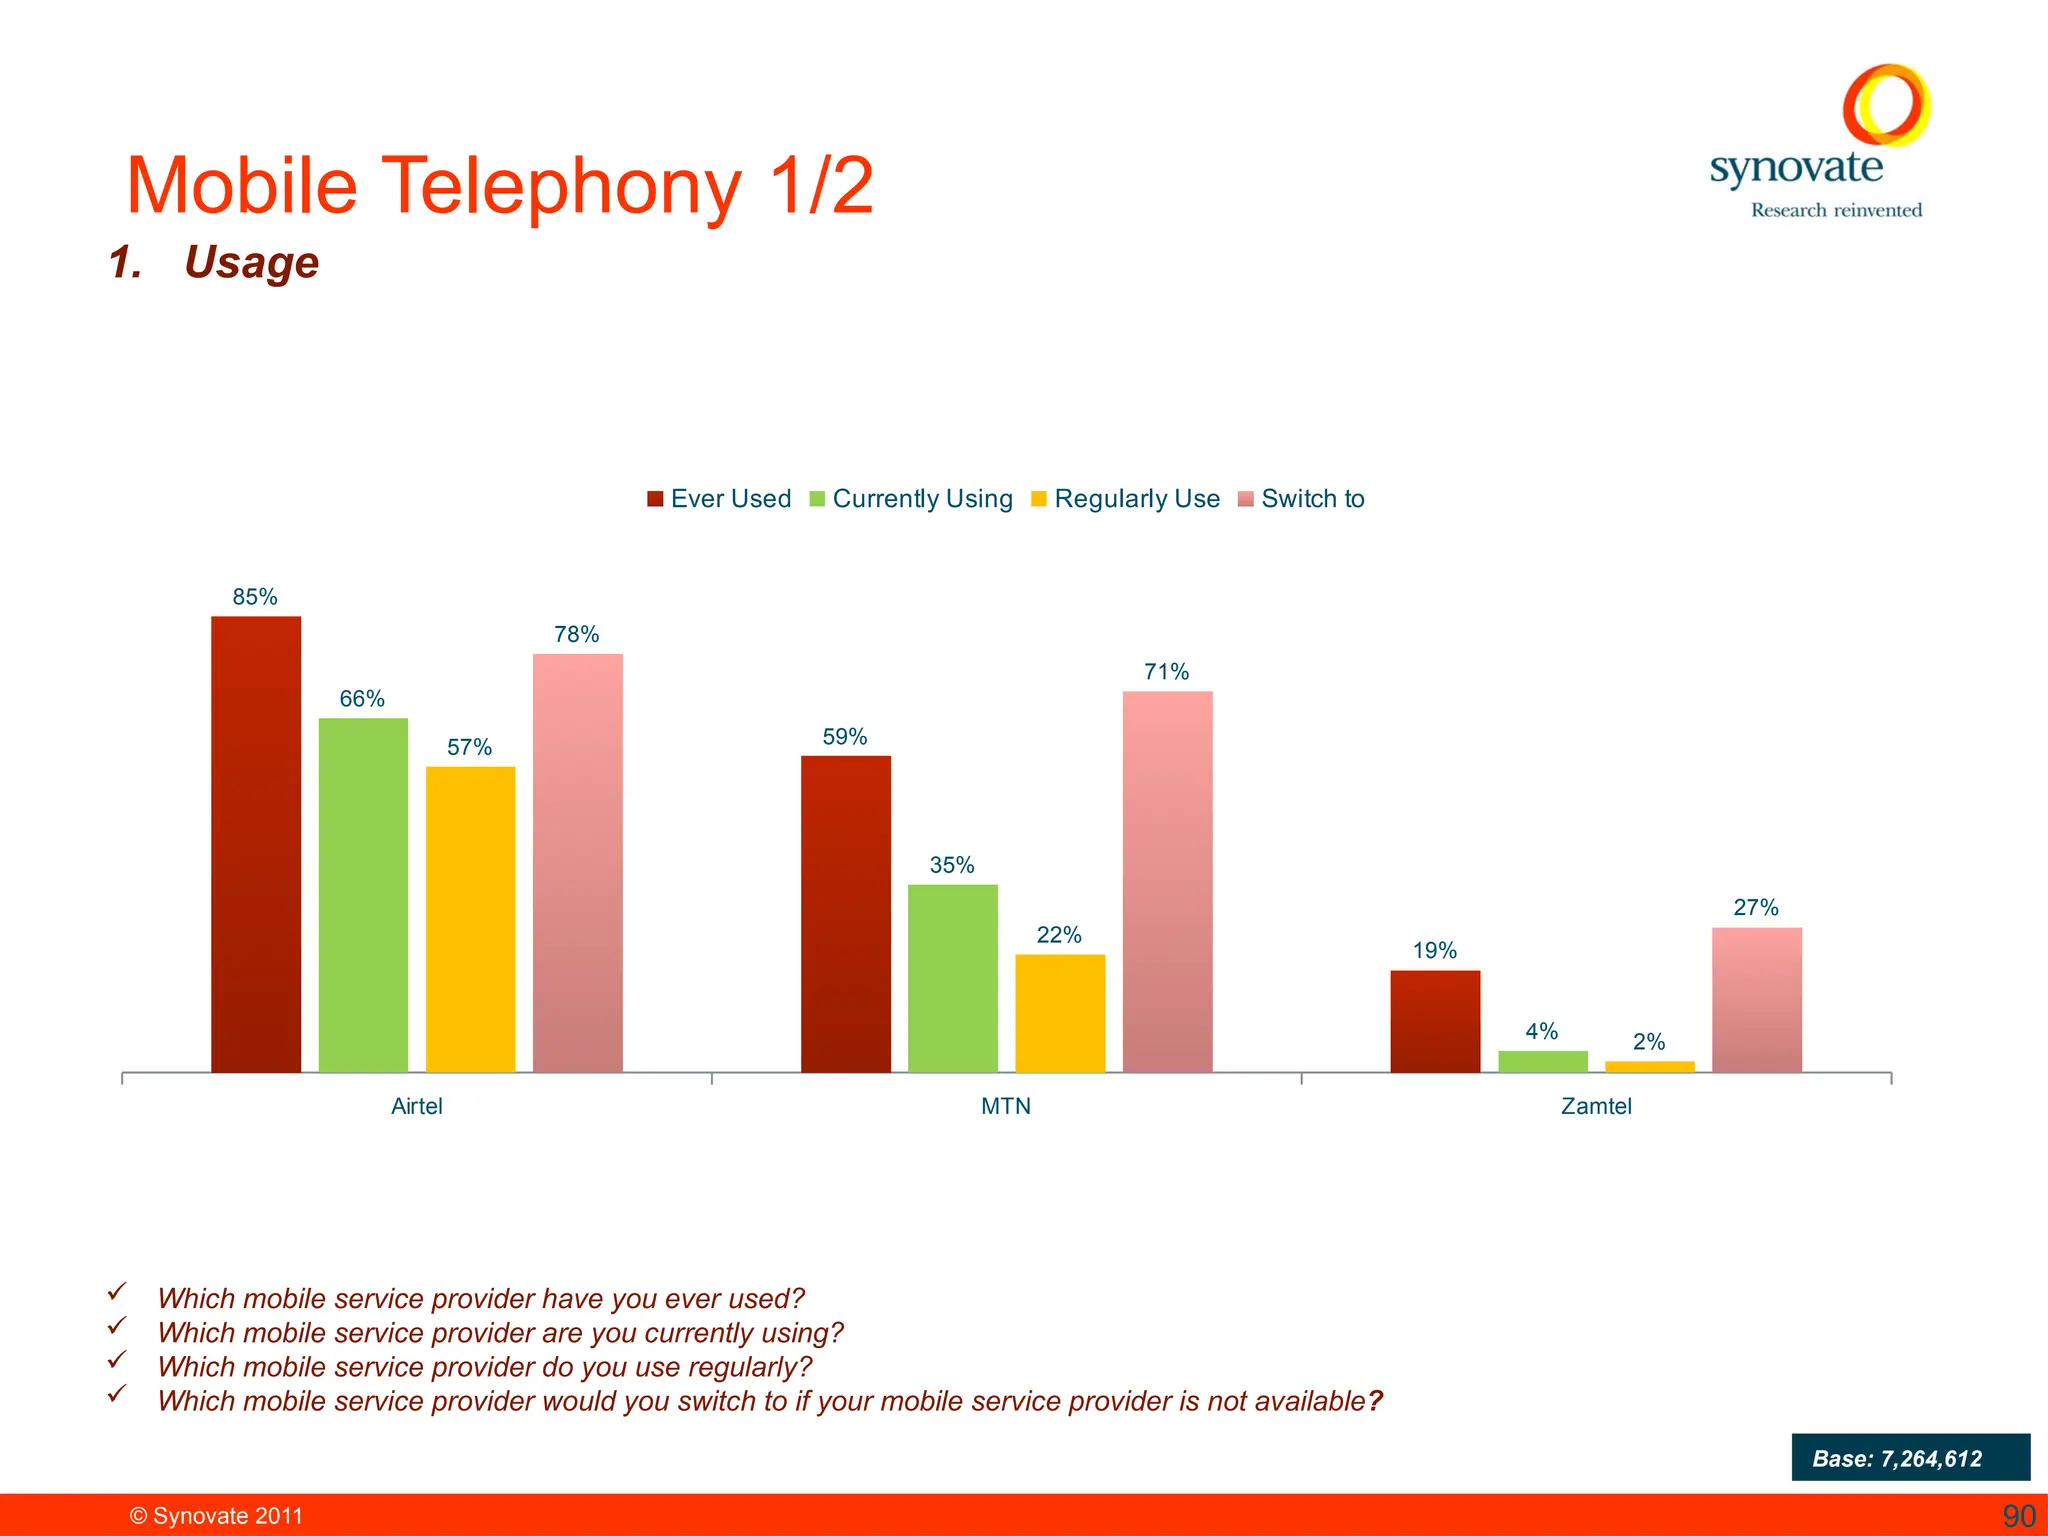
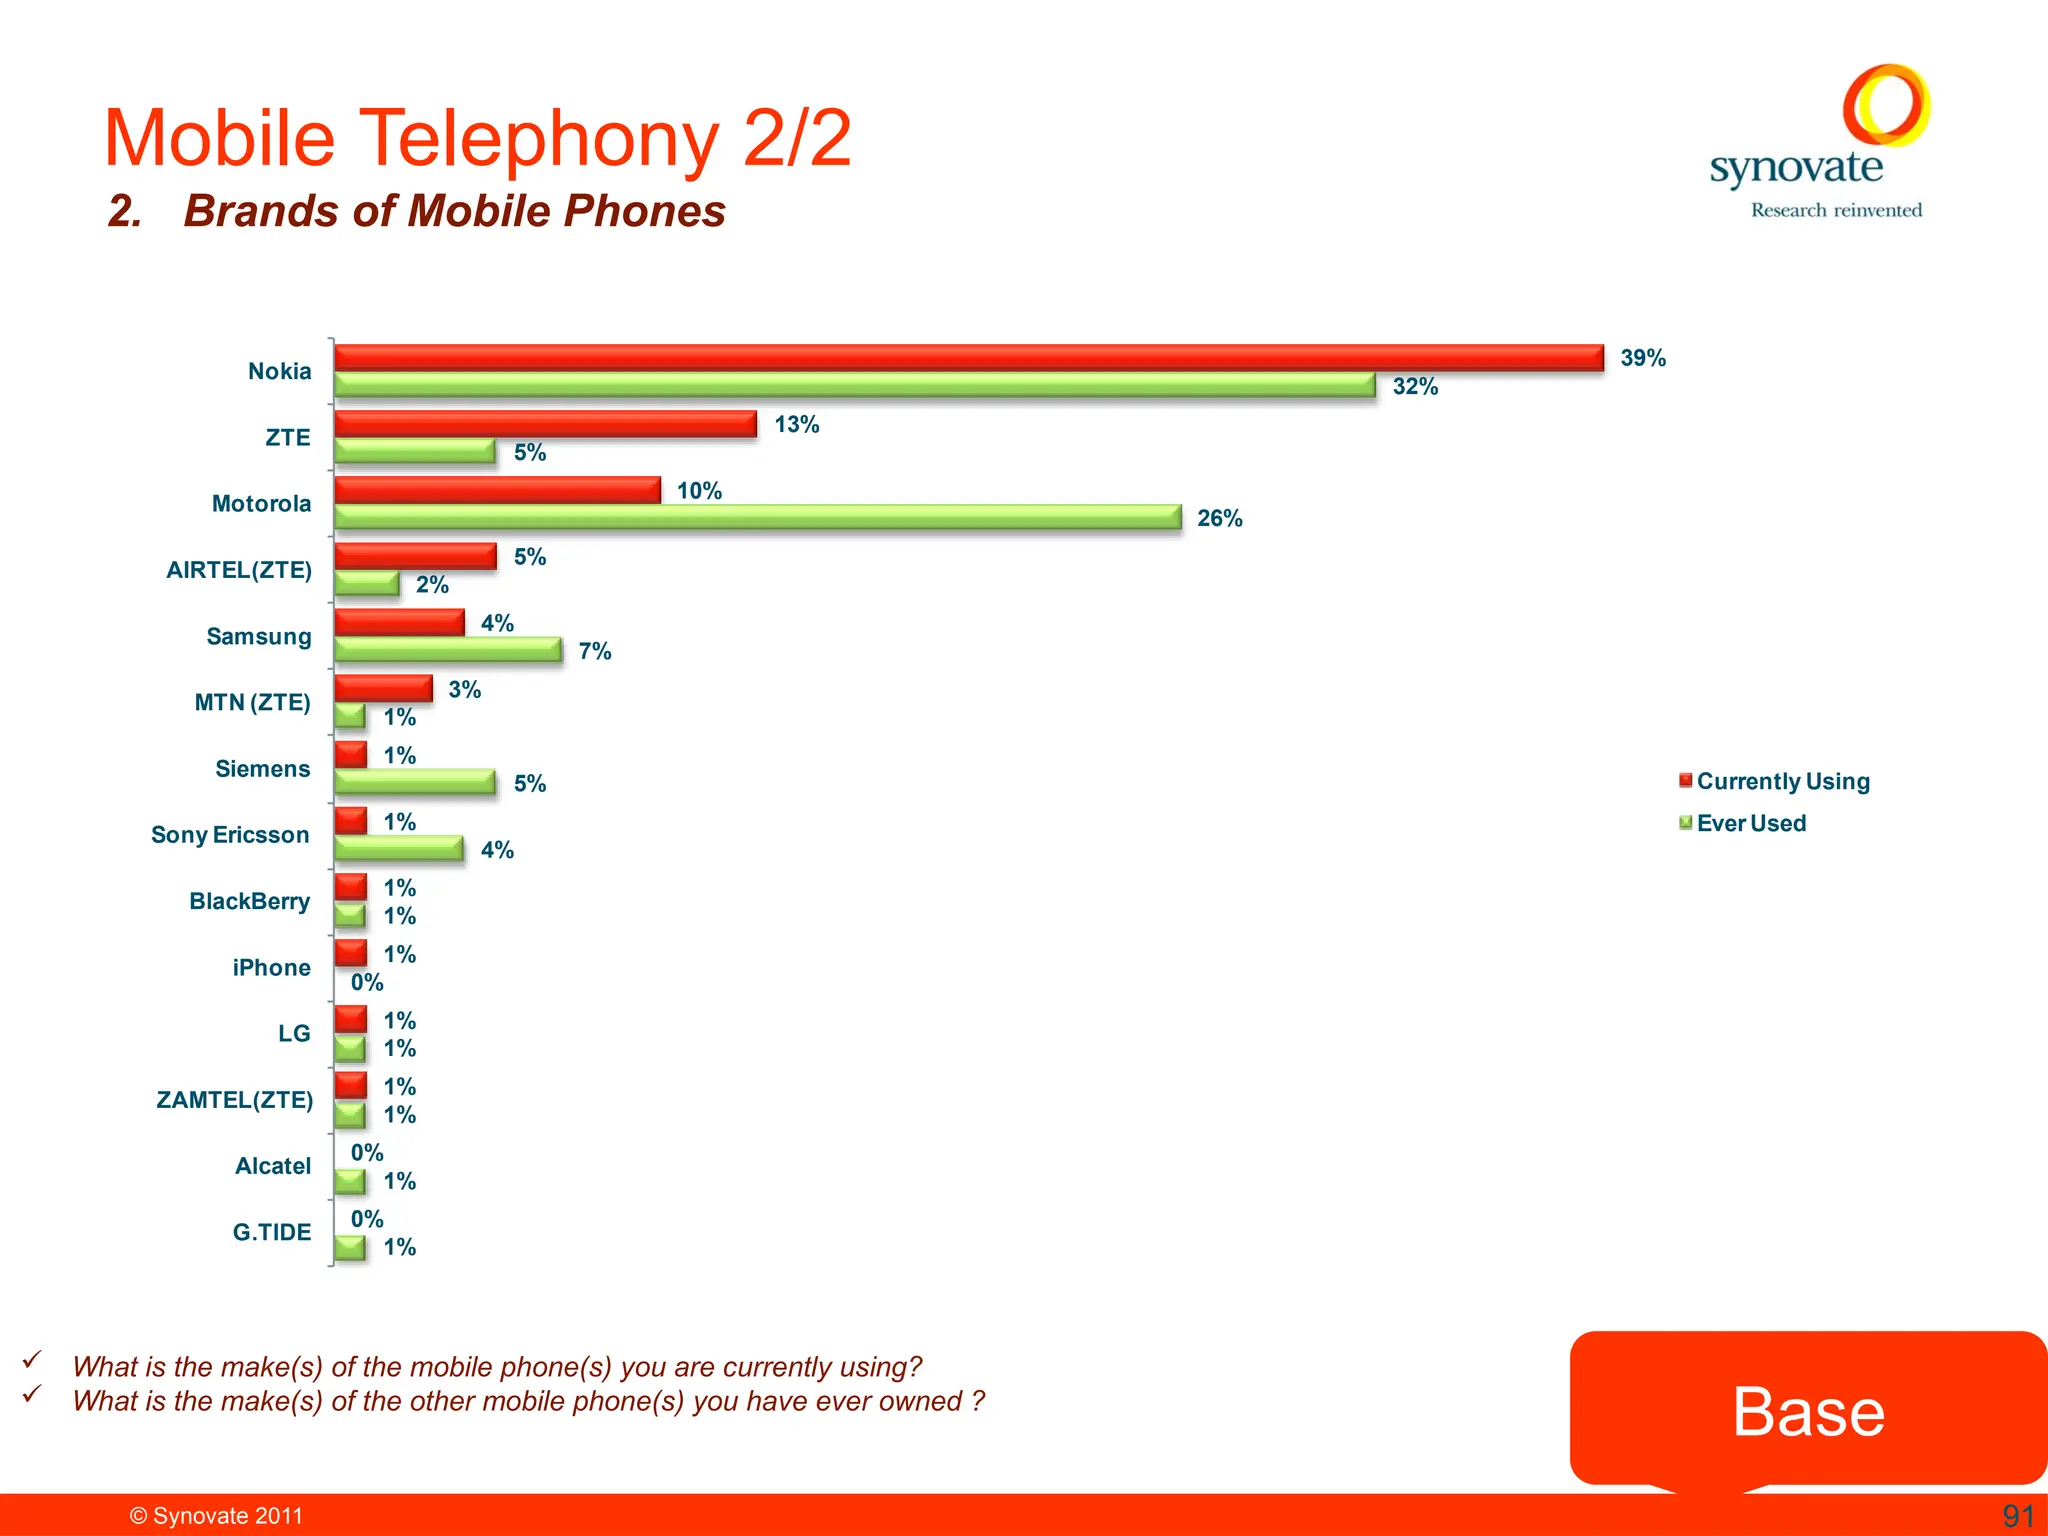
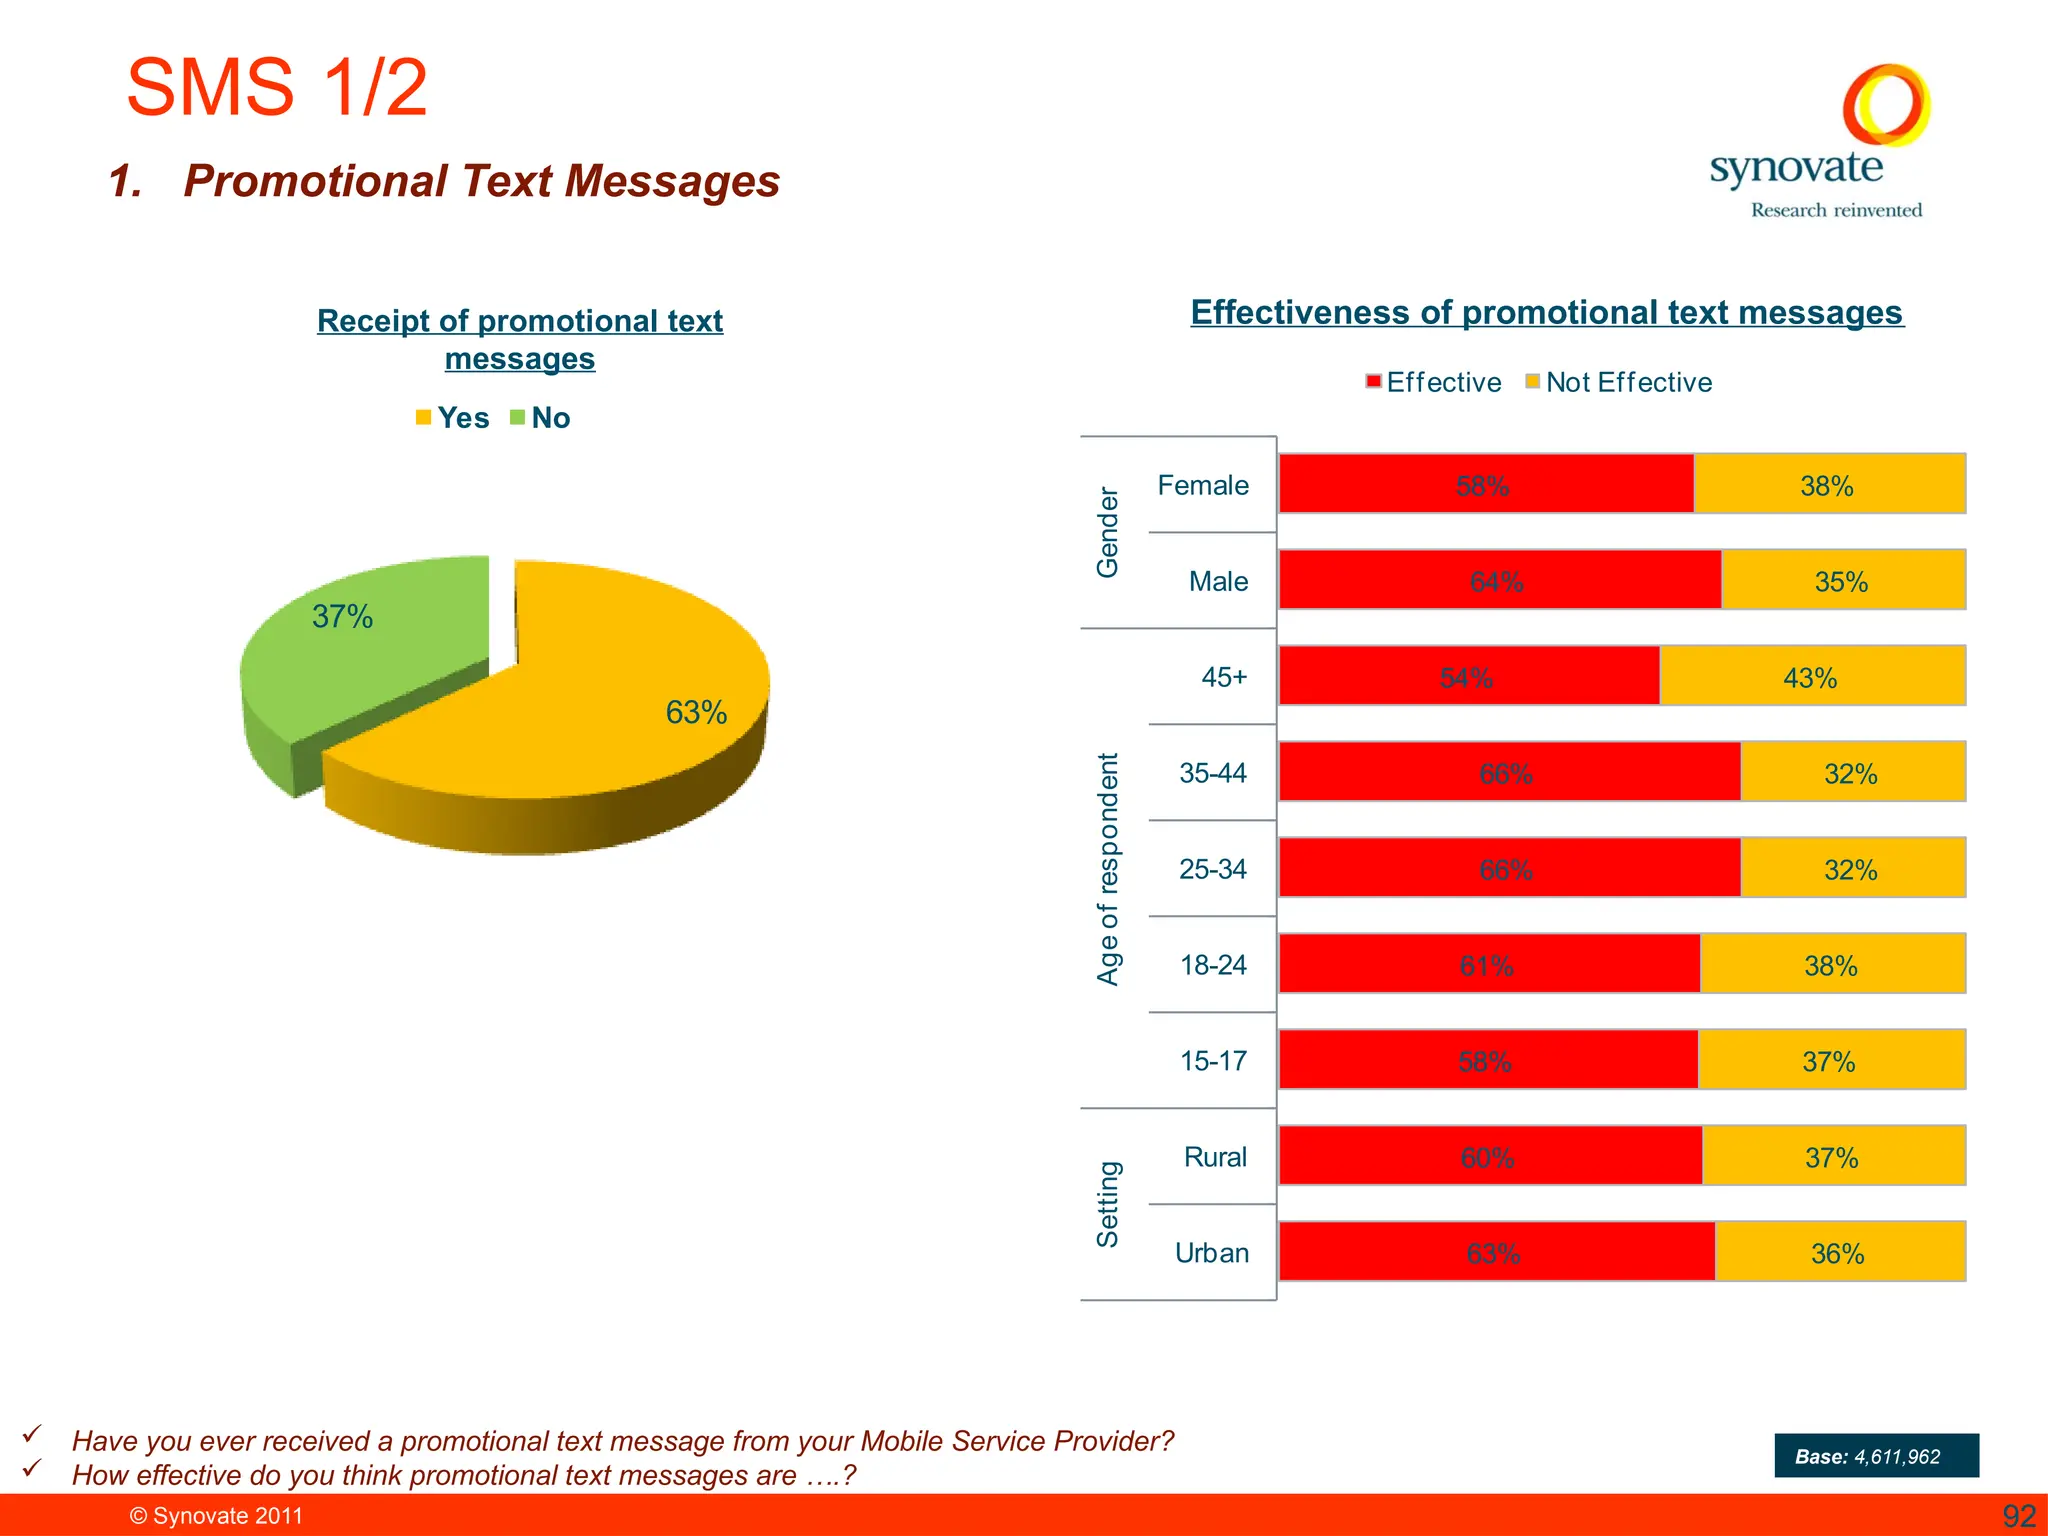
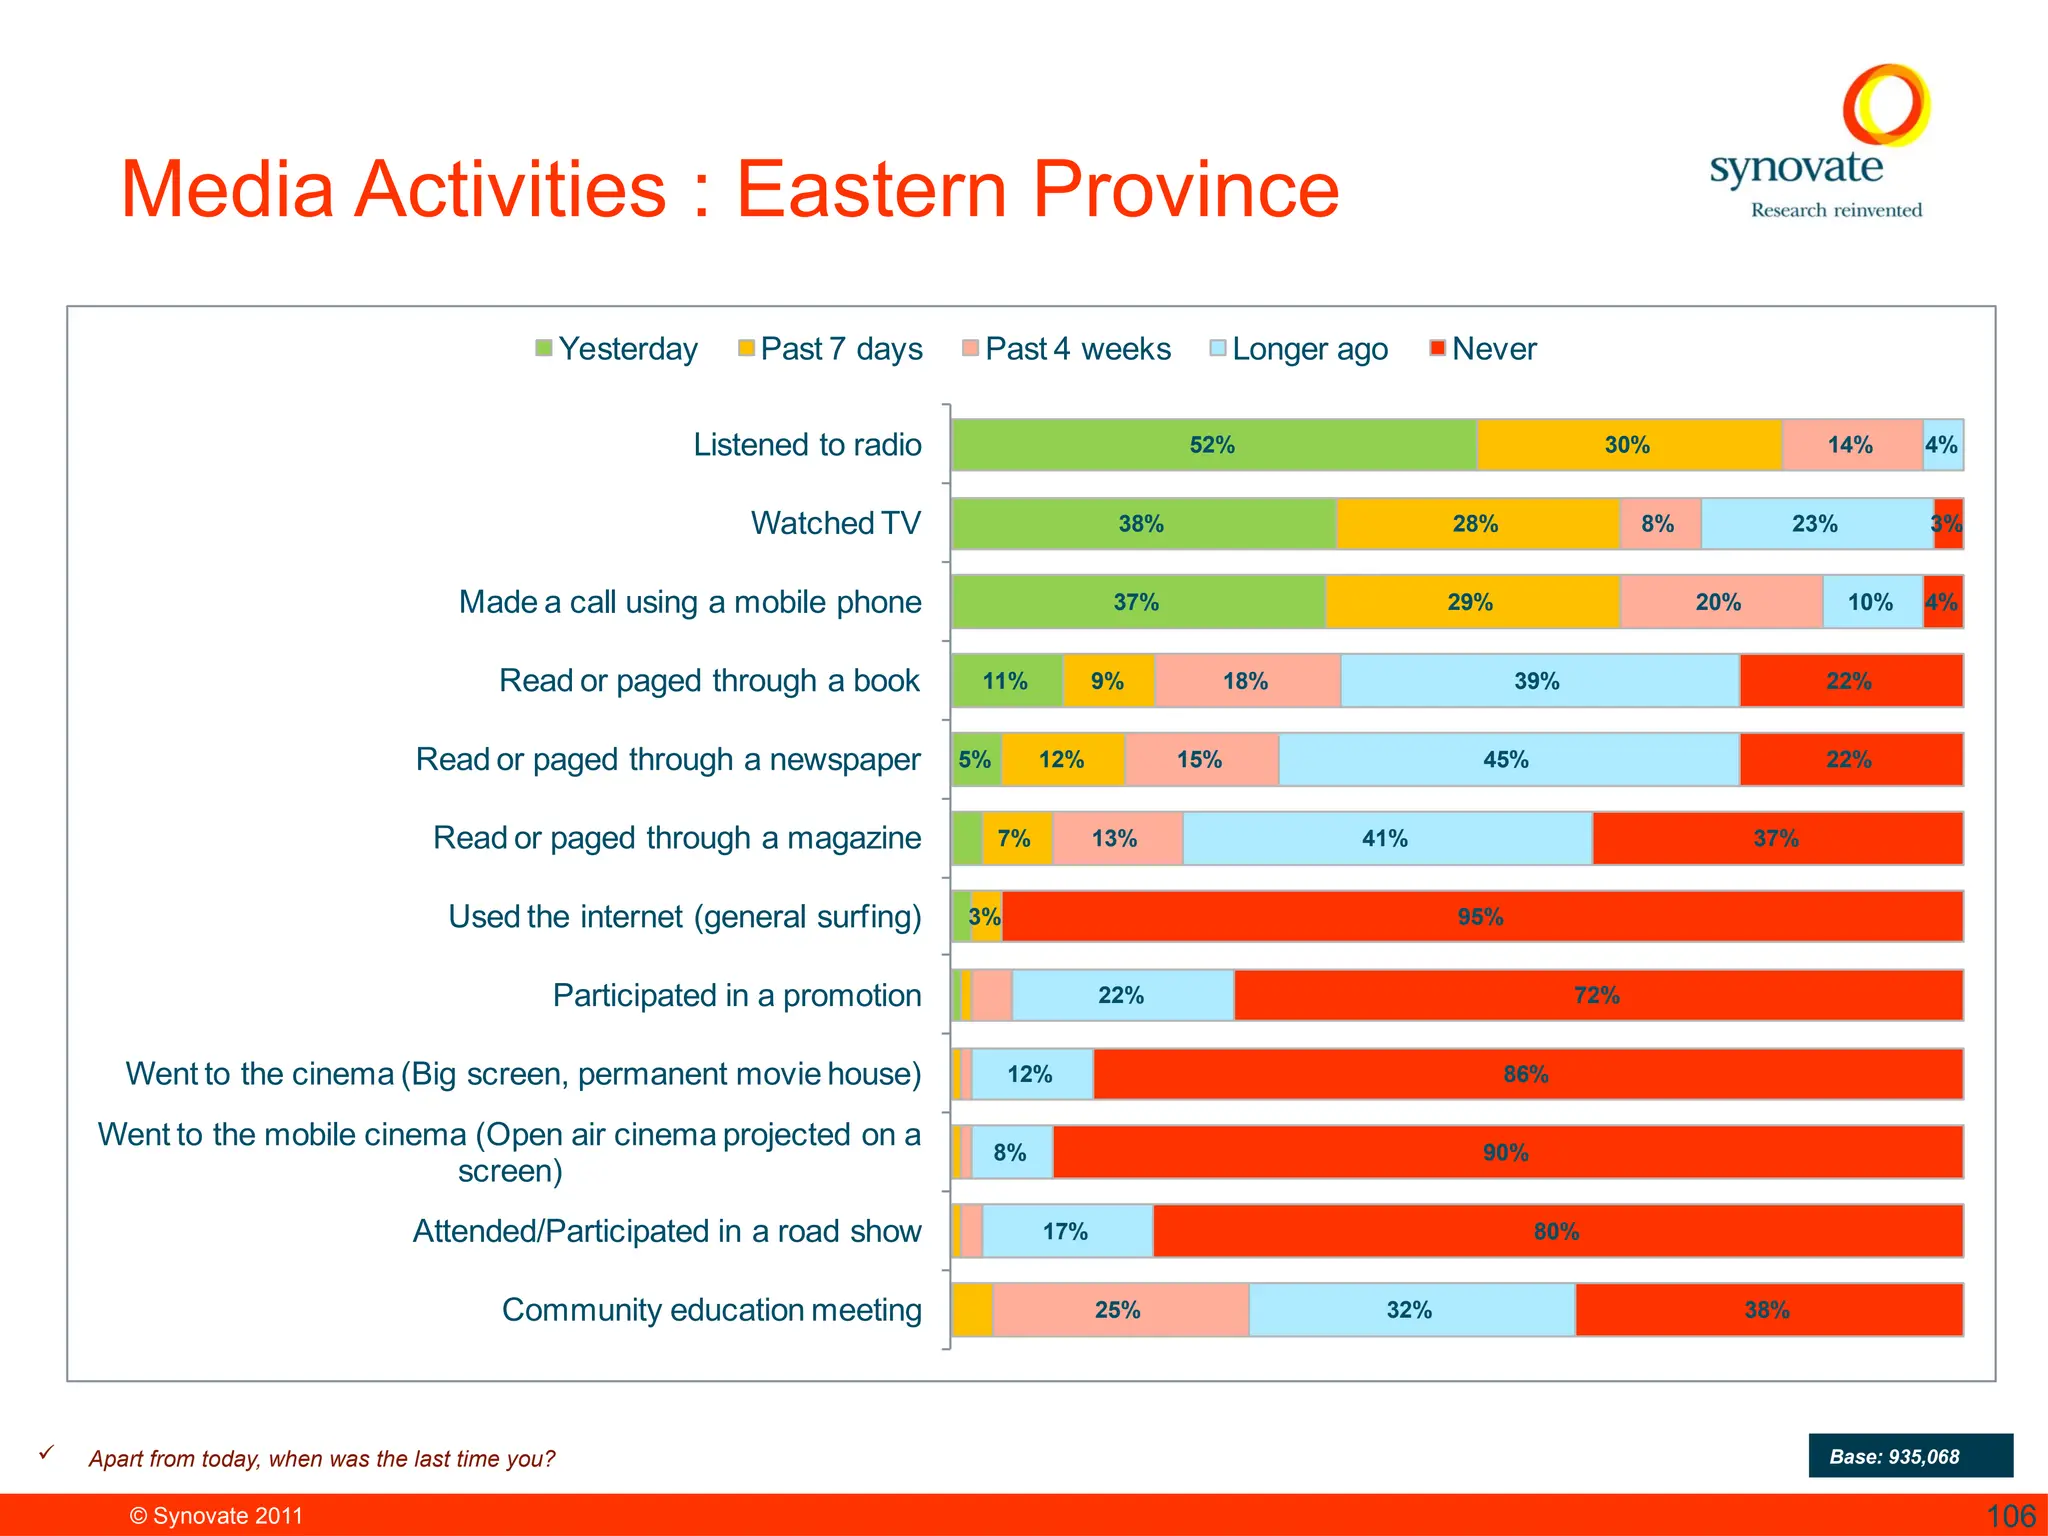
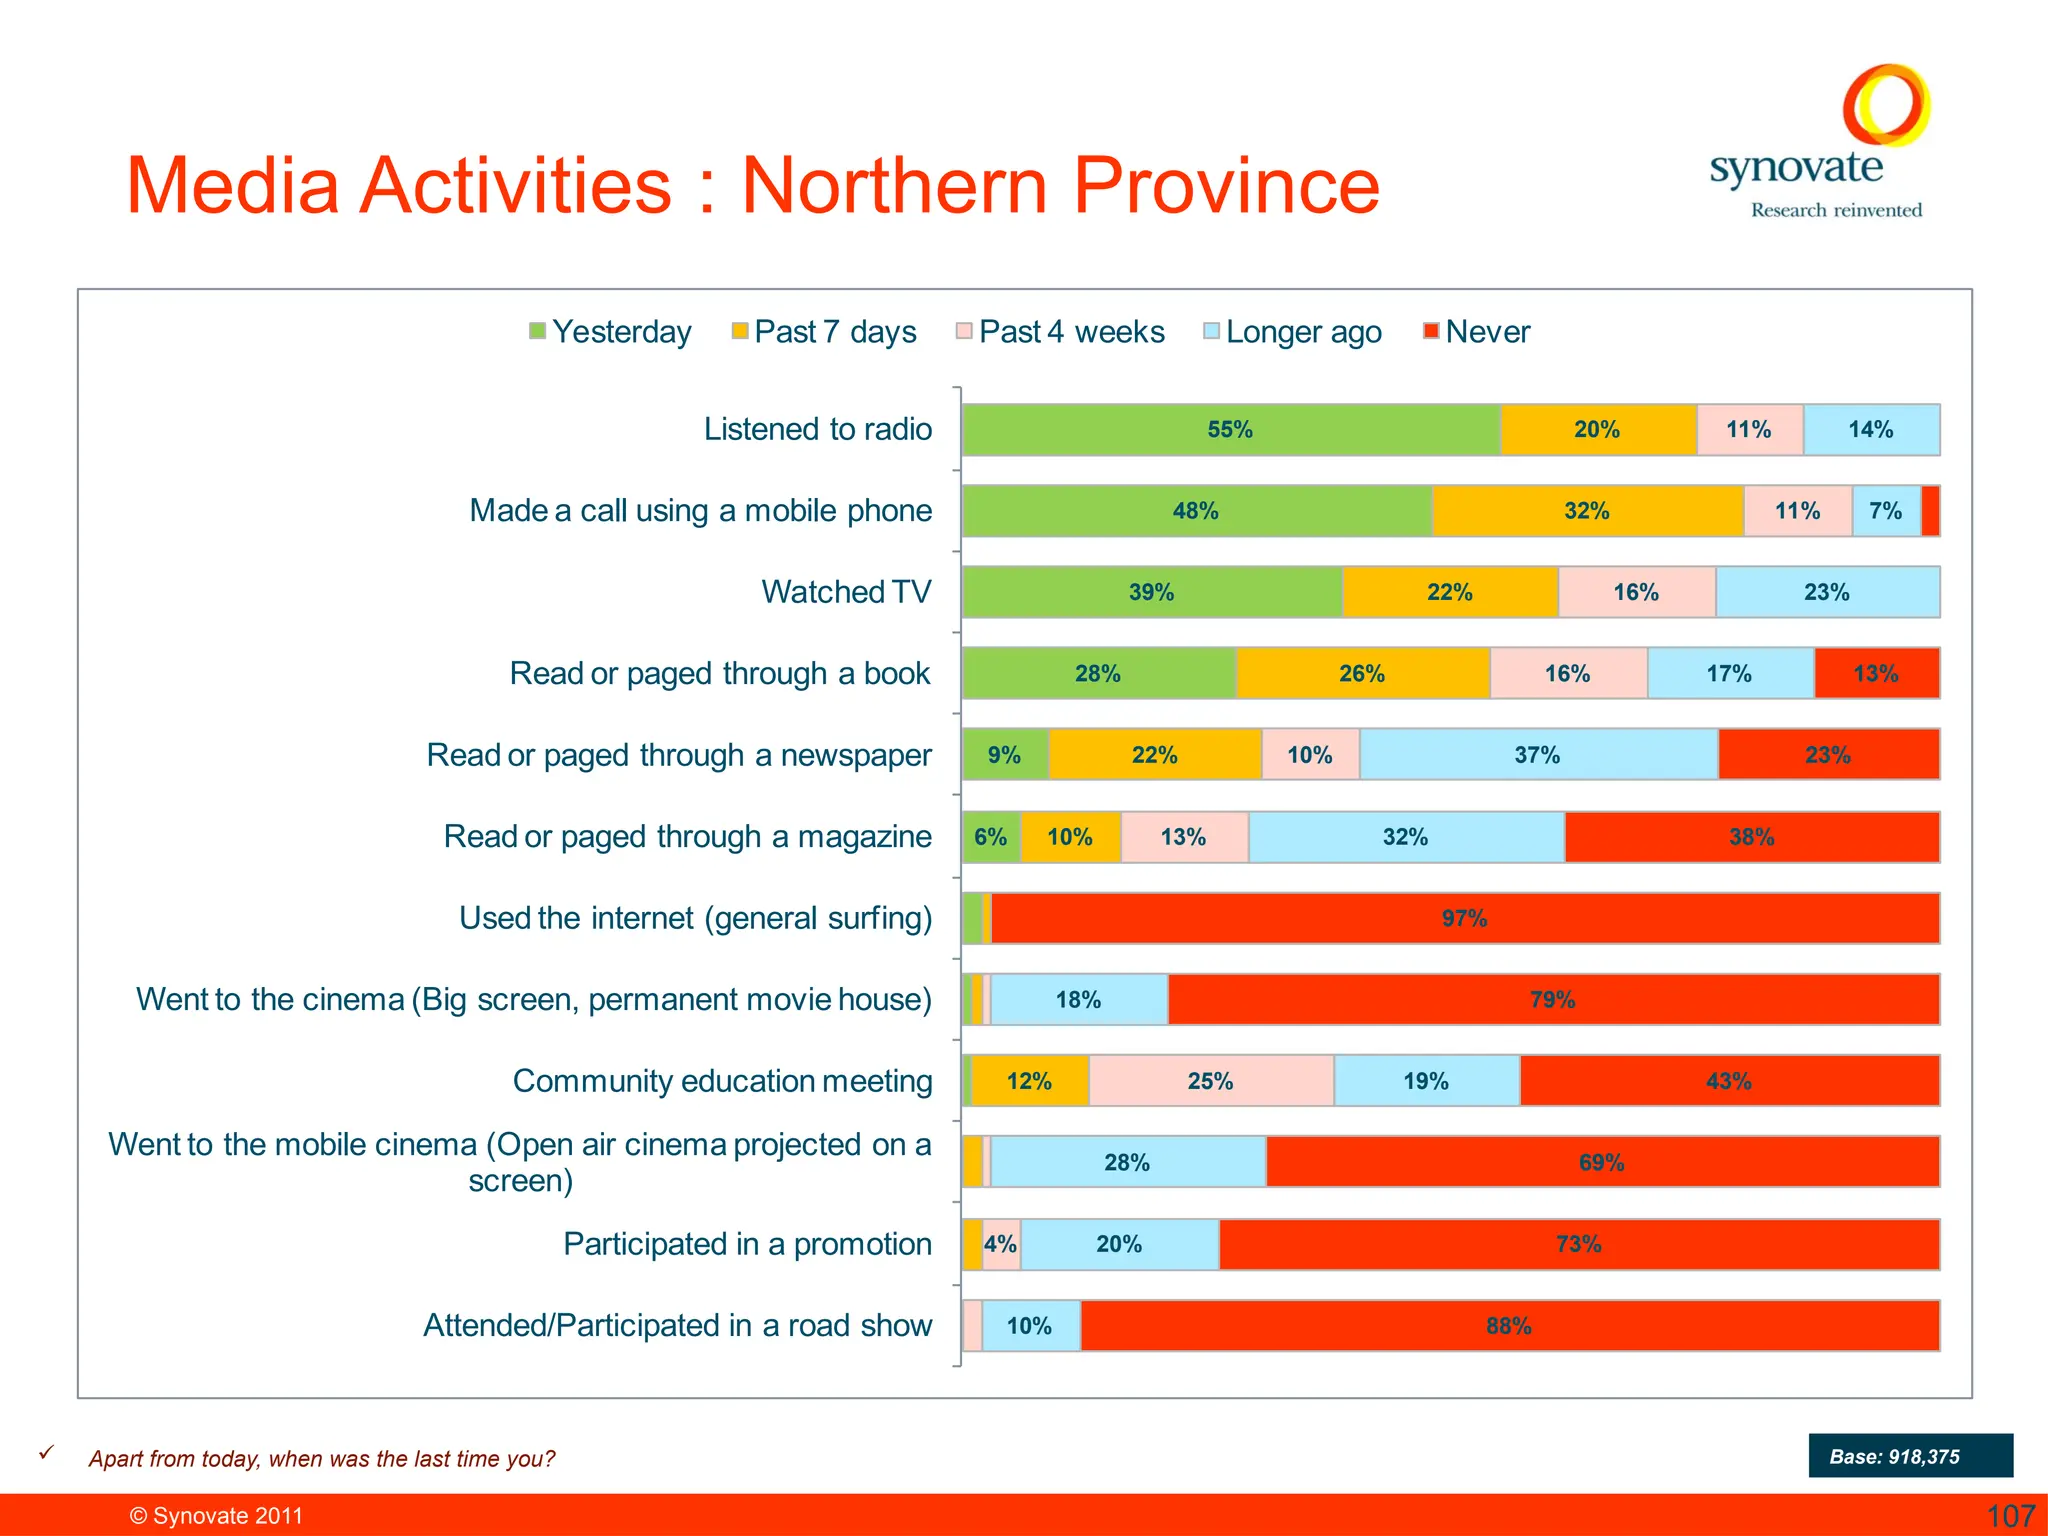
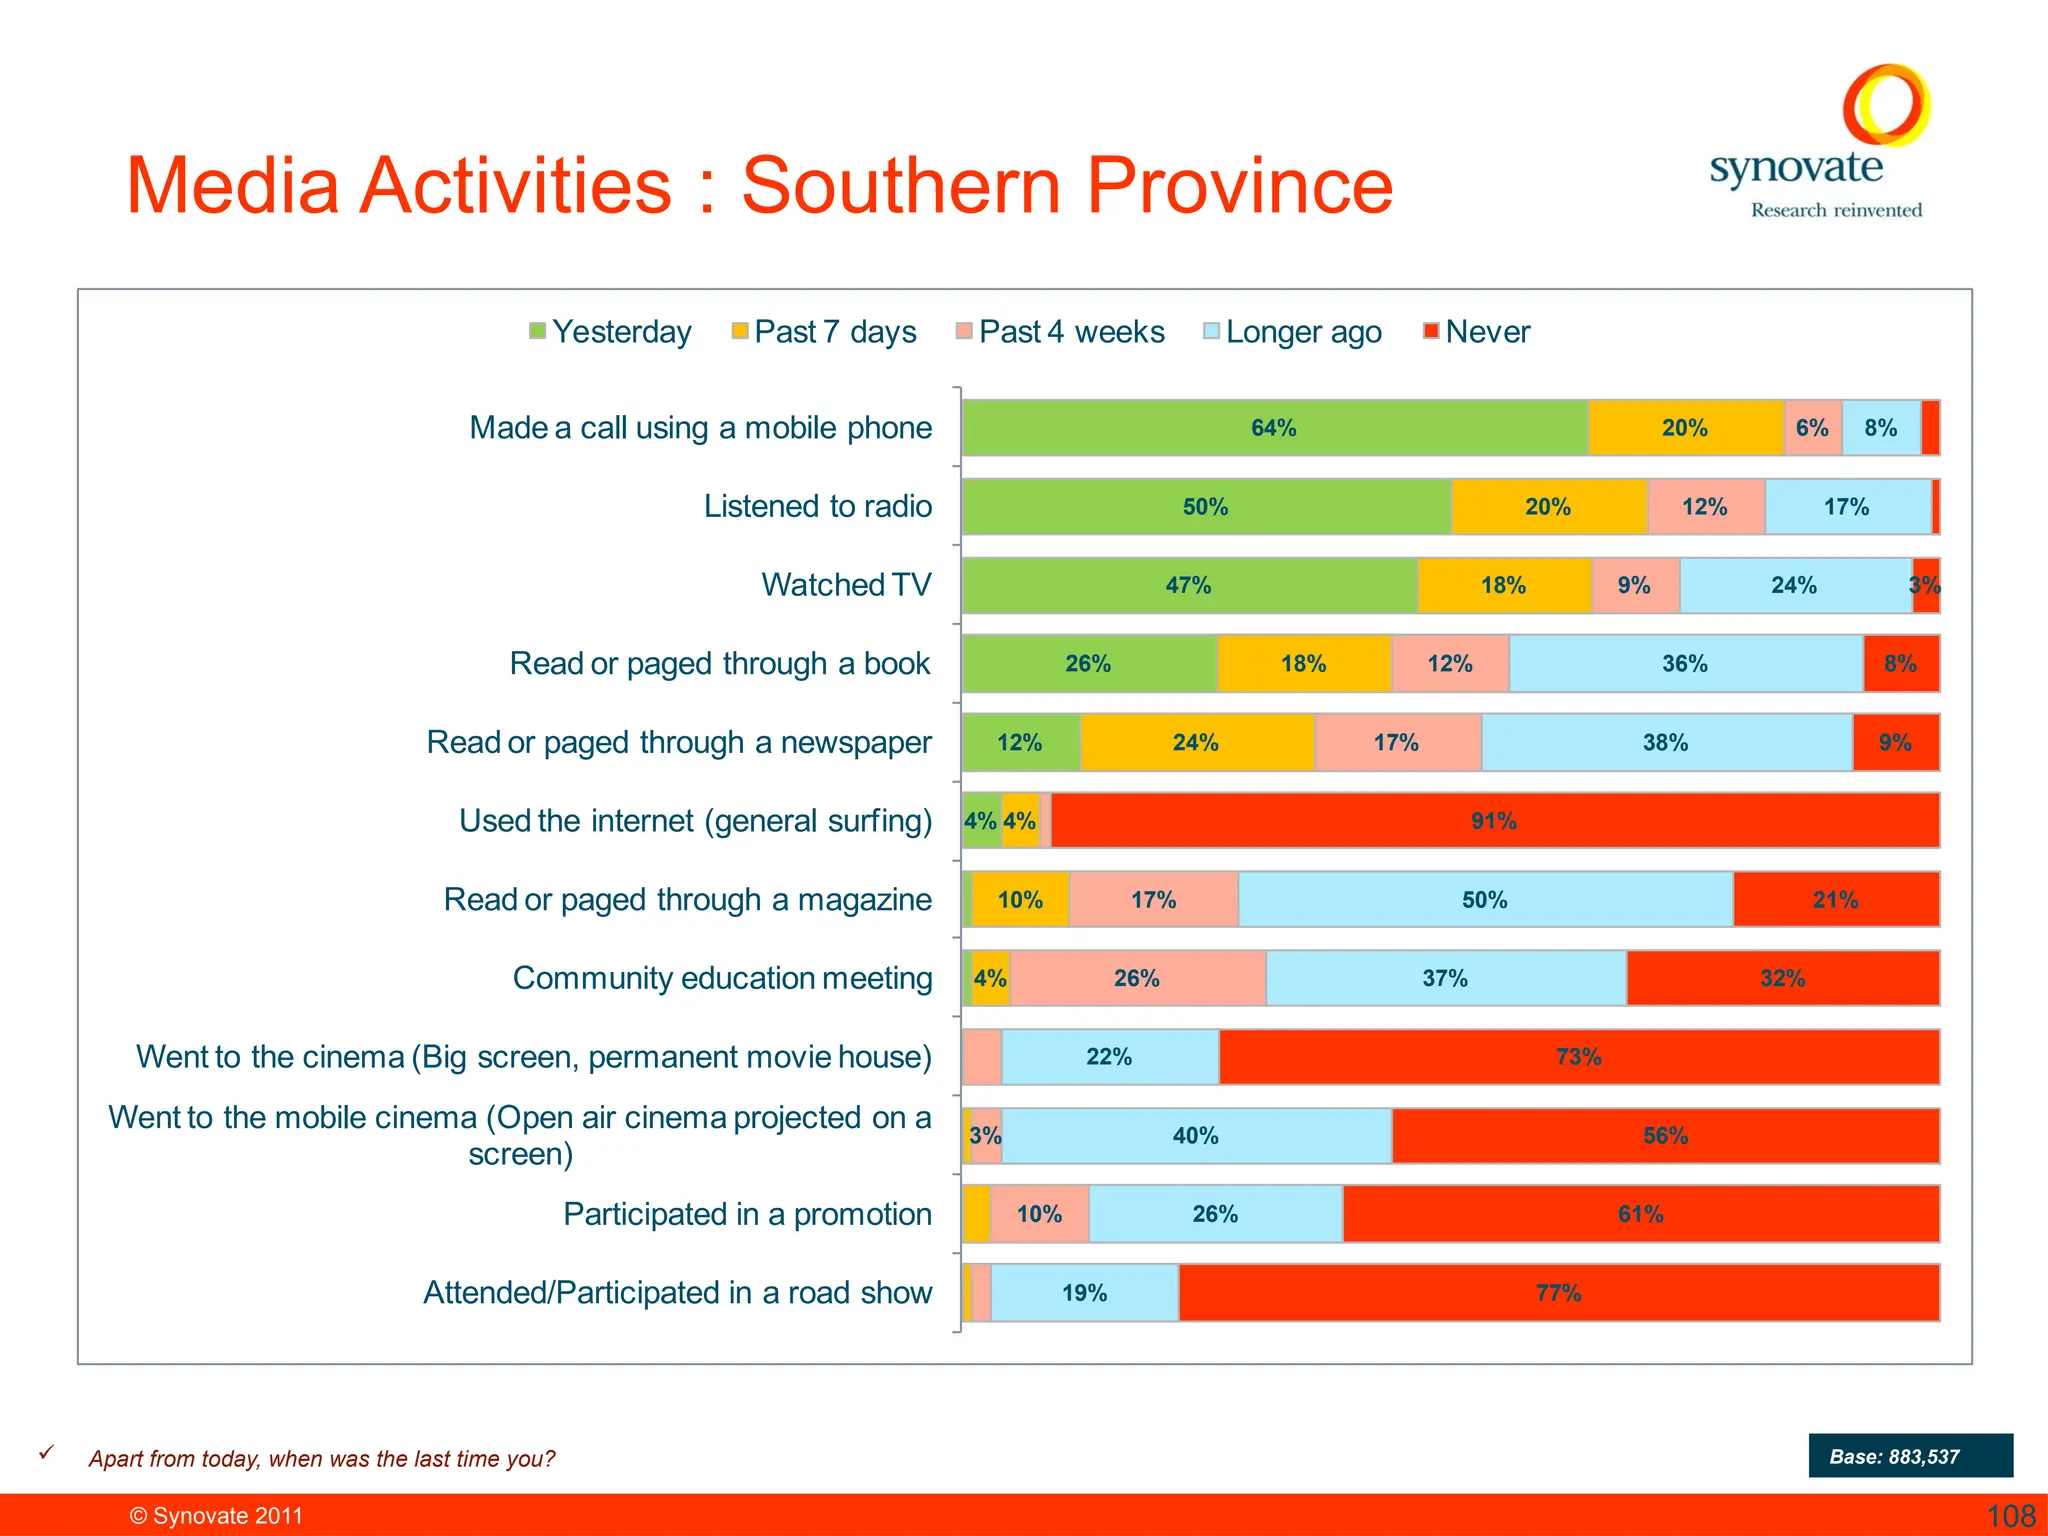
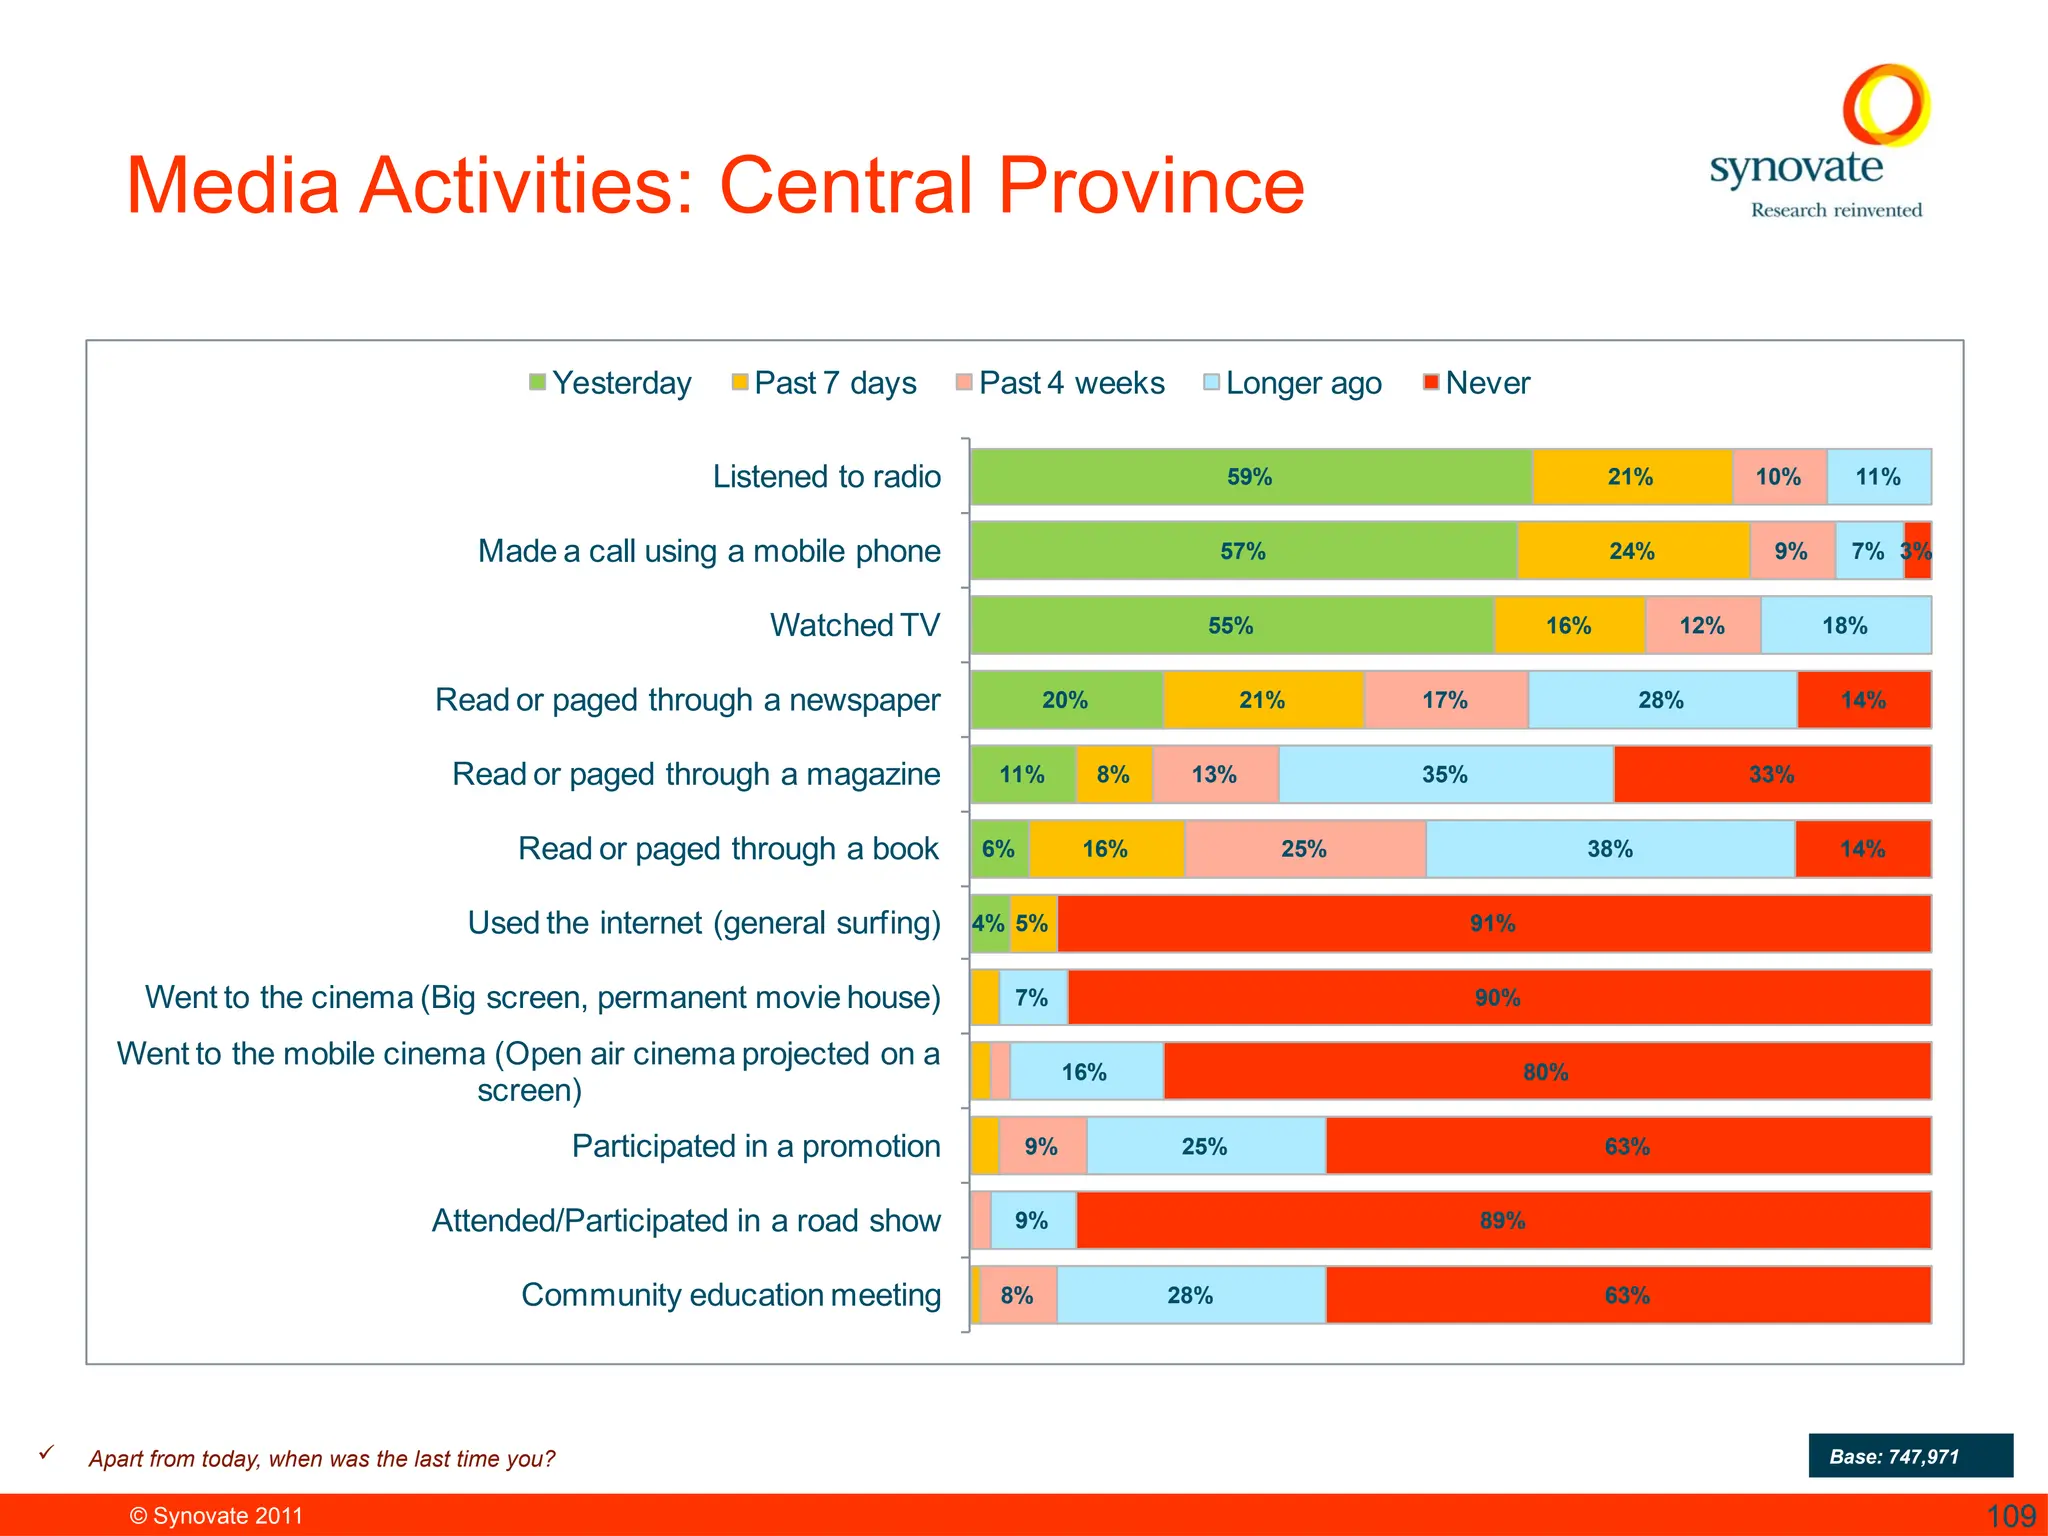
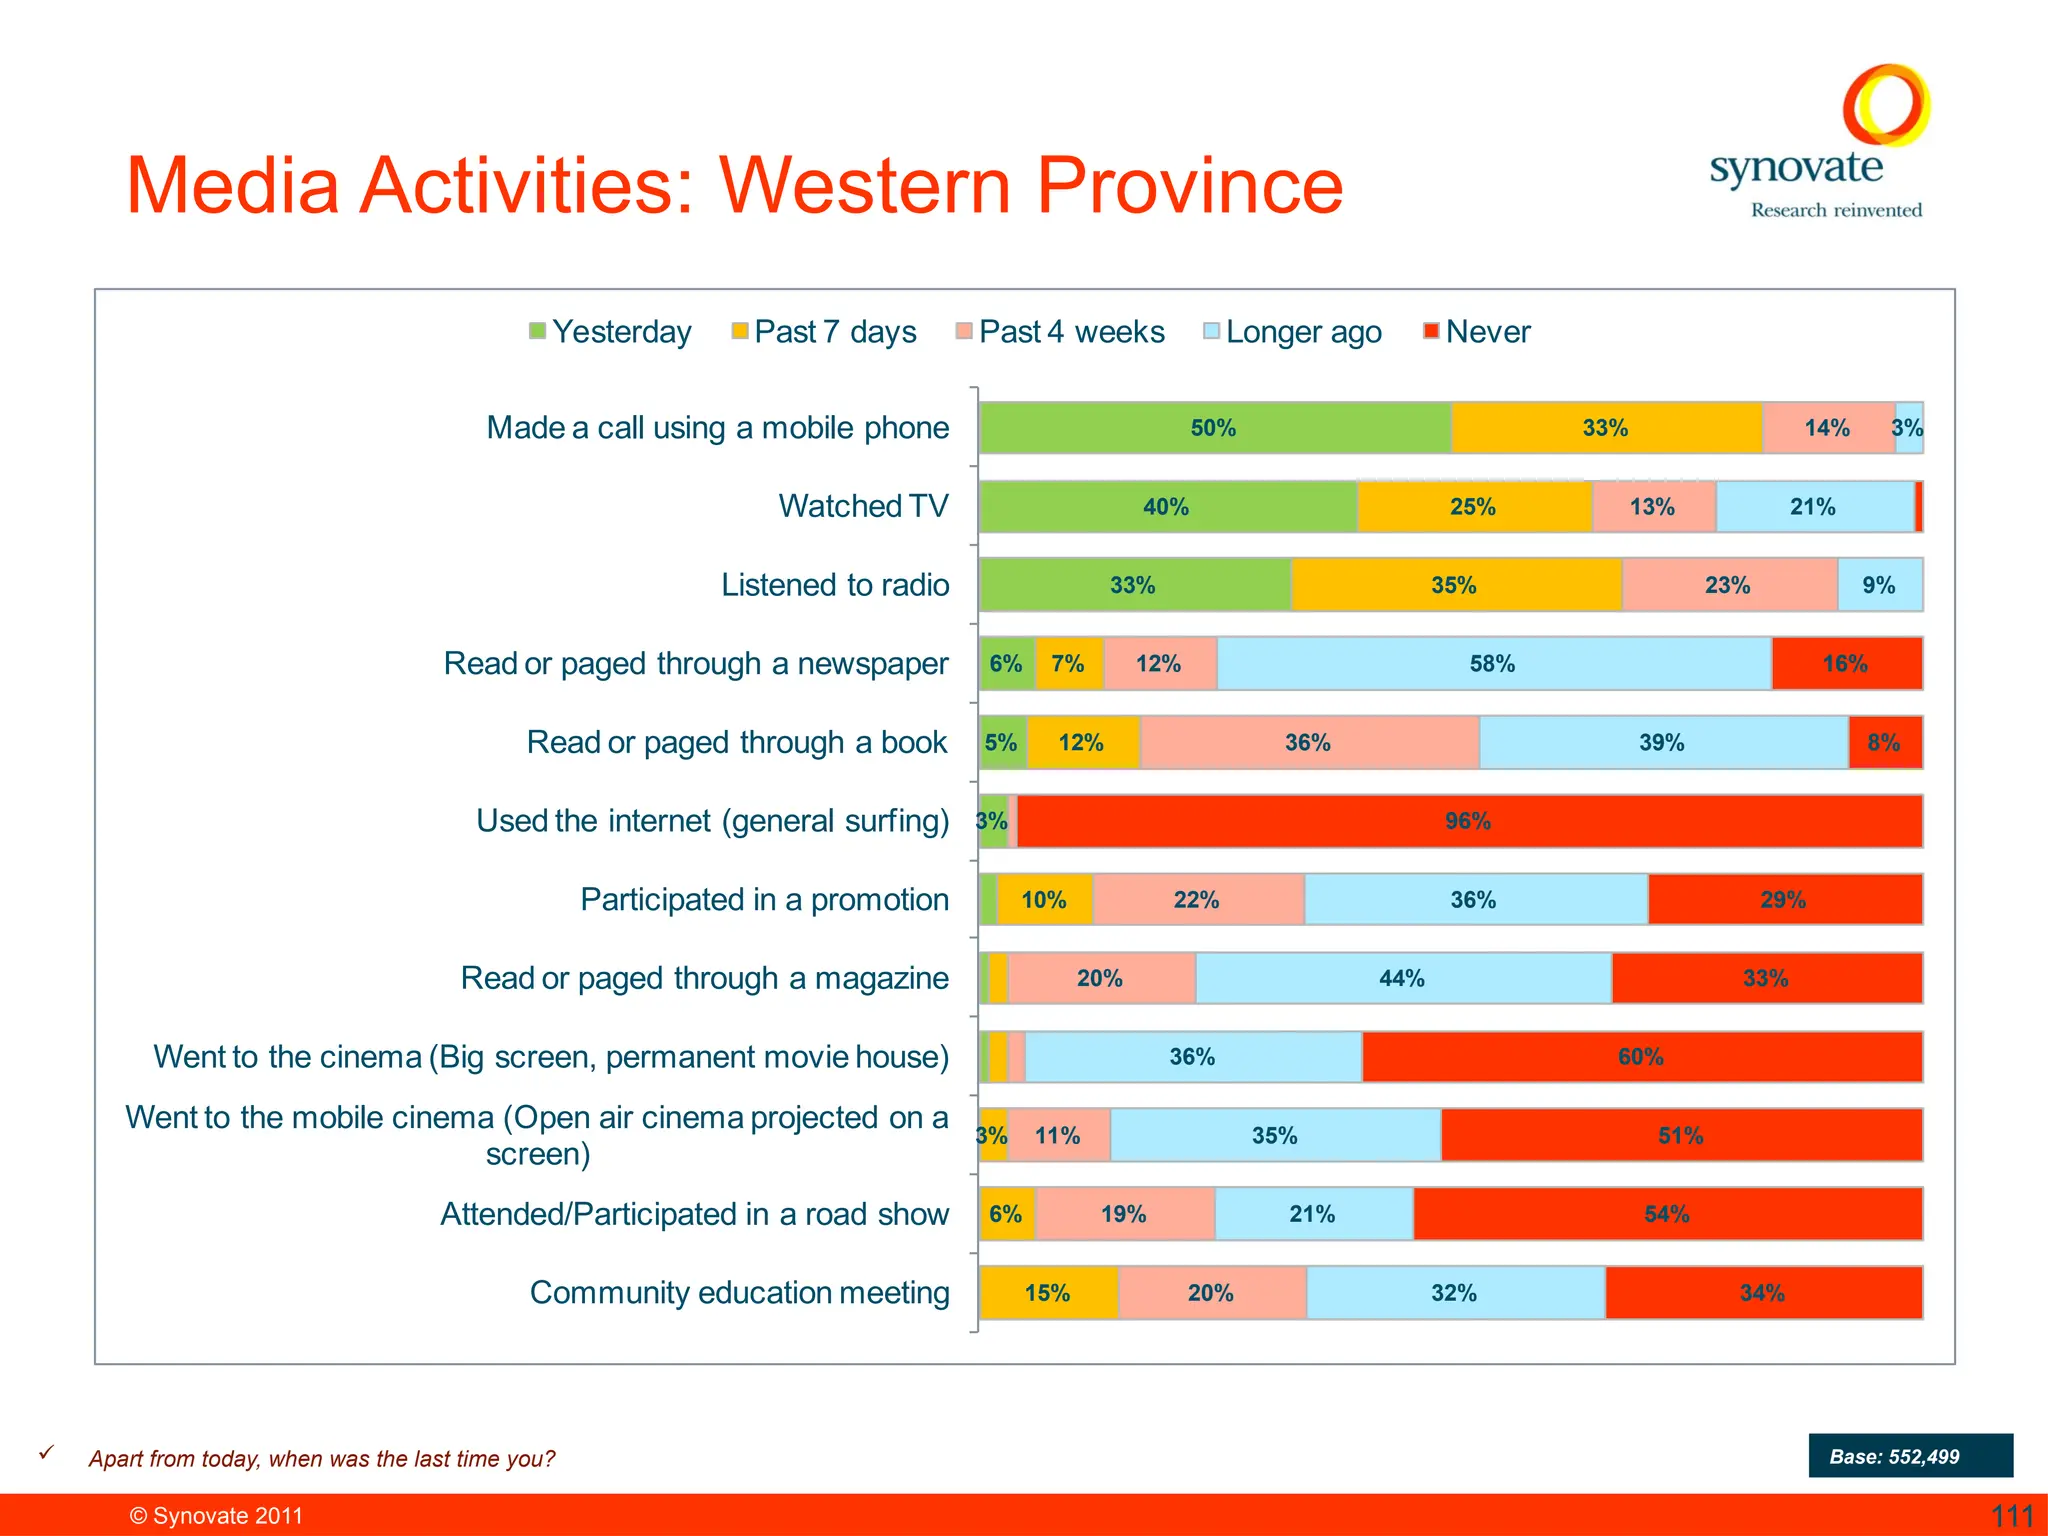
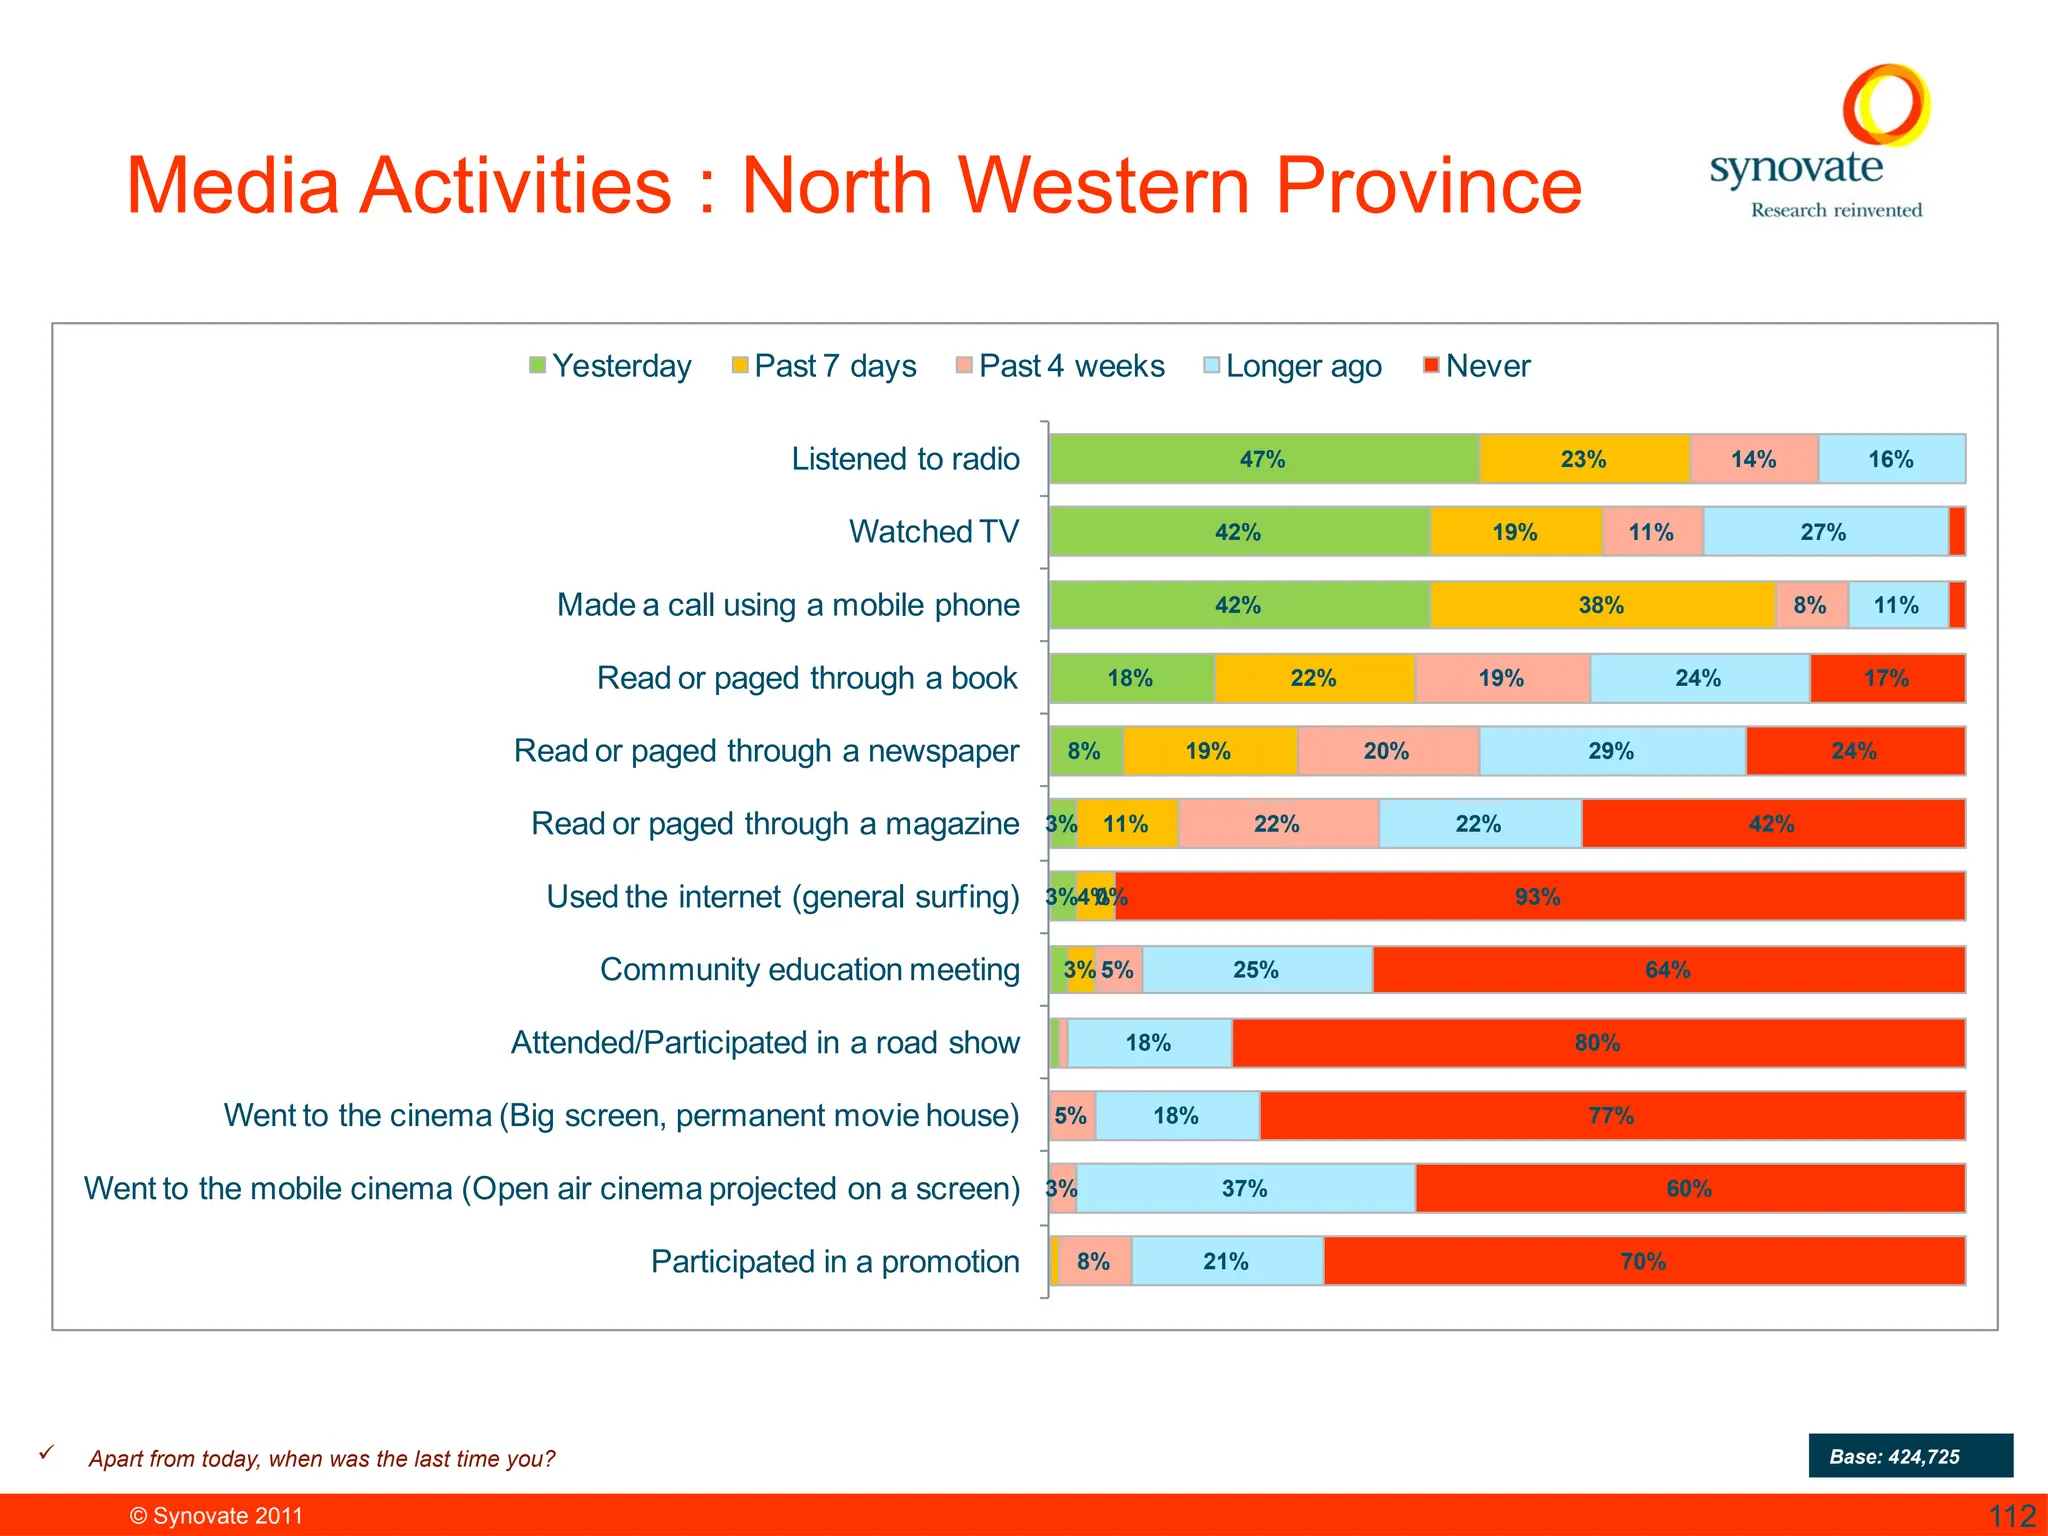
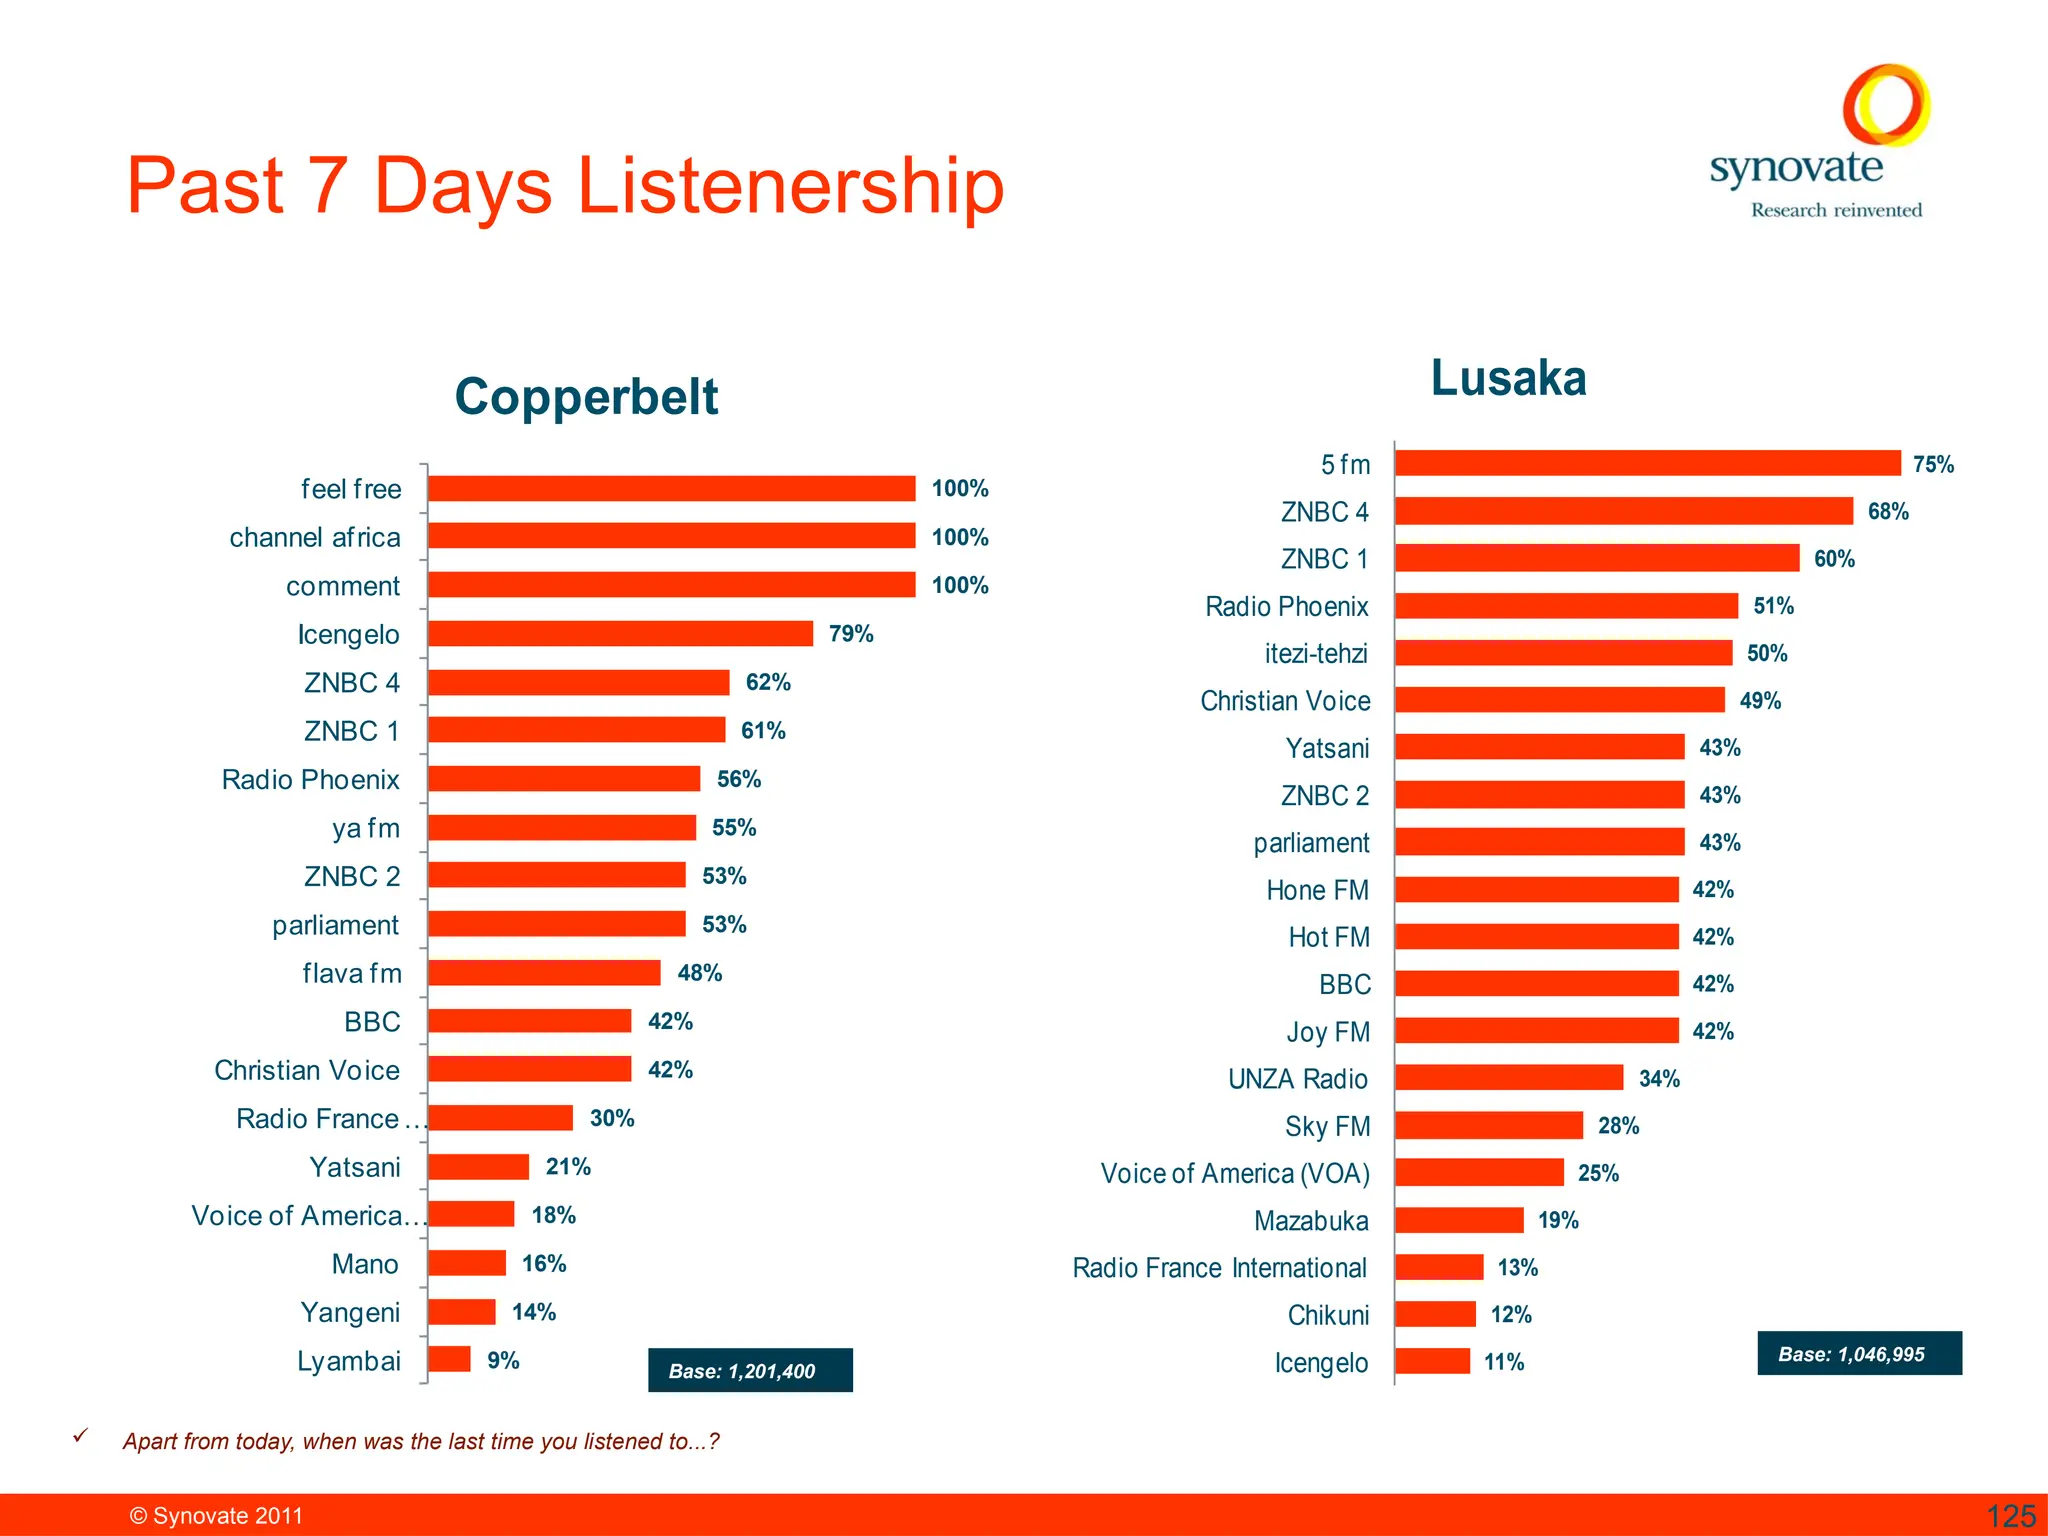
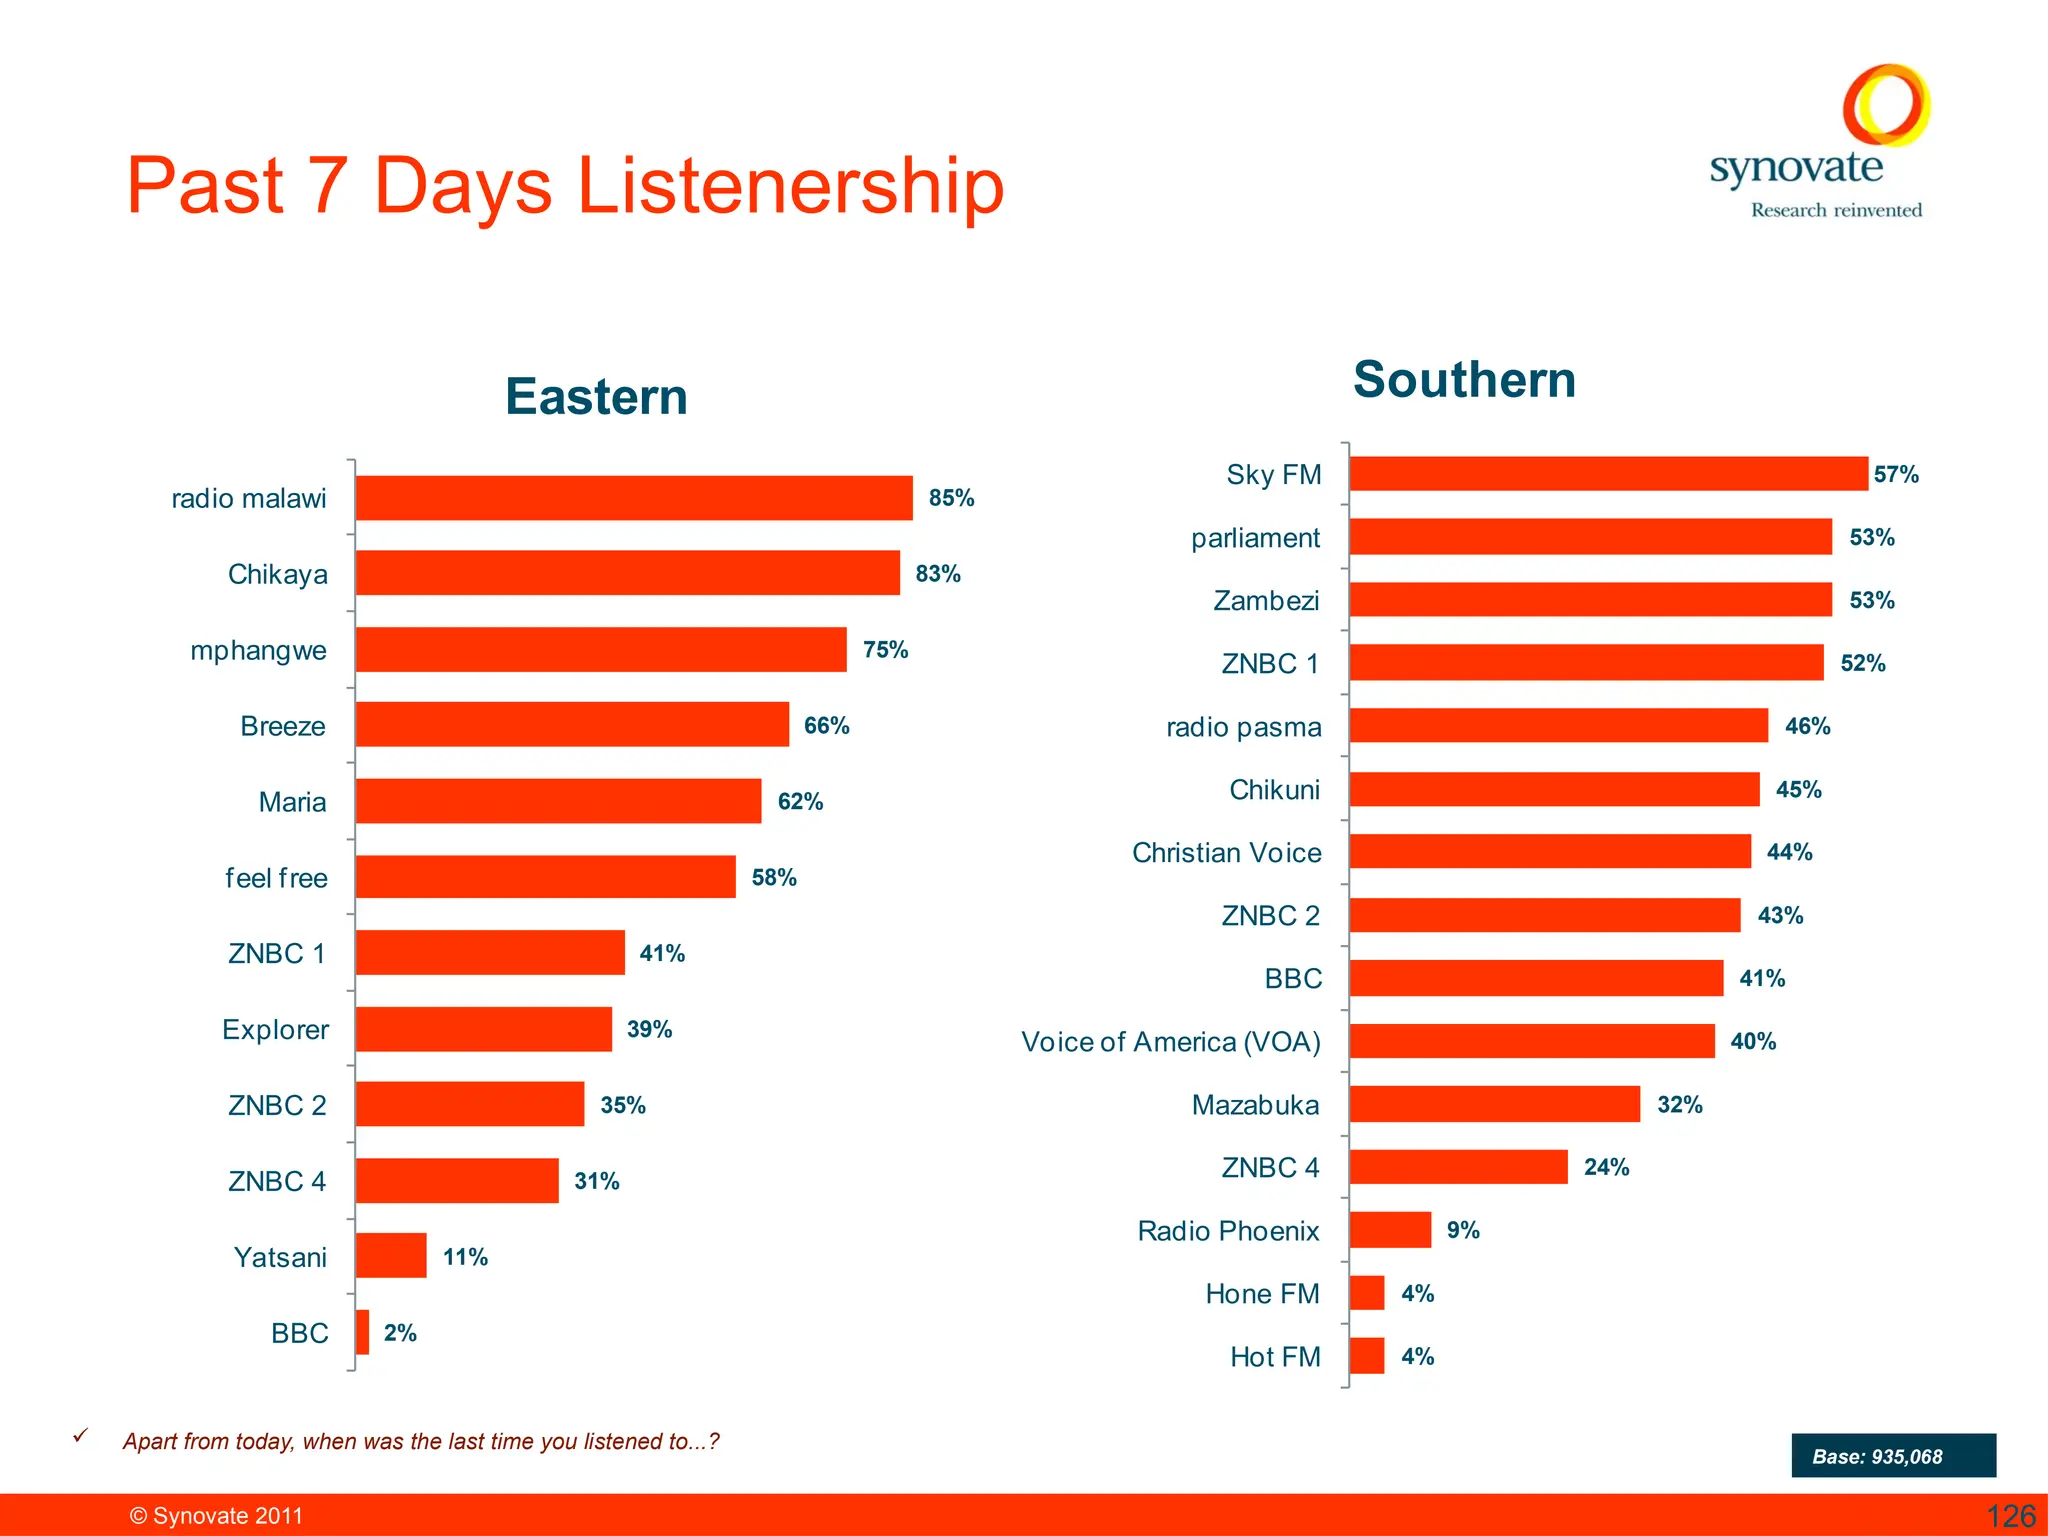
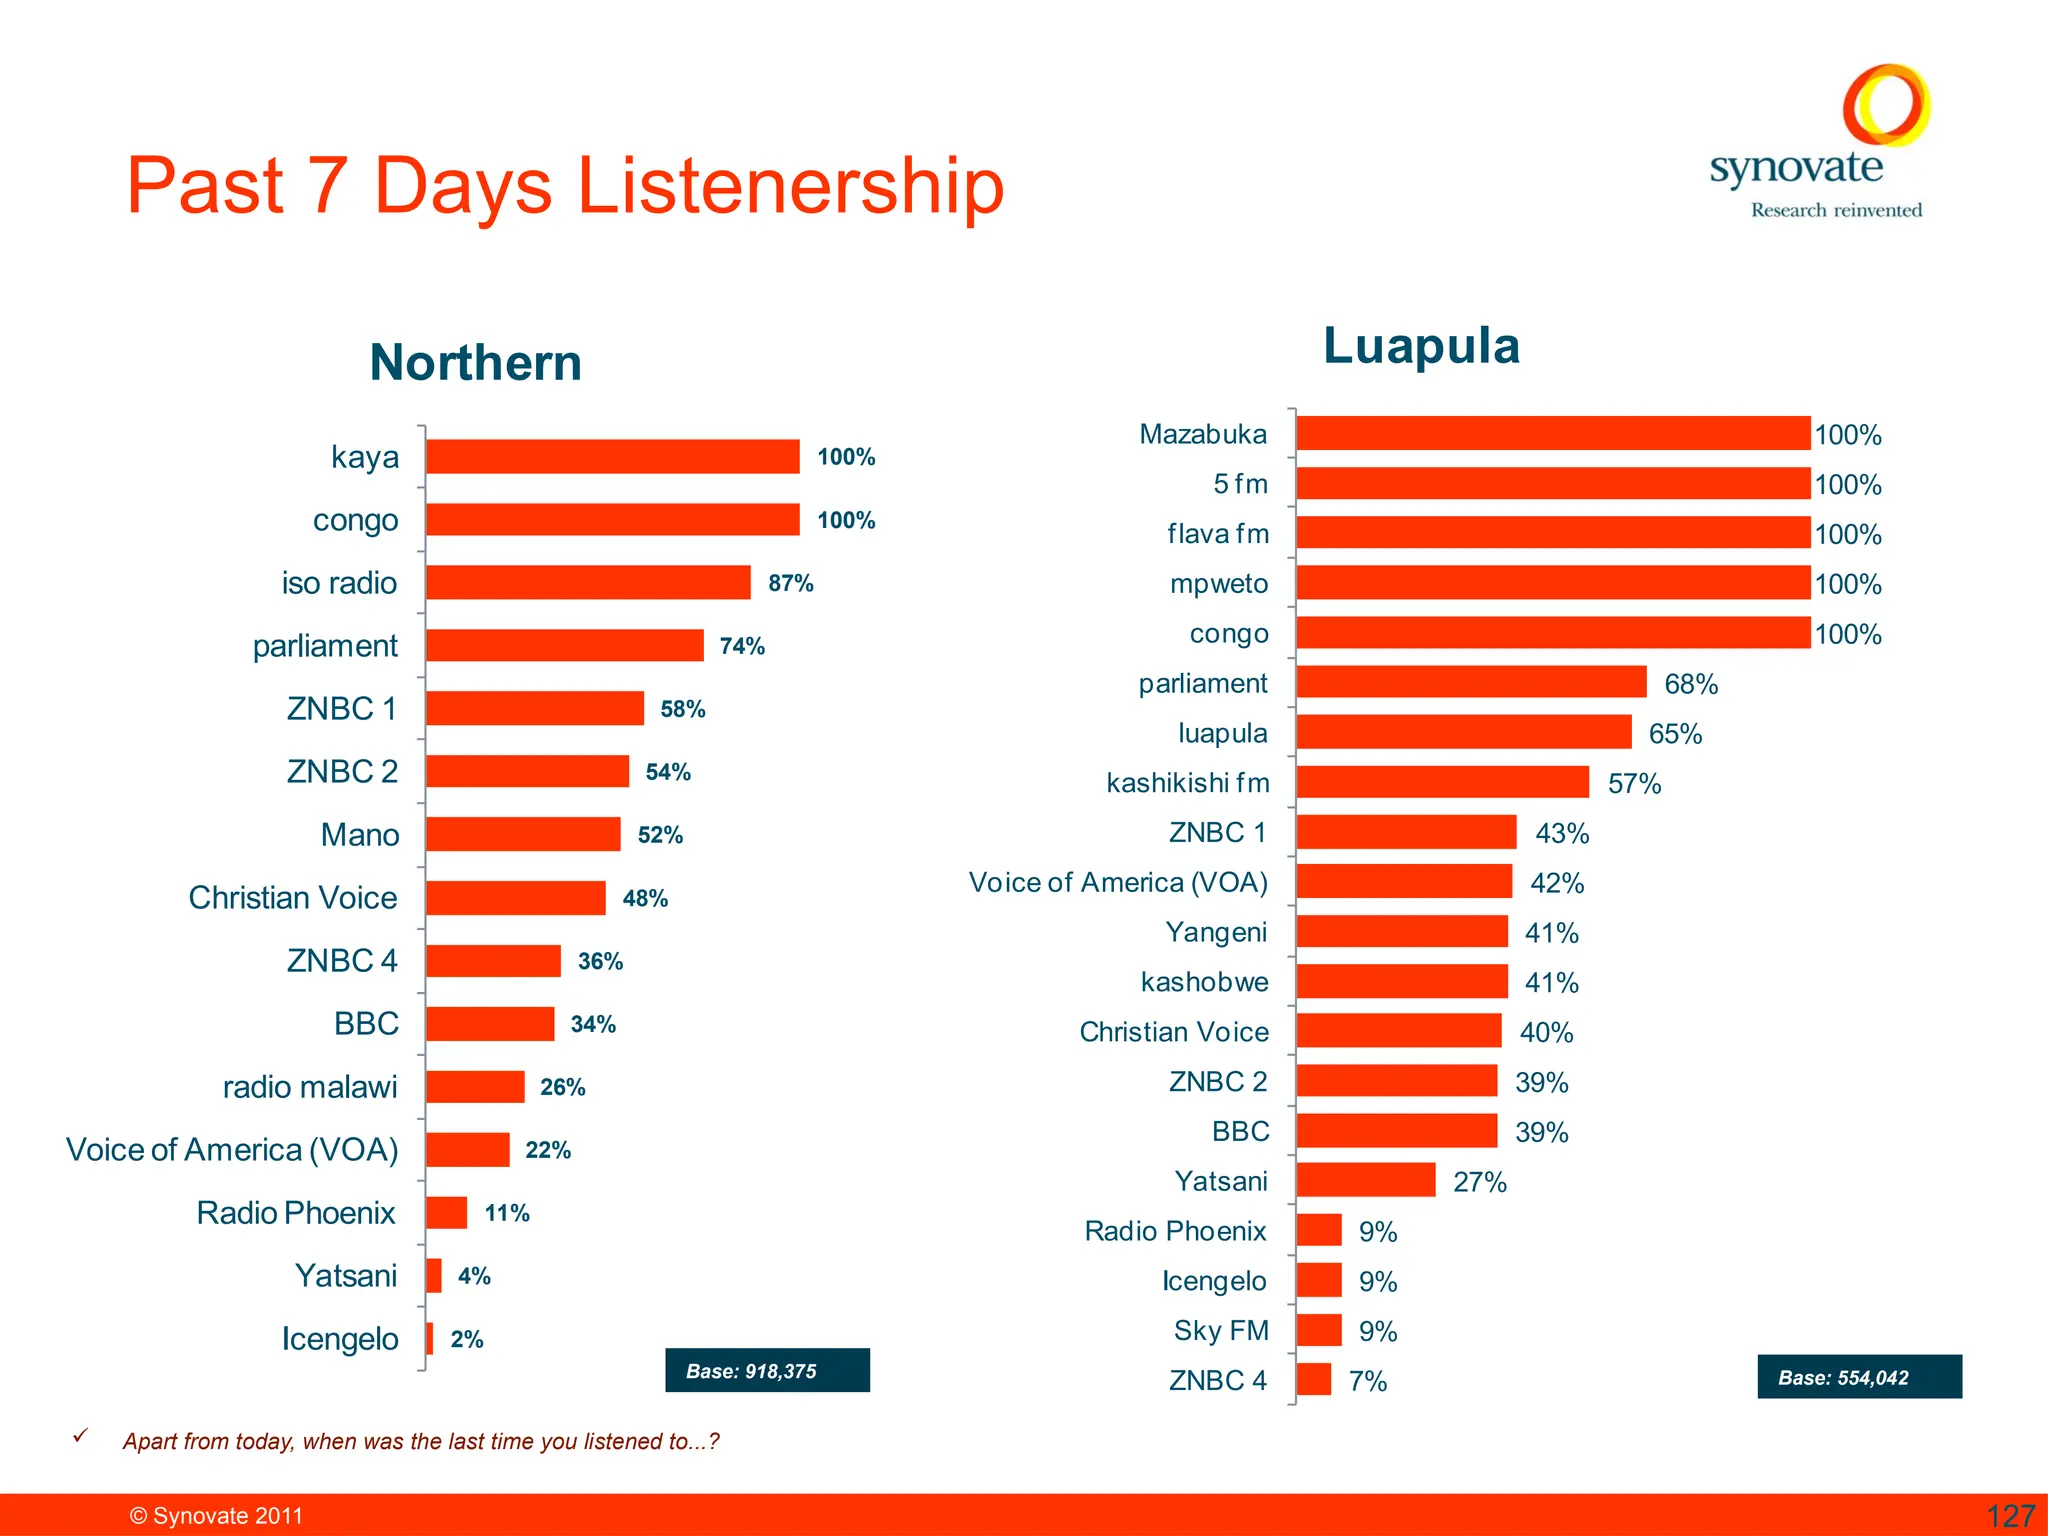
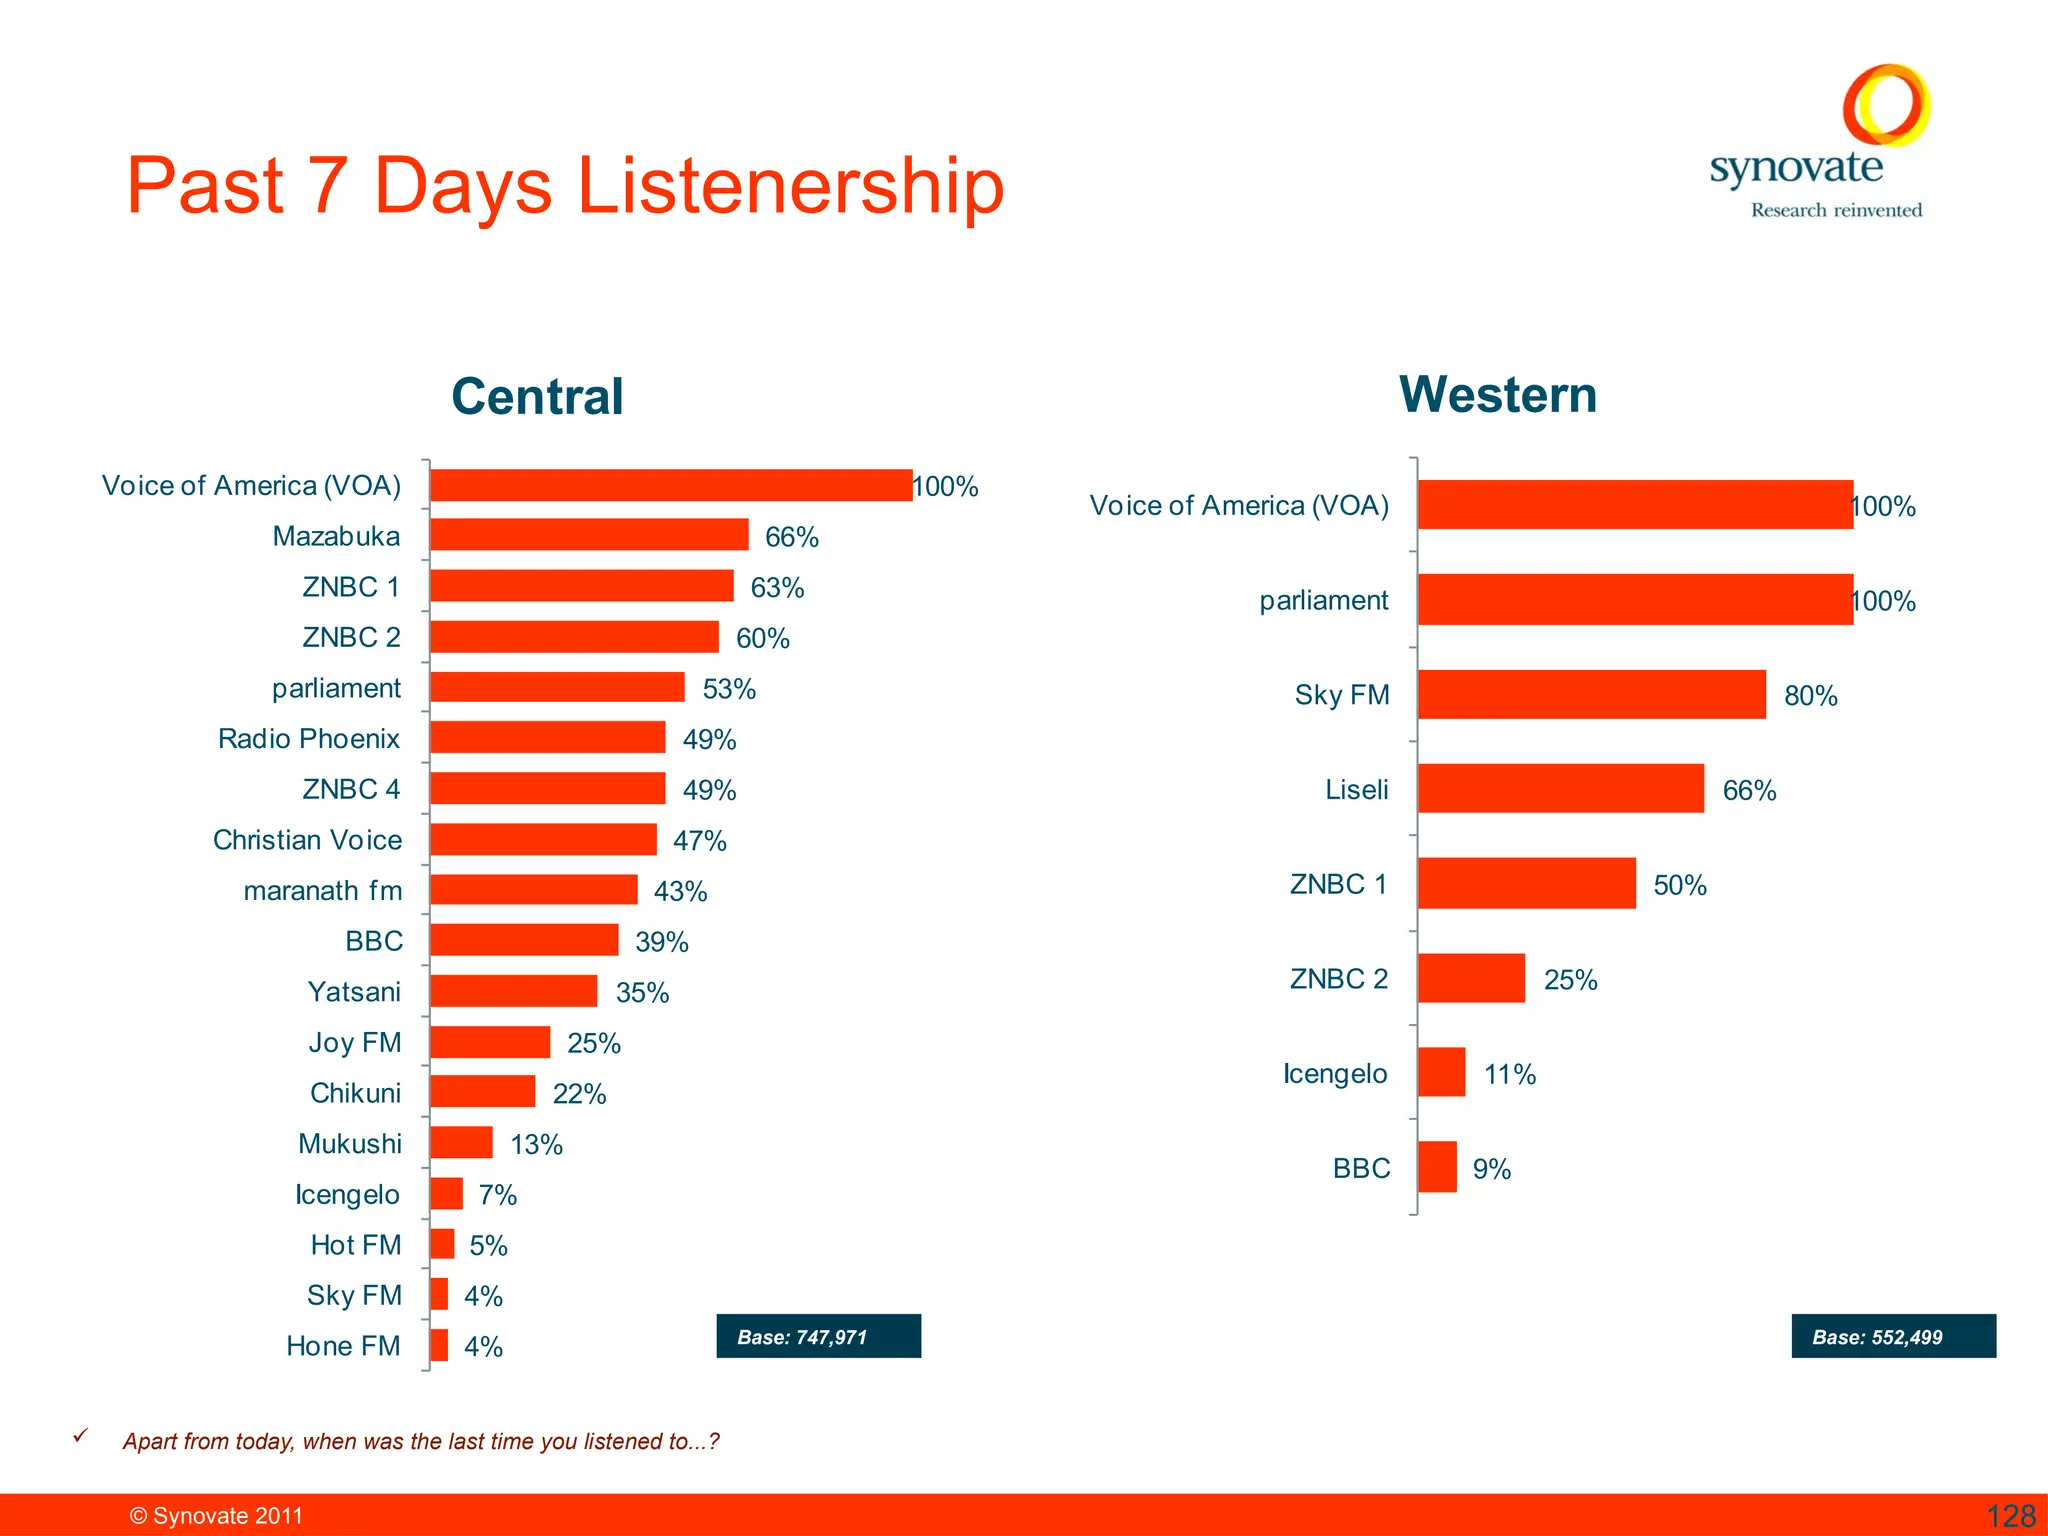
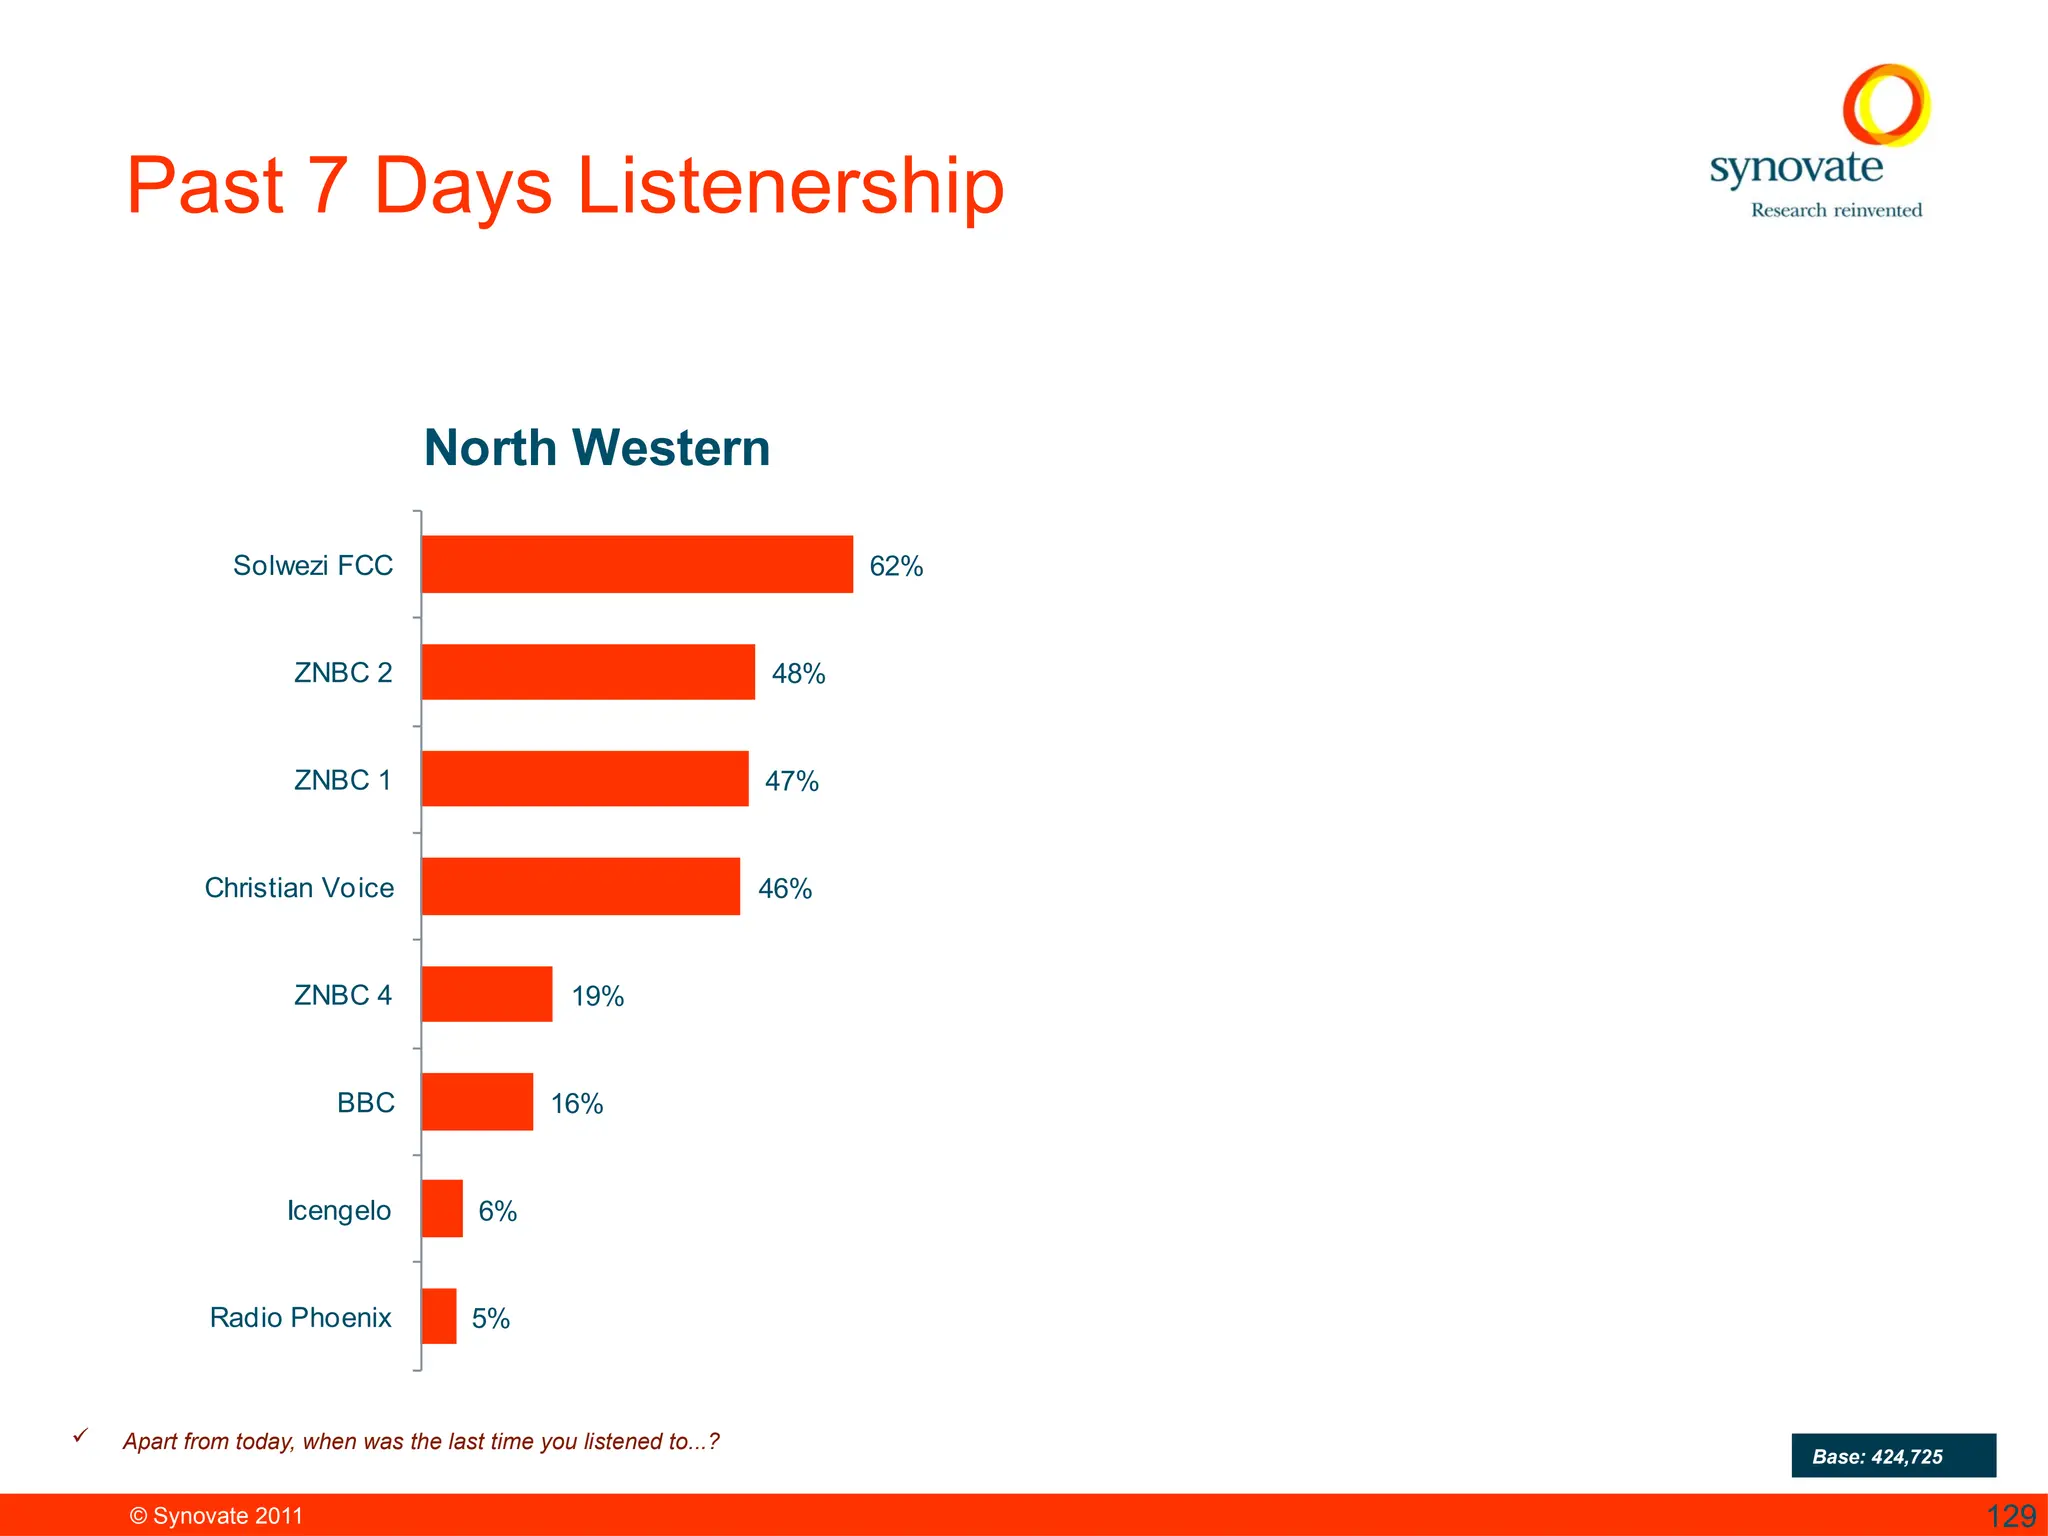
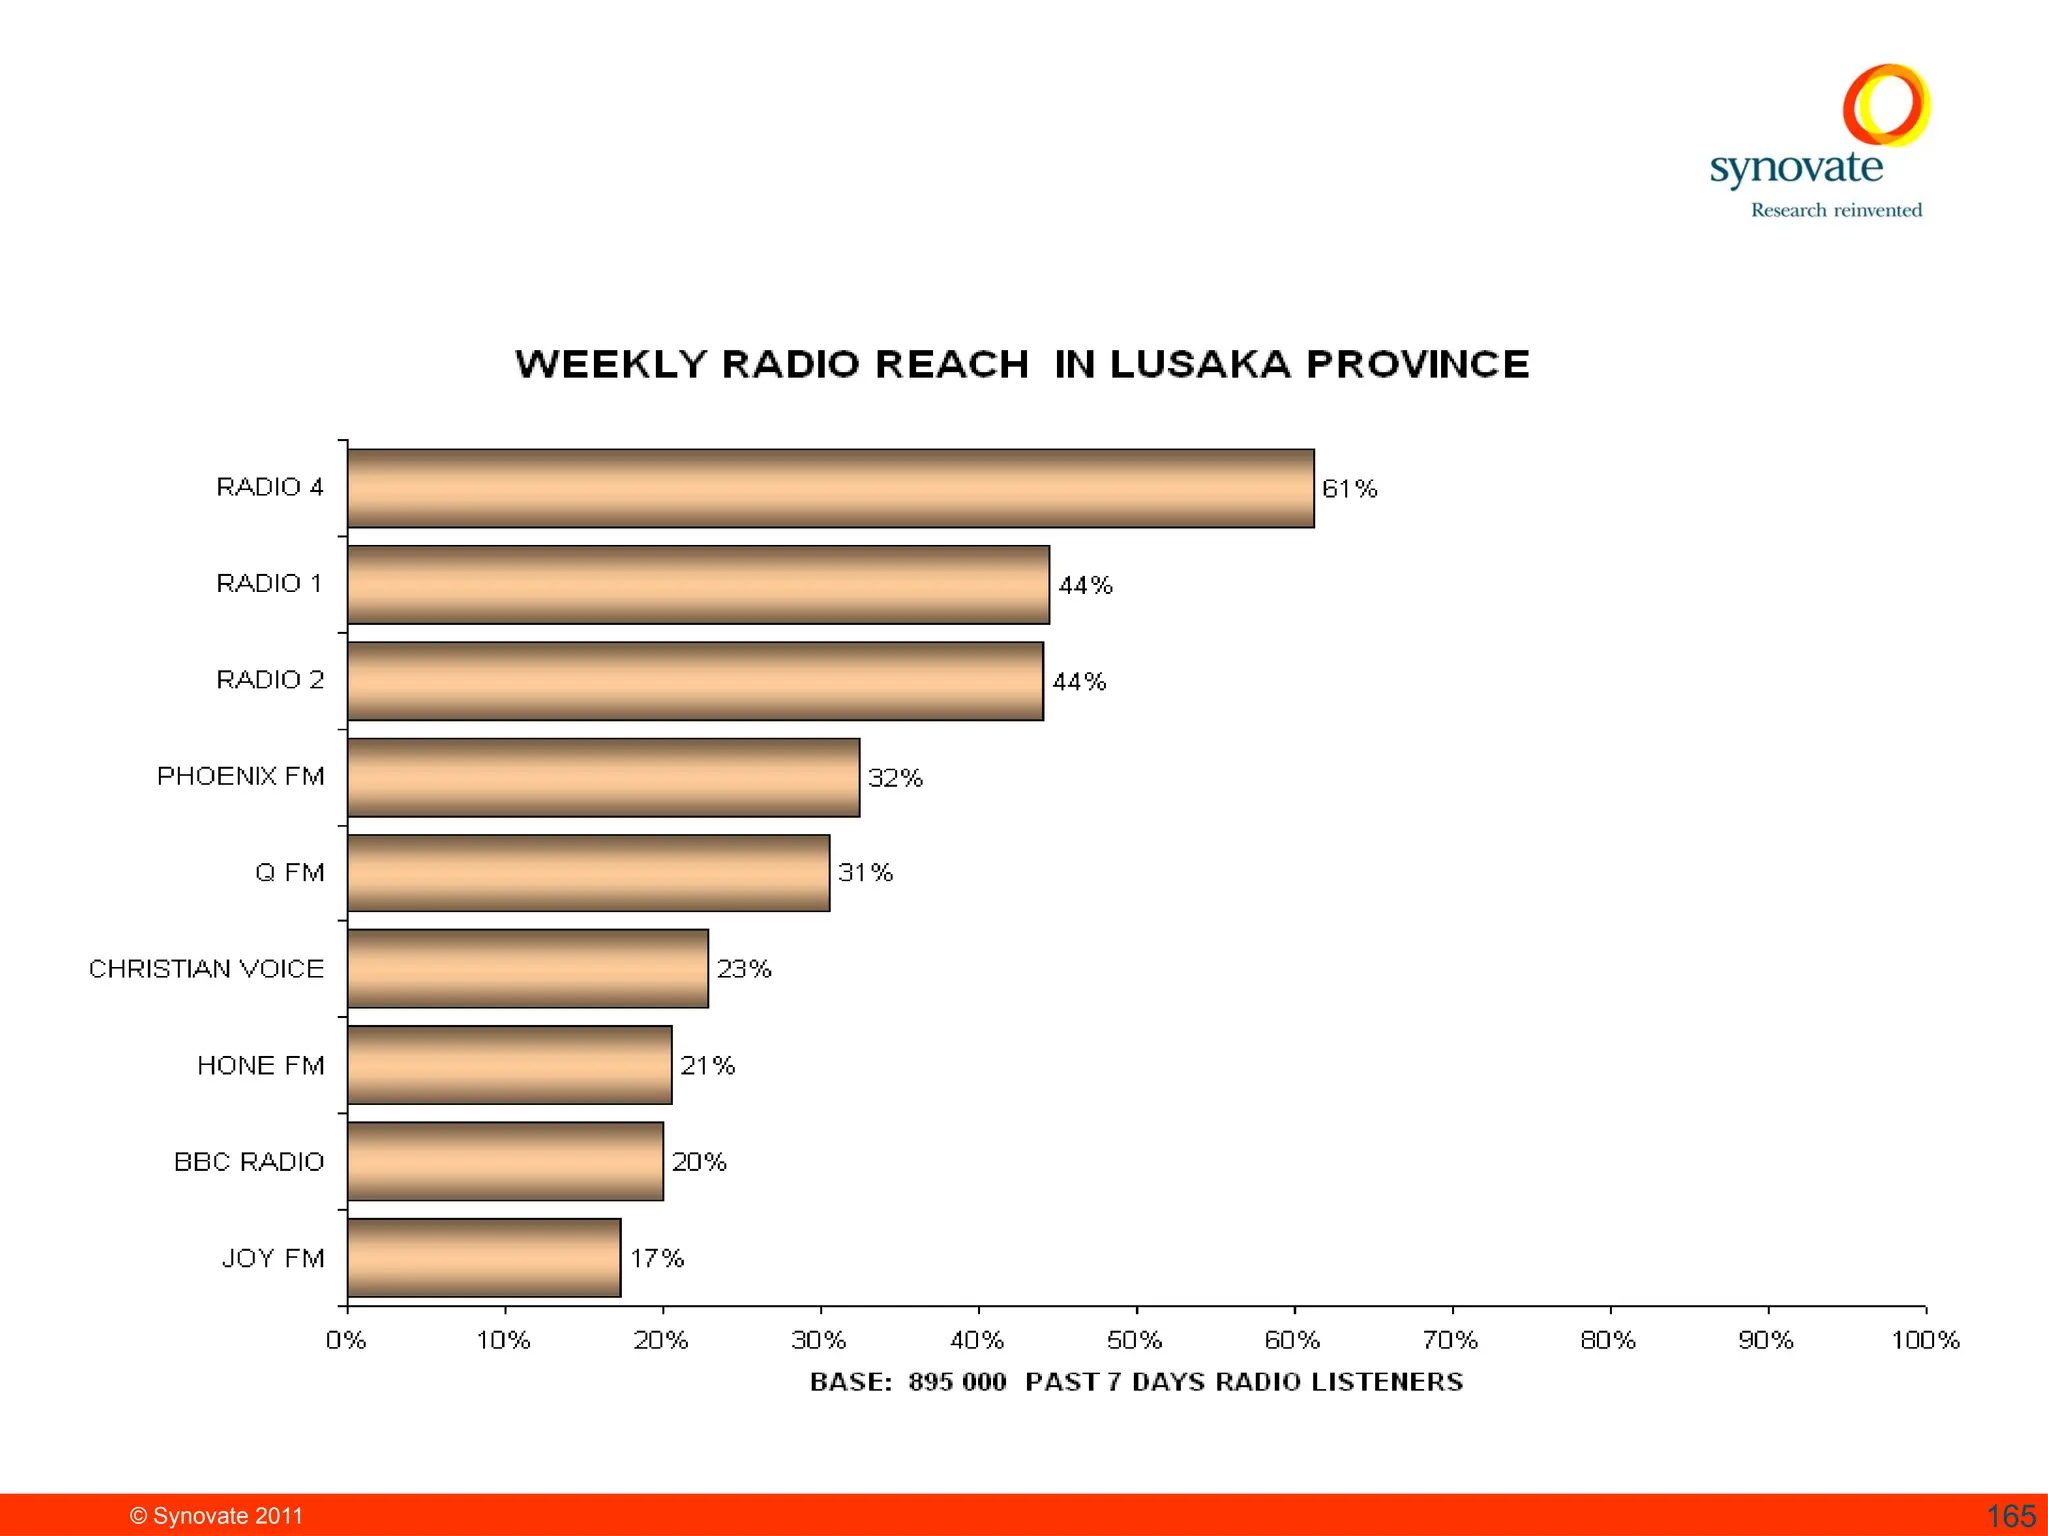
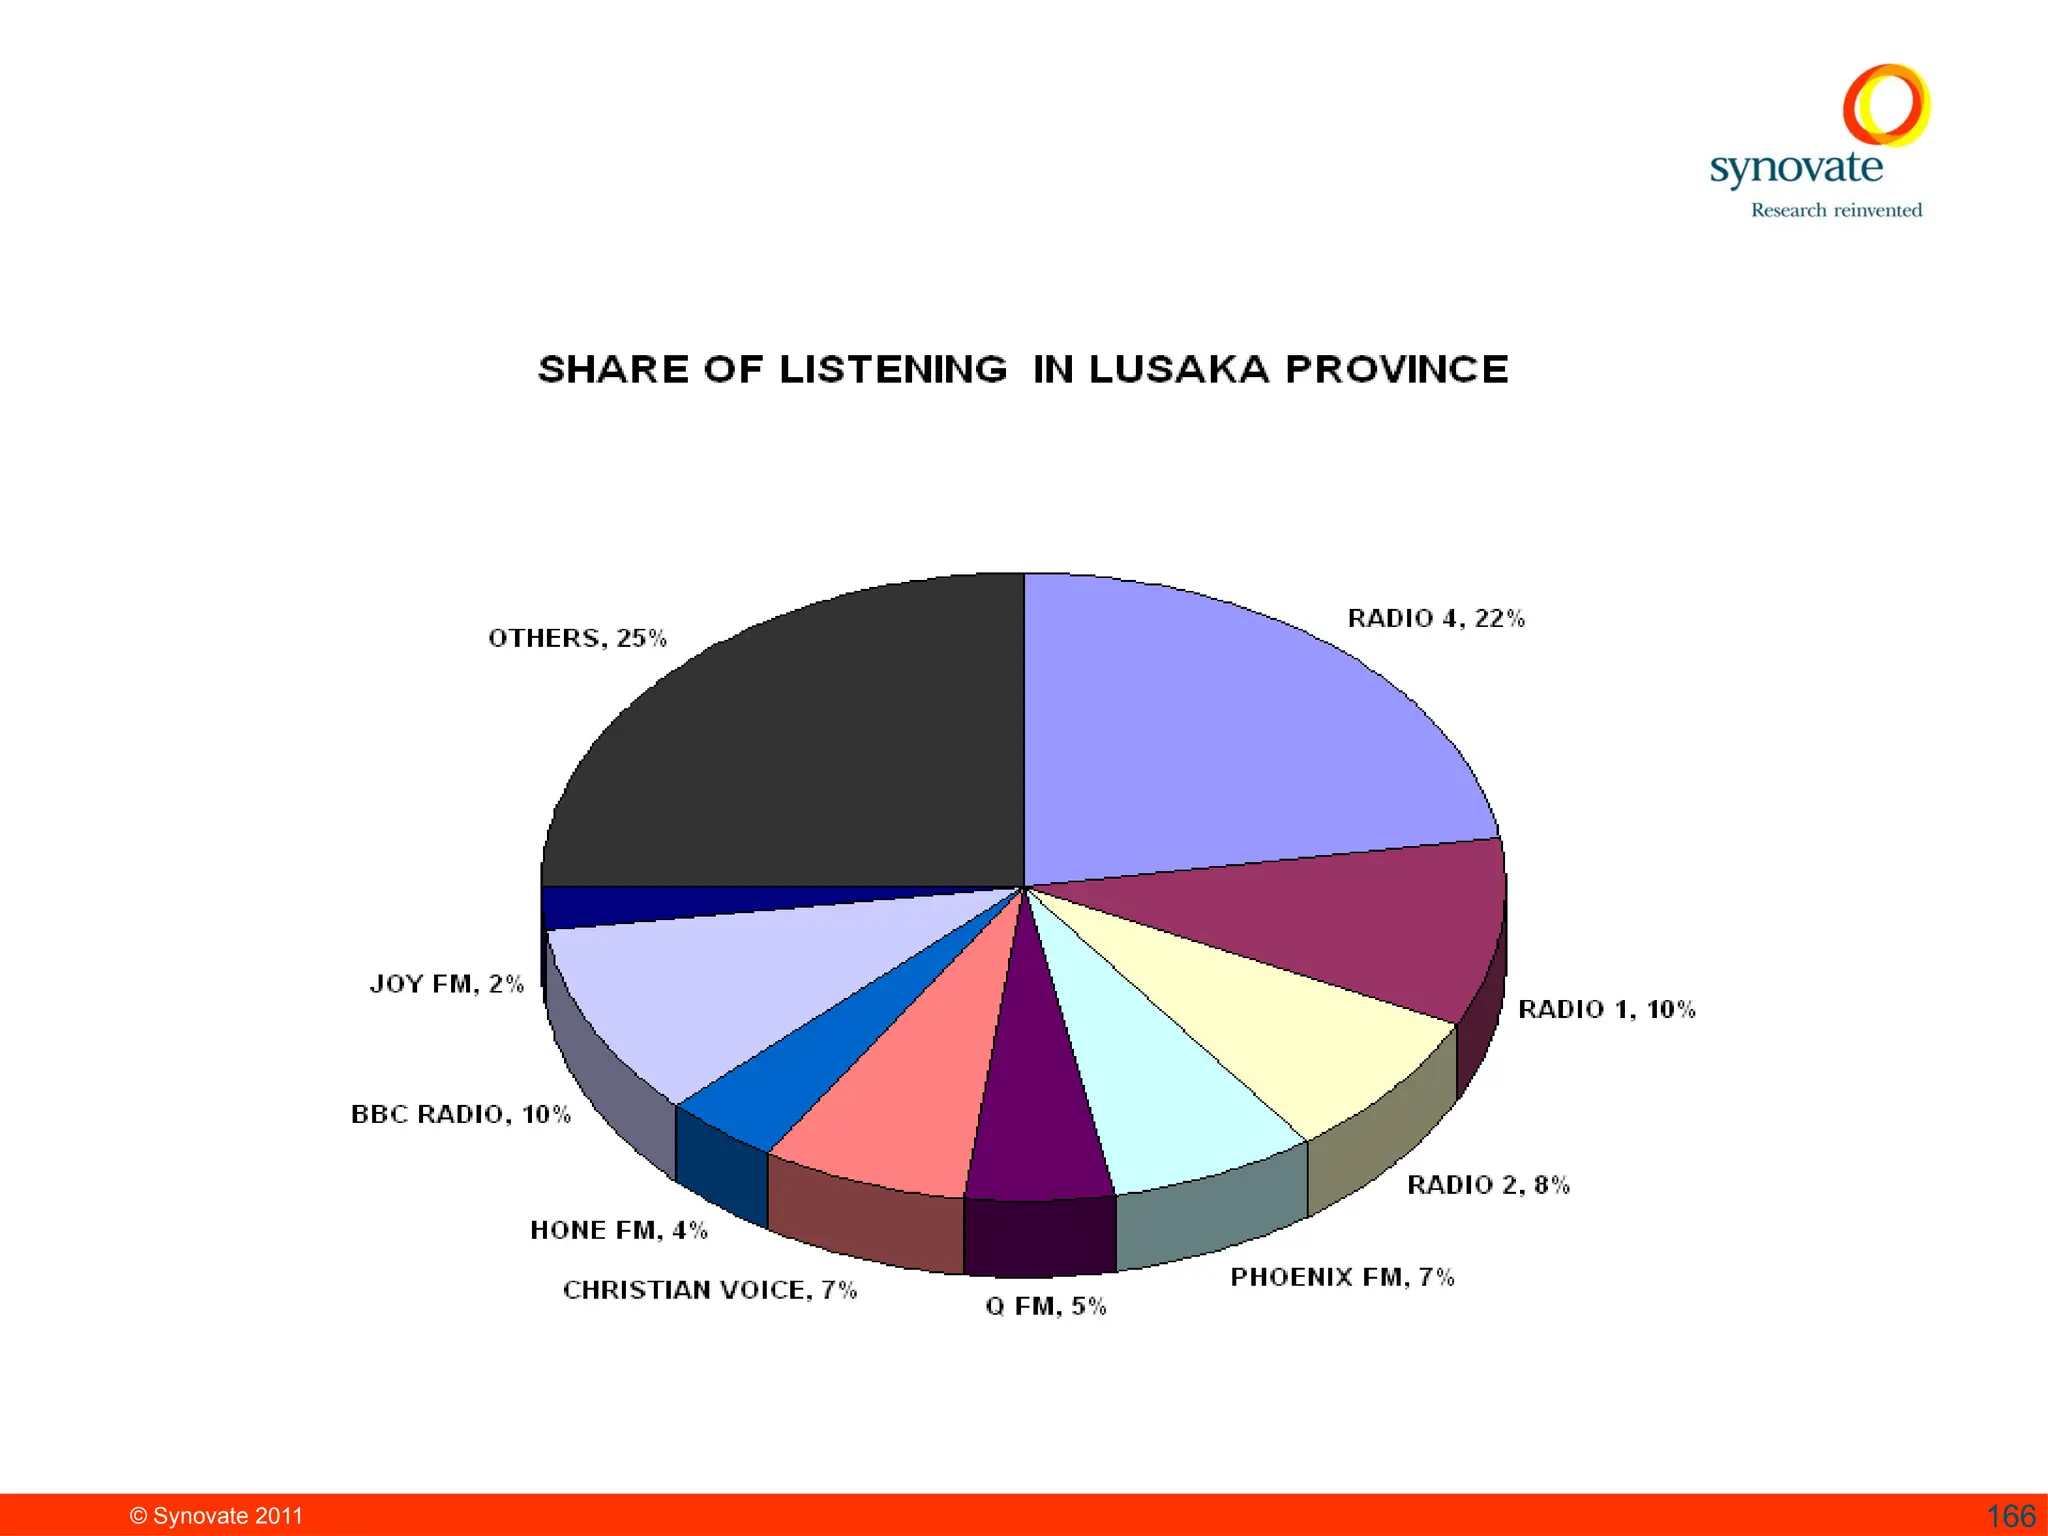
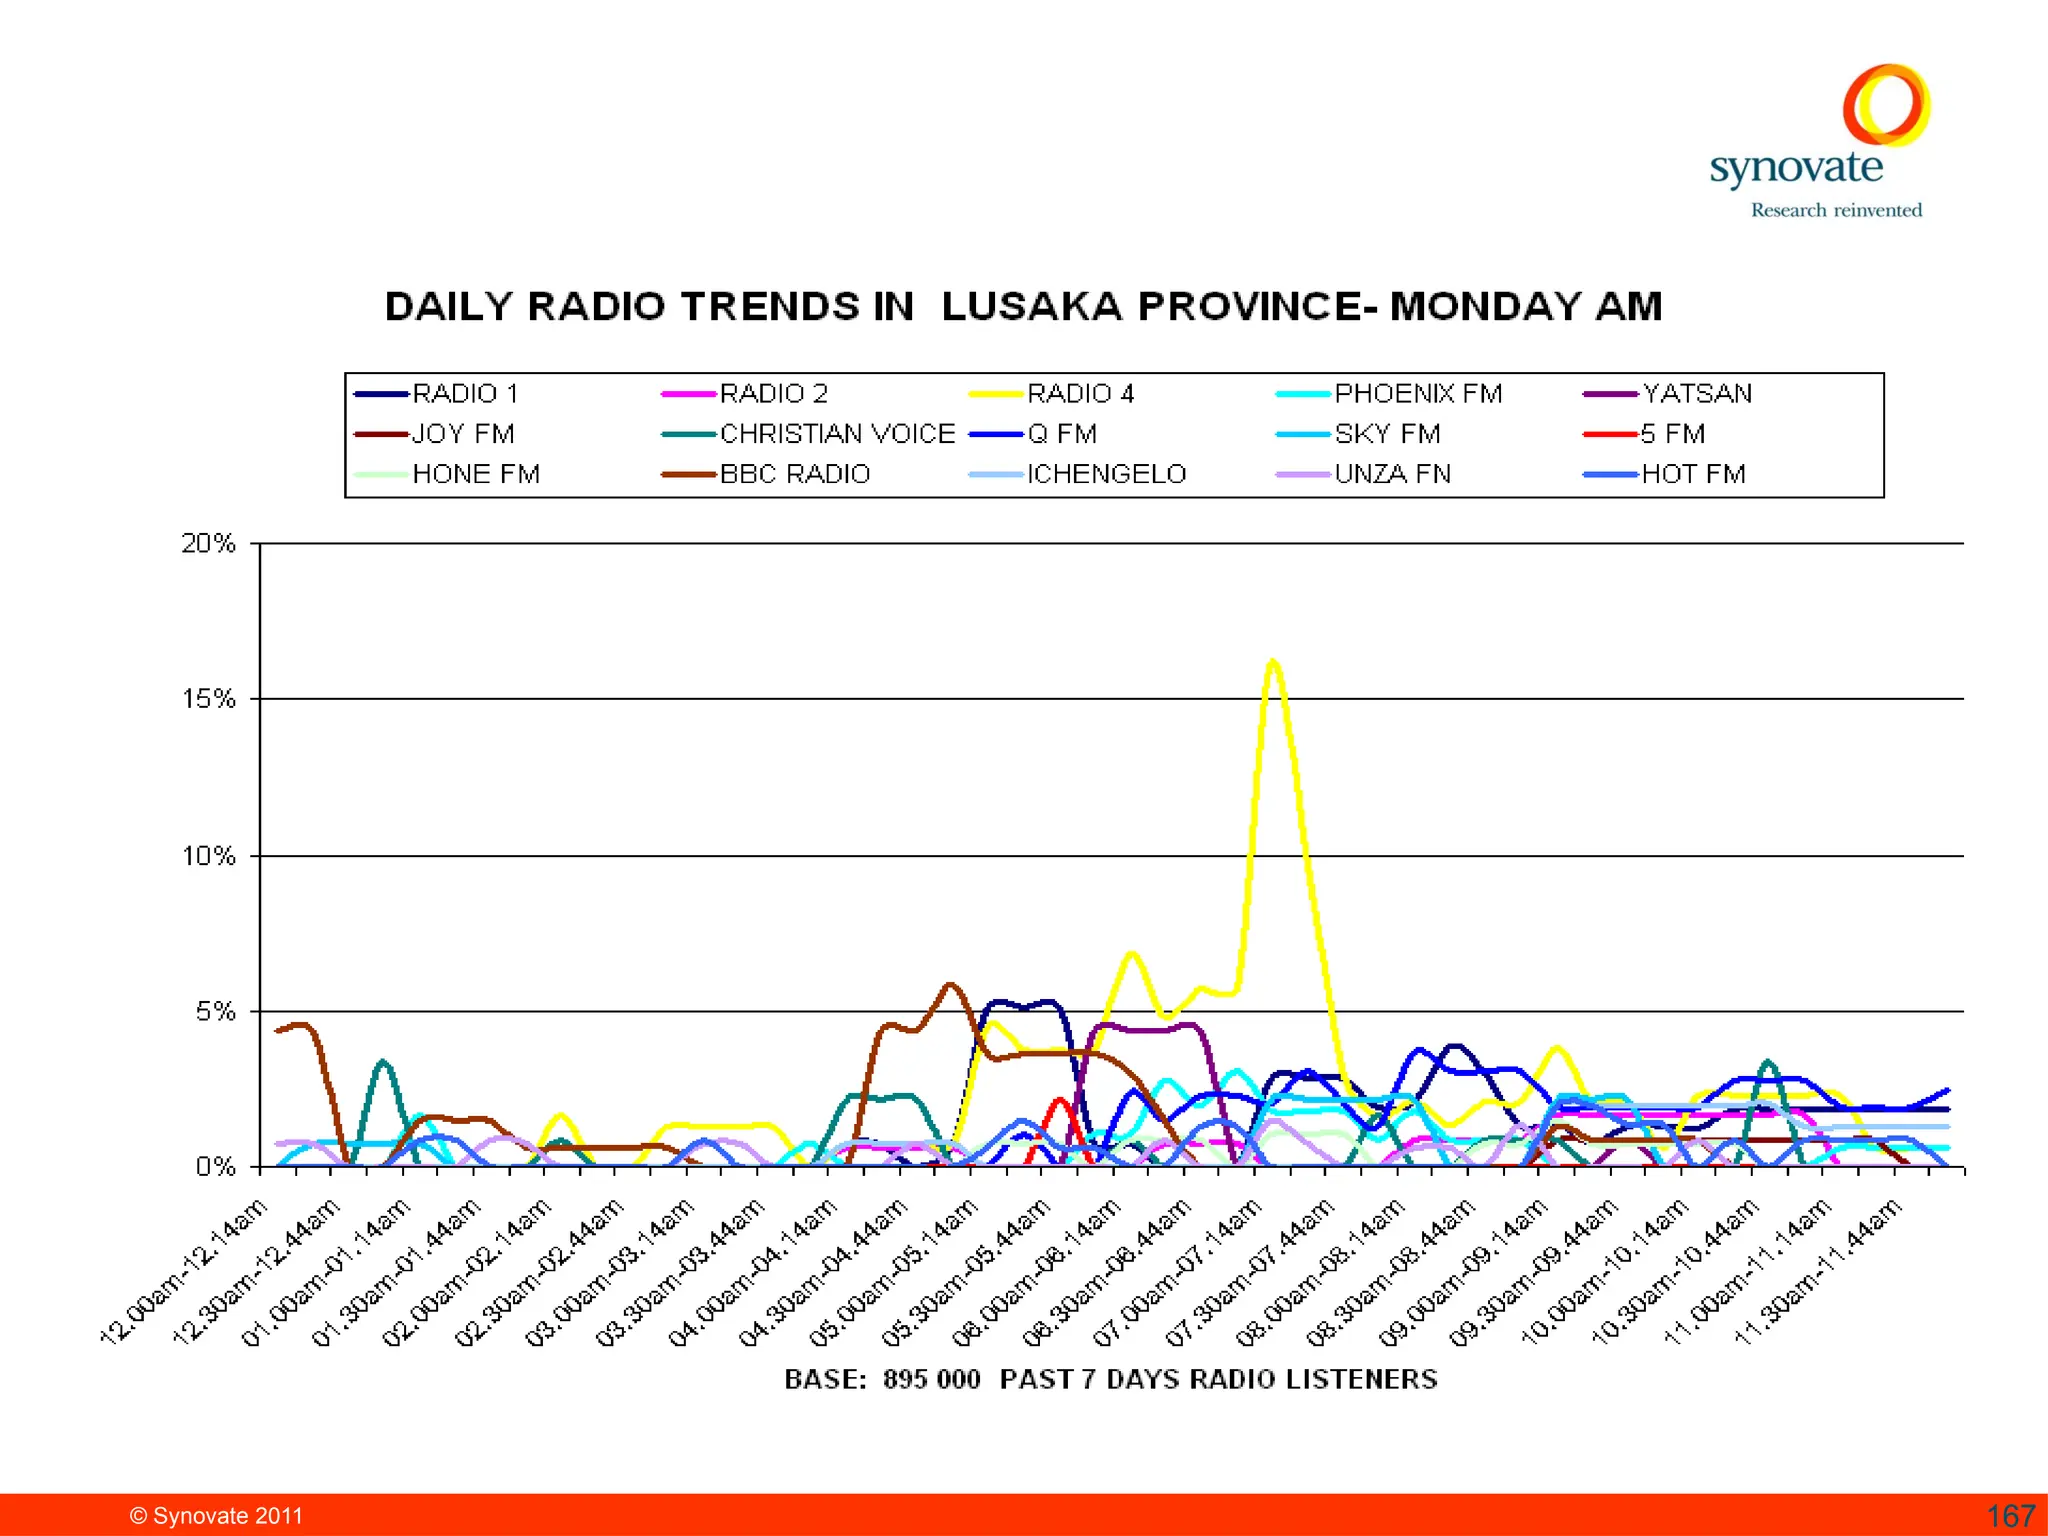
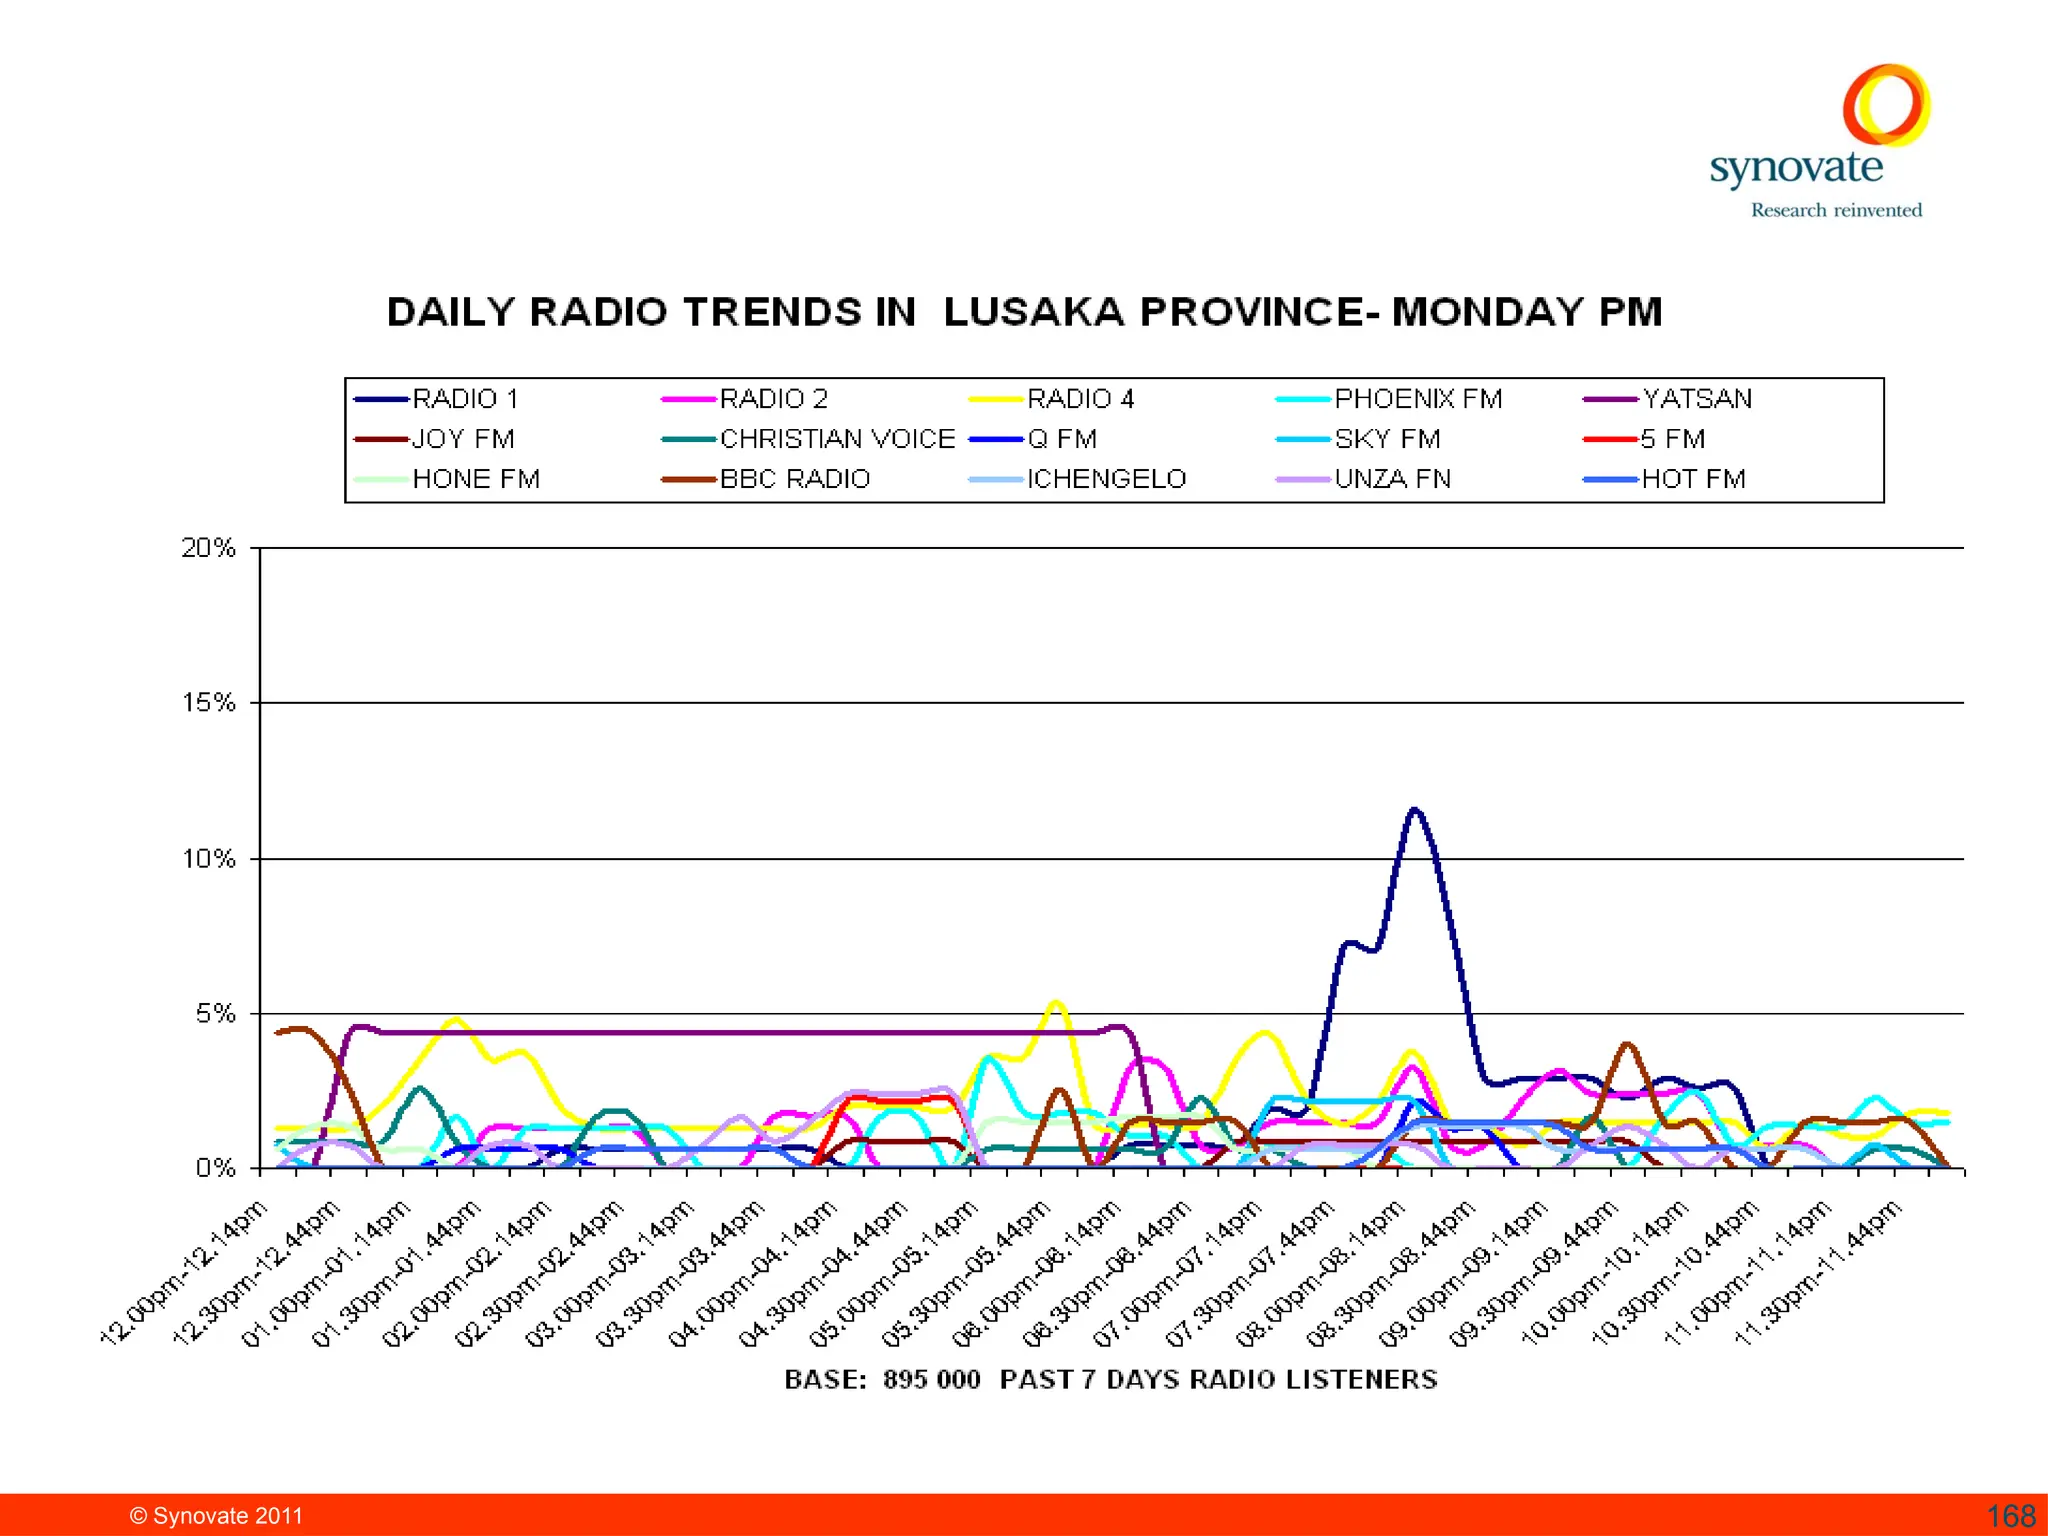
It includes Leadership,Listenship and other aspects of radio and how people respond to it.