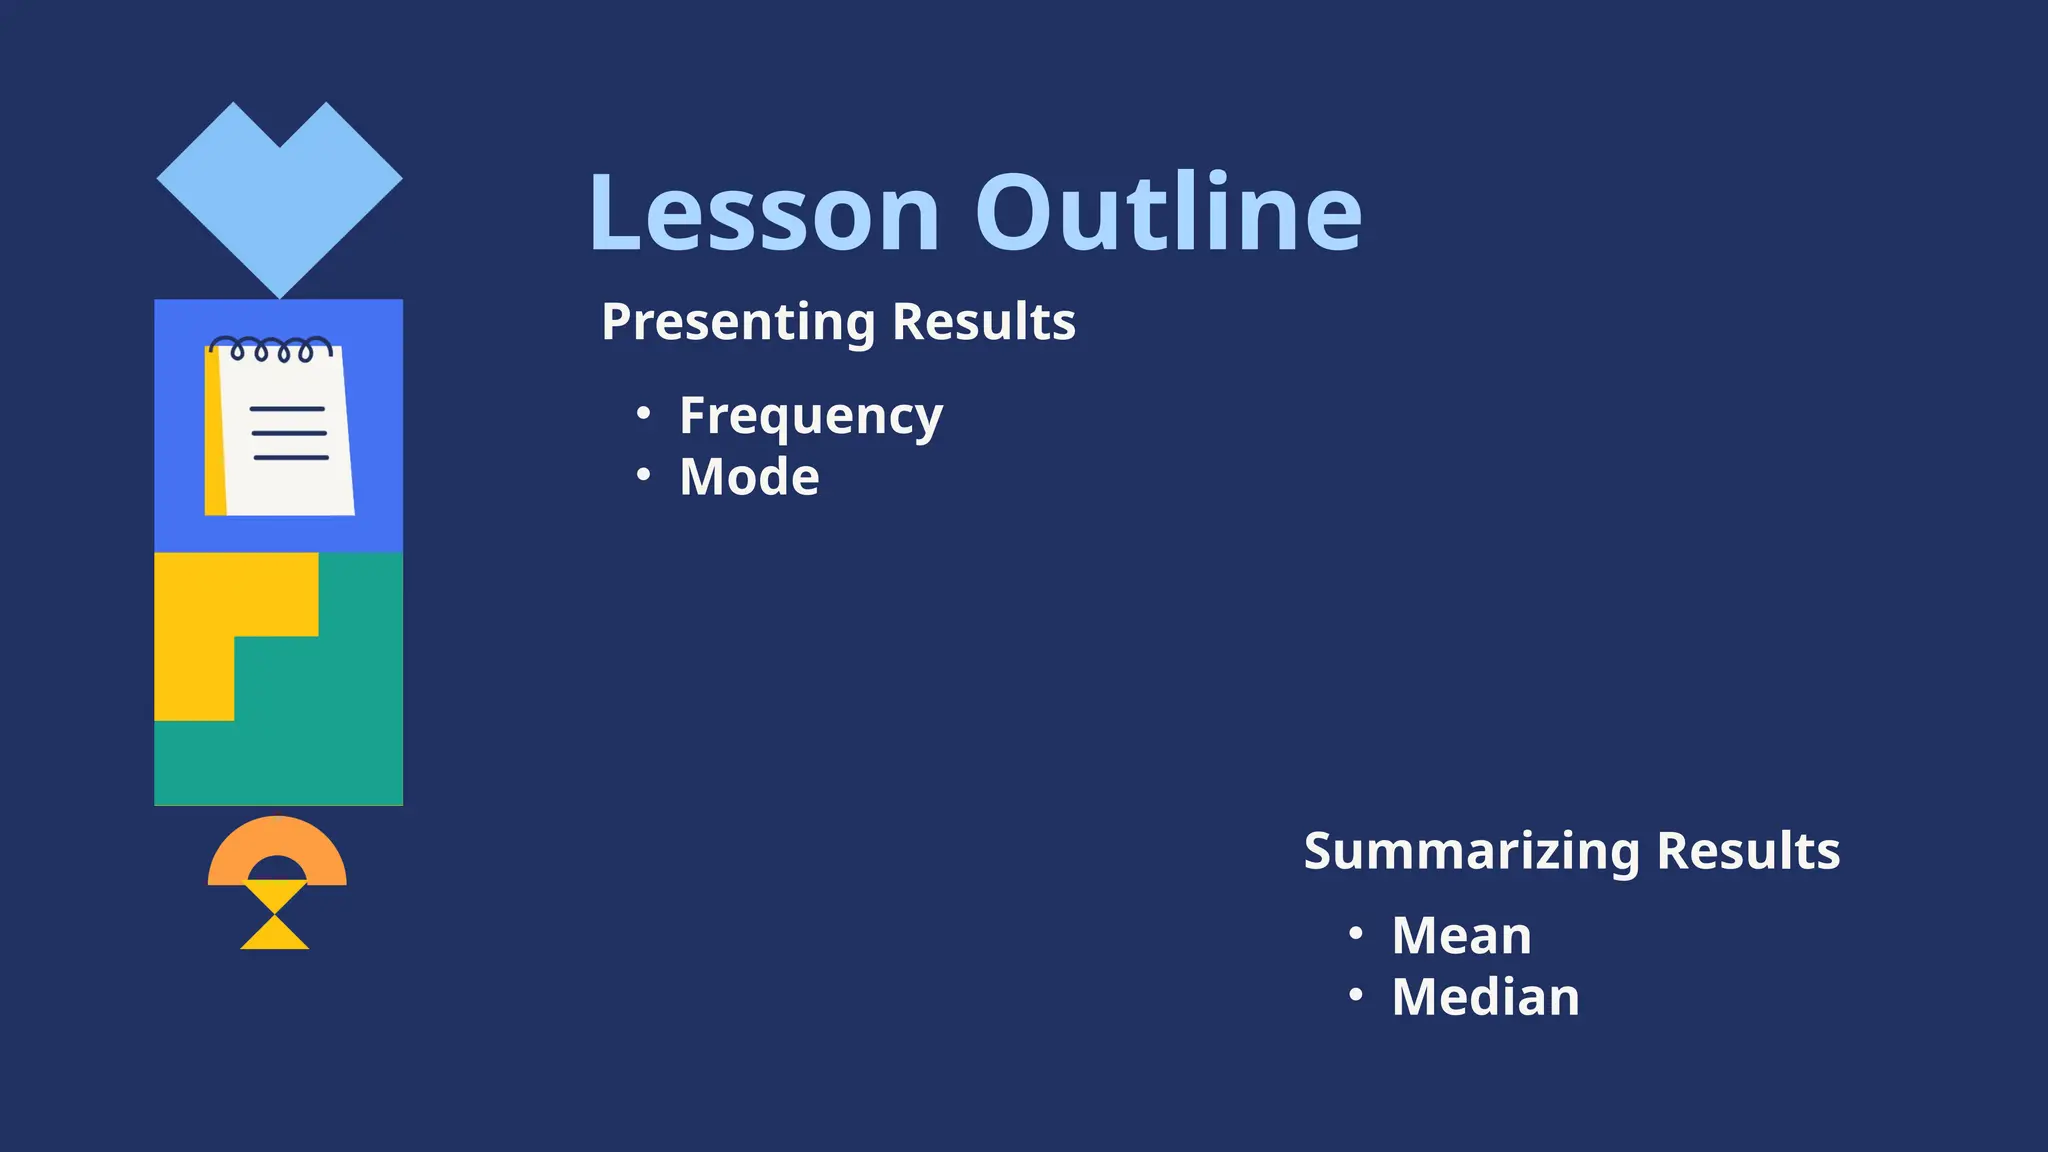
• Mean
• Median
•Frequency
• Mode
Presenting Results
Summarizing Results
Lesson Outline
3.
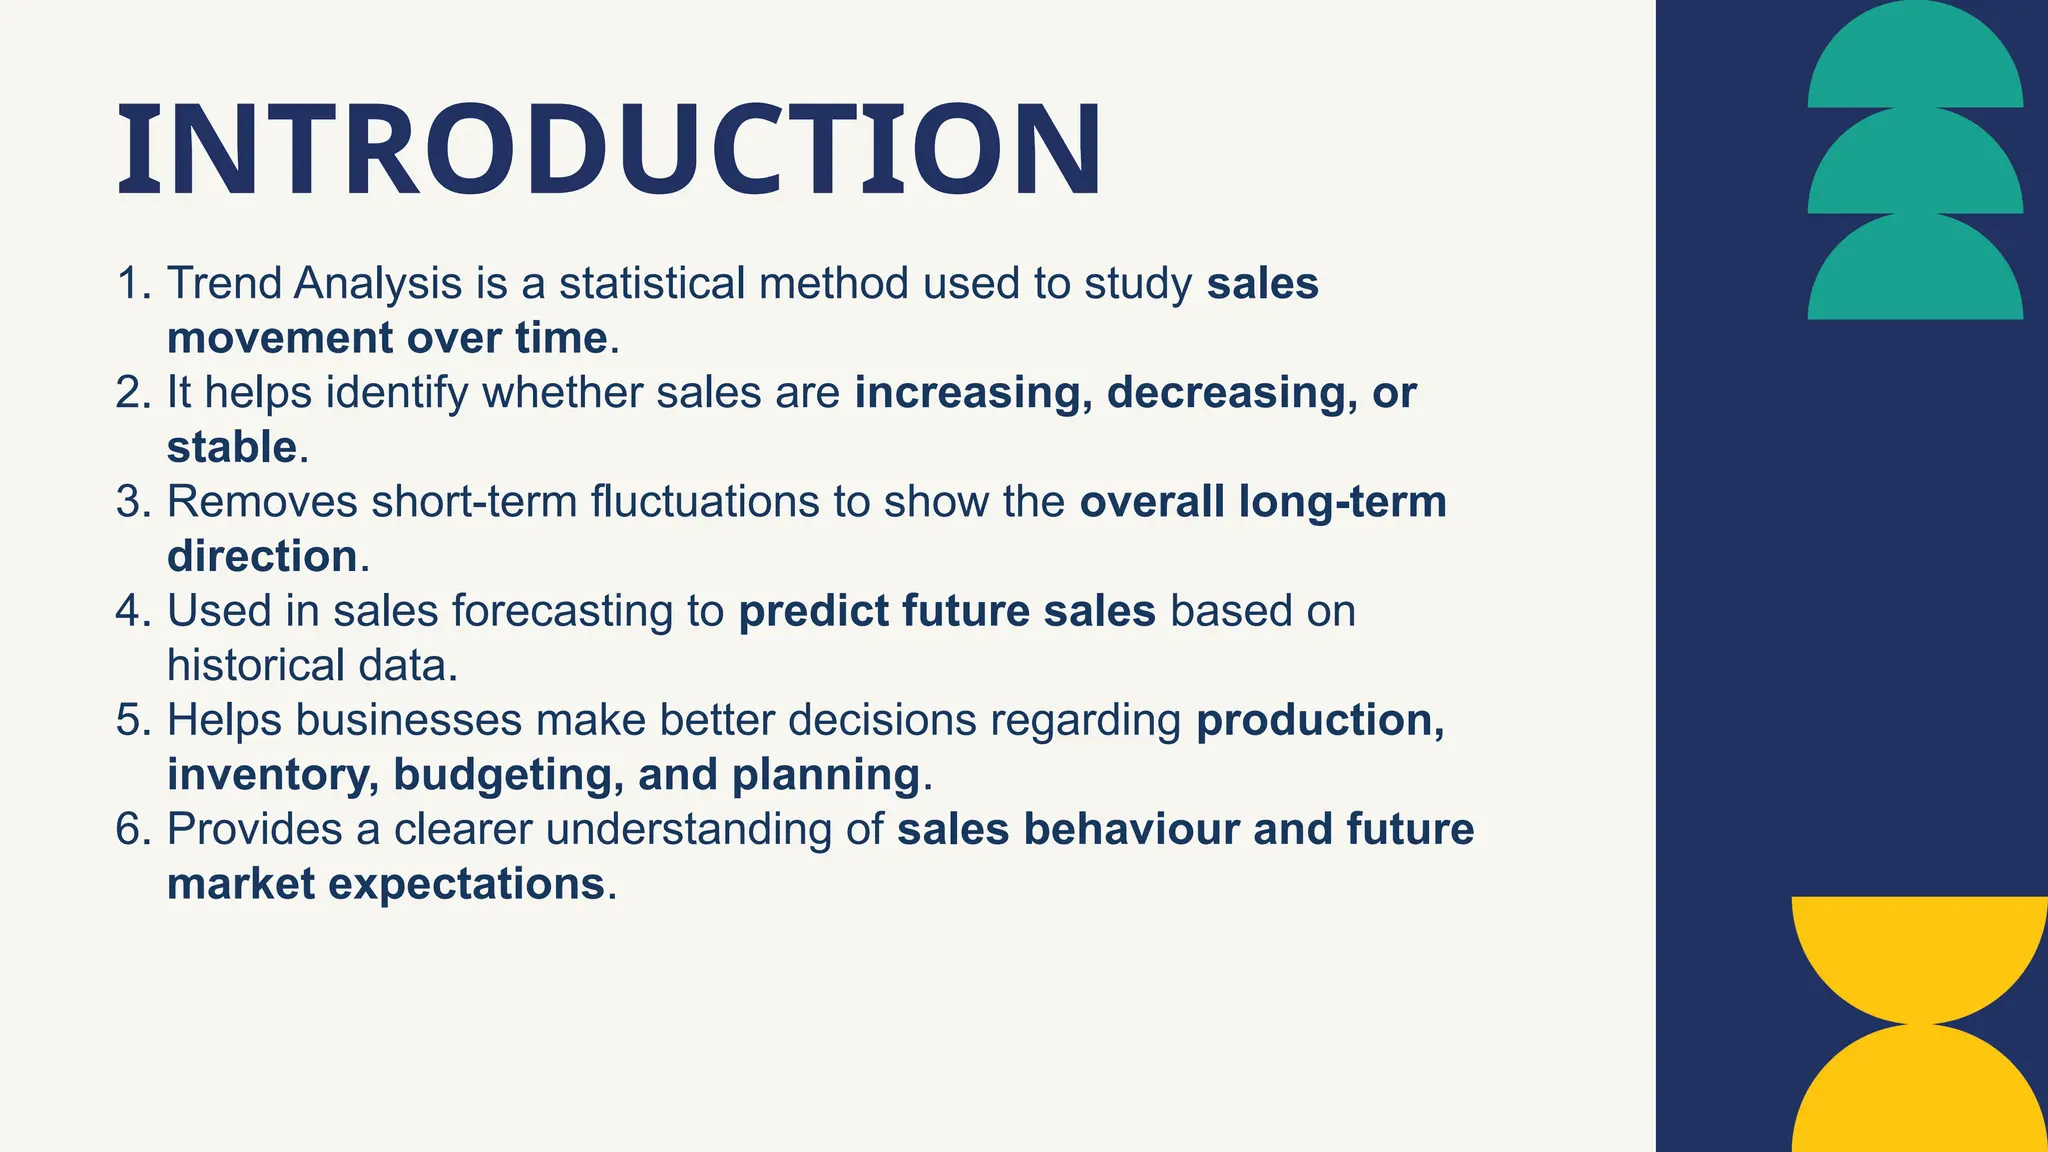
1. Trend Analysisis a statistical method used to study sales
movement over time.
2. It helps identify whether sales are increasing, decreasing, or
stable.
3. Removes short-term fluctuations to show the overall long-term
direction.
4. Used in sales forecasting to predict future sales based on
historical data.
5. Helps businesses make better decisions regarding production,
inventory, budgeting, and planning.
6. Provides a clearer understanding of sales behaviour and future
market expectations.
INTRODUCTION
4.
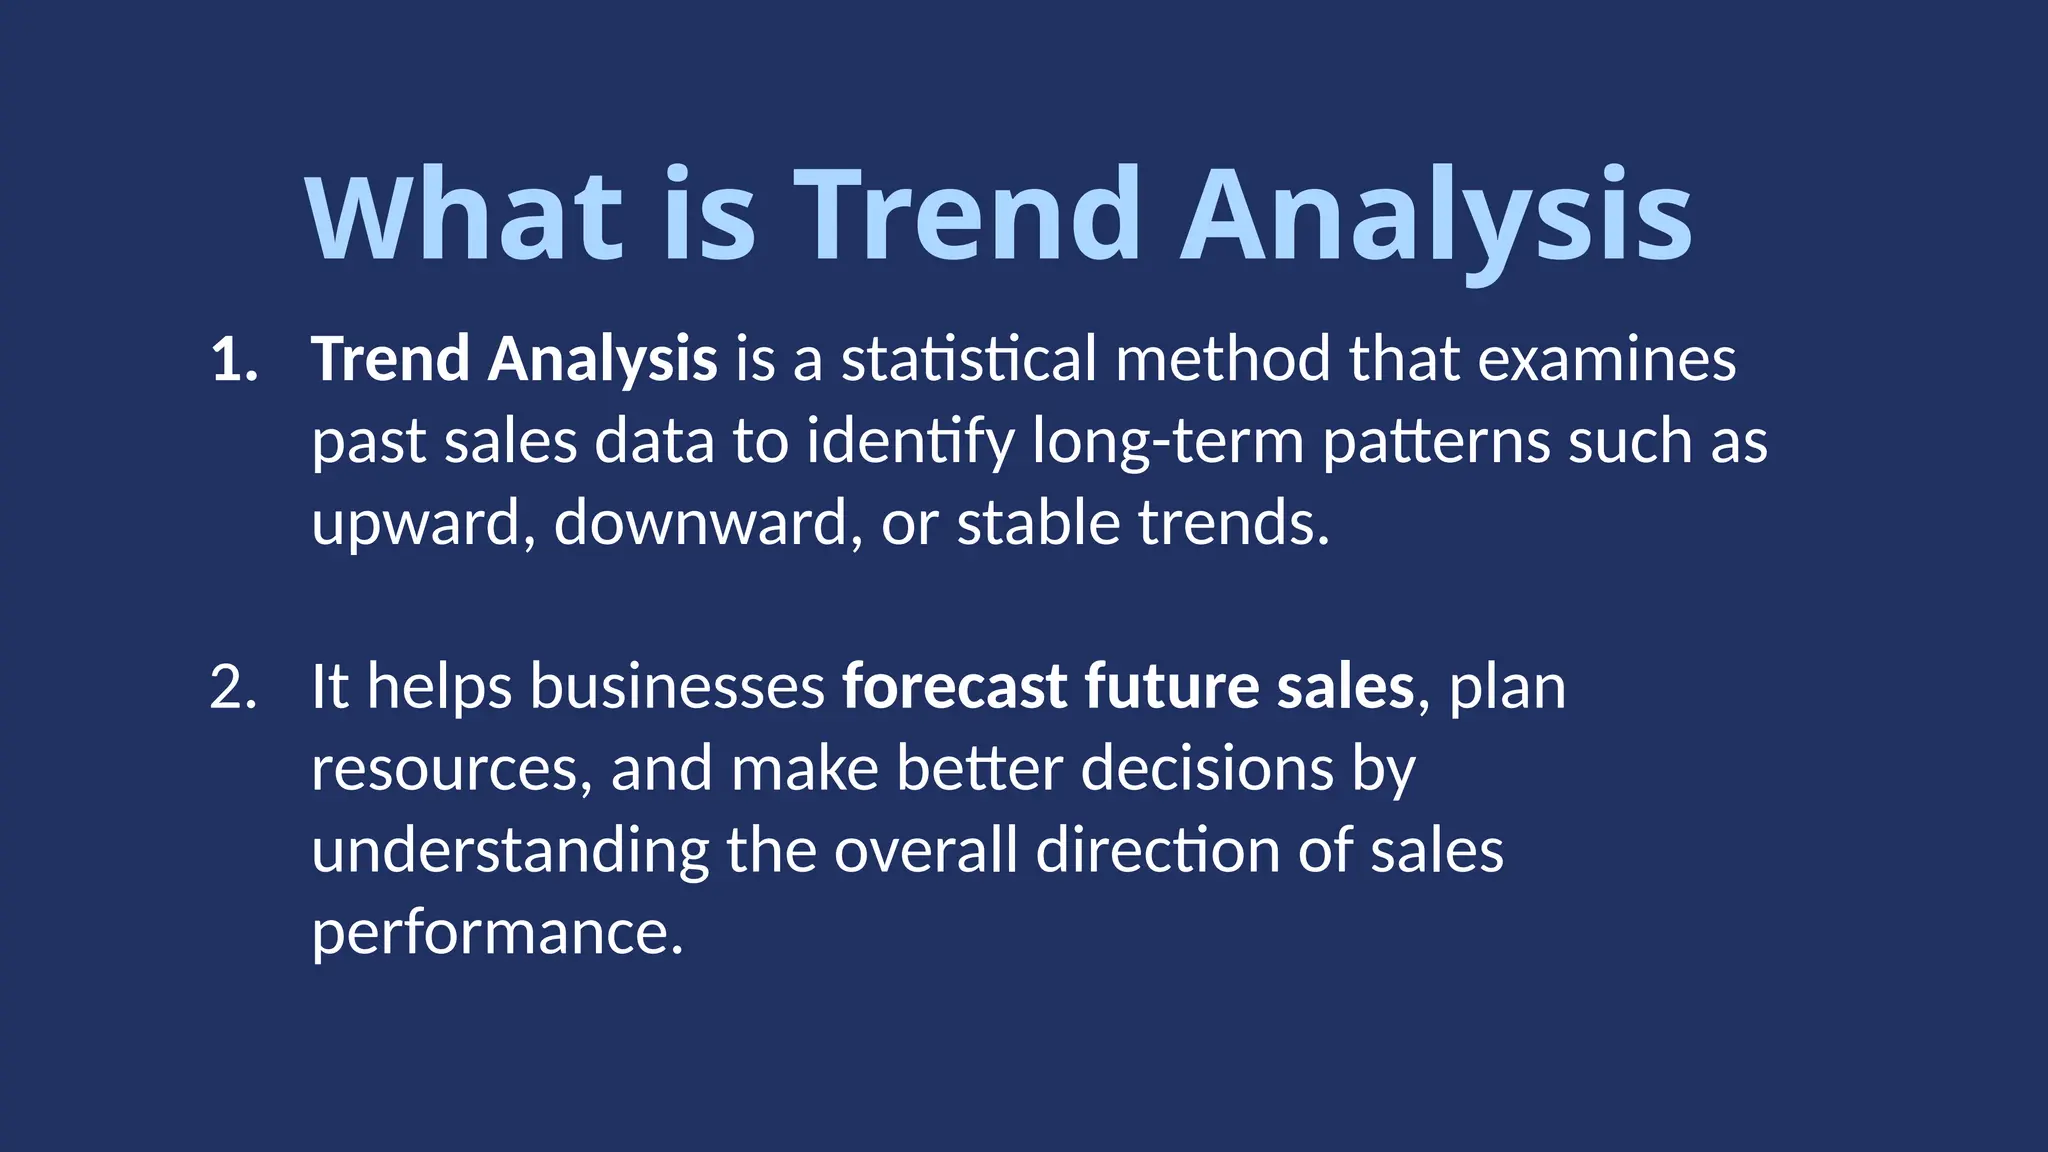
What is TrendAnalysis
1. Trend Analysis is a statistical method that examines
past sales data to identify long-term patterns such as
upward, downward, or stable trends.
2. It helps businesses forecast future sales, plan
resources, and make better decisions by
understanding the overall direction of sales
performance.
6.
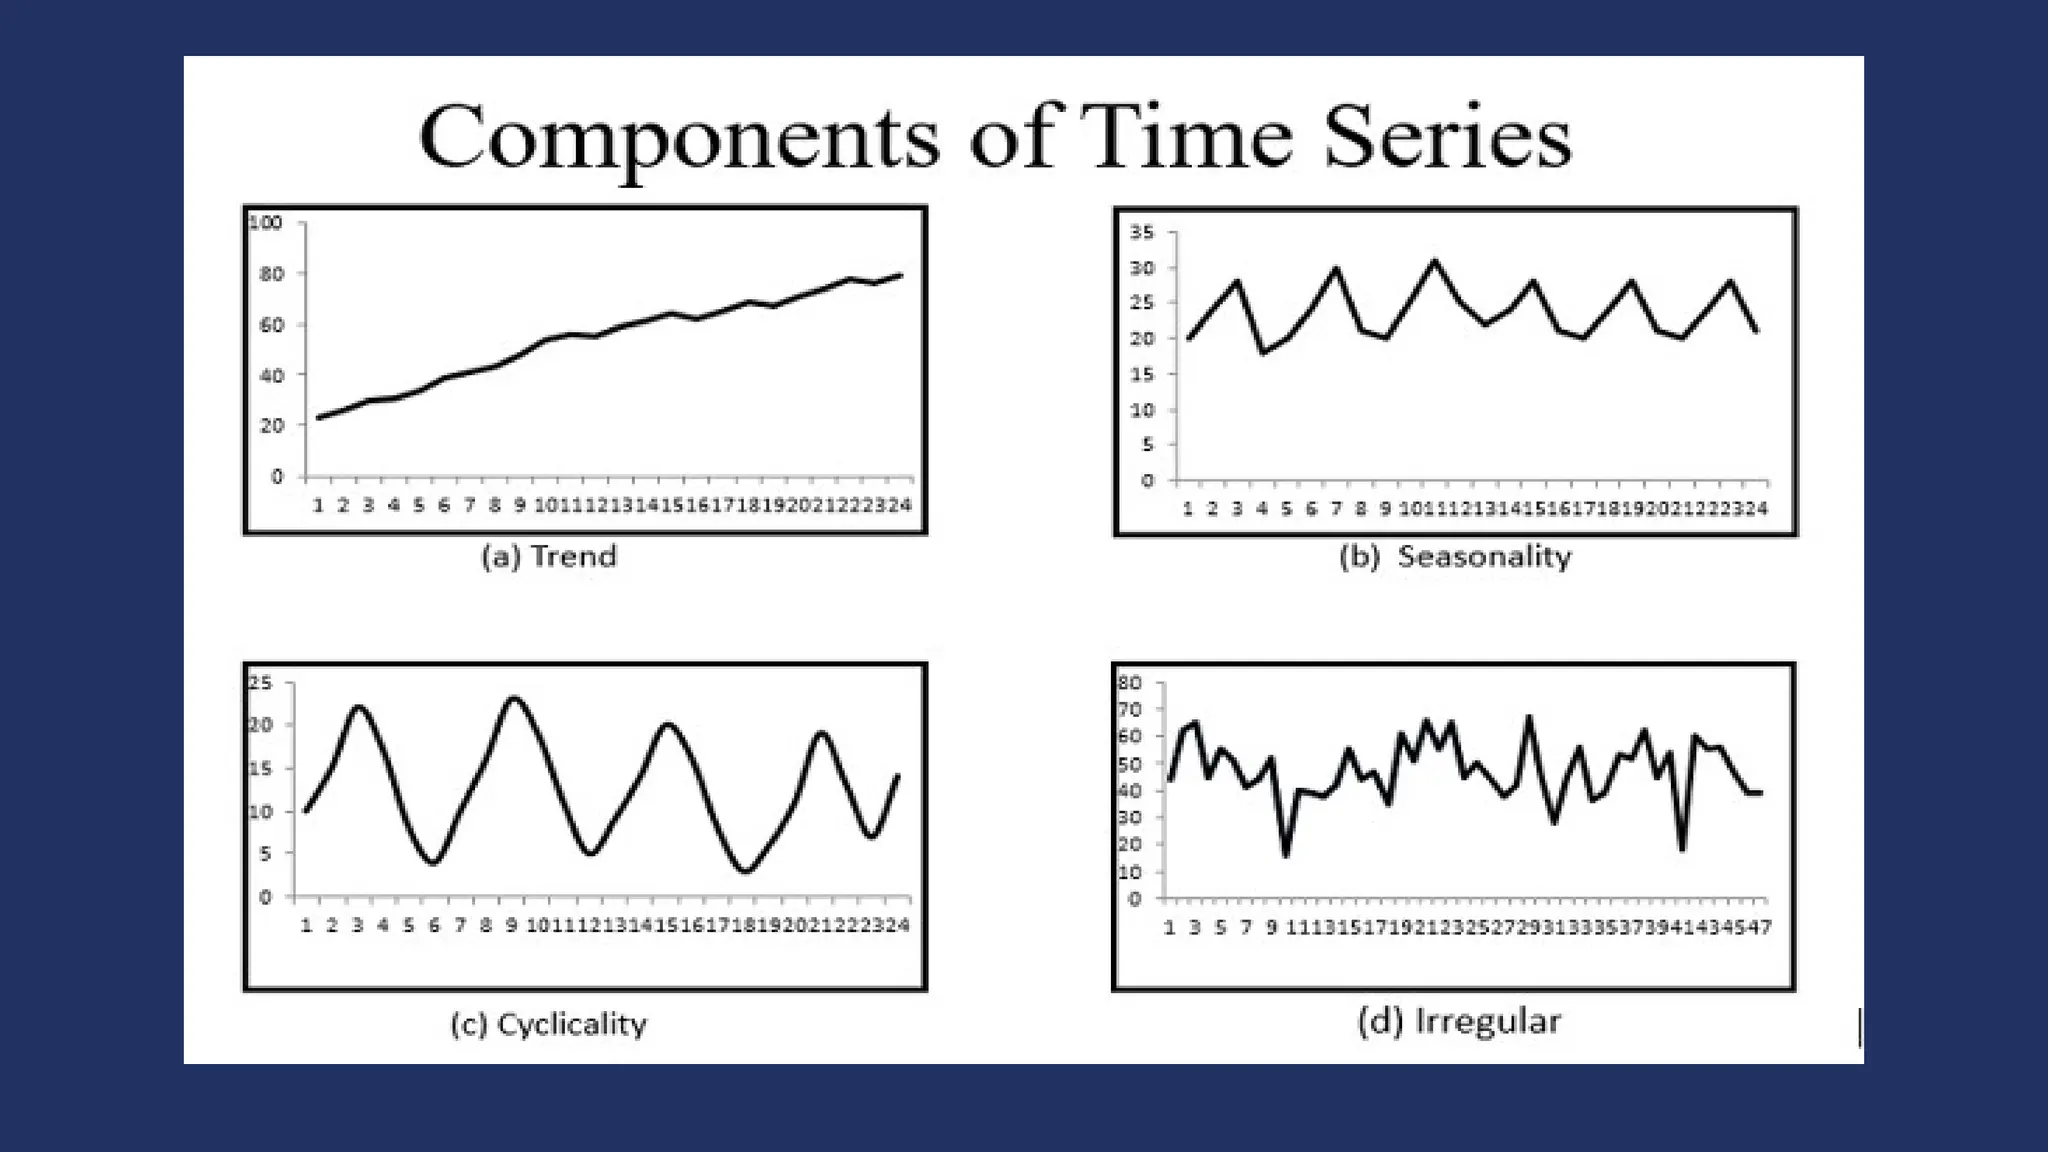
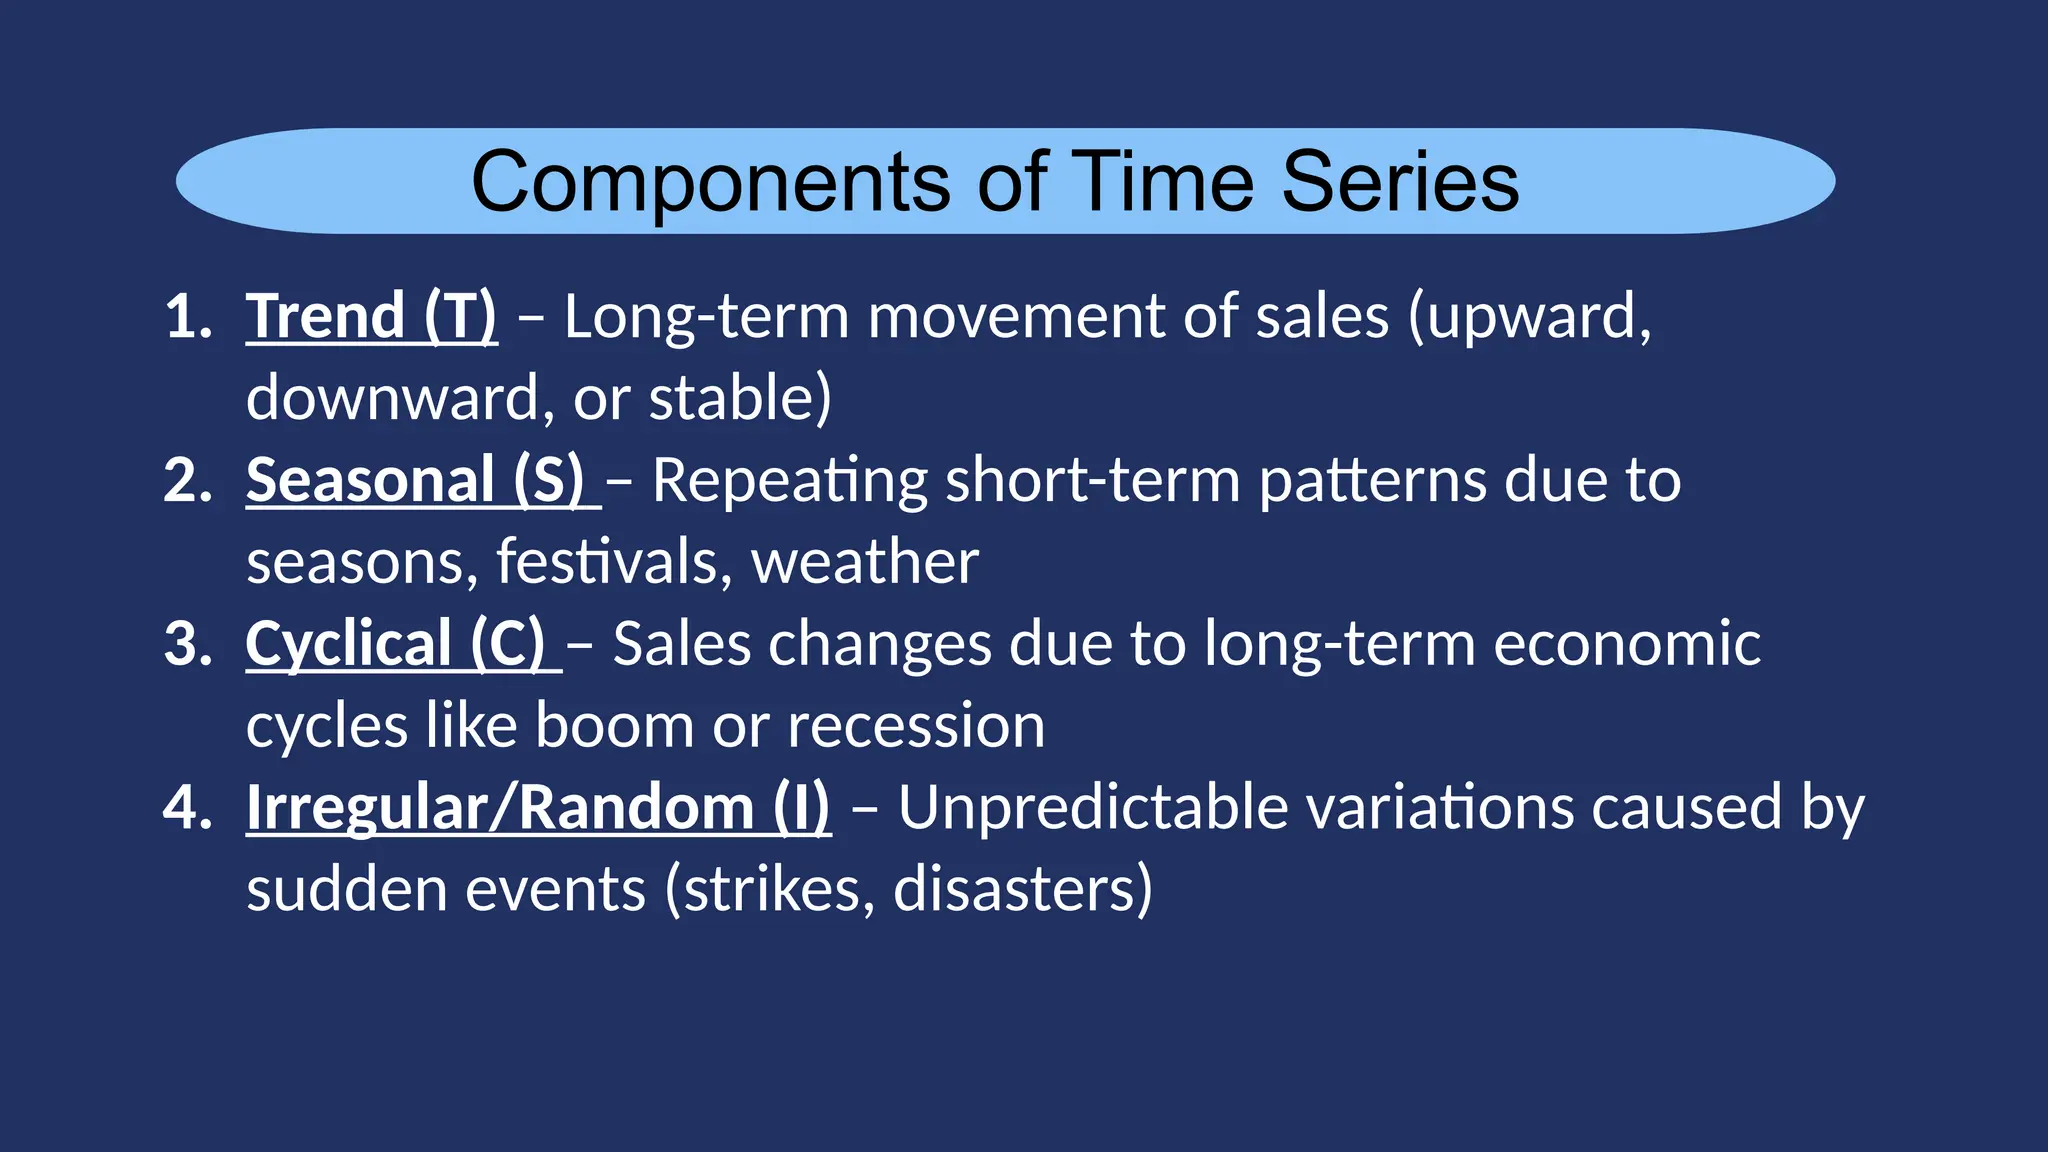
Components of TimeSeries
1. Trend (T) – Long-term movement of sales (upward,
downward, or stable)
2. Seasonal (S) – Repeating short-term patterns due to
seasons, festivals, weather
3. Cyclical (C) – Sales changes due to long-term economic
cycles like boom or recession
4. Irregular/Random (I) – Unpredictable variations caused by
sudden events (strikes, disasters)
7.
Trend Analysis inSales
forecasting
1. Time series Analysis
2. Moving Average
3. Data Visualization
4. Segmentation Analysis
5. Correlation Analysis
6. Customer Behaviour Analysis
7. Comparative Analysis
8. Price Elasticity
Find also the median for all four data
sets.
8.
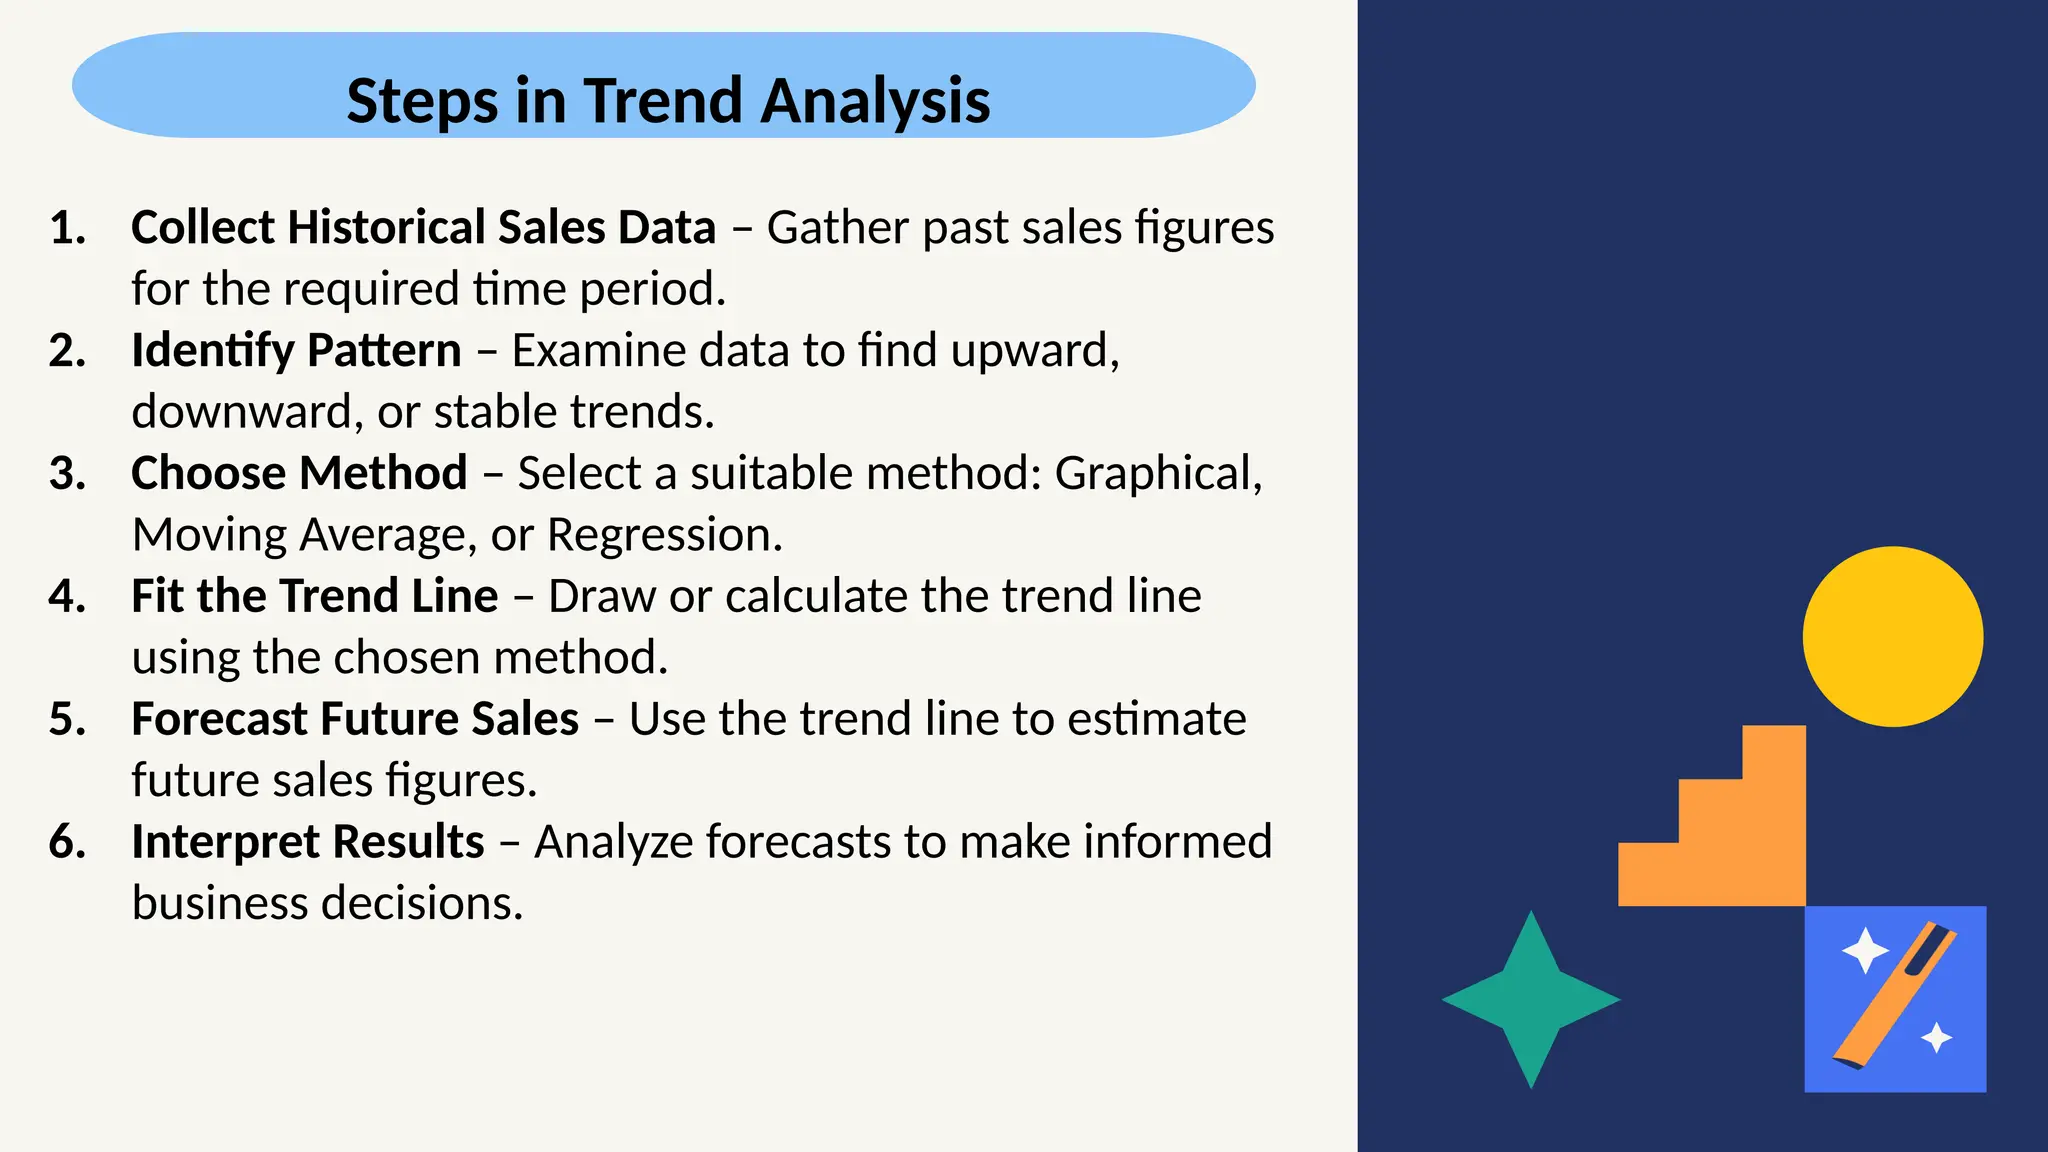
1. Collect HistoricalSales Data – Gather past sales figures
for the required time period.
2. Identify Pattern – Examine data to find upward,
downward, or stable trends.
3. Choose Method – Select a suitable method: Graphical,
Moving Average, or Regression.
4. Fit the Trend Line – Draw or calculate the trend line
using the chosen method.
5. Forecast Future Sales – Use the trend line to estimate
future sales figures.
6. Interpret Results – Analyze forecasts to make informed
business decisions.
Steps in Trend Analysis
9.
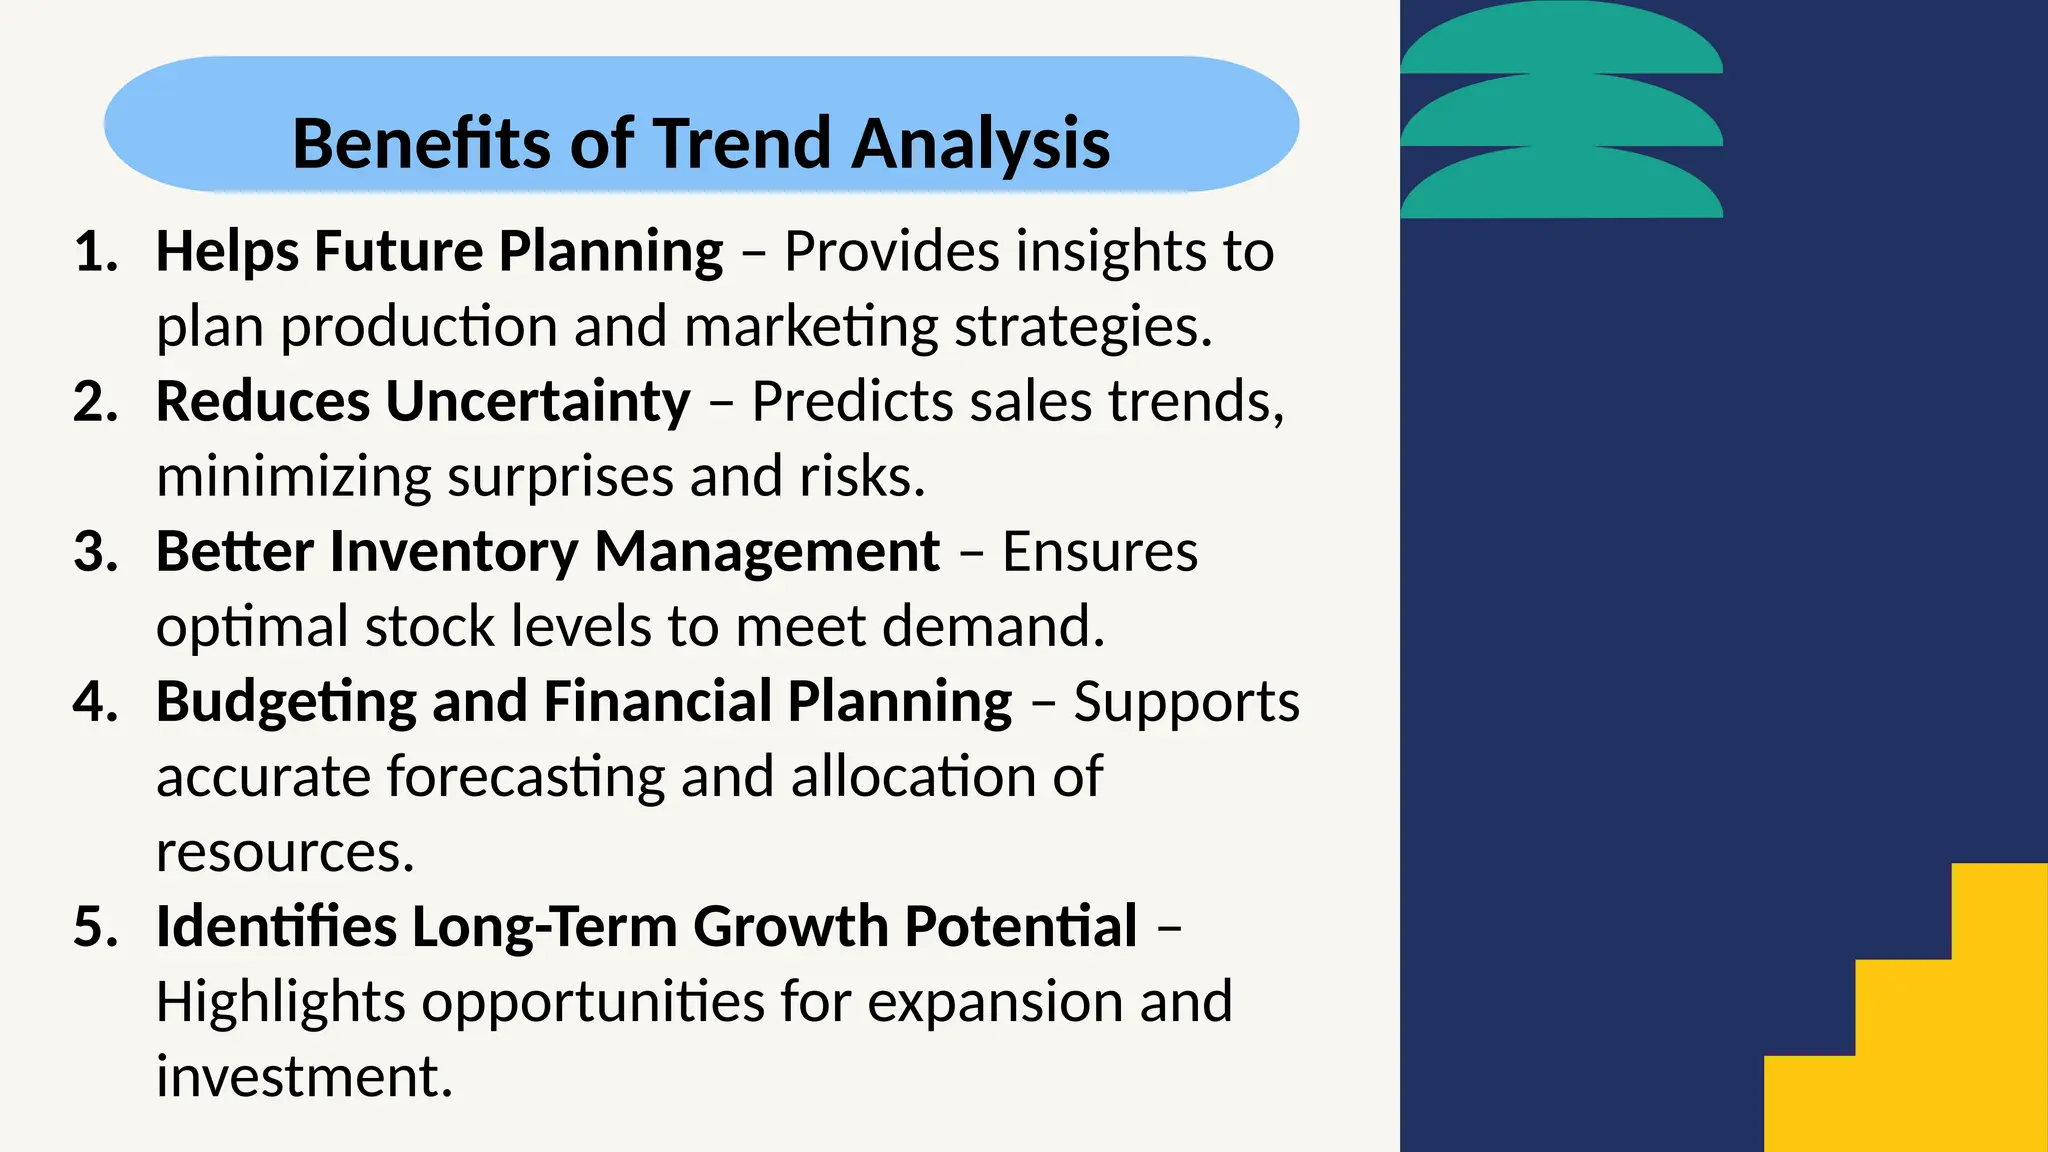
Benefits of TrendAnalysis
1. Helps Future Planning – Provides insights to
plan production and marketing strategies.
2. Reduces Uncertainty – Predicts sales trends,
minimizing surprises and risks.
3. Better Inventory Management – Ensures
optimal stock levels to meet demand.
4. Budgeting and Financial Planning – Supports
accurate forecasting and allocation of
resources.
5. Identifies Long-Term Growth Potential –
Highlights opportunities for expansion and
investment.
10.
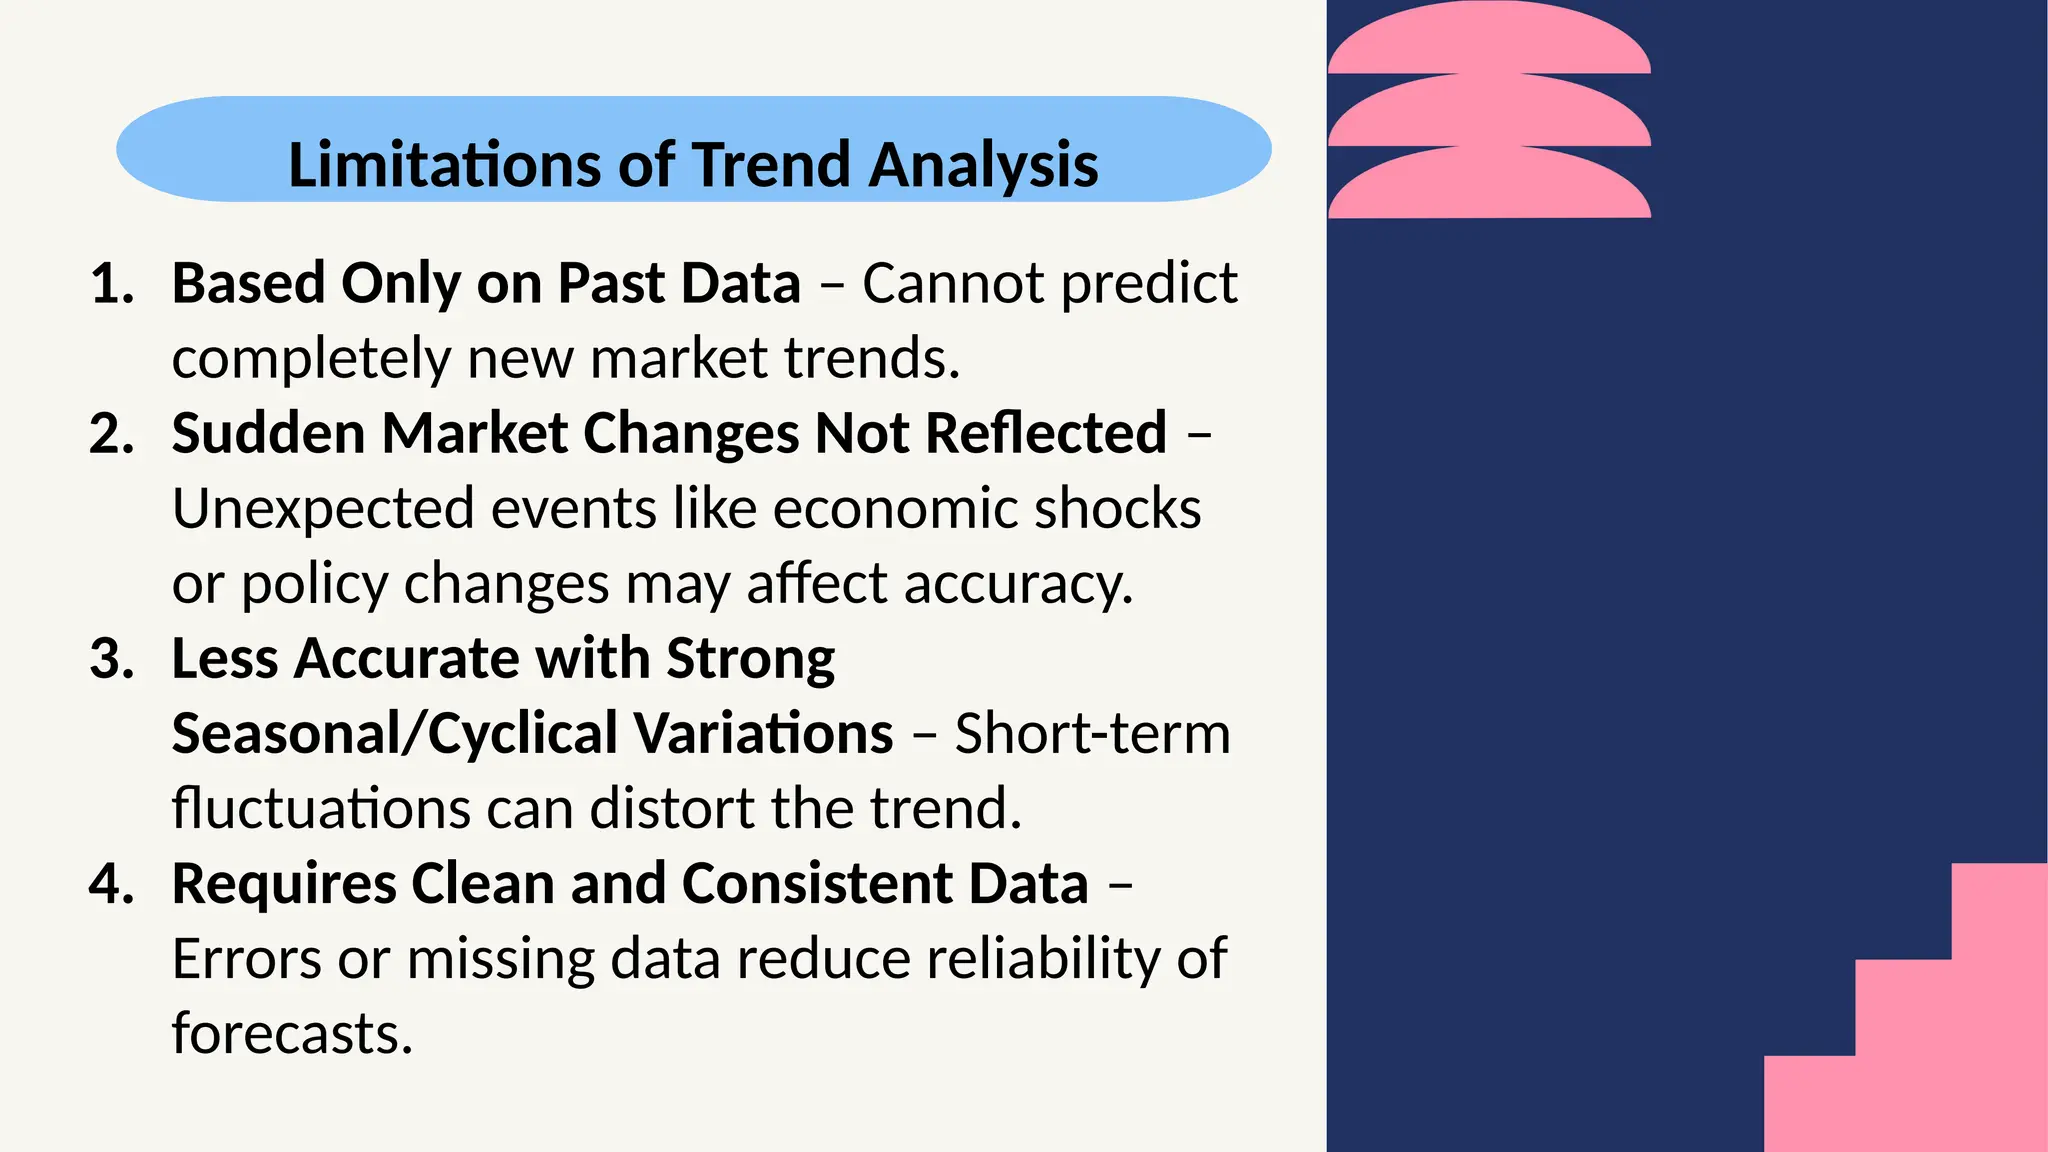
Limitations of TrendAnalysis
1. Based Only on Past Data – Cannot predict
completely new market trends.
2. Sudden Market Changes Not Reflected –
Unexpected events like economic shocks
or policy changes may affect accuracy.
3. Less Accurate with Strong
Seasonal/Cyclical Variations – Short-term
fluctuations can distort the trend.
4. Requires Clean and Consistent Data –
Errors or missing data reduce reliability of
forecasts.
11.
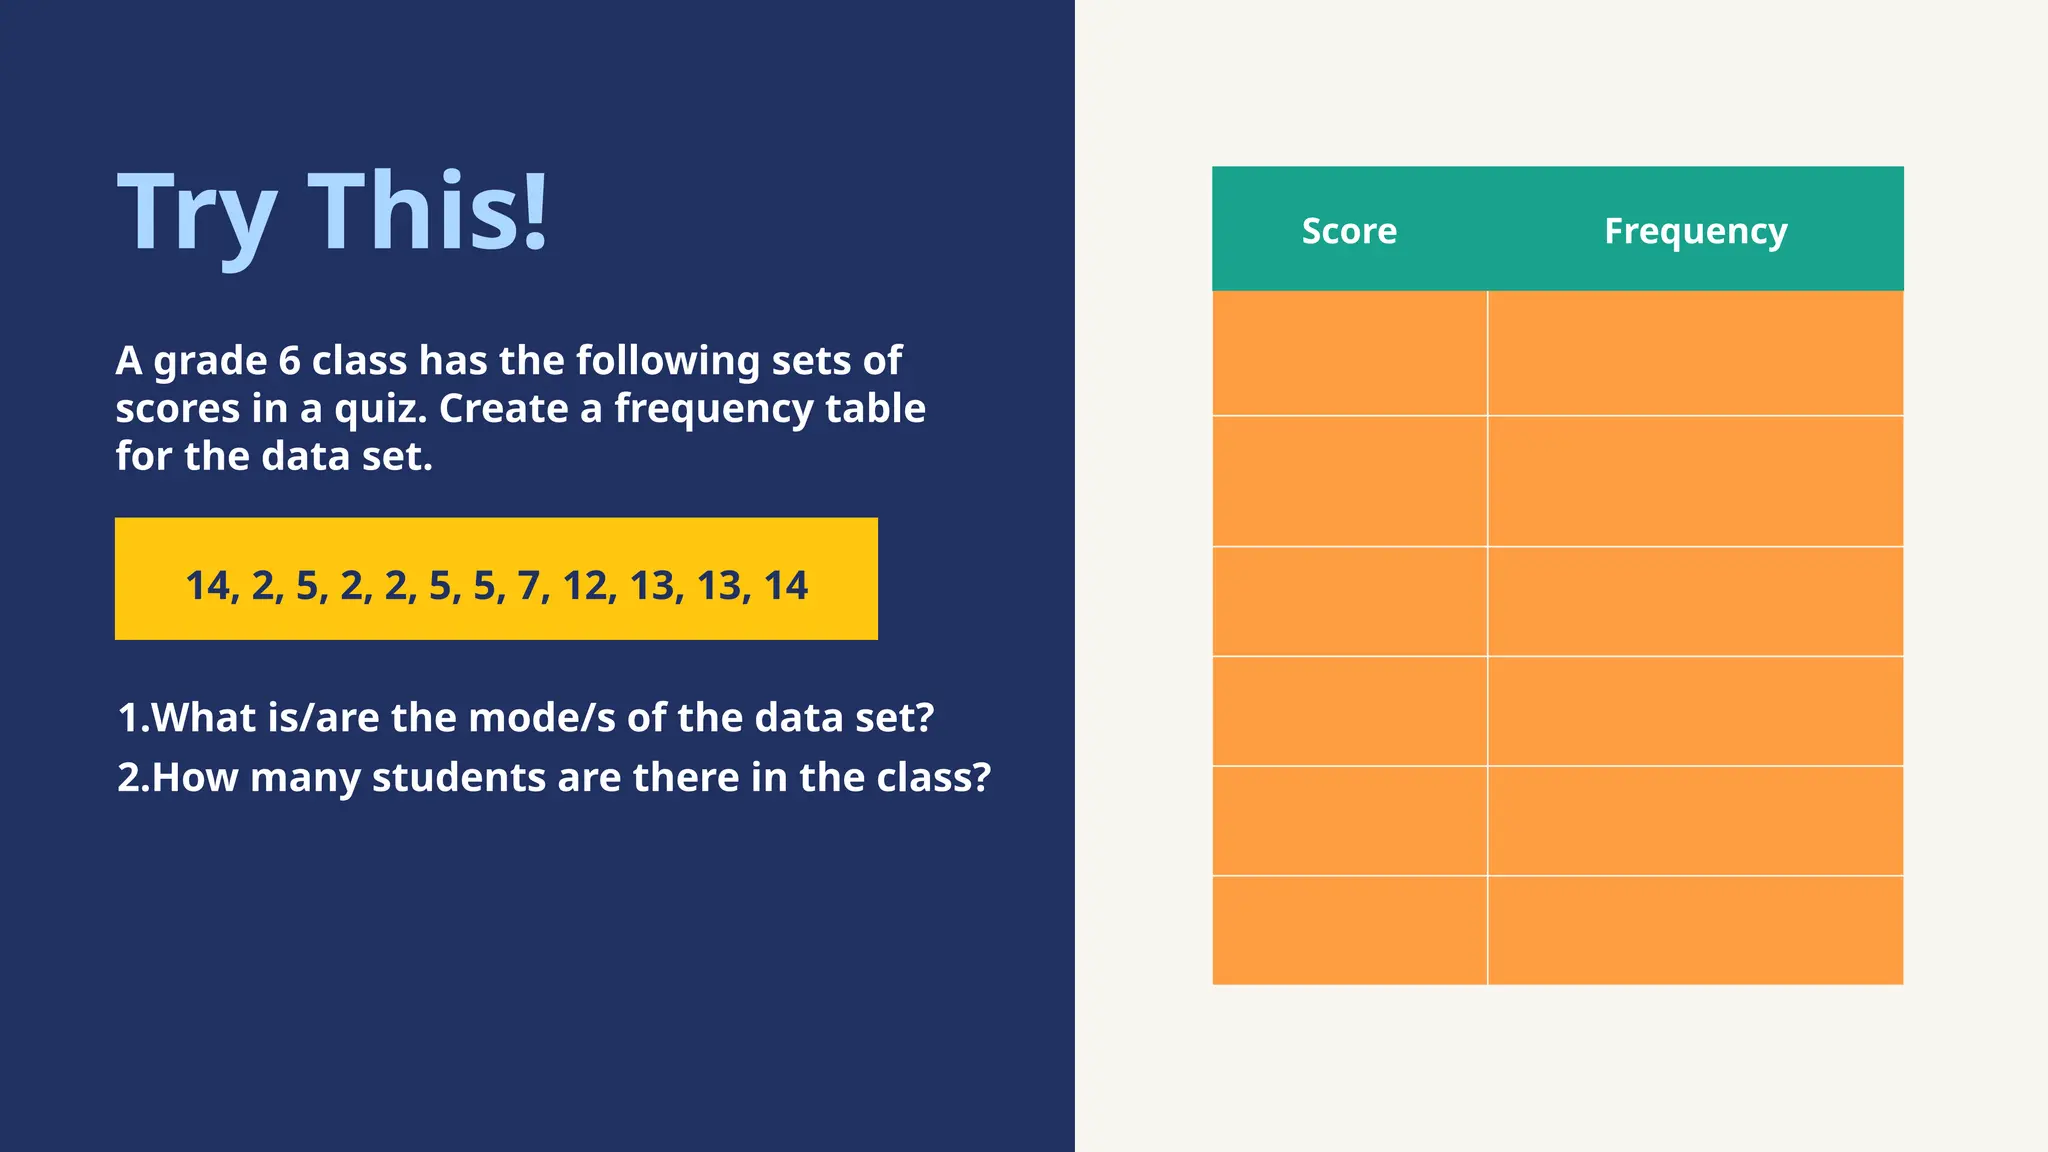
14, 2, 5,2, 2, 5, 5, 7, 12, 13, 13, 14
Try This! Score Frequency
A grade 6 class has the following sets of
scores in a quiz. Create a frequency table
for the data set.
1.What is/are the mode/s of the data set?
2.How many students are there in the class?
12.
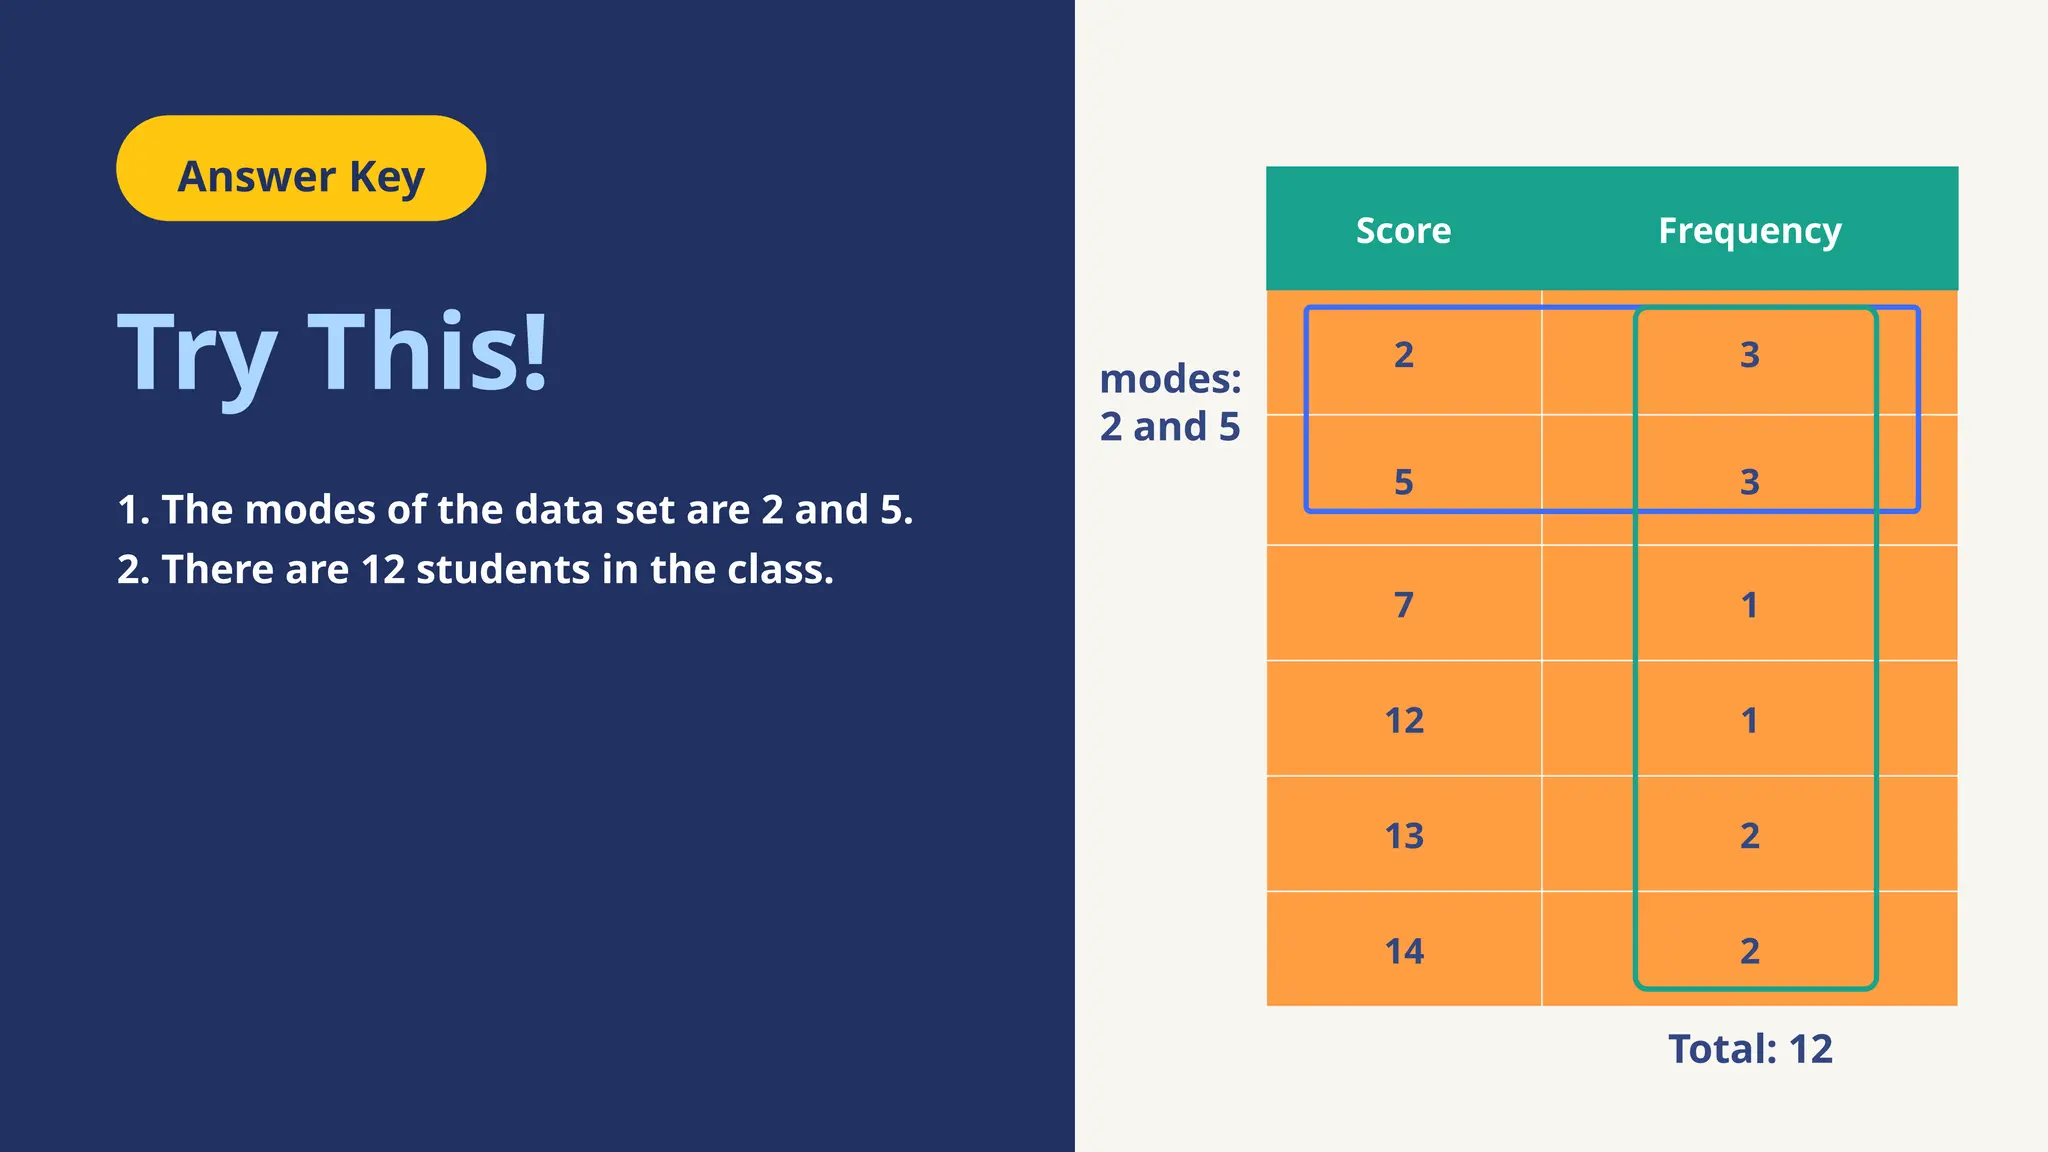
Score Frequency
2 3
53
7 1
12 1
13 2
14 2
Answer Key
Try This!
1. The modes of the data set are 2 and 5.
2. There are 12 students in the class.
Total: 12
modes:
2 and 5
13.
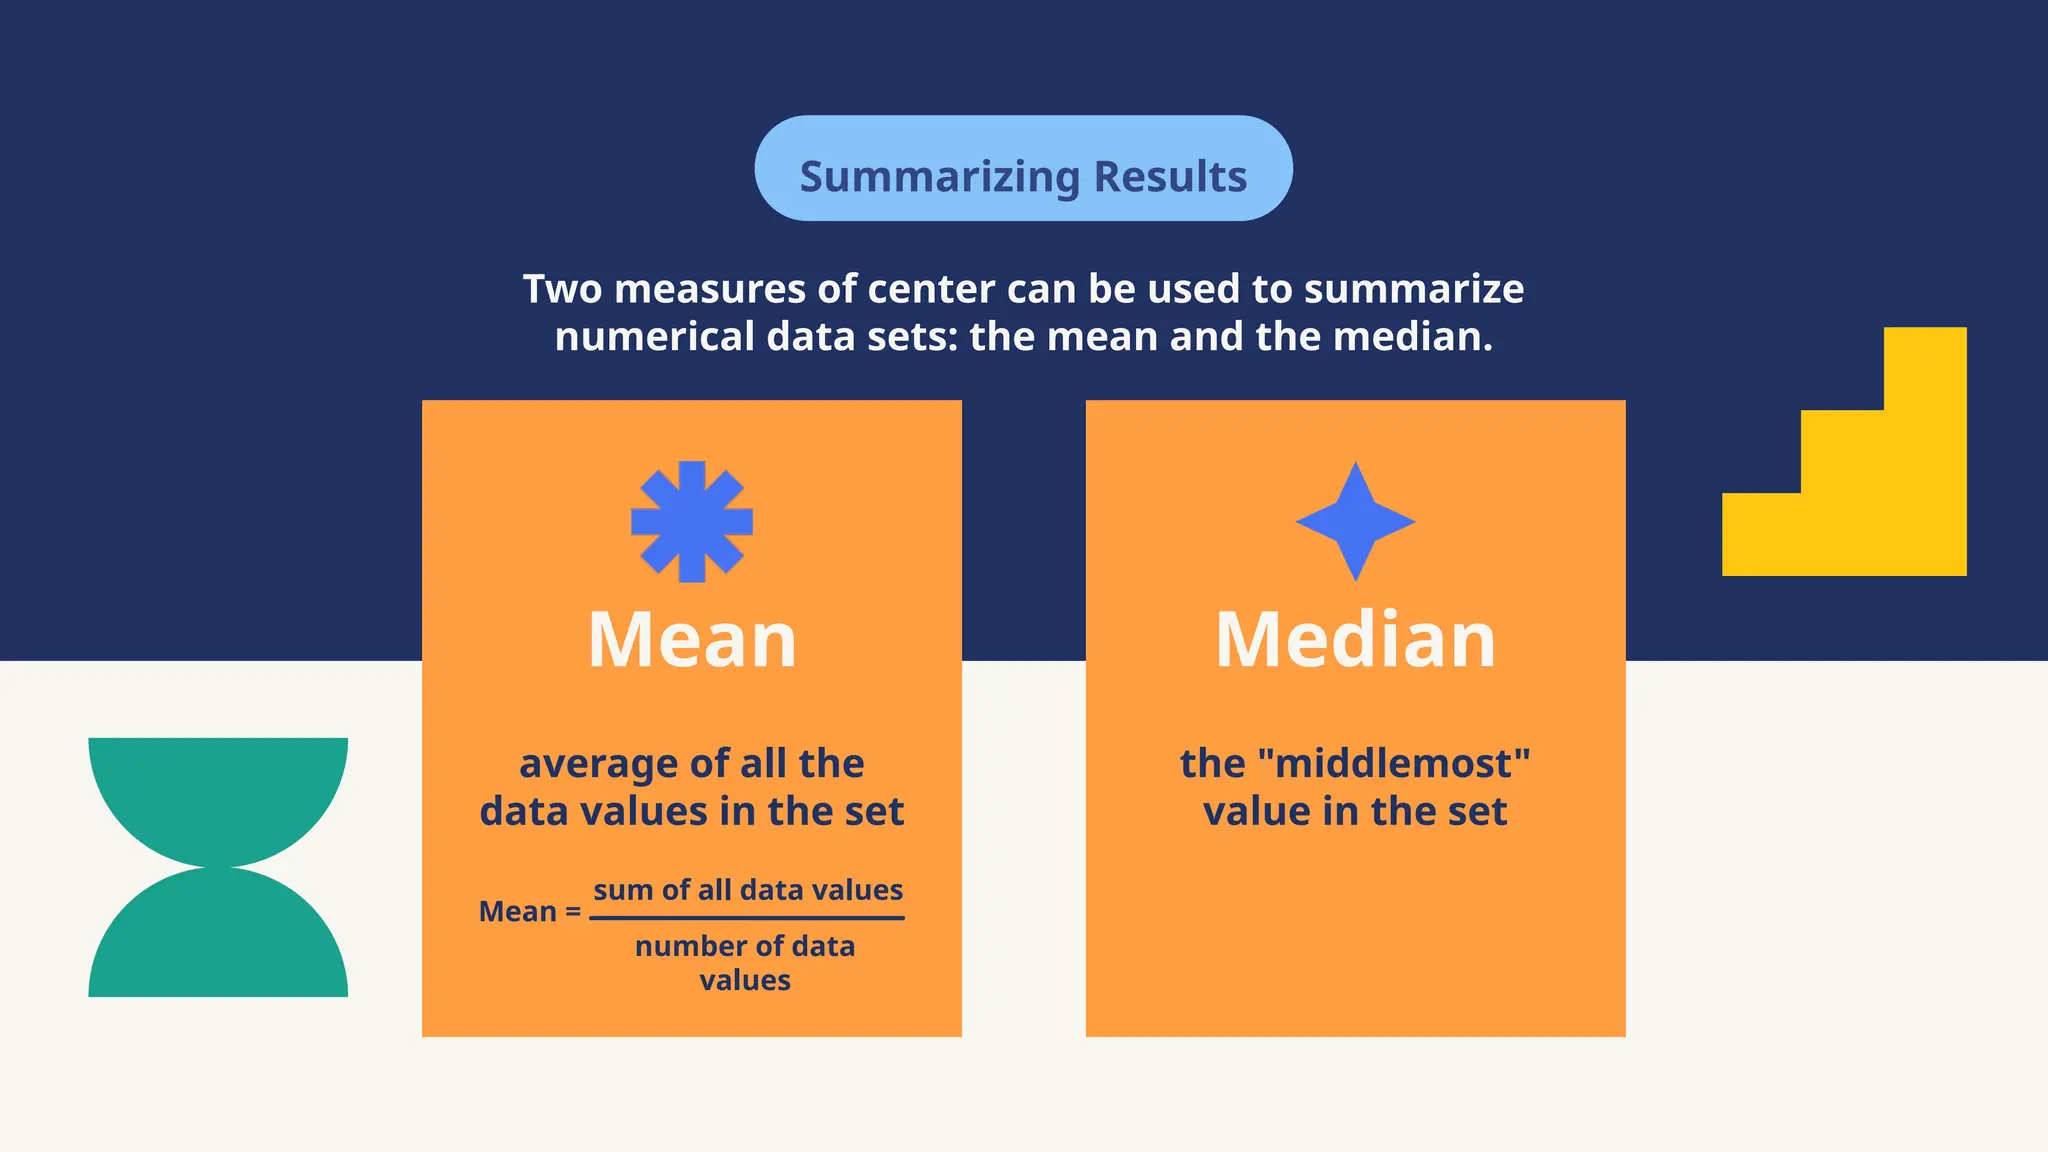
Summarizing Results
Mean Median
Twomeasures of center can be used to summarize
numerical data sets: the mean and the median.
average of all the
data values in the set
the "middlemost"
value in the set
Mean =
sum of all data values
number of data
values
14.
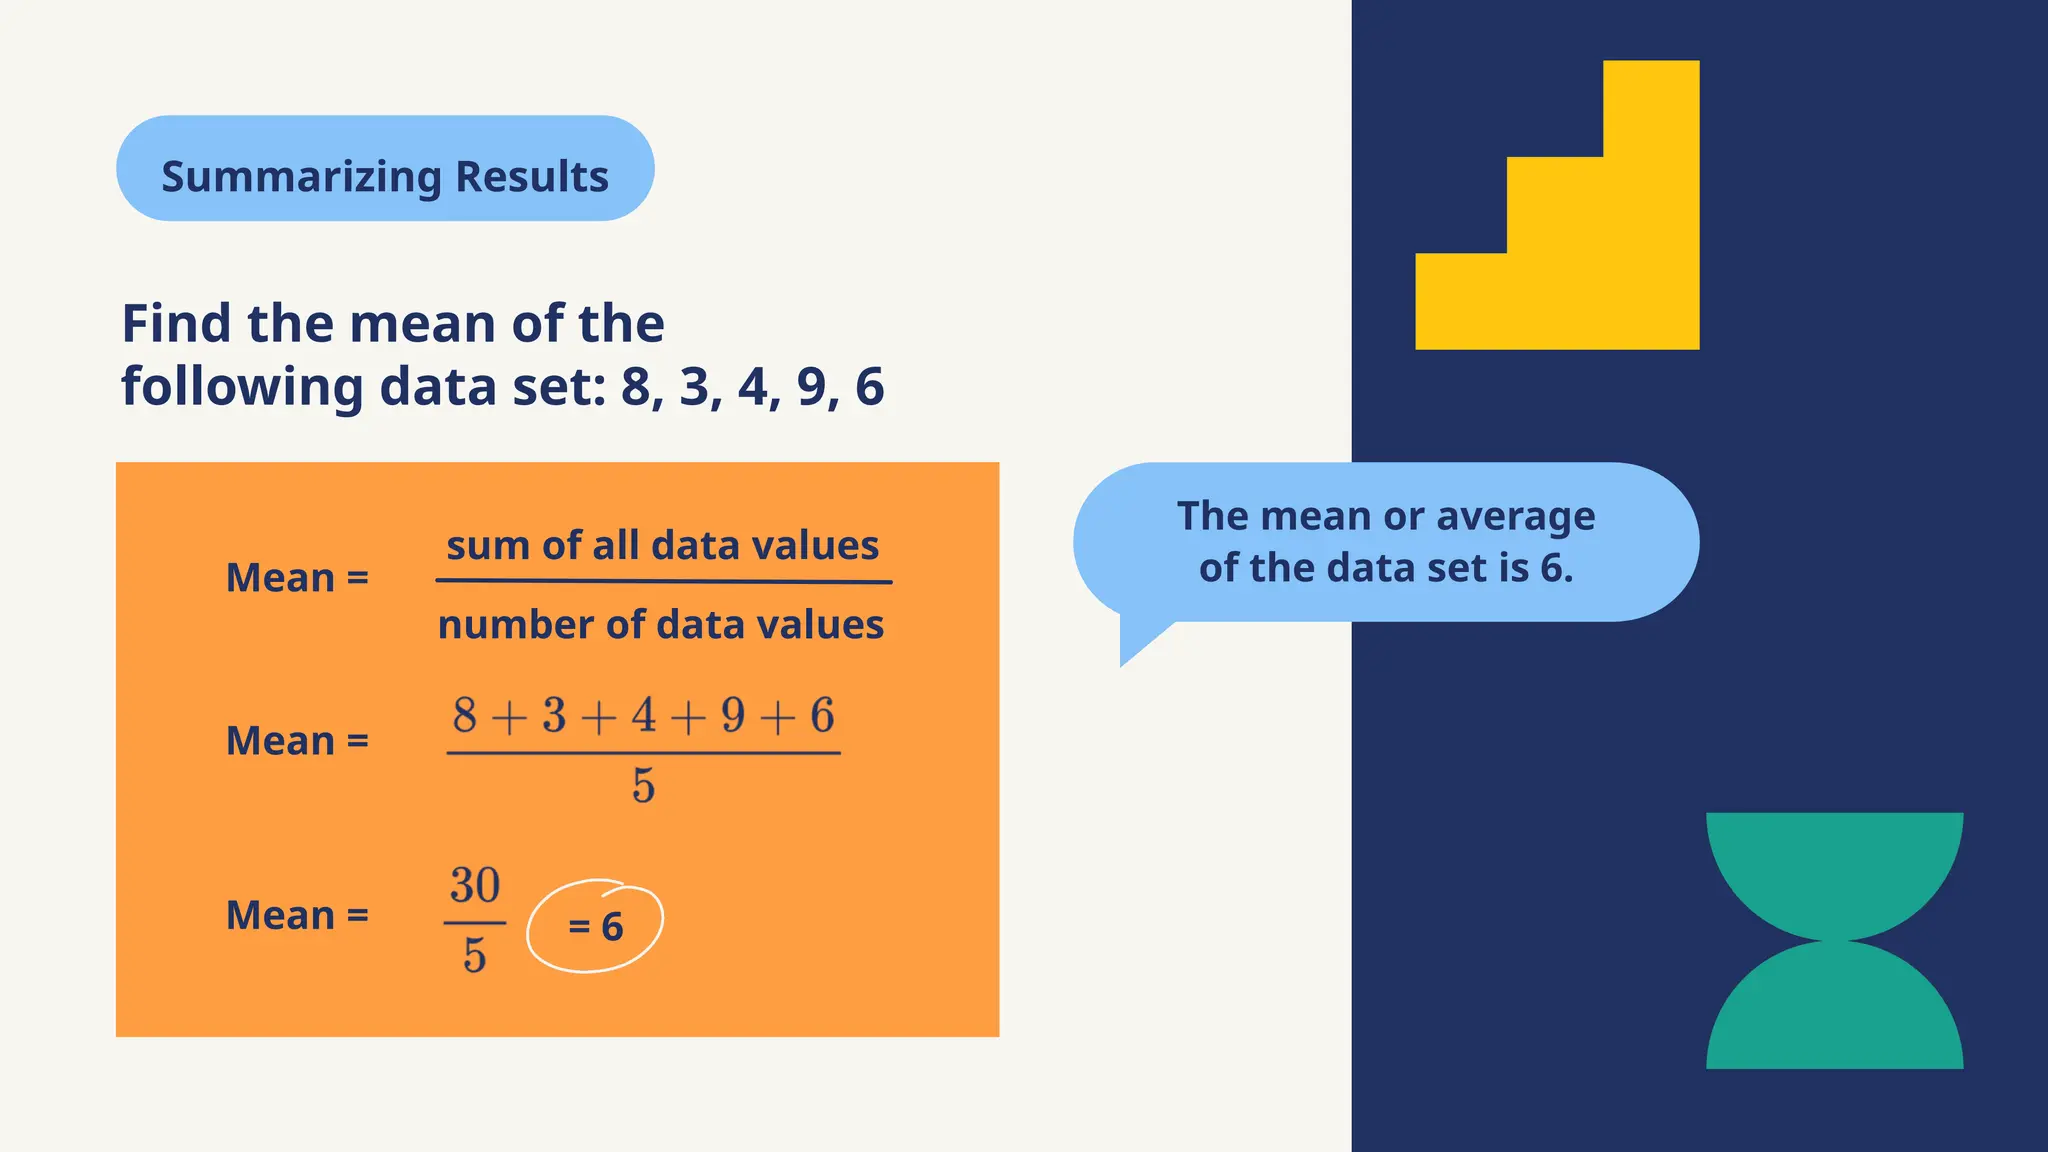
The mean oraverage
of the data set is 6.
Find the mean of the
following data set: 8, 3, 4, 9, 6
Summarizing Results
Mean =
sum of all data values
number of data values
Mean =
Mean = = 6
15.
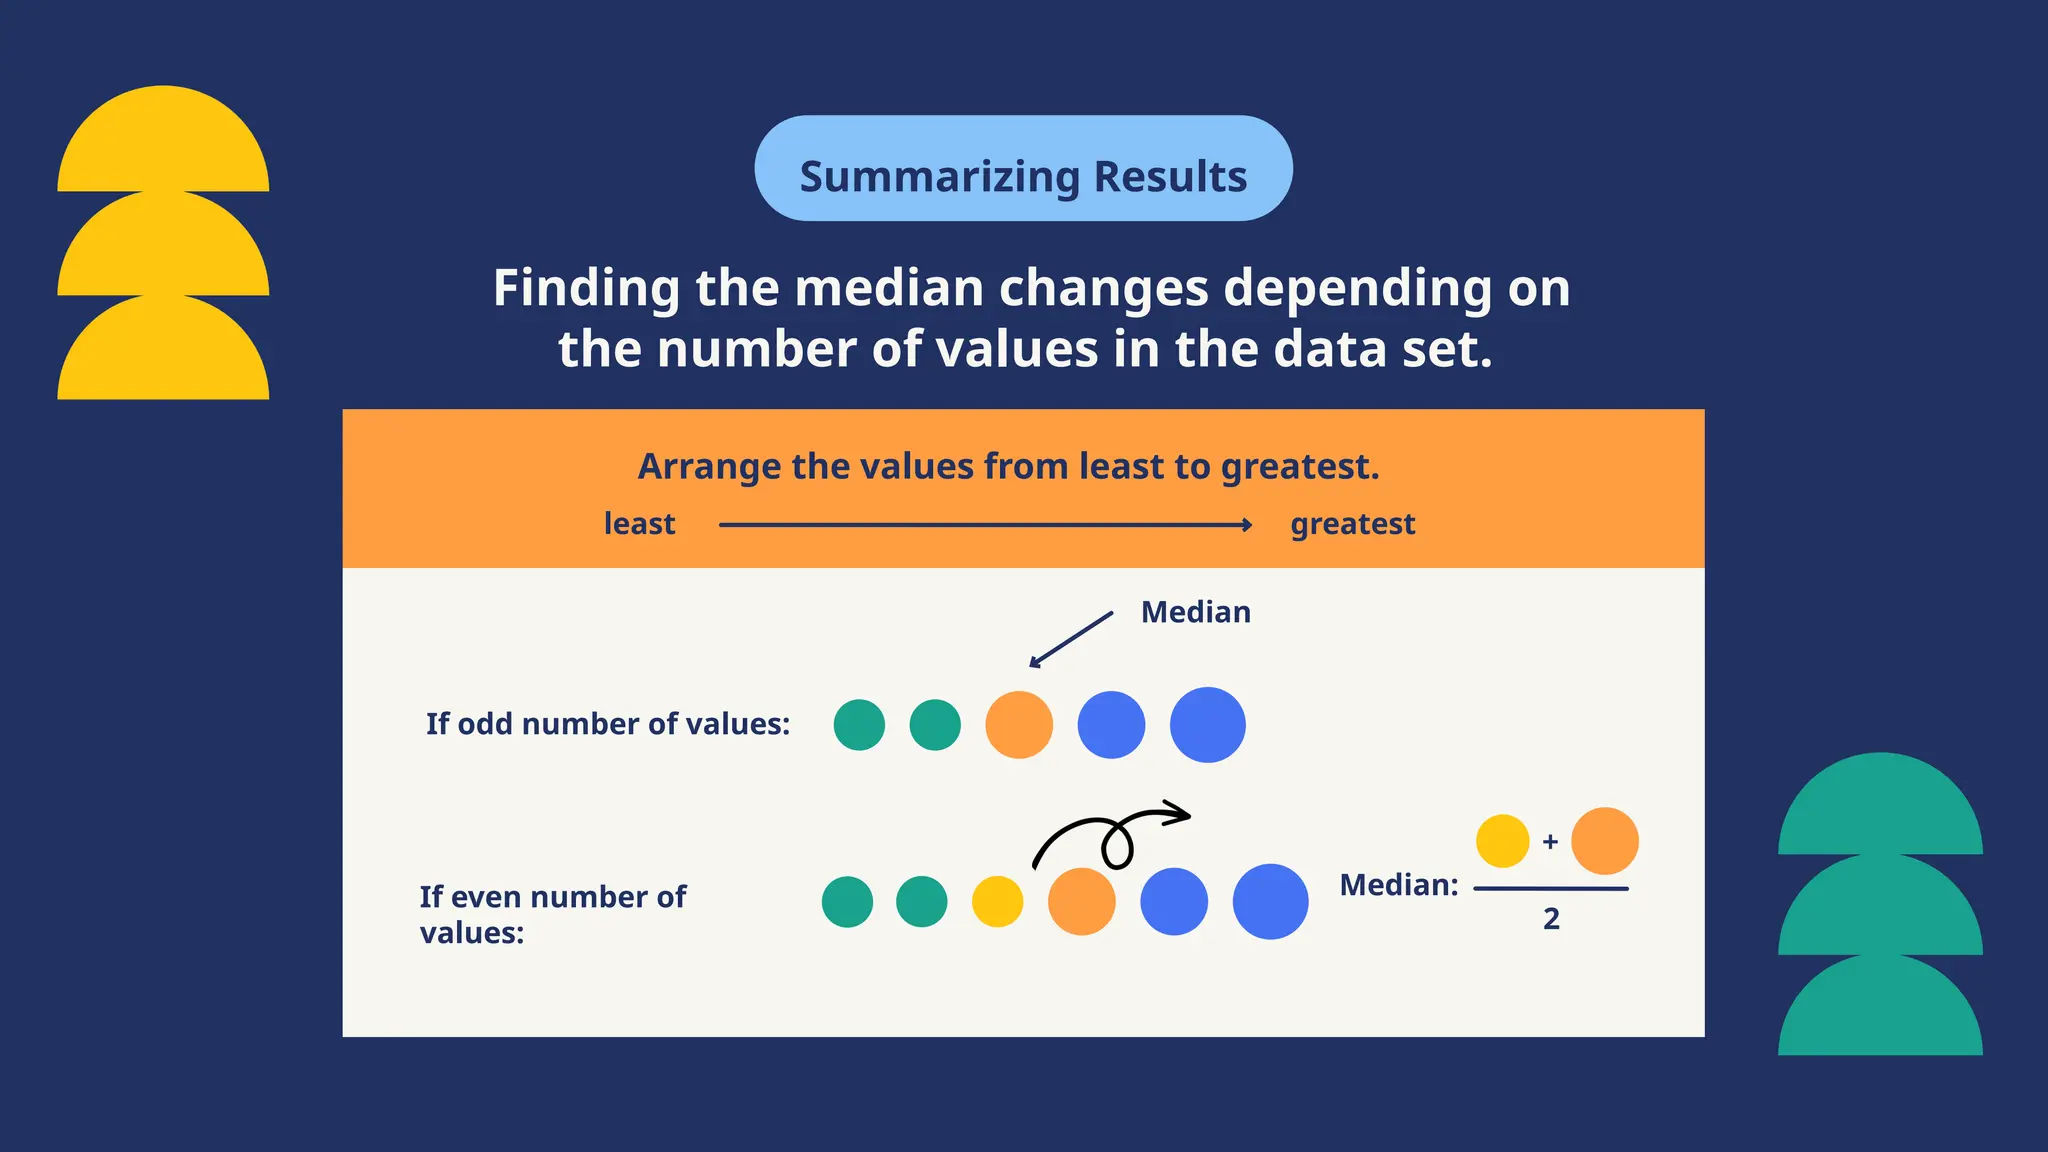
Summarizing Results
Finding themedian changes depending on
the number of values in the data set.
Arrange the values from least to greatest.
least greatest
Median
If odd number of values:
If even number of
values:
Median:
+
2
16.
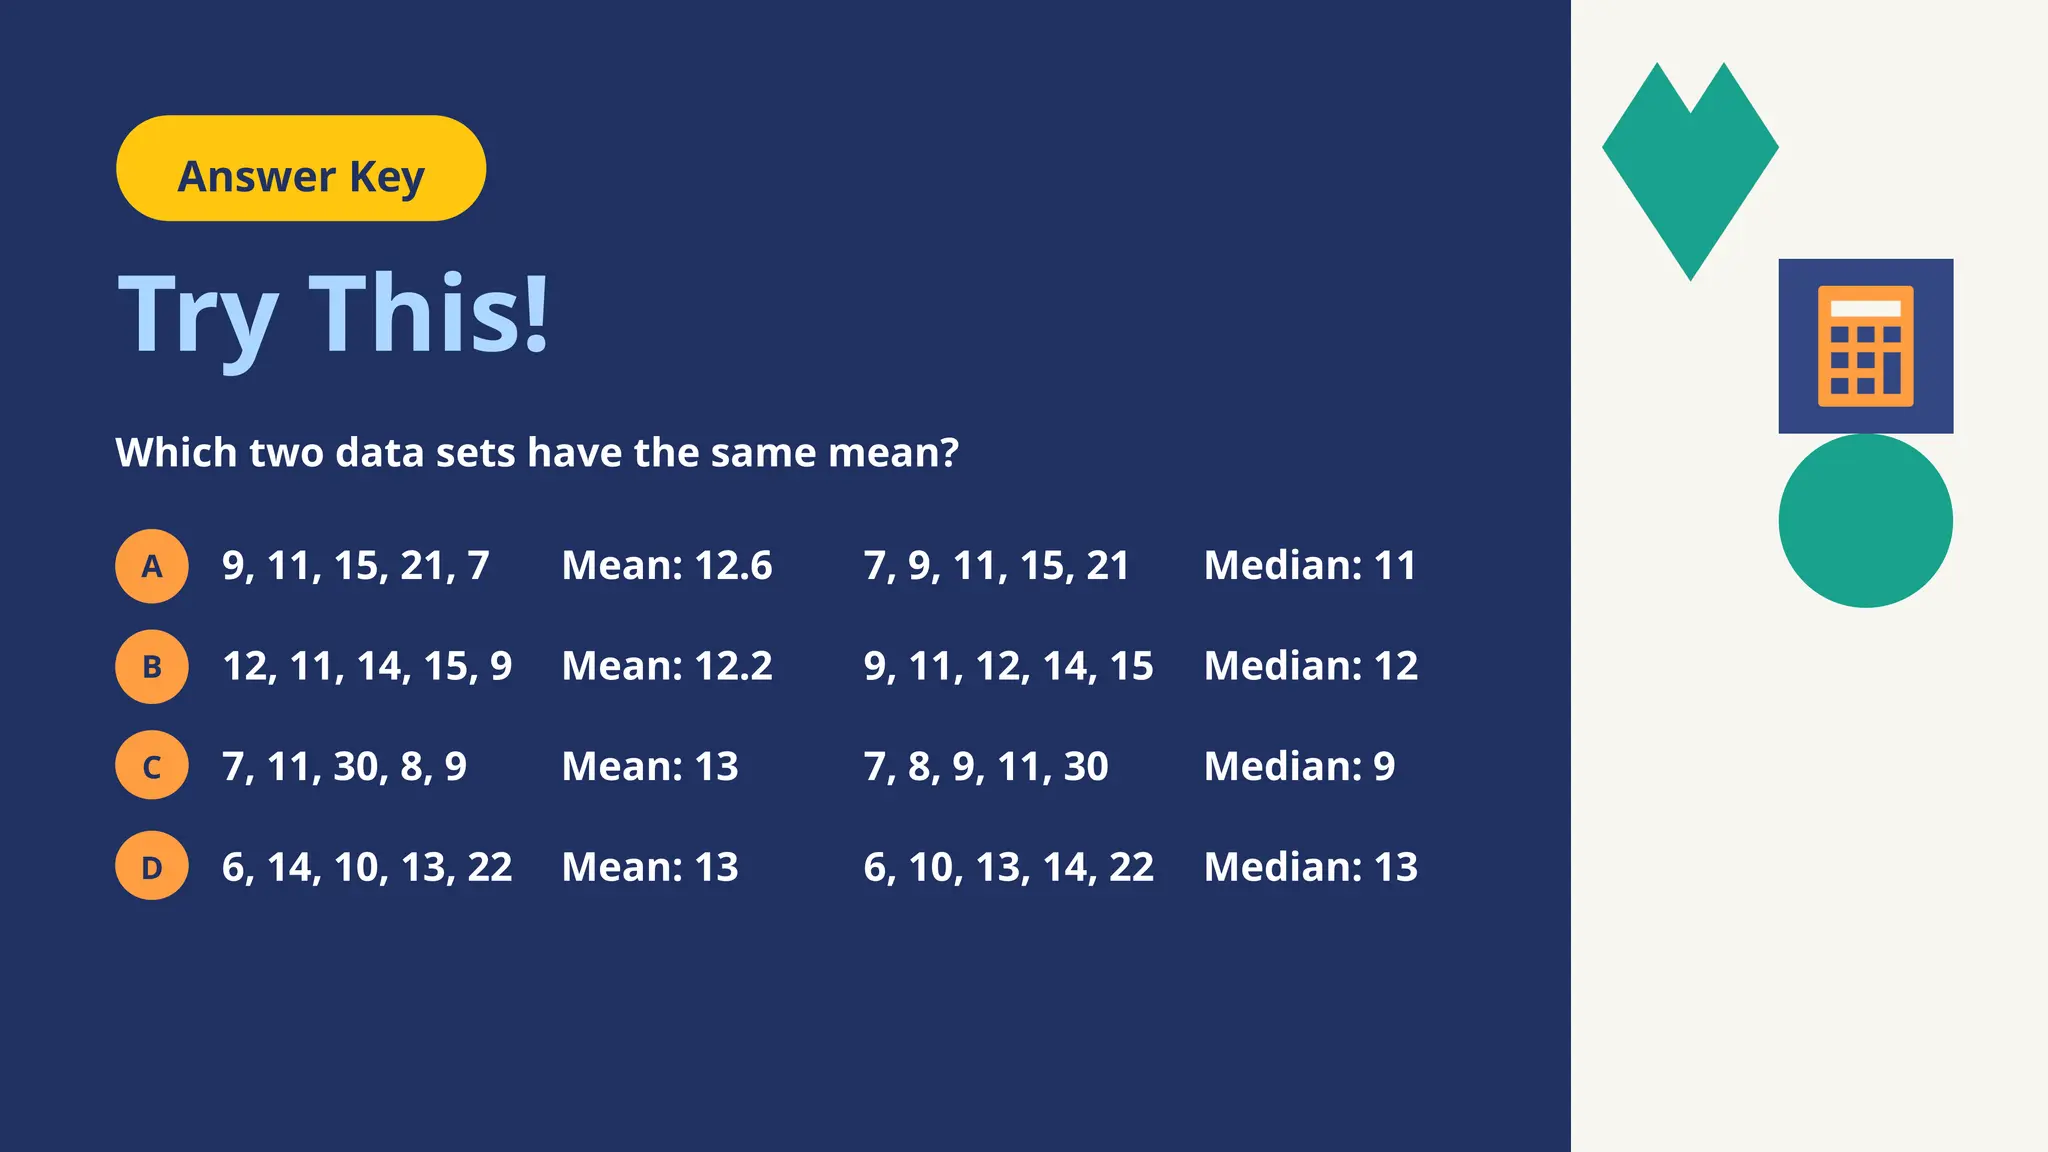
Answer Key
Try This!
Whichtwo data sets have the same mean?
9, 11, 15, 21, 7
12, 11, 14, 15, 9
7, 11, 30, 8, 9
6, 14, 10, 13, 22
C and D have the same mean of 13.
Mean: 13
Mean: 13
Mean: 12.6 7, 9, 11, 15, 21 Median: 11
Mean: 12.2 9, 11, 12, 14, 15 Median: 12
7, 8, 9, 11, 30 Median: 9
6, 10, 13, 14, 22 Median: 13
A
B
C
D
17.
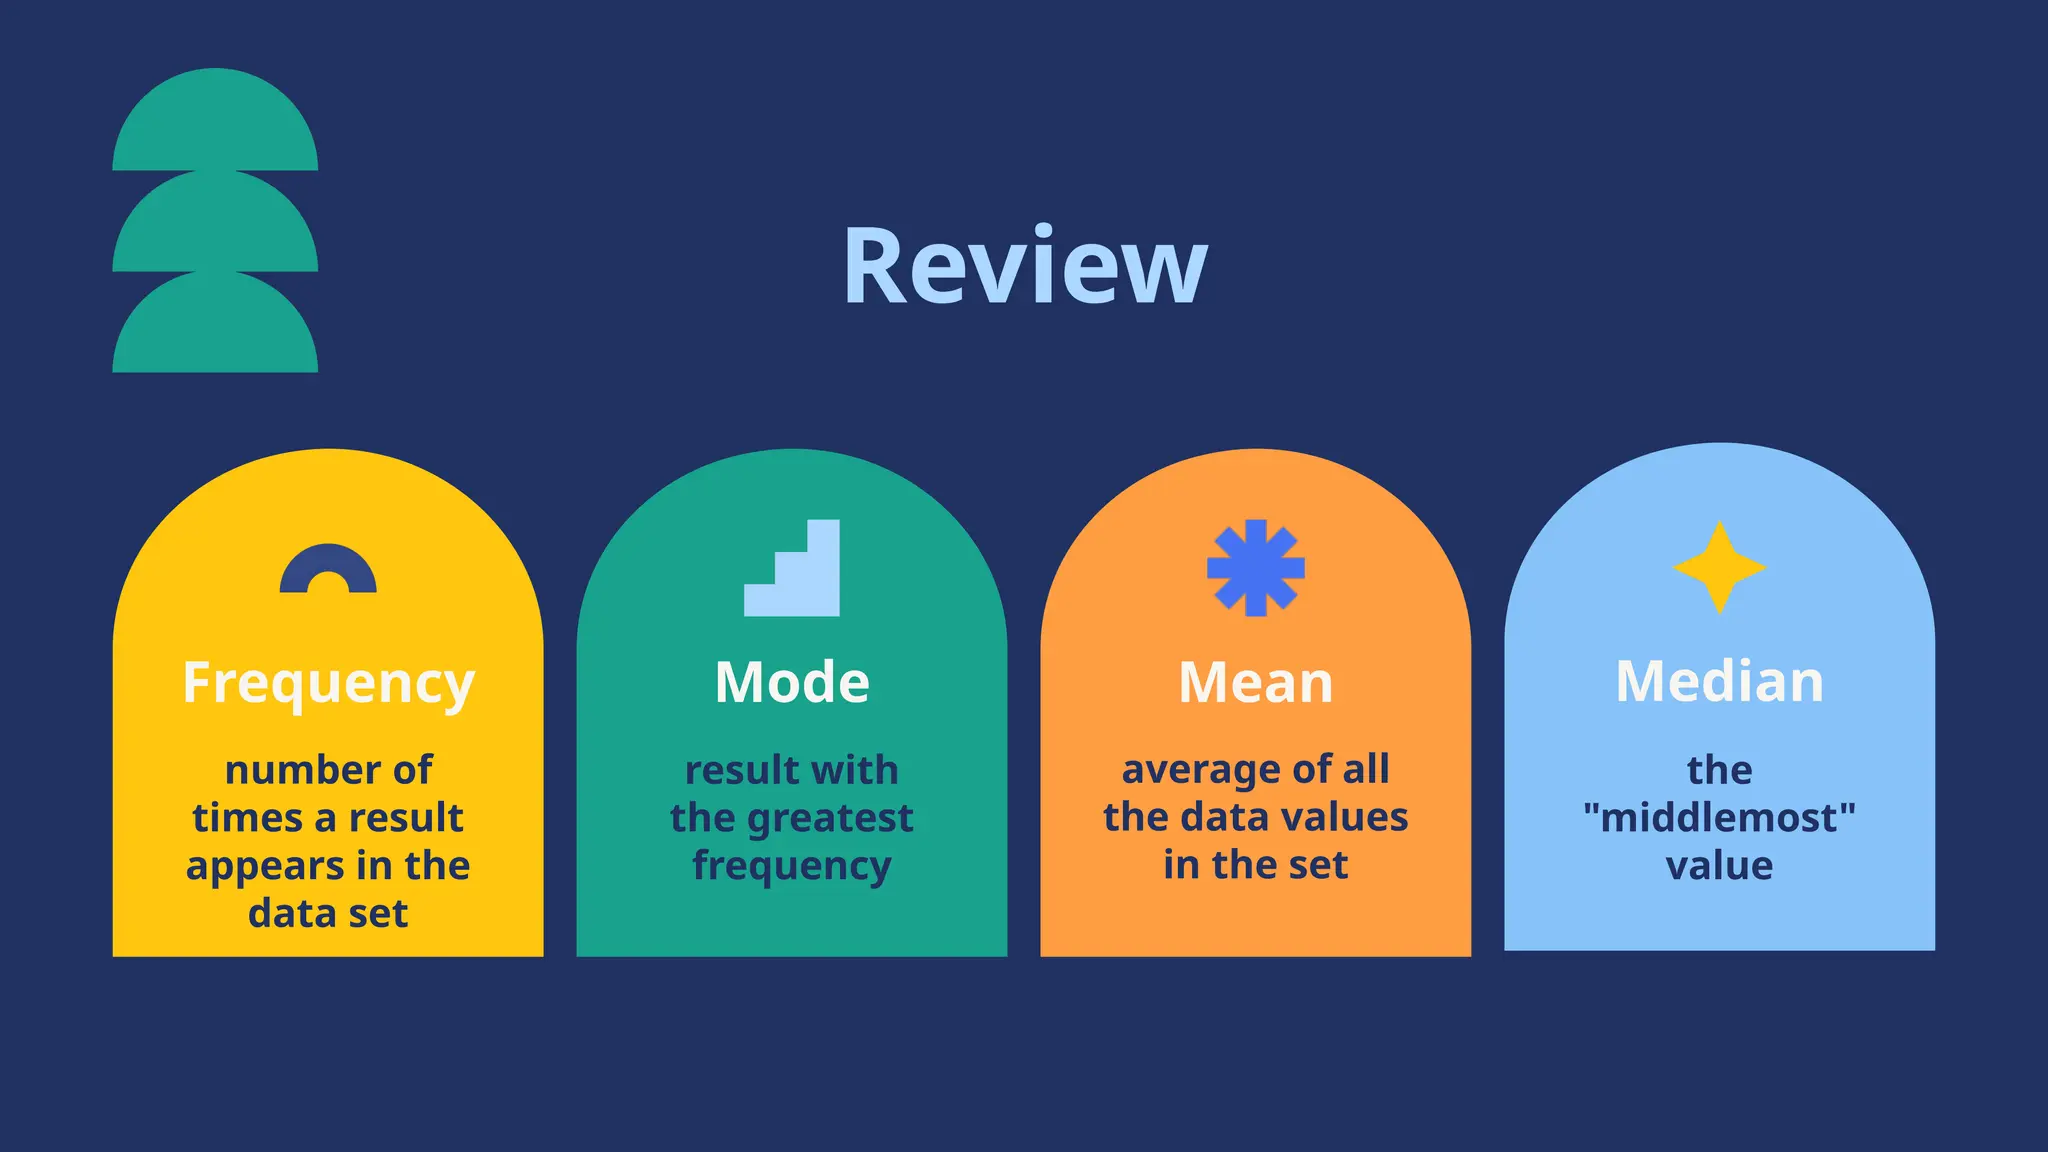
Mean
average of all
thedata values
in the set
Mode
result with
the greatest
frequency
Frequency
number of
times a result
appears in the
data set
Median
the
"middlemost"
value
Review
18.
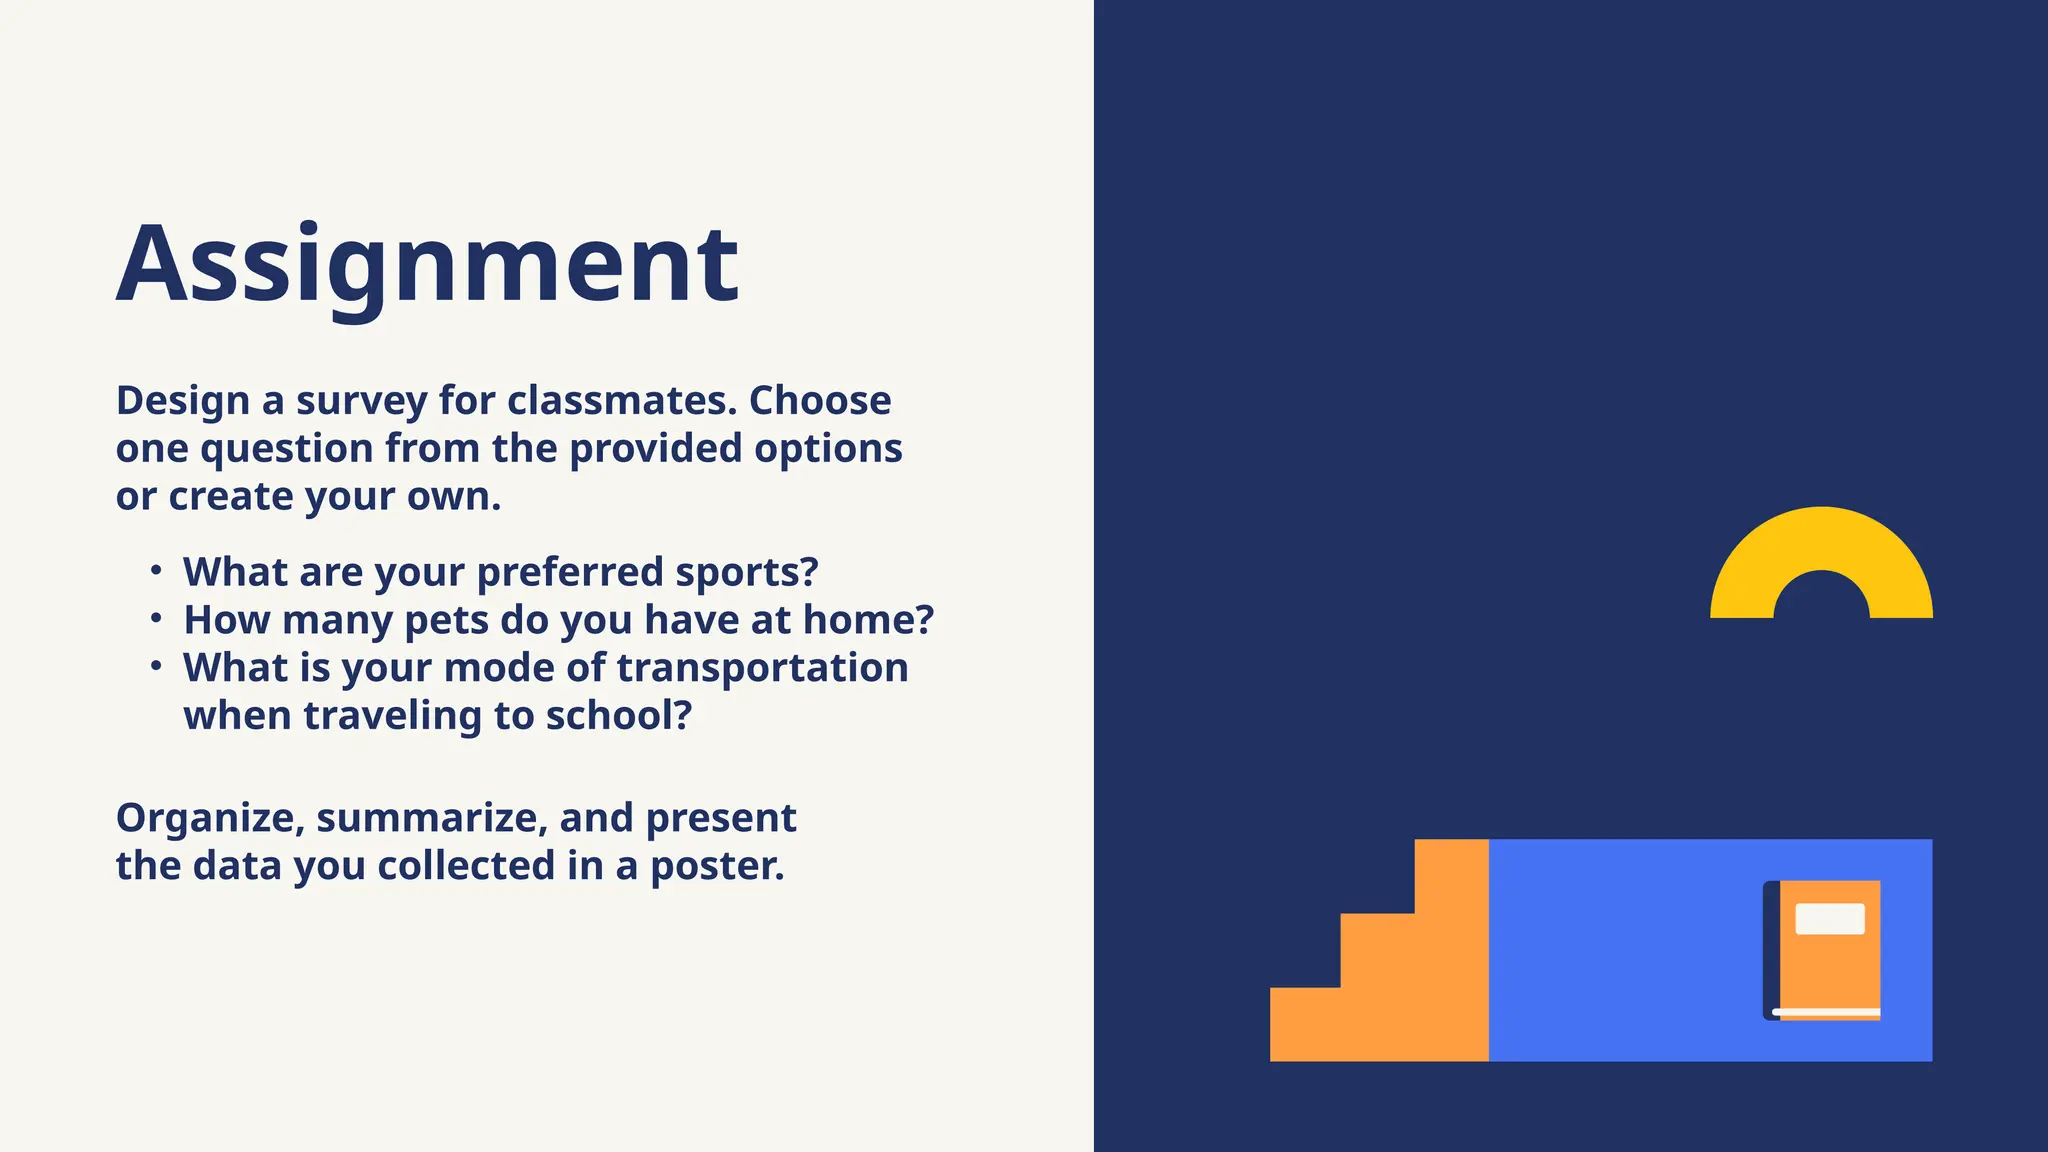
Design a surveyfor classmates. Choose
one question from the provided options
or create your own.
• What are your preferred sports?
• How many pets do you have at home?
• What is your mode of transportation
when traveling to school?
Organize, summarize, and present
the data you collected in a poster.
Assignment
19.
Reference
Mathspace. "Statistics." Accessed14 June 2023,
https://mathspace.co/textbooks/syllabuses/Syllabus-1155/topics/Topic-
21893/subtopics/Subtopic-279788/?searchString=&activeTab=worksheet.
20.
Resource
Page
Use these iconsand
illustrations in your Canva
Presentation. Happy
designing! Don't forget to
delete this page before
presenting.
21.
Try this backgroundfor online class.
*Please delete this section before downloading.
22.
Press these
keys while
onPresent
mode!
B for blur C for confetti
O for bubbles
D for a drumroll M for mic drop
U for unveil
O for quiet
0-9 Any number from
0-9 for a timer