UTILITY:
► The propertyof a commodity that satisfies a want or need of a consumer.
► In other words, it refers to the want satisfying power of a commodity.
► Commodity will possess utility only if it satisfies a want.
► Utility differs from person to person, place to place, and time to time
► In other words the satisfaction that a consumer derives from the consumption of commodities is termed
utility.
► For eg. Suppose a consumer eats 5 oranges. The total satisfaction the consumer gets from this is called
total utility.
► Suppose he/she now consumes an extra orange. The extra satisfaction obtained from consuming this
orange is called ‘Marginal Utility’ of the 6th
orange.
► 2 waysof measuring utility
► 1) Cardinal Approach
► 2) Ordinal Approach
► Cardinal Utility theory says that utility is measurable just as prices and quantities are.i.e we can assign
number of UTILS to each commodity
► For eg. An orange = 5 utils
► An apple = 6 utils
► The ordinal utility theory says that utility is not measurable like prices and quanitites. But one can order
the utilities from different goods. That is, we can say whether the utility of an orange is less than, equal to
or greater than the utility of an apple.
5.
► Assumptions ofCardinal utility analysis
► 1. Utility is cardinal
► 2. The consumer is rational i.e the consumer always prefers more of goods and services to derive
maximum utility and he is assumed to have perfect knowledge of goods and services.
► 3. The consumers have limited money income which they spend on the purchase of all the goods and
services for their living.
► 4. The tastes and preferences of the consumer remain unchanged.
► 5. There is no time gap between the consumption of successive units. The consumer goes on consuming
the units one by one, without any break.
► 6. The utility is additive in nature.
6.
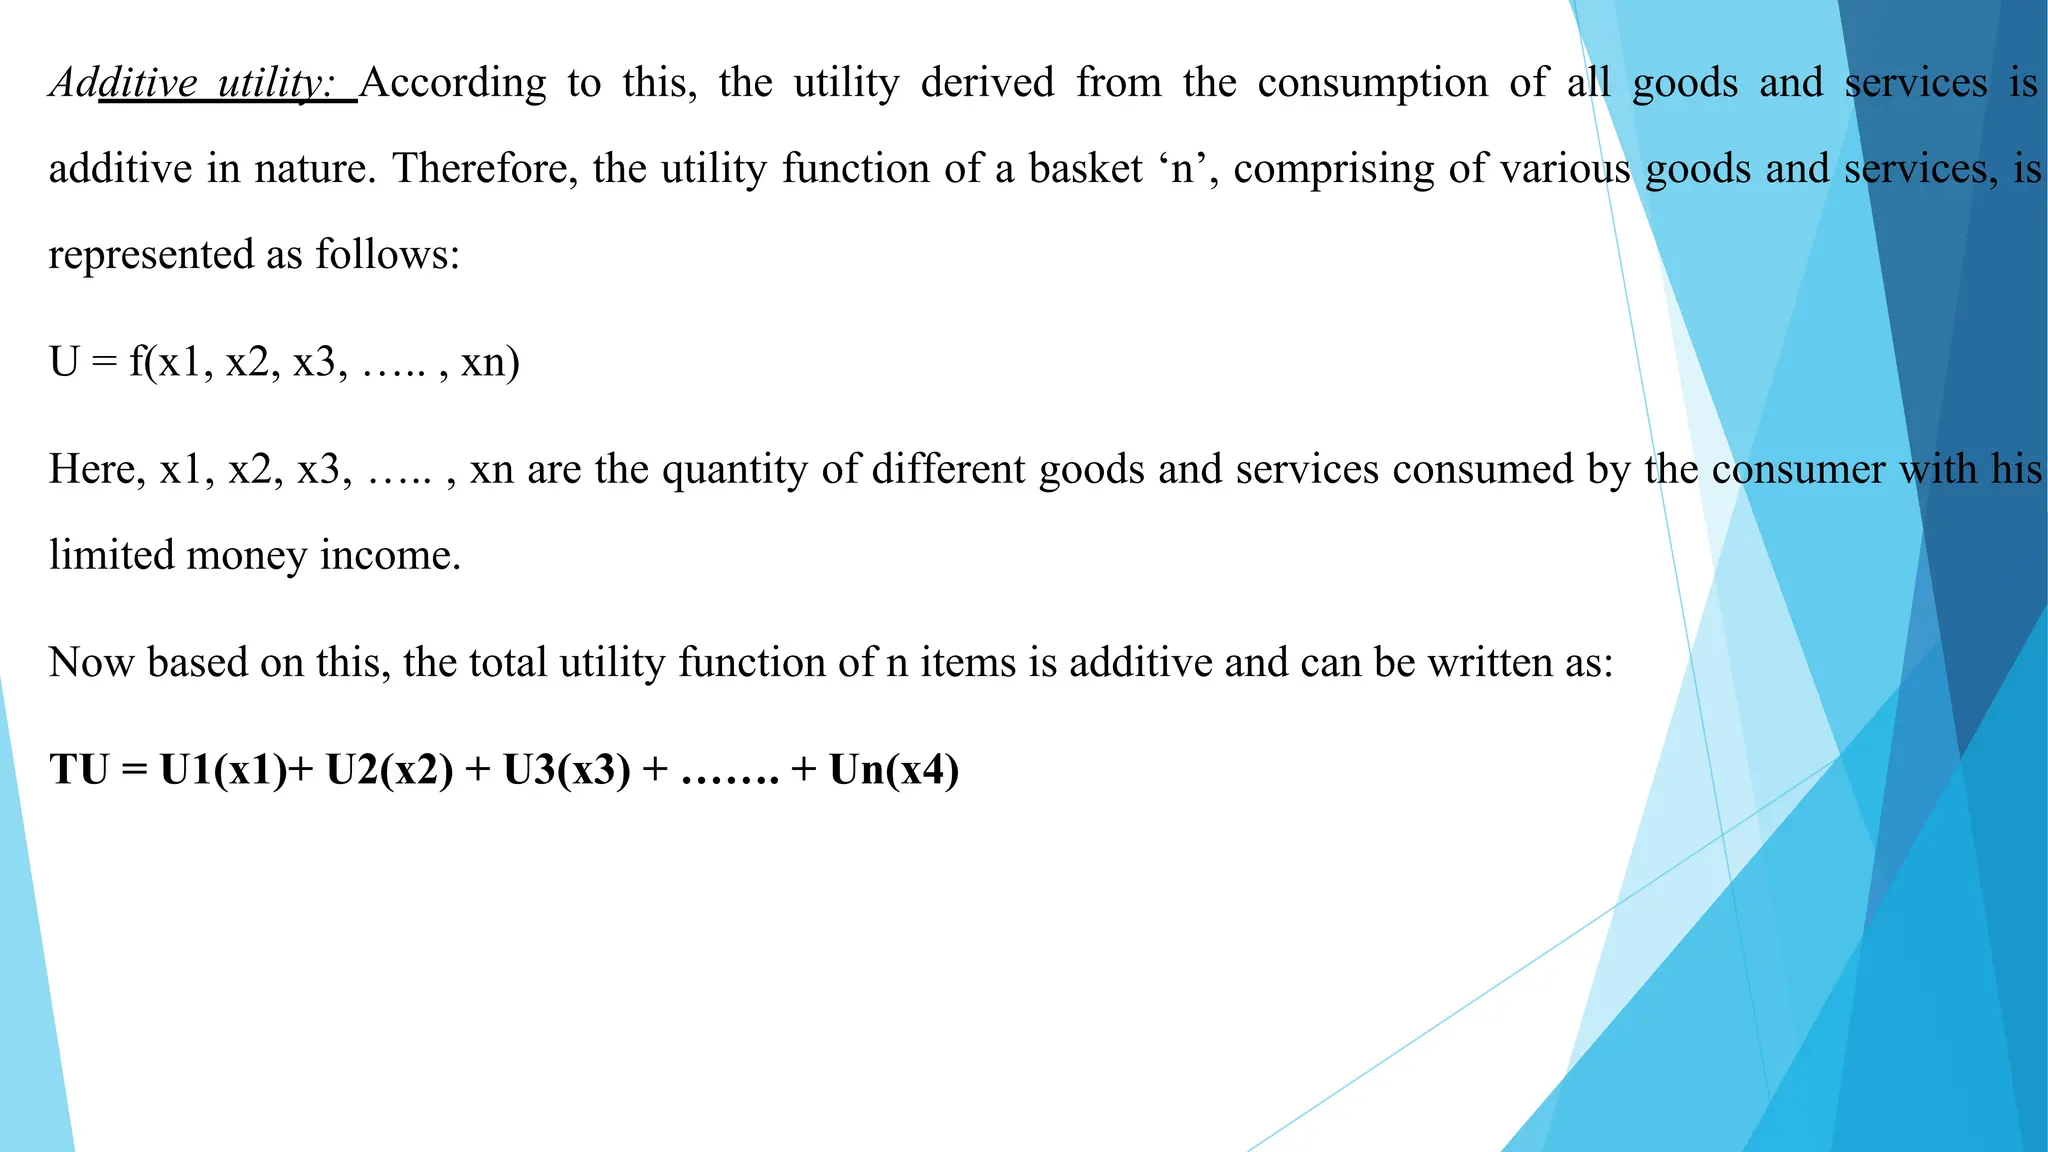
Additive utility: Accordingto this, the utility derived from the consumption of all goods and services is
additive in nature. Therefore, the utility function of a basket ‘n’, comprising of various goods and services, is
represented as follows:
U = f(x1, x2, x3, ….. , xn)
Here, x1, x2, x3, ….. , xn are the quantity of different goods and services consumed by the consumer with his
limited money income.
Now based on this, the total utility function of n items is additive and can be written as:
TU = U1(x1)+ U2(x2) + U3(x3) + ……. + Un(x4)
7.
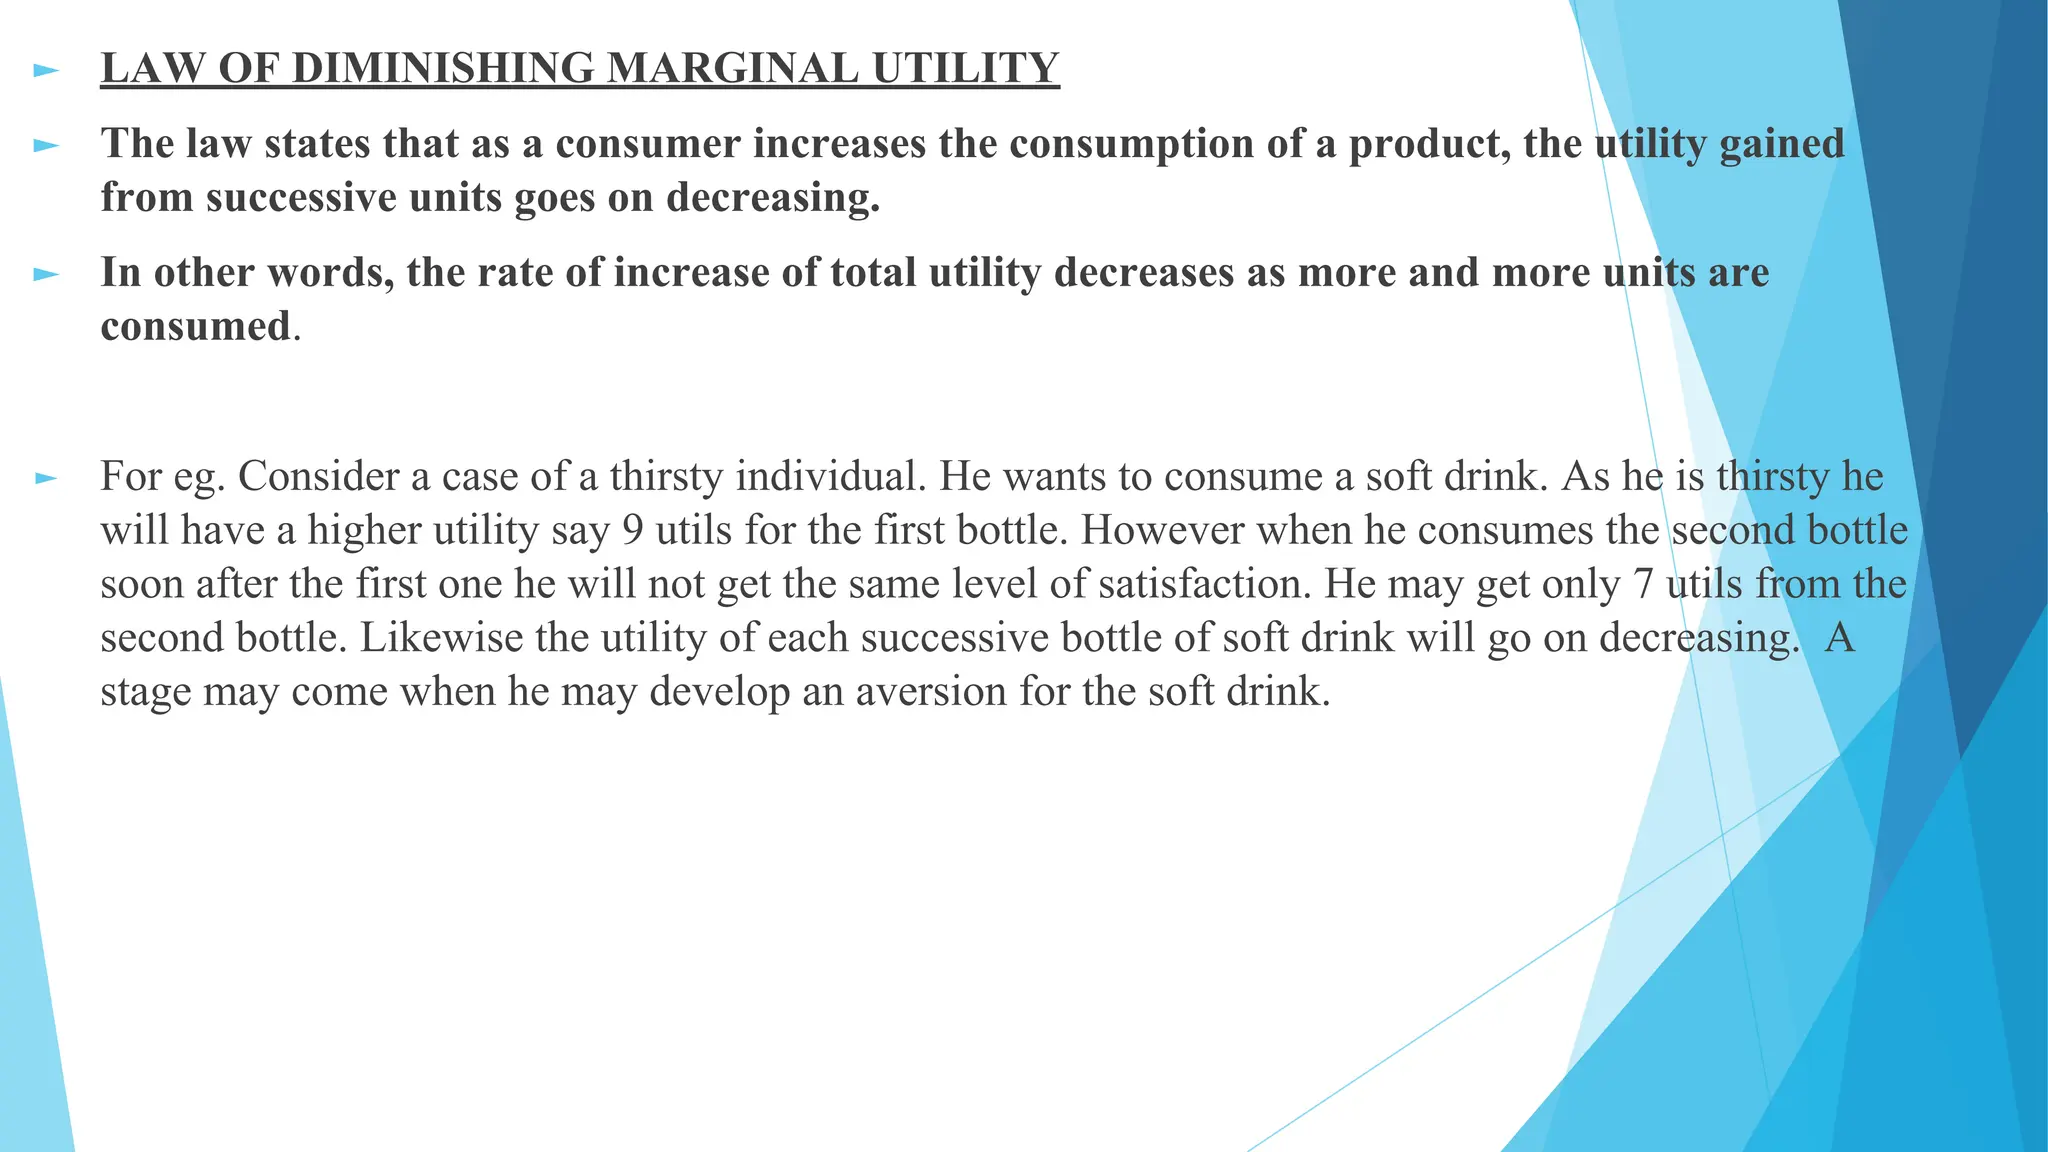
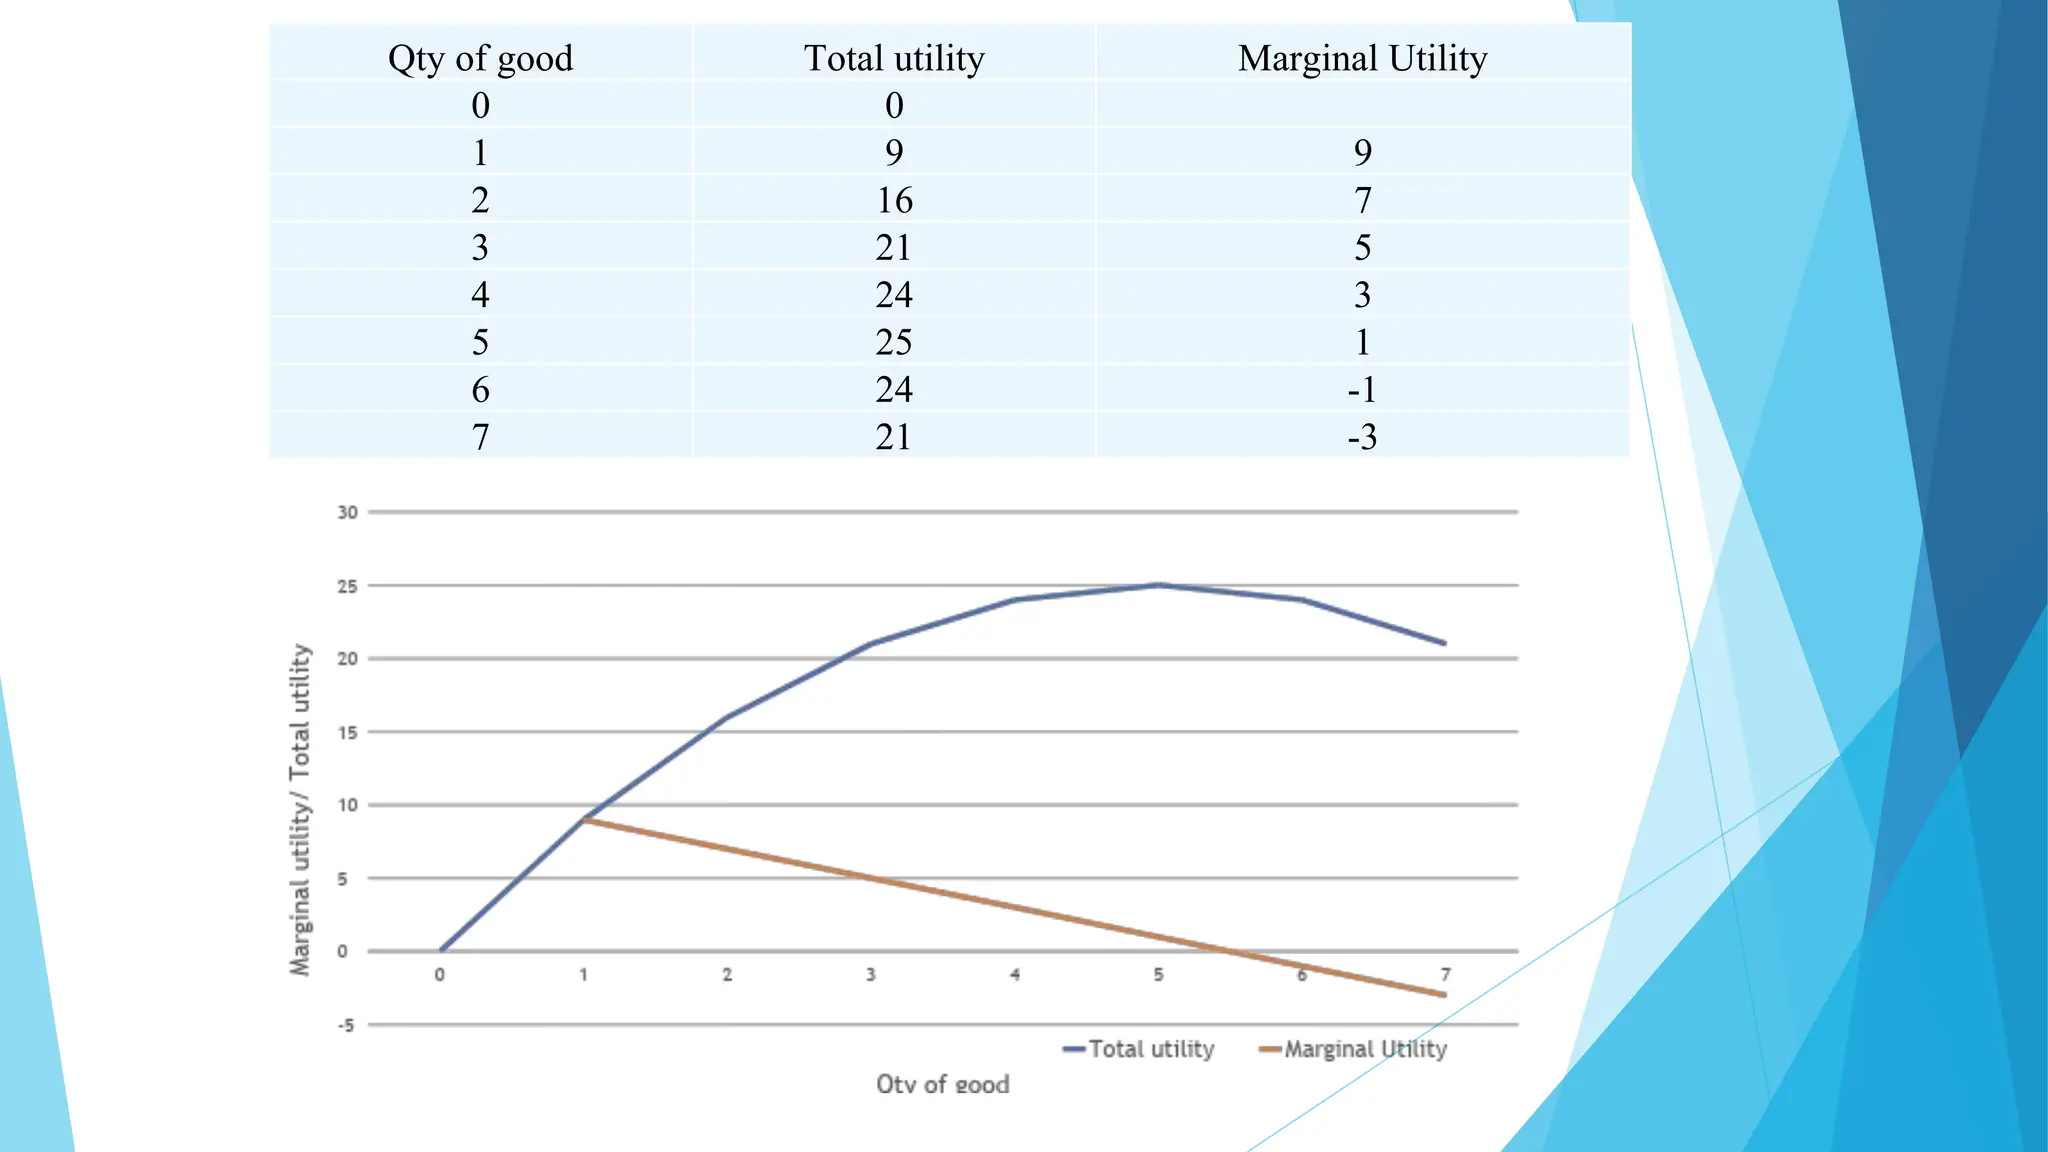
► LAW OFDIMINISHING MARGINAL UTILITY
► The law states that as a consumer increases the consumption of a product, the utility gained
from successive units goes on decreasing.
► In other words, the rate of increase of total utility decreases as more and more units are
consumed.
► For eg. Consider a case of a thirsty individual. He wants to consume a soft drink. As he is thirsty he
will have a higher utility say 9 utils for the first bottle. However when he consumes the second bottle
soon after the first one he will not get the same level of satisfaction. He may get only 7 utils from the
second bottle. Likewise the utility of each successive bottle of soft drink will go on decreasing. A
stage may come when he may develop an aversion for the soft drink.
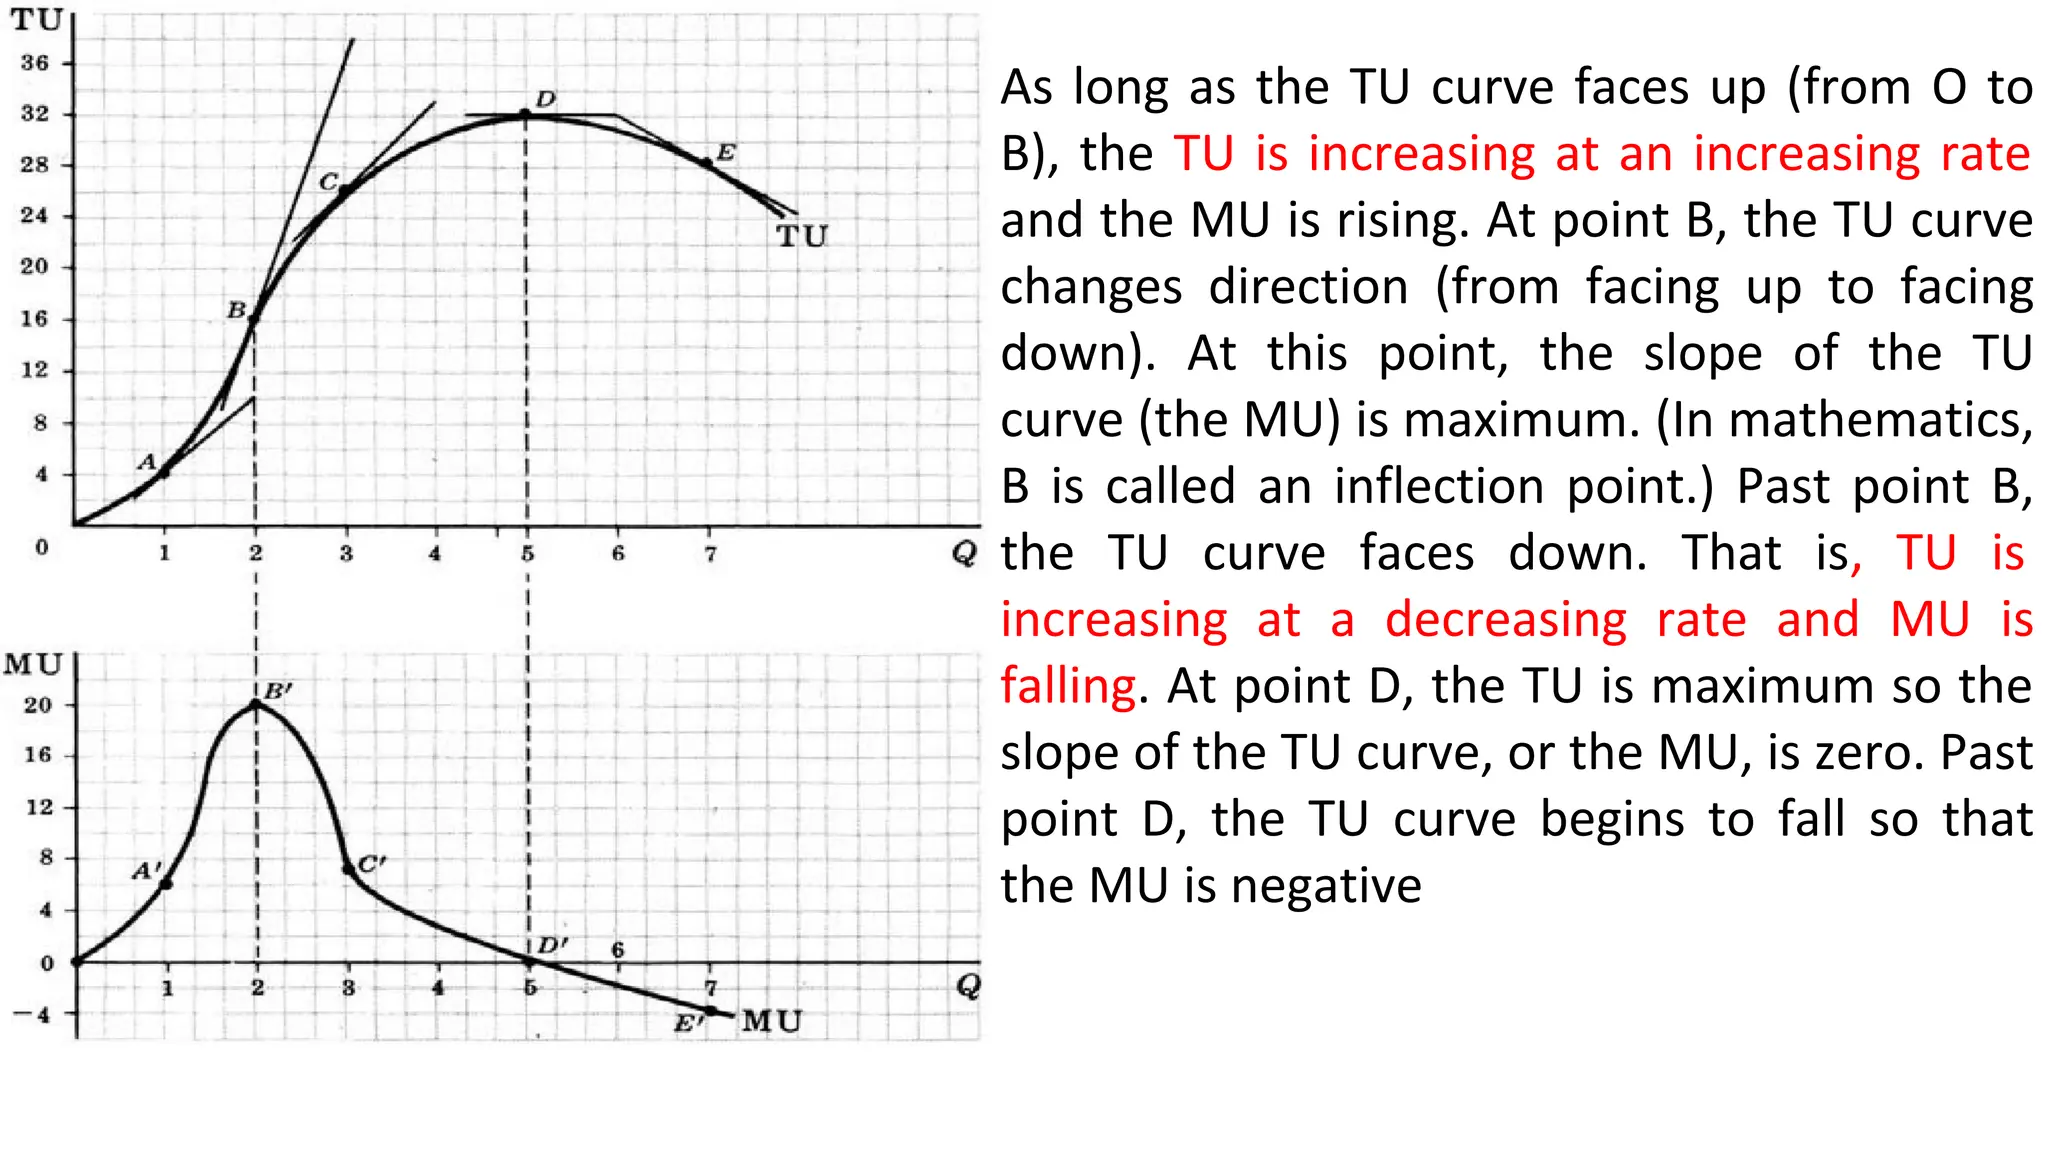
As long asthe TU curve faces up (from O to
B), the TU is increasing at an increasing rate
and the MU is rising. At point B, the TU curve
changes direction (from facing up to facing
down). At this point, the slope of the TU
curve (the MU) is maximum. (In mathematics,
B is called an inflection point.) Past point B,
the TU curve faces down. That is, TU is
increasing at a decreasing rate and MU is
falling. At point D, the TU is maximum so the
slope of the TU curve, or the MU, is zero. Past
point D, the TU curve begins to fall so that
the MU is negative
10.
► CONSUMER EQUILIBRIUM
►Consumer is said to be in equilibrium when he has:
► 1) maximized his satisfaction
► 2) spent his entire income
► 3) attained optimum allocation of expenditure
► 4) consumed optimum quantity of each commodity
► The consumer is said to be in equilibrium when he is able to spend his personal
income in such a way that the utility or satisfaction of the last dollar spent on
the various commodities is the same.
► INDIFFERENCE CURVEANALYSIS
► This theory was put forward by J.R Hicks and R.G Allen.
► This approach considers utility to be ordinal i.e it cannot be measured but can only be ranked or
compared.
► ASSUMPTIONS OF INDIFFERENCE CURVE ANALYSIS
► 1. Utility is ordinal i.e Utility being subjective is rankable but not not measurable
► 2. Consumer is rational
► 3. The income of the consumer is constant
► 4. The taste and preferences of the consumer remains unchanged
► 5. If a consumer prefers a commodity A to B and a commodity B to C then it implies he prefers
commodity A to C.
15.
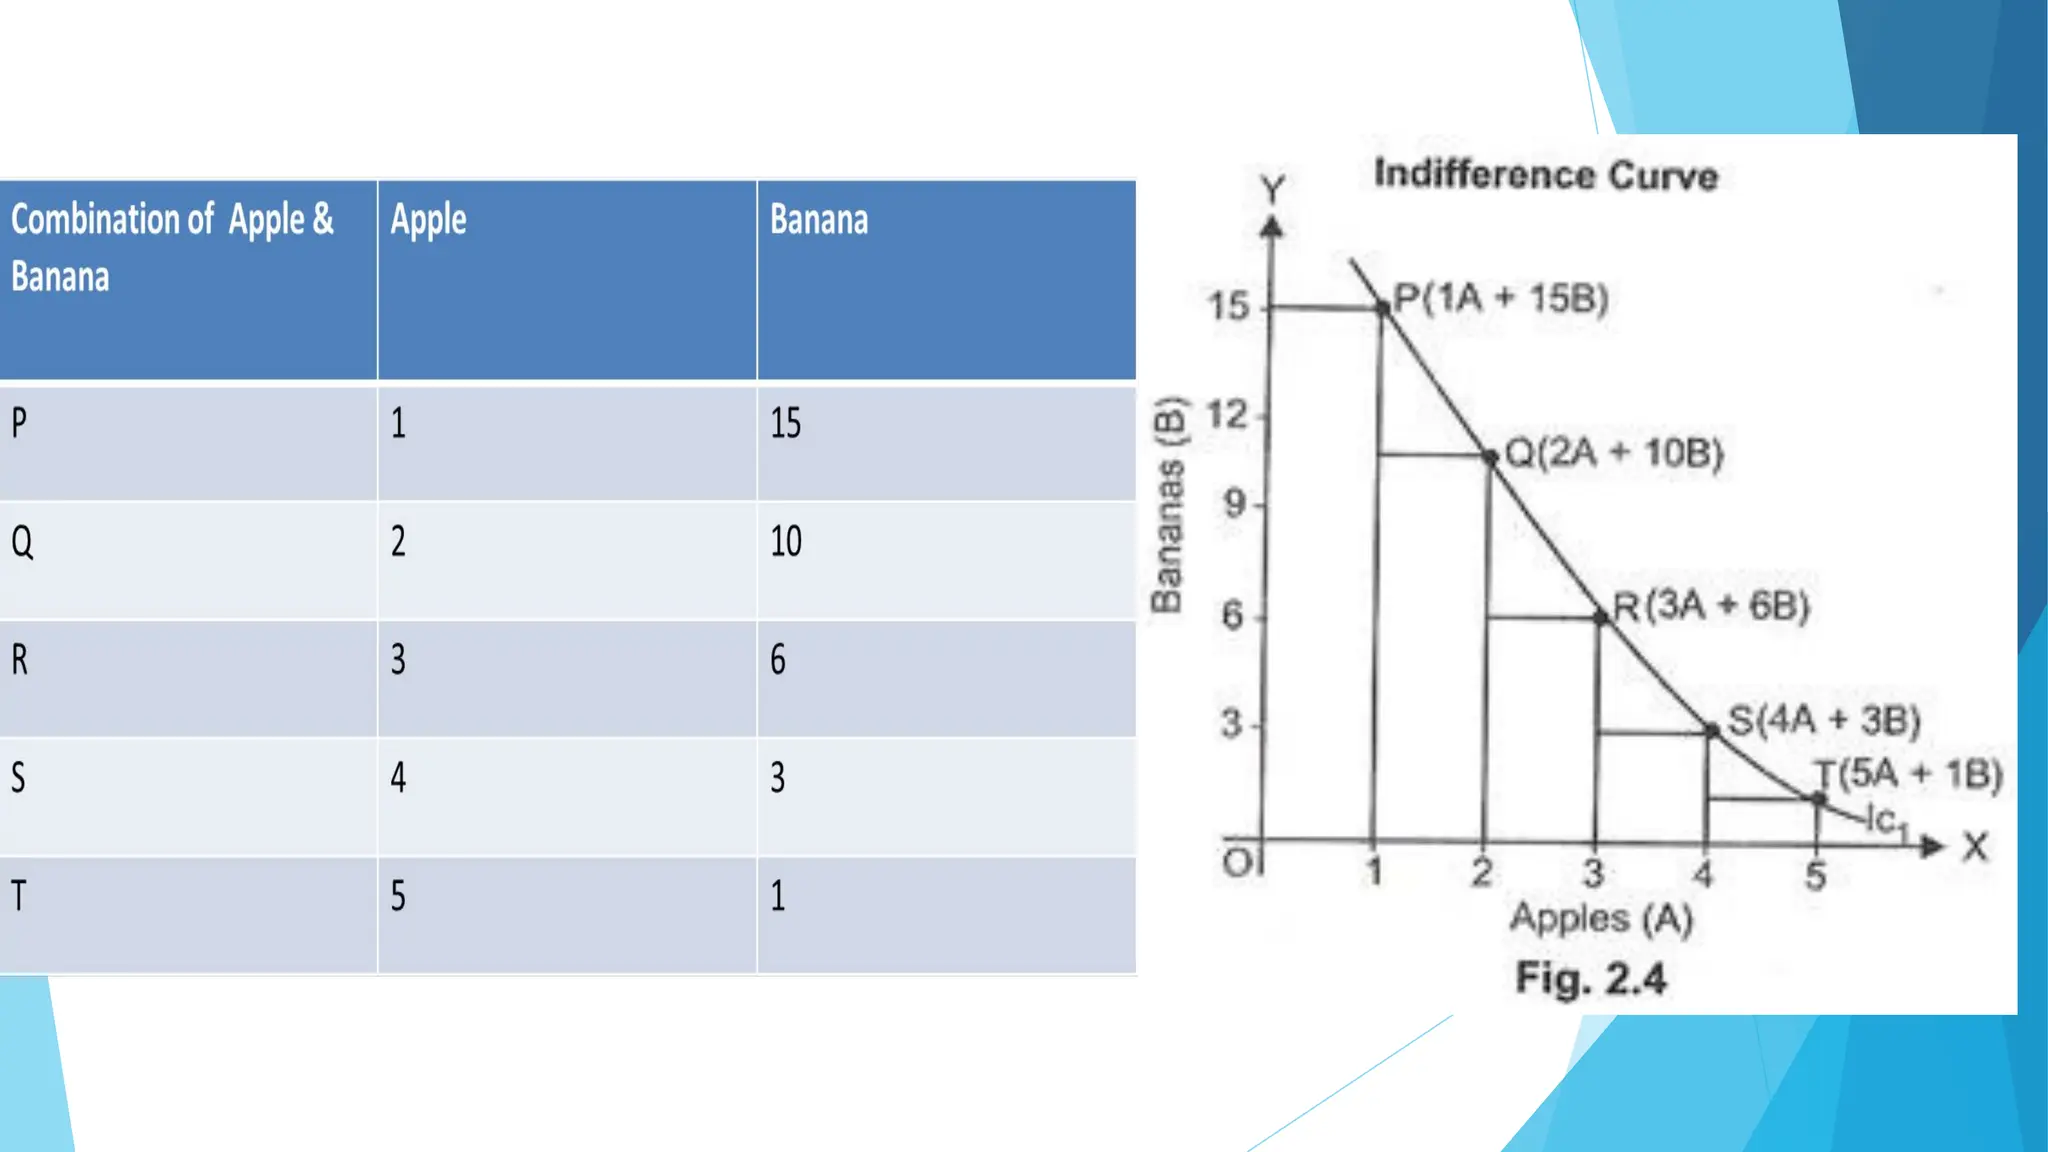
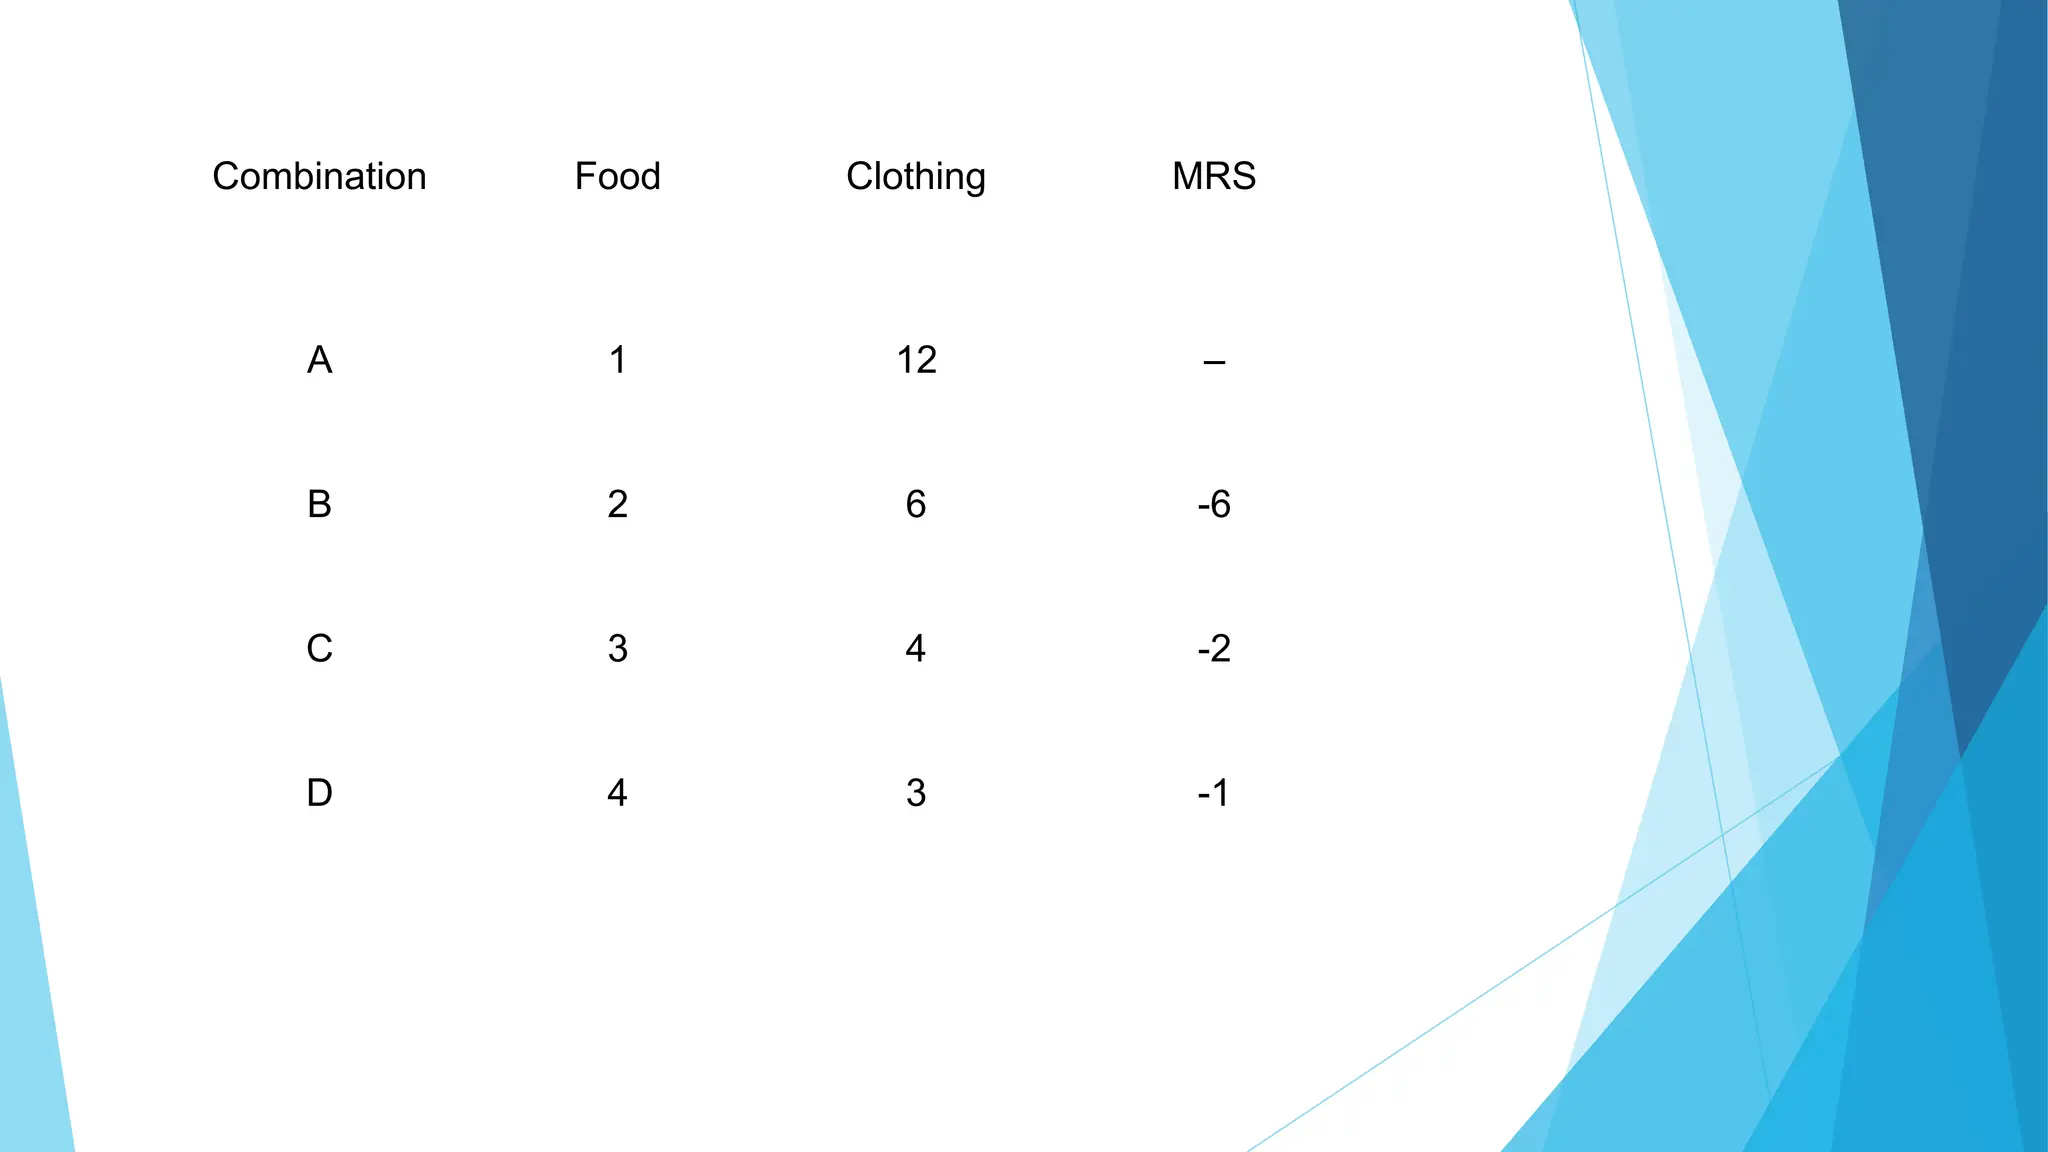
► INDIFFERENCE CURVE:
►When a consumer consumes various goods and services, then there are some combinations, which
give him exactly the same total satisfaction. The graphical representation of such combinations is
termed as indifference curve.
► or in other words:
► The locus of points, each representing a different combination of two goods, which provide the same
level of utility to the consumer is known as an indifference curve.
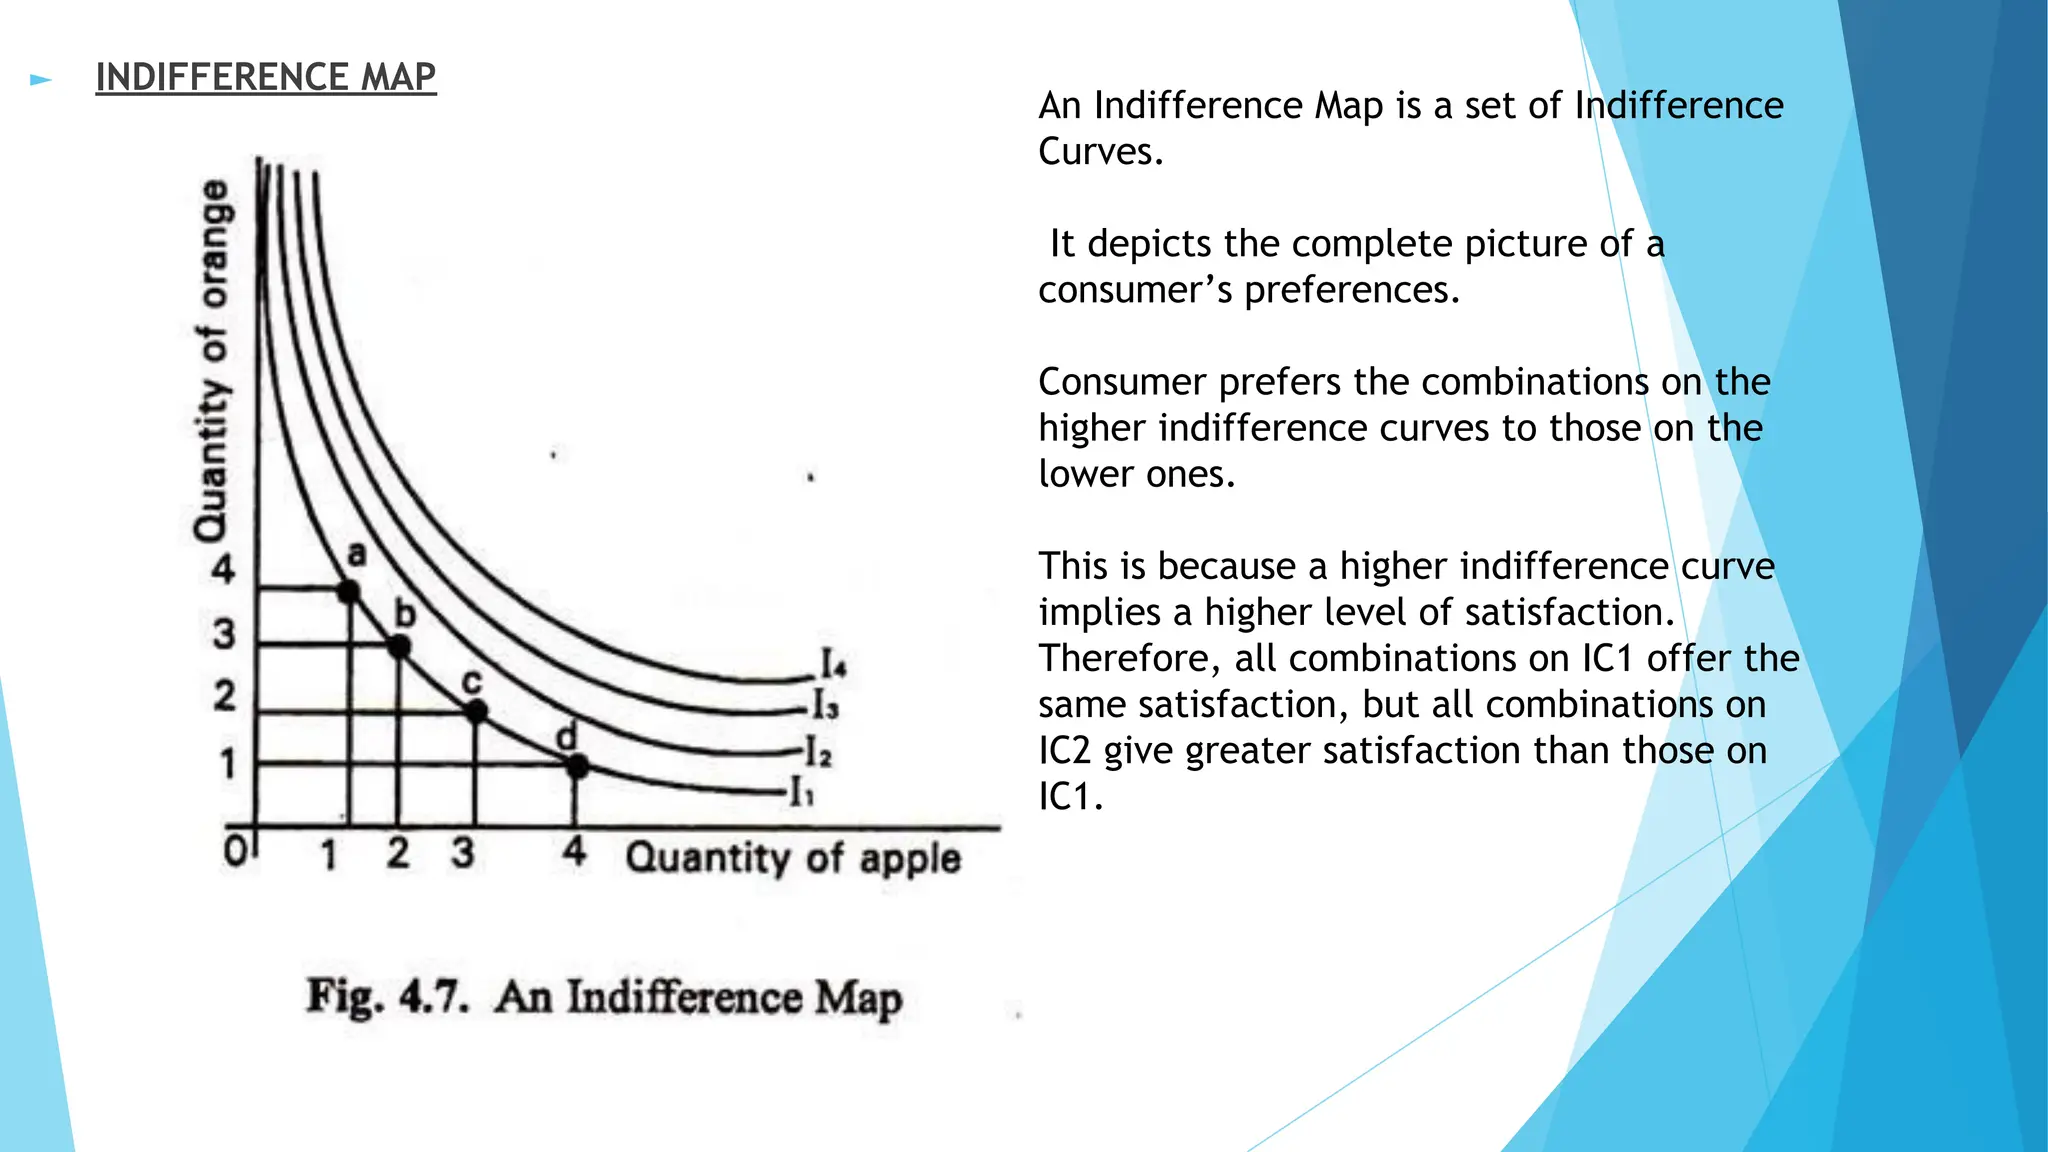
► INDIFFERENCE MAP
AnIndifference Map is a set of Indifference
Curves.
It depicts the complete picture of a
consumer’s preferences.
Consumer prefers the combinations on the
higher indifference curves to those on the
lower ones.
This is because a higher indifference curve
implies a higher level of satisfaction.
Therefore, all combinations on IC1 offer the
same satisfaction, but all combinations on
IC2 give greater satisfaction than those on
IC1.
20.
► CHARACTERISTICS OFINDIFFERENCE CURVE
► 1. Indifference curves are downward sloping: This is because for the same level of utility if the demand
of one commodity increases, the demand for the second commodity has to decrease.
► 2. Indifference curves are convex to the origin: The diminishing MRS gives the downward sloping
convex shape to the indifference curve.
► 3. Higher Indifference curves denote higher levels of utility: Higher utility can be derived only when the
quantity demanded of either good increases (keeping other constant) or when quantity demanded of both
goods is increased.
► 4. Indifference curves never intersect each other: Since the same combination of goods cannot yield two
different levels of utility indifference curves can never cut each other.
22.
► Law ofdiminishing MRS:
► The convex nature of the indifference curve is due to the fact that the rate of substitution goes on
decreasing as more units of a commodity are consumed.
► The quantity of a commodity that a consumer is willing to sacrifice for an additional unit keeps on
decreasing as he continues substituting one commodity for another. This is the law of diminishing
MRS.
► BUDGET LINE:
► A budget line represents all the combinations of two products that can be purchased for a given amount
of income of the consumer.
► For example: there are two goods X and Y be available at prices P1 and P2 and in quantities Q1 and
Q2. For a given income/budget ‘B’ a consumer can make the following purchase:
23.
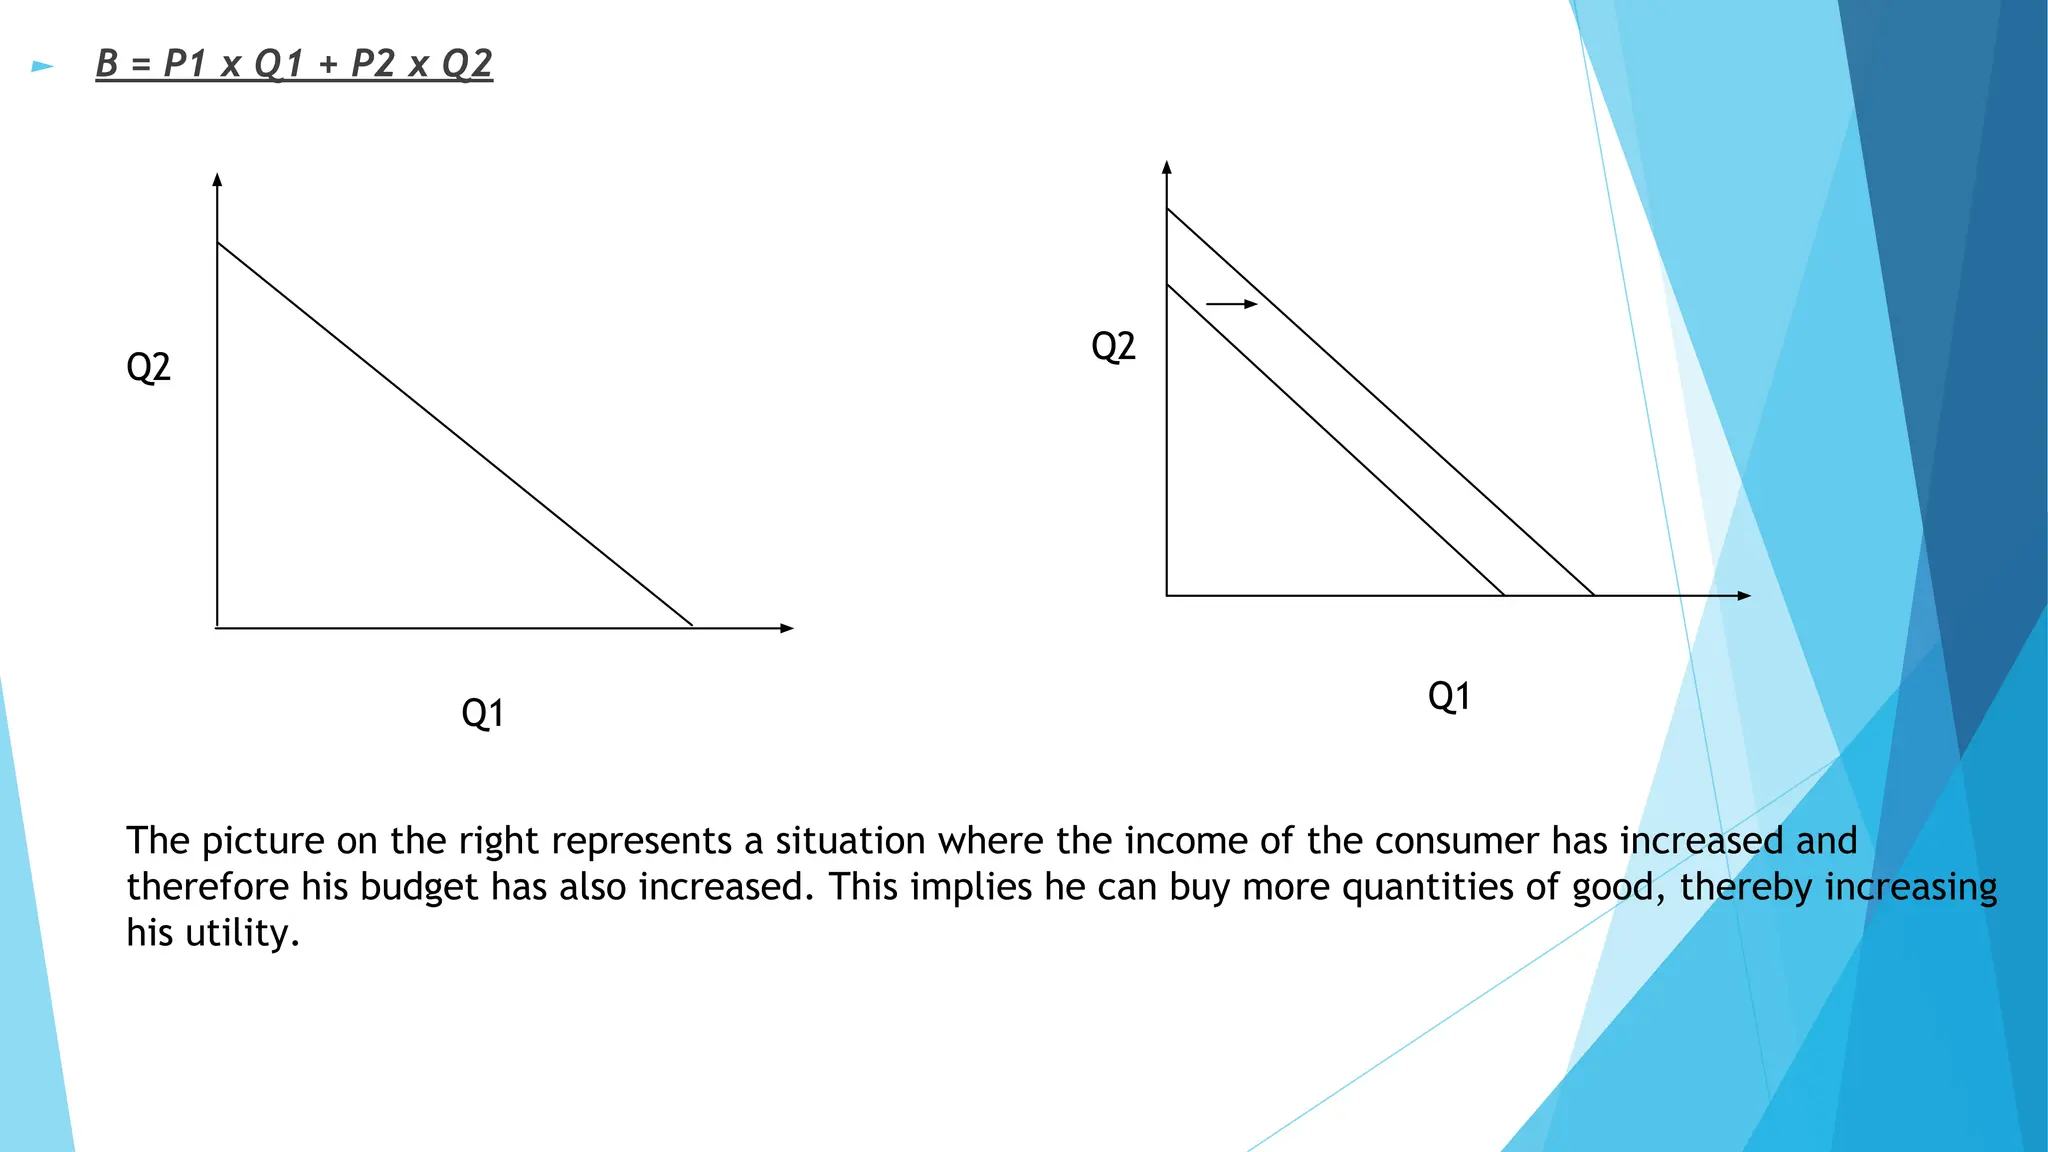
► B =P1 x Q1 + P2 x Q2
Q1
Q2
Q1
Q2
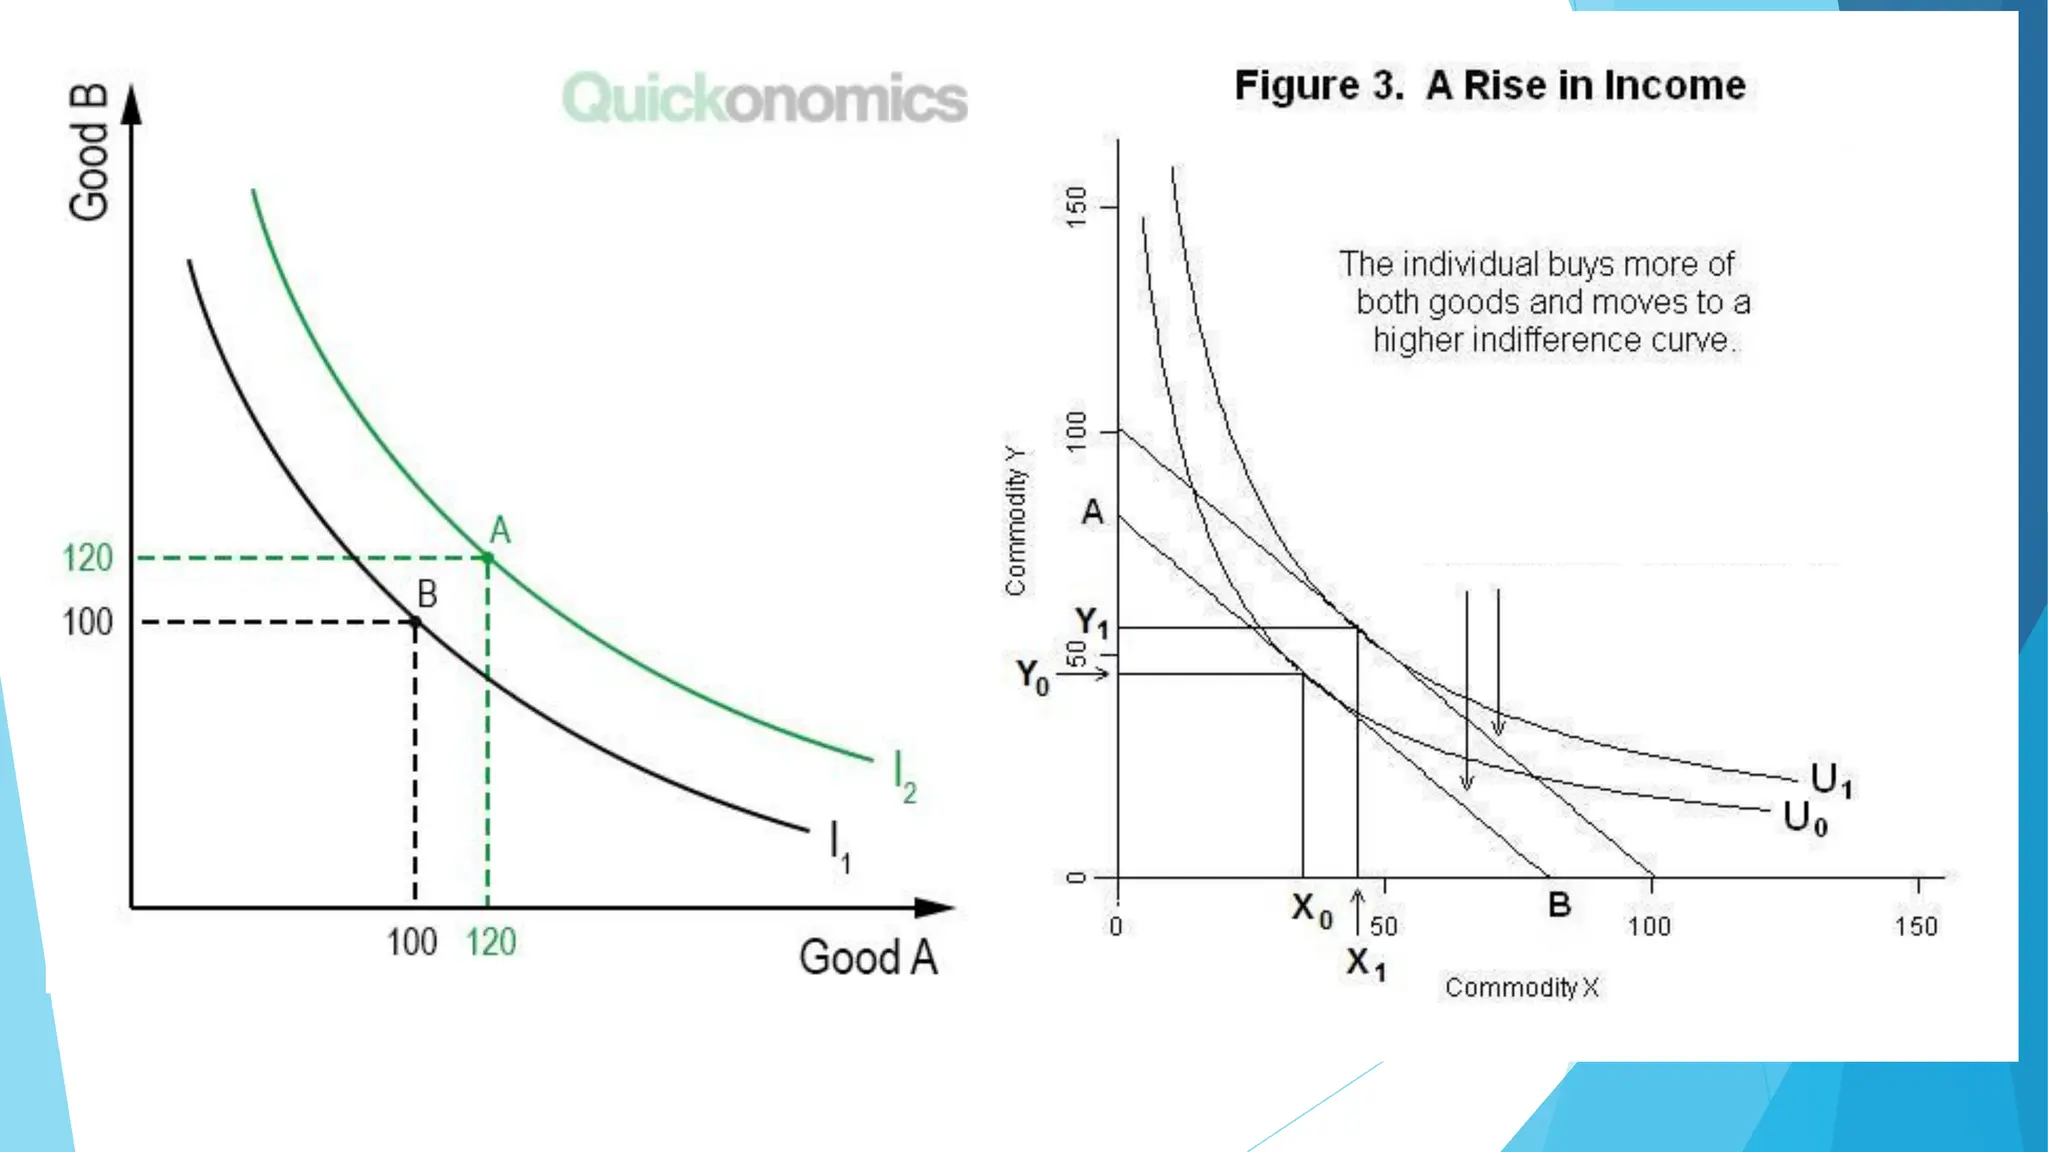
The picture on the right represents a situation where the income of the consumer has increased and
therefore his budget has also increased. This implies he can buy more quantities of good, thereby increasing
his utility.
24.
► CONSUMER EQUILIBRIUM(ordinal utility method)
► The term consumer’s equilibrium refers to the amount of goods and services which the consumer
may buy in the market given his income and given prices of goods in the market".
►
► The aim of the consumer is to get maximum satisfaction from his money income. "A consumer is
said to be in equilibrium at a point where the price line is touching the highest attainable
indifference curve.
25.
► CONDITIONS FOREQUILIBRIUM
► First: A given price line should be tangent to an indifference curve or marginal rate of satisfaction of
good X for good Y (MRSxy
) must be equal to the price ratio of the two goods. i.e.
MRSxy
= Px
/ Py
► Second: The second order condition is that indifference curve must be convex to the origin at the point
of tangency.
27.
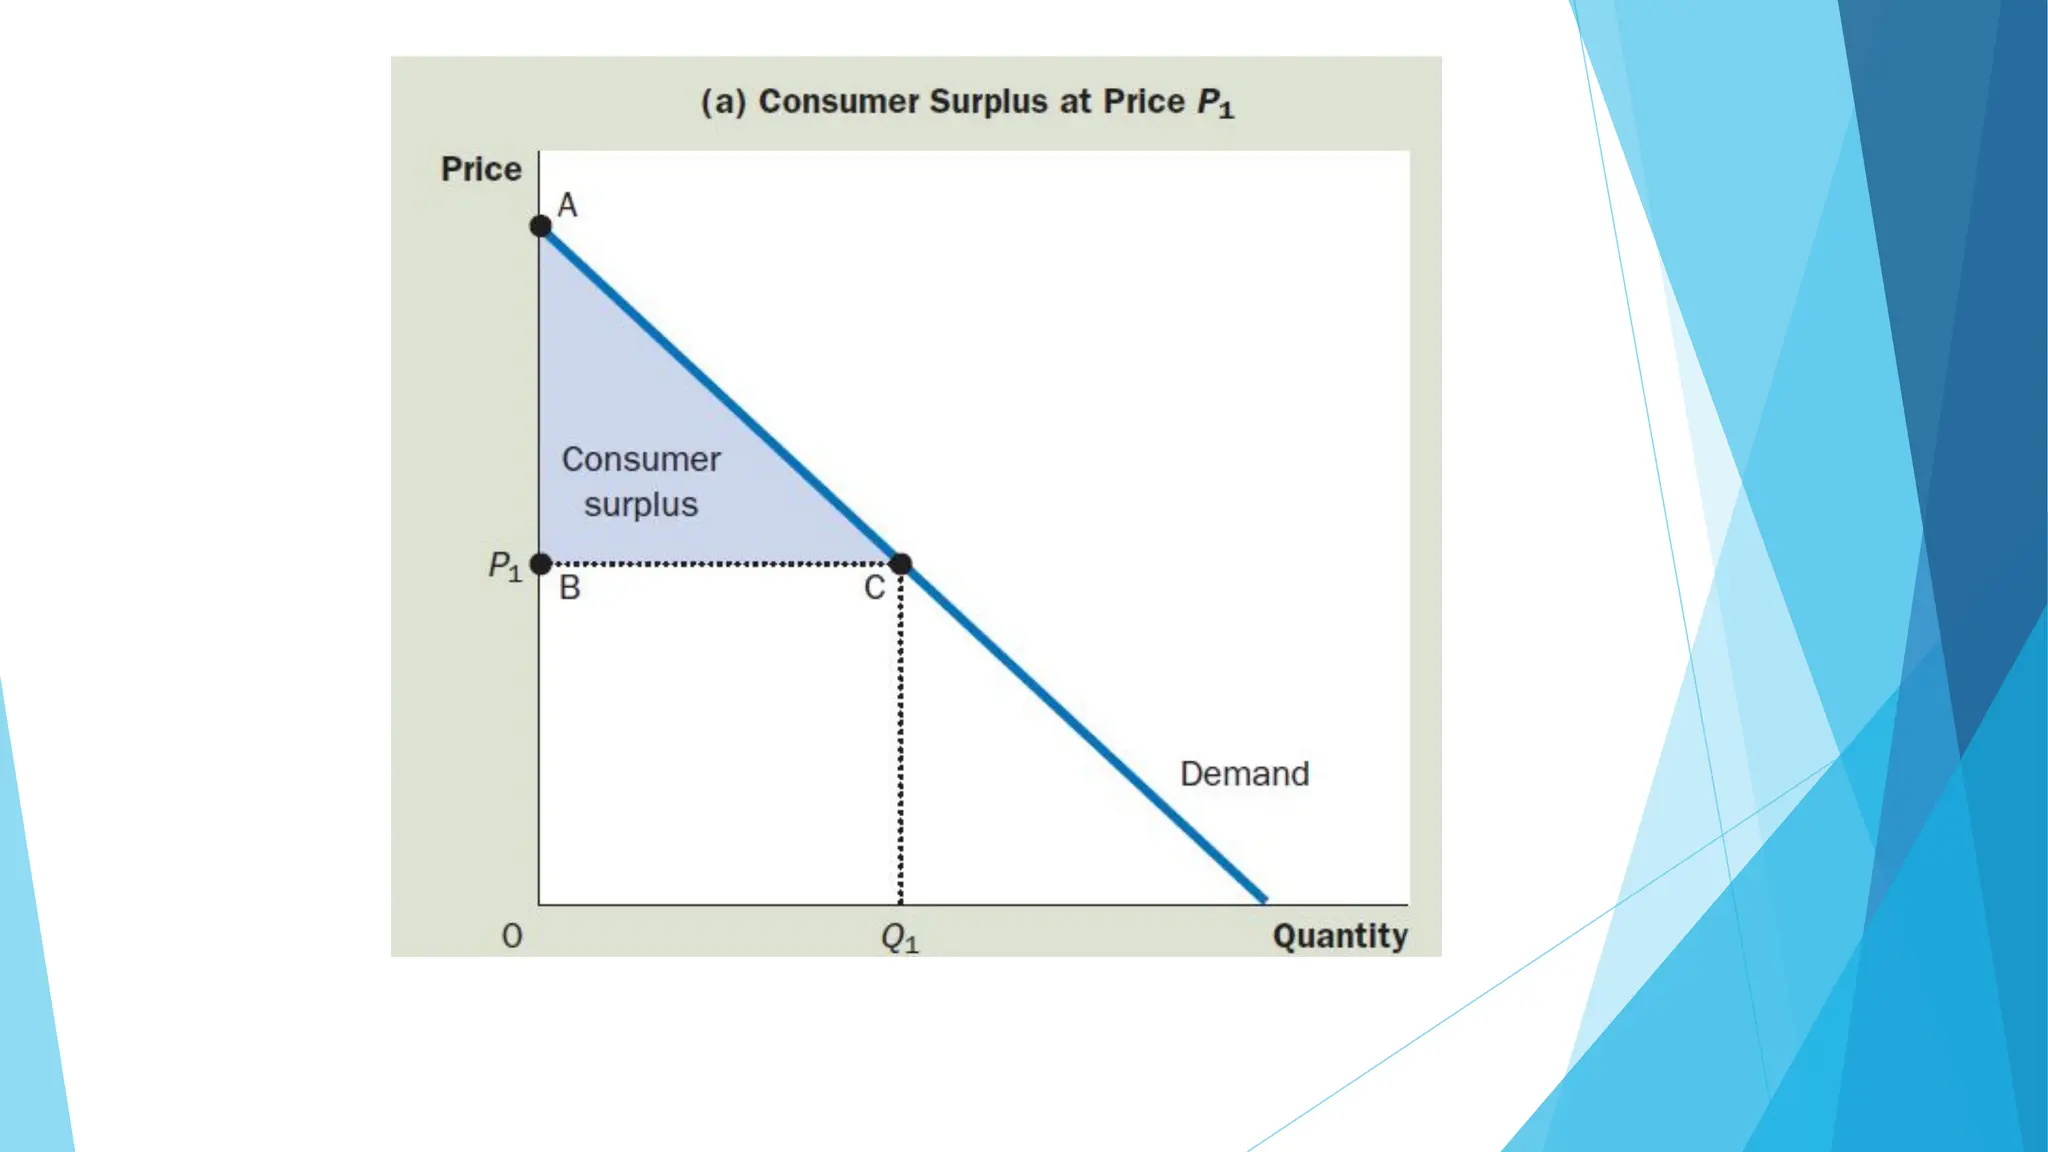
► CONSUMER SURPLUS
►Willingness to pay: The maximum amount that a buyer will pay for a good.
► Any consumer will be willing to buy the good at any price less than the price he is willing to pay. The
consumer would refuse to buy at any price above the price he is willing to pay.
► Consumer Surplus: The amount that a buyer is willing to pay for a good minus the amount the consumer
actually pays.
► Consumer surplus measures the benefit buyers receive
► Graphically consumer surplus can be measured as the area above the price line and below the
demand curve.
29.
P1
P2
Q1 Q2
A
B
C
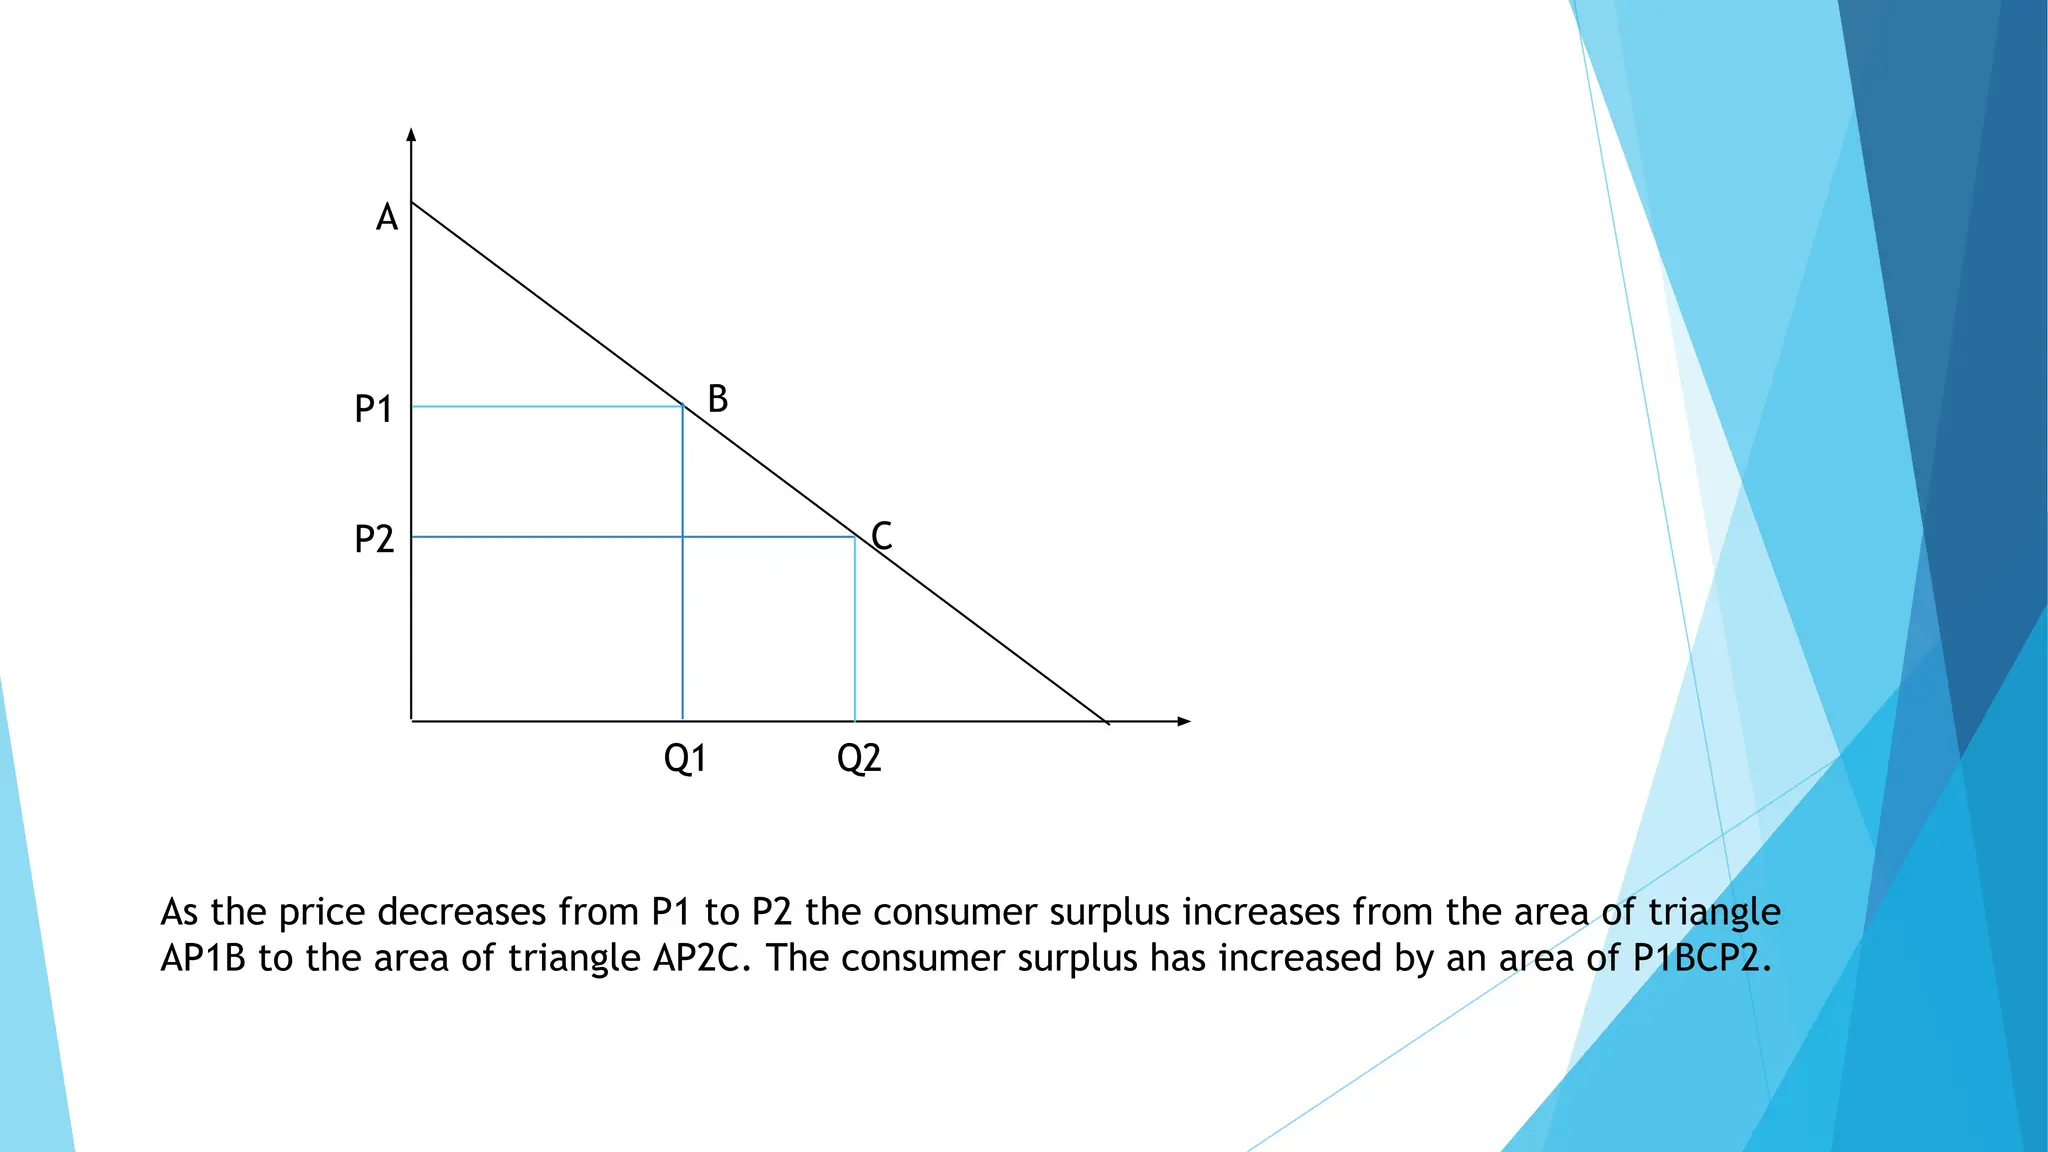
As theprice decreases from P1 to P2 the consumer surplus increases from the area of triangle
AP1B to the area of triangle AP2C. The consumer surplus has increased by an area of P1BCP2.
30.
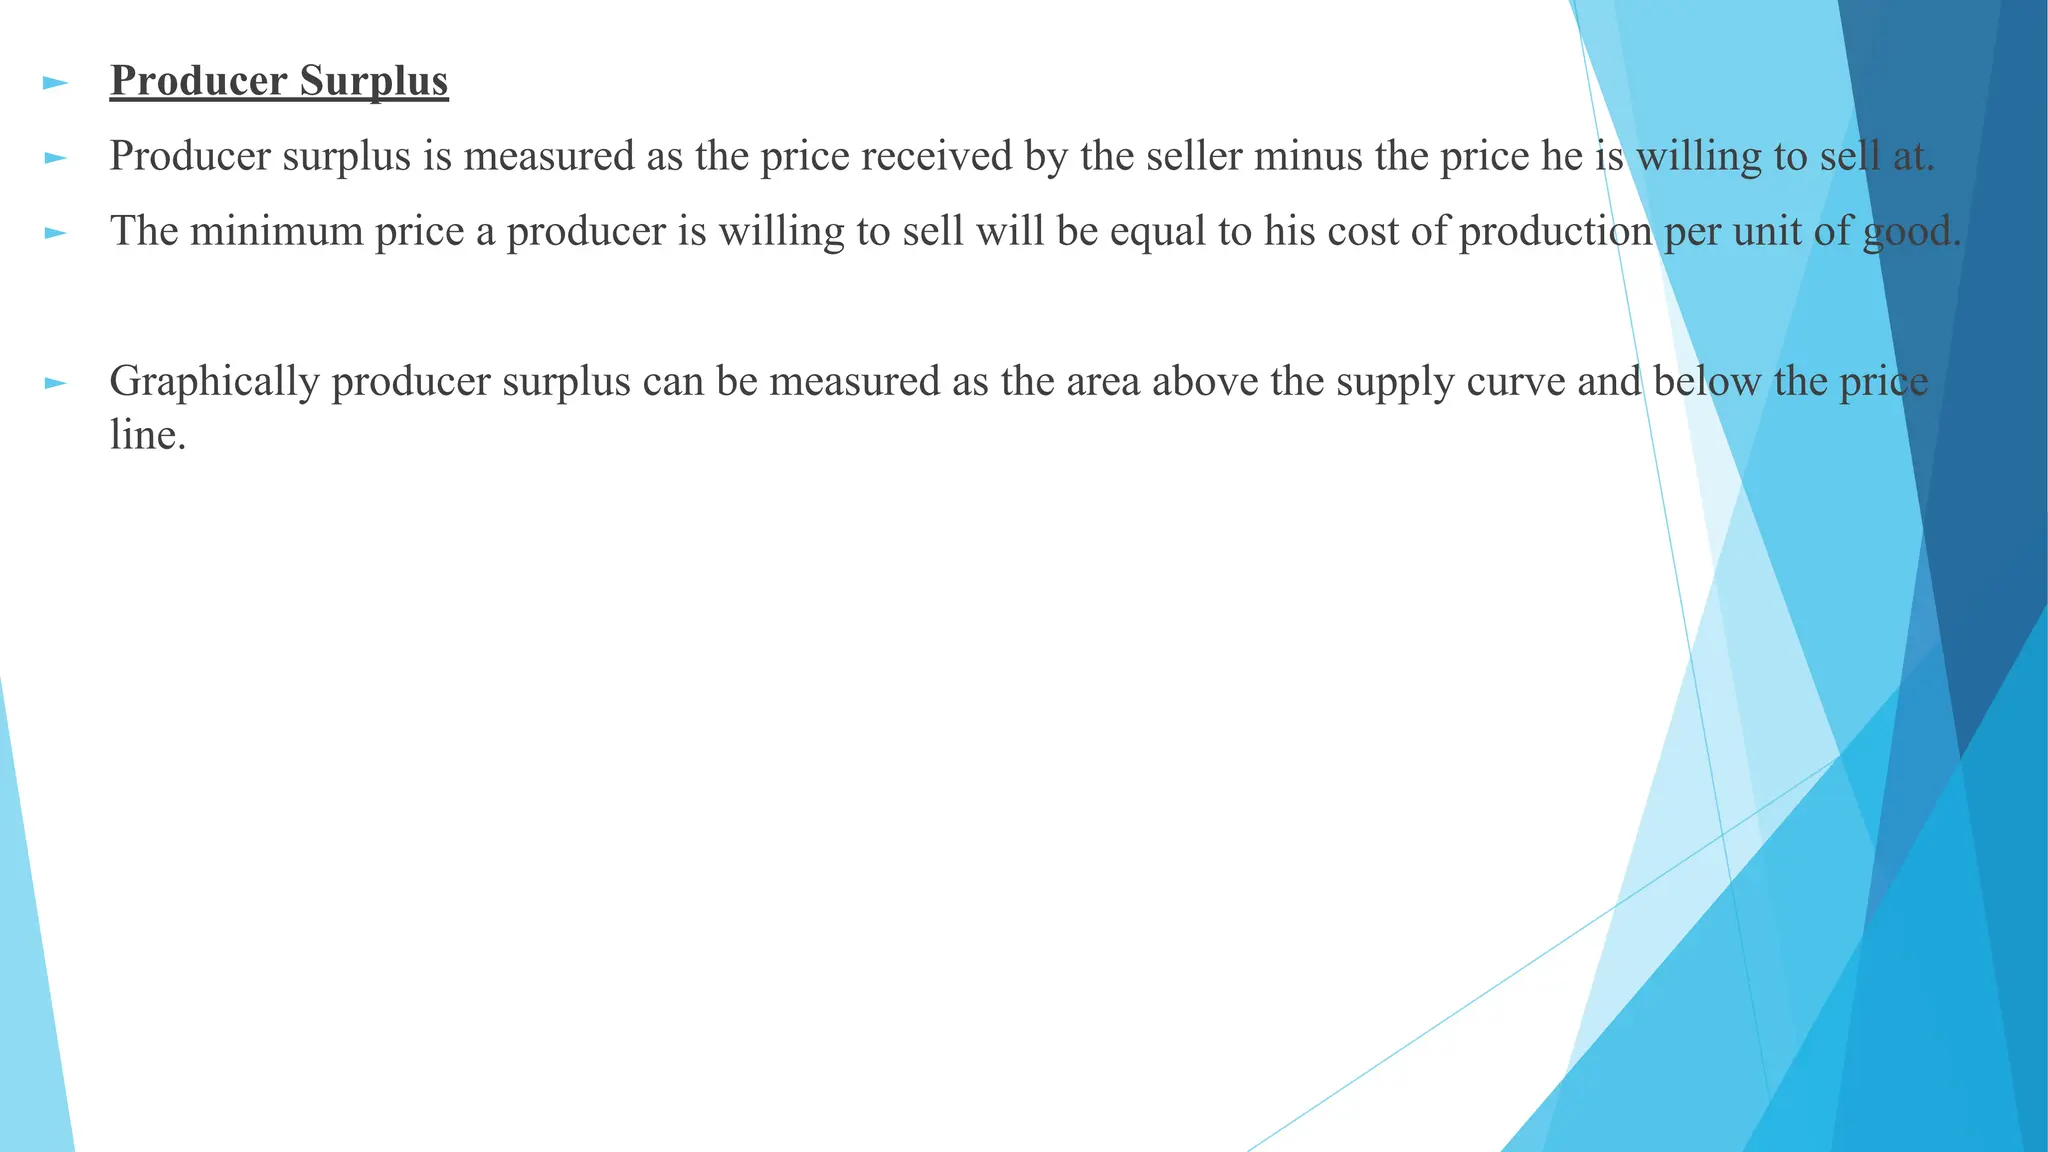
► Producer Surplus
►Producer surplus is measured as the price received by the seller minus the price he is willing to sell at.
► The minimum price a producer is willing to sell will be equal to his cost of production per unit of good.
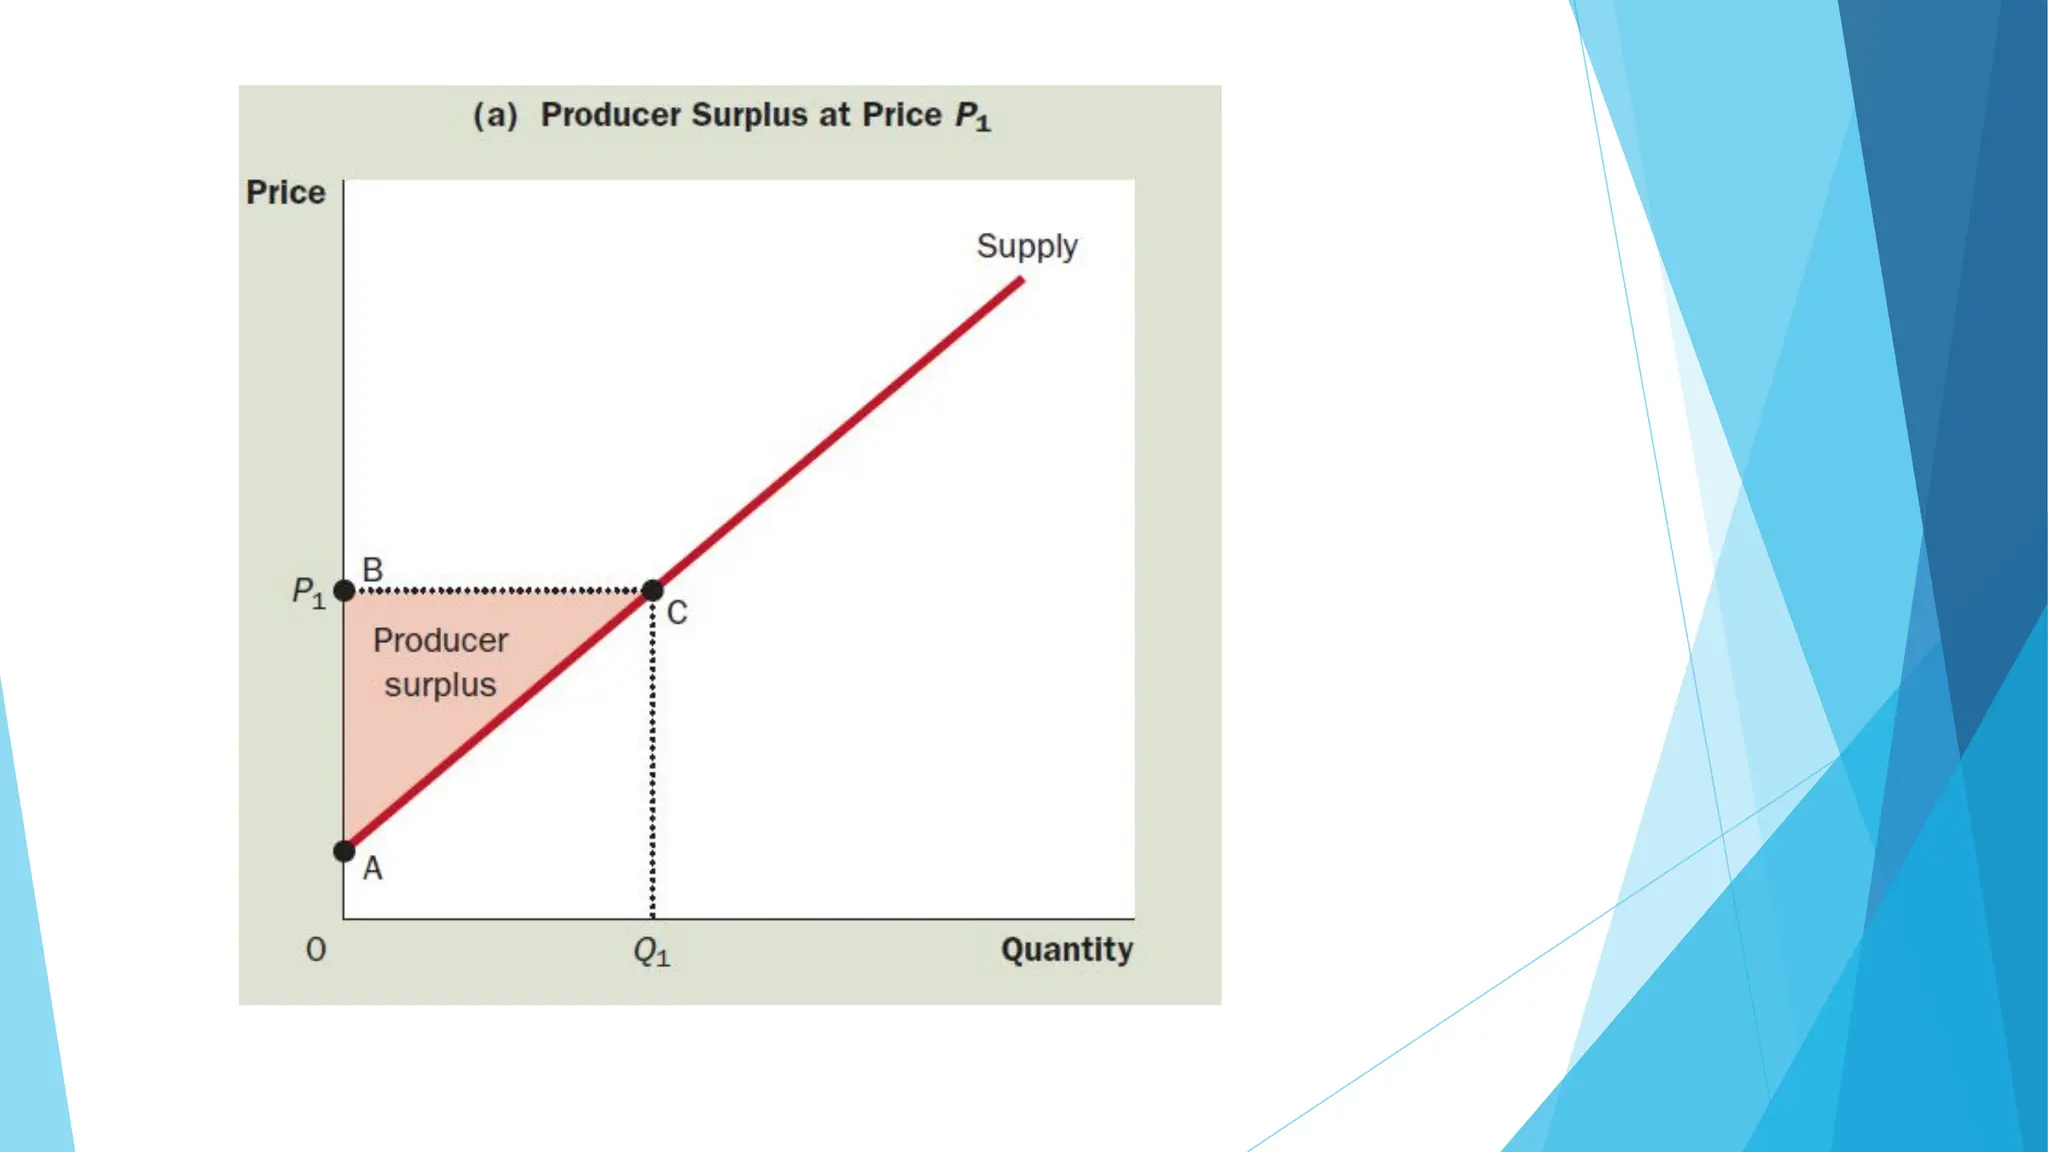
► Graphically producer surplus can be measured as the area above the supply curve and below the price
line.