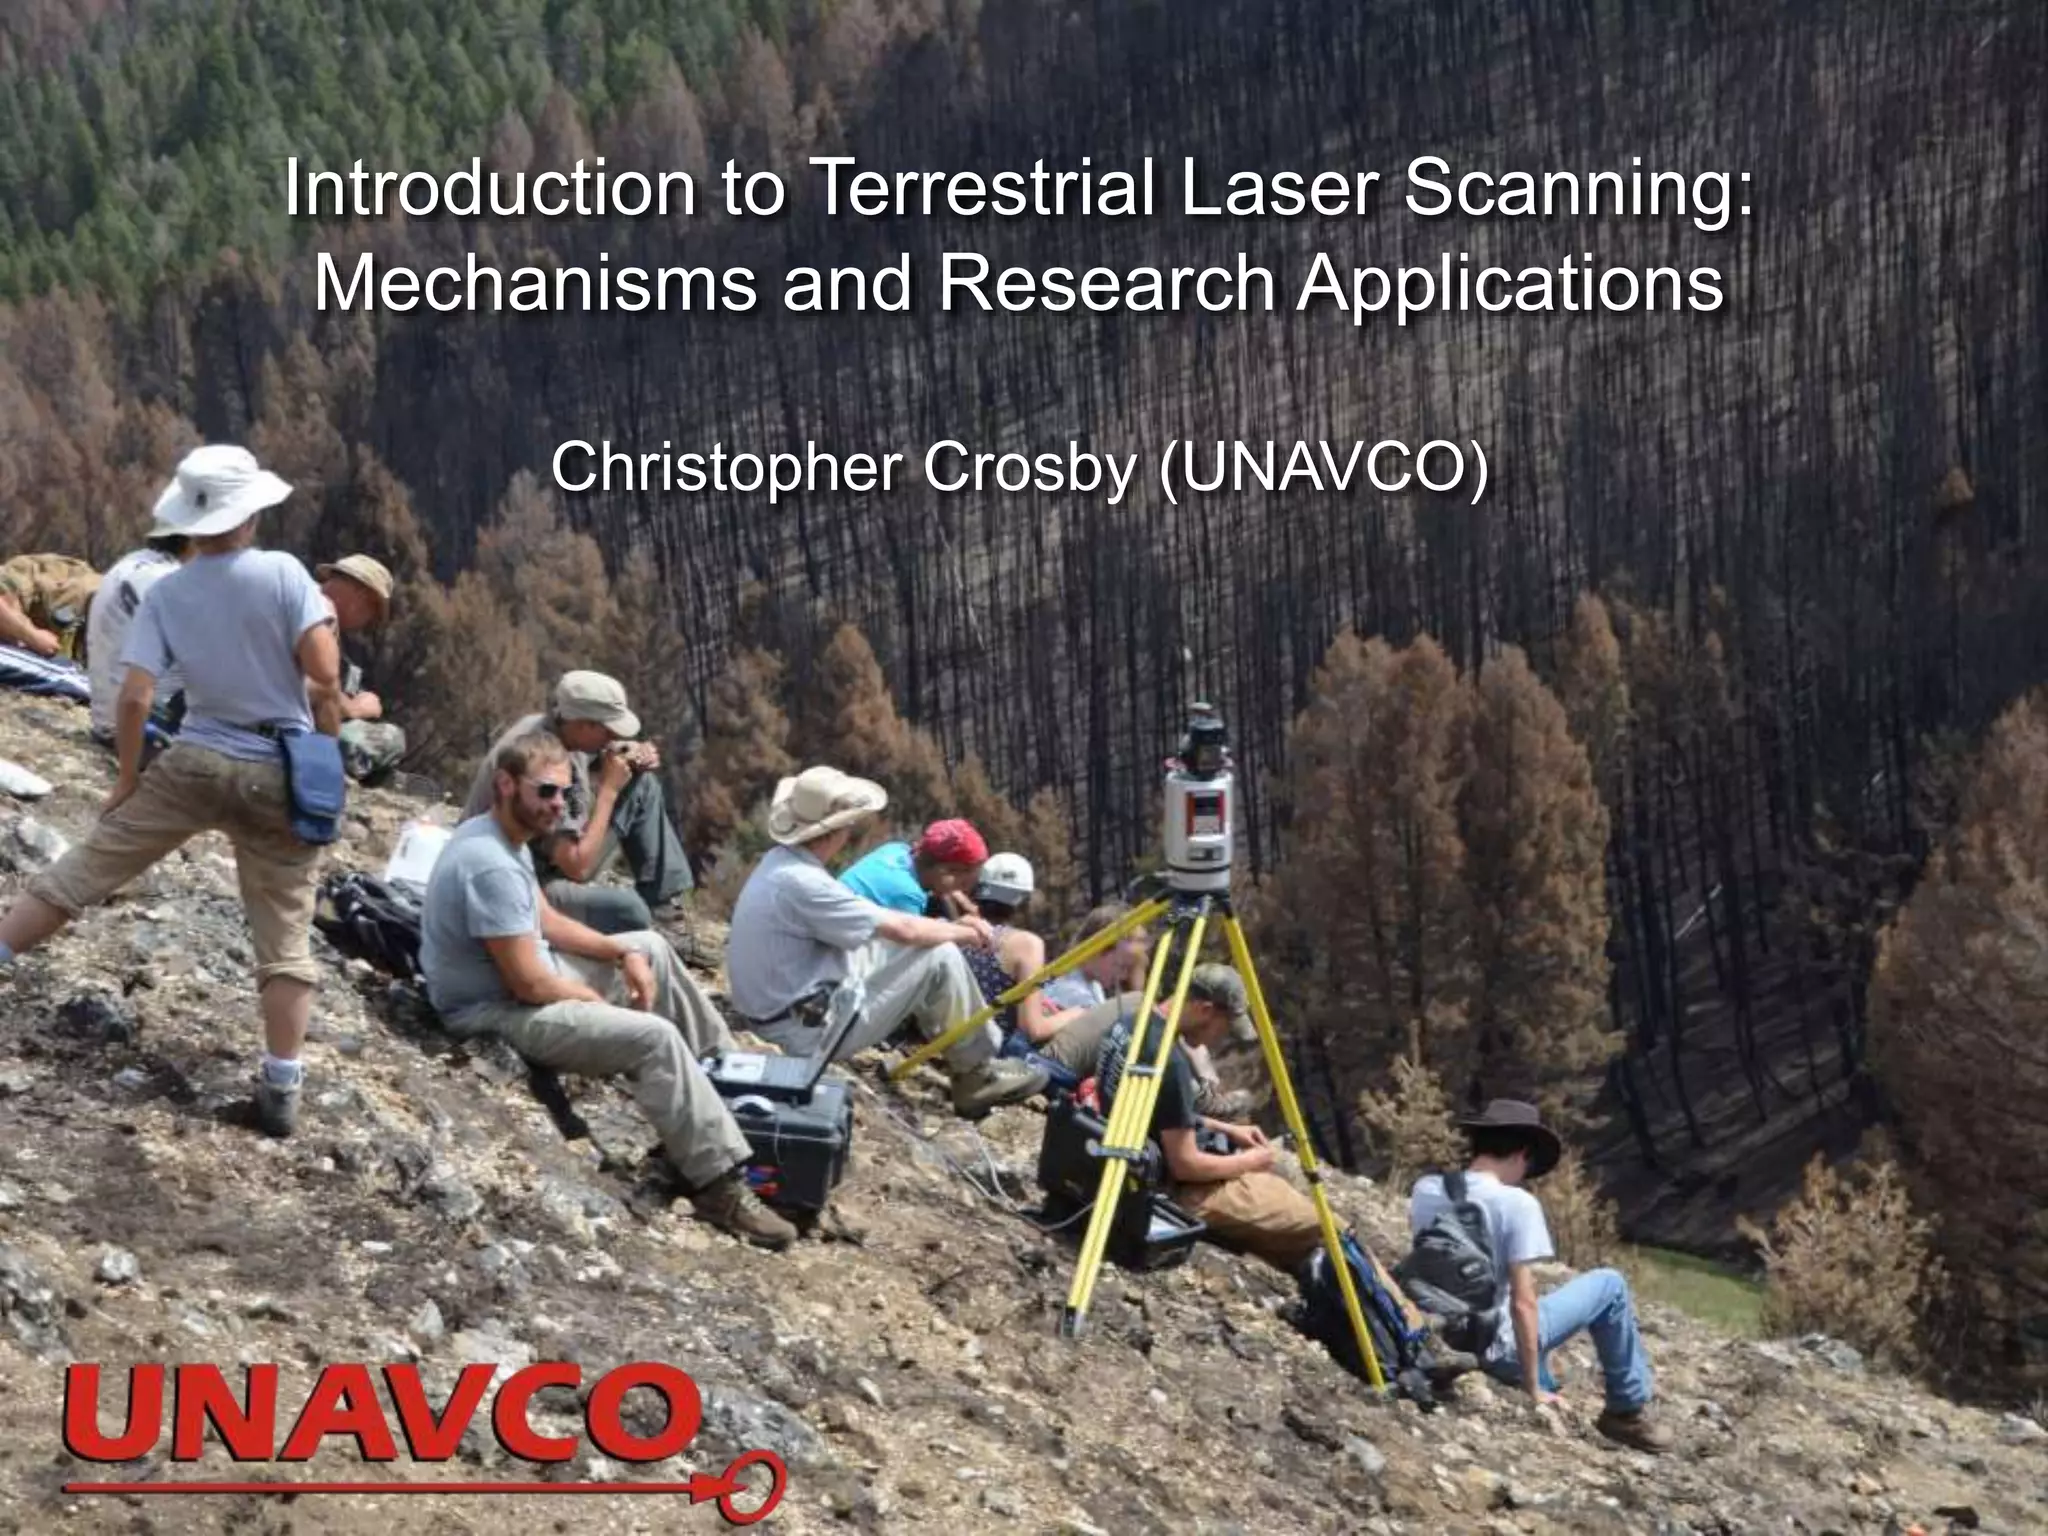
The document provides an introduction to terrestrial laser scanning (TLS), detailing its mechanisms, research applications, and various types of laser scanners available through the UNAVCO TLS instrument pool. It highlights the advantages and limitations of different lidar technologies and outlines specific TLS research projects, including studies on the 2011 Japan tsunami and glaciological research in polar environments. Additionally, the document discusses the educational resources and community support associated with TLS technology.
In this document
Powered by AI
Introduction to terrestrial laser scanning's mechanisms and applications.
Overview of UNAVCO and its resources, training, and support for the TLS community.
Fundamentals of lidar technology, including distance measurement techniques.
Overview of different lidar platforms and their altitude, footprint, and accuracy specifications.
Discussion on discrete pulse versus full waveform lidar returns and their benefits.
Applications of terrestrial and airborne lidar in various studies across California.
Showcase video illustrating the application of TLS technology.
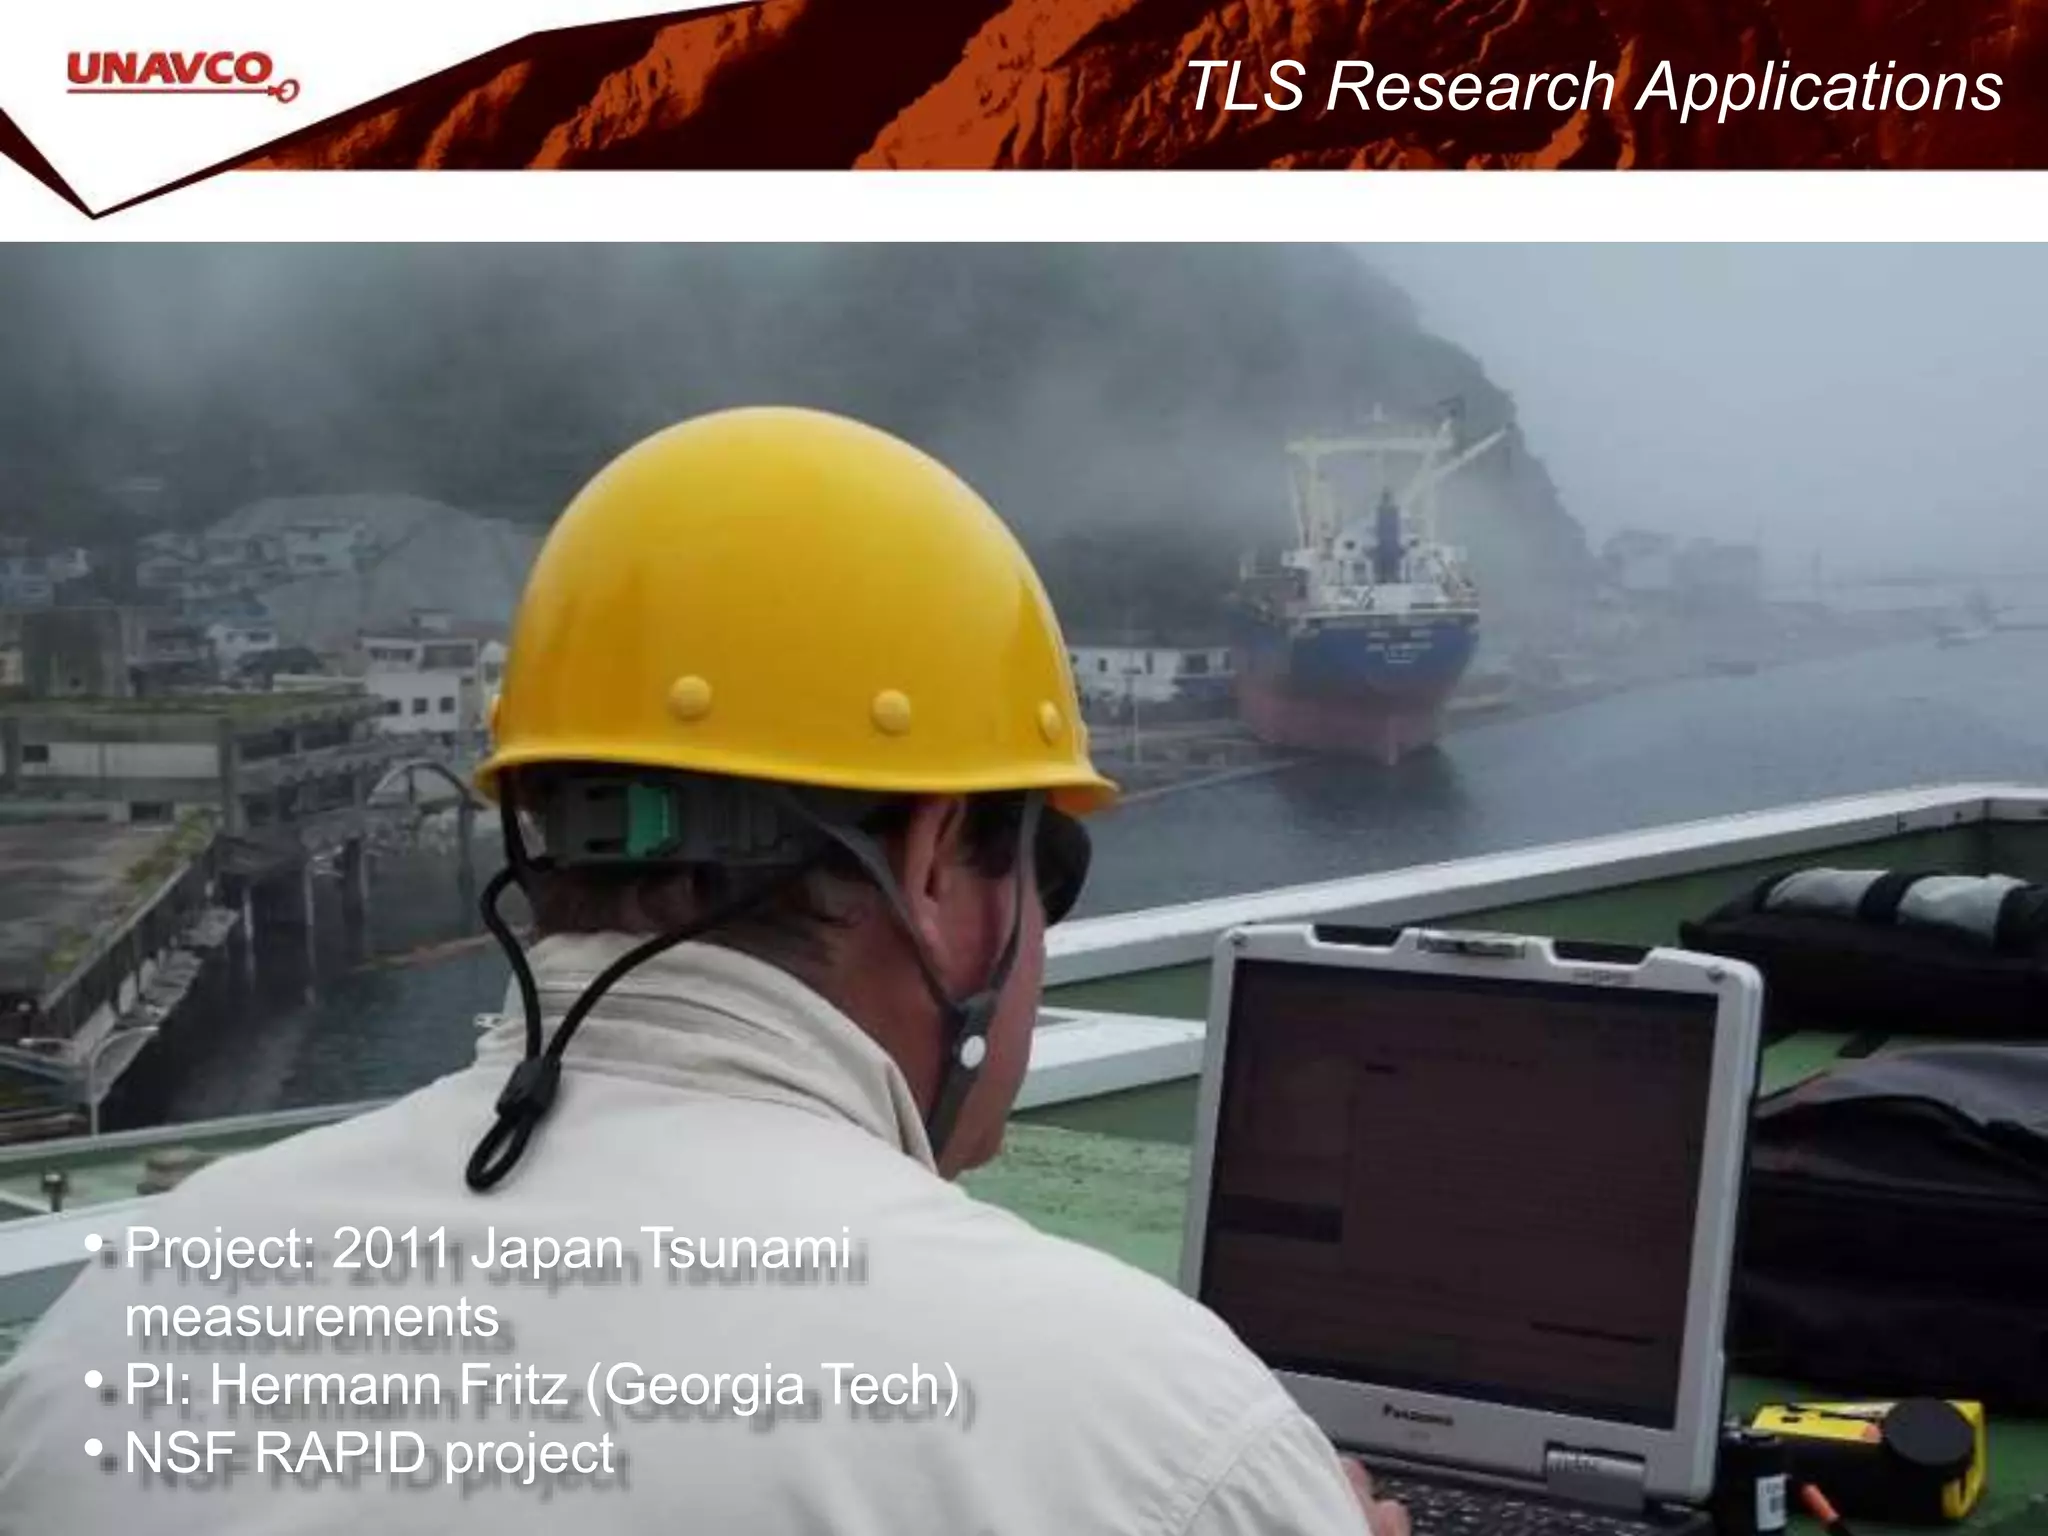
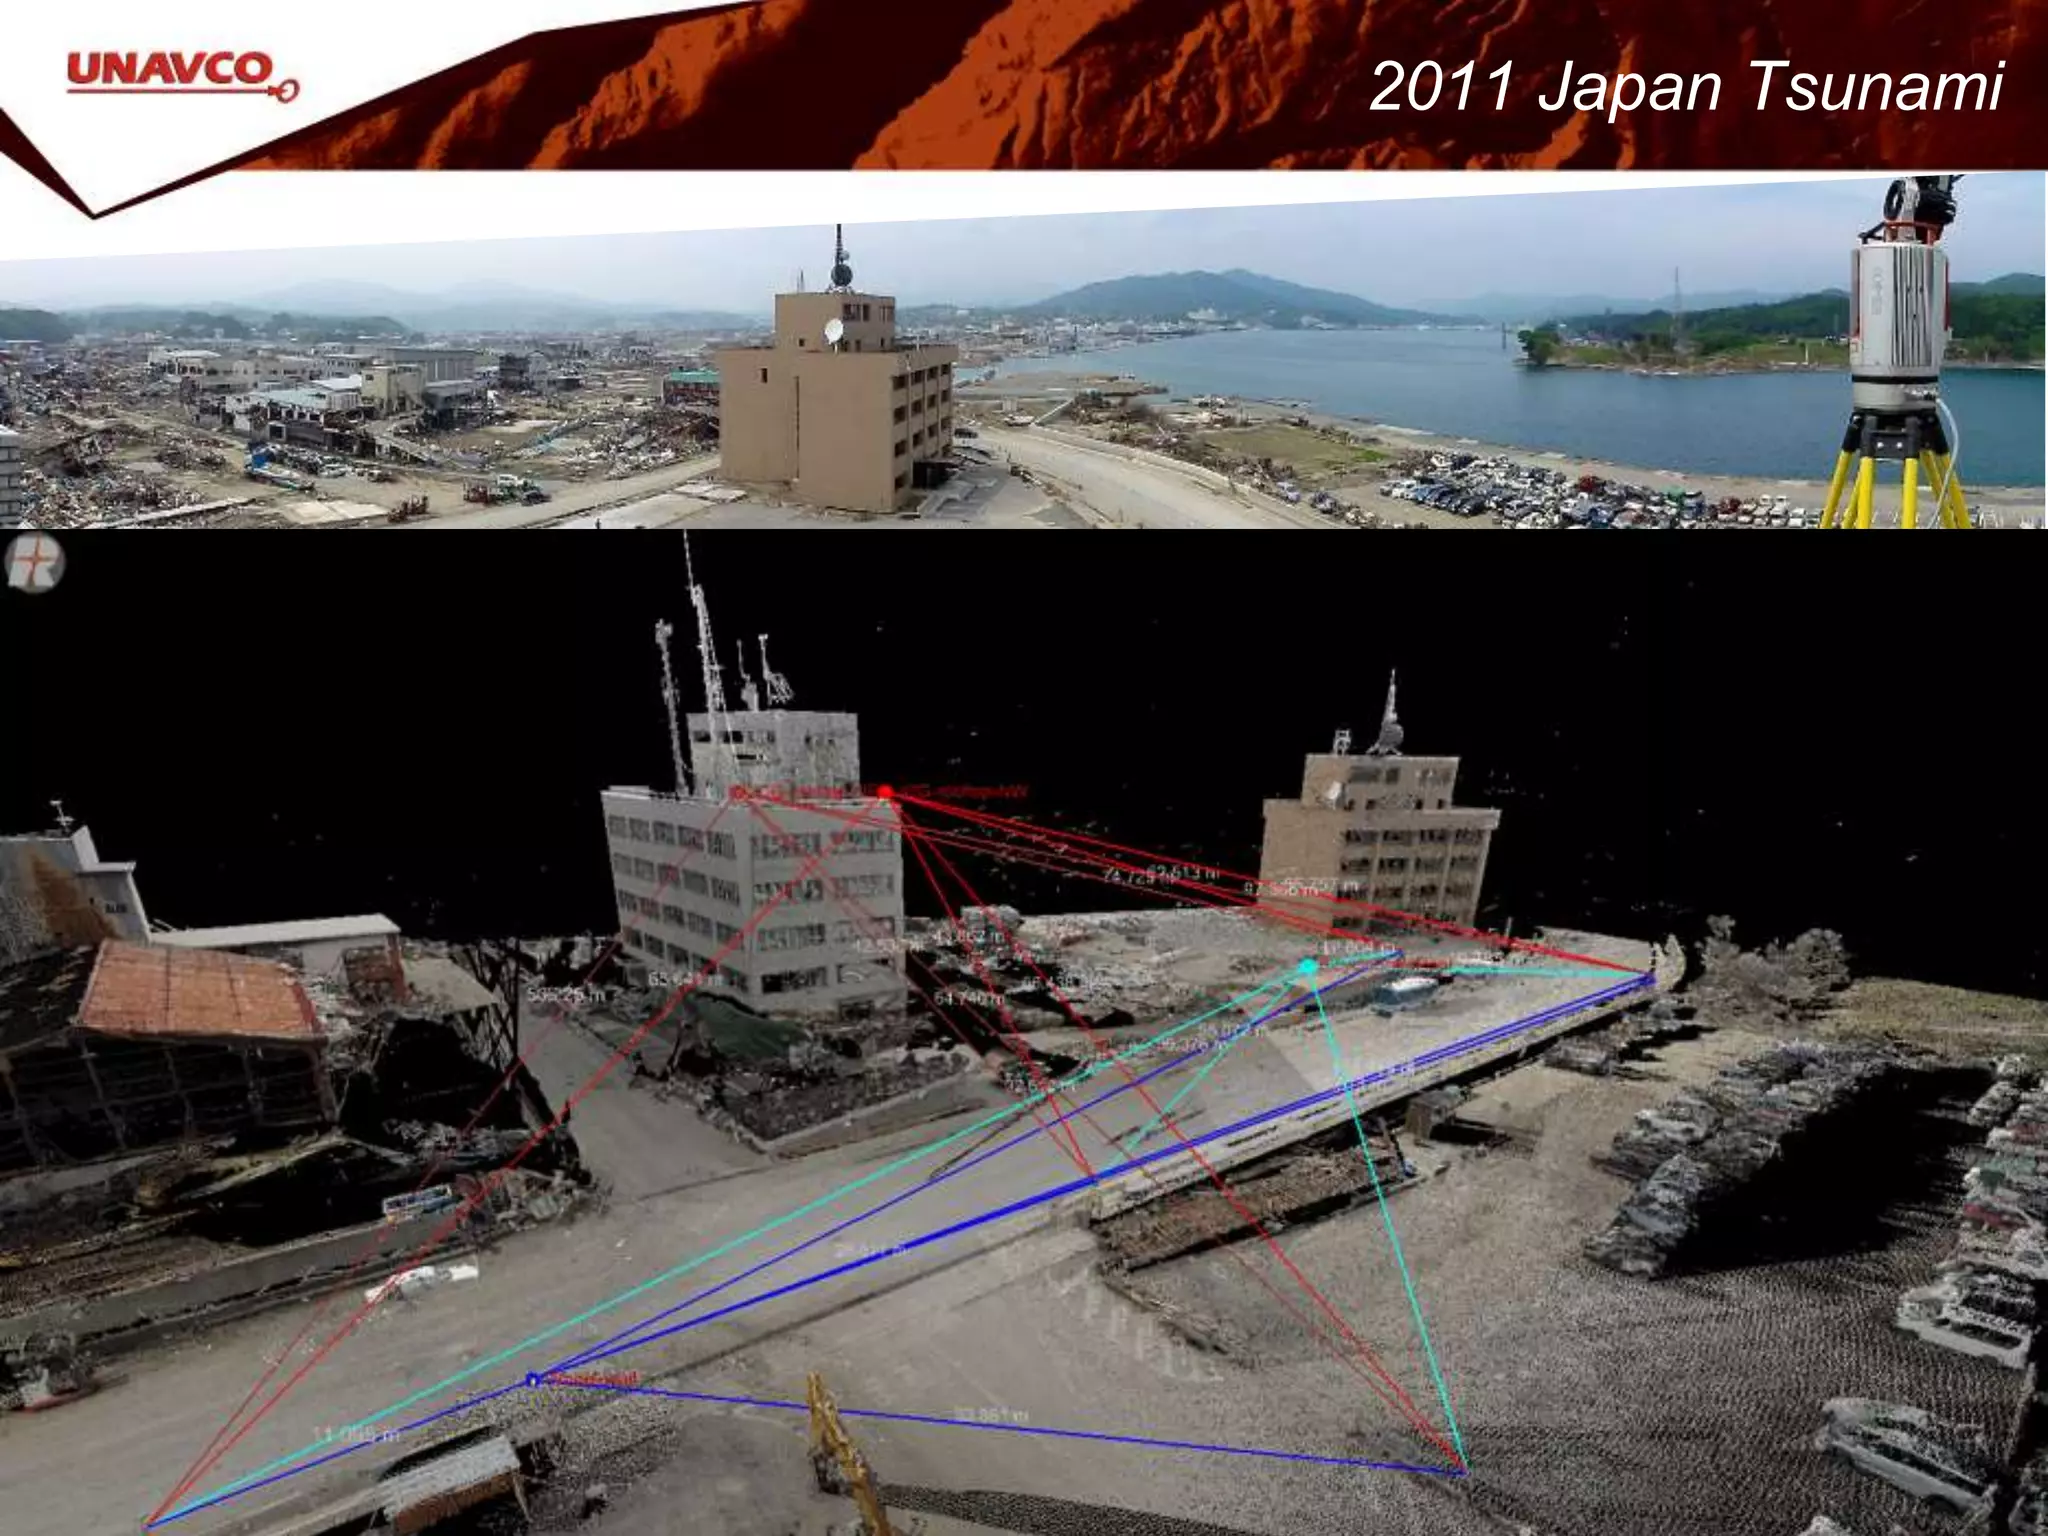
Research applications of TLS technology in post-tsunami measurements in 2011.
TLS project aimed at studying precariously balanced rocks for seismic modeling.
Research using TLS to study erosion impacts and logistics in remote polar environments.
TLS scanning of volcanic activities in Antarctica for thermal energy budgeting.
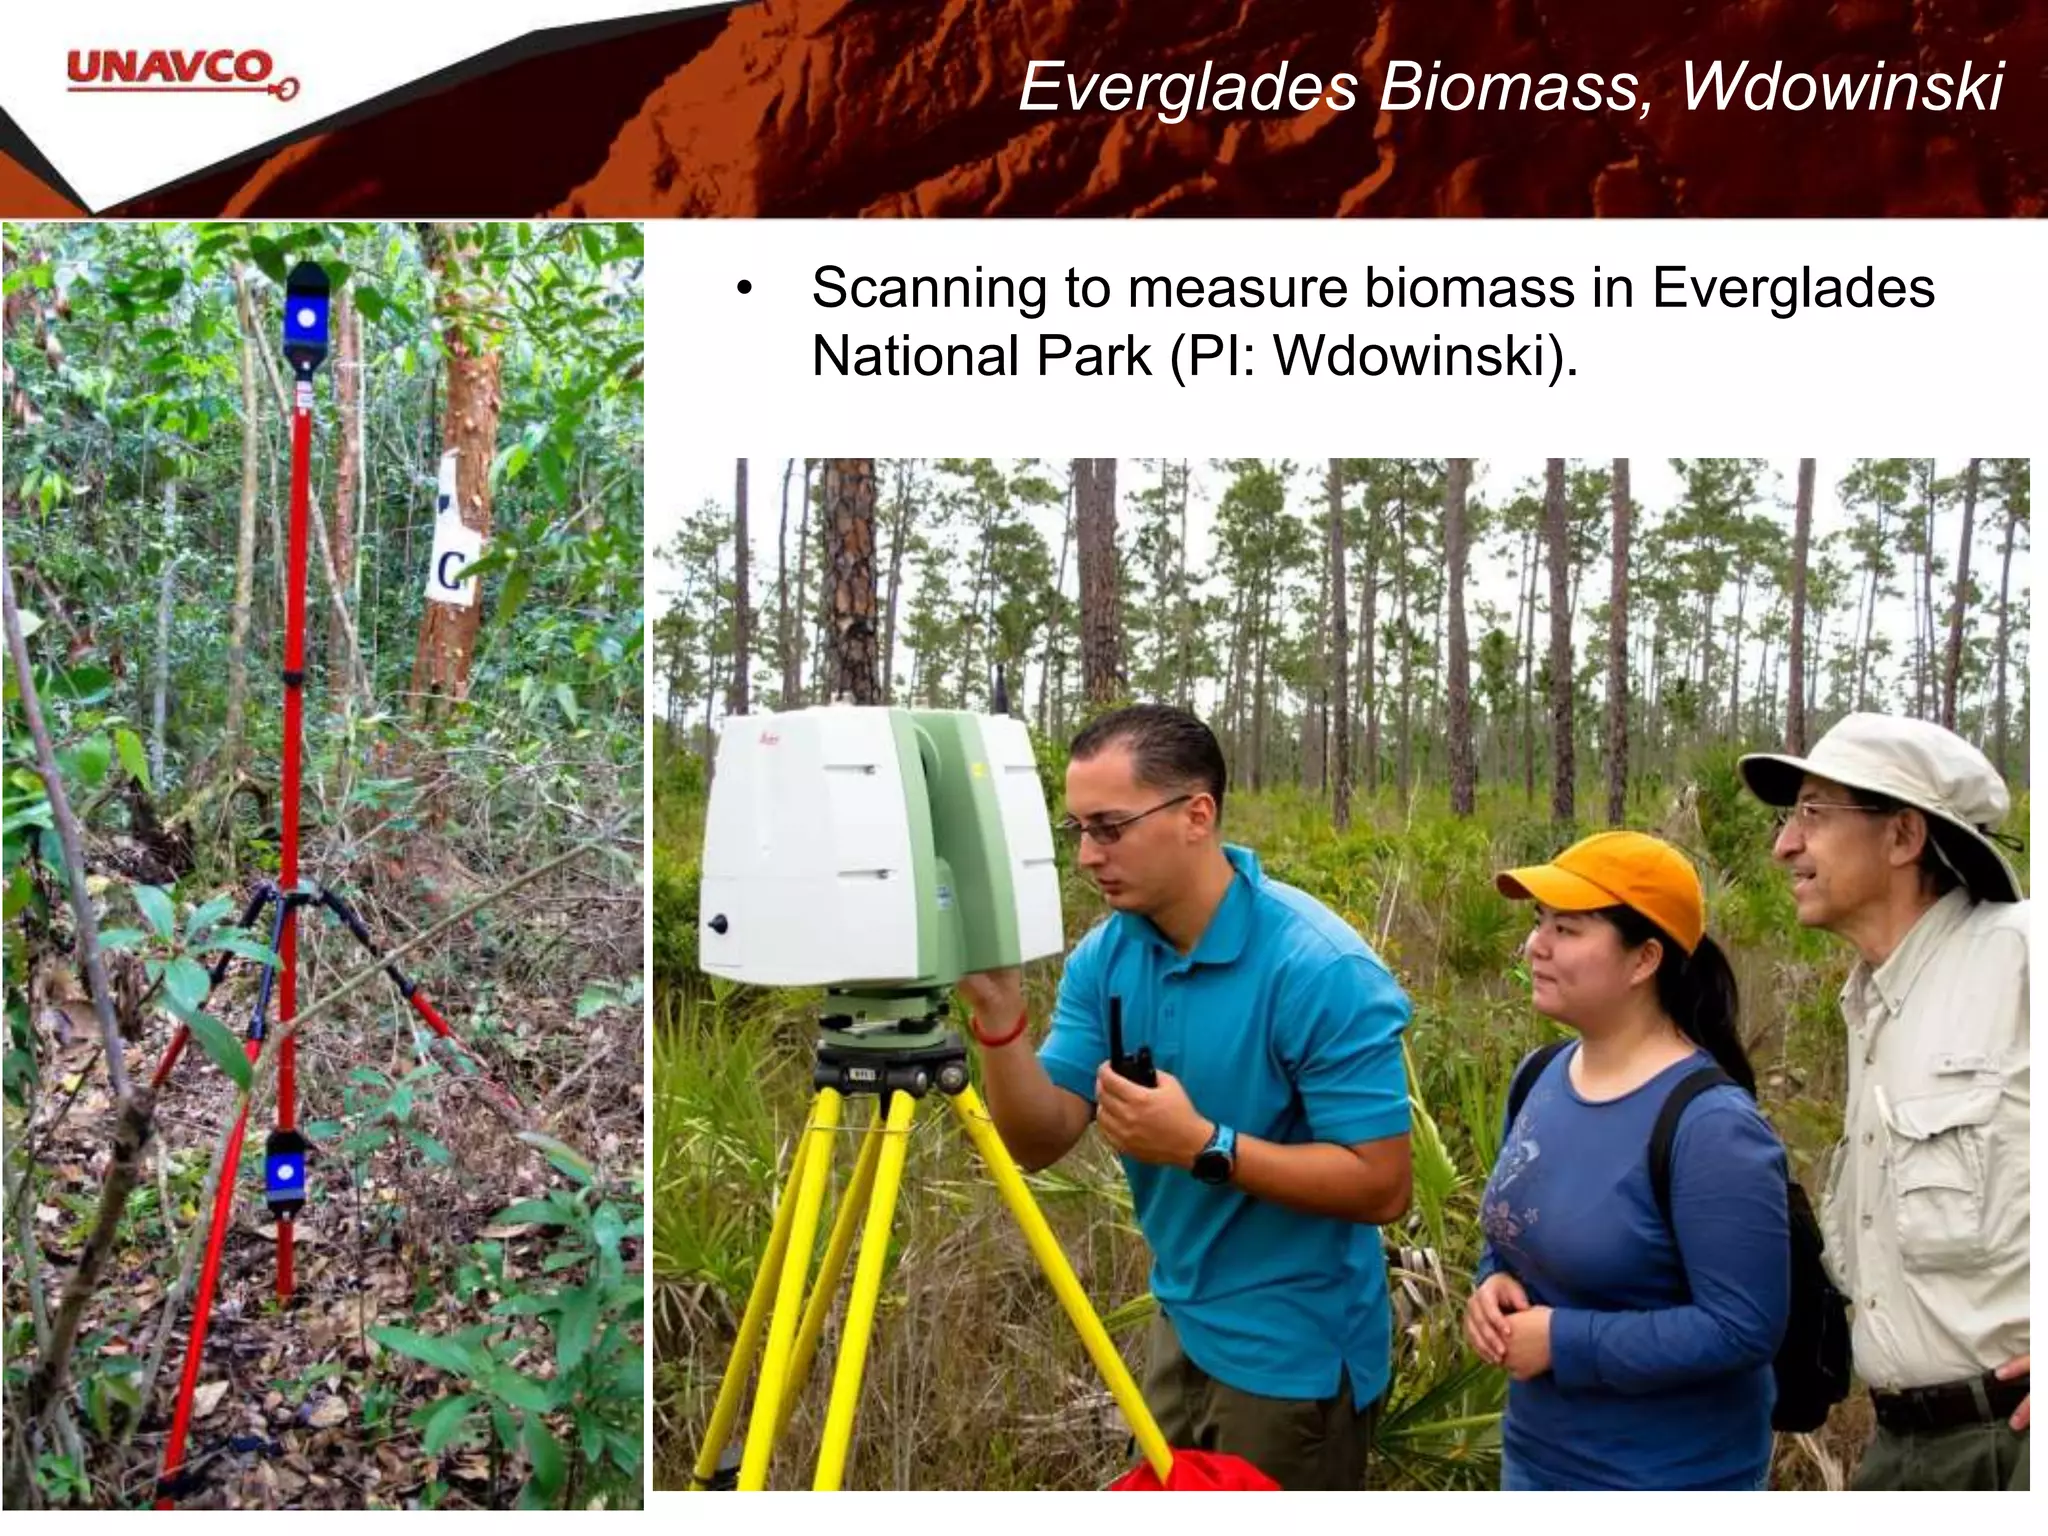
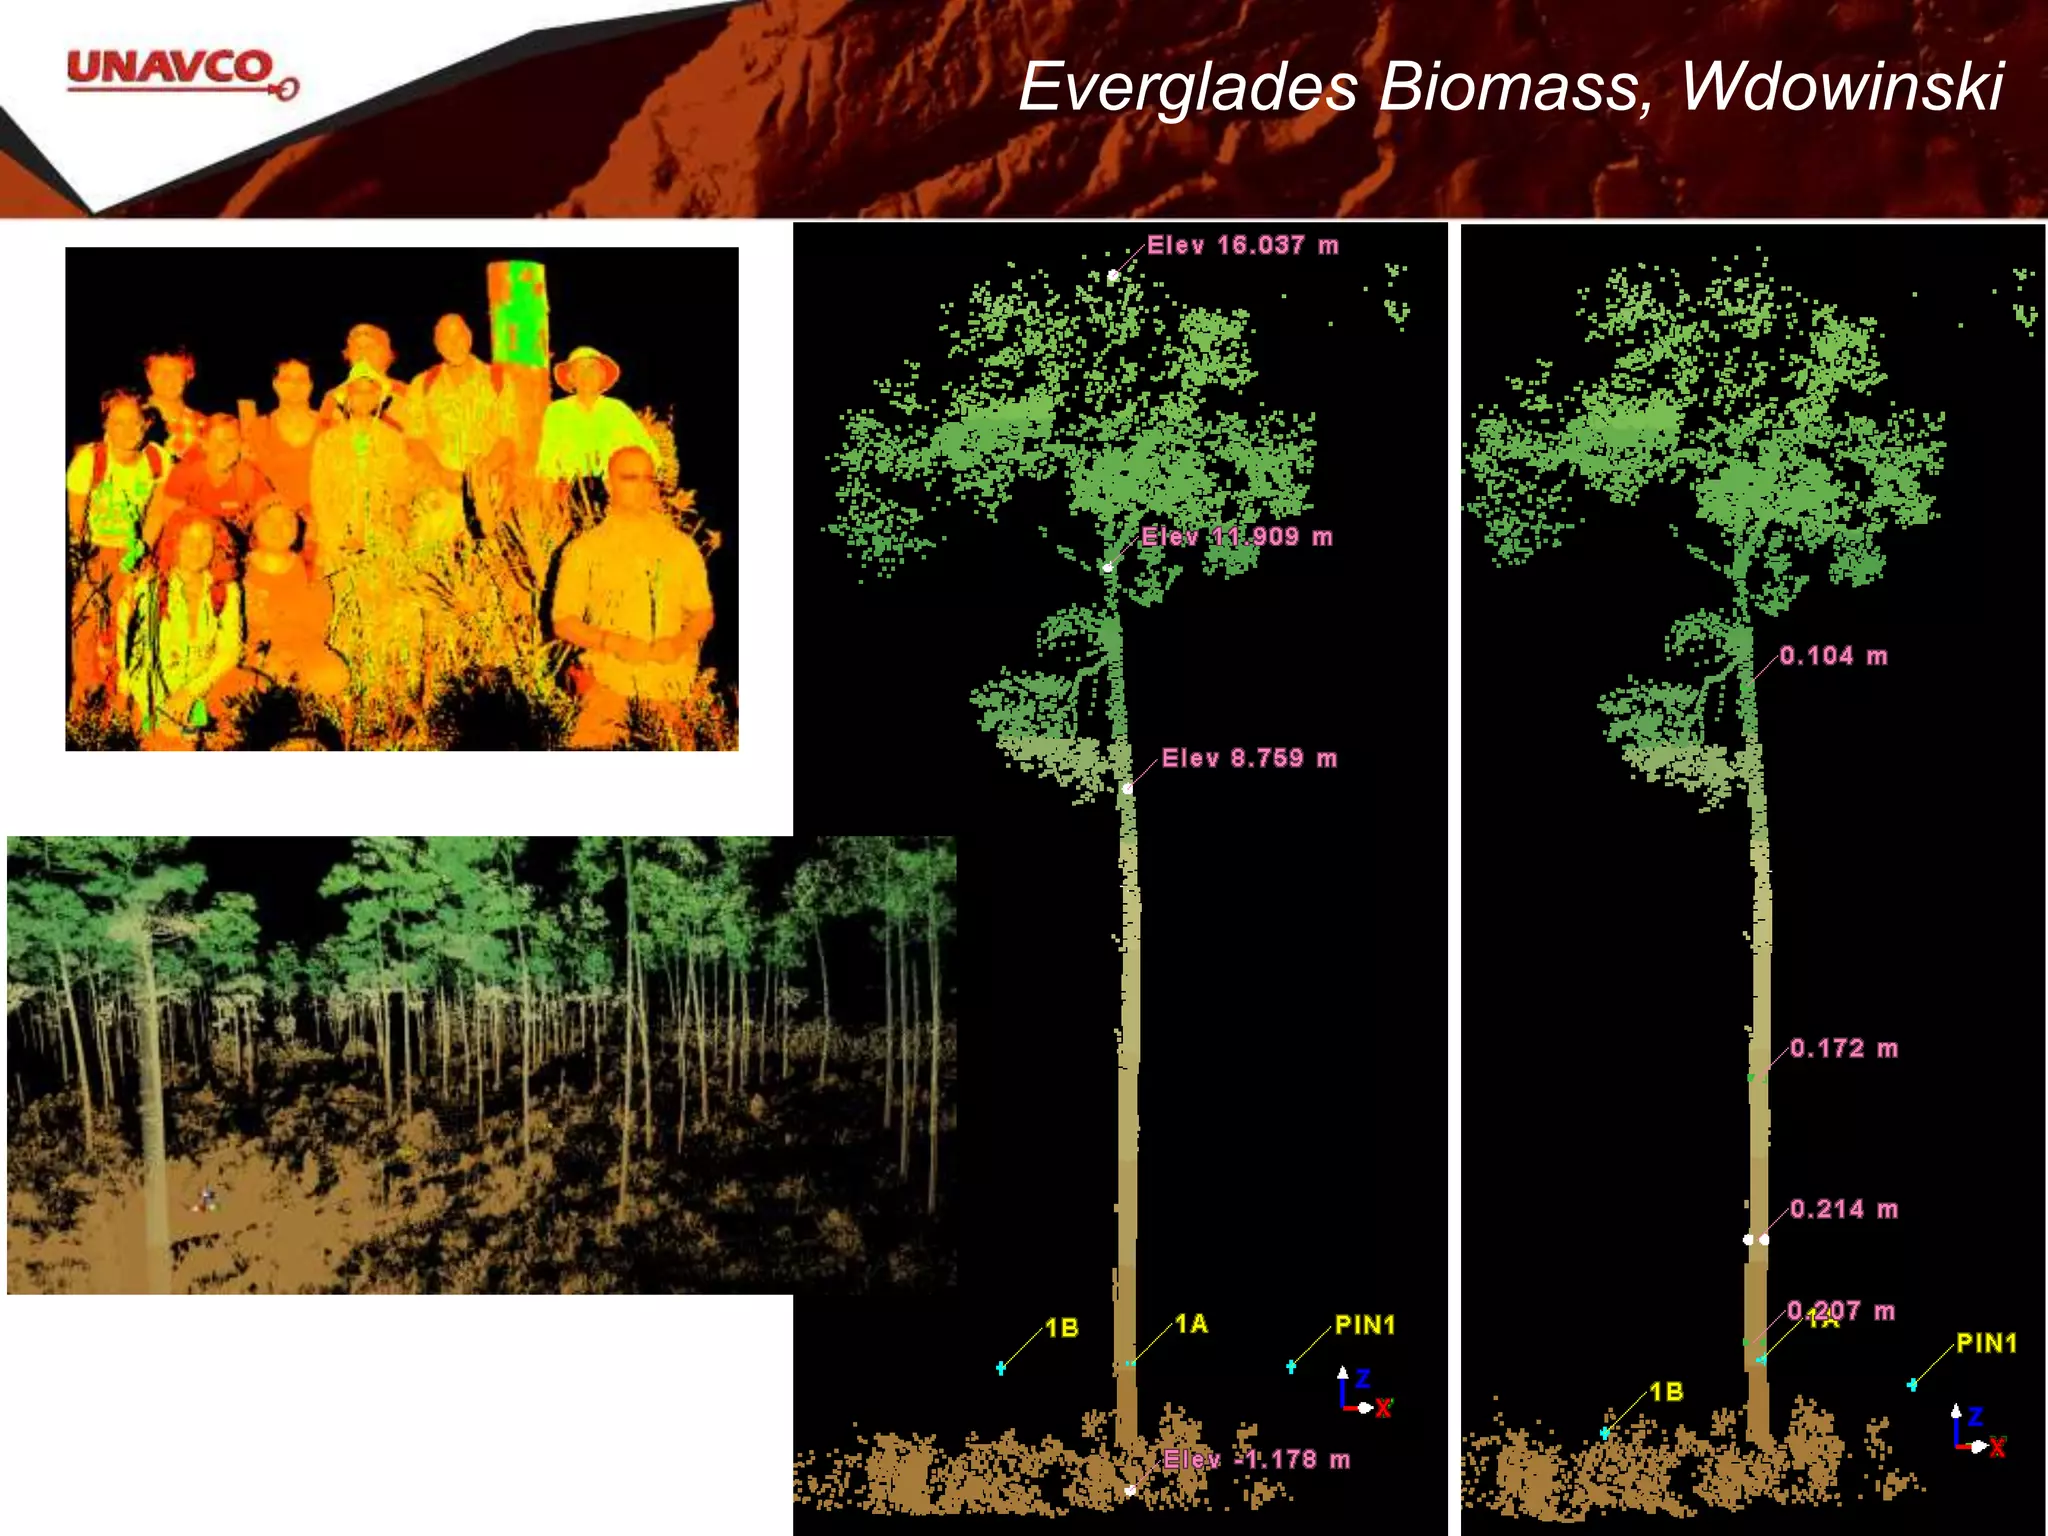
Utilizing TLS to measure biomass in ecology, specifically in the Everglades.
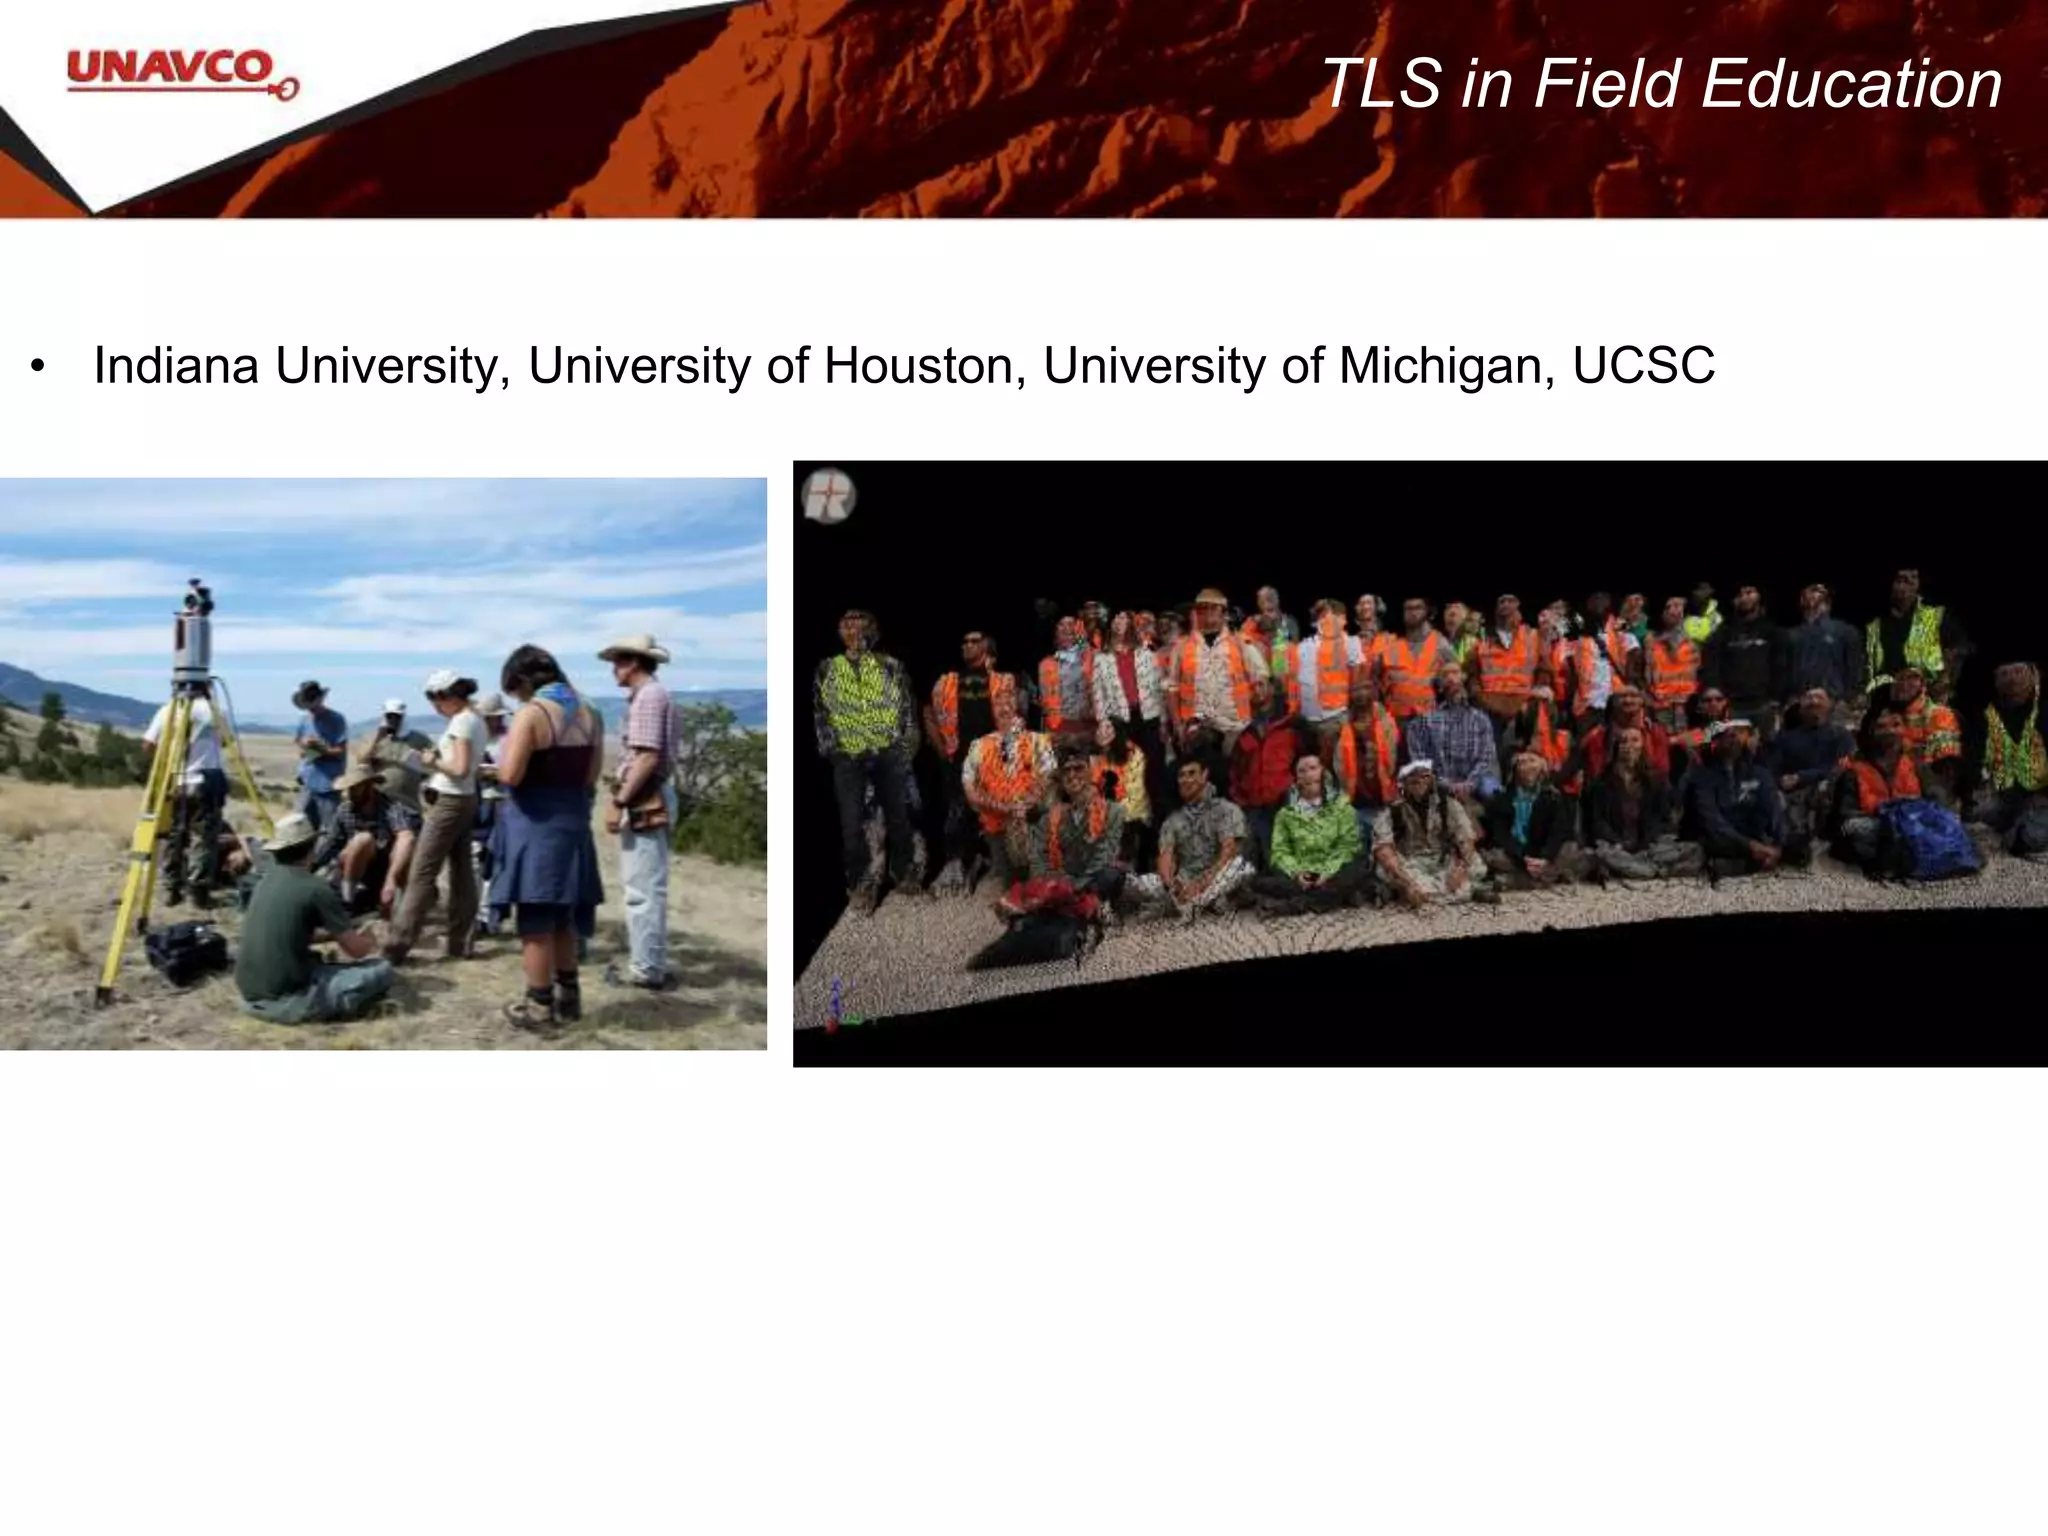
Educational collaborations and field research projects involving TLS.
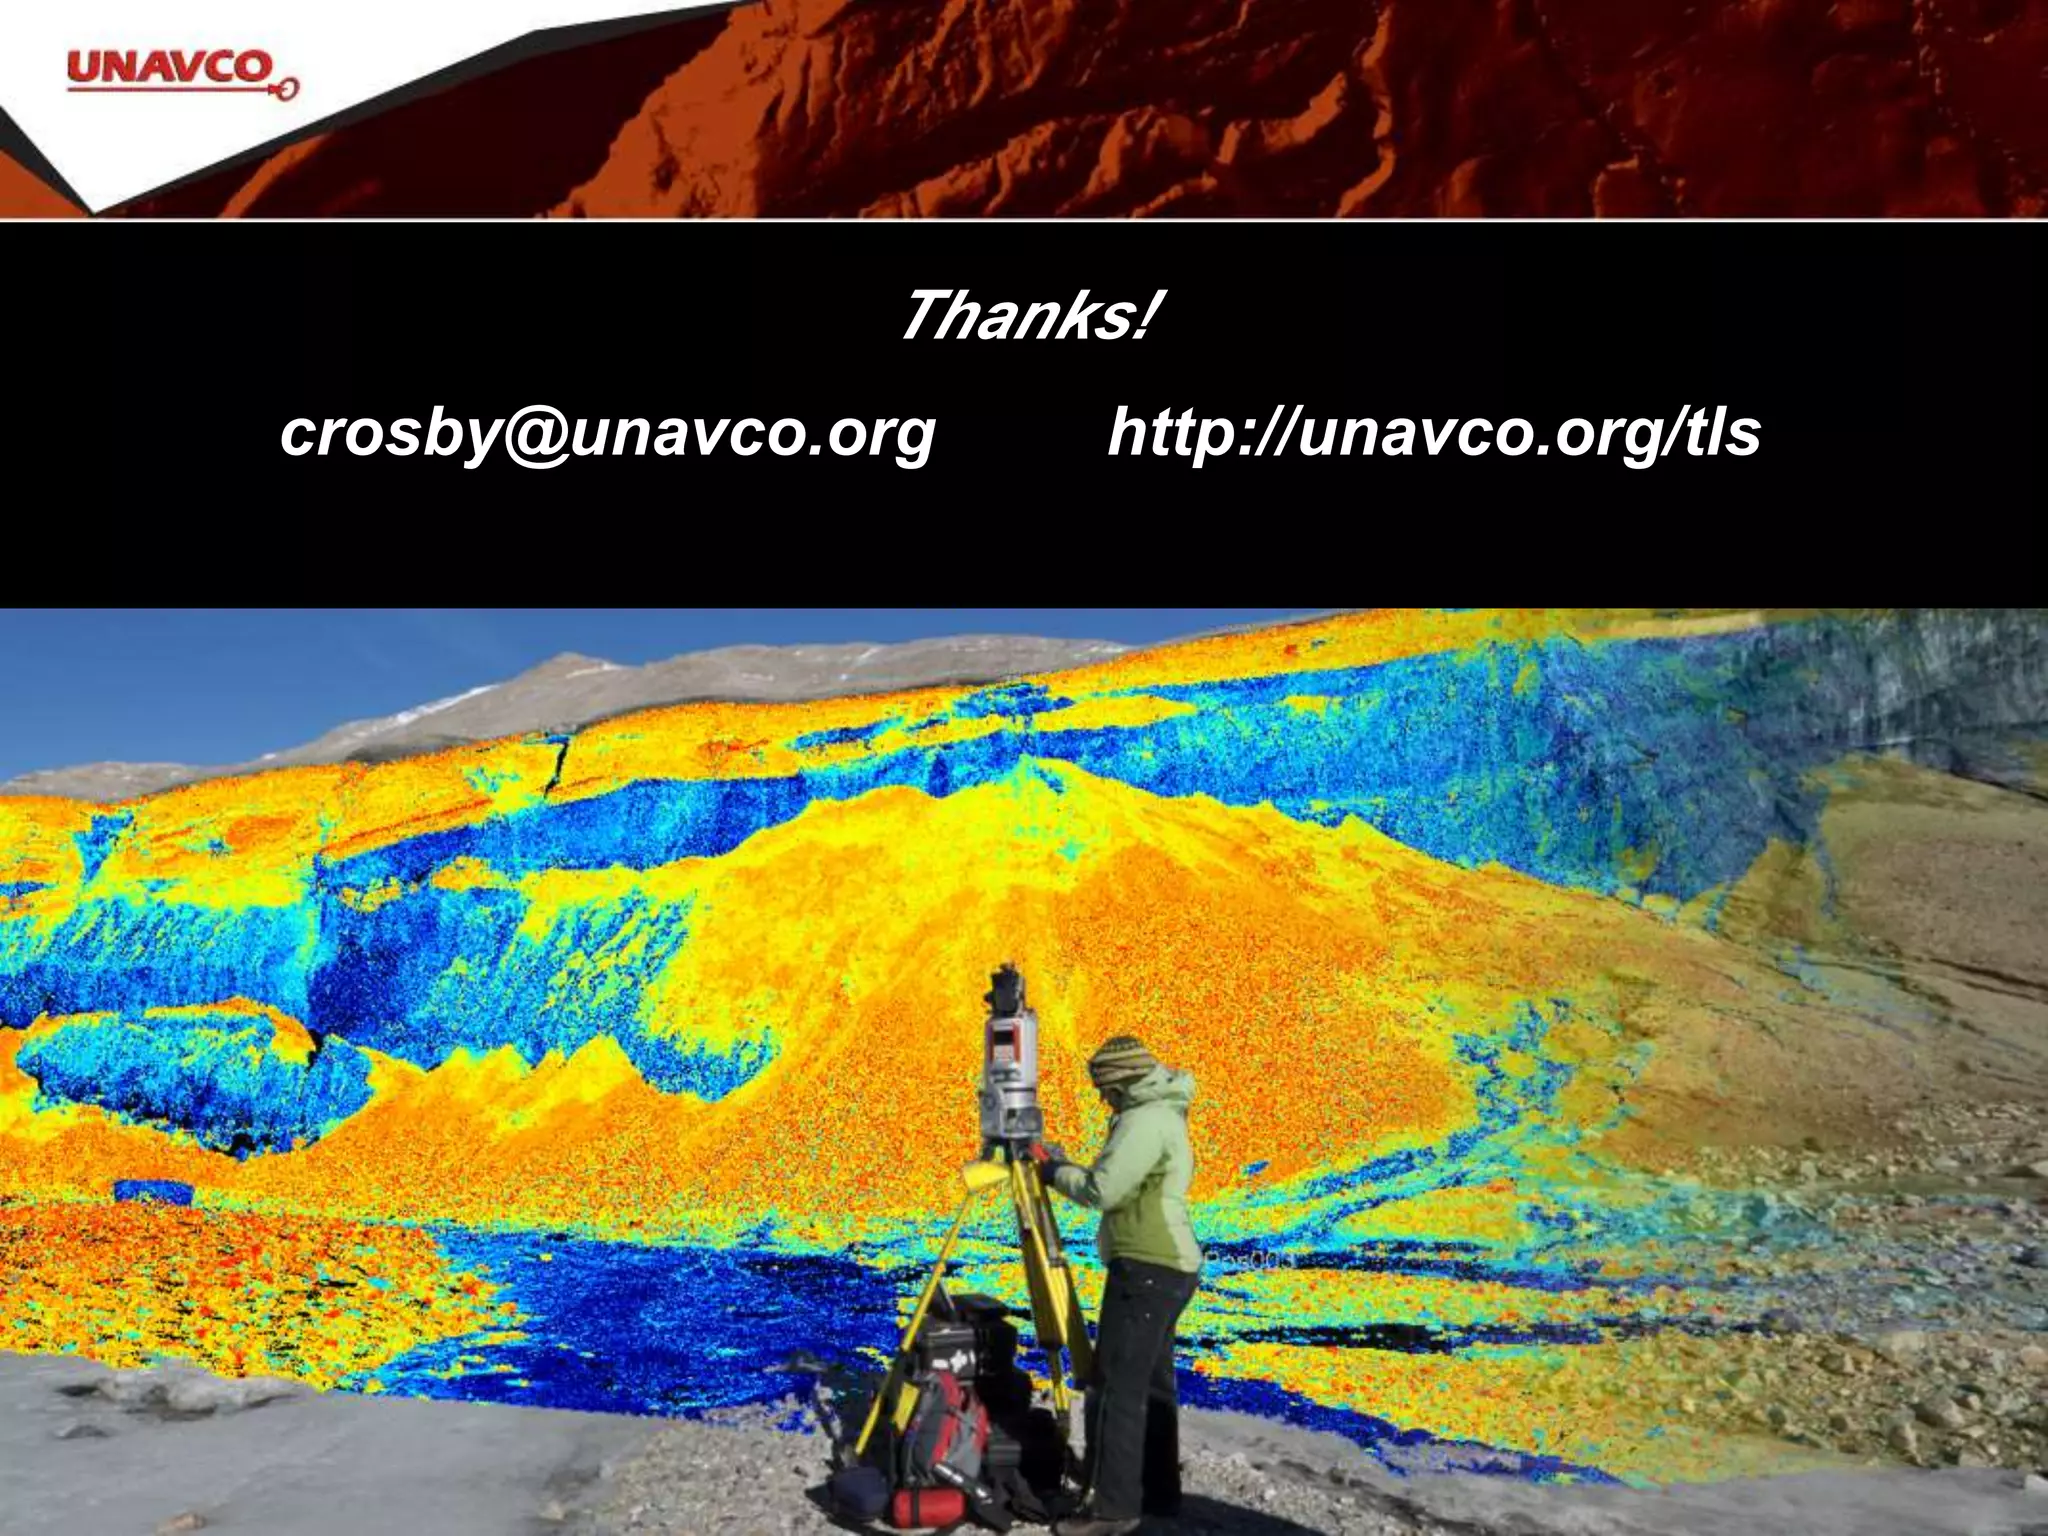
Conclusion of the presentation with contact details for follow-up.
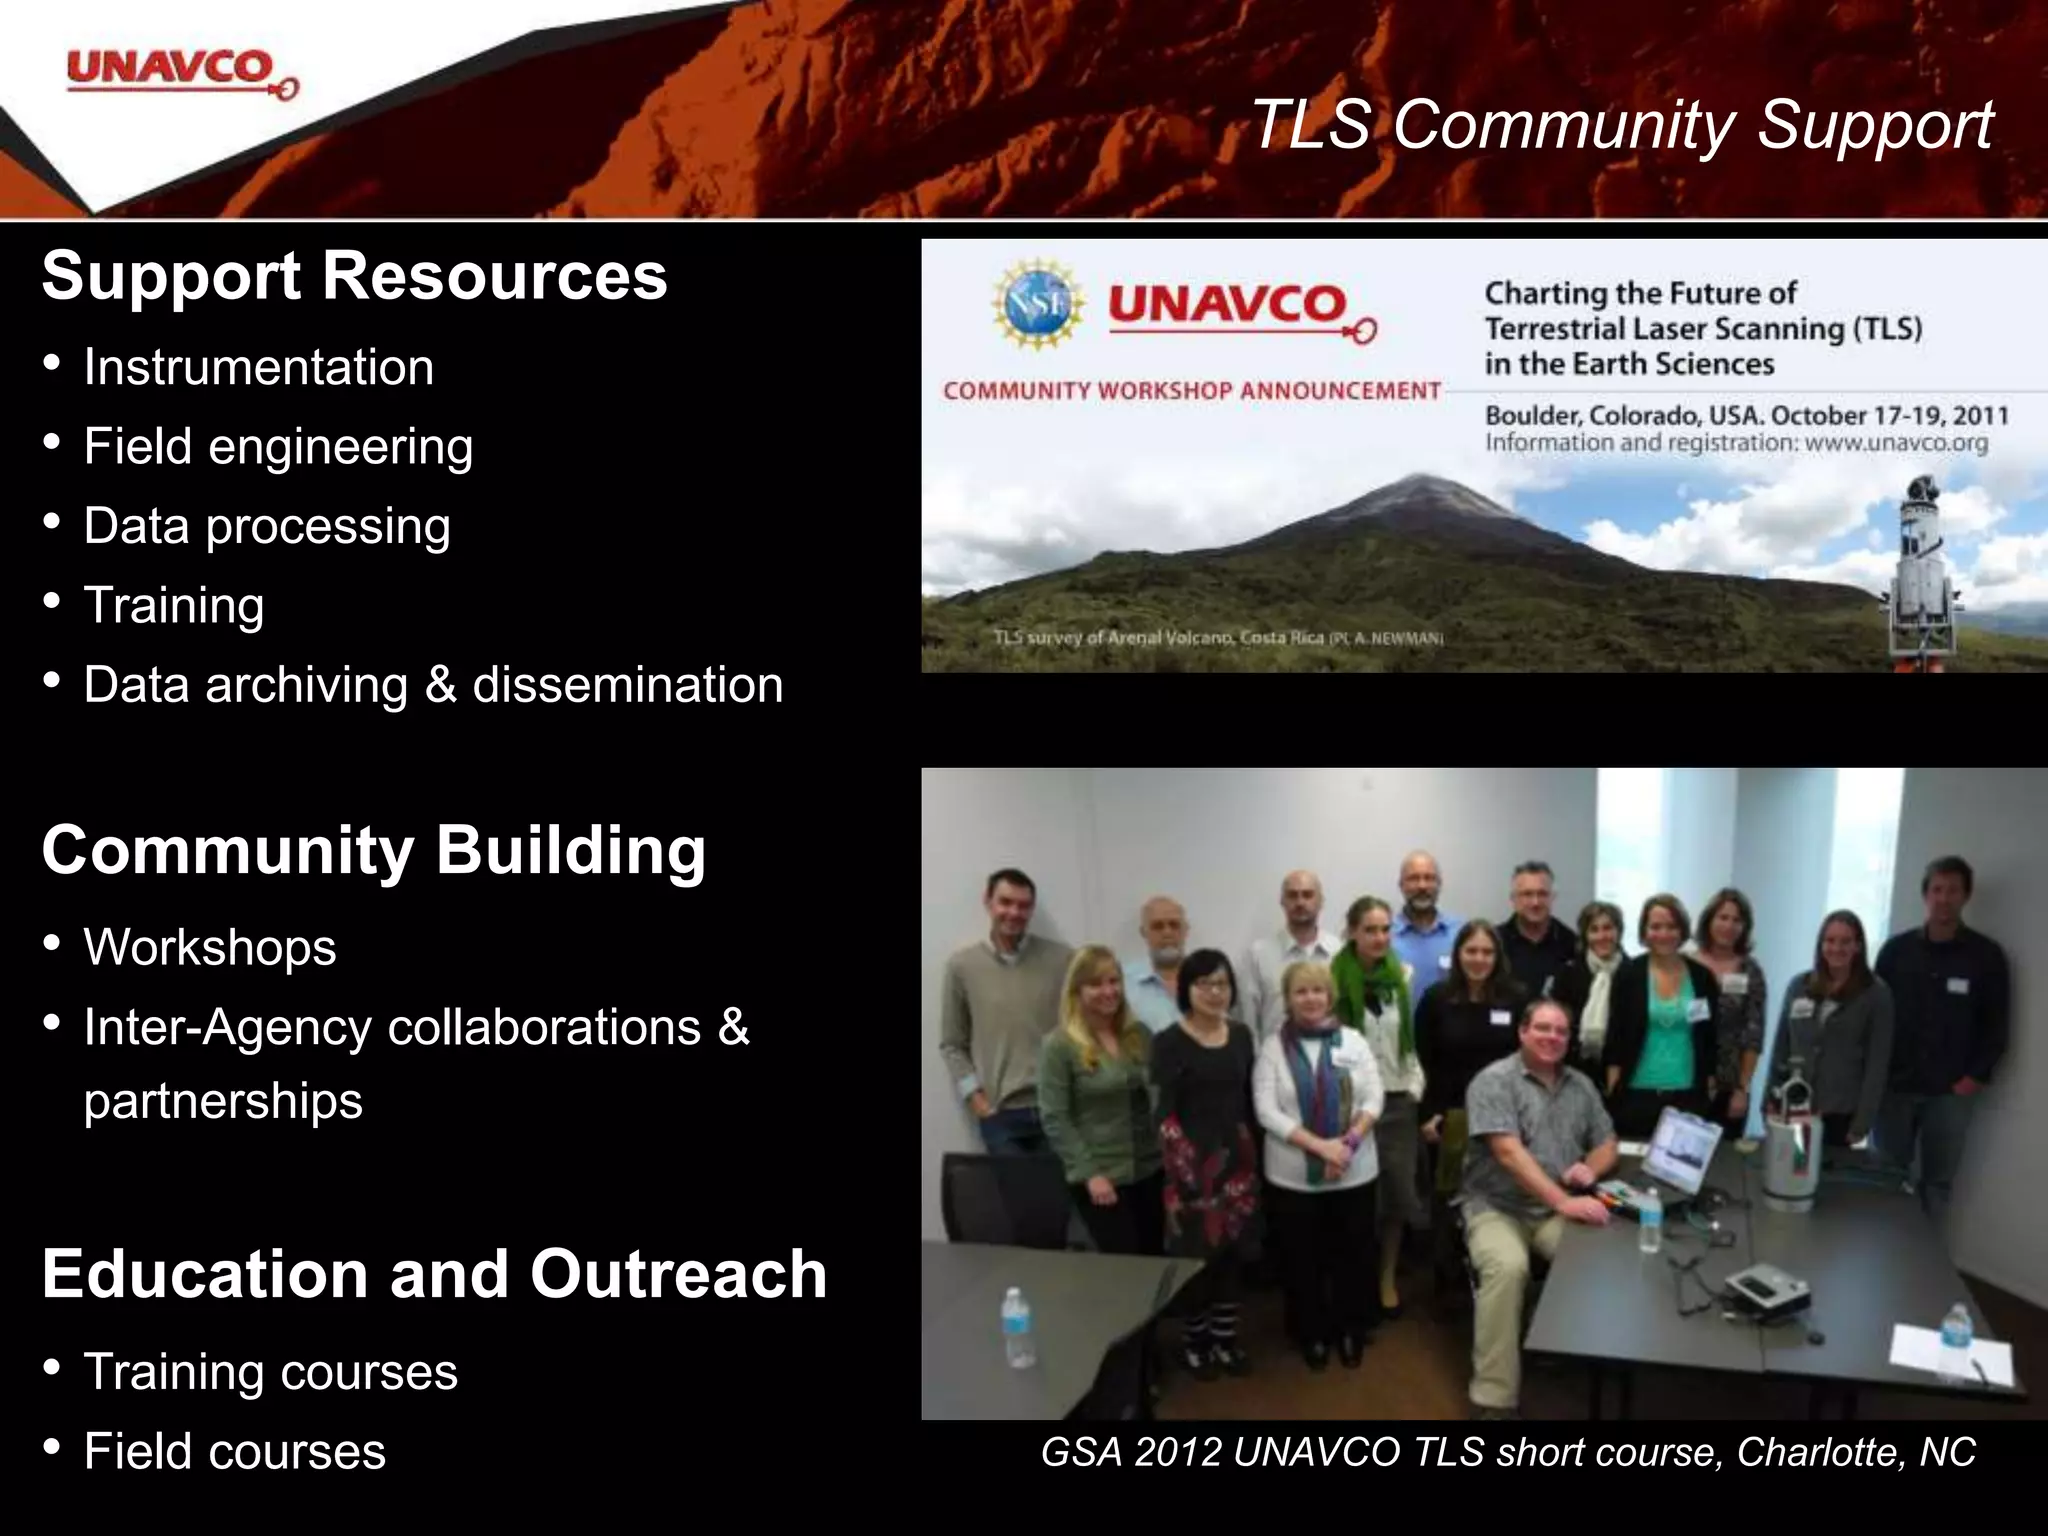
Support Resources
• Instrumentation
•Field engineering
• Data processing
• Training
• Data archiving & dissemination
Community Building
• Workshops
• Inter-Agency collaborations &
partnerships
Education and Outreach
• Training courses
• Field courses GSA 2012 UNAVCO TLS short course, Charlotte, NC
TLS Community Support
5.
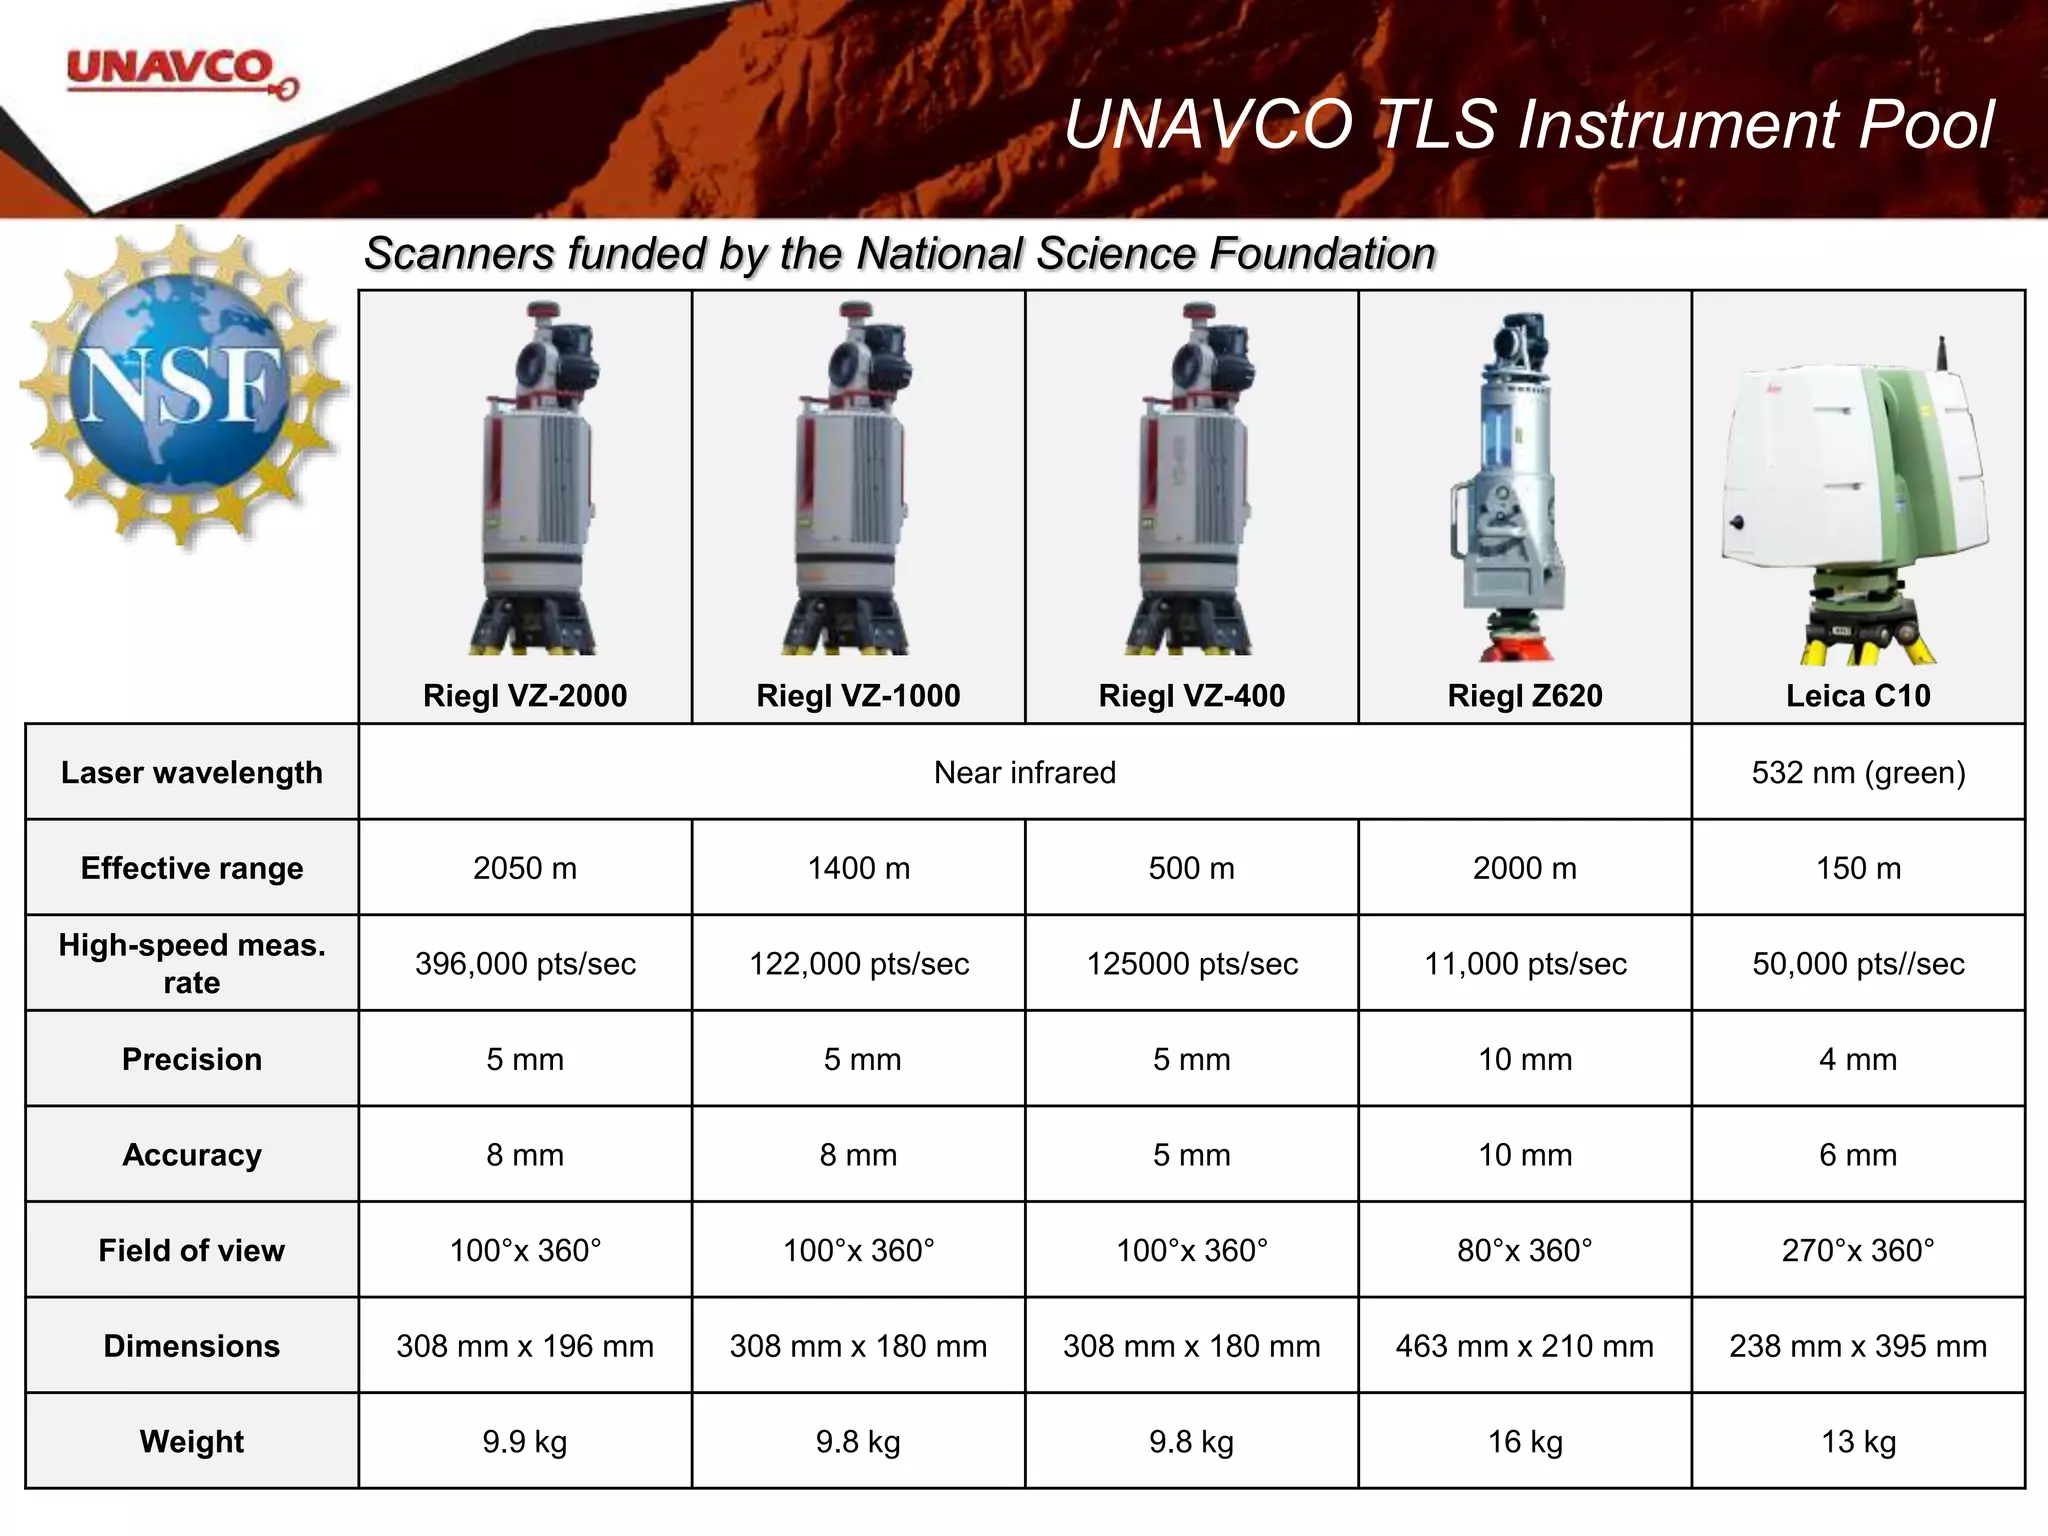
Scanners funded bythe National Science Foundation
UNAVCO TLS Instrument Pool
Riegl VZ-2000 Riegl VZ-1000 Riegl VZ-400 Riegl Z620 Leica C10
Laser wavelength Near infrared 532 nm (green)
Effective range 2050 m 1400 m 500 m 2000 m 150 m
High-speed meas.
rate
396,000 pts/sec 122,000 pts/sec 125000 pts/sec 11,000 pts/sec 50,000 pts//sec
Precision 5 mm 5 mm 5 mm 10 mm 4 mm
Accuracy 8 mm 8 mm 5 mm 10 mm 6 mm
Field of view 100°x 360° 100°x 360° 100°x 360° 80°x 360° 270°x 360°
Dimensions 308 mm x 196 mm 308 mm x 180 mm 308 mm x 180 mm 463 mm x 210 mm 238 mm x 395 mm
Weight 9.9 kg 9.8 kg 9.8 kg 16 kg 13 kg
6.
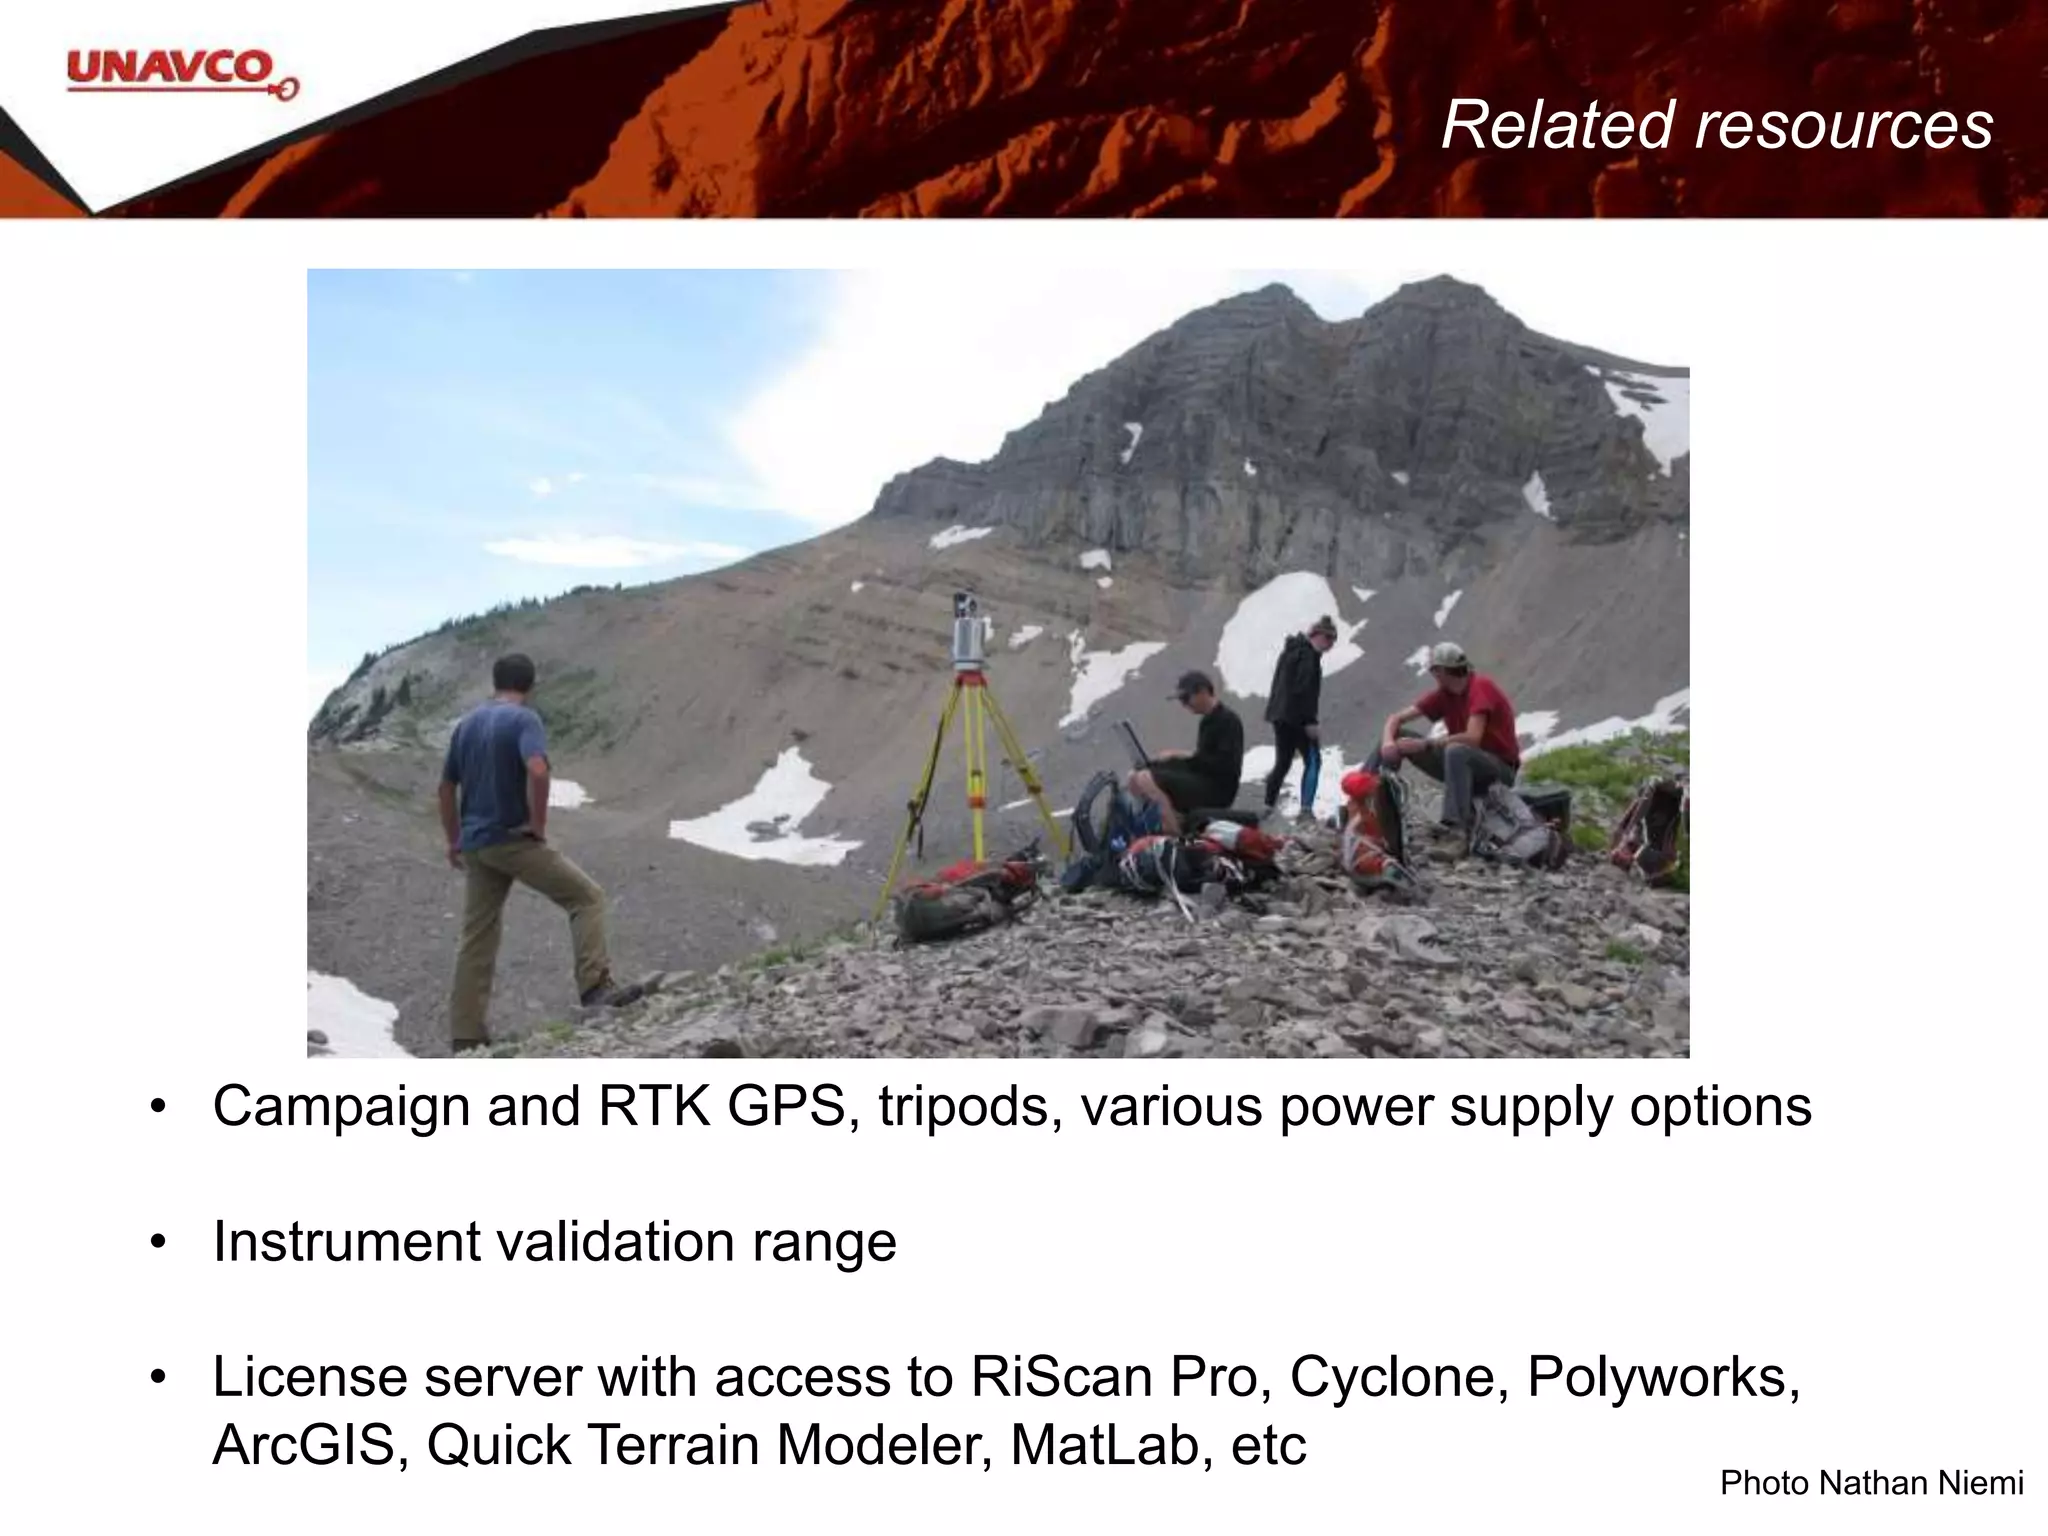
• Campaign andRTK GPS, tripods, various power supply options
• Instrument validation range
• License server with access to RiScan Pro, Cyclone, Polyworks,
ArcGIS, Quick Terrain Modeler, MatLab, etc
Related resources
Photo Nathan Niemi
7.
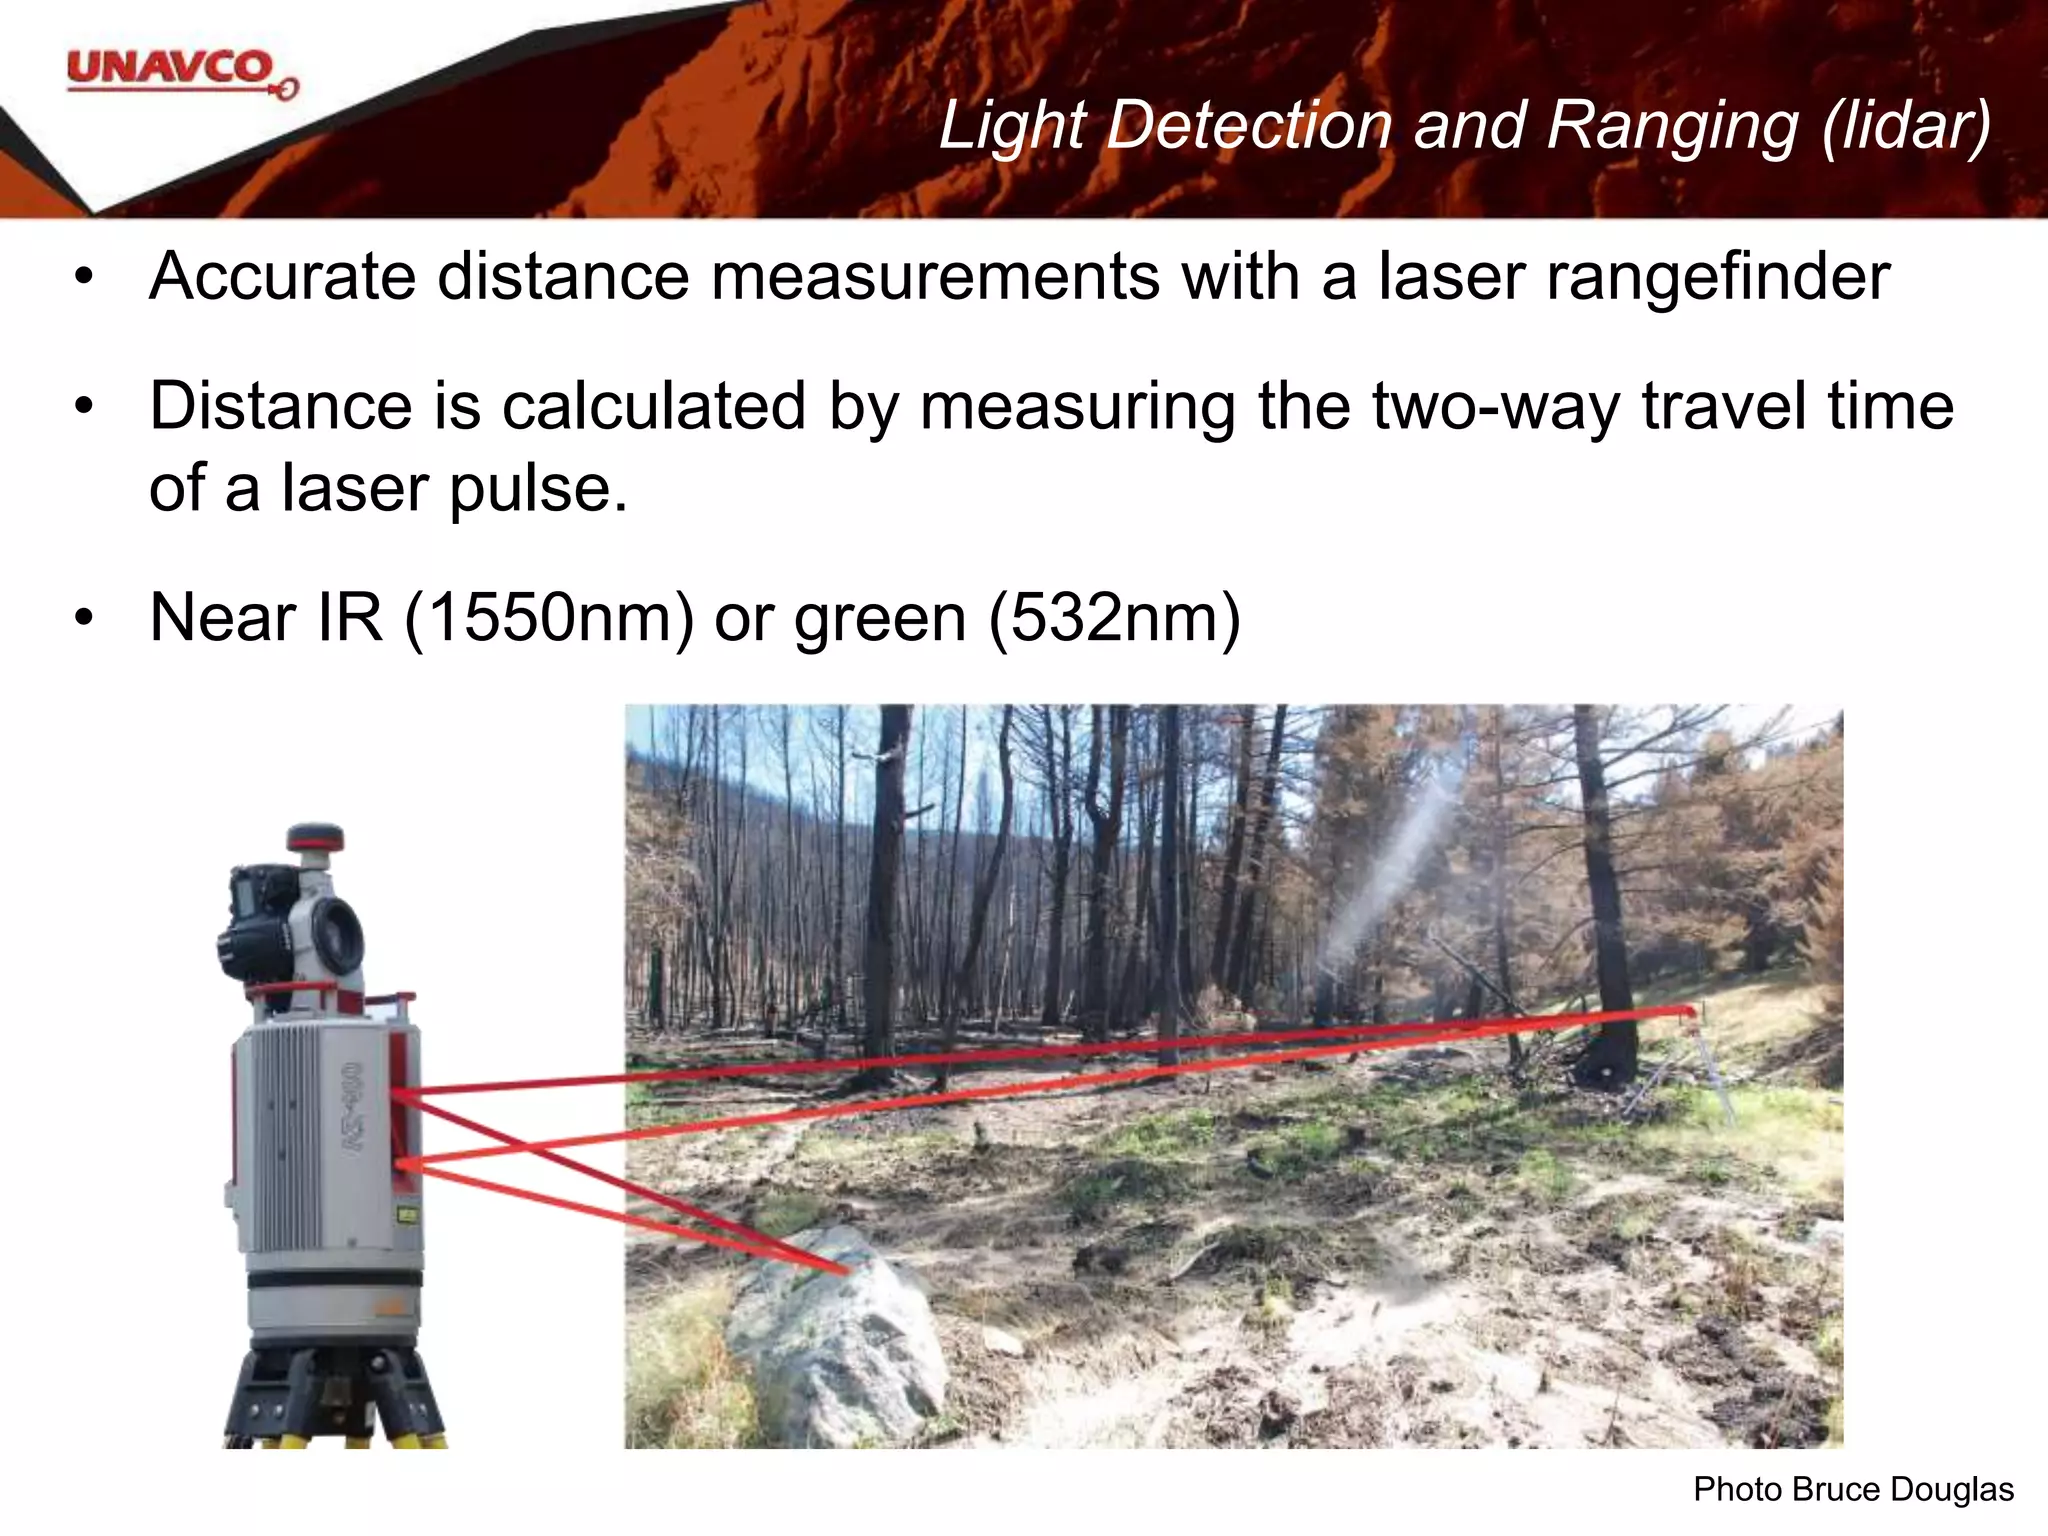
Light Detection andRanging (lidar)
• Accurate distance measurements with a laser rangefinder
• Distance is calculated by measuring the two-way travel time
of a laser pulse.
• Near IR (1550nm) or green (532nm)
Photo Bruce Douglas
8.
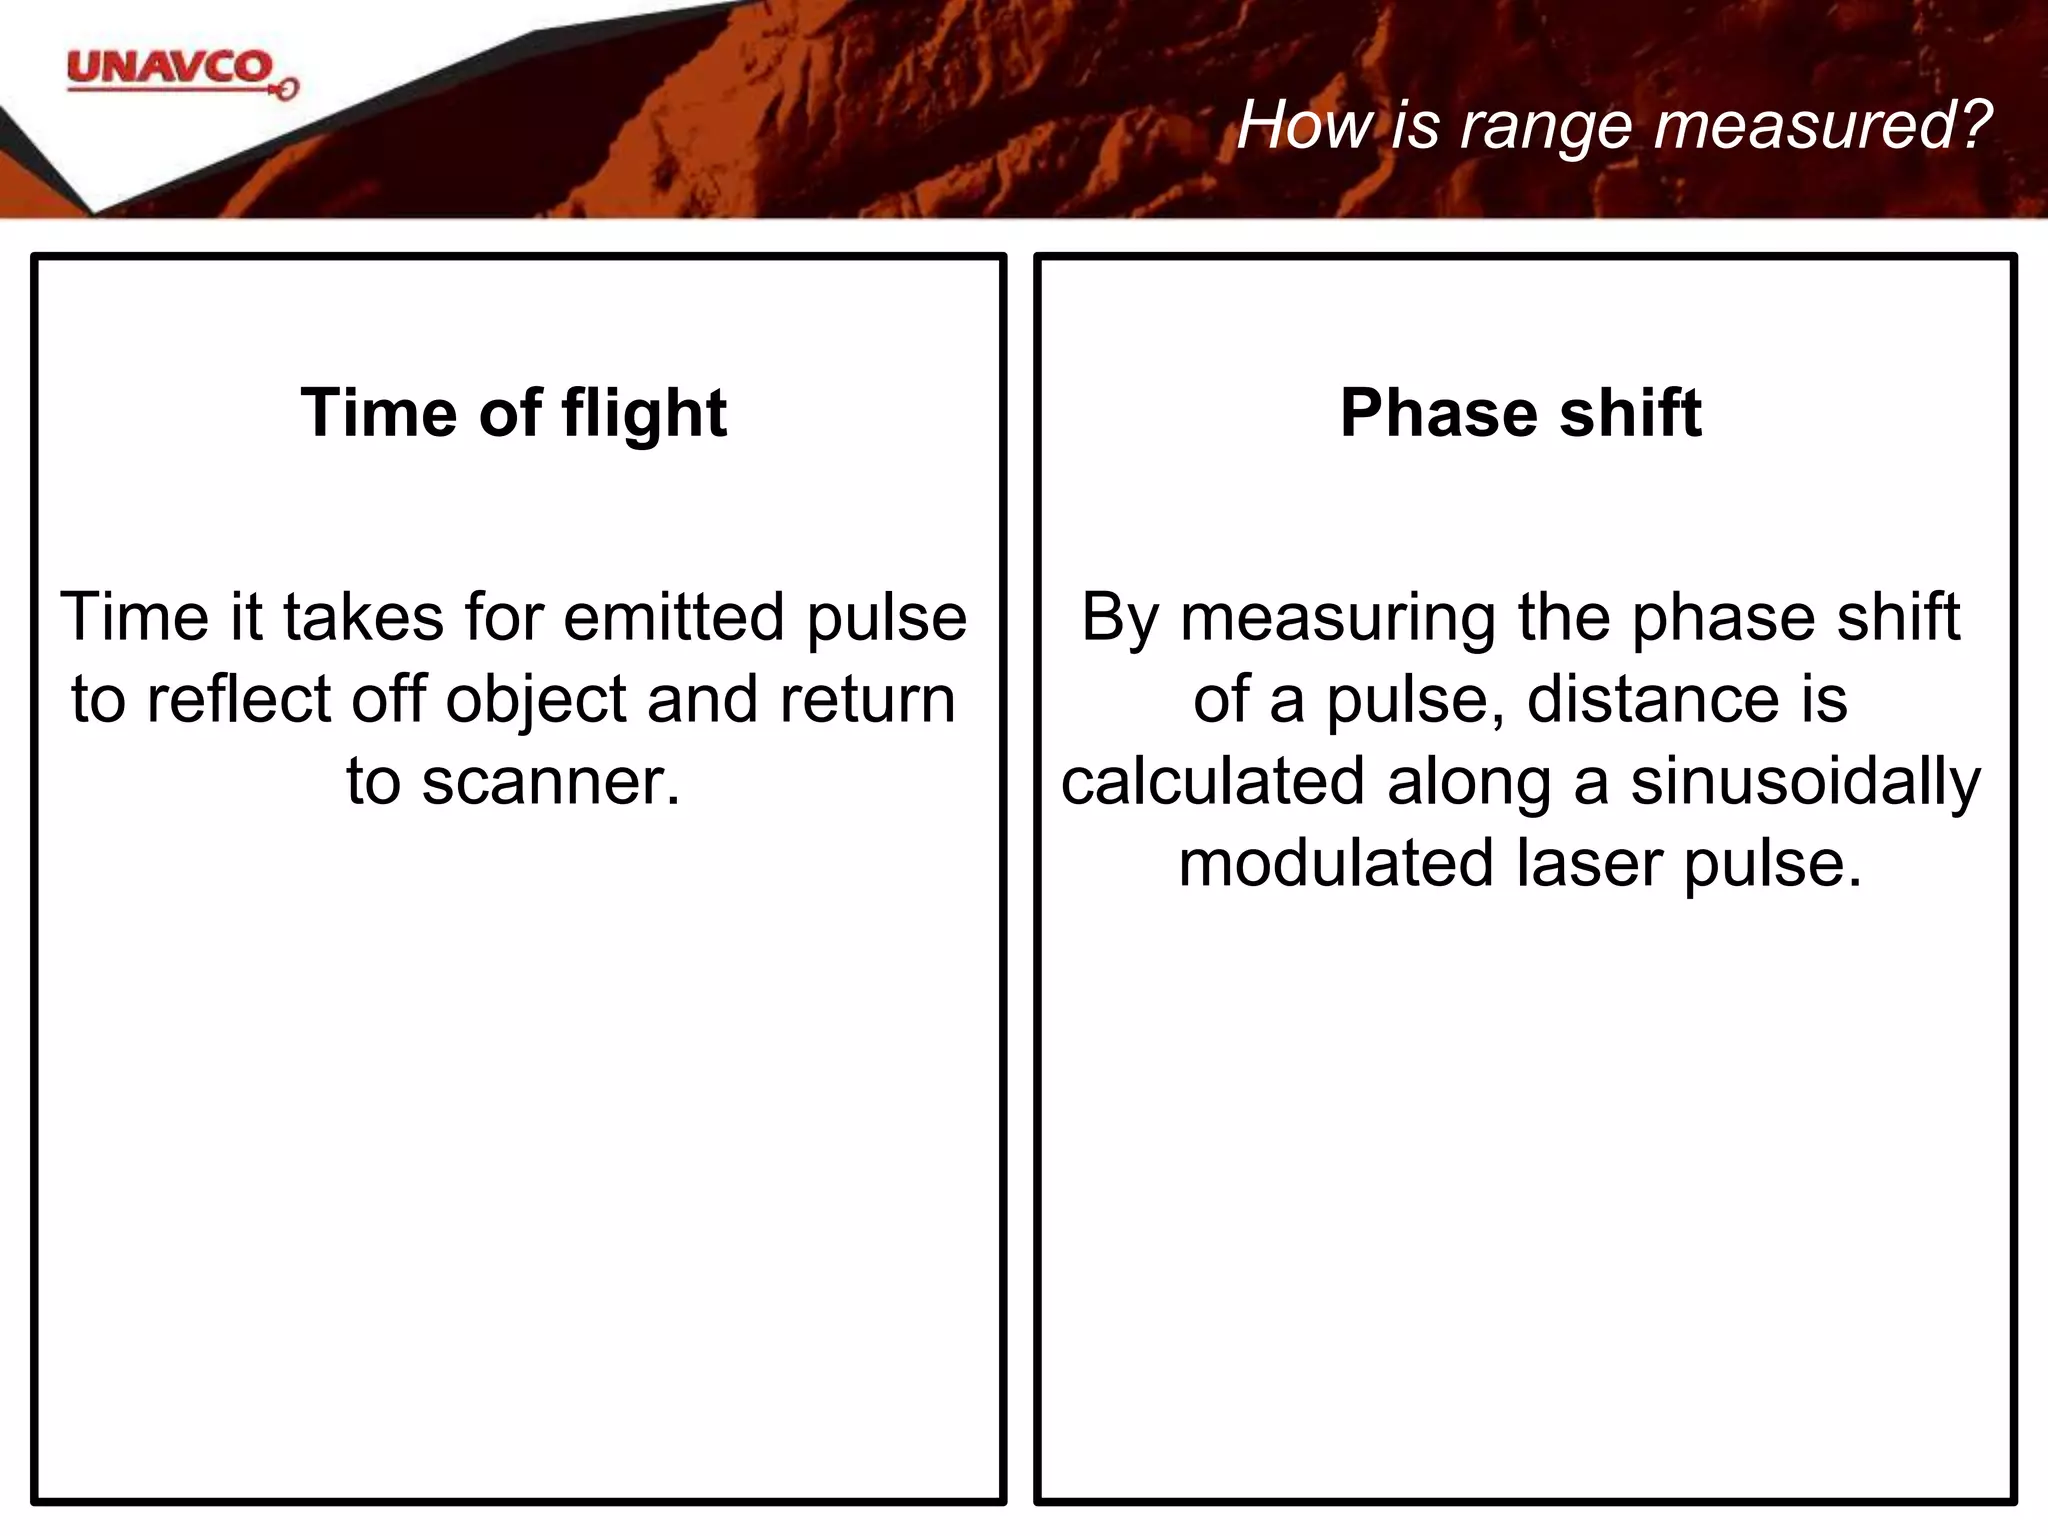
Time of flight
Timeit takes for emitted pulse
to reflect off object and return
to scanner.
Phase shift
By measuring the phase shift
of a pulse, distance is
calculated along a sinusoidally
modulated laser pulse.
How is range measured?
9.
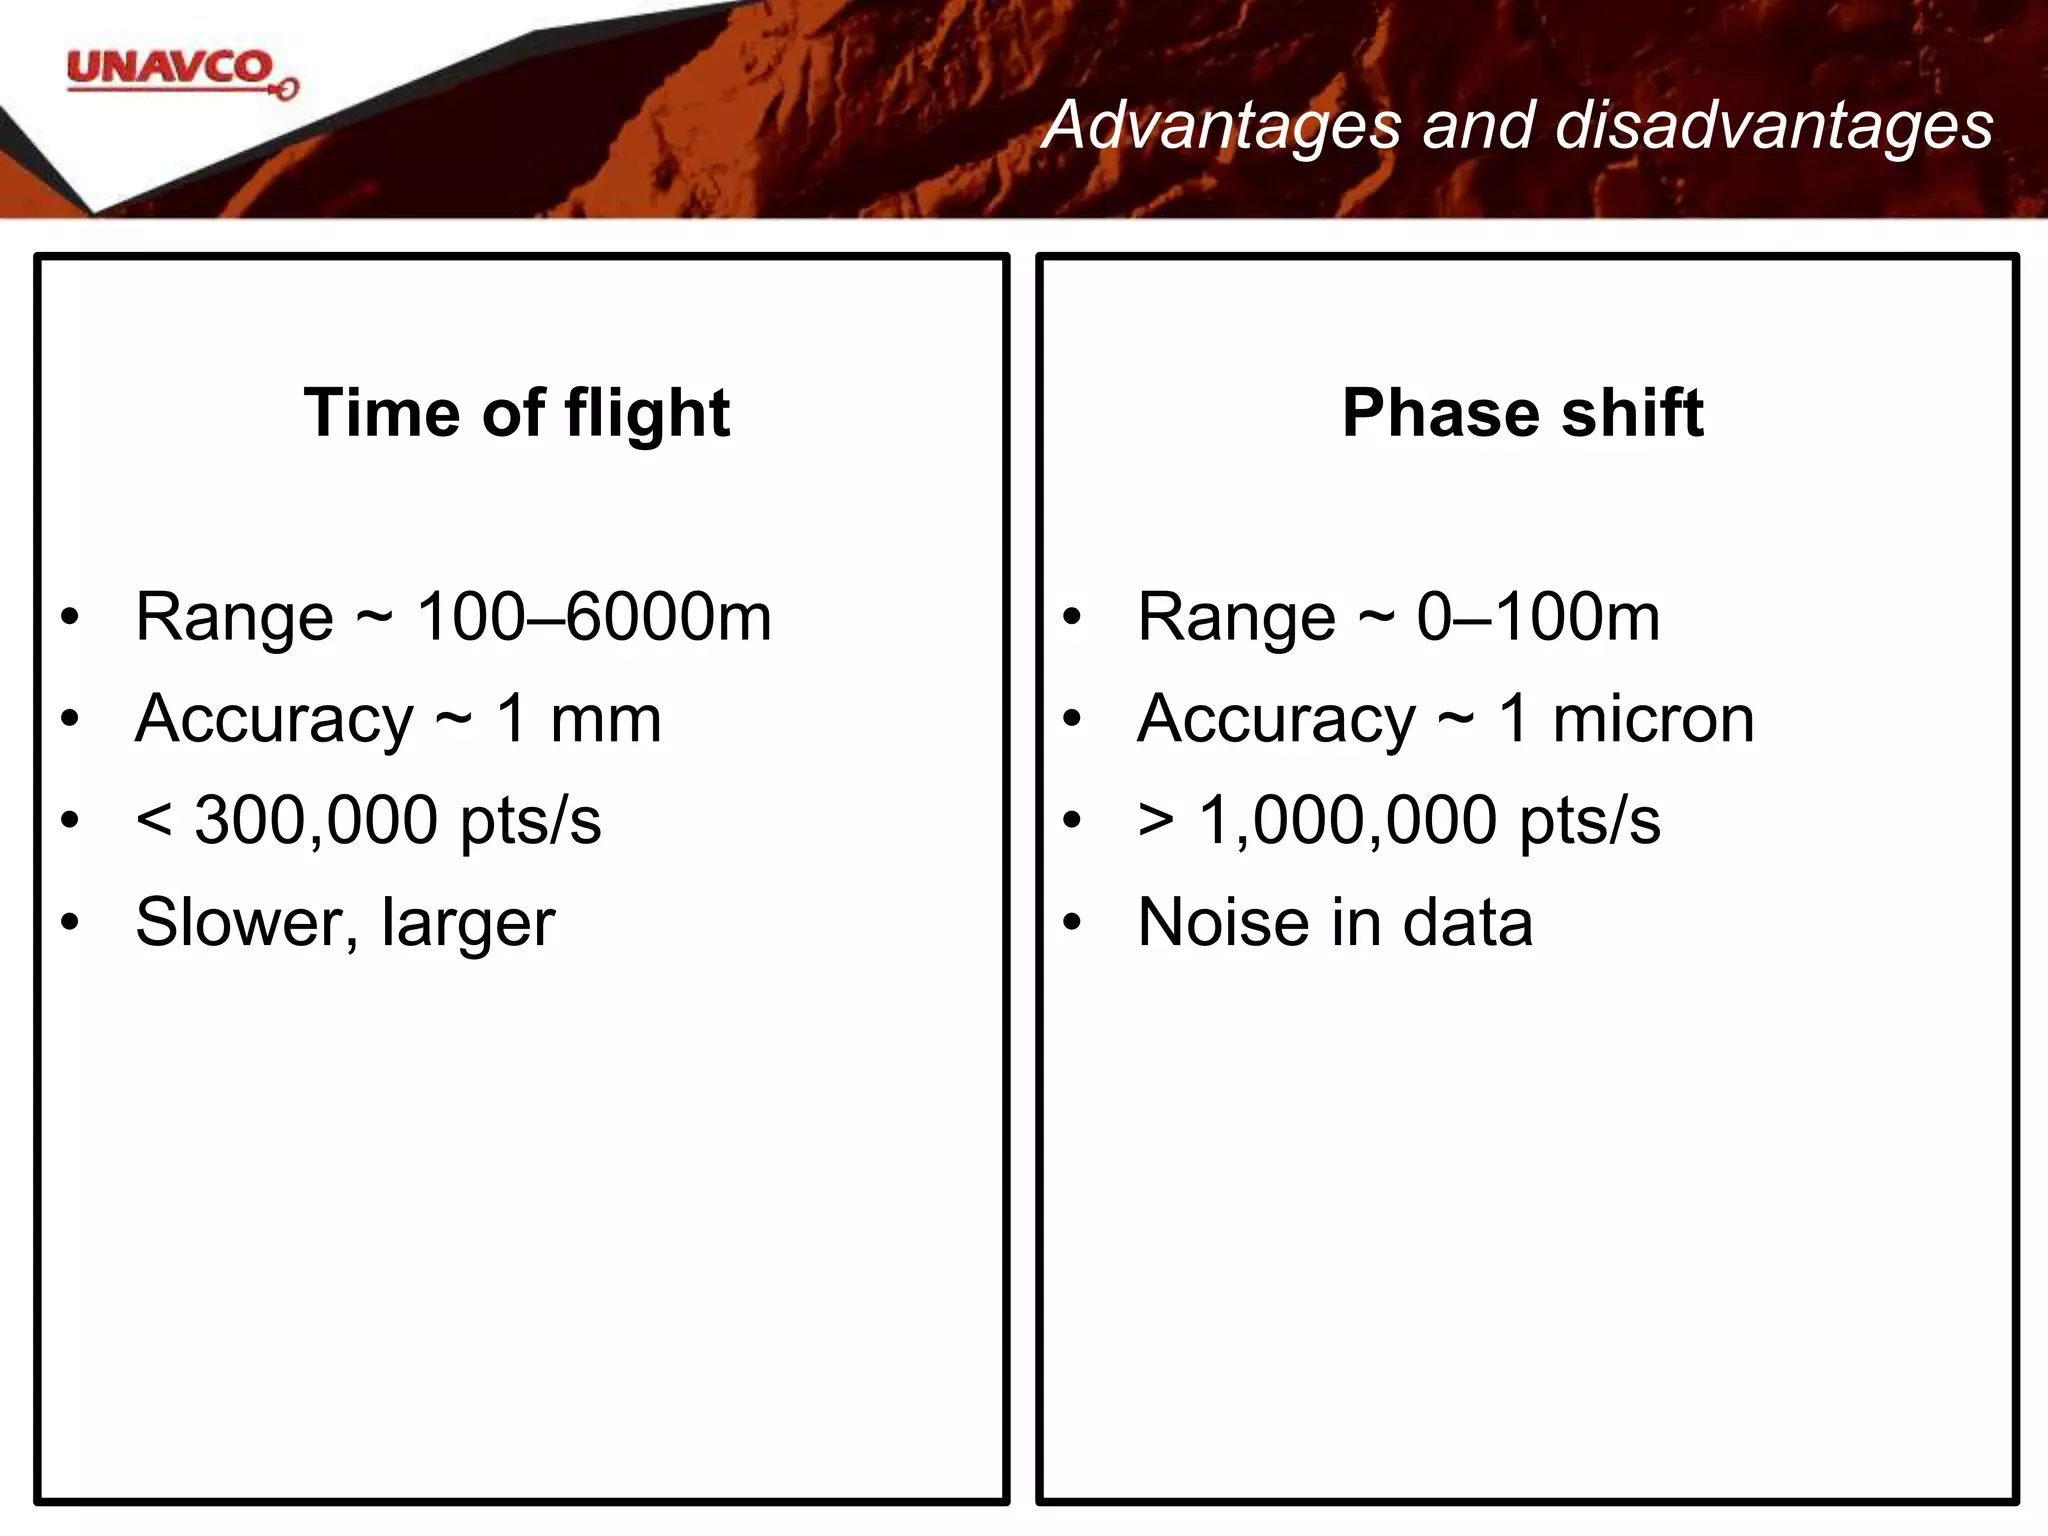
Advantages and disadvantages
Timeof flight
• Range ~ 100–6000m
• Accuracy ~ 1 mm
• < 300,000 pts/s
• Slower, larger
Phase shift
• Range ~ 0–100m
• Accuracy ~ 1 micron
• > 1,000,000 pts/s
• Noise in data
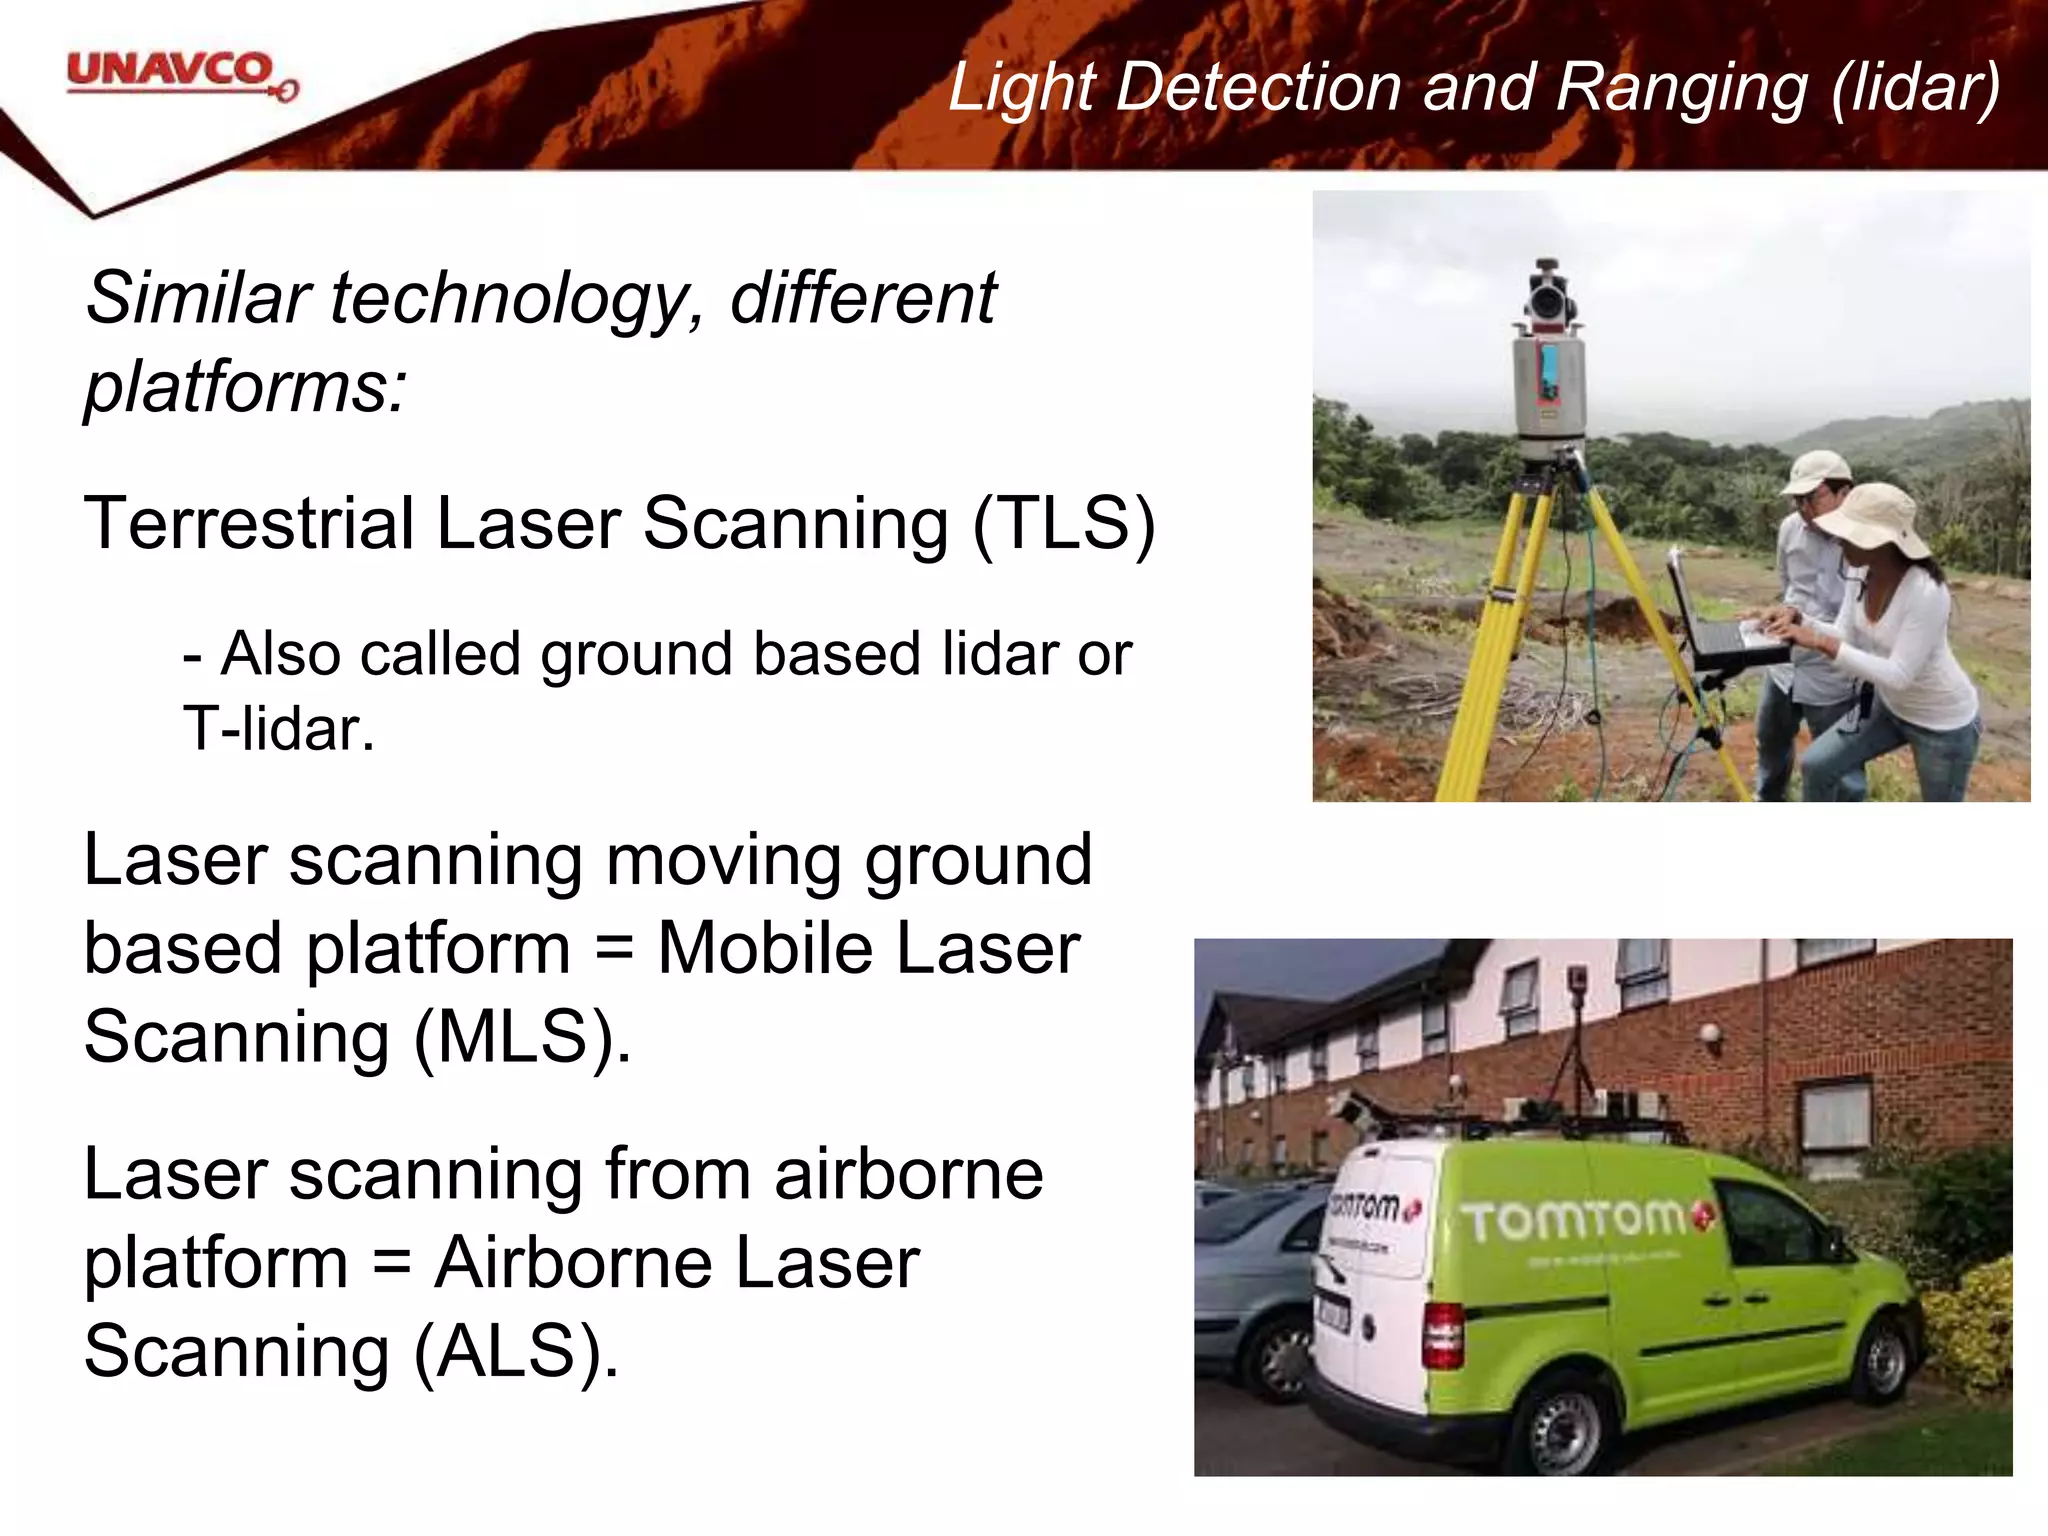
Similar technology, different
platforms:
TerrestrialLaser Scanning (TLS)
- Also called ground based lidar or
T-lidar.
Laser scanning moving ground
based platform = Mobile Laser
Scanning (MLS).
Laser scanning from airborne
platform = Airborne Laser
Scanning (ALS).
Light Detection and Ranging (lidar)
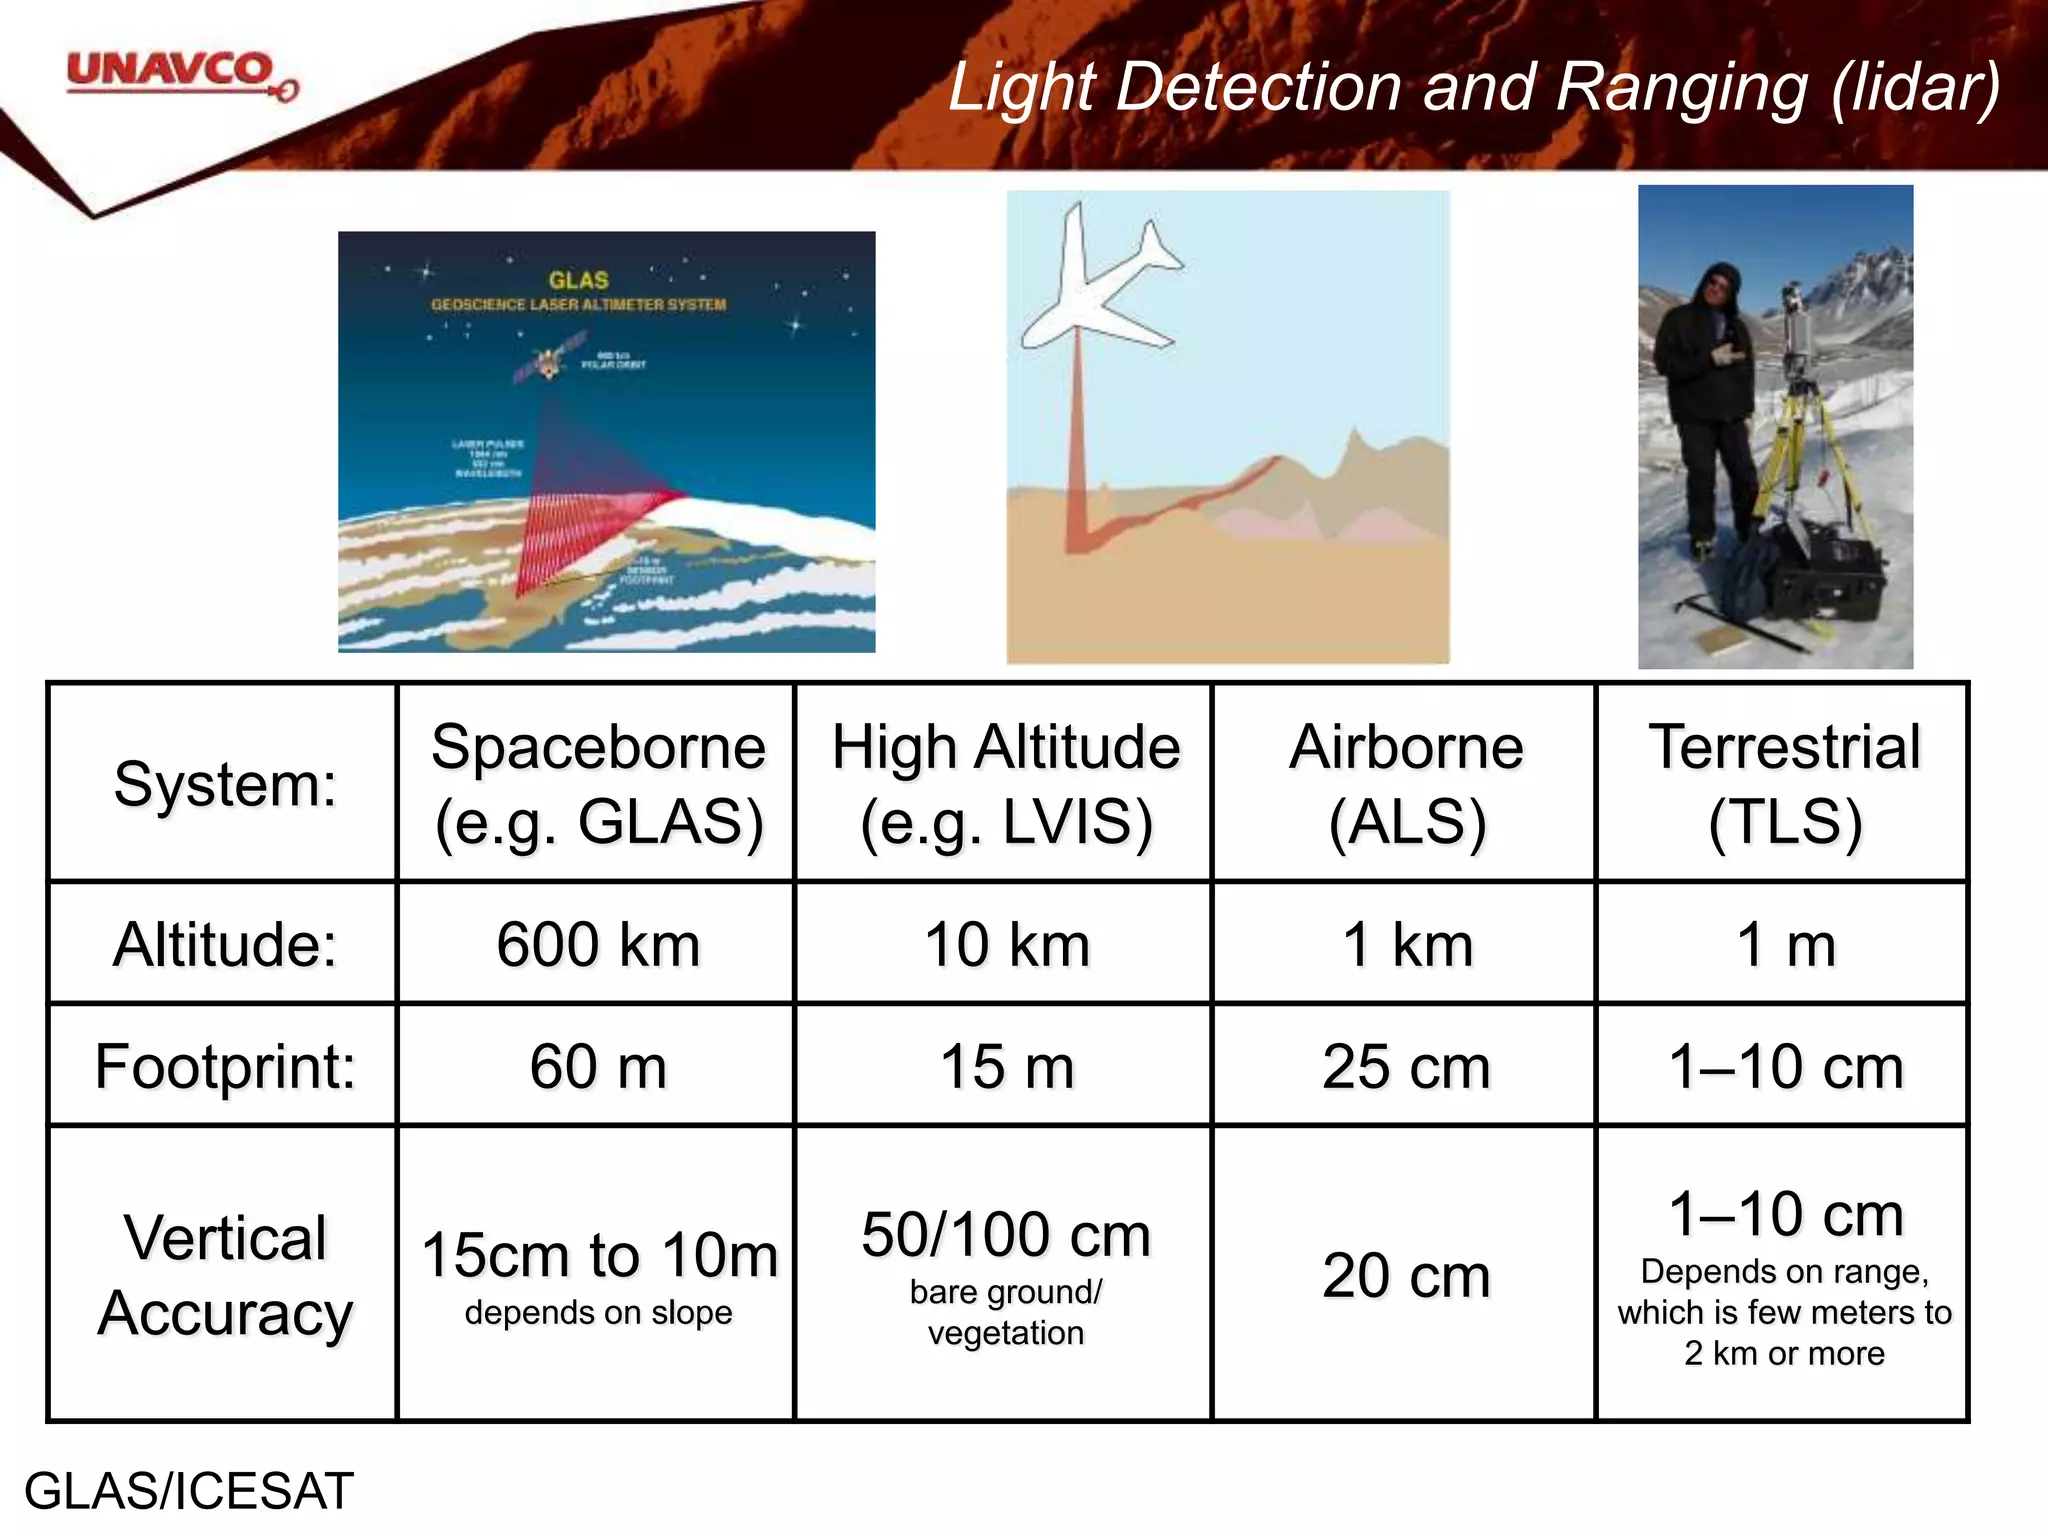
12.
System:
Spaceborne
(e.g. GLAS)
High Altitude
(e.g.LVIS)
Airborne
(ALS)
Terrestrial
(TLS)
Altitude: 600 km 10 km 1 km 1 m
Footprint: 60 m 15 m 25 cm 1–10 cm
Vertical
Accuracy
15cm to 10m
depends on slope
50/100 cm
bare ground/
vegetation
20 cm
1–10 cm
Depends on range,
which is few meters to
2 km or more
Light Detection and Ranging (lidar)
GLAS/ICESAT
13.
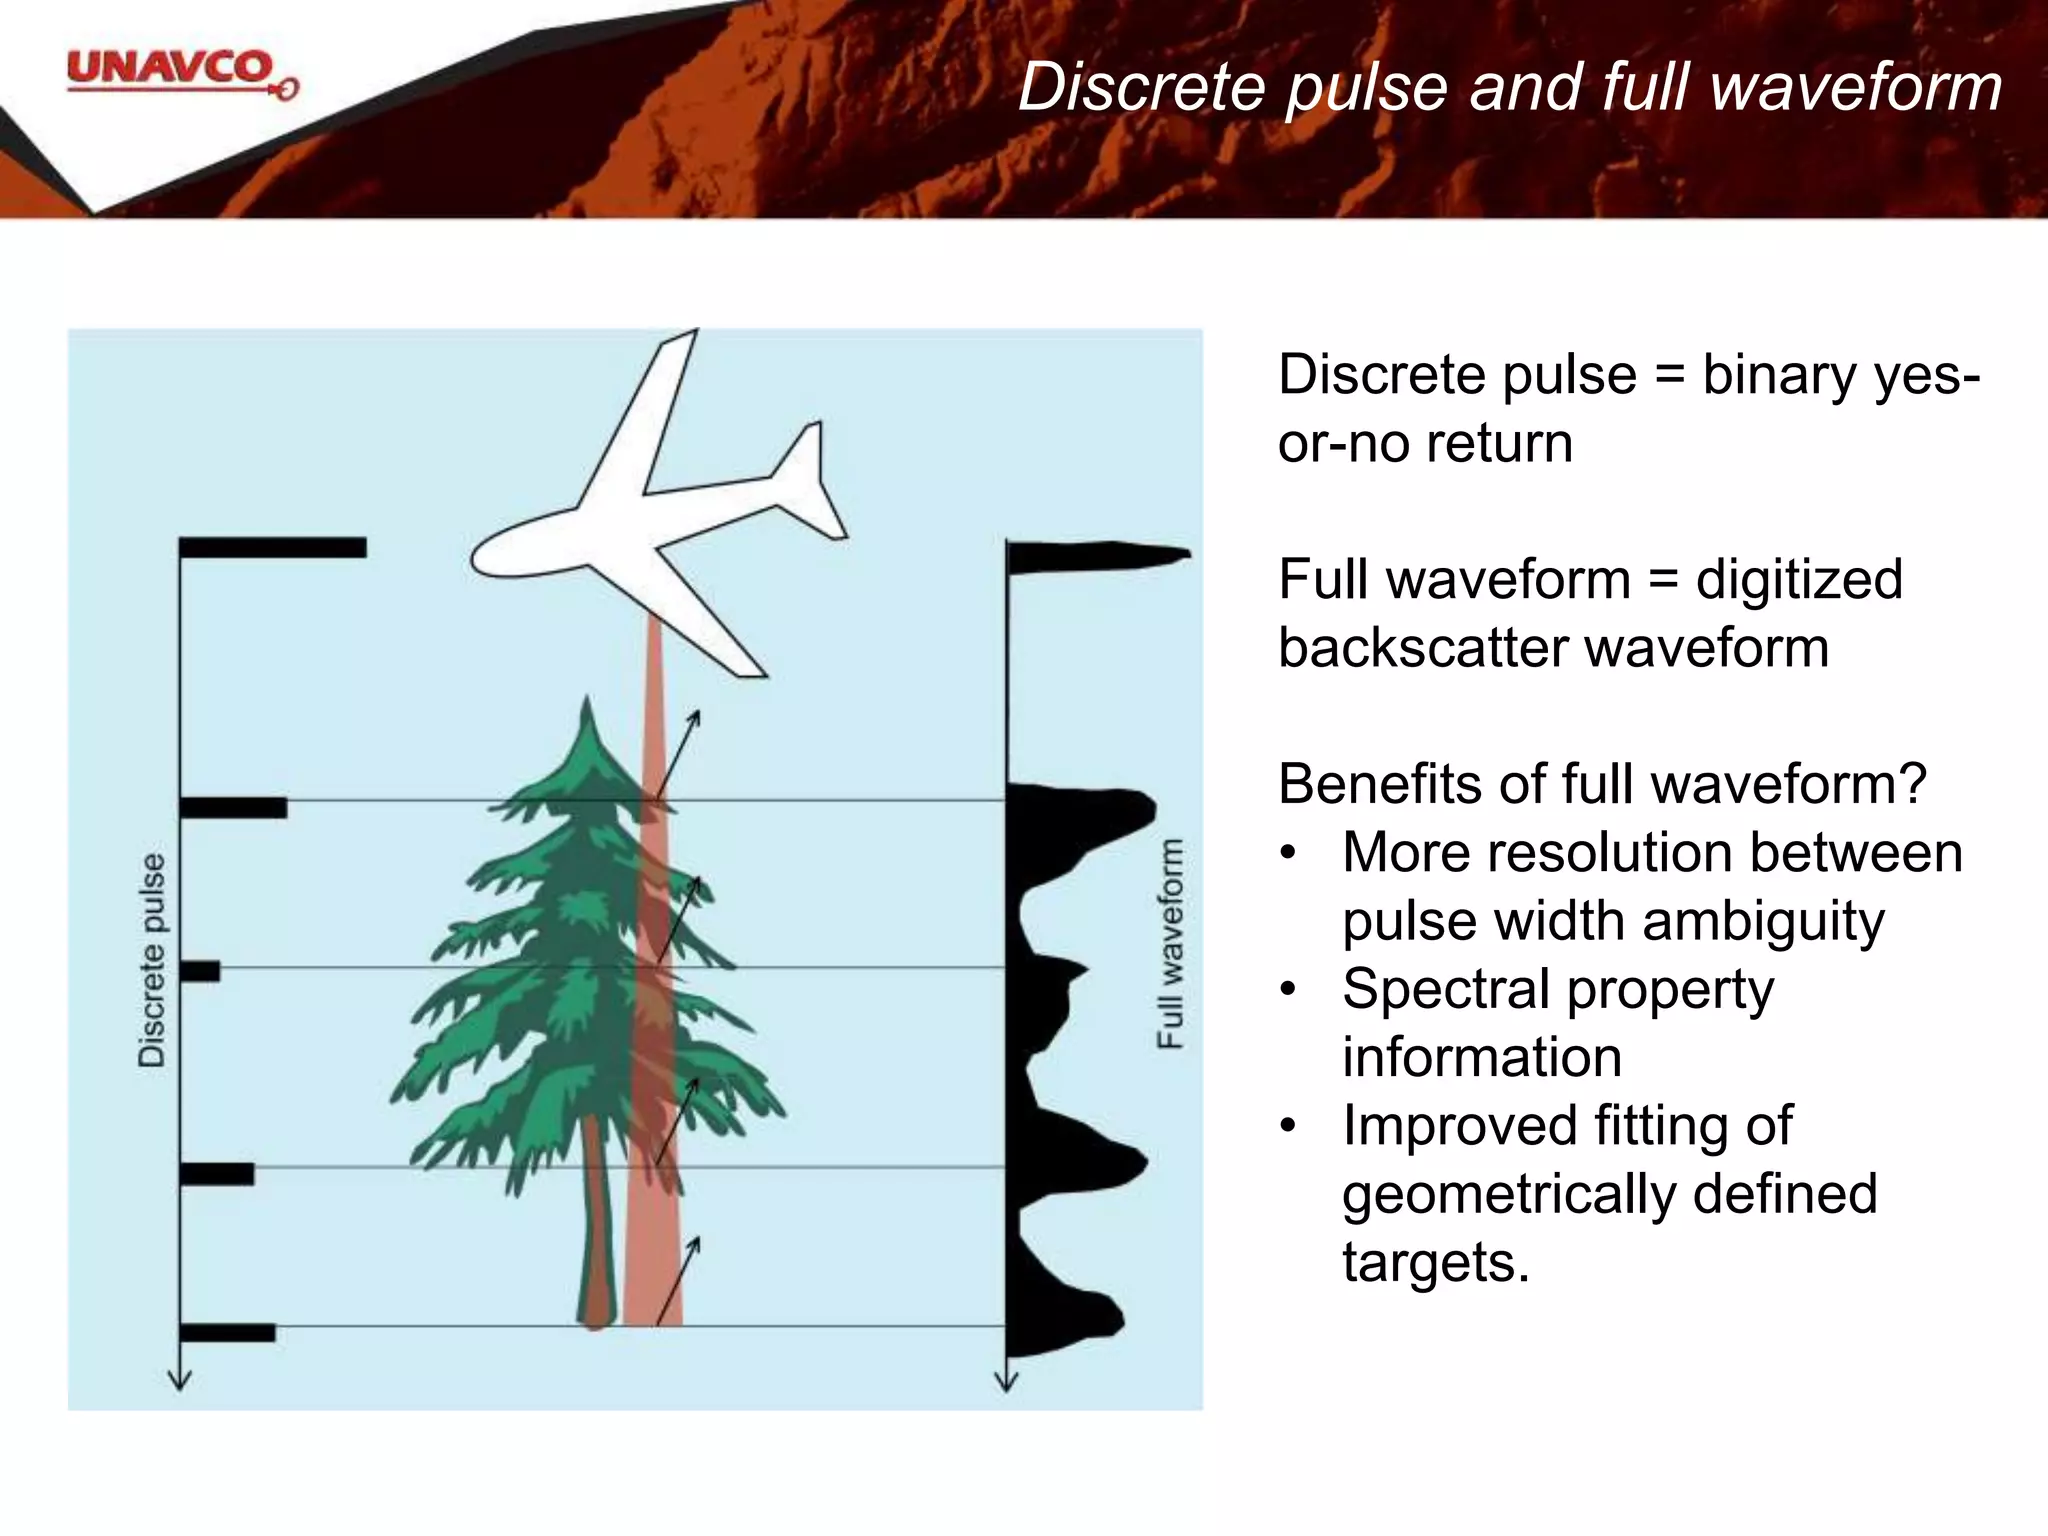
Discrete pulse =binary yes-
or-no return
Full waveform = digitized
backscatter waveform
Benefits of full waveform?
• More resolution between
pulse width ambiguity
• Spectral property
information
• Improved fitting of
geometrically defined
targets.
Discrete pulse and full waveform
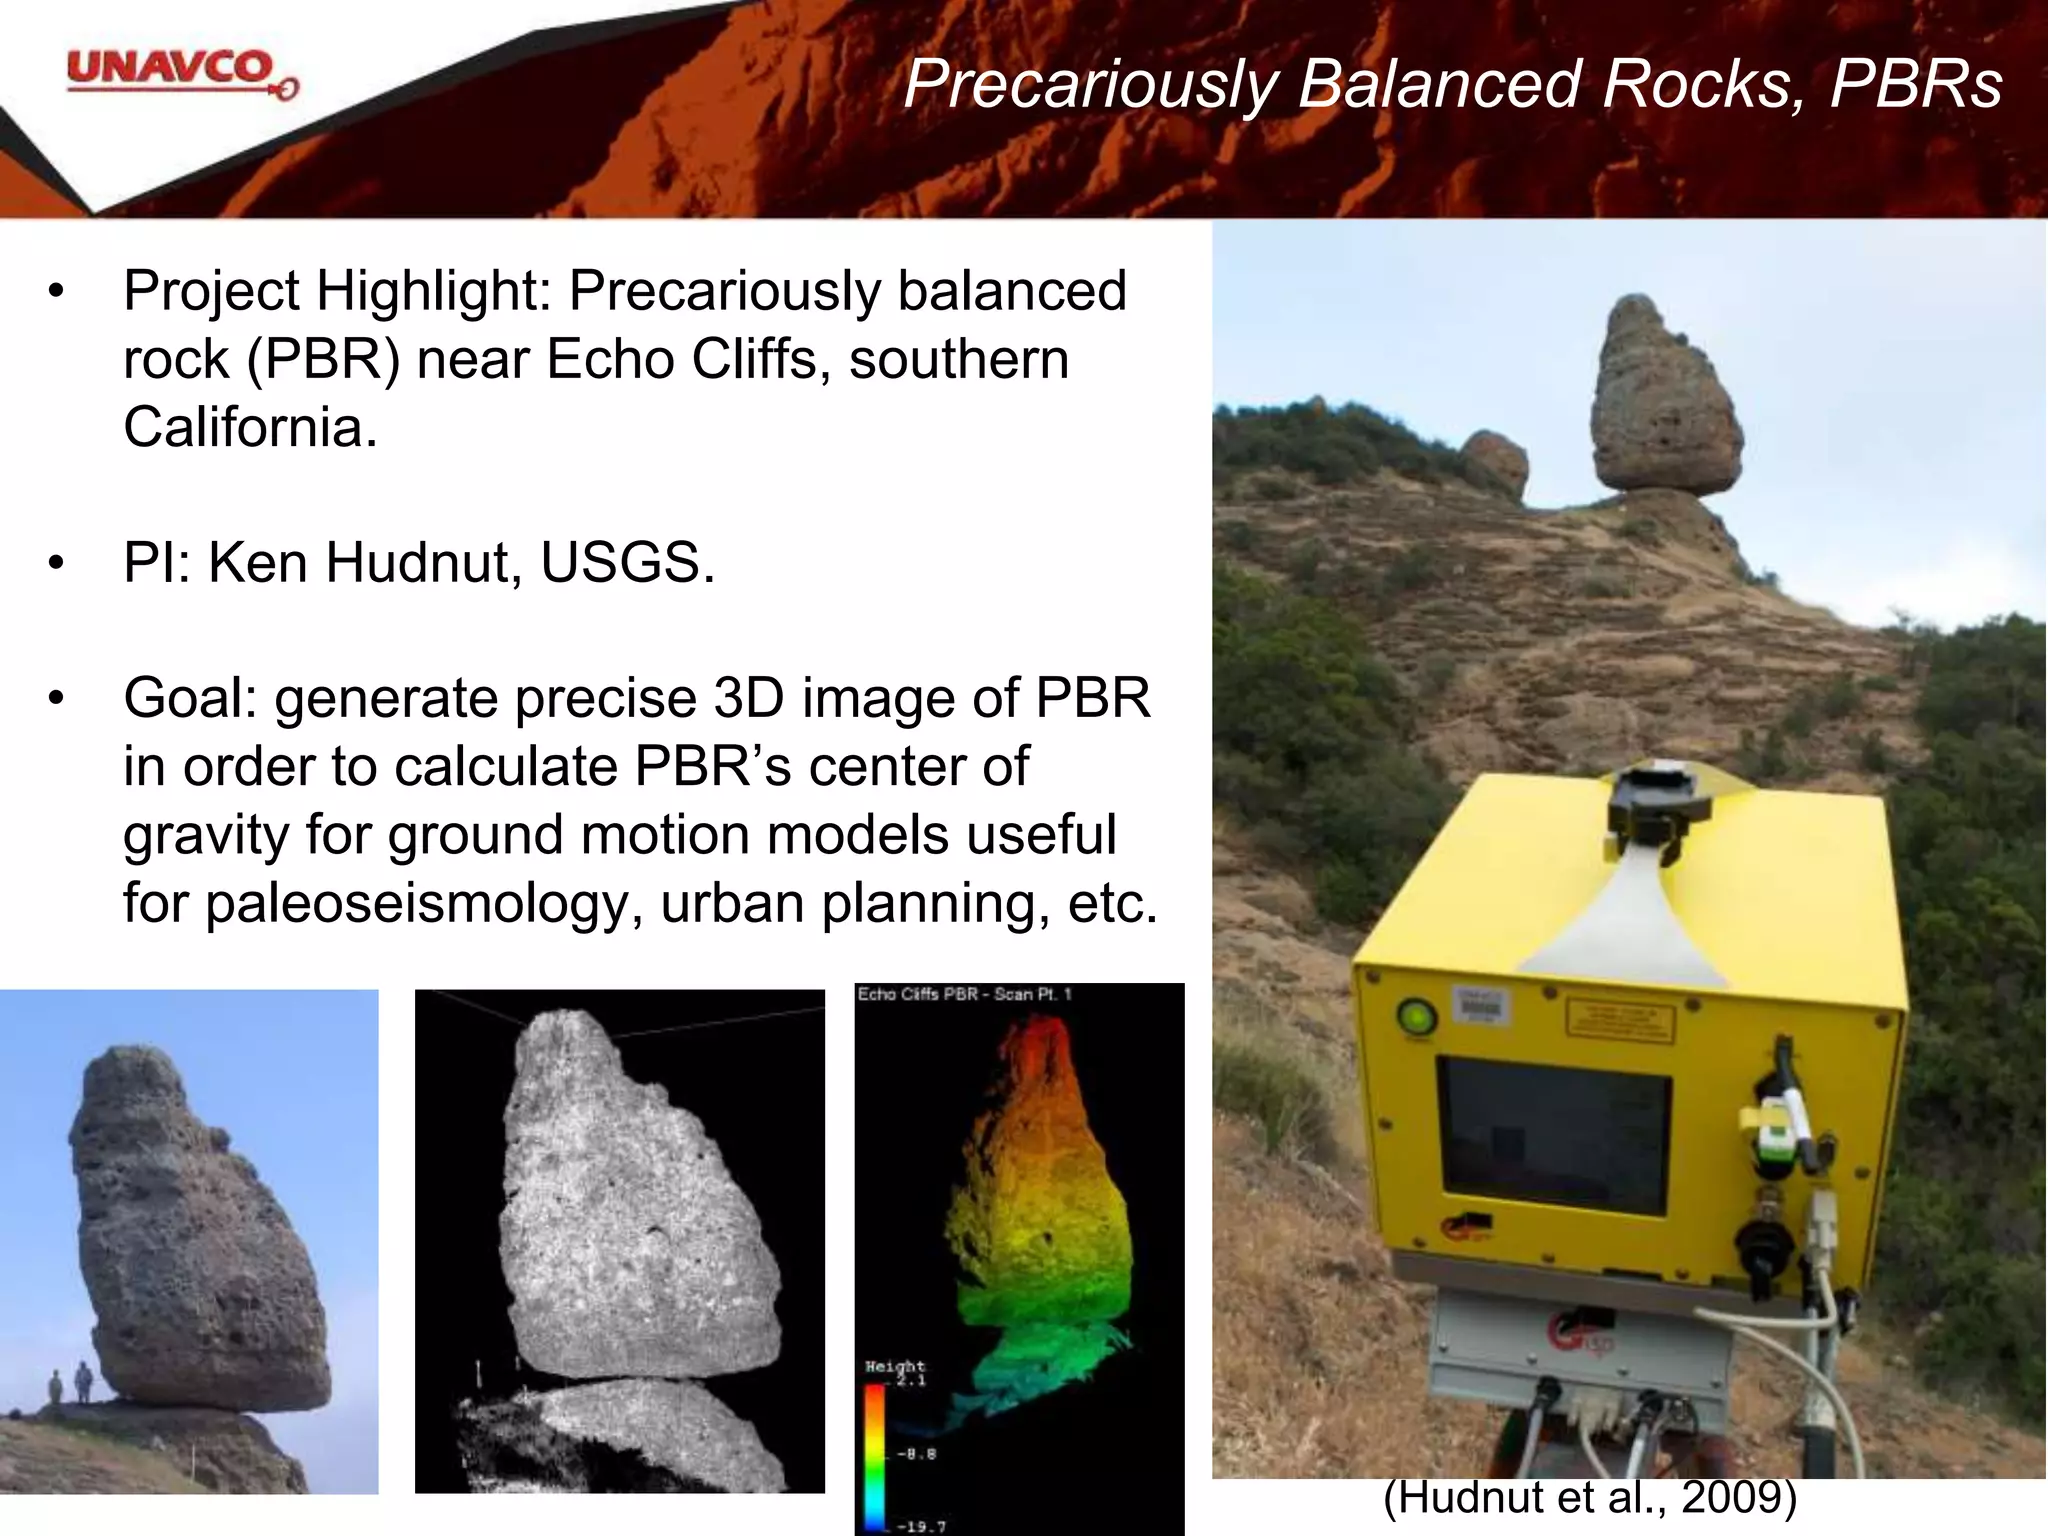
• Project Highlight:Precariously balanced
rock (PBR) near Echo Cliffs, southern
California.
• PI: Ken Hudnut, USGS.
• Goal: generate precise 3D image of PBR
in order to calculate PBR’s center of
gravity for ground motion models useful
for paleoseismology, urban planning, etc.
(Hudnut et al., 2009)
Precariously Balanced Rocks, PBRs
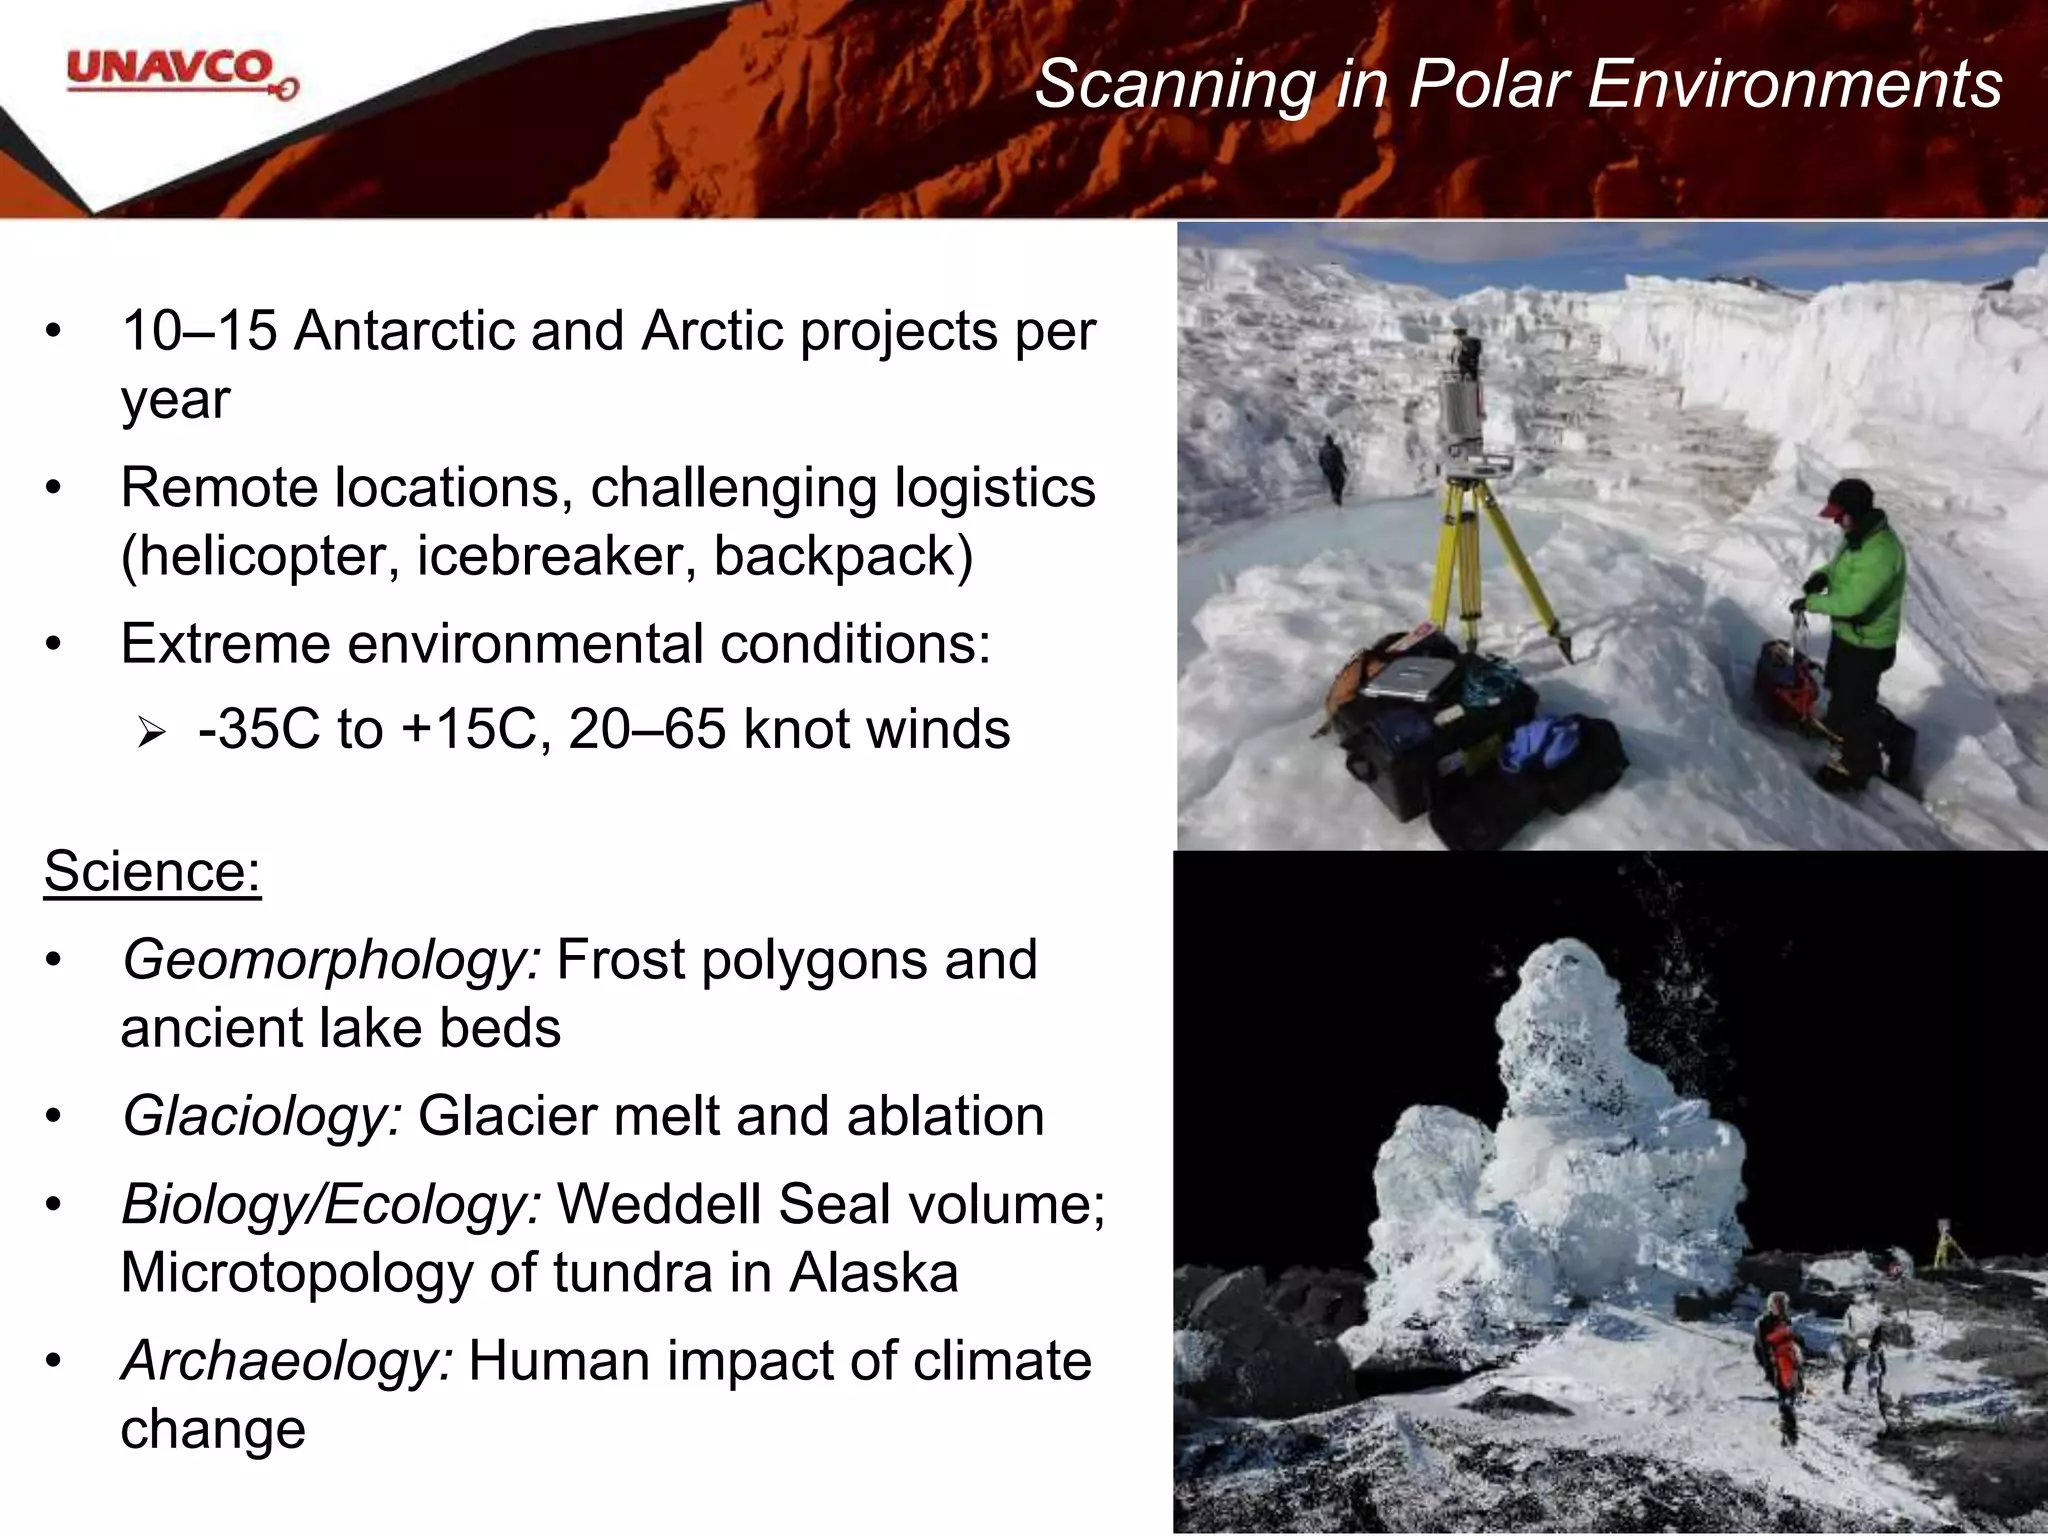
• 10–15 Antarcticand Arctic projects per
year
• Remote locations, challenging logistics
(helicopter, icebreaker, backpack)
• Extreme environmental conditions:
-35C to +15C, 20–65 knot winds
Science:
• Geomorphology: Frost polygons and
ancient lake beds
• Glaciology: Glacier melt and ablation
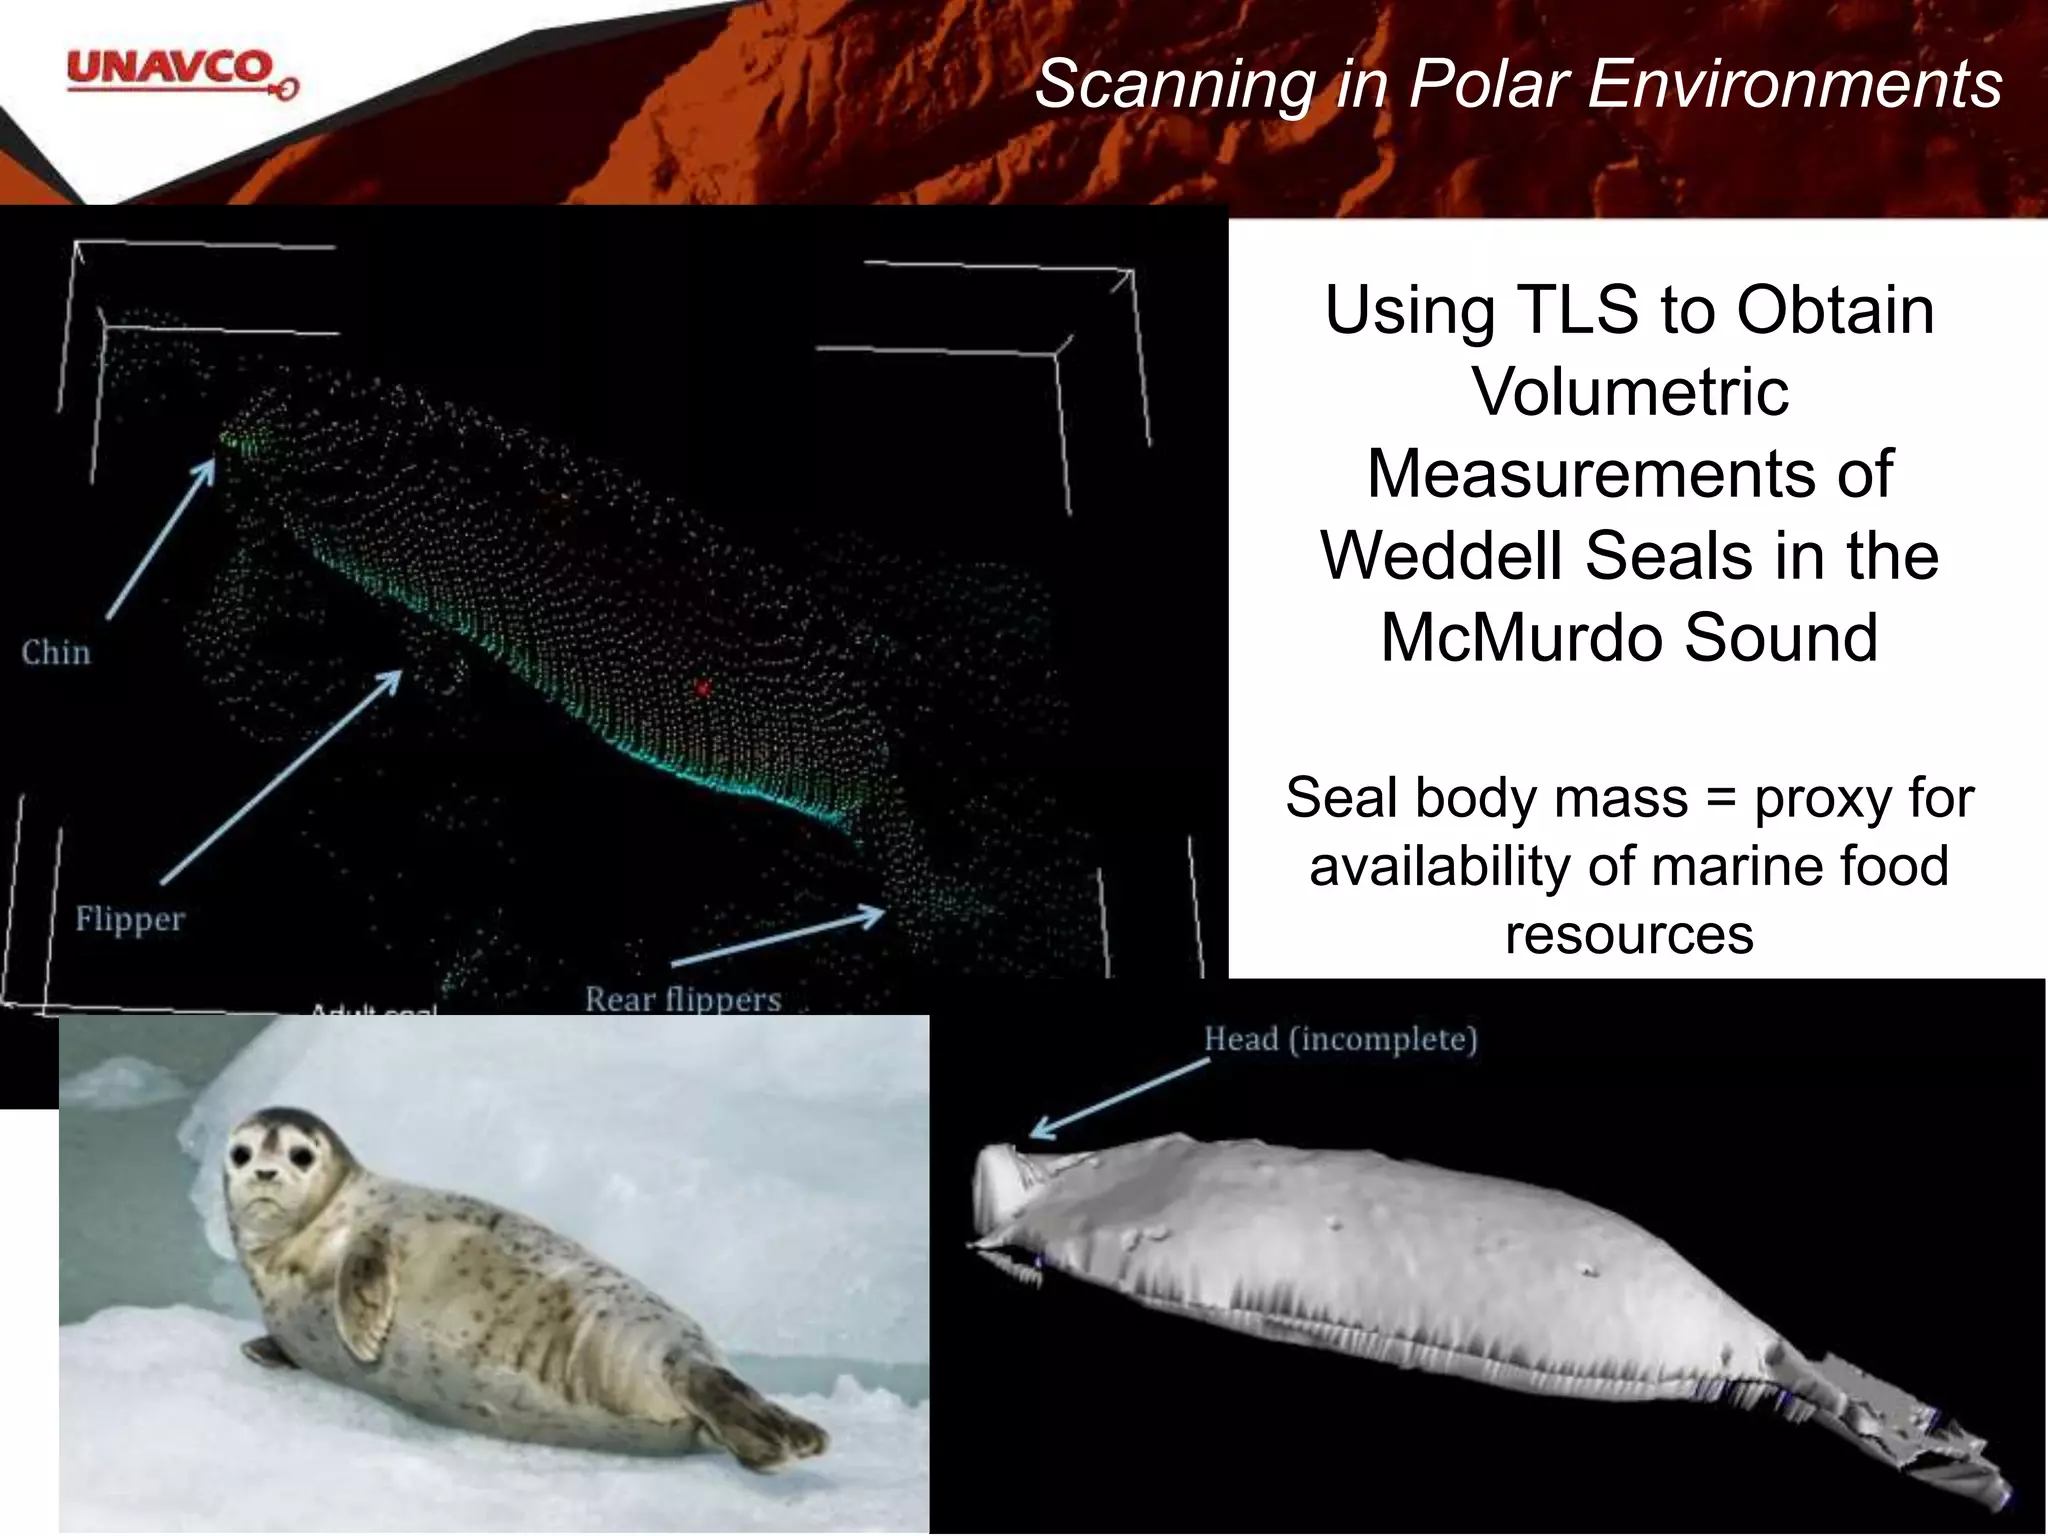
• Biology/Ecology: Weddell Seal volume;
Microtopology of tundra in Alaska
• Archaeology: Human impact of climate
change
Scanning in Polar Environments
33.
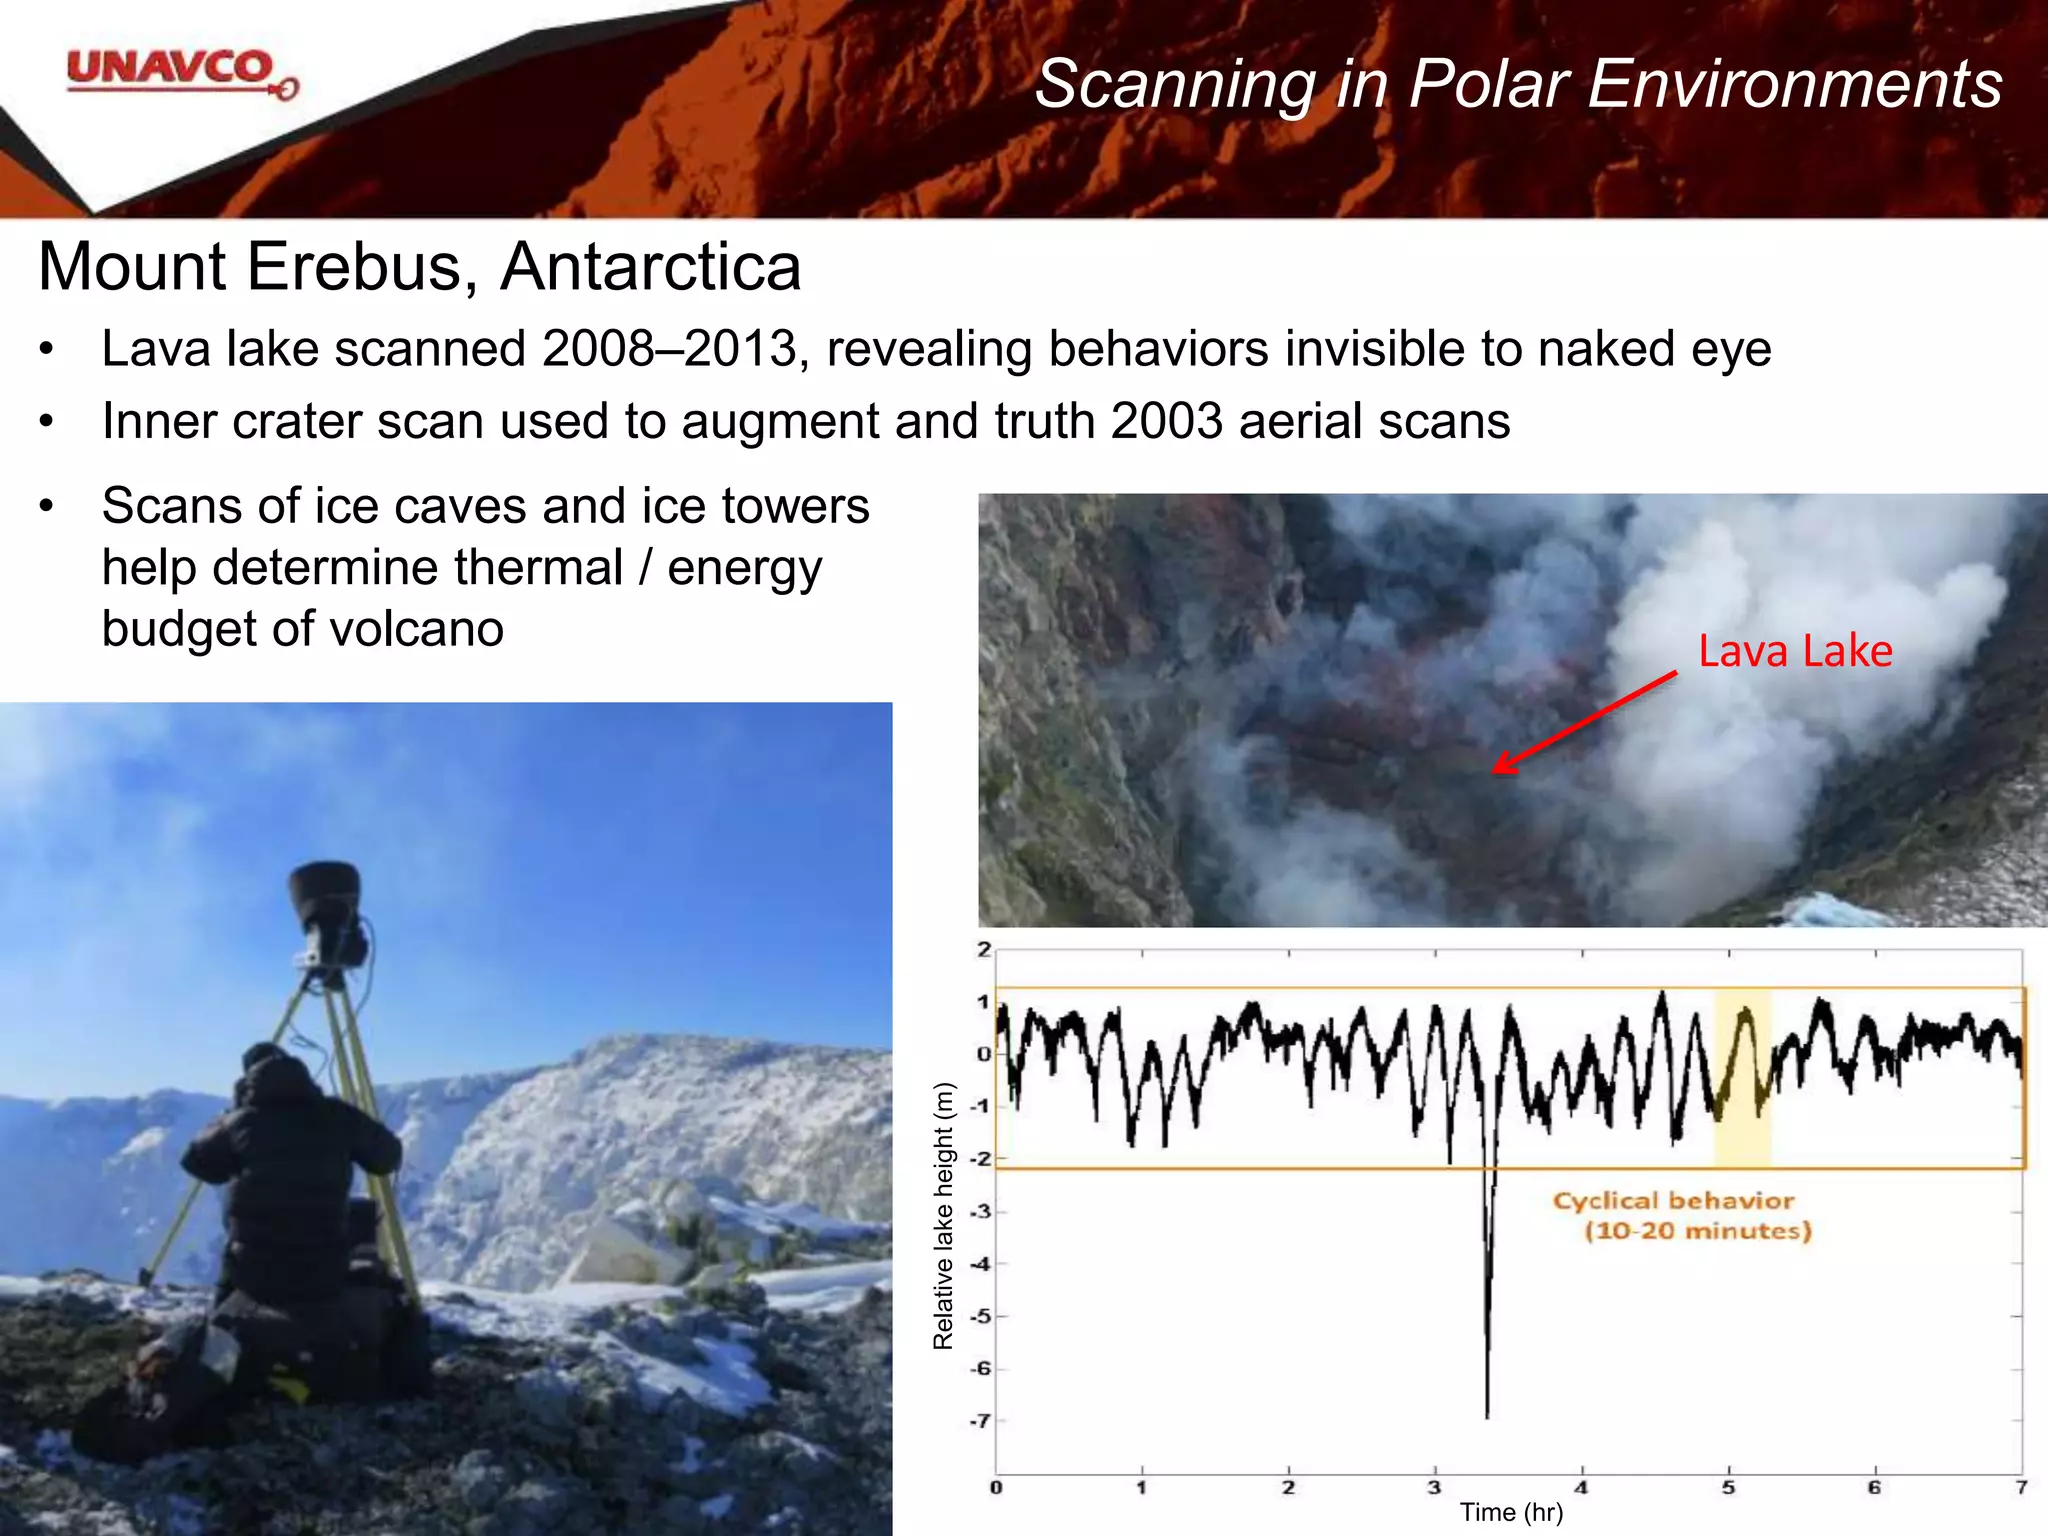
Mount Erebus, Antarctica
•Lava lake scanned 2008–2013, revealing behaviors invisible to naked eye
• Inner crater scan used to augment and truth 2003 aerial scans
Lava Lake
Time (hr)
Relativelakeheight(m)
• Scans of ice caves and ice towers
help determine thermal / energy
budget of volcano
Scanning in Polar Environments
34.
Using TLS toObtain
Volumetric
Measurements of
Weddell Seals in the
McMurdo Sound
Seal body mass = proxy for
availability of marine food
resources
Scanning in Polar Environments
#3 UNAVCO has provided the material for this field module. So what’s UNAVCO? This video is a three- minute introduction to what UNAVCO is!
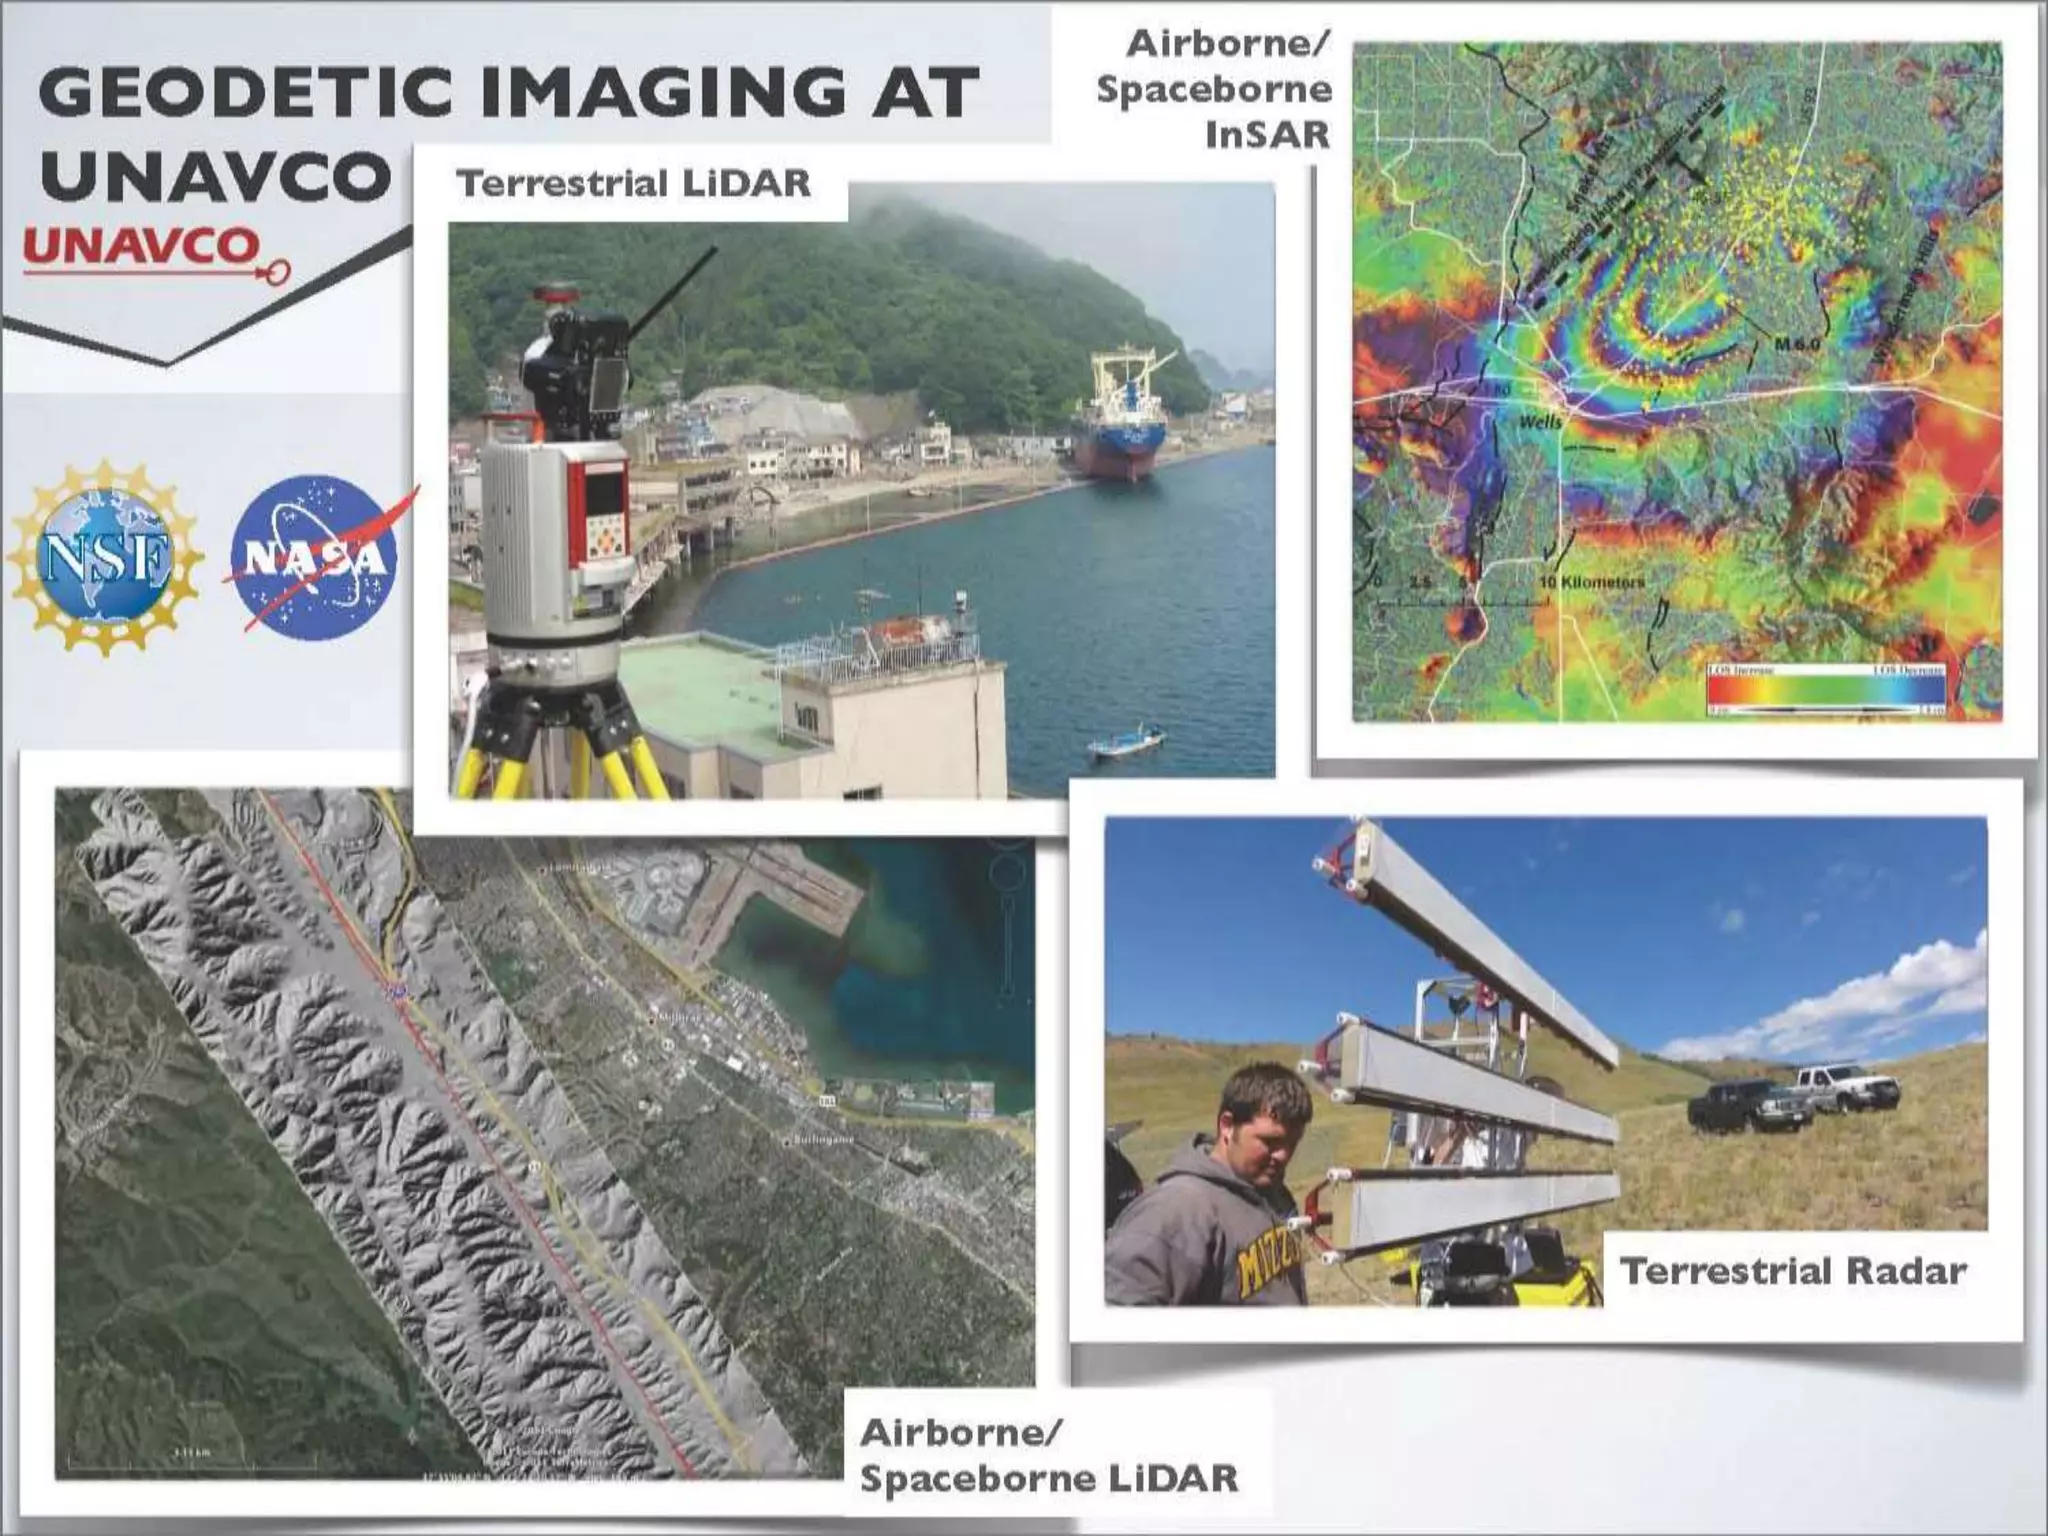
#4 You’ve seen from the video that geodesy encompasses many types of data and data collection. Here are examples from four of the geodetic imaging areas UNAVCO works in: airborne/spaceborne InSAR, terrestrial radar, airborne/spaceborne lidar, and the focus of today’s presentation and this field module, terrestrial lidar.
Images from UNAVCO
#5 TLS is supported by UNAVCO in a variety of ways; PIs can use instrumentation, have field engineers come with them to conduct a survey, etc. UNAVCO also leads workshops and short courses and participates in many collaborations with other agencies. UNAVCO also has an Education and Community Engagement department for activities pertaining to geodesy education.
#6 UNAVCO has seven TLS instruments. Six of them are Riegl scanners similar to the ones that you will use in this course. The seventh is a Leica scanner with a slightly smaller maximum range (distance to feature of interest). UNAVCO also has all the supporting equipment needed for a TLS survey such as GPS, tripods, etc., and also has access to a server with licenses for the software one uses to explore and process the data.
#8 Light detection and ranging or lidar works by measuring the distance between a scanner and any object in its field of view by emitting a laser pulse and measuring the time it takes to return and be recorded by a receiver.
#9 There are two ways that this range between the object and the scanner is measured. The first is time of flight, which is what the Riegl scanner you’ll use utilizes. the calculated time is based on the time it takes a signal to be returned. Phase shift measures the phase shift of a pulse and uses that to calculate the distance.
#10 Advantages exist for both systems. Time of flight has a larger maximum range, which means it can be used in sites where the area of interest may or may not be directly accessible. Phase shift is more accurate and can collect more points per second. Time of flight is a slower and larger system, whereas phase shift data can be noisy and only collected when one is close to the feature of interest.
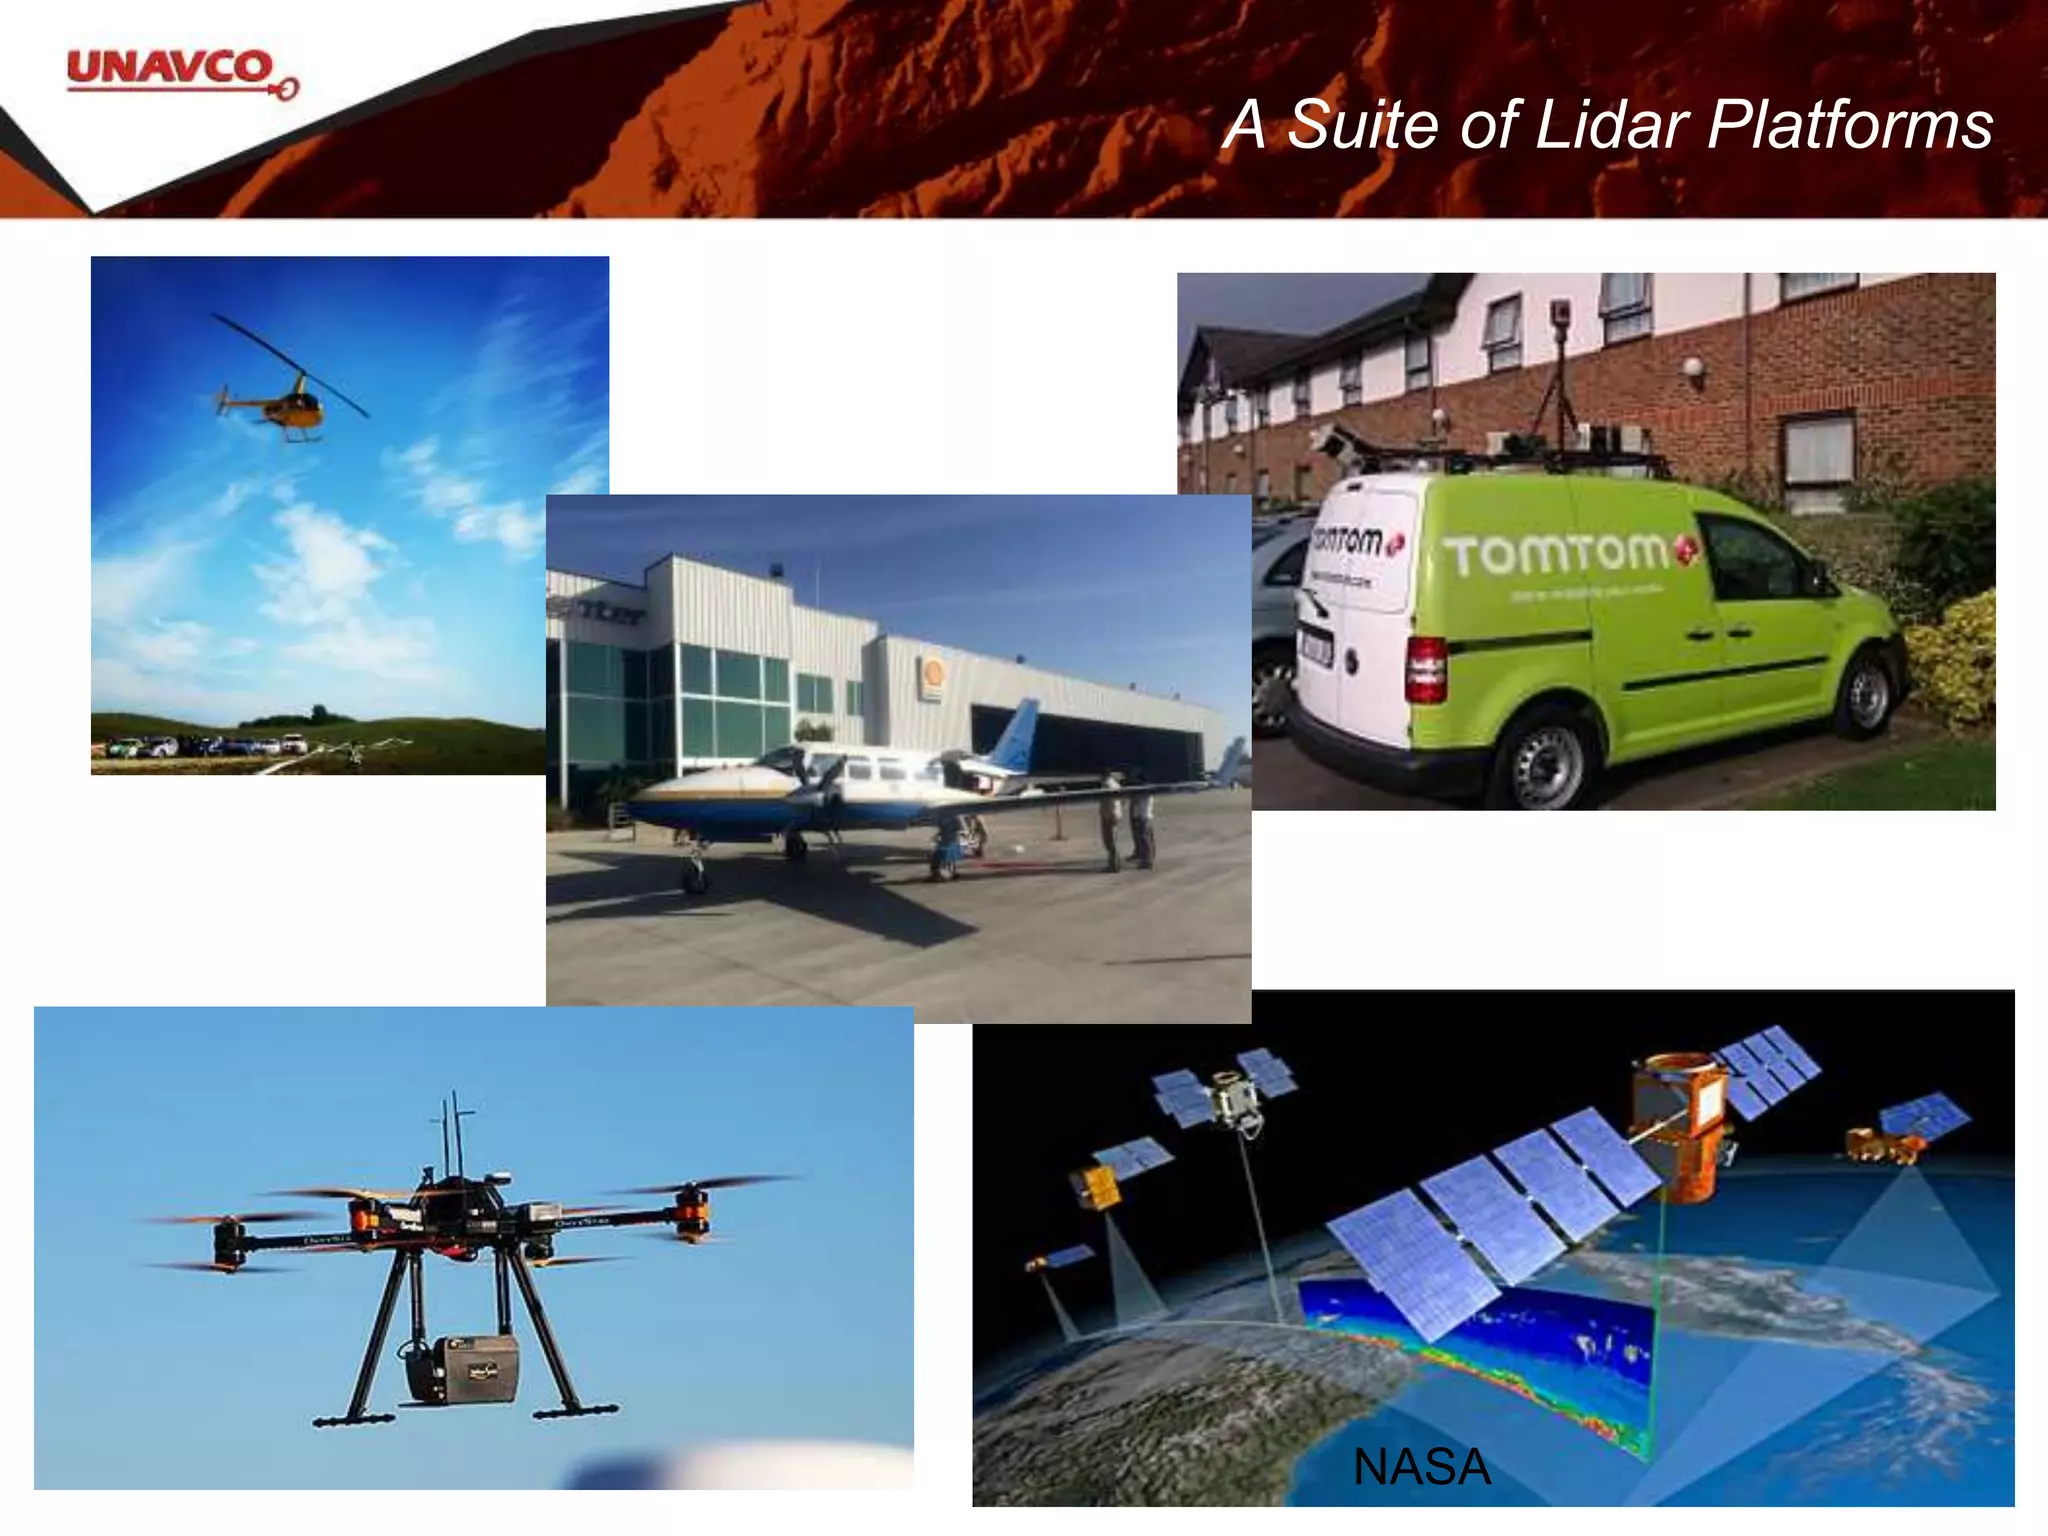
#11 Lidar data can be collected using many platforms: tripod (what you learn in this module), drone, helicopter, airborne, satellite, and even off the top of a car.
Images (clockwise from upper left):
https://pixabay.com/static/uploads/photo/2015/11/11/23/31/sky-1039395__180.jpg (CC)
http://www.opentopography.org/blog/opentopography-rides-along-airborne-lidar-survey-ncalmhttp://www.opentopography.org/sites/opentopography.org/files/images/news_items/plane_thumb.jpg (public domain)
https://en.wikipedia.org/wiki/Lidar#/media/File:Mapping_van_tomtom_with_five_lidars.jpg (public domain)
http://www.hq.nasa.gov/office/hqlibrary/documents/o55480866.pdf (public domain)
By Cargyrak - Own work, CC BY-SA 4.0, https://commons.wikimedia.org/w/index.php?curid=48685015 (CC)
#12 Read slide. Don’t need to spend a lot of time on this one!
Images: UNAVCO and https://en.wikipedia.org/wiki/Lidar#/media/File:Mapping_van_tomtom_with_five_lidars.jpg
#13 Because of all these different platforms, we can collect data using lidar over a huge range of scales.
Images NASA public domain
#14 The vast majority of scanners are discrete pulse
Lidar can record data in one of two ways: discrete pulse or full waveform. Full waveform is preferred because it has better resolution and fits targets better, but discrete pulse can be used for a lower resolution scan. This also depends on the scanner being used.
Image: Kate Shervais
#15 In geoscience, we are very interested in the topography of the earth but not always so interested in the vegetation. (space bar) When you use lidar in general you are able to actually de-vegetate the view because of the multiple returns we just discussed. This is Highway 1 and Fort Ross in California. Red line is the rupture of the 1906 earthquake, as mapped in the 1906 official report on the earthquake. What geologists tend to think of as noise (vegetation) may be something someone else could be very interested in. So you could also analyze the height of the vegetation (space bar).
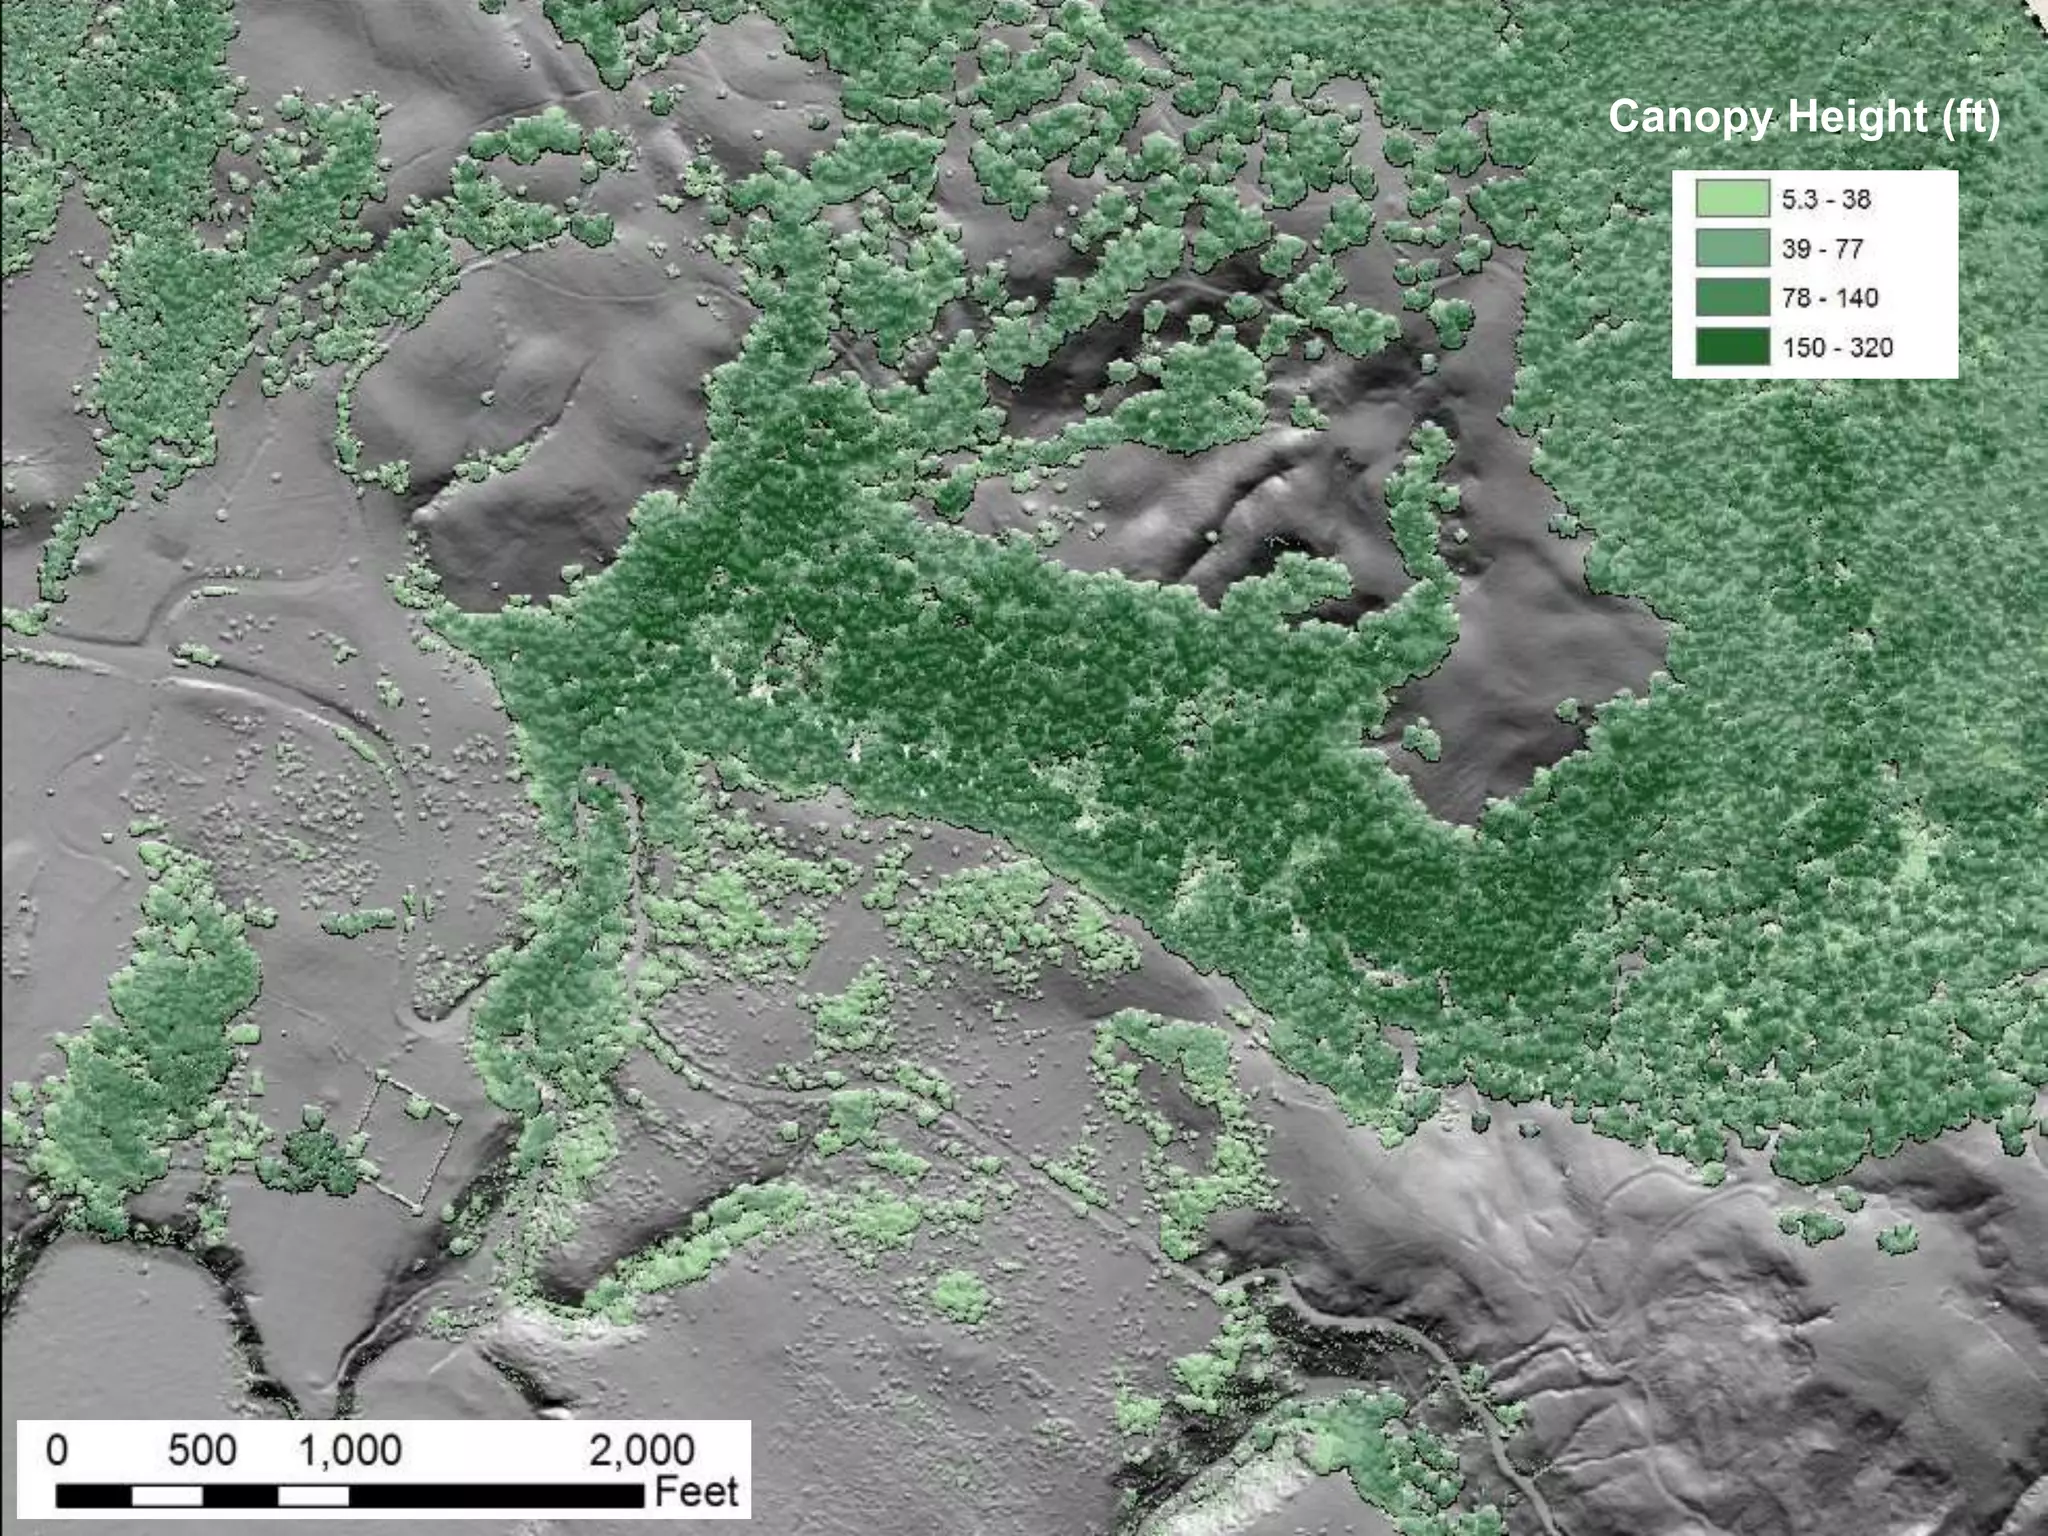
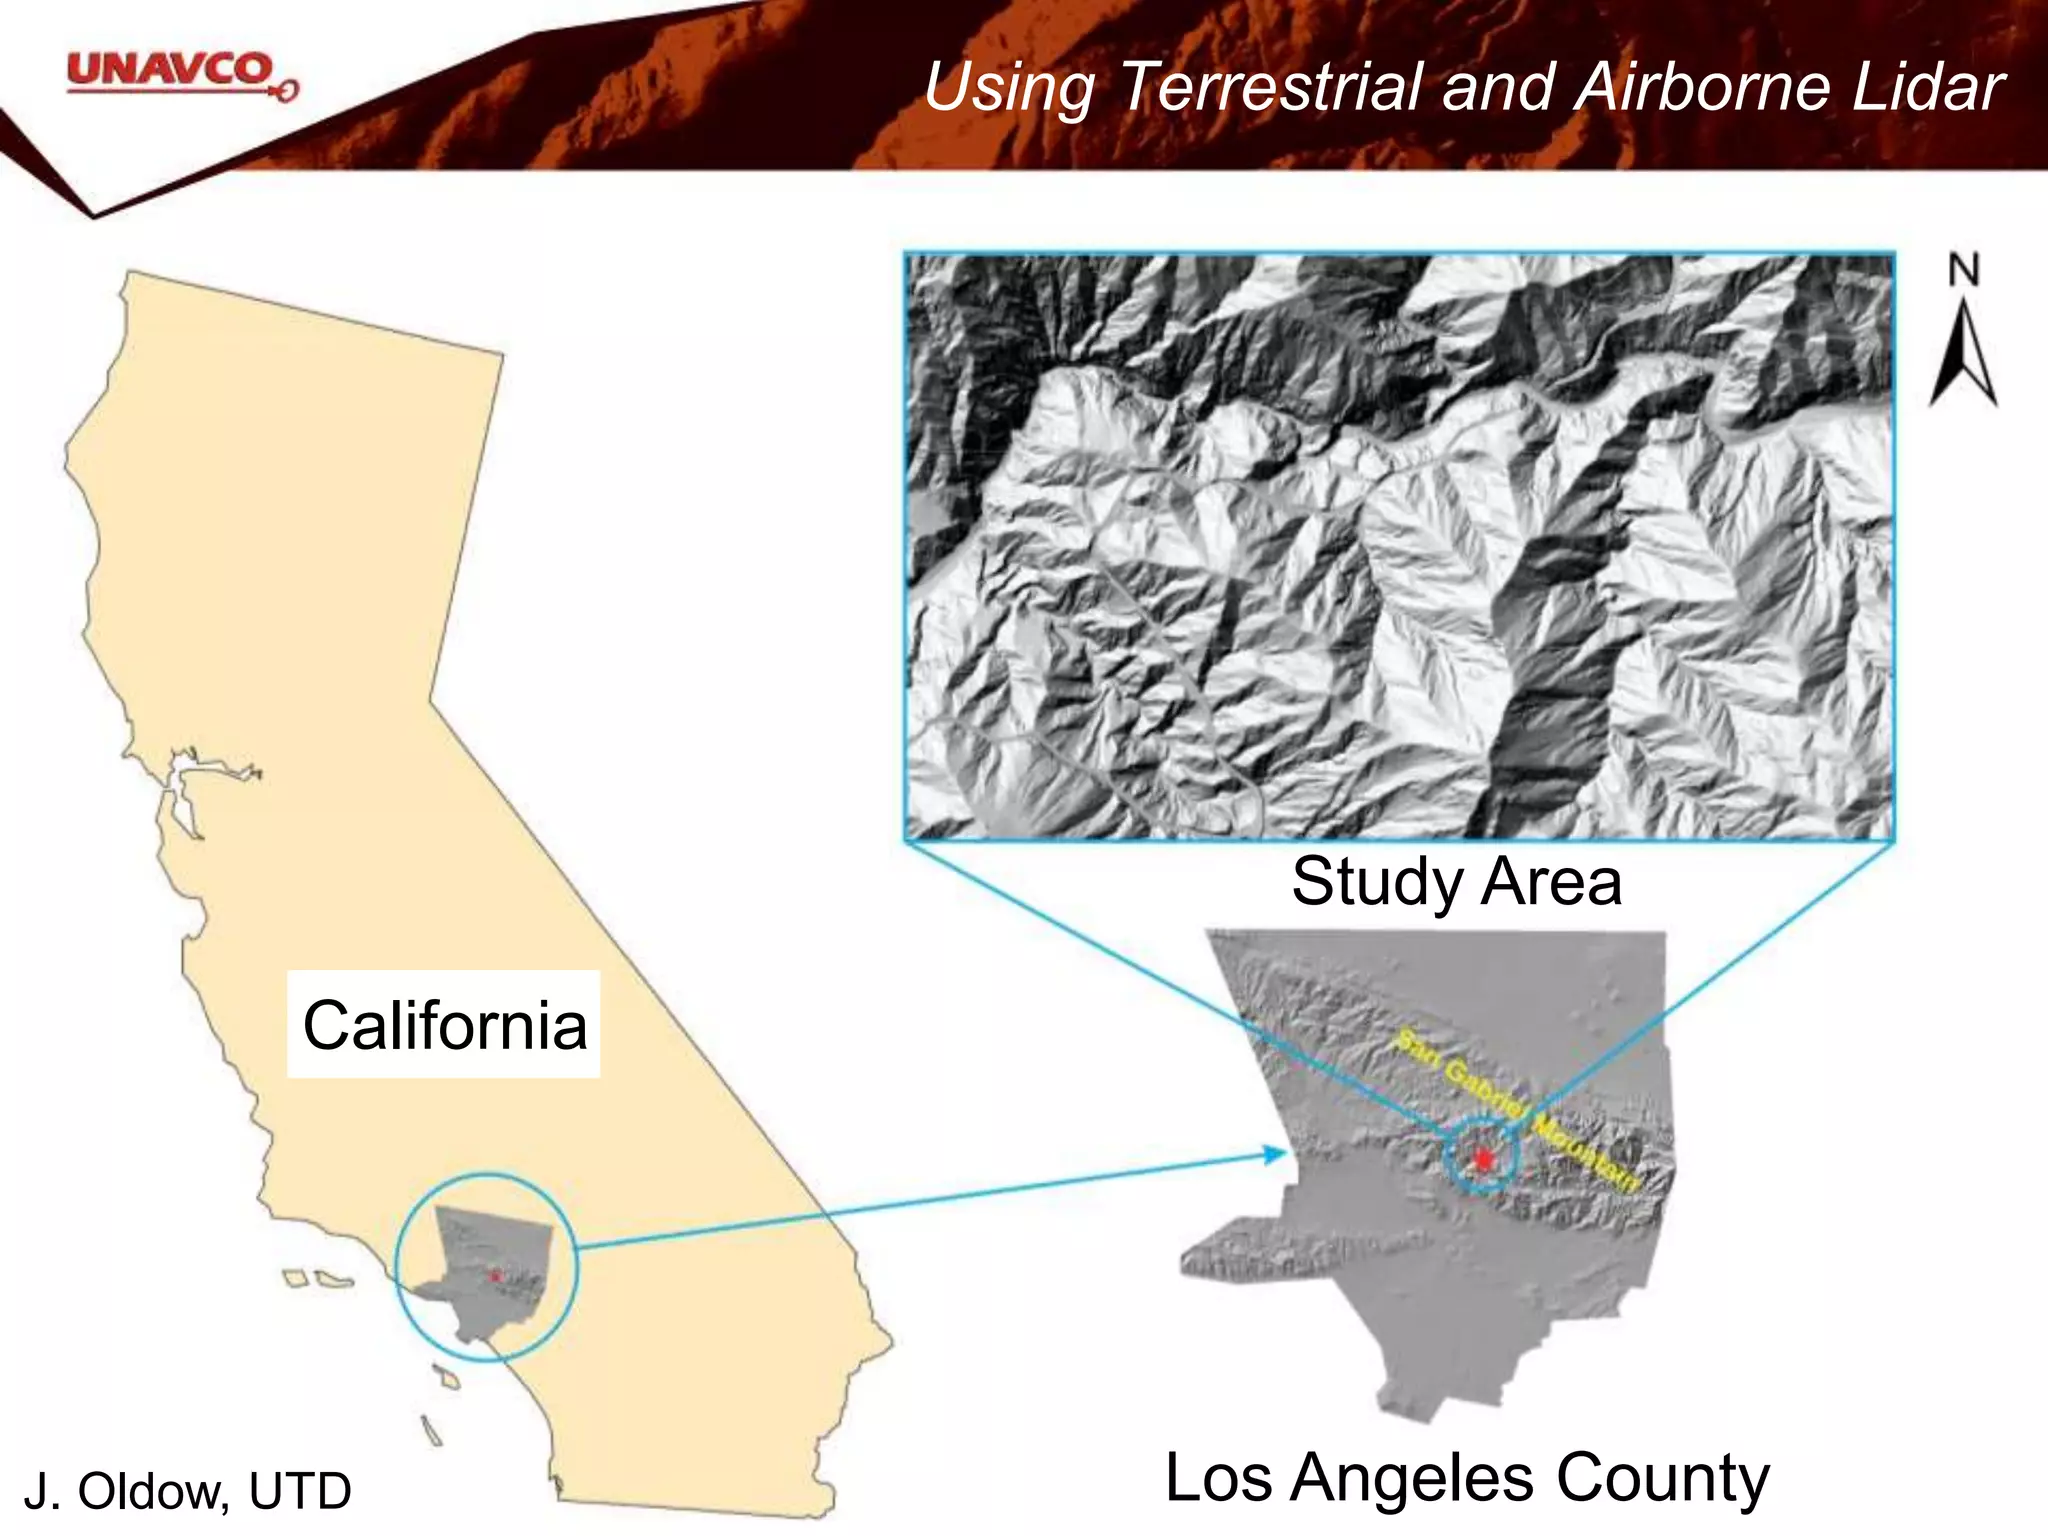
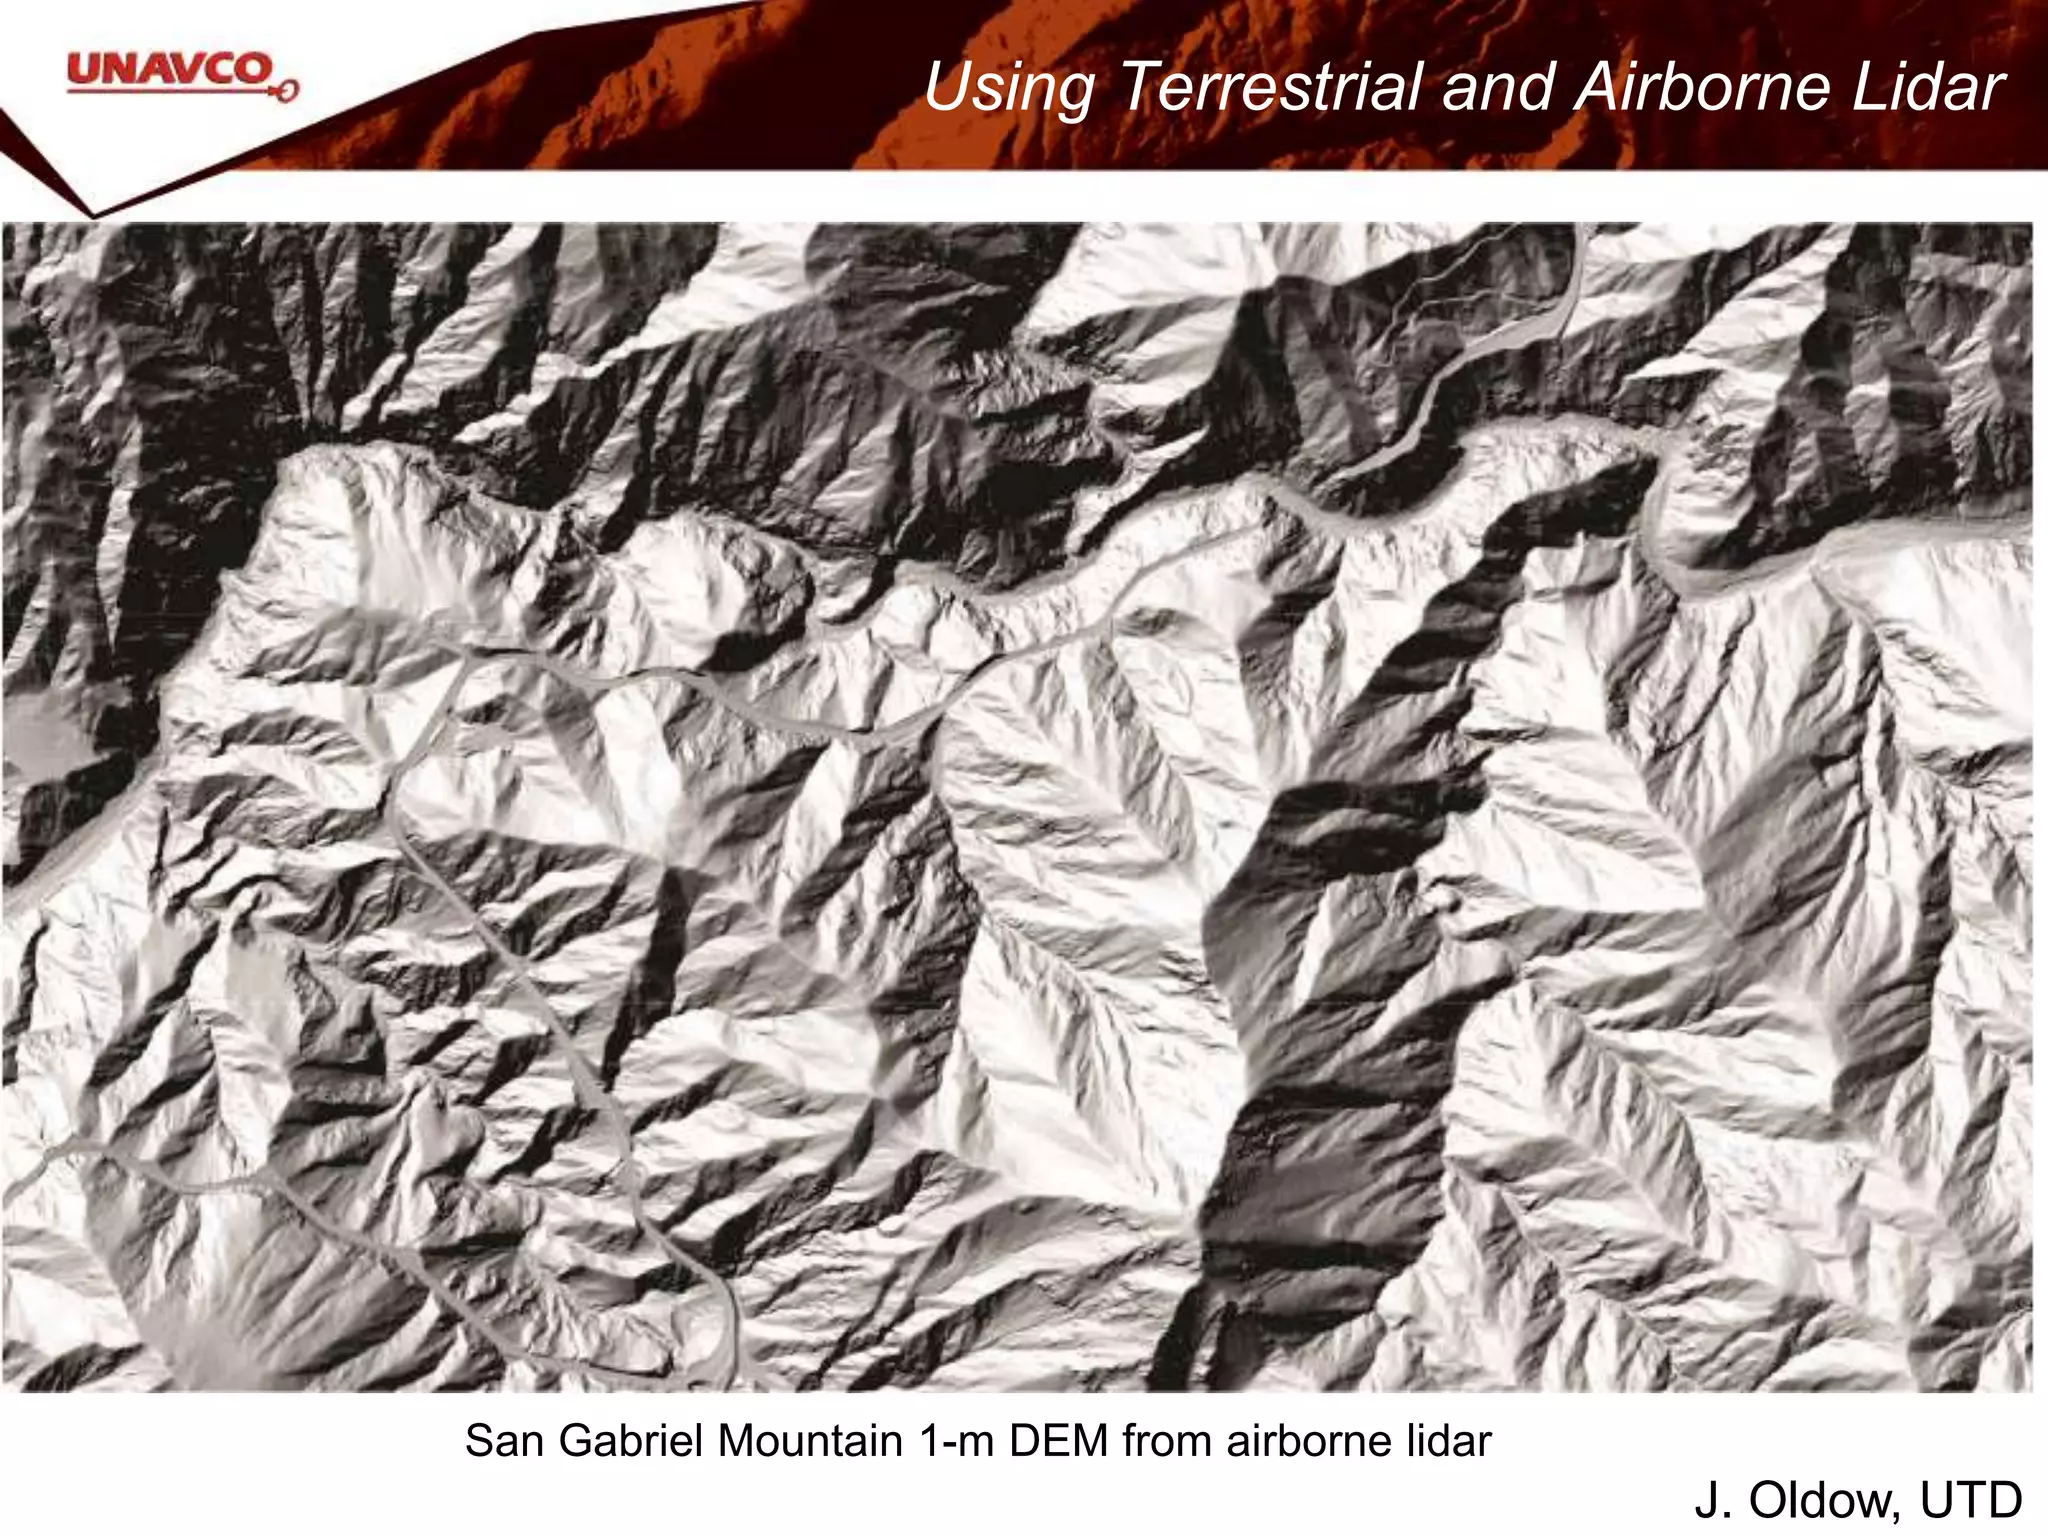
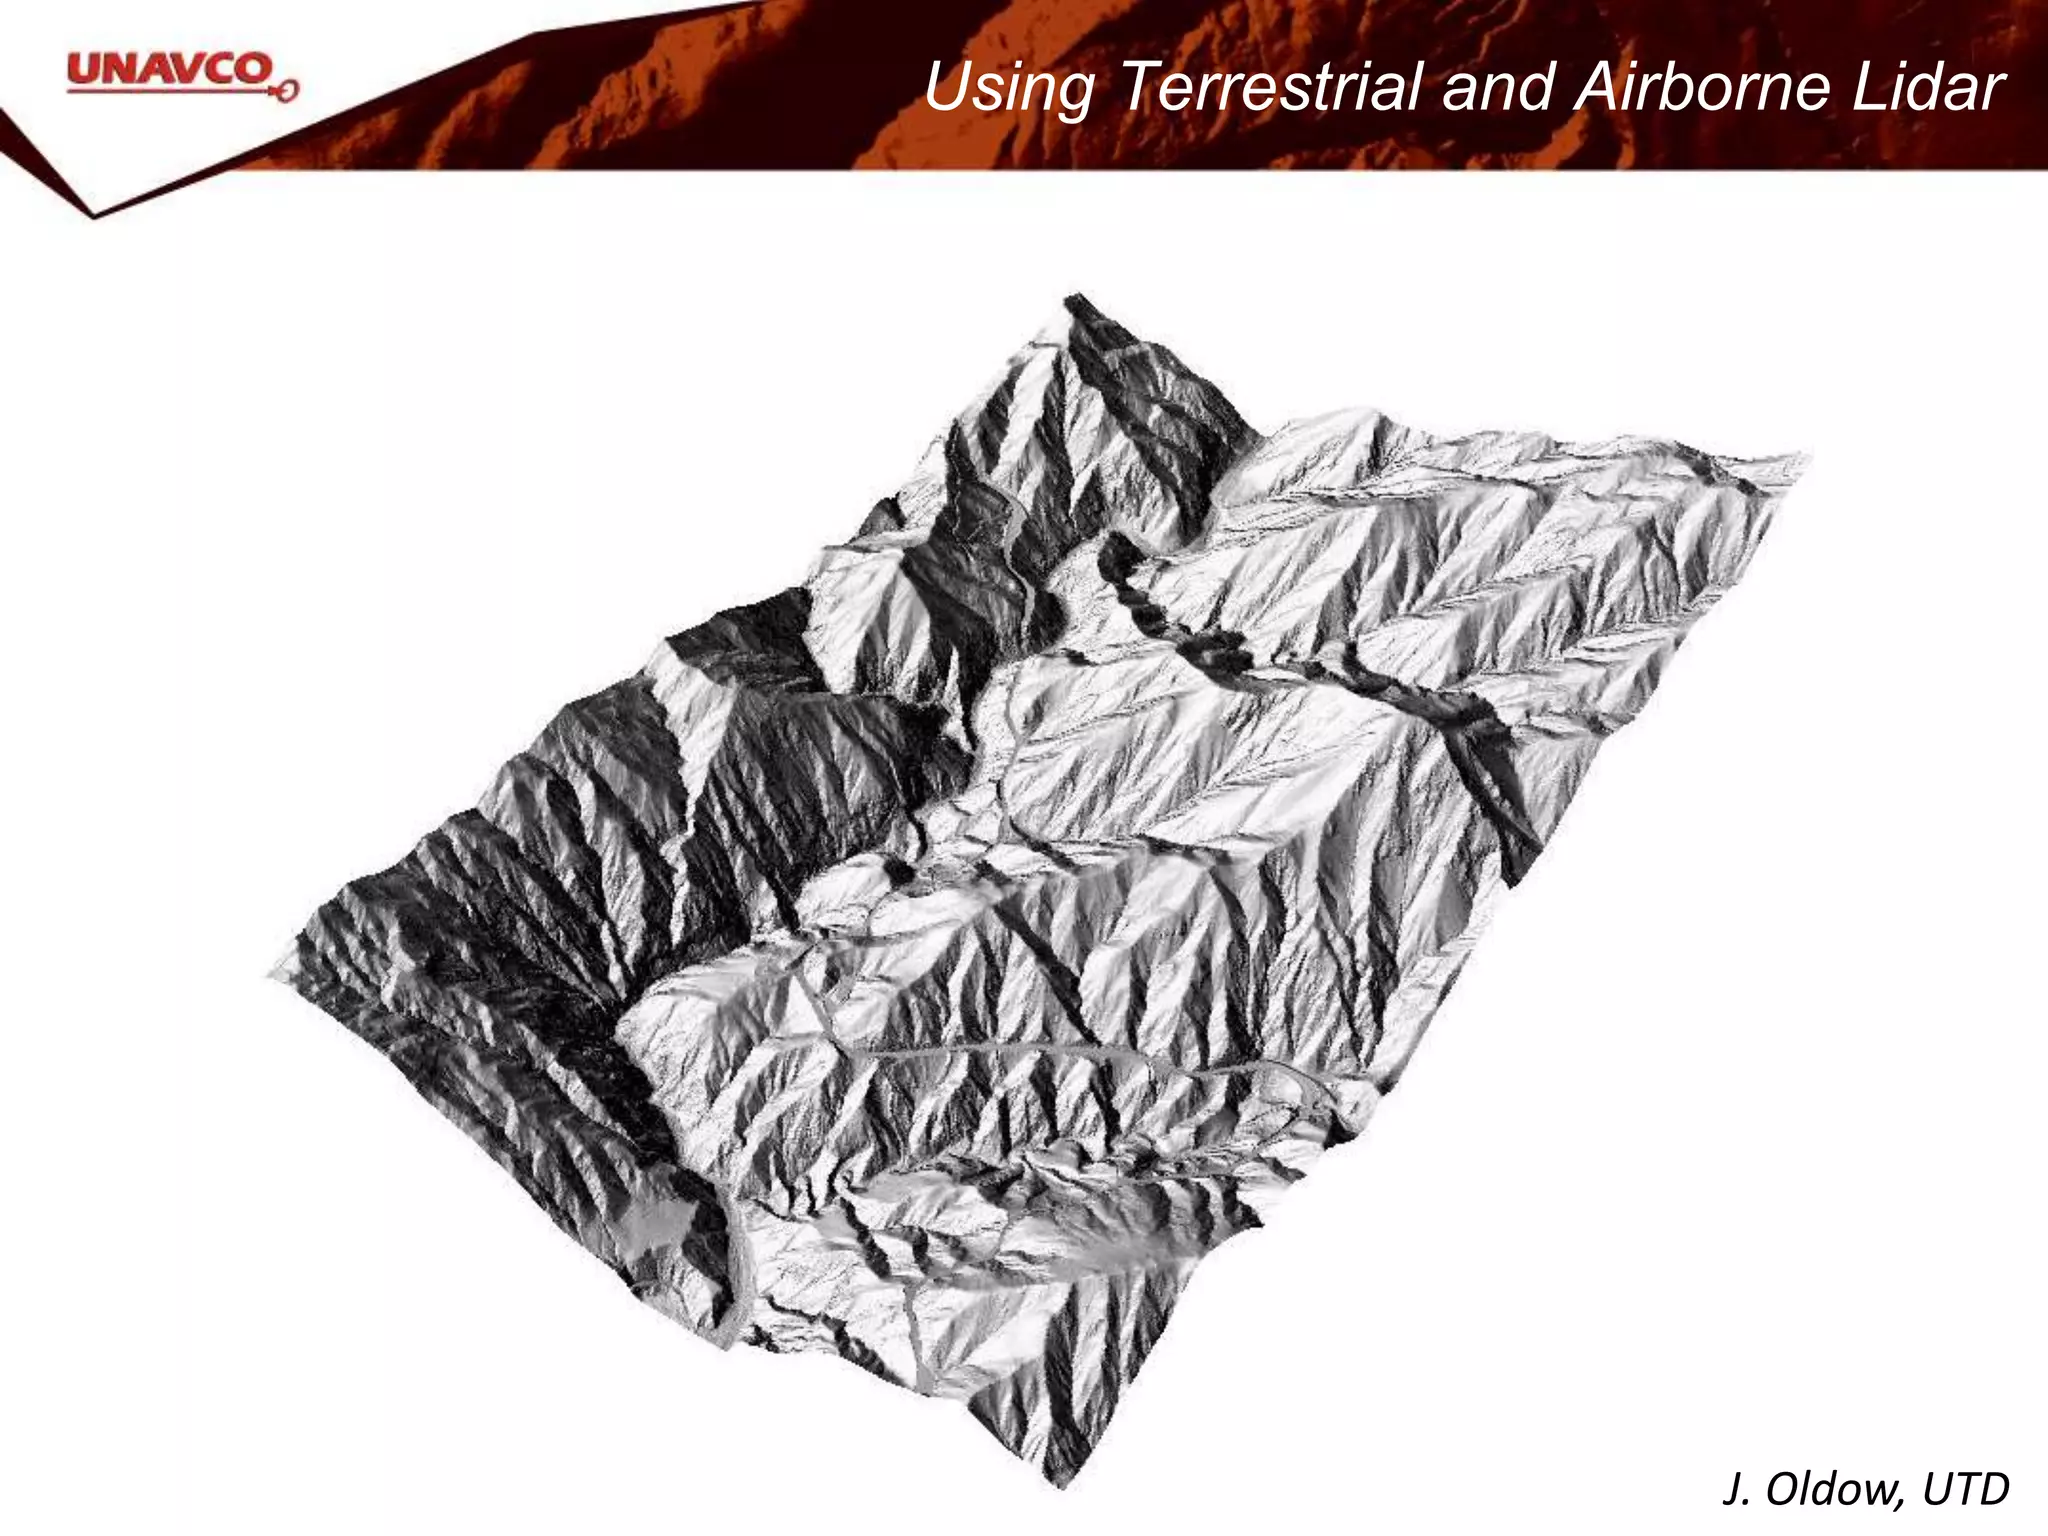
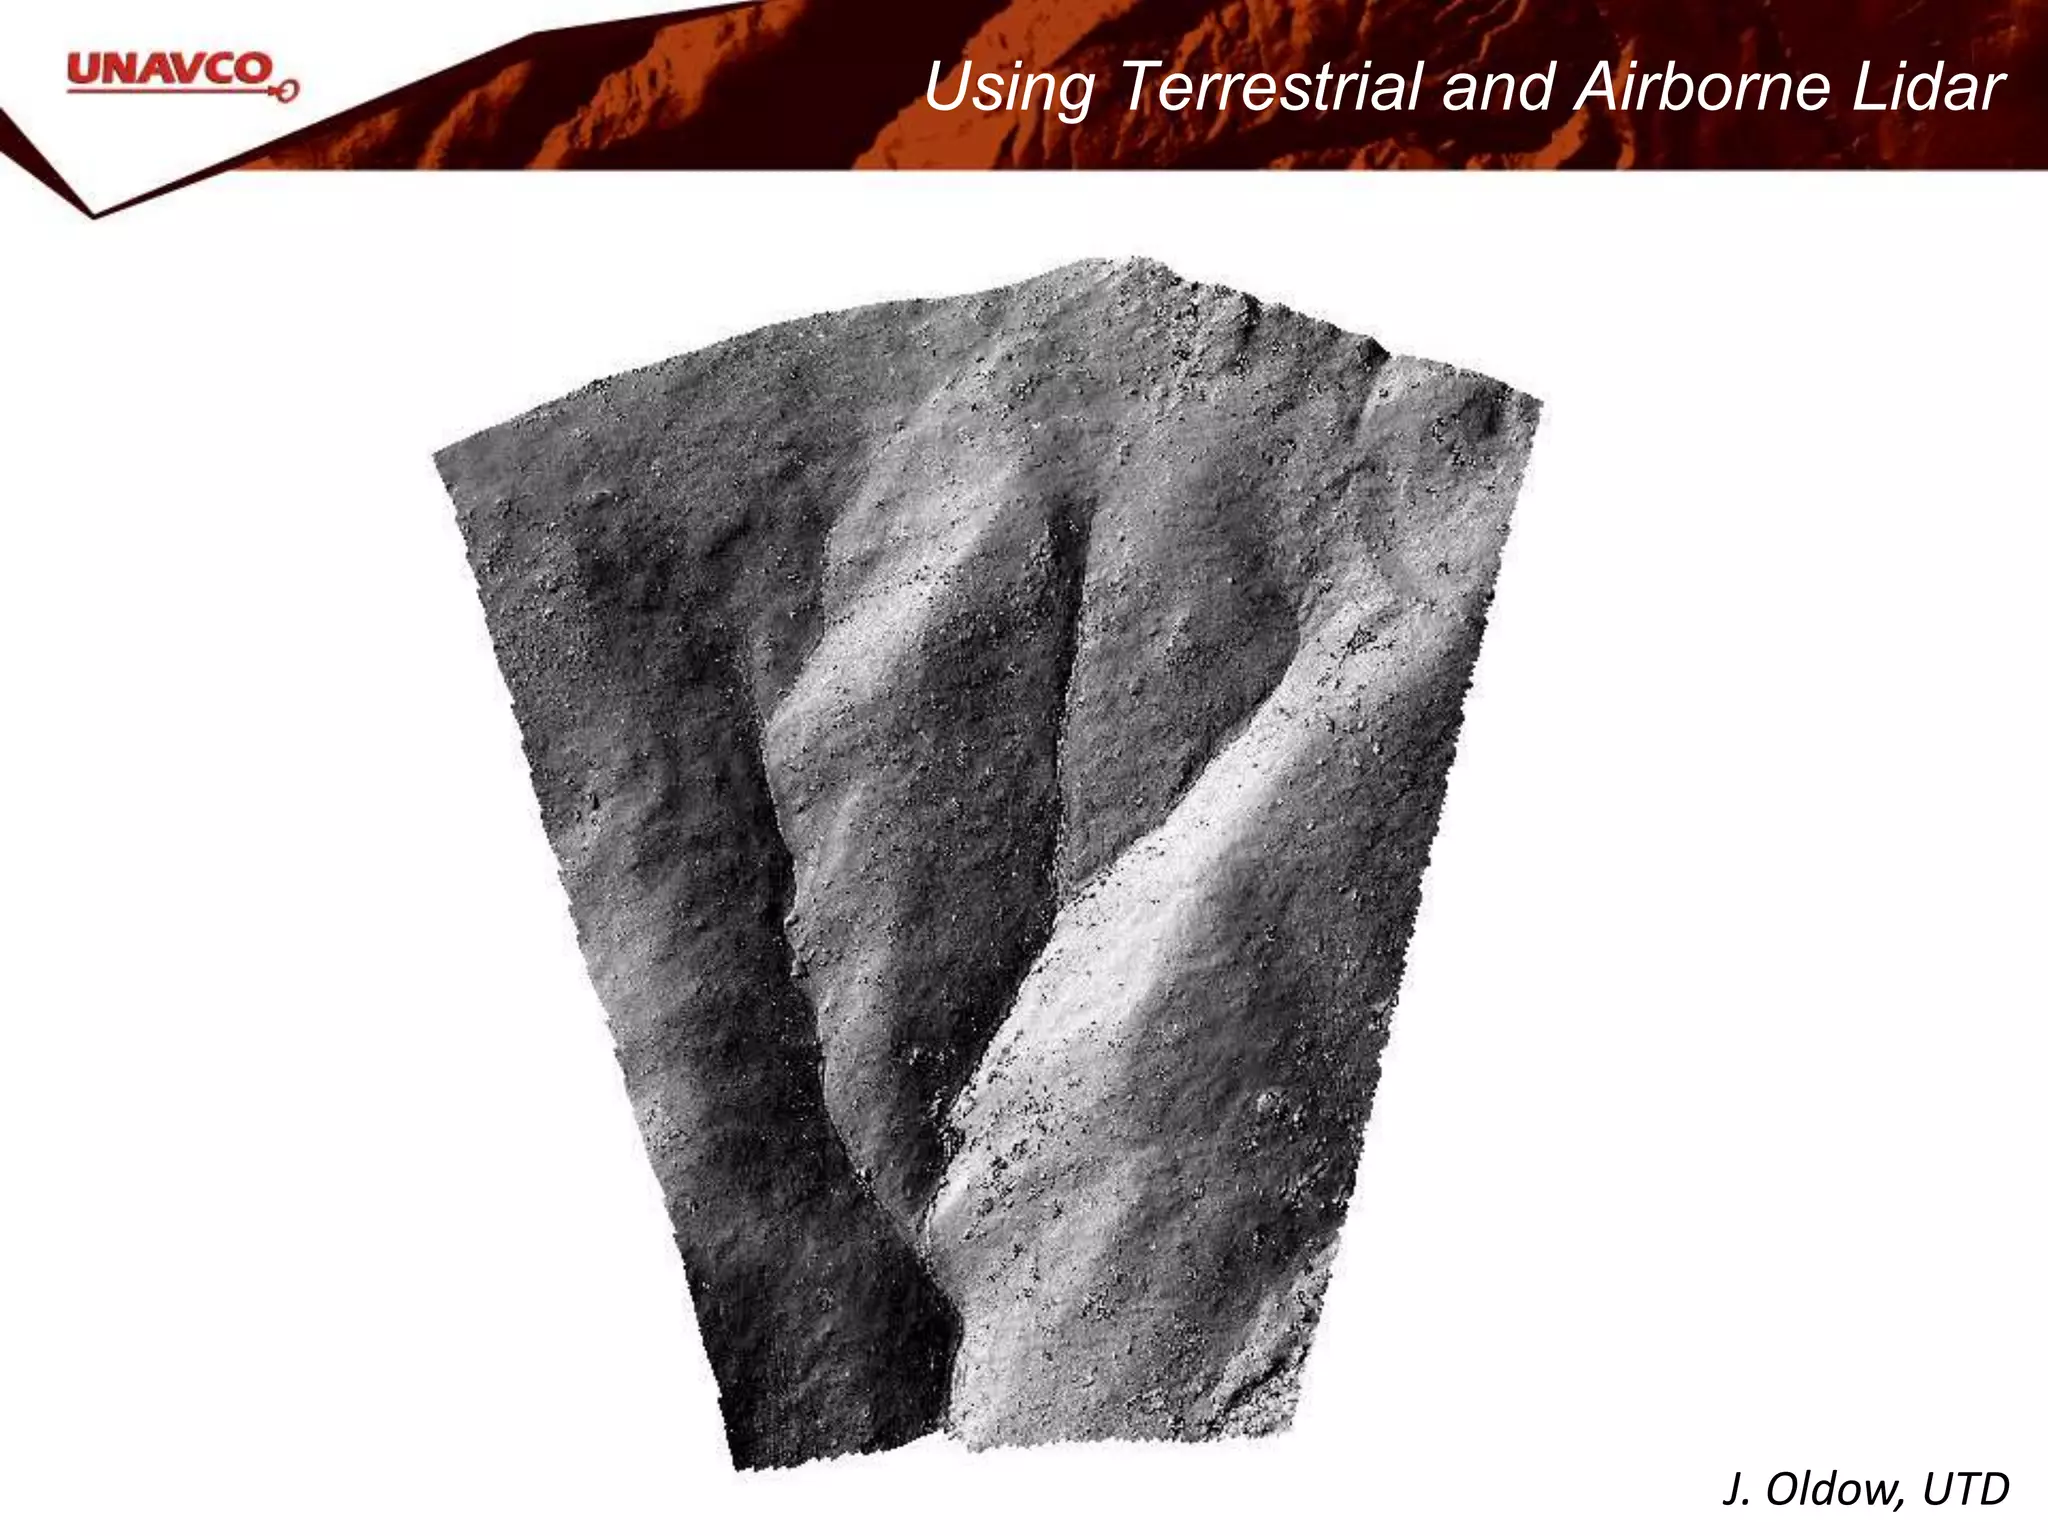
#16 TLS can be used as an addition to airborne lidar (the platform used to collect the data on the previous slide) or on its own. This study area in the San Gabriel Mountains has a 1-m DEM of the study area. This study was focused on analyzing the impact of the 2009 Station Fire in the San Gabriel Mountains.
#17 It looks great/very high resolution from this view; at this scale you could do some kind of watershed analysis.
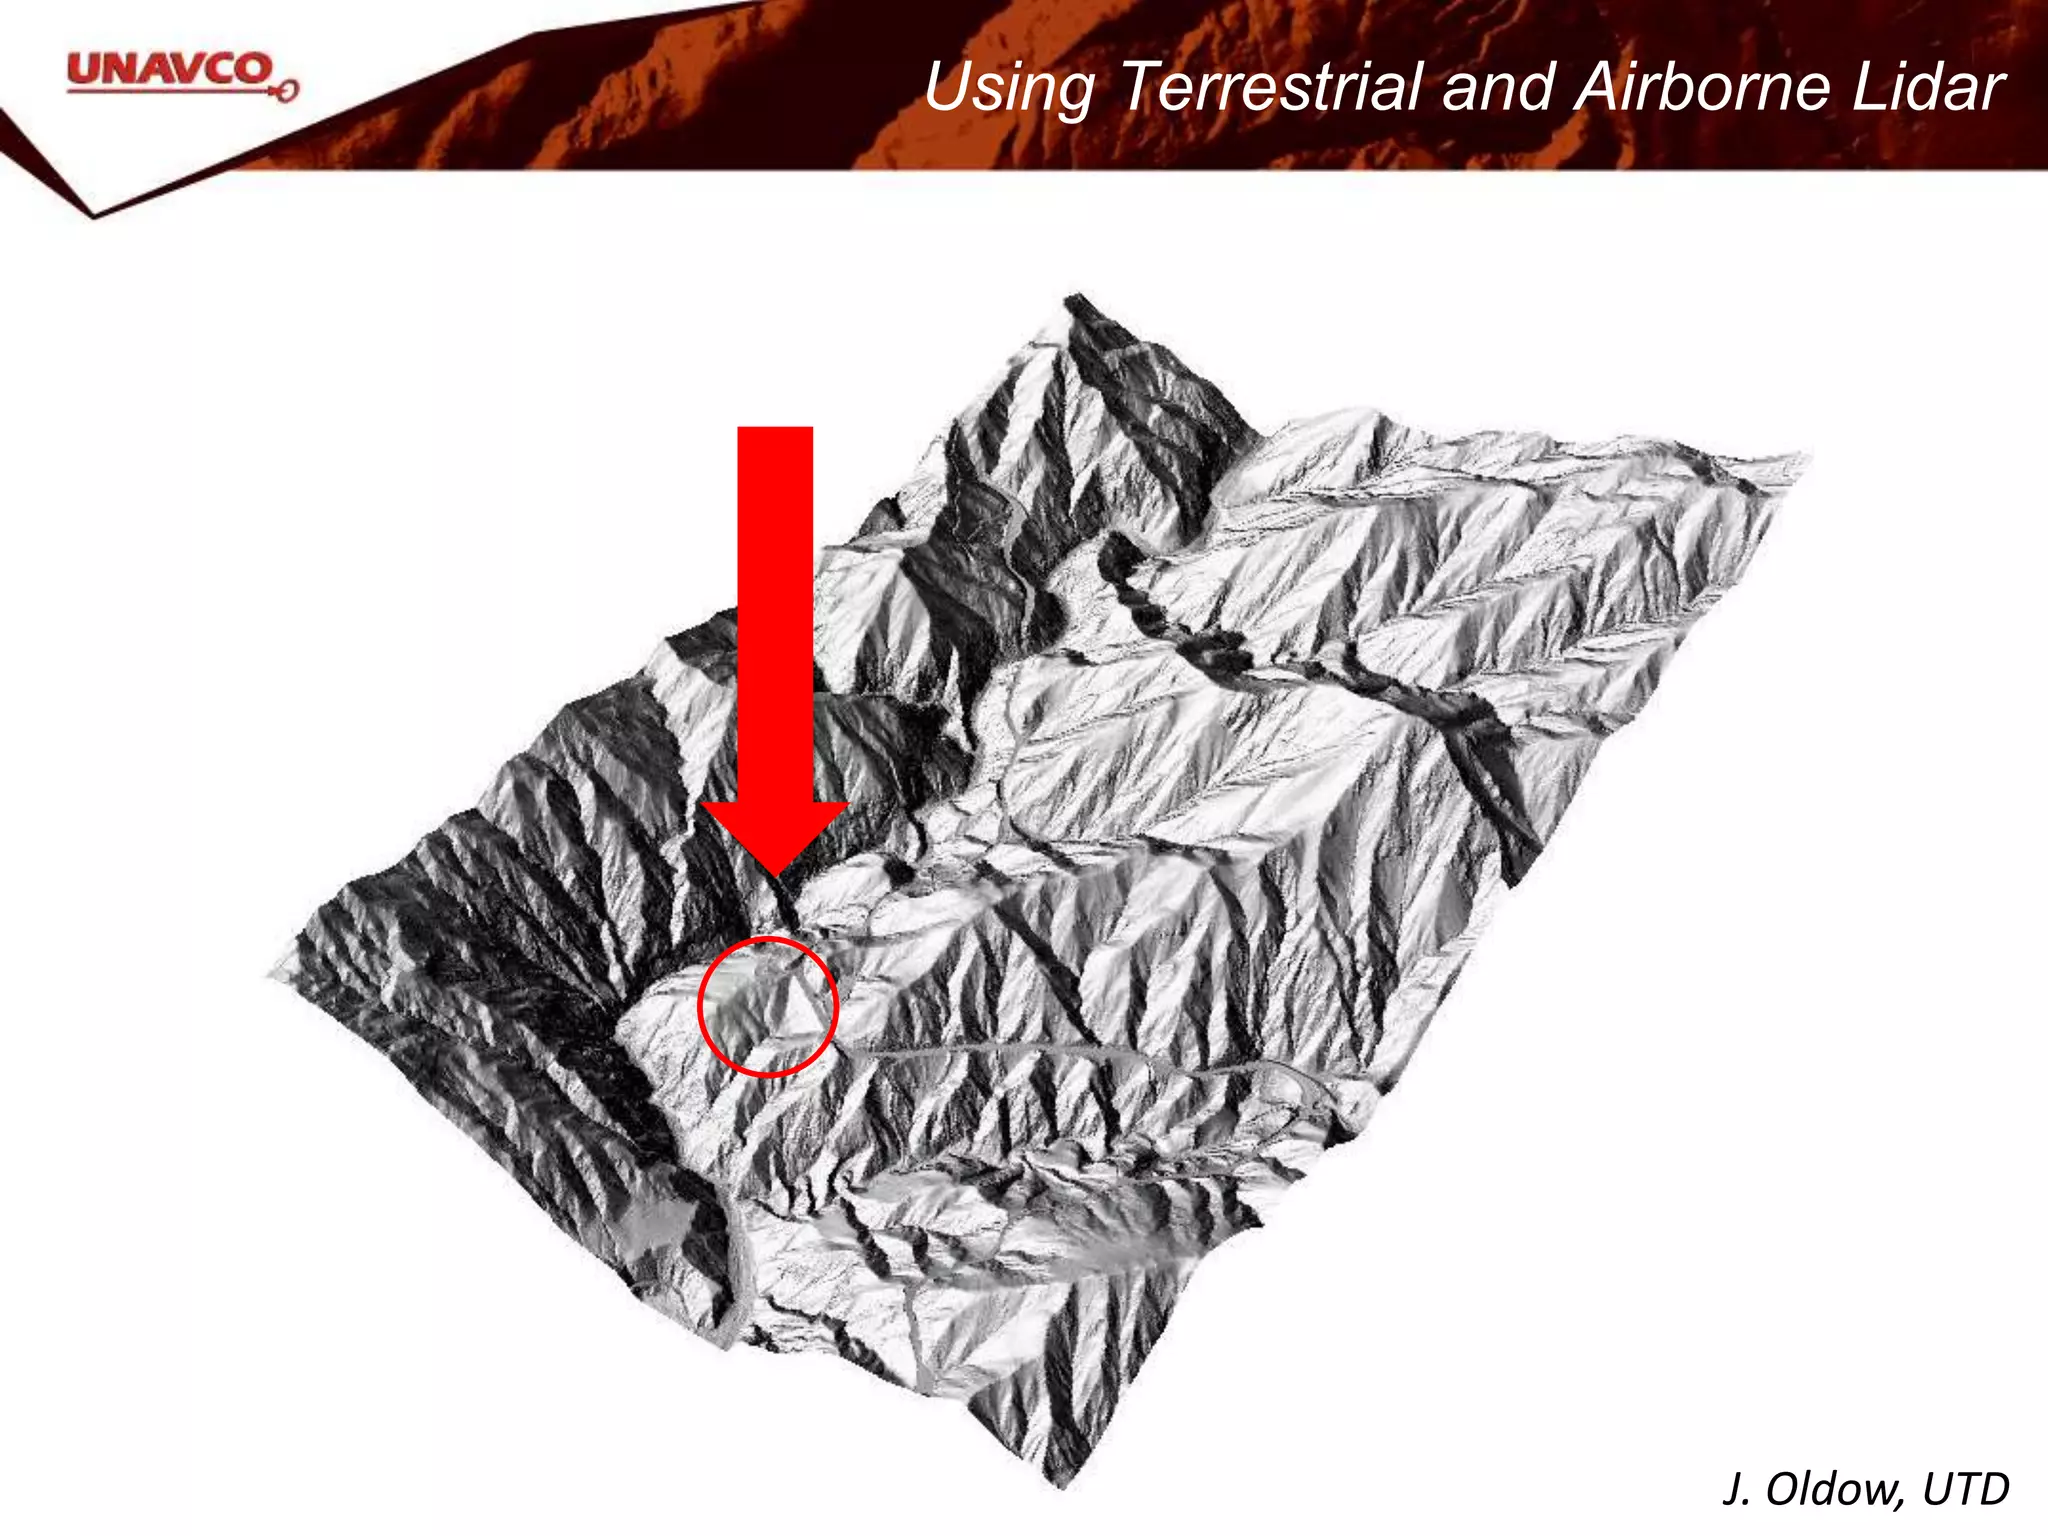
#19 The research area of interest, however, is the area highlighted by the circle
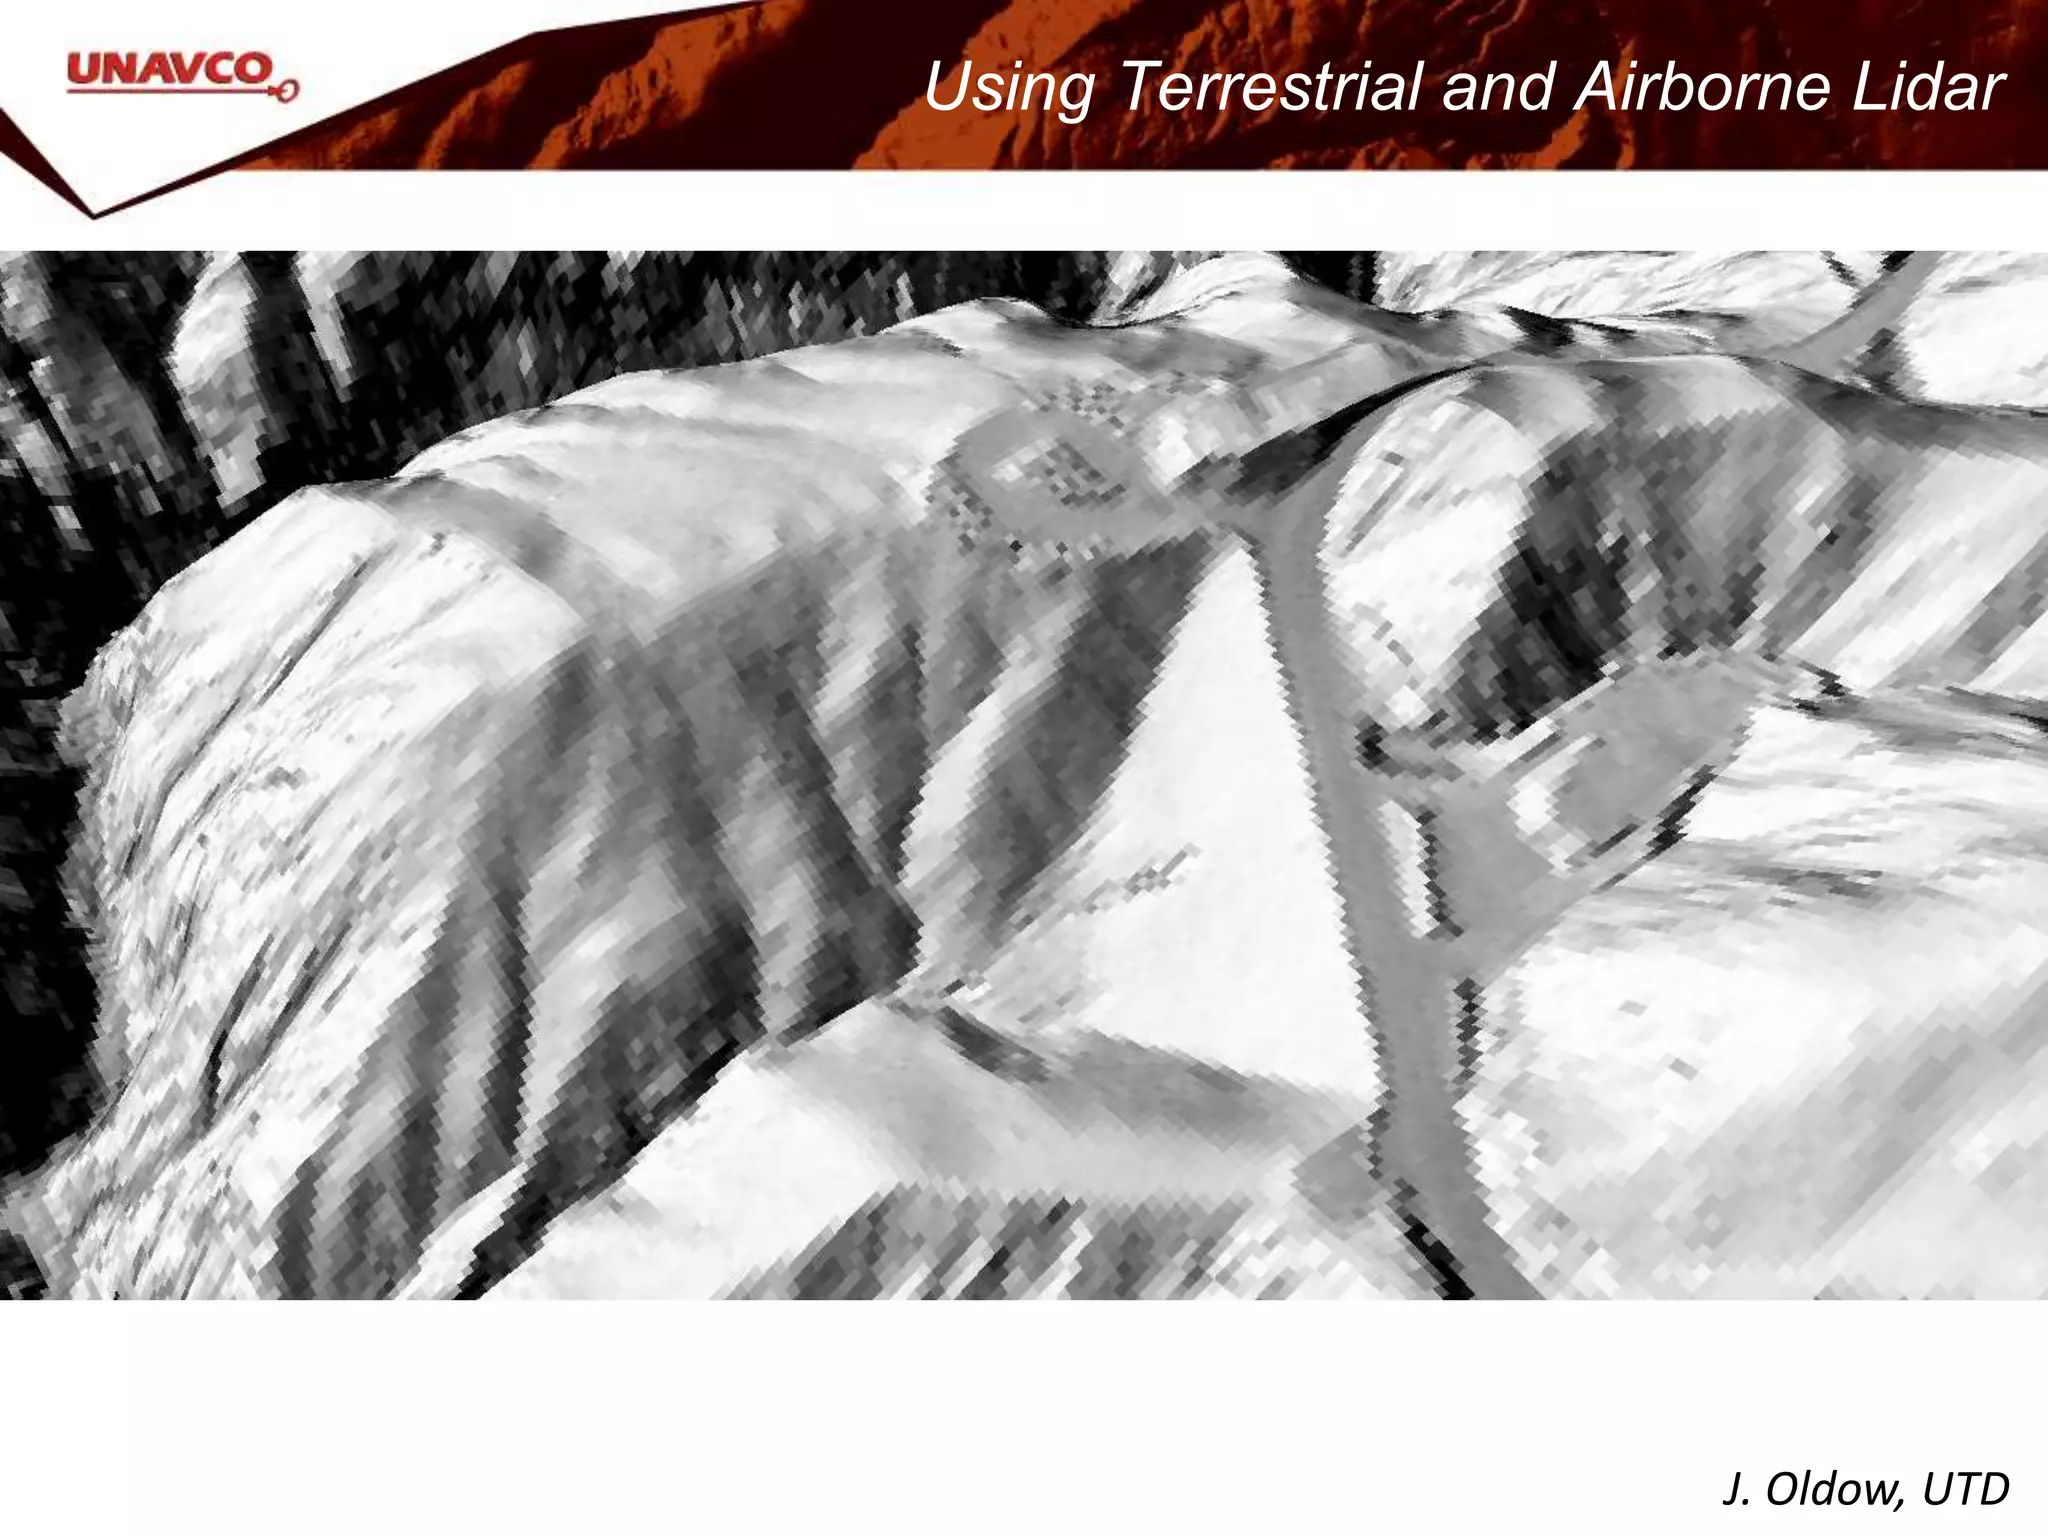
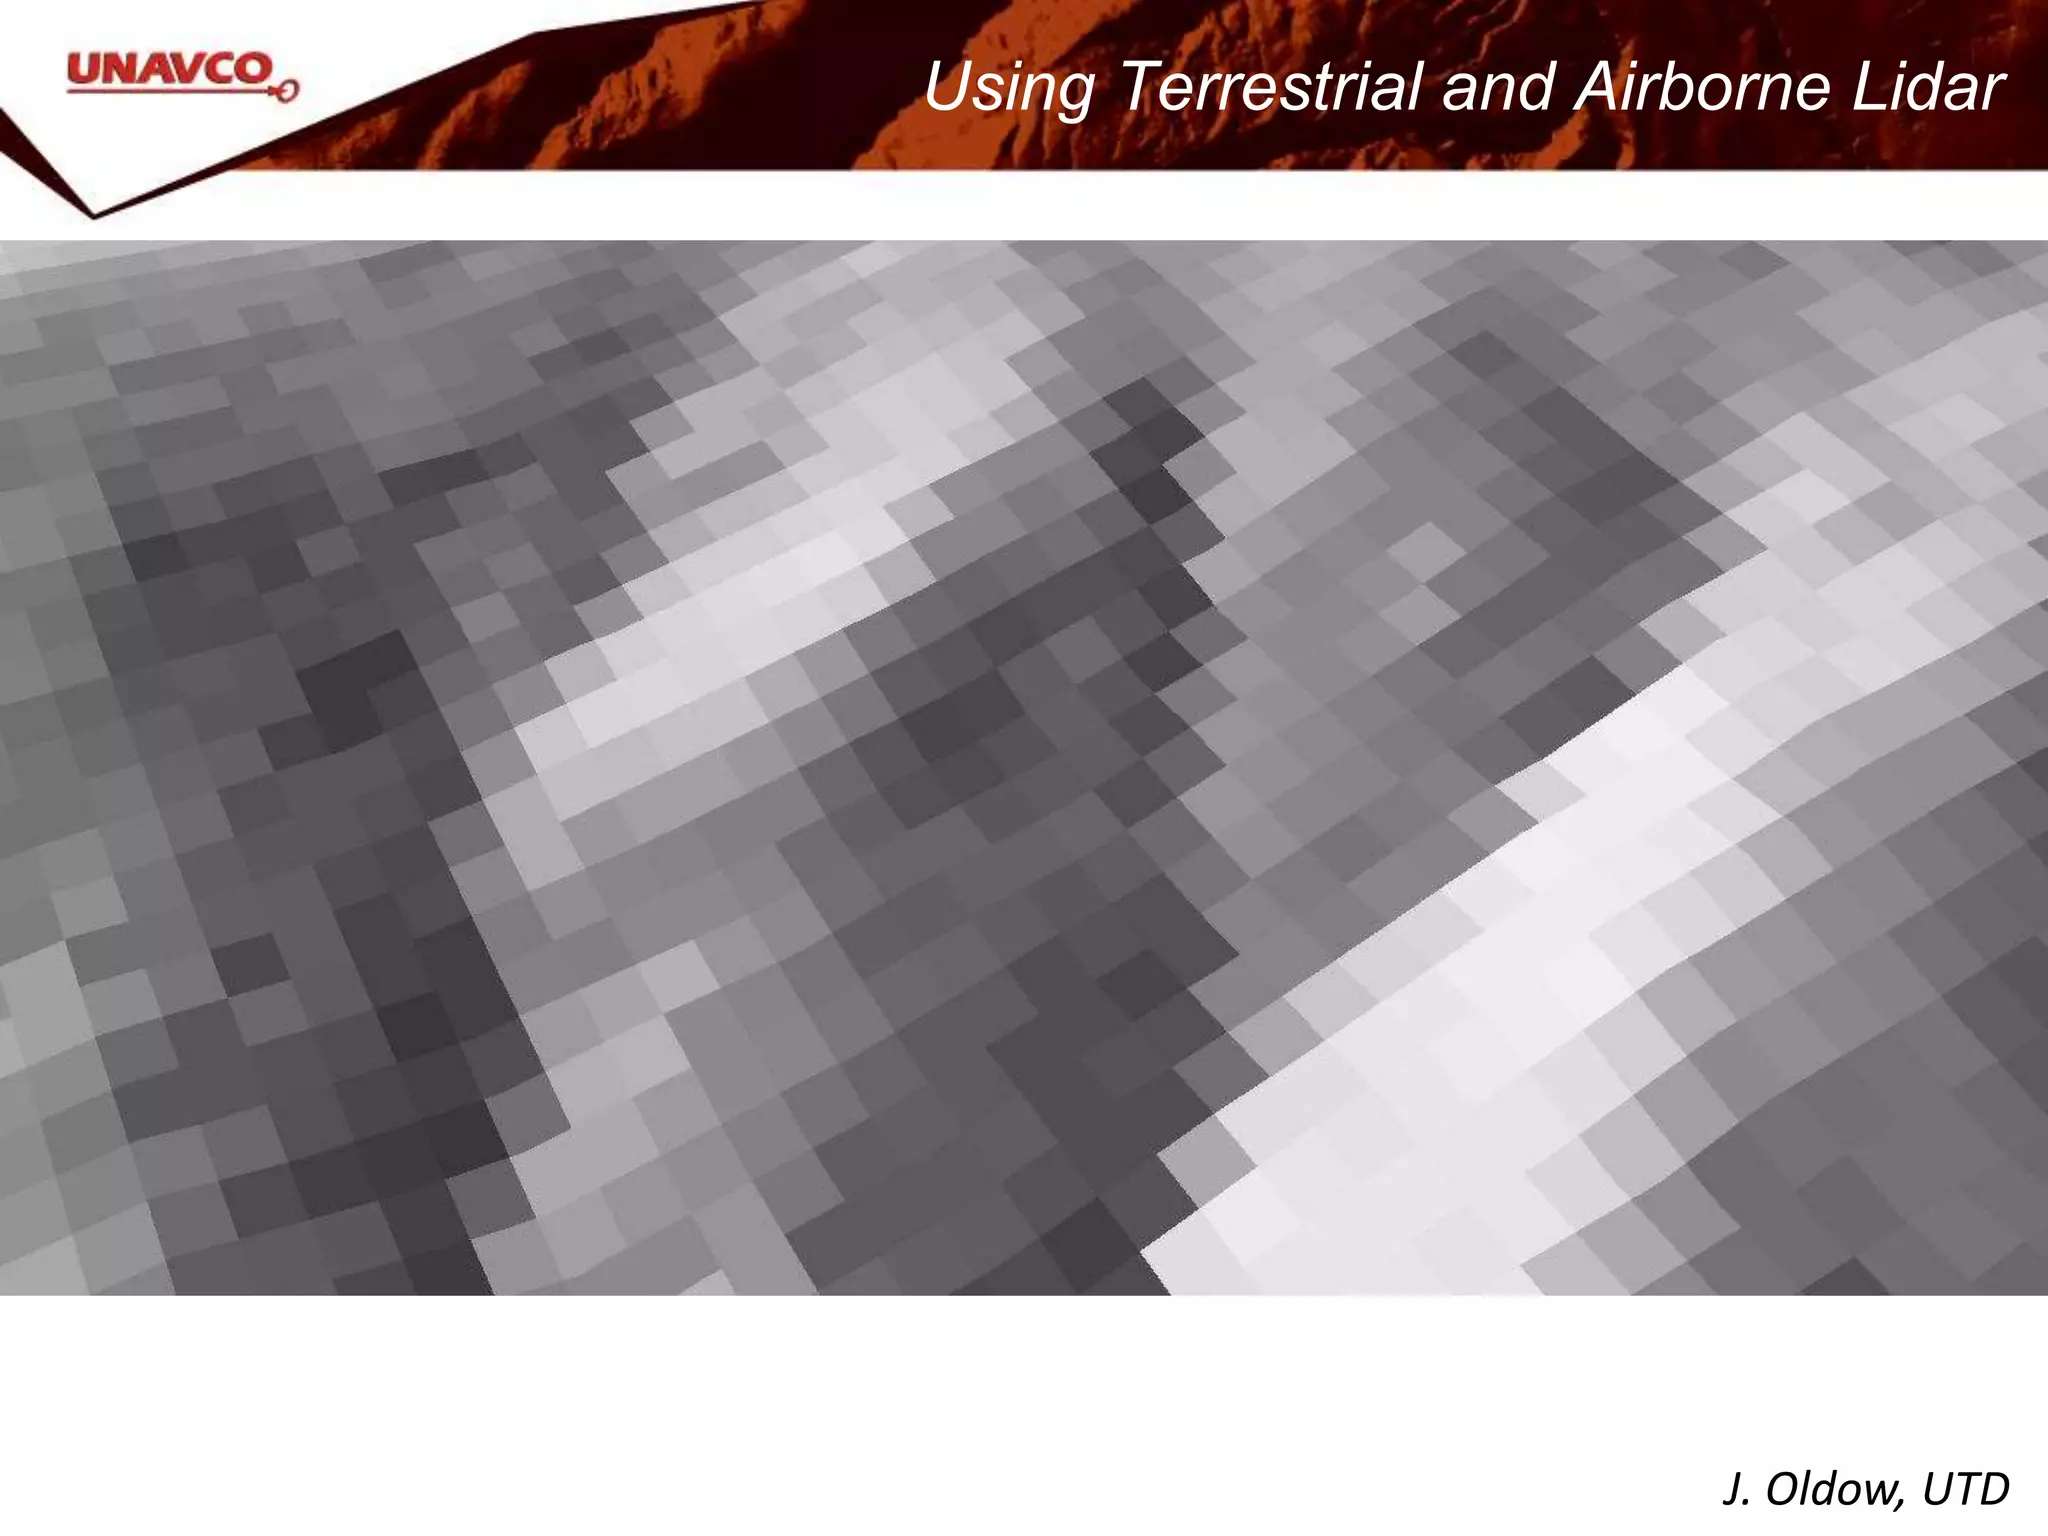
#20 If we zoom to this area, the resolution is no longer so great.
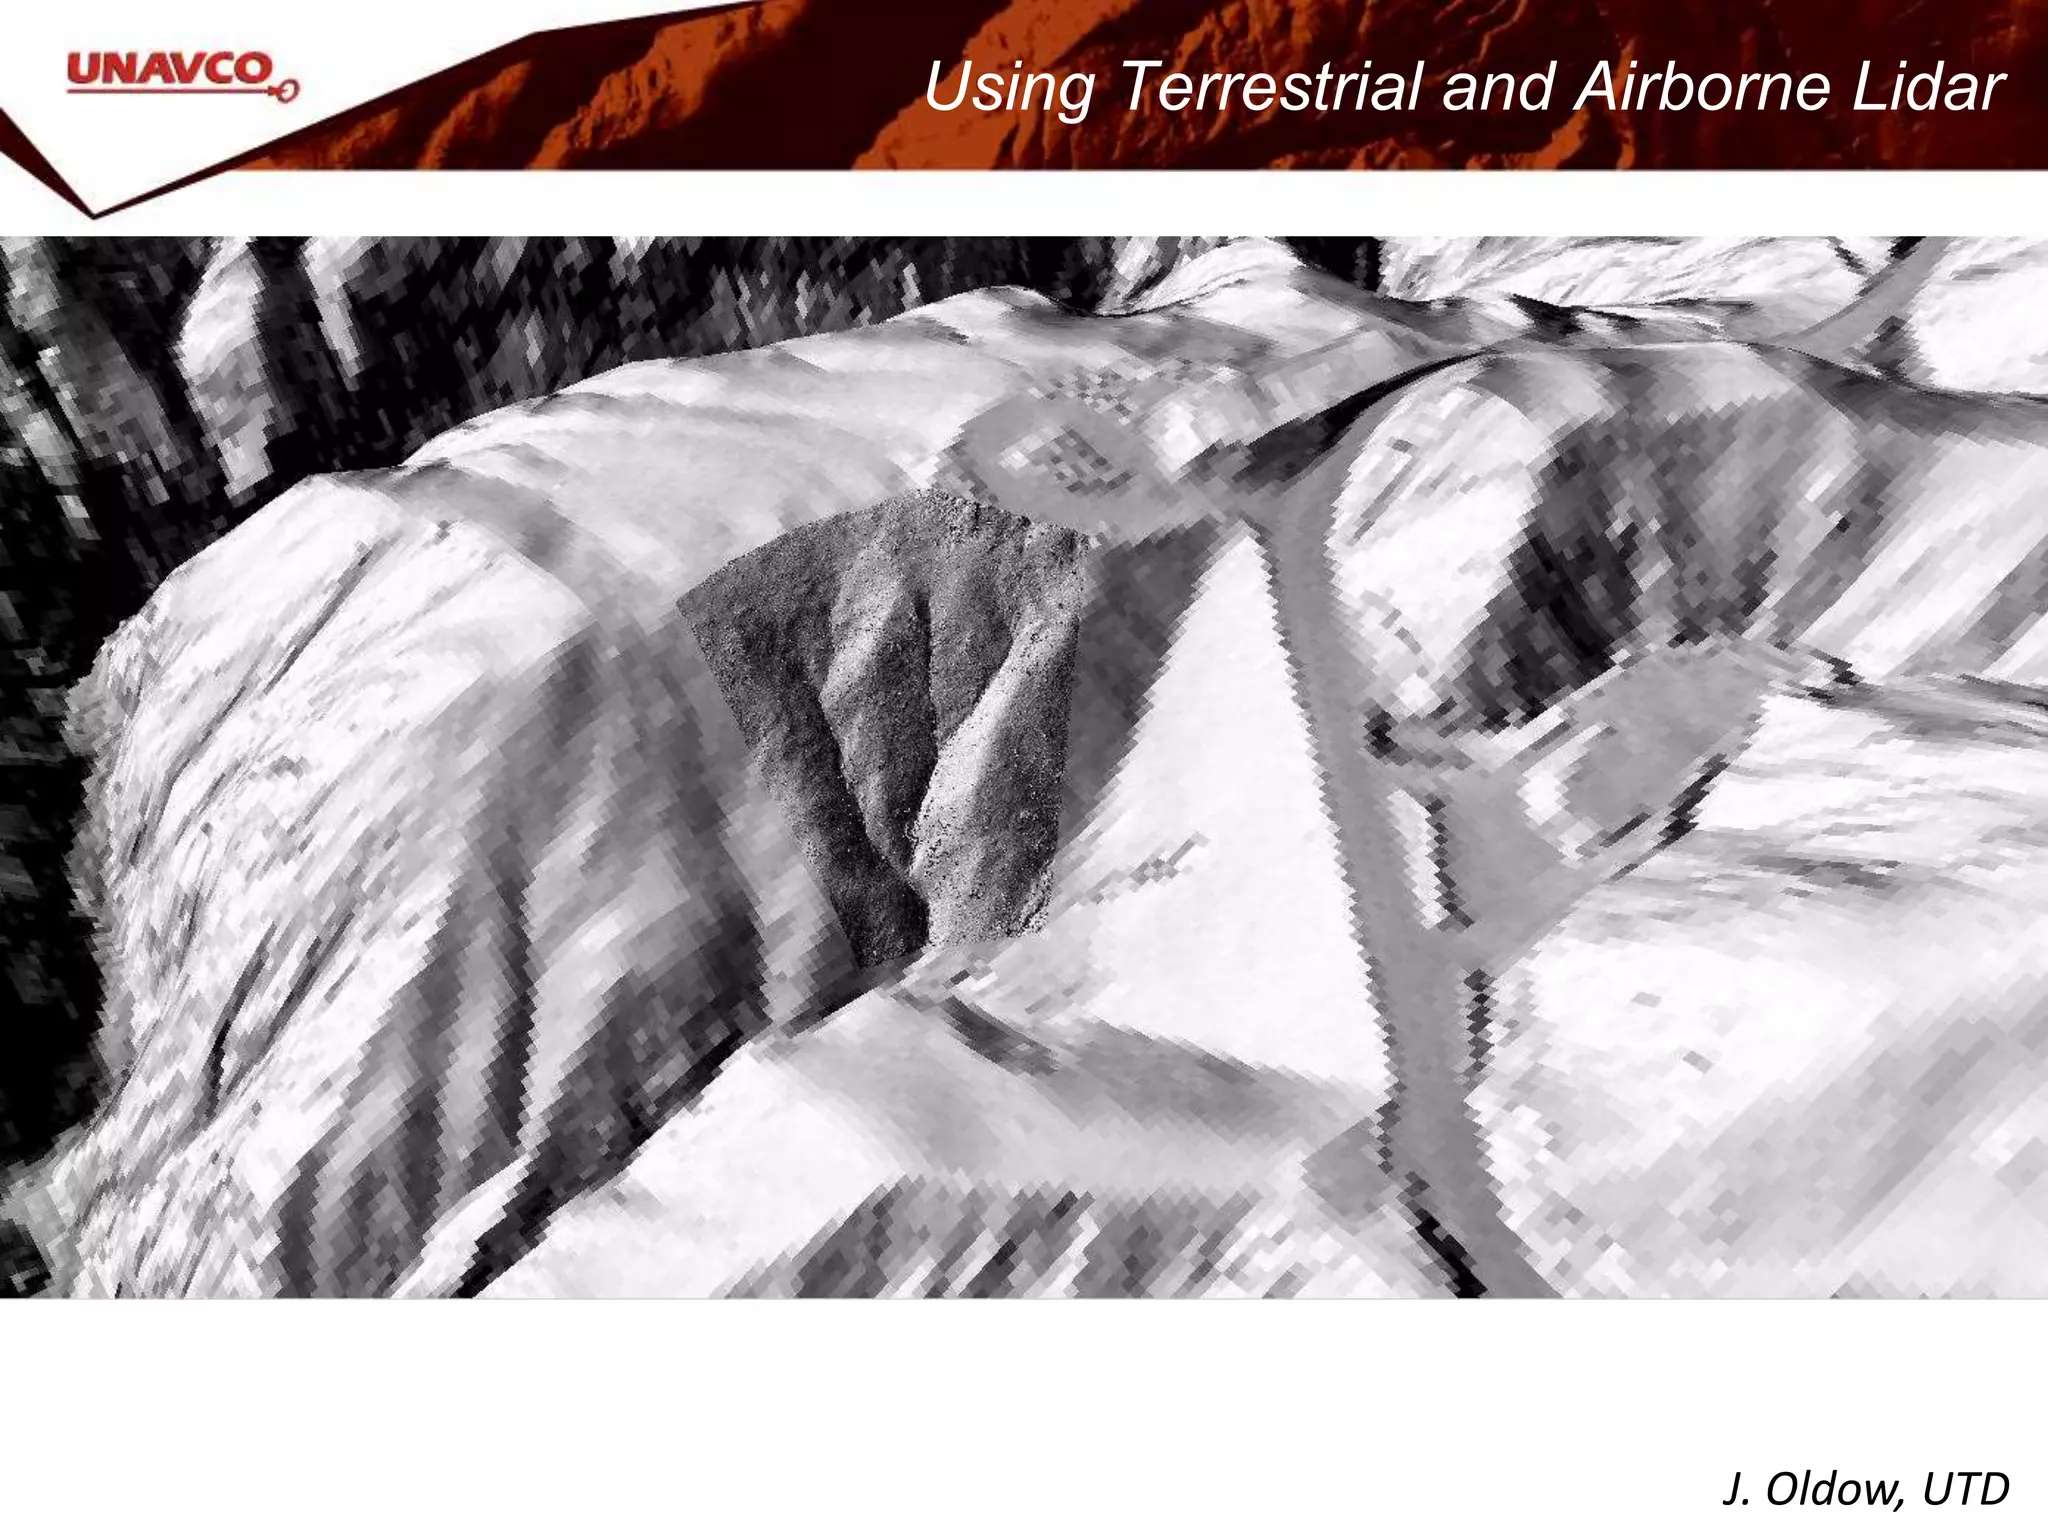
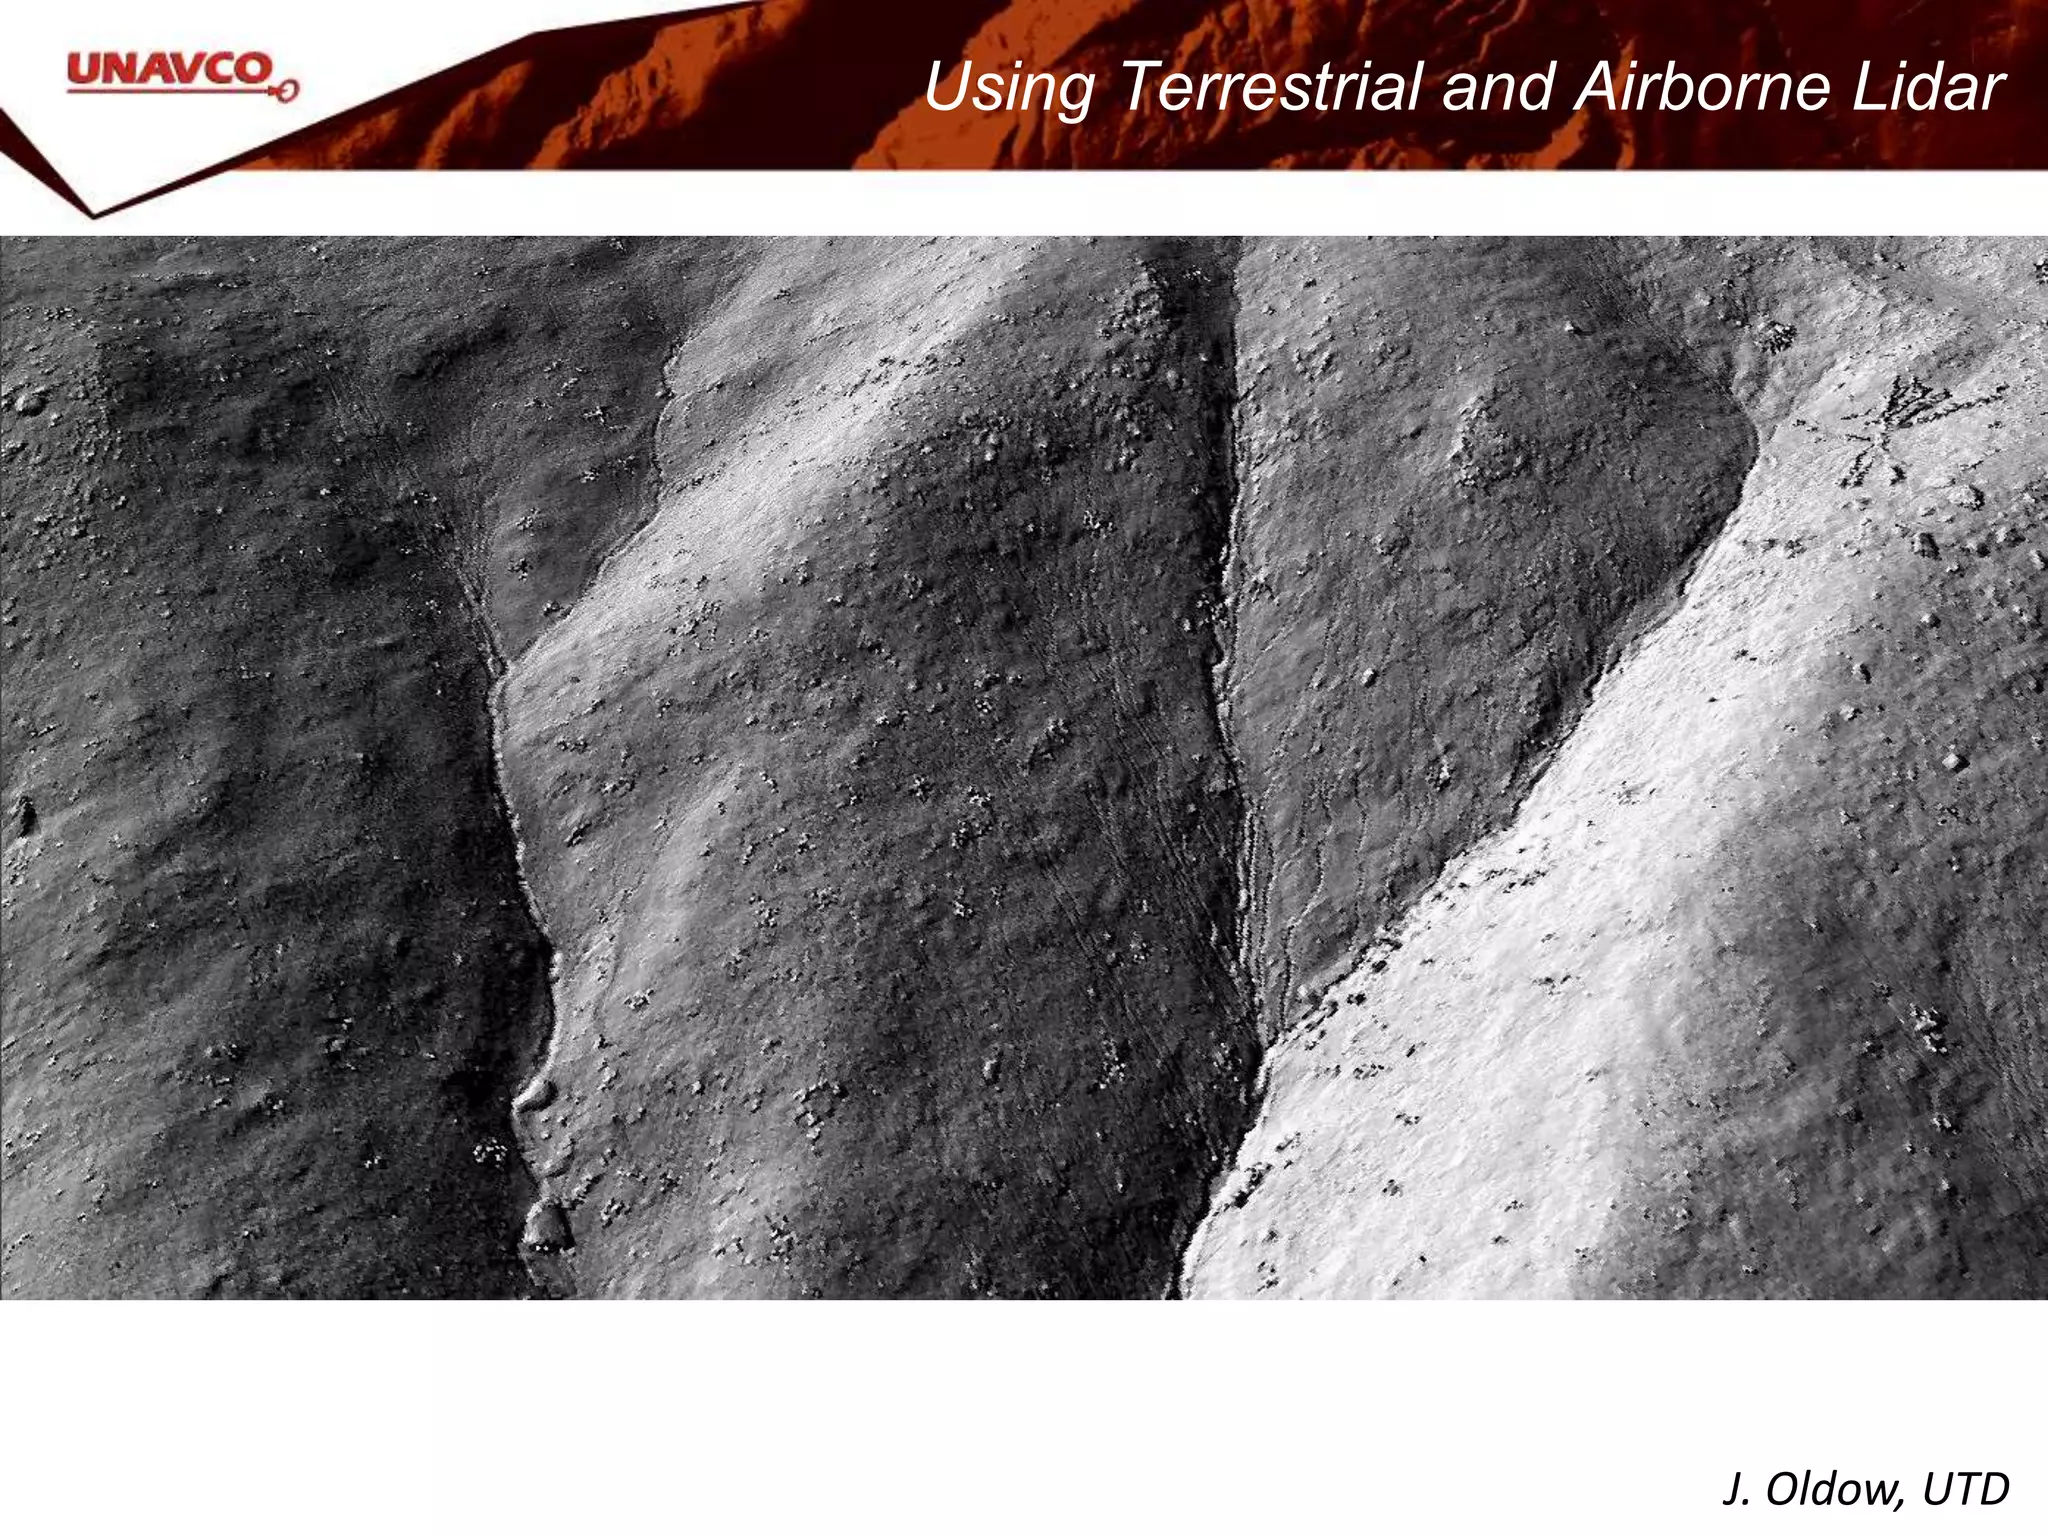
#21 However, if you’re interested in exactly how the fire has affected the slope, you may want to bring a TLS to do a detail scan like this one to show the characteristics of the slope.
#22 All the little nubs on this slide are actually tree stumps!
#24 Compared to this view of the TLS data. The fire de-vegetated the hillslope. TLS allows you to capture the landscape at the scale at which the process is happening. You can even see small gullies running down the side of the hill!
#25 Play embedded video. This demonstrates applications of TLS for research.
#26 TLS has a number of research applications. The following slides will demonstrate the wide range of research that has been conducted using UNAVCO instrumentation and support.
Image: UNAVCO
#27 In this project run by Georgia Tech and sponsored by NSF RAPID, PIs used TLS to document the effects of the 2011 Japan tsunami soon after it happened. This slide shows the scan positions
Images: UNAVCO
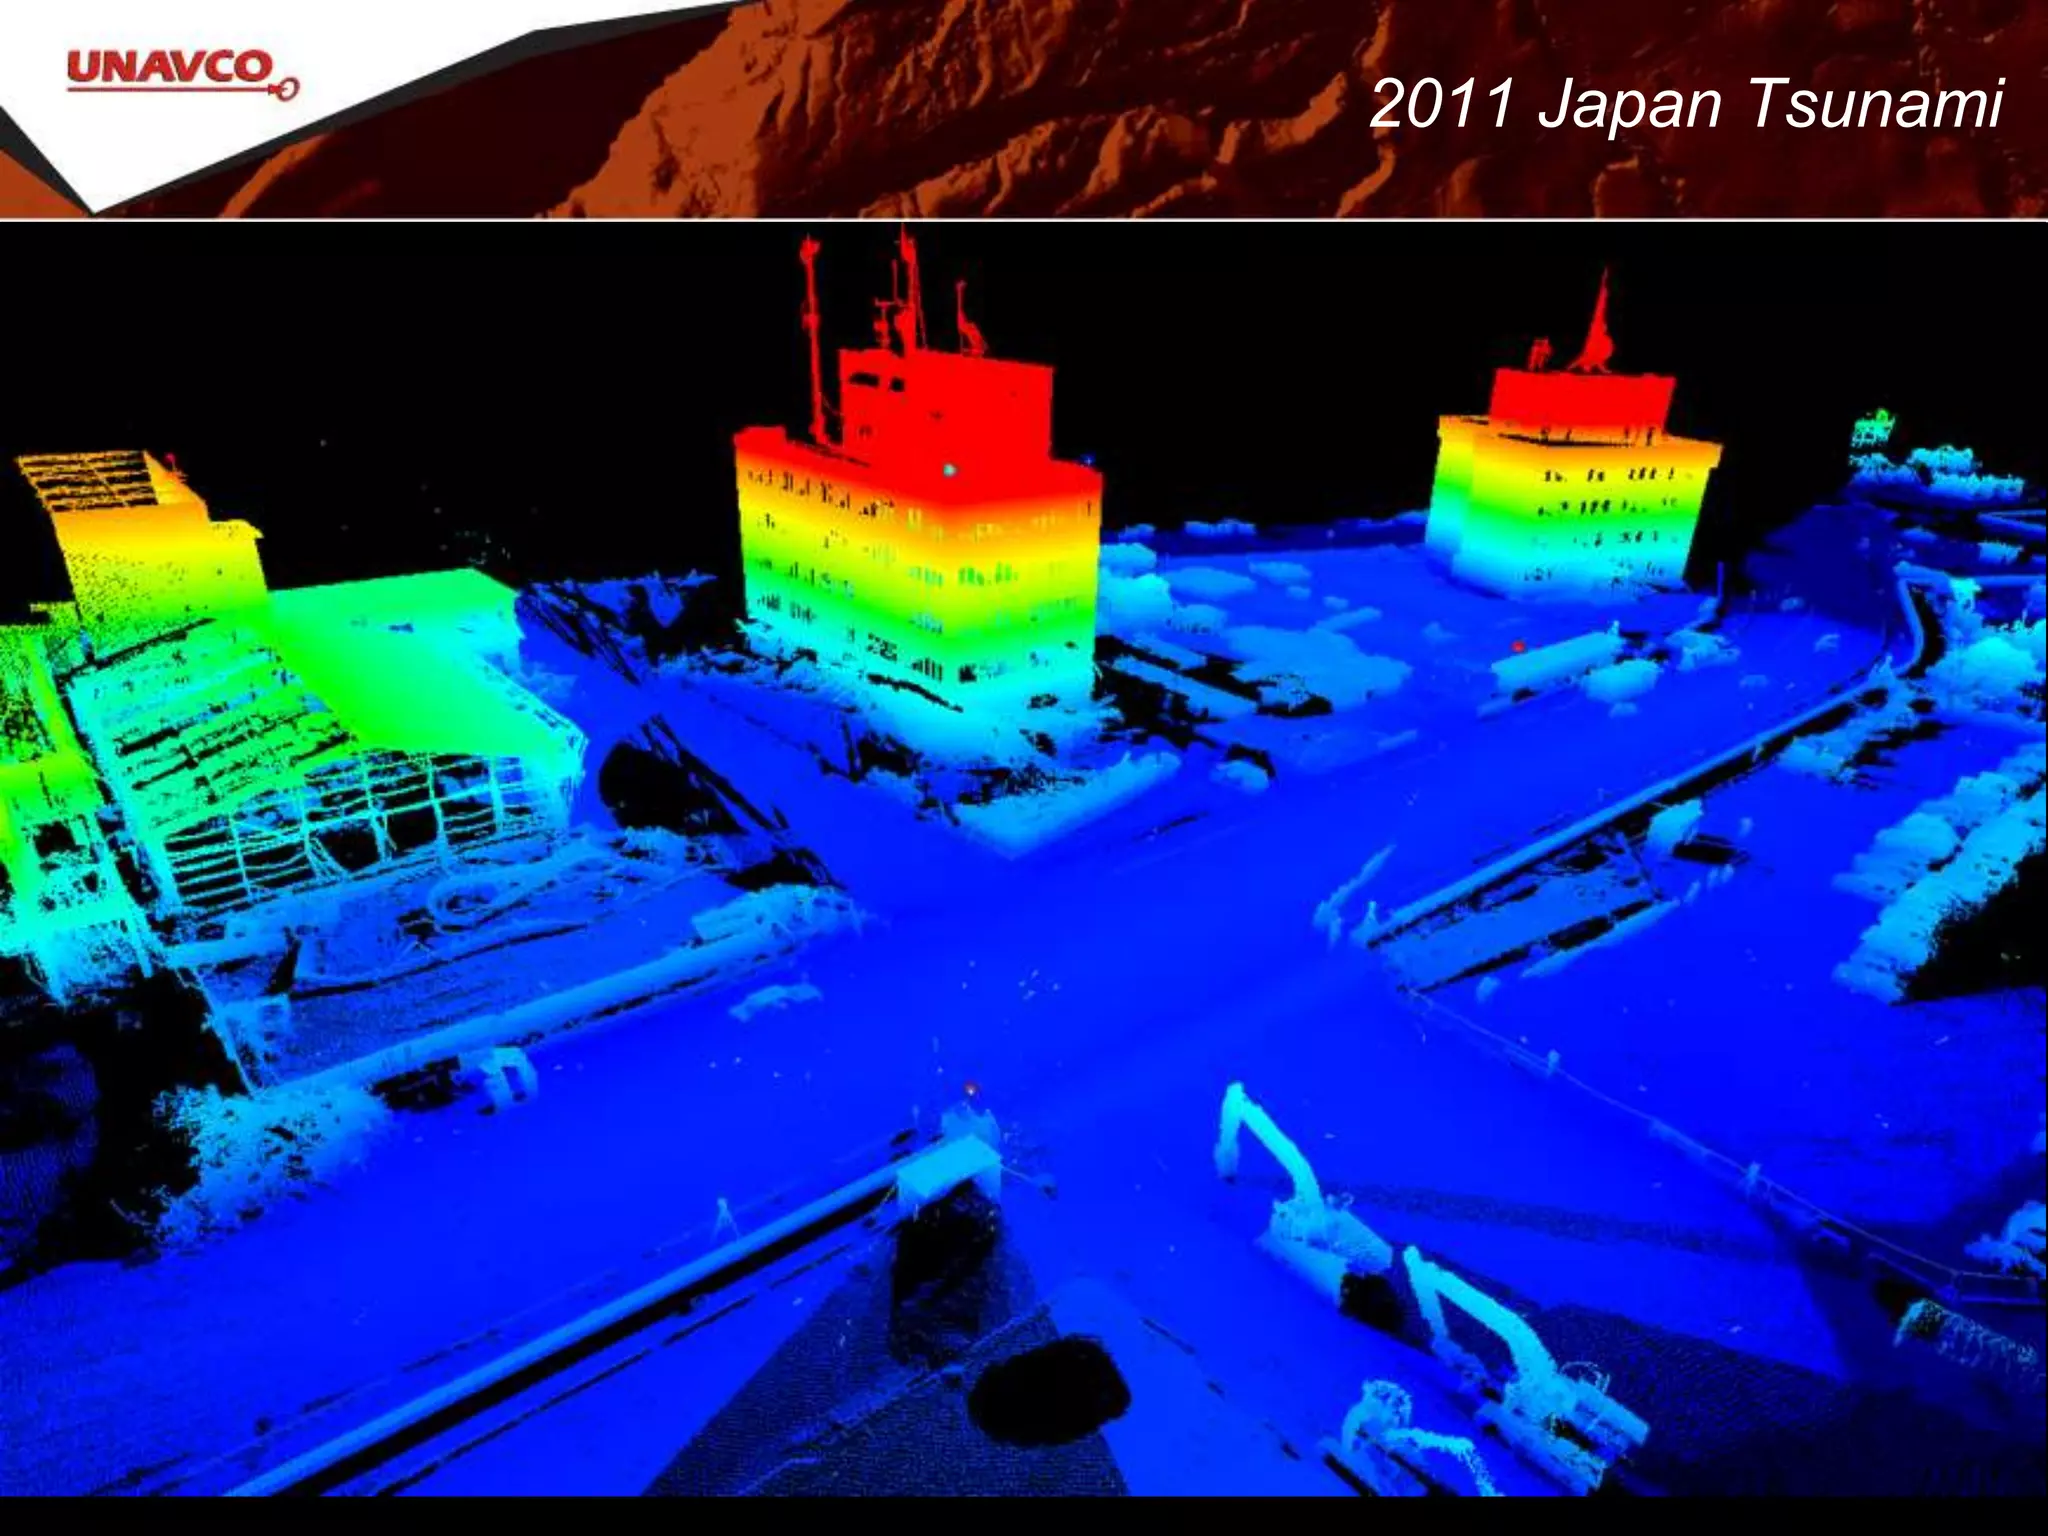
#28 While this slide shows the resultant scan, projected using the elevation of the data.
Images: UNAVCO
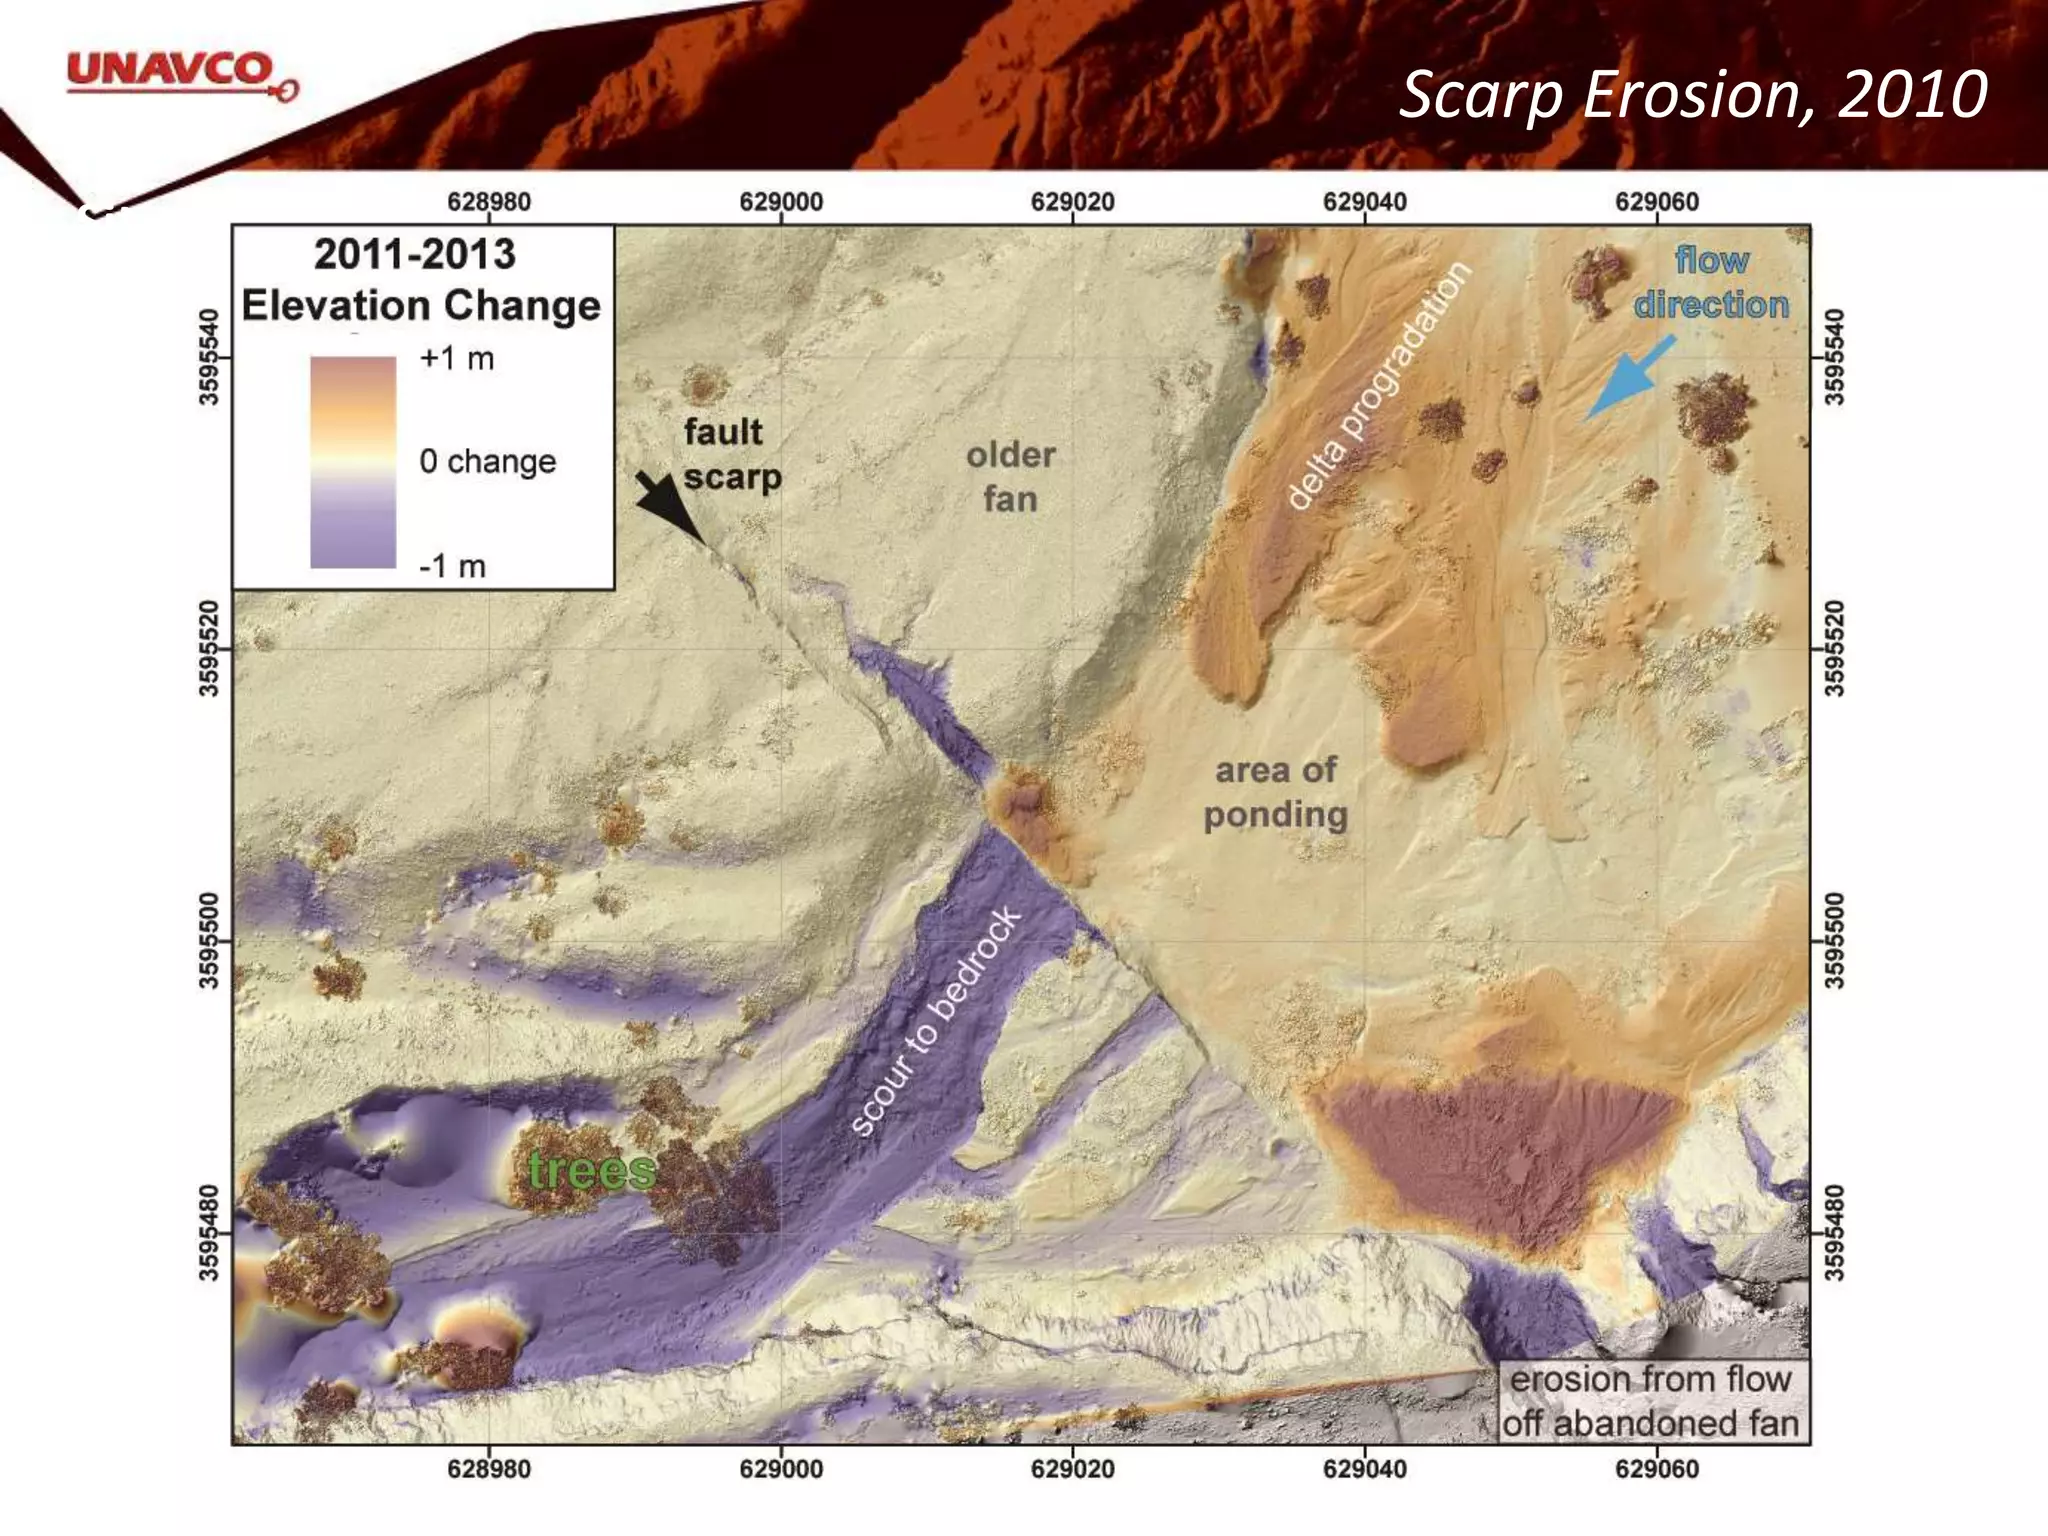
#29 Fault scarps also erode with time, as shown by this study analyzing the elevation change on one fault scarp.
Image: Austin Elliot
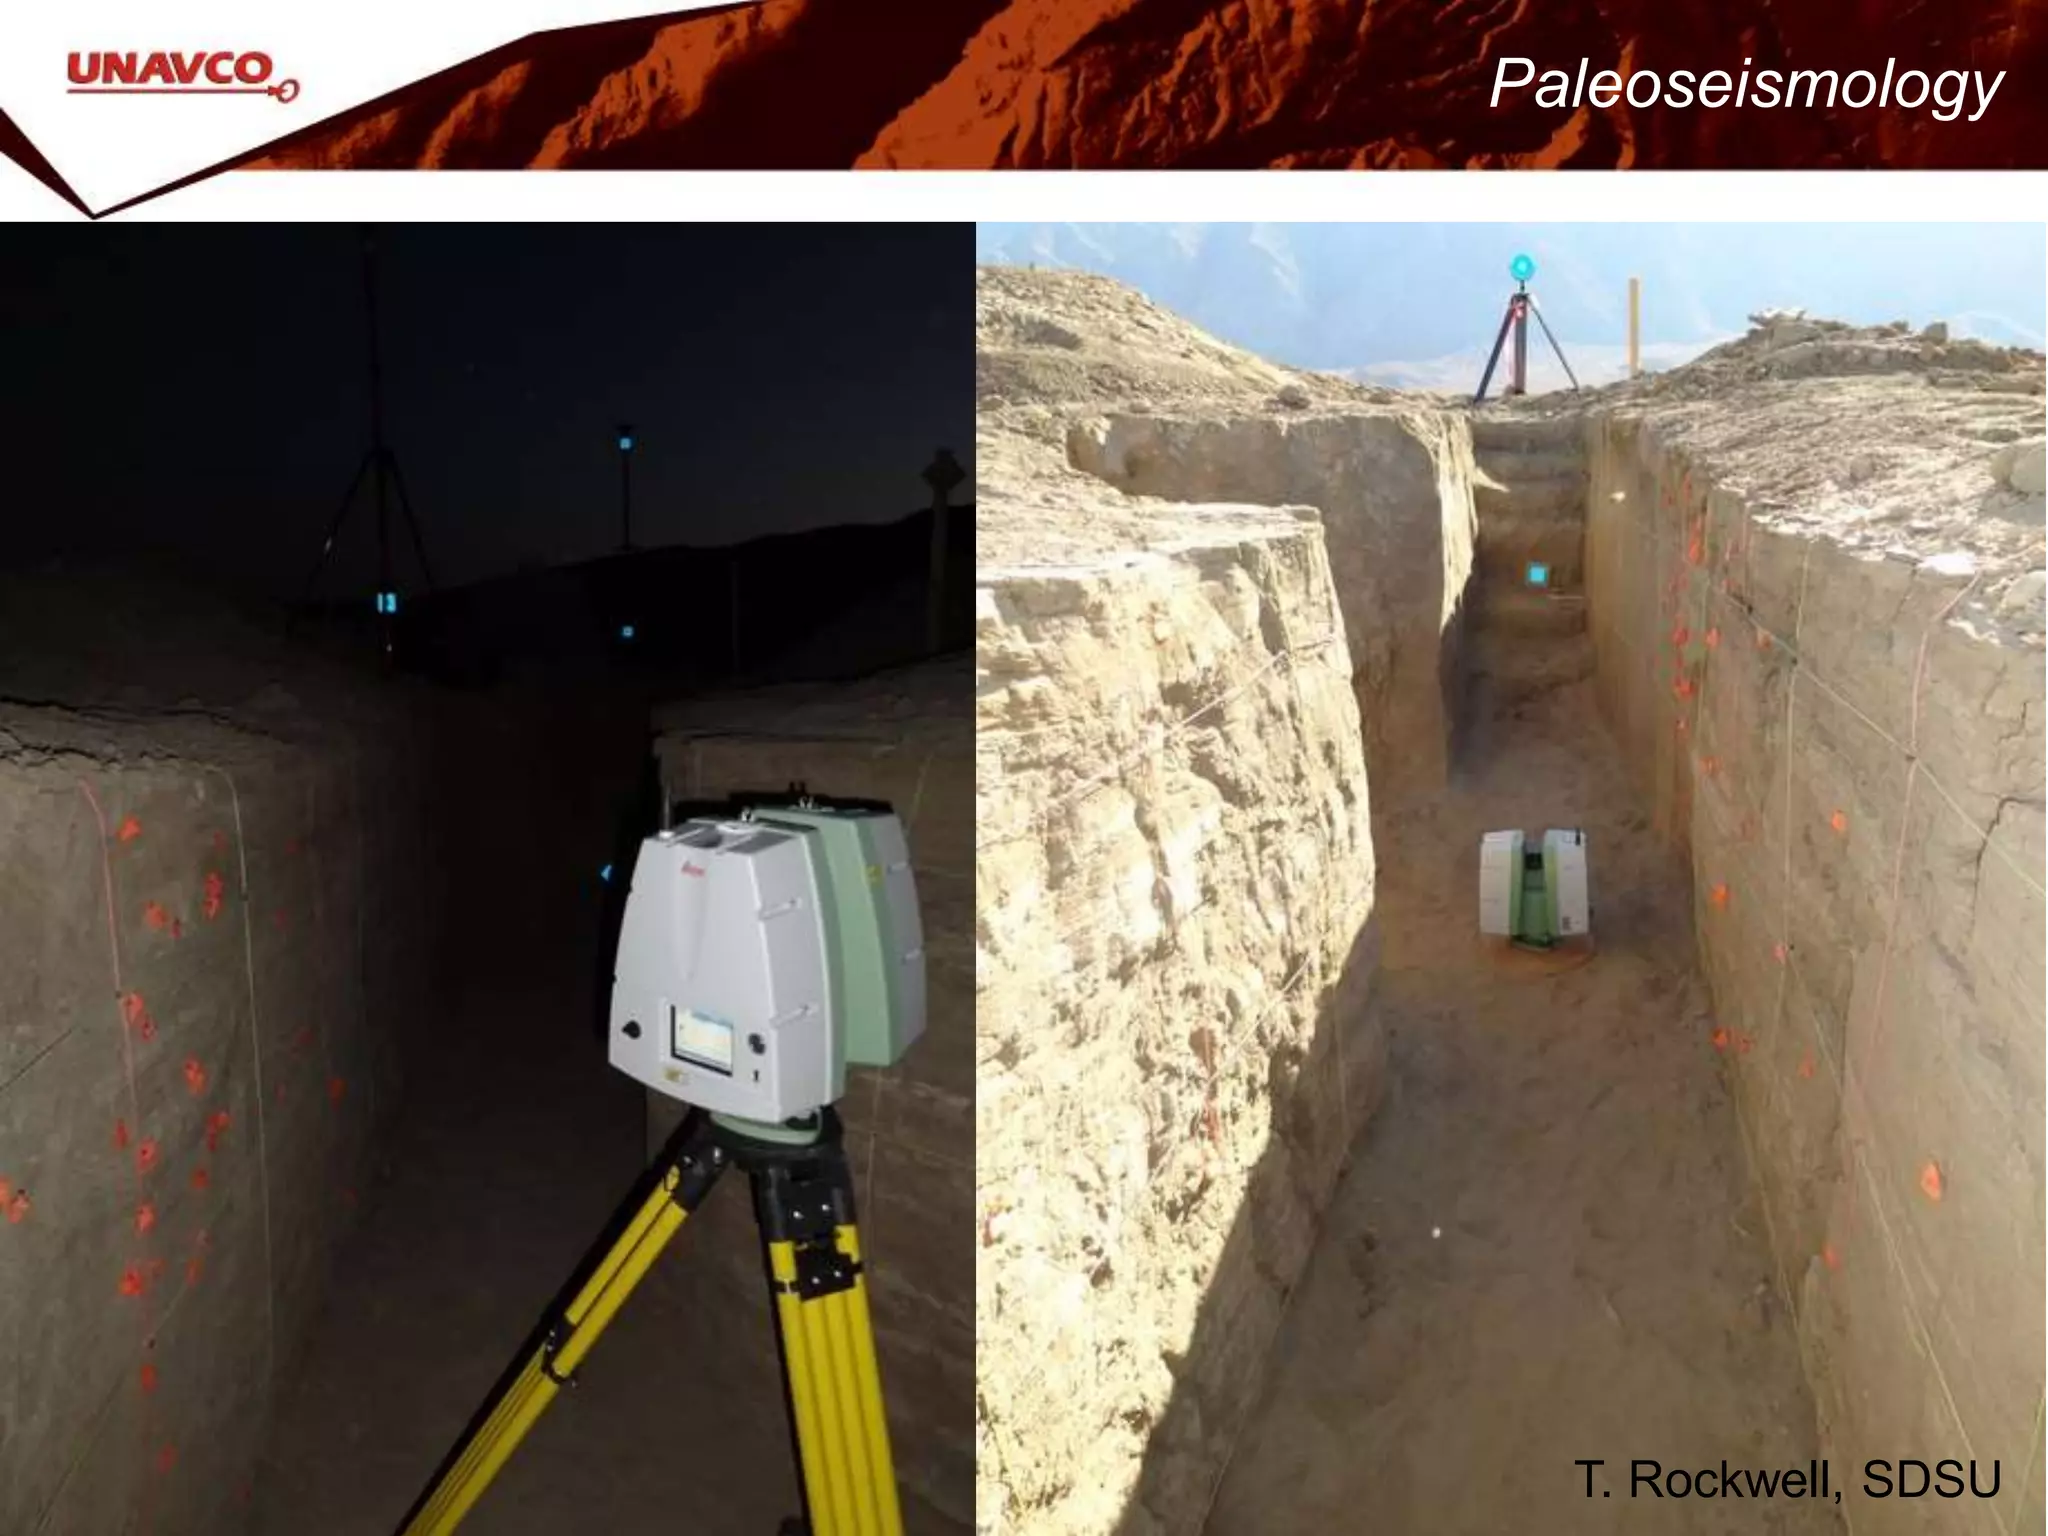
#30 Paleoseismologists dig trenches into fault scarps to track the number of events that have occurred on that fault and their relative age to calculate recurrence intervals and do other analyses. TLS allows researchers to record the trench, because trenches usually stay open for a short time interval.
#31 Precariously balanced rocks are used in paleoseismology to help constrain the ground shaking during past events, as the rocks would fall if the shaking reached a certain level. TLS helps researchers create accurate models based on the 3D scan of the PBR.
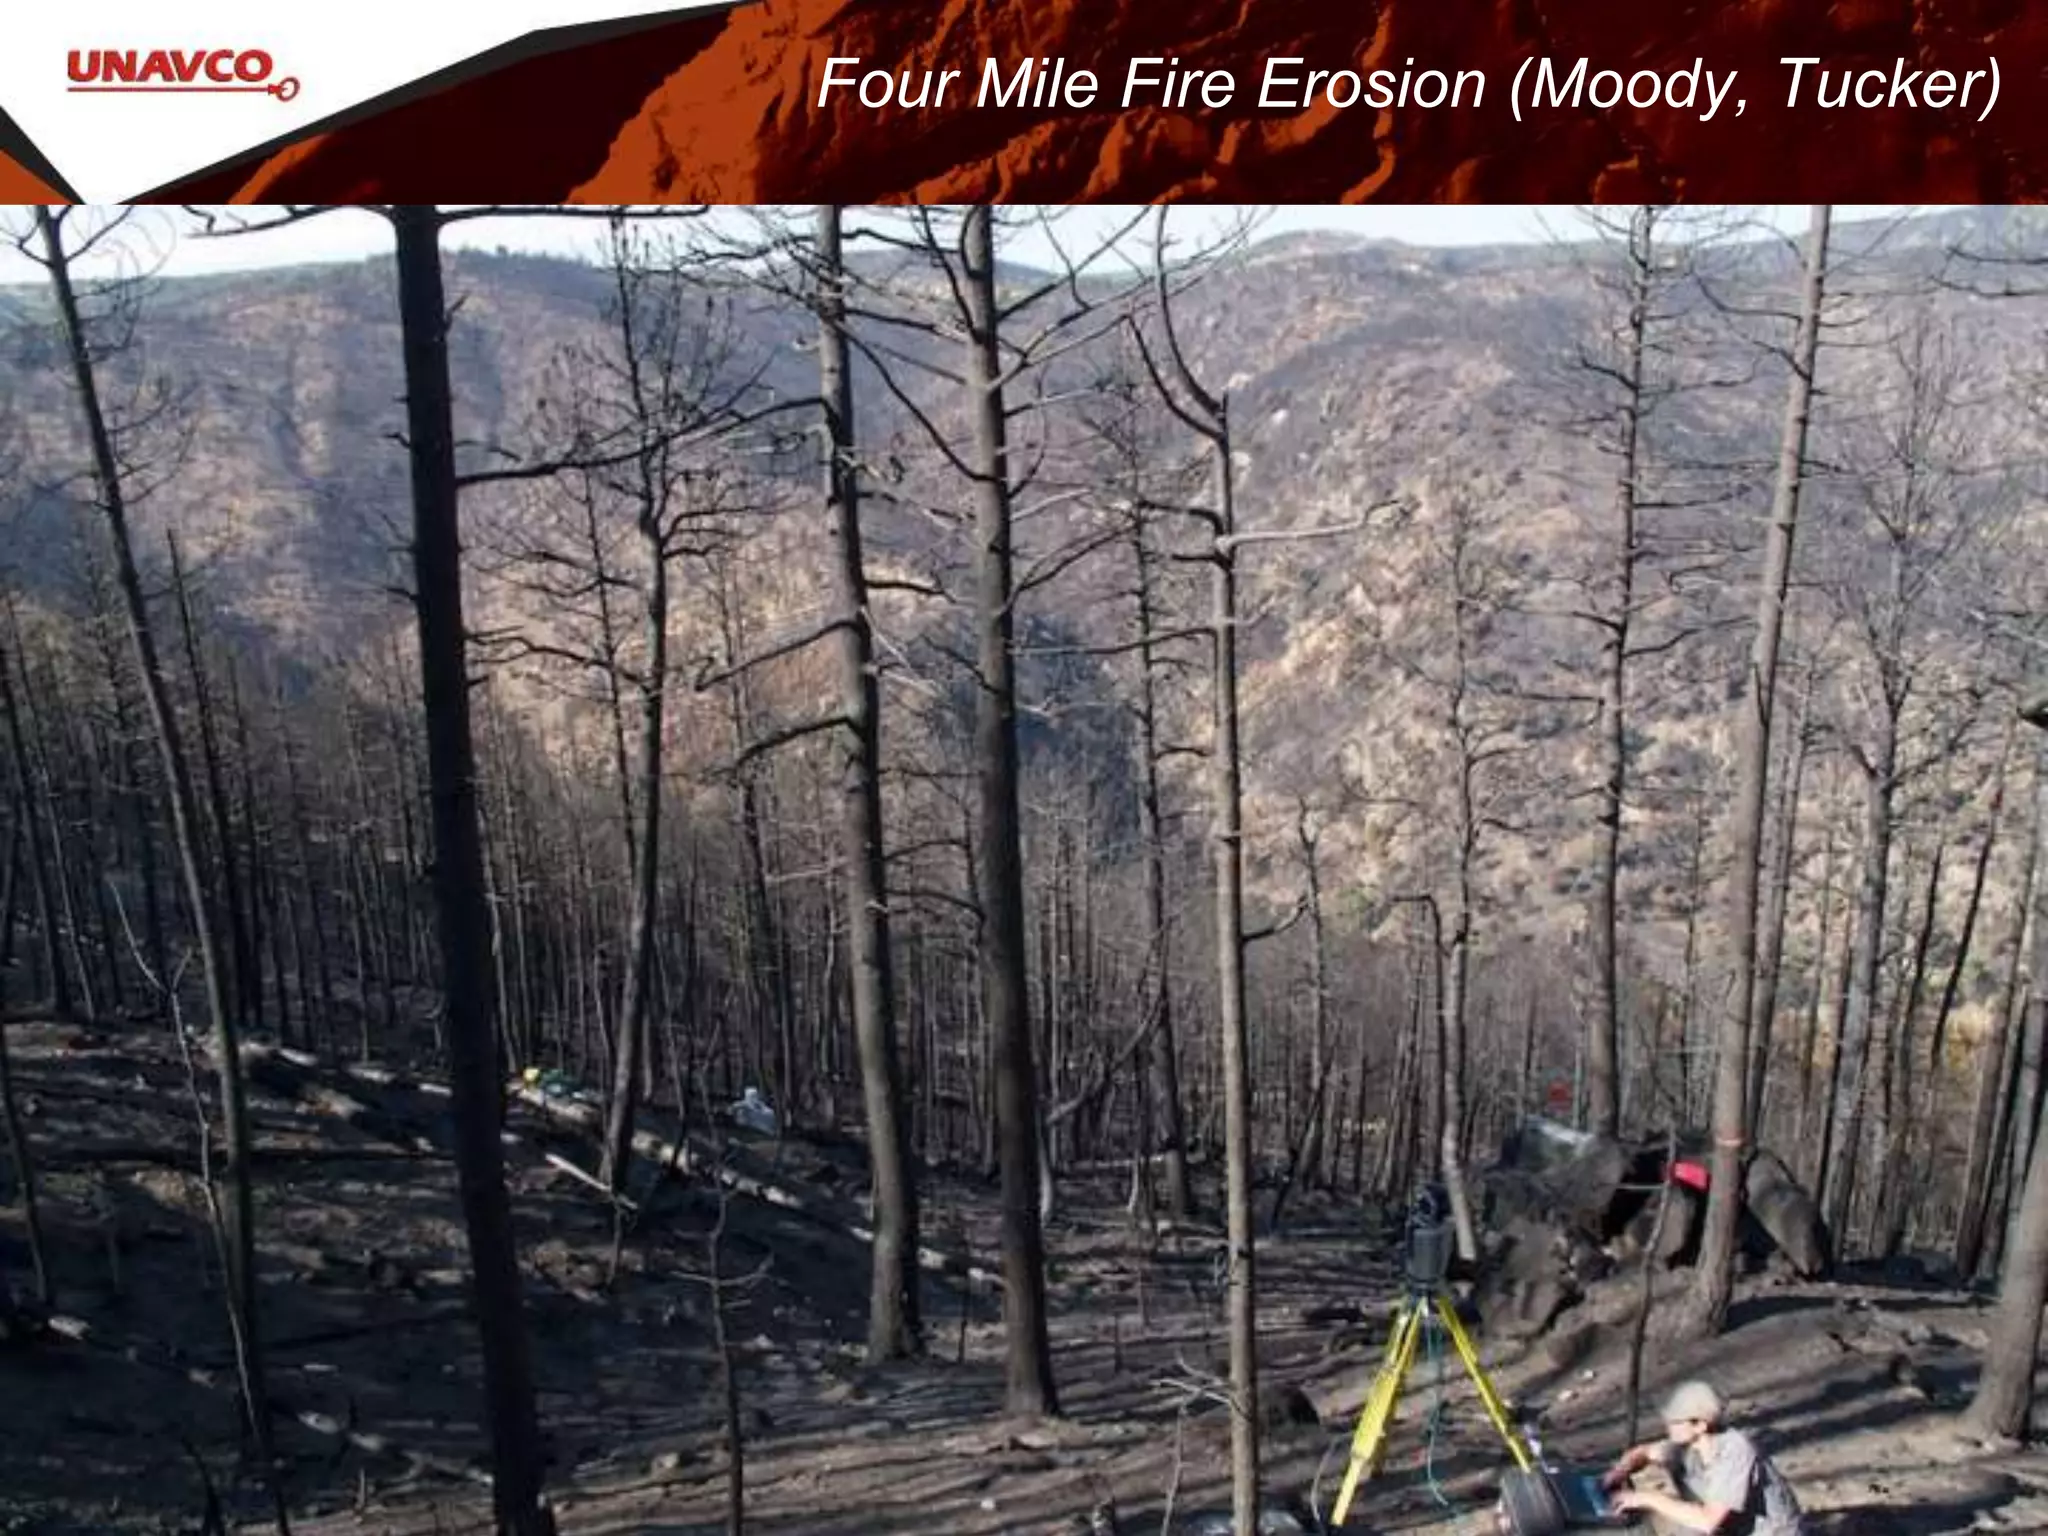
#32 Geomorphologists also use TLS. In this example, researchers studied the erosion related to the four mile fire.
Image: UNAVCO
#33 TLS is extremely useful for a variety of applications in polar research settings. UNAVCO works on 10–15 of these projects a year, and they range from geomorphology to glaciology to biology/ecology to archaeology.
Images: UNAVCO
#34 One example of a polar TLS project is Mount Erebus, Antarctica. Scans show the thermal and energy budget of the volcano.
Images: UNAVCO
#35 Another example is seal body mass, used as an analog for availability of marine food resources. (How does the seal stay still? Is this done just on dead seals?)
Images: UNAVCO
#36 In non-polar settings, Lidar has been used to record dinosaur footprints.
Images: UNAVCO
#37 Another application of TLS is outside of the field of geoscience: forestry researchers also use TLS to scan their area of interest and then measure features like the volume of the tree trunk after returning to the lab.
#38 An example of forestry work on the Everglades biomass. Emmanuel Luciano
#39 Finally, we use TLS to teach students like you about geodesy!