The document summarized Andrea Capolei's presentation on designing and implementing effective logging strategies at the 2nd Cosenza MuleSoft Meetup. Some key points from the presentation include:
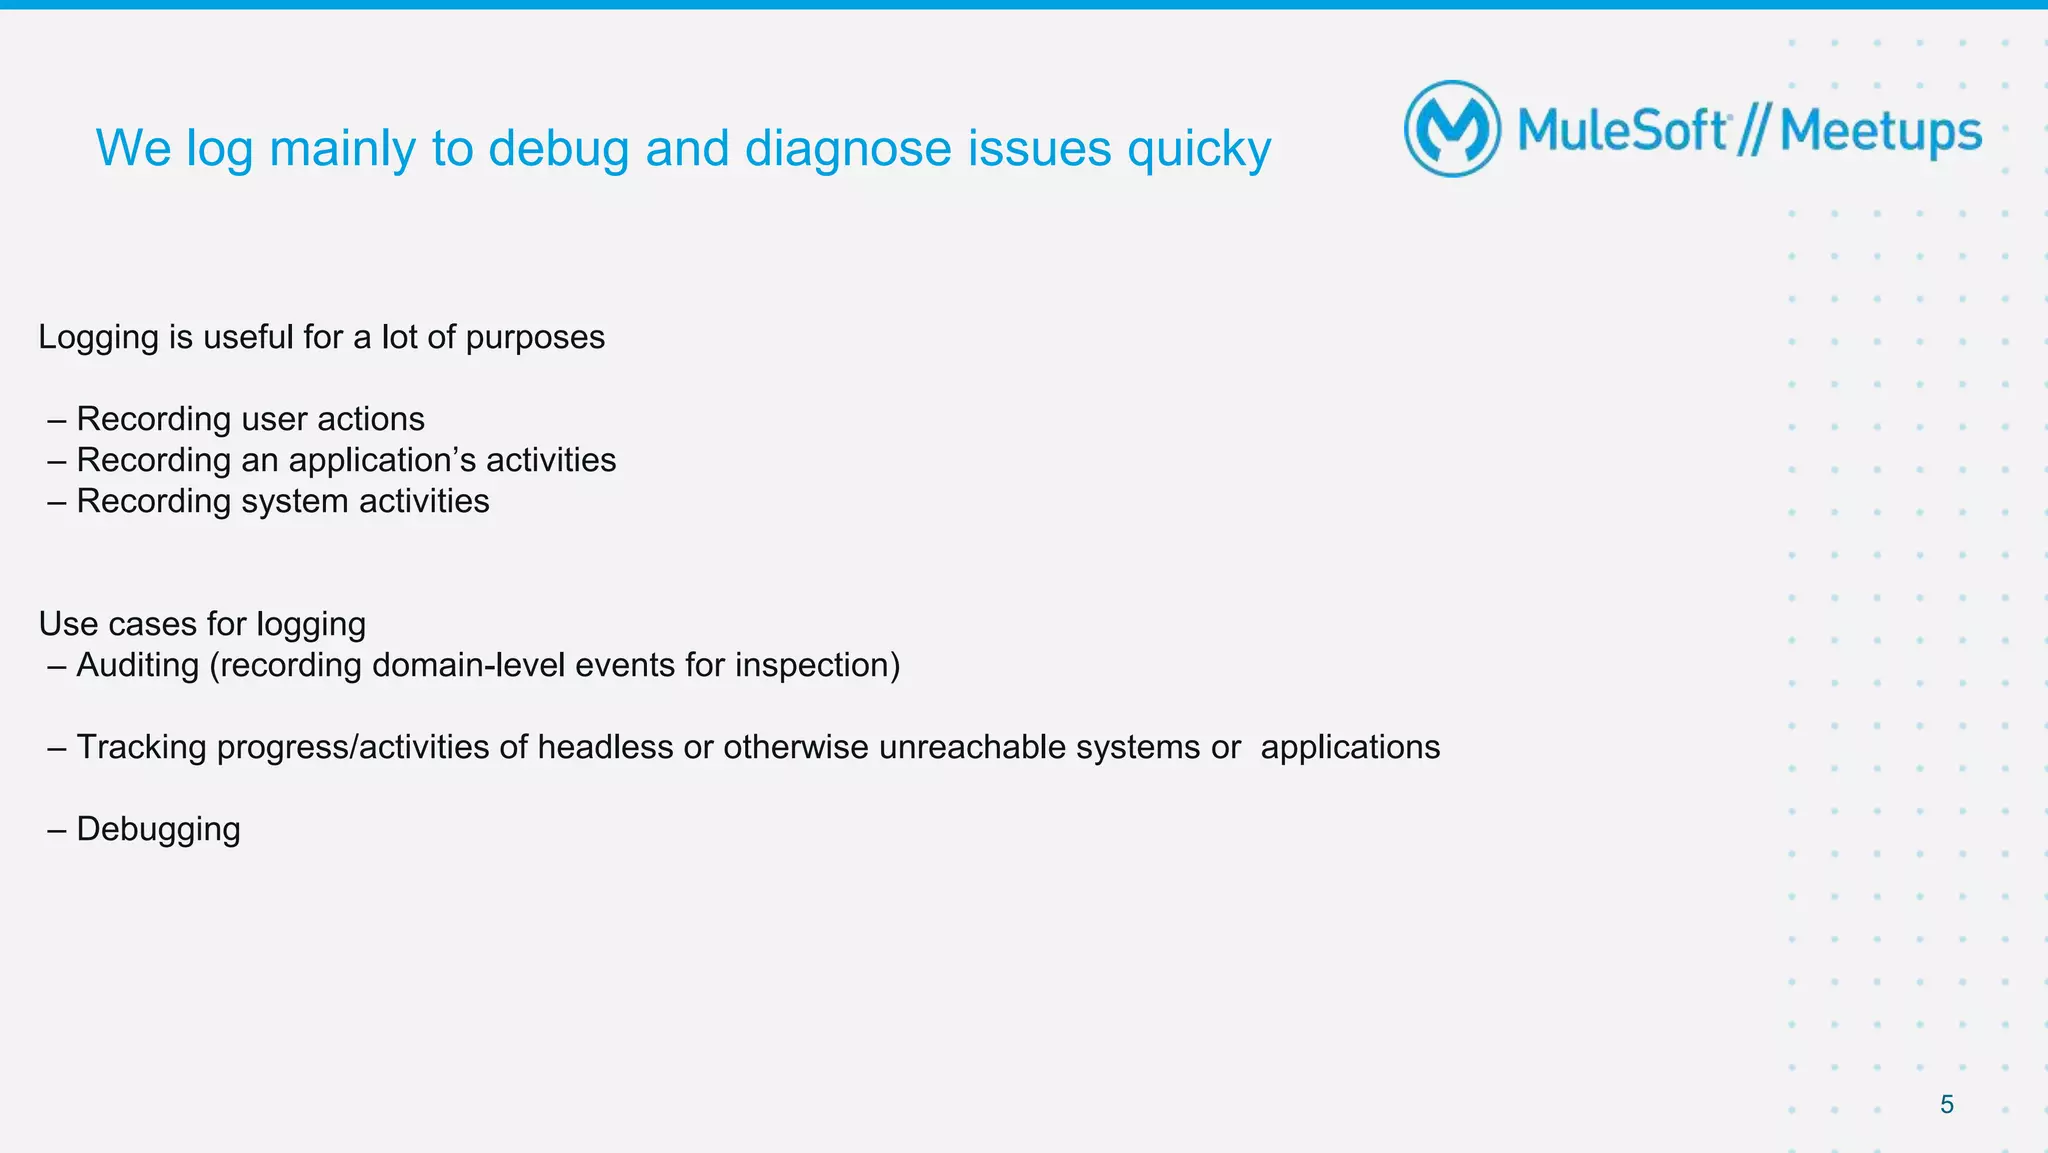
- The importance of logging for purposes like auditing, debugging, and tracking system activities.
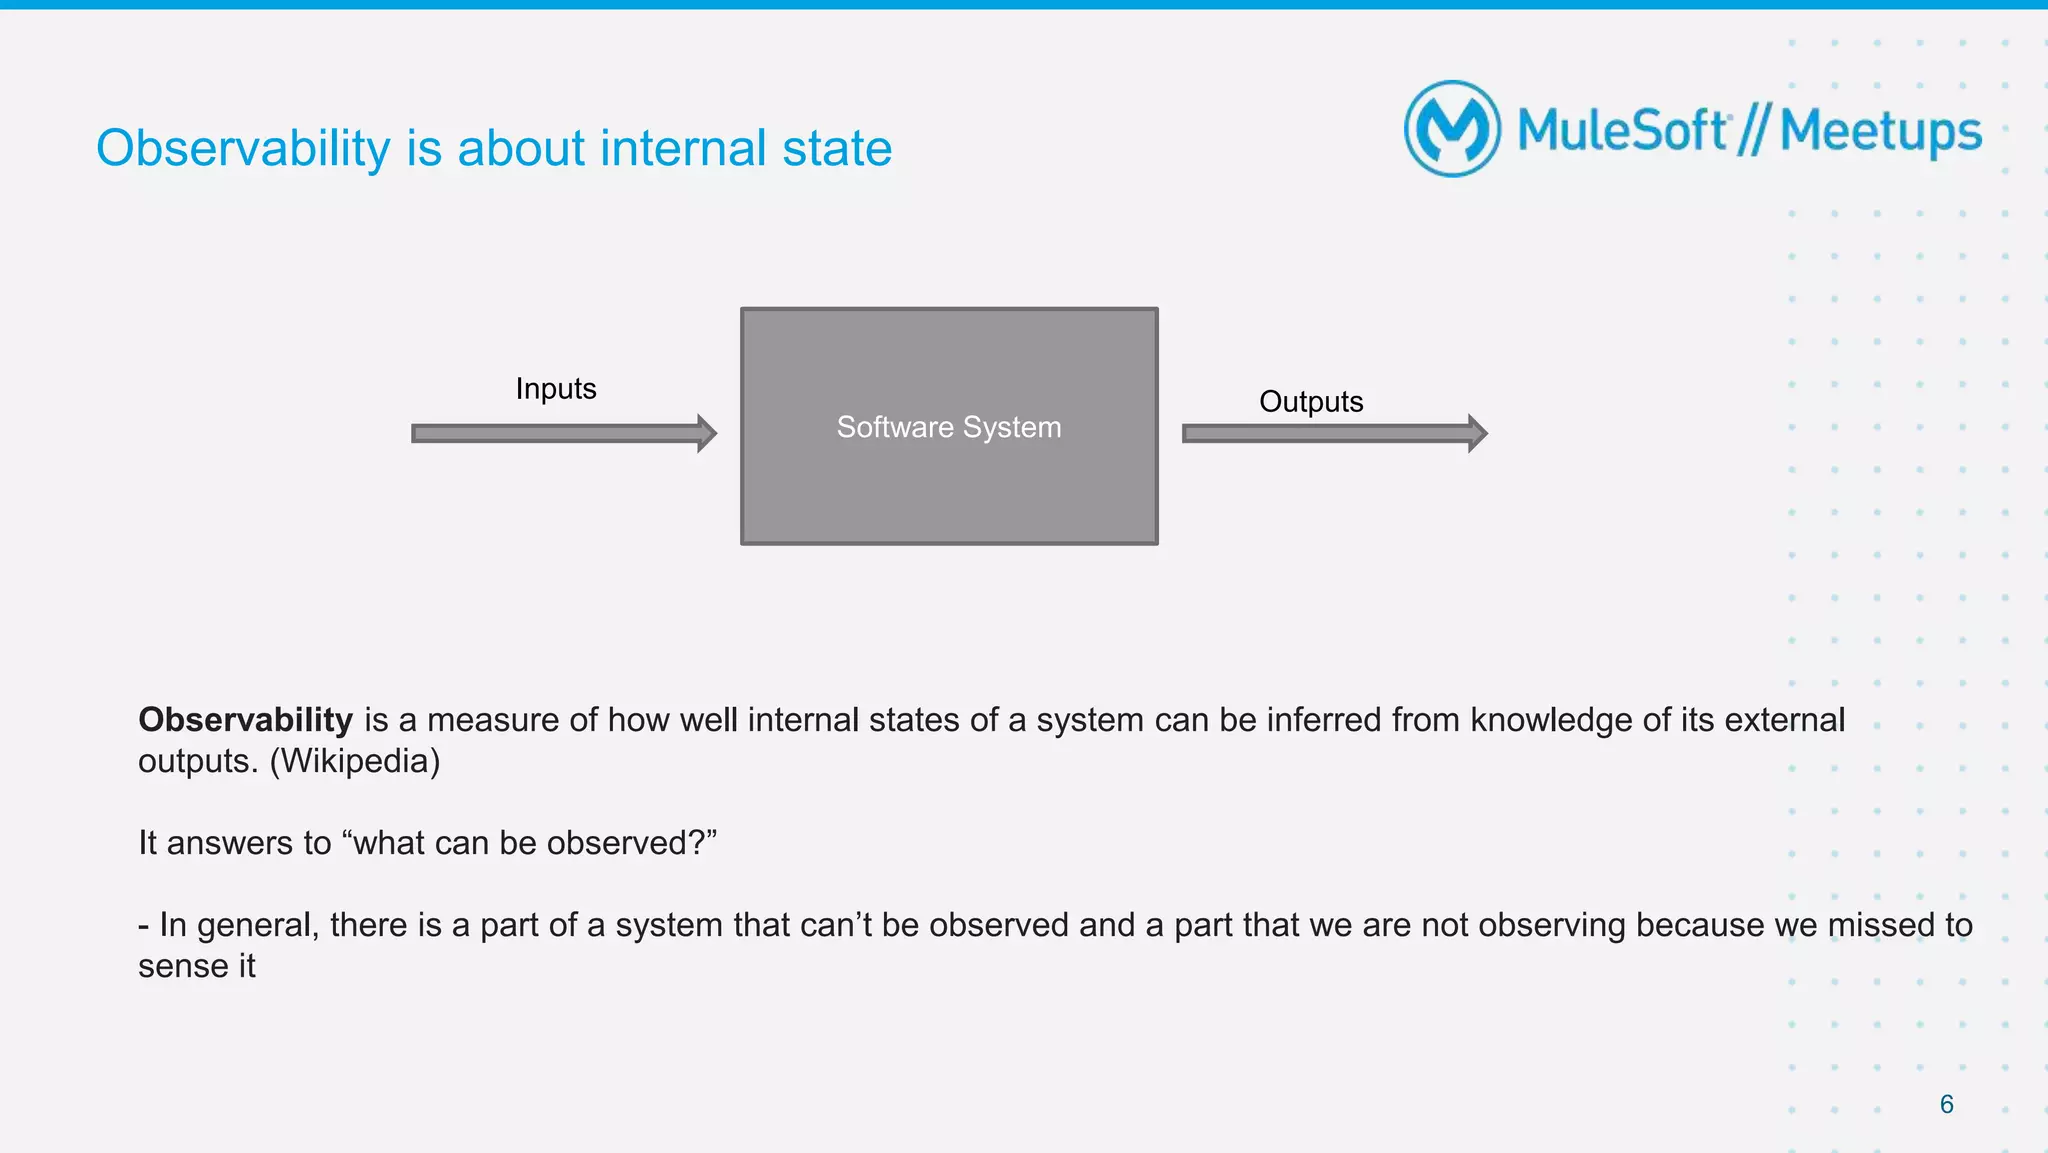
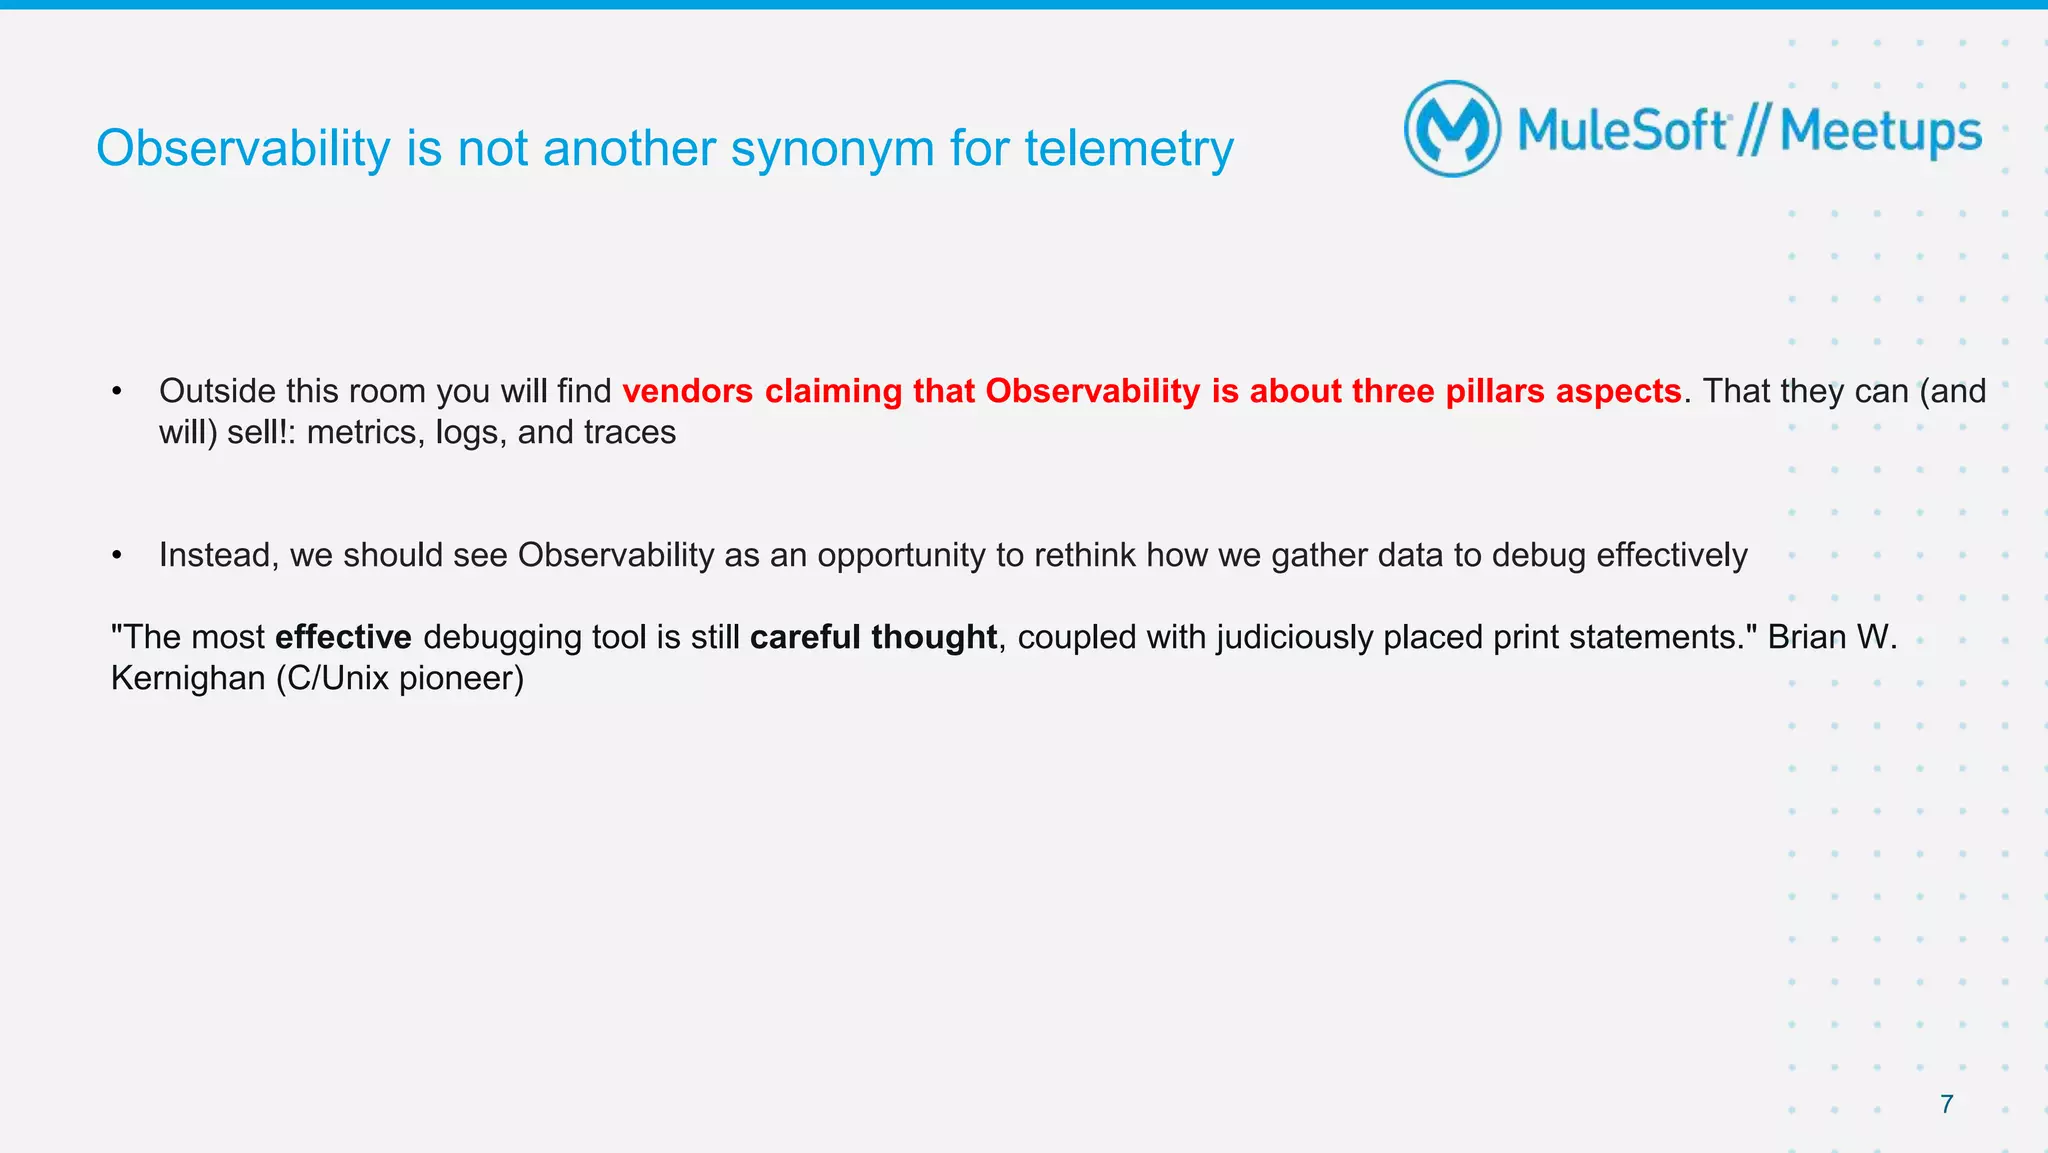
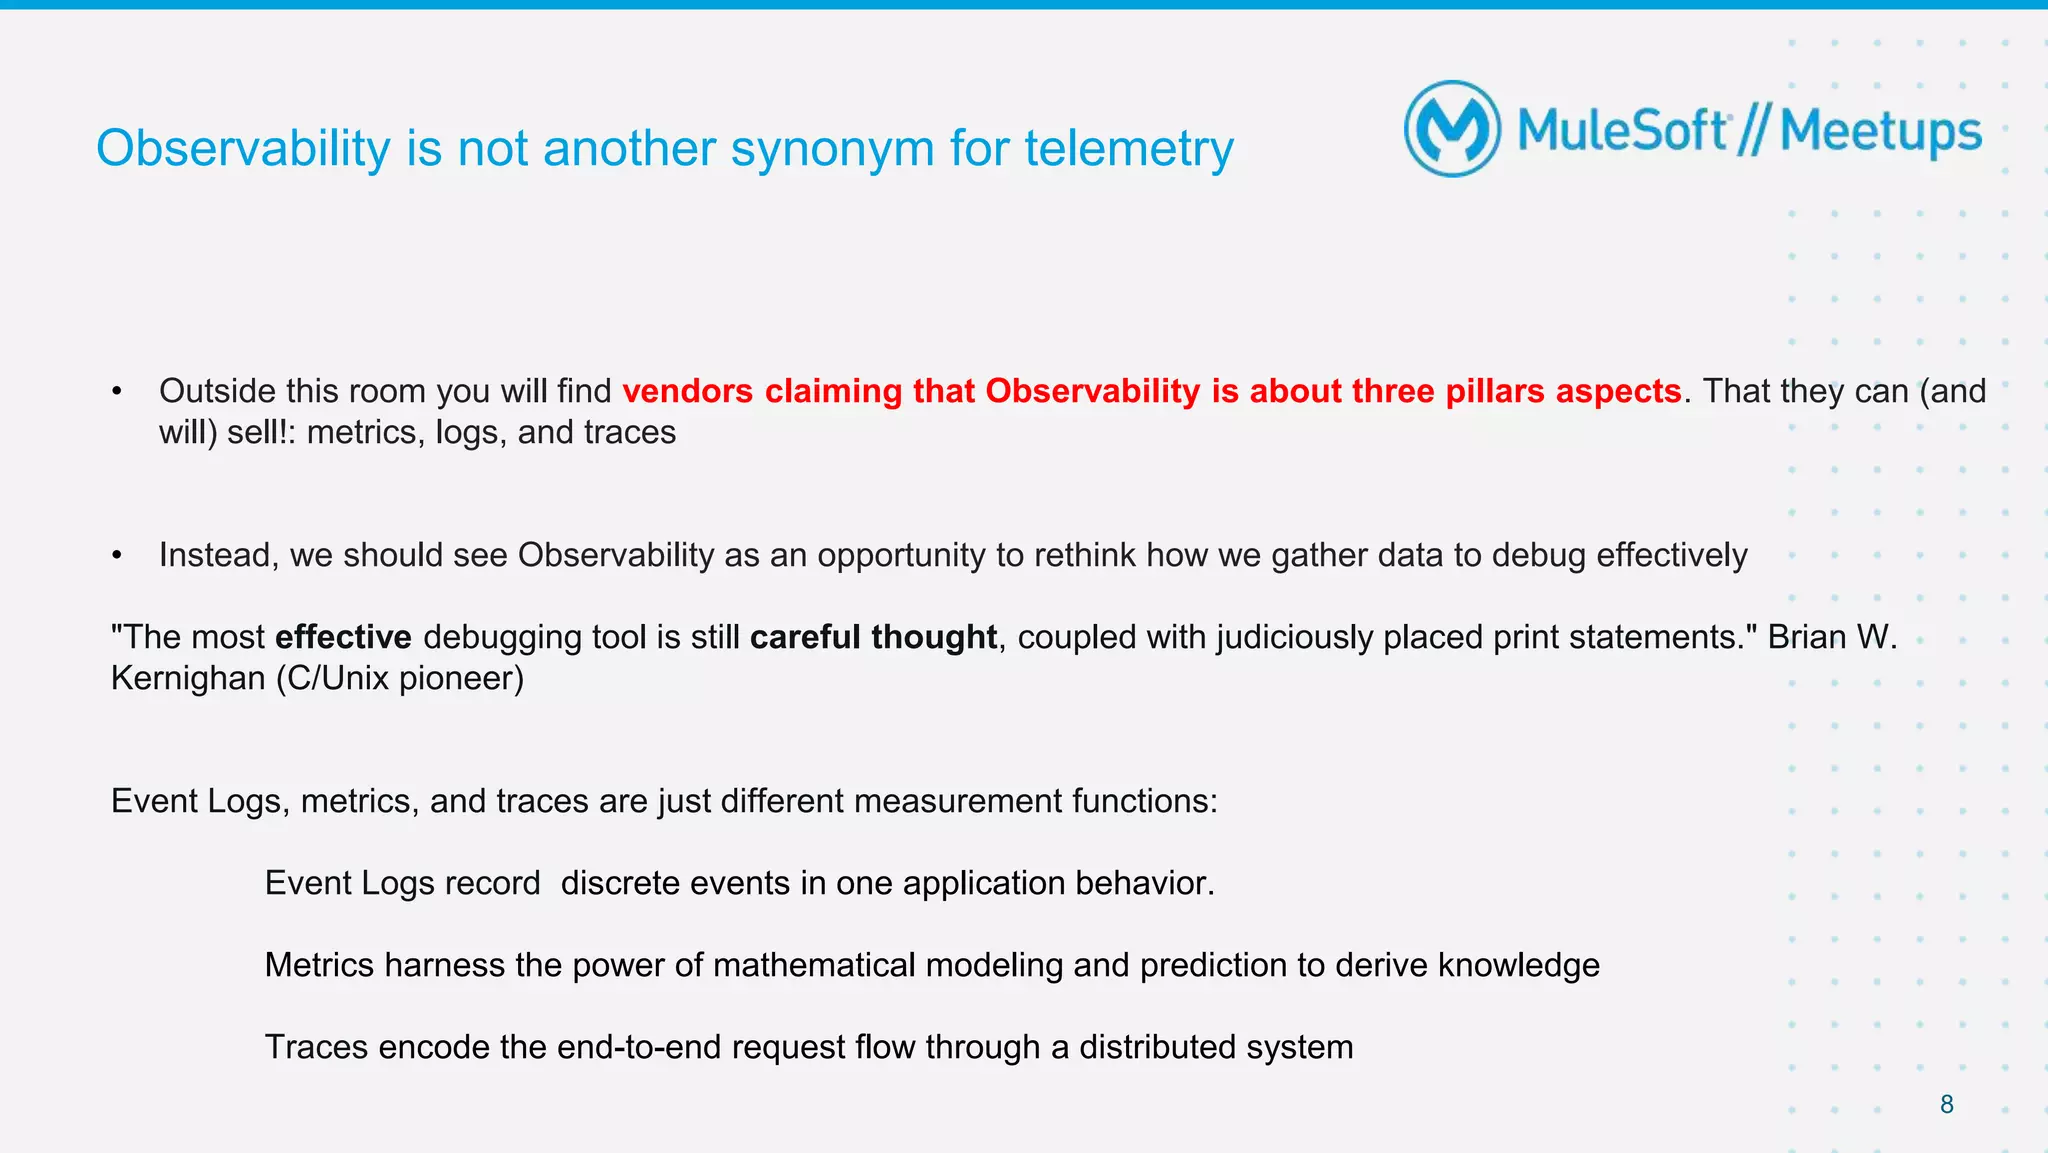
- Observability is about inferring a system's internal state from external outputs, not just telemetry. Careful logging is more effective than metrics and traces alone.
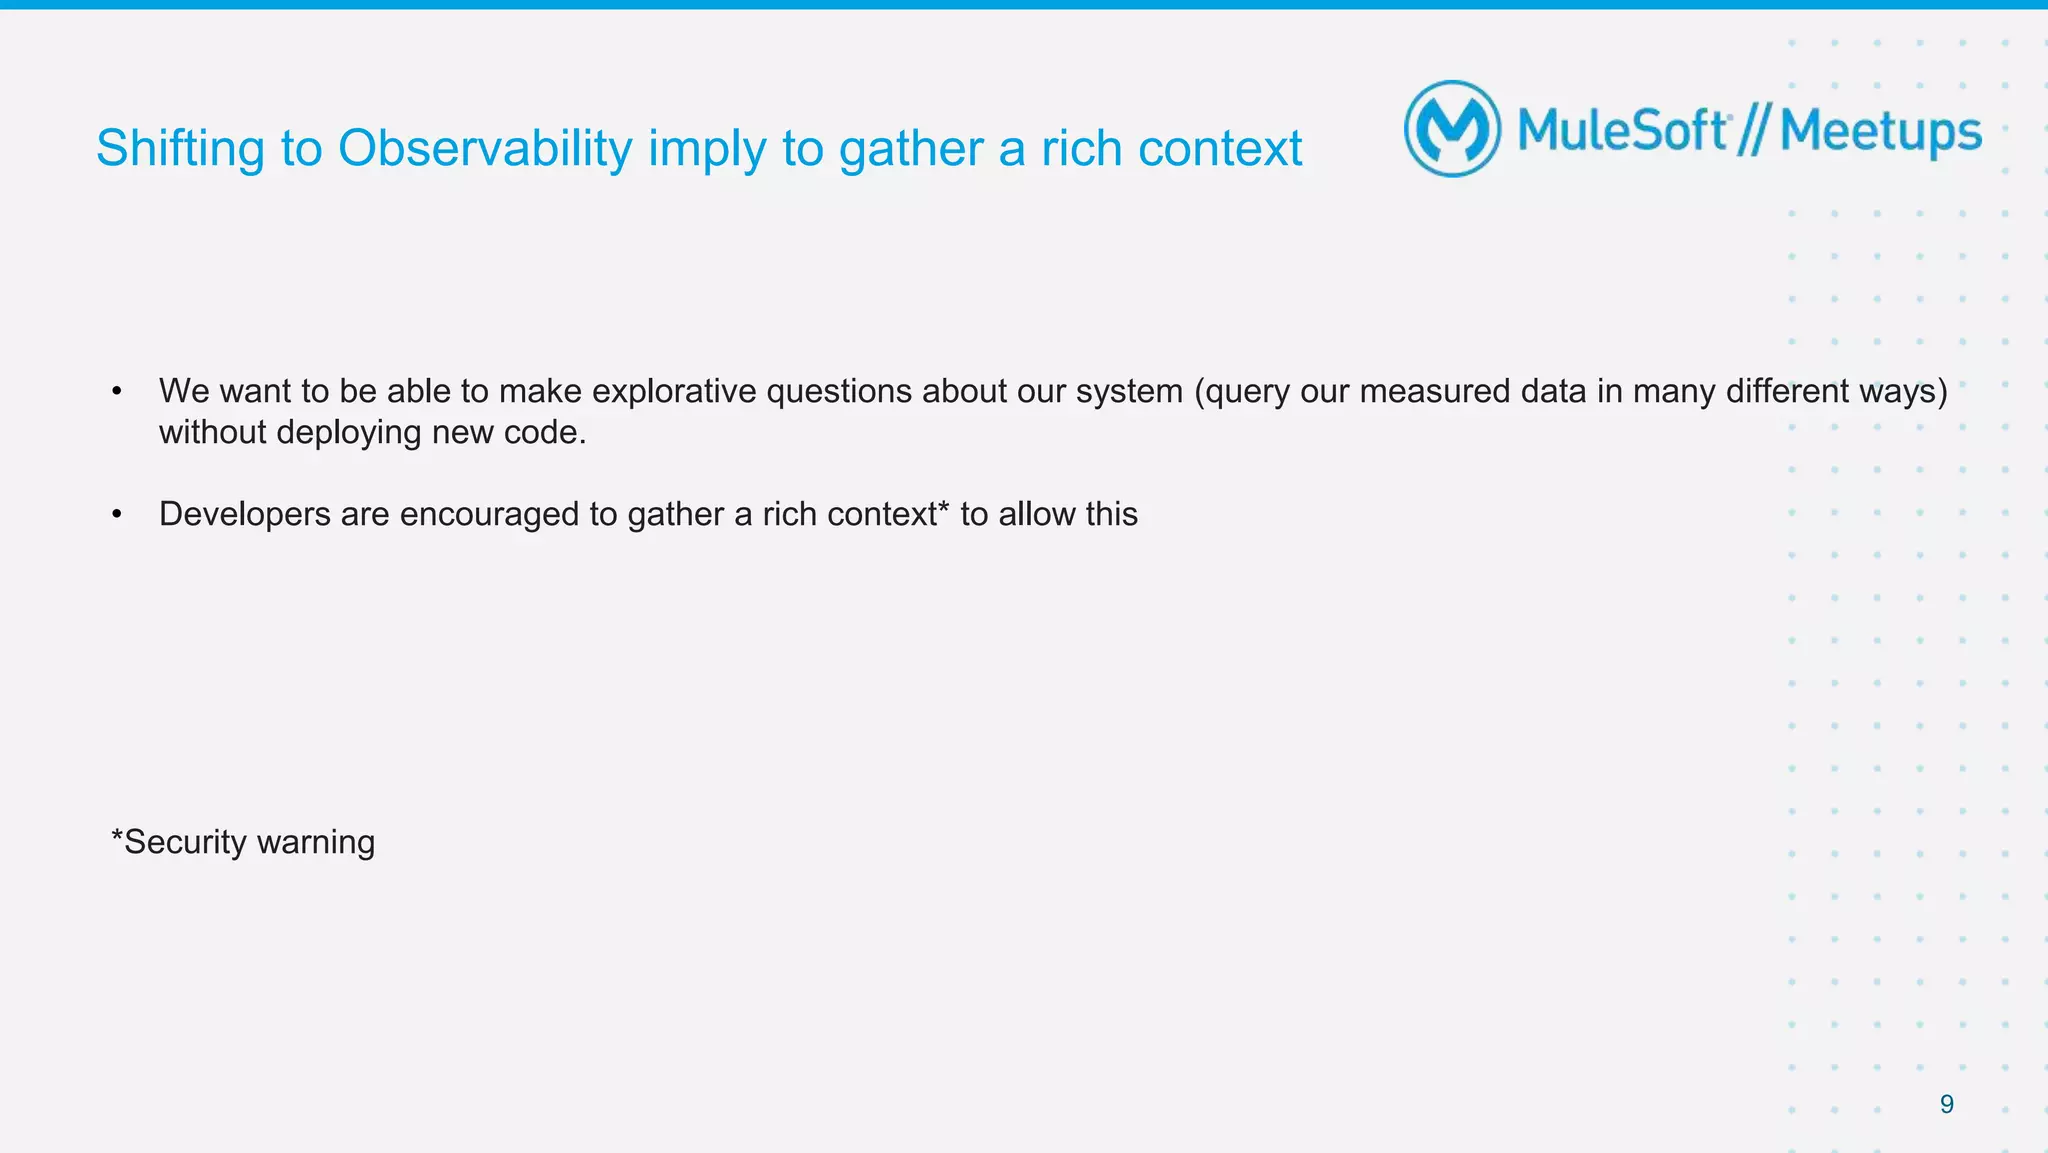
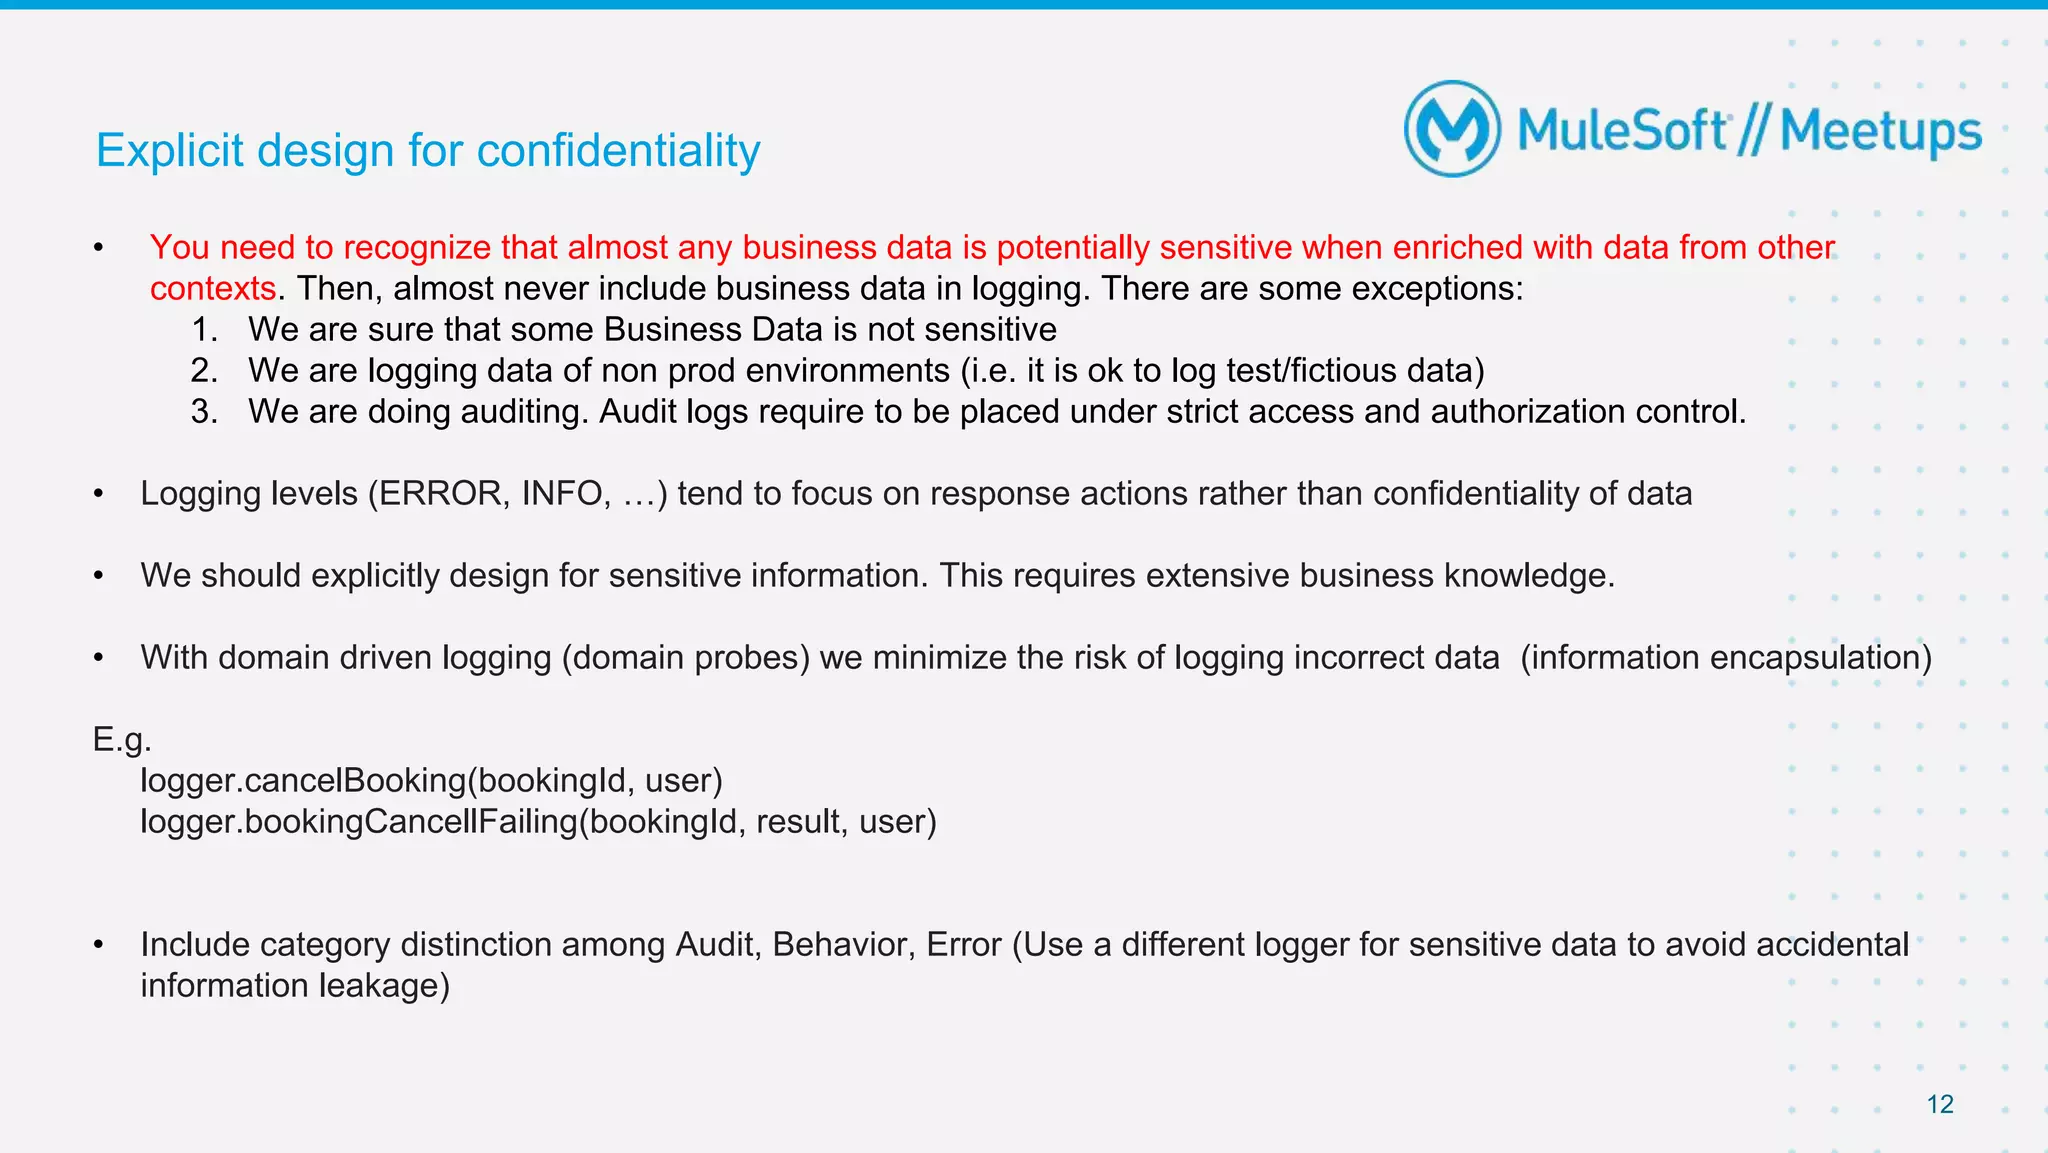
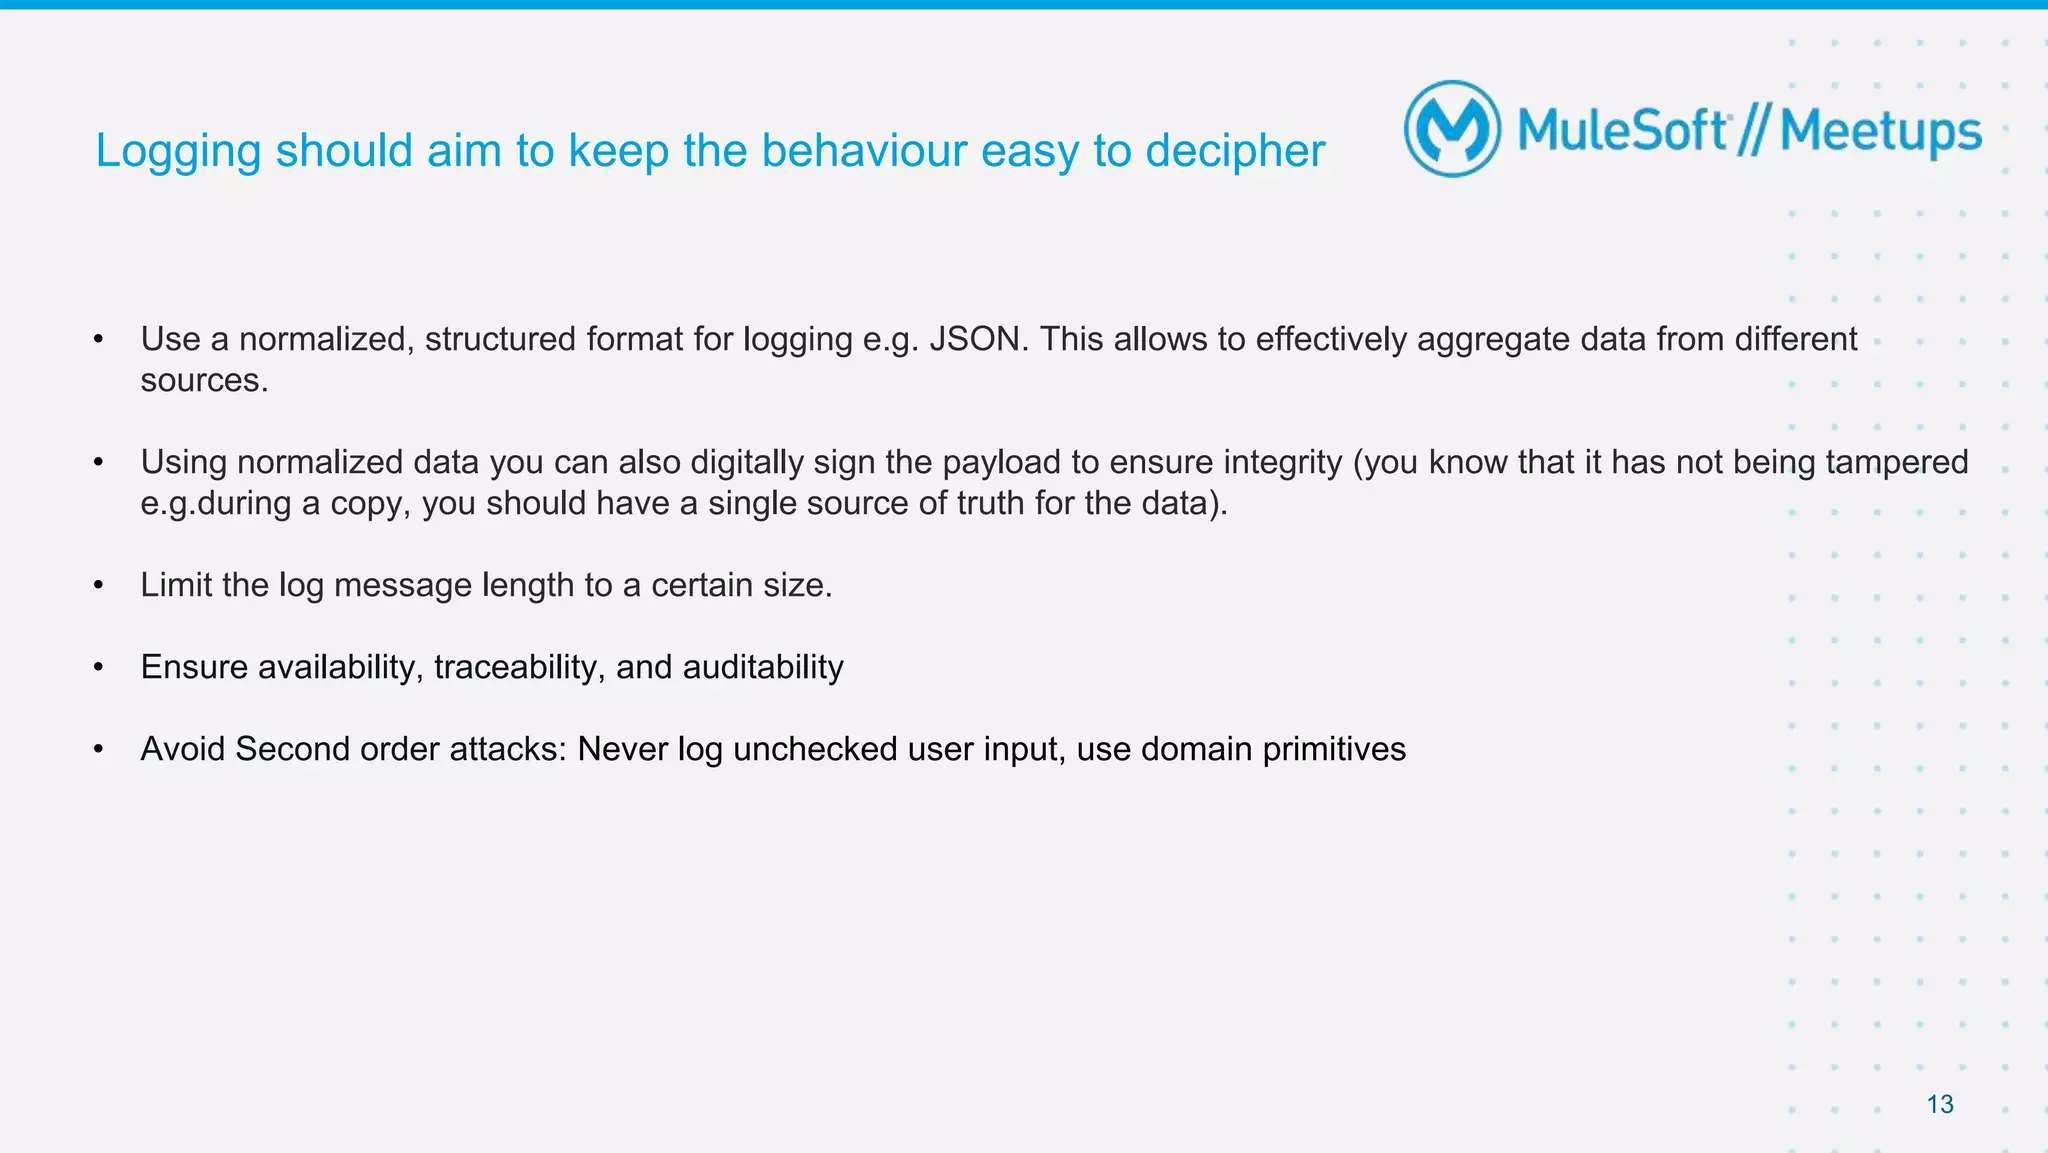
- Logging should aim to provide rich context for exploratory questions without new code. Sensitive data requires explicit design for confidentiality.
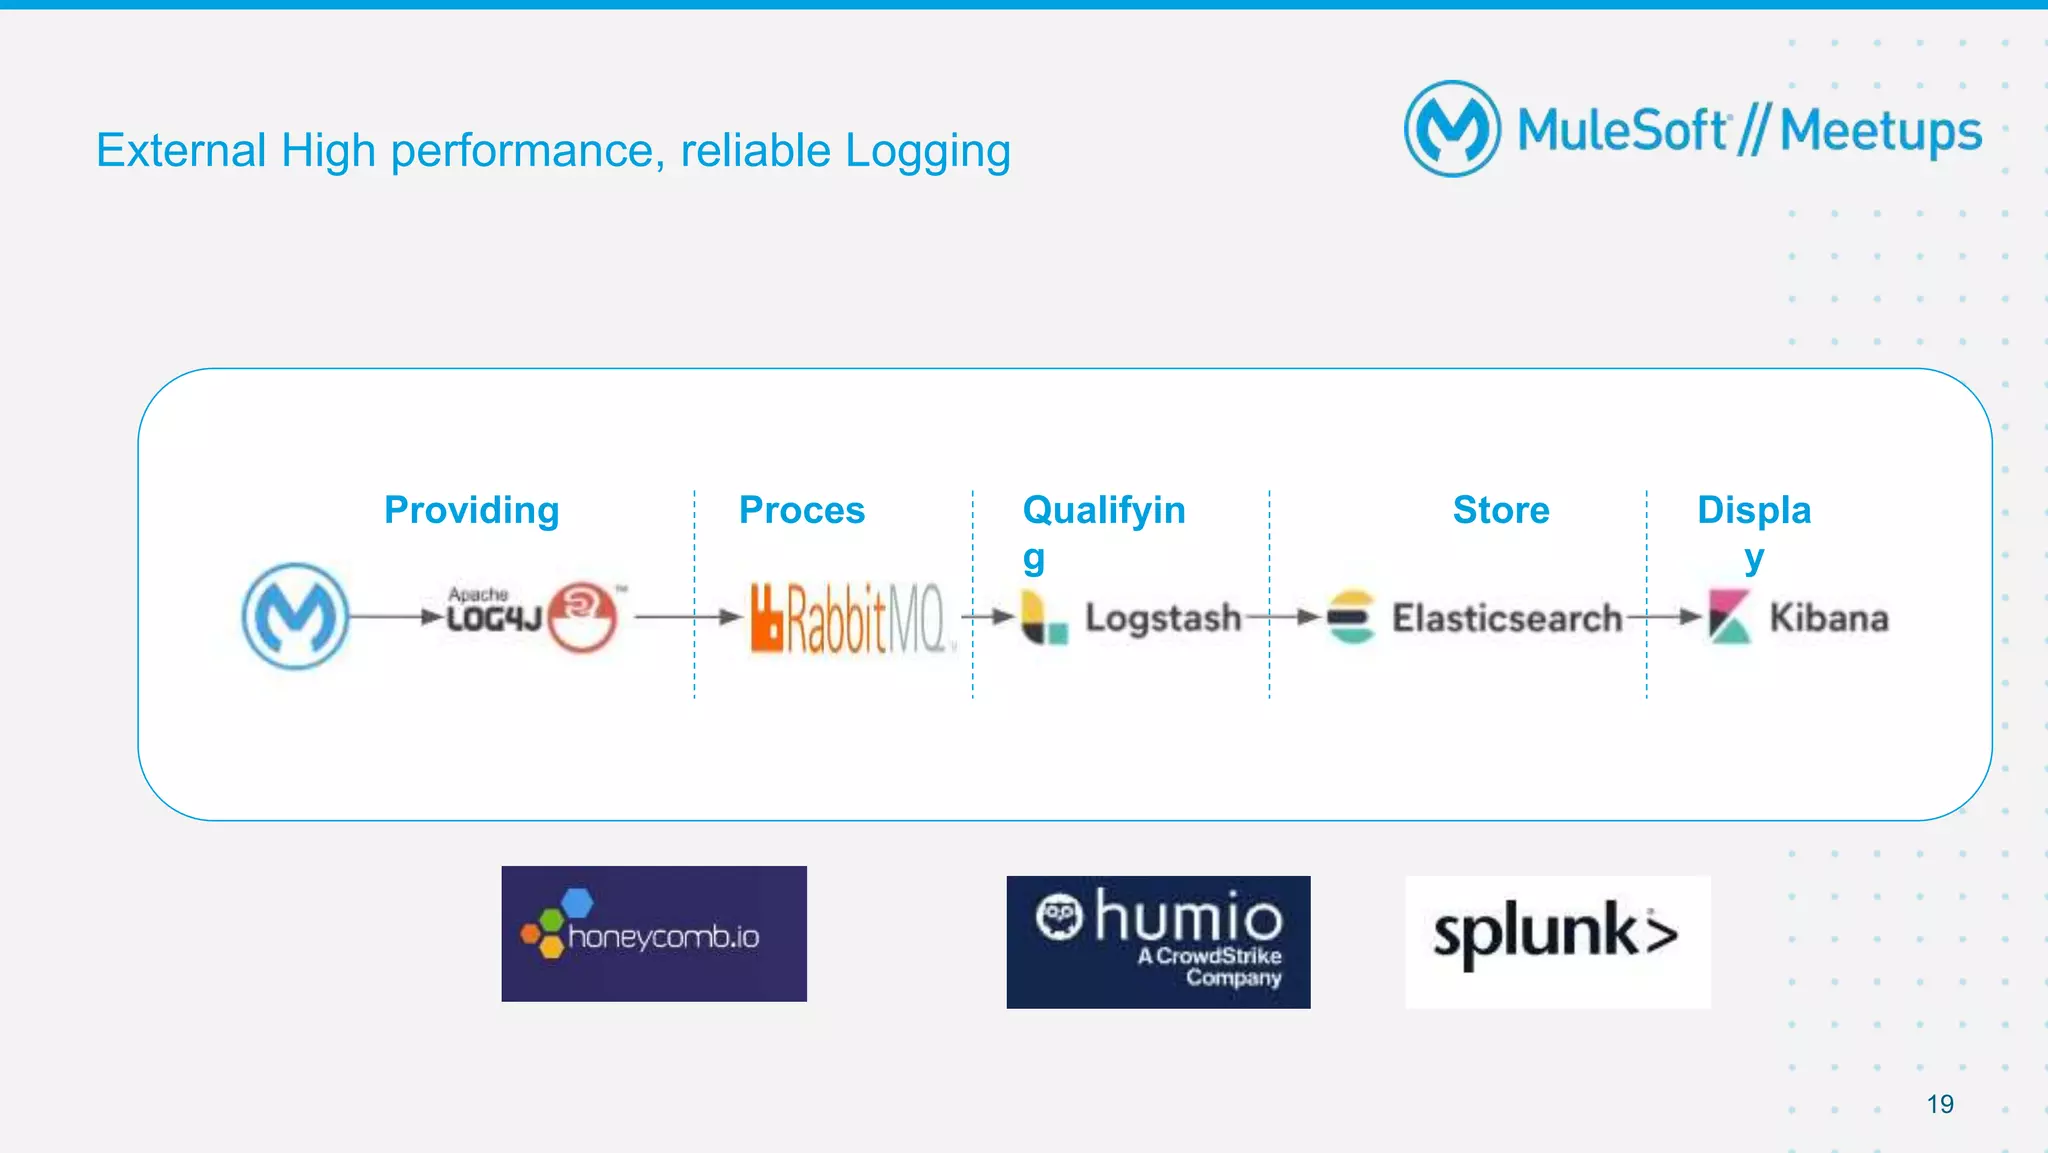
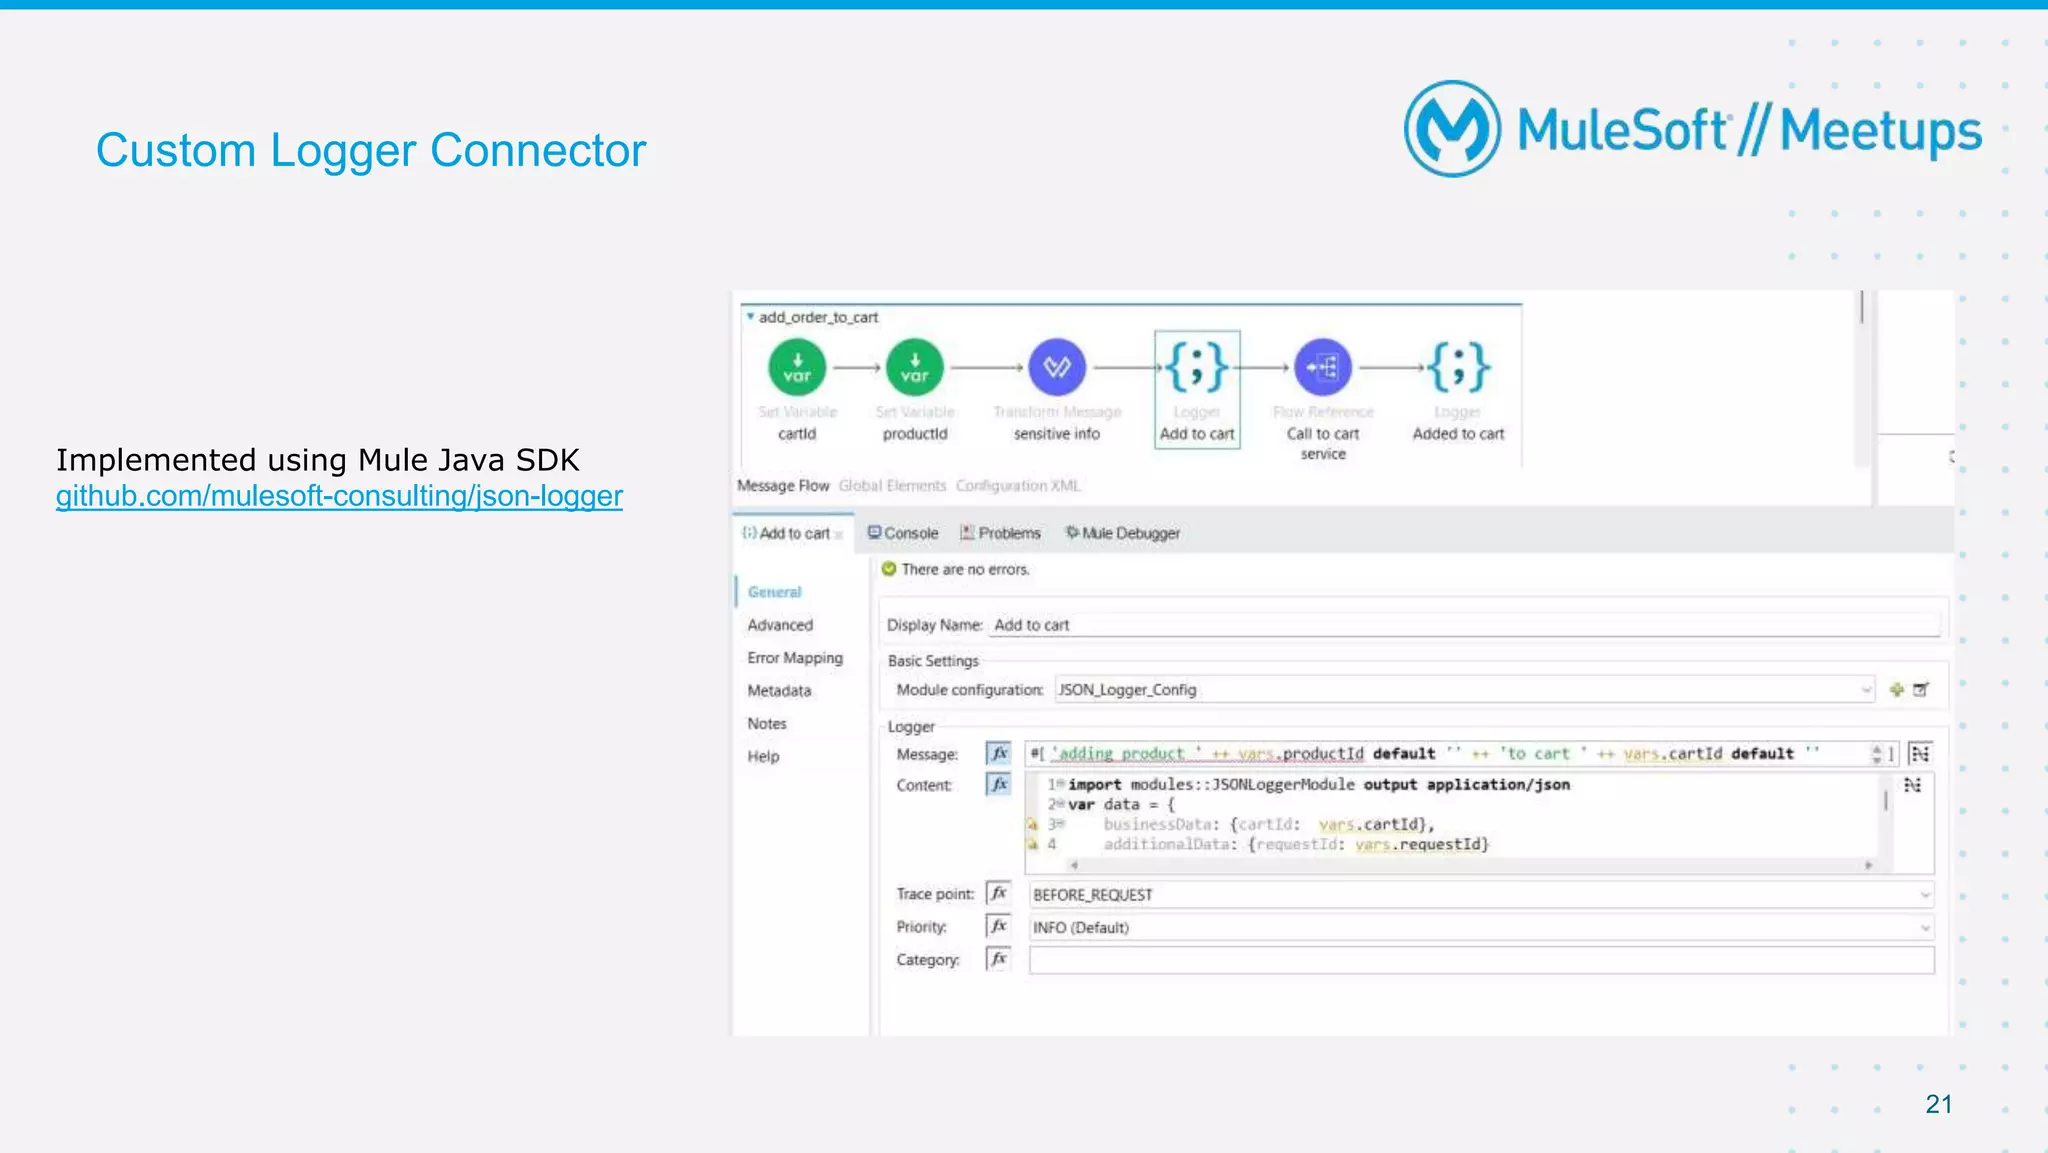
- Formats like JSON with additional fields can provide structure and context to effectively aggregate logs from different sources.

![16
Data format example
"log_timestamp": "2022-03-15T17:01:13.314Z",
"loggerName": "org.mule.extension.jsonlogger.JsonLogger",
"system" : "azure-net-on-prem",
"hostId" : "sv-mule-001",
"applicationName" : "json-logger-test-app",
"applicationVersion" : "1.0.0-SNAPSHOT",
"priority" : "INFO",
"threadName" : "[json-logger-test-app].api-httpListenerConfig.worker.03",
"environment" : "dev",
"correlationId" : "99825dc0-ccc9-11e7-87ad-f45c898c34ab",
"logger_content": {
"logger_version" : "1.0.0",
"businessProcess" : "payments",
"processName" : "s-payment-implementationFlow",
"tracePoint" : "START",
"processCorrelationId": "12da85c6-ad22-11e7-abc4-cec278b6b58b",
“externalRequestId": "93da85c6-ad22-11e7-abc4-cec278b6b50a",
"message" : "Paying orderId EC1245",
"content" : "{"businessData": {"country": "IT" },“techinicalData": {"retry_num": "2"}}",
“additionalData" : {
"businessData" : {
"customerId" : "1234",
"orderId" : "EC1245",
"country" : "IT",
"paid": "100.00",
"currency": "eur"
}}}
additionalData is sensitive and it is logged only
in non prod environments for testing/debug
purposes.](https://image.slidesharecdn.com/cosenzamulesoftmeetup2ndpublic-220722074045-c4eedcb8/75/Designing-and-Implementing-Effective-Logging-Strategies-16-2048.jpg)


![16
Data format example
"log_timestamp": "2022-03-15T17:01:13.314Z",
"loggerName": "org.mule.extension.jsonlogger.JsonLogger",
"system" : "azure-net-on-prem",
"hostId" : "sv-mule-001",
"applicationName" : "json-logger-test-app",
"applicationVersion" : "1.0.0-SNAPSHOT",
"priority" : "INFO",
"threadName" : "[json-logger-test-app].api-httpListenerConfig.worker.03",
"environment" : "dev",
"correlationId" : "99825dc0-ccc9-11e7-87ad-f45c898c34ab",
"logger_content": {
"logger_version" : "1.0.0",
"businessProcess" : "payments",
"processName" : "s-payment-implementationFlow",
"tracePoint" : "START",
"processCorrelationId": "12da85c6-ad22-11e7-abc4-cec278b6b58b",
“externalRequestId": "93da85c6-ad22-11e7-abc4-cec278b6b50a",
"message" : "Paying orderId EC1245",
"content" : "{"businessData": {"country": "IT" },“techinicalData": {"retry_num": "2"}}",
“additionalData" : {
"businessData" : {
"customerId" : "1234",
"orderId" : "EC1245",
"country" : "IT",
"paid": "100.00",
"currency": "eur"
}}}
additionalData is sensitive and it is logged only
in non prod environments for testing/debug
purposes.](https://crownmelresort.com/image.slidesharecdn.com/cosenzamulesoftmeetup2ndpublic-220722074045-c4eedcb8/75/Designing-and-Implementing-Effective-Logging-Strategies-16-2048.jpg)