lab exam
• when:Nov 27 - Dec 1
• length = 1 hour
– each lab section divided in two
• register for the exam in your section so there is
a computer reserved for you
• If you write in the 1st hour, you can’t leave early!
If you write in the second hour, you can’t arrive
late!
2.
lab exam
• format:
–open book!
– similar to questions in lab manual
– last section in the lab manual has review
questions
– show all your work: hypotheses, tests of
assumptions, test statistics, p-values and
conclusions
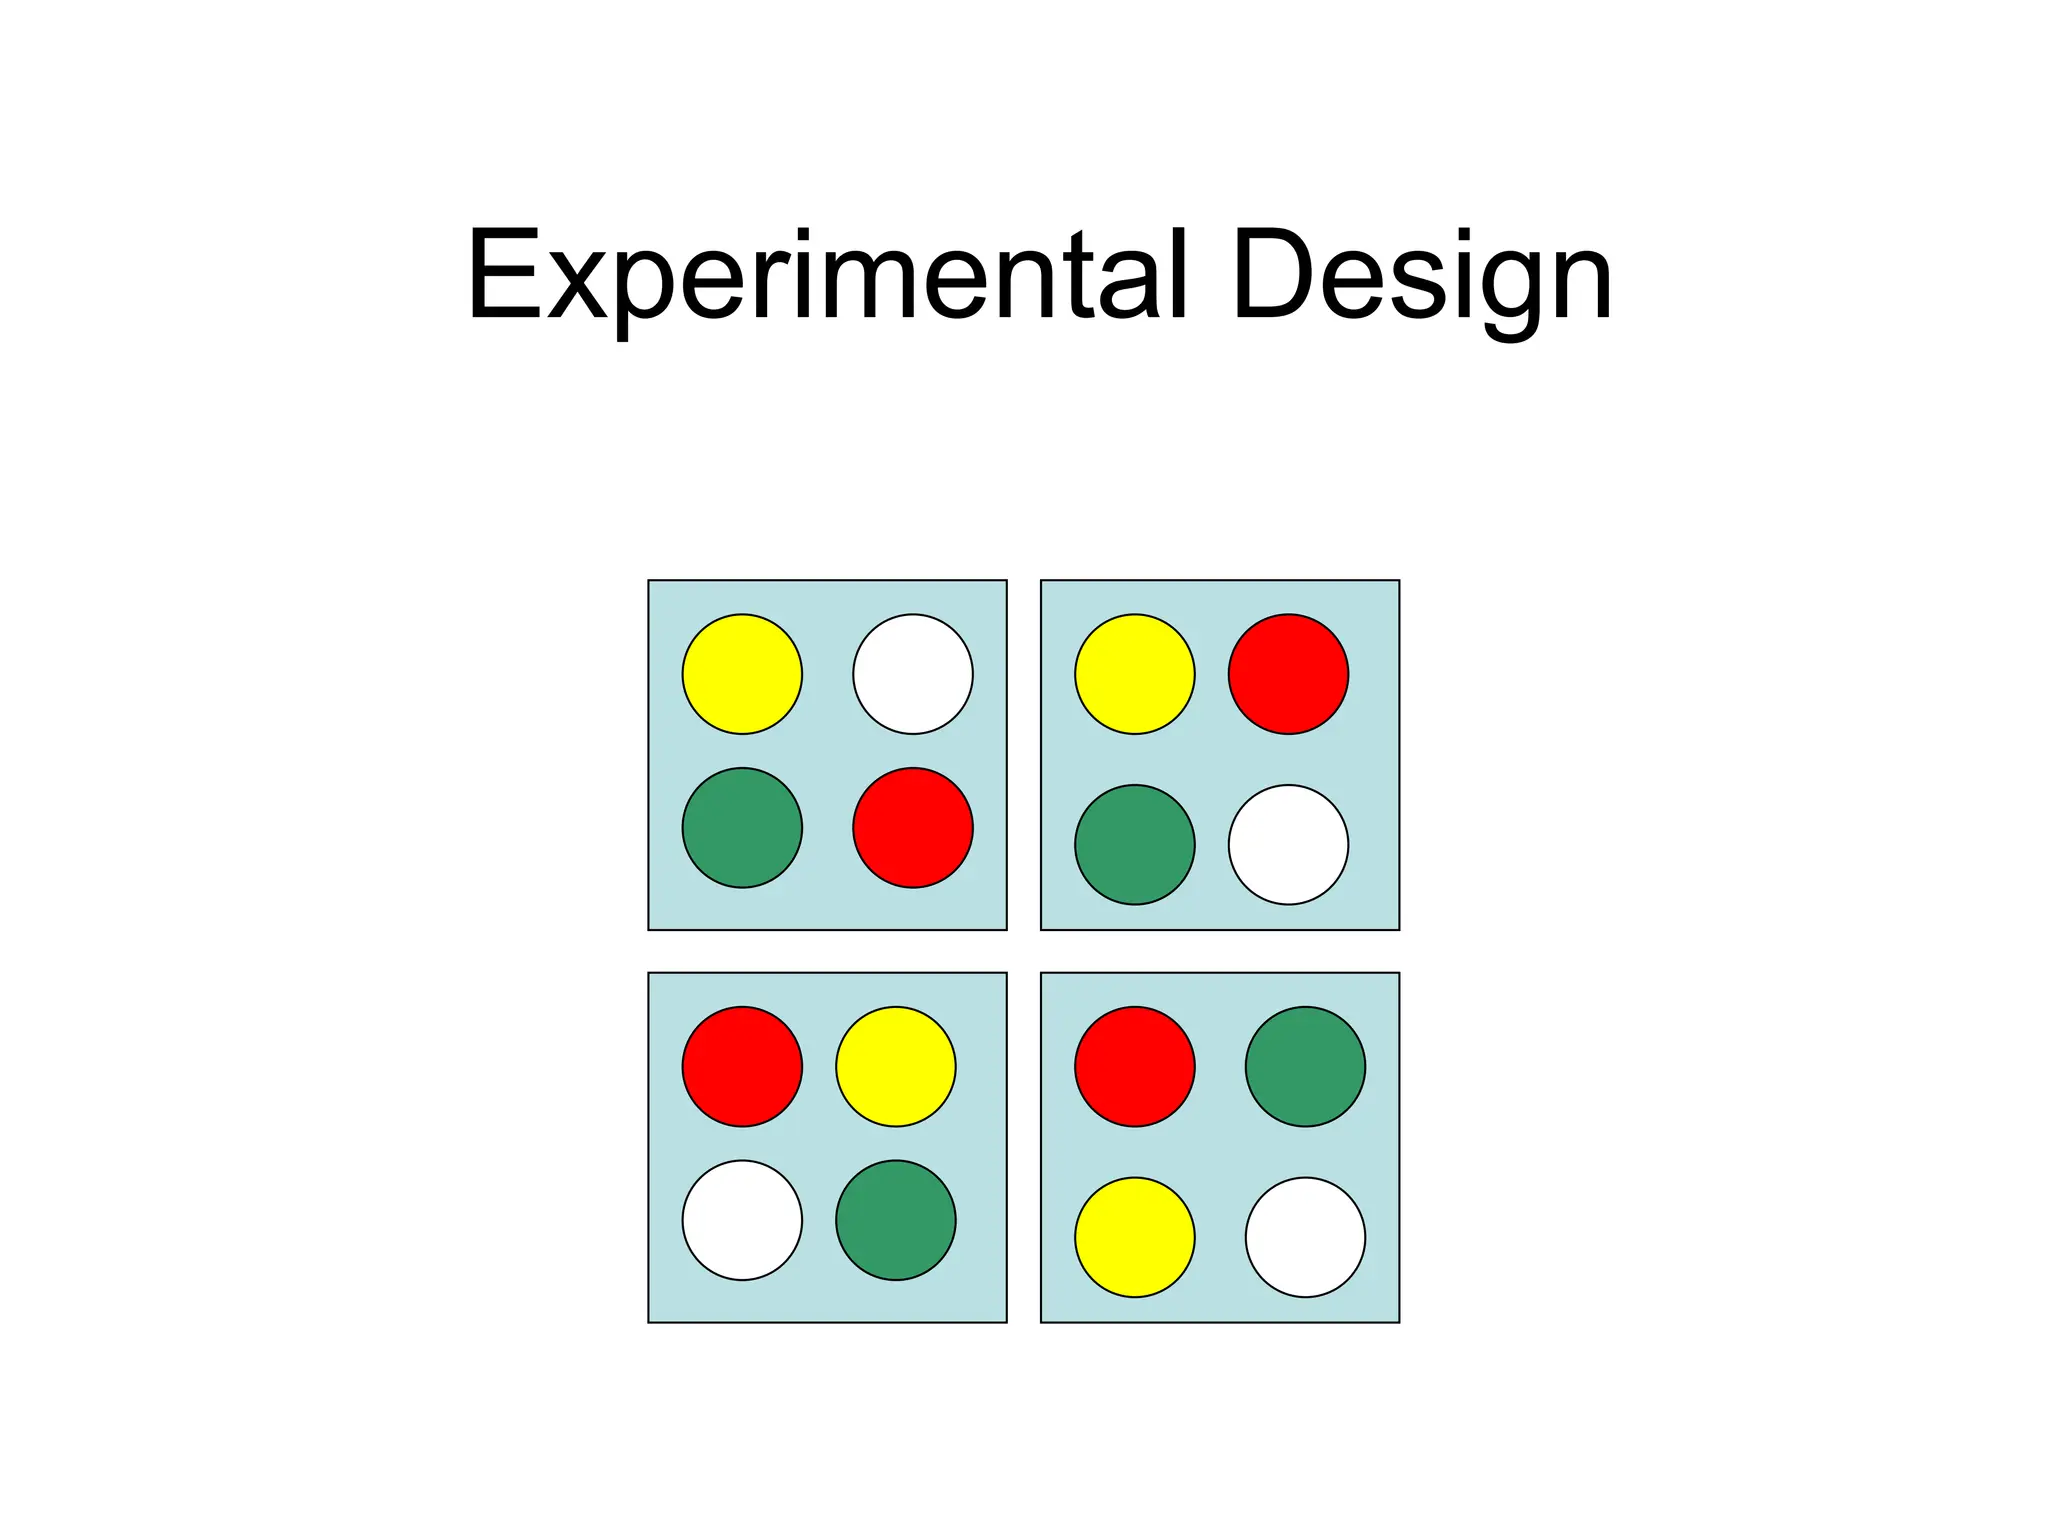
Experimental Design
• Experimentaldesign is the part of statistics
that happens before you carry out an
experiment
• Proper planning can save many
headaches
• You should design your experiments with
a particular statistical test in mind
5.
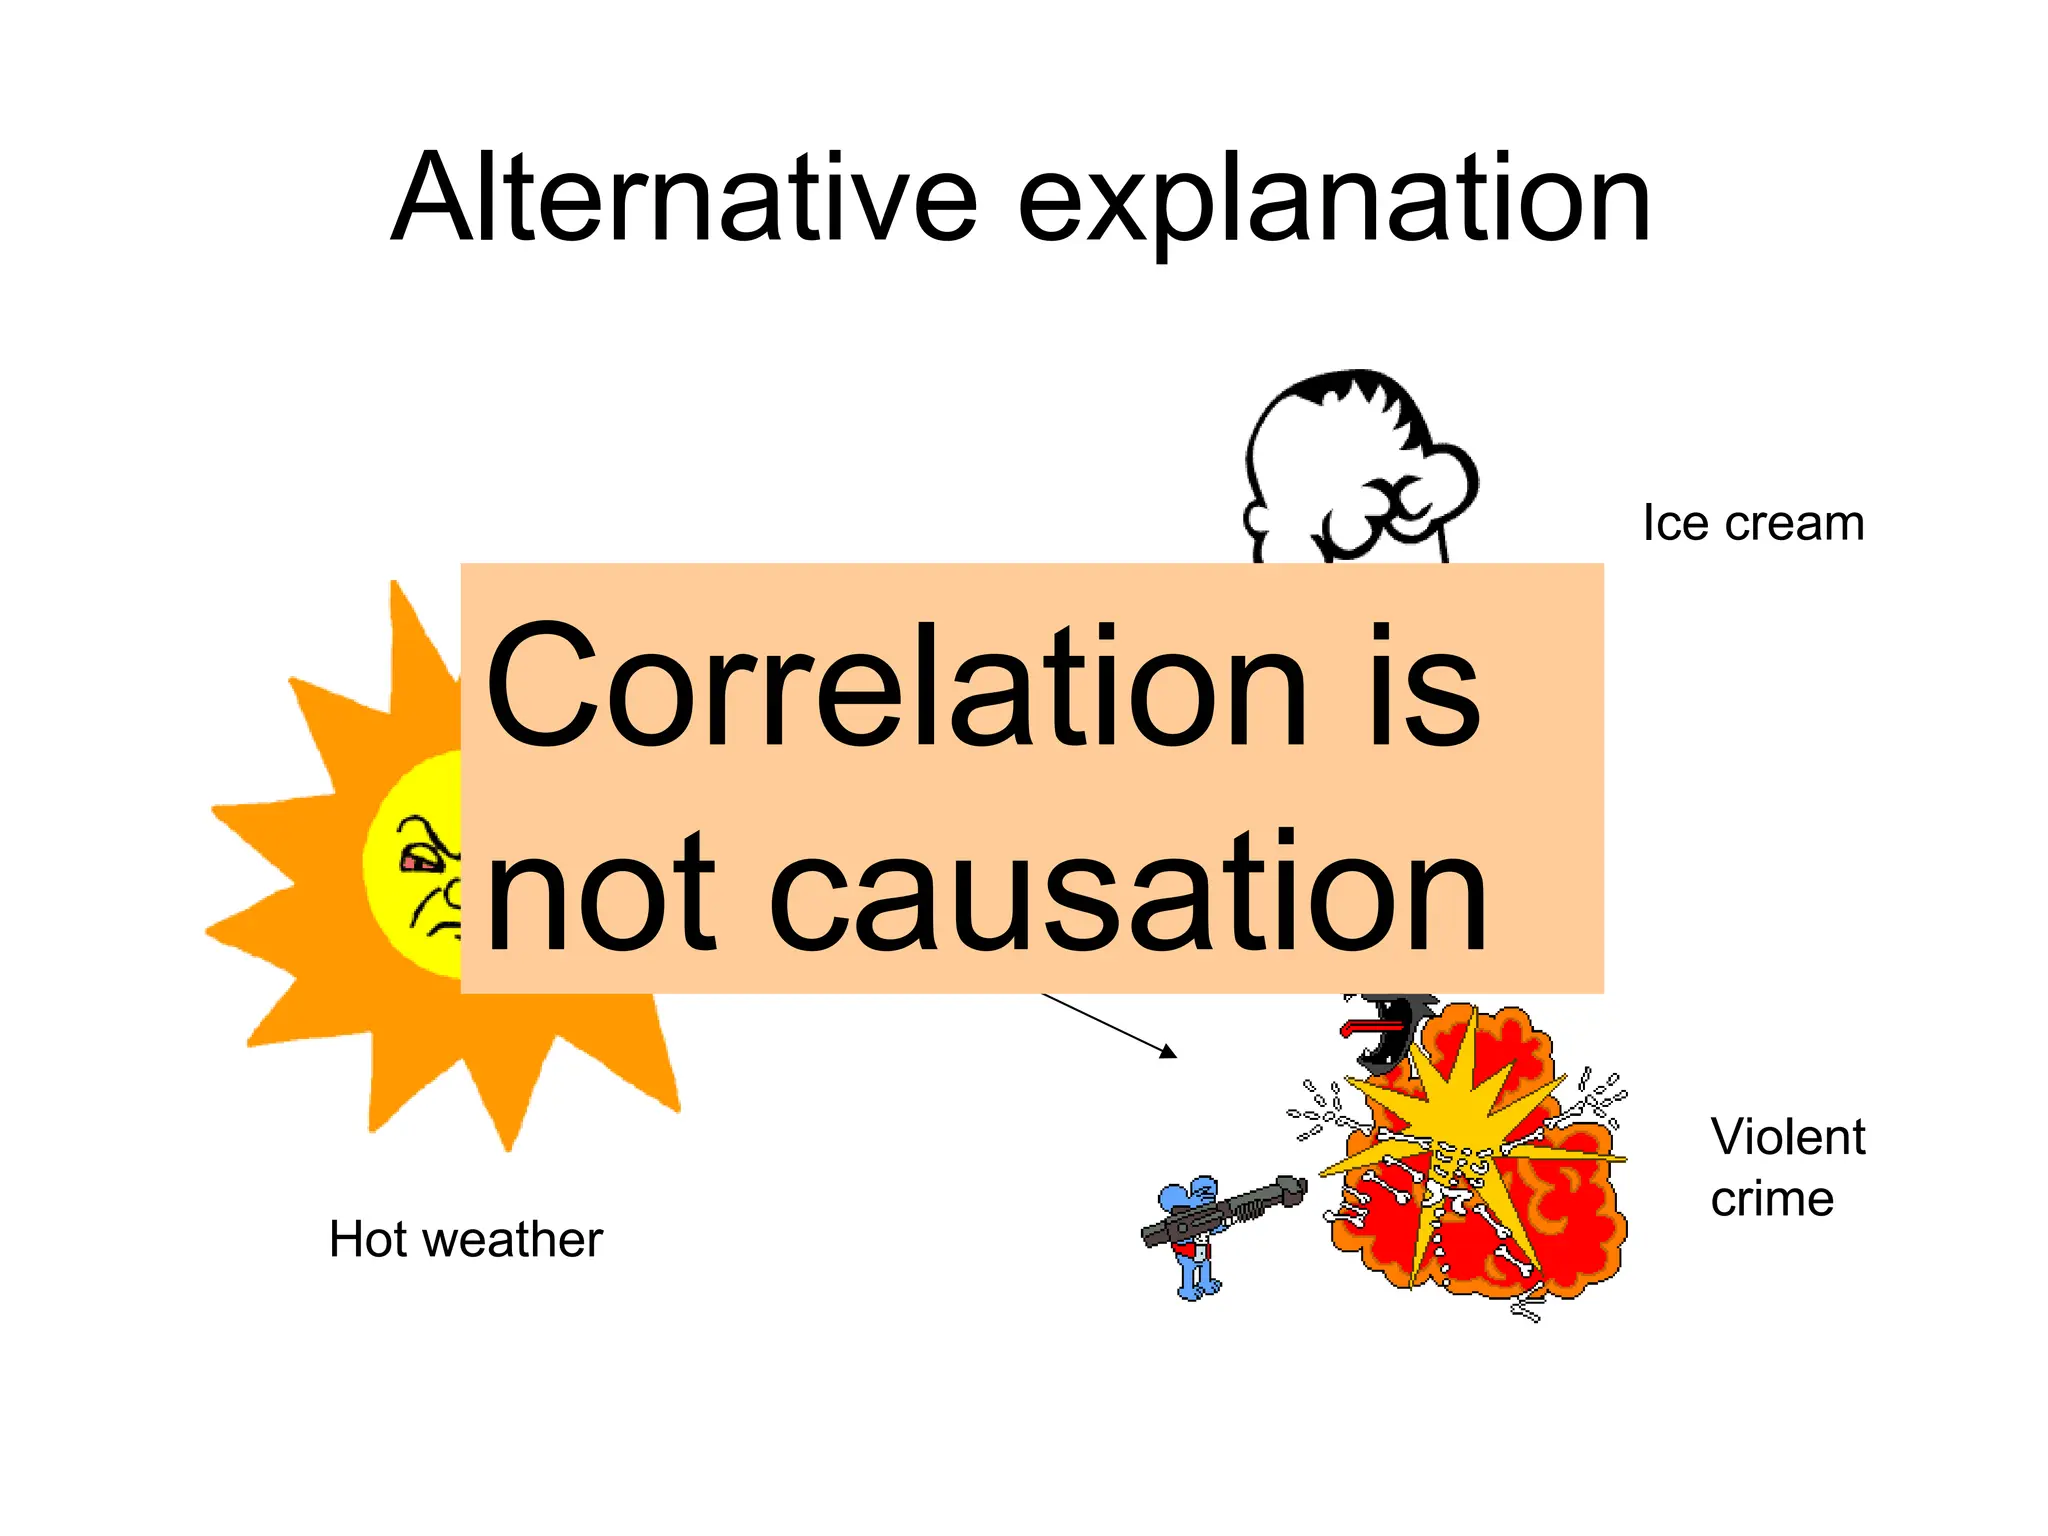
Why do experiments?
•Contrast: observational study vs.
experiments
• Example:
– Observational studies show a positive
association between ice cream sales and
levels of violent crime
– What does this mean?
6.
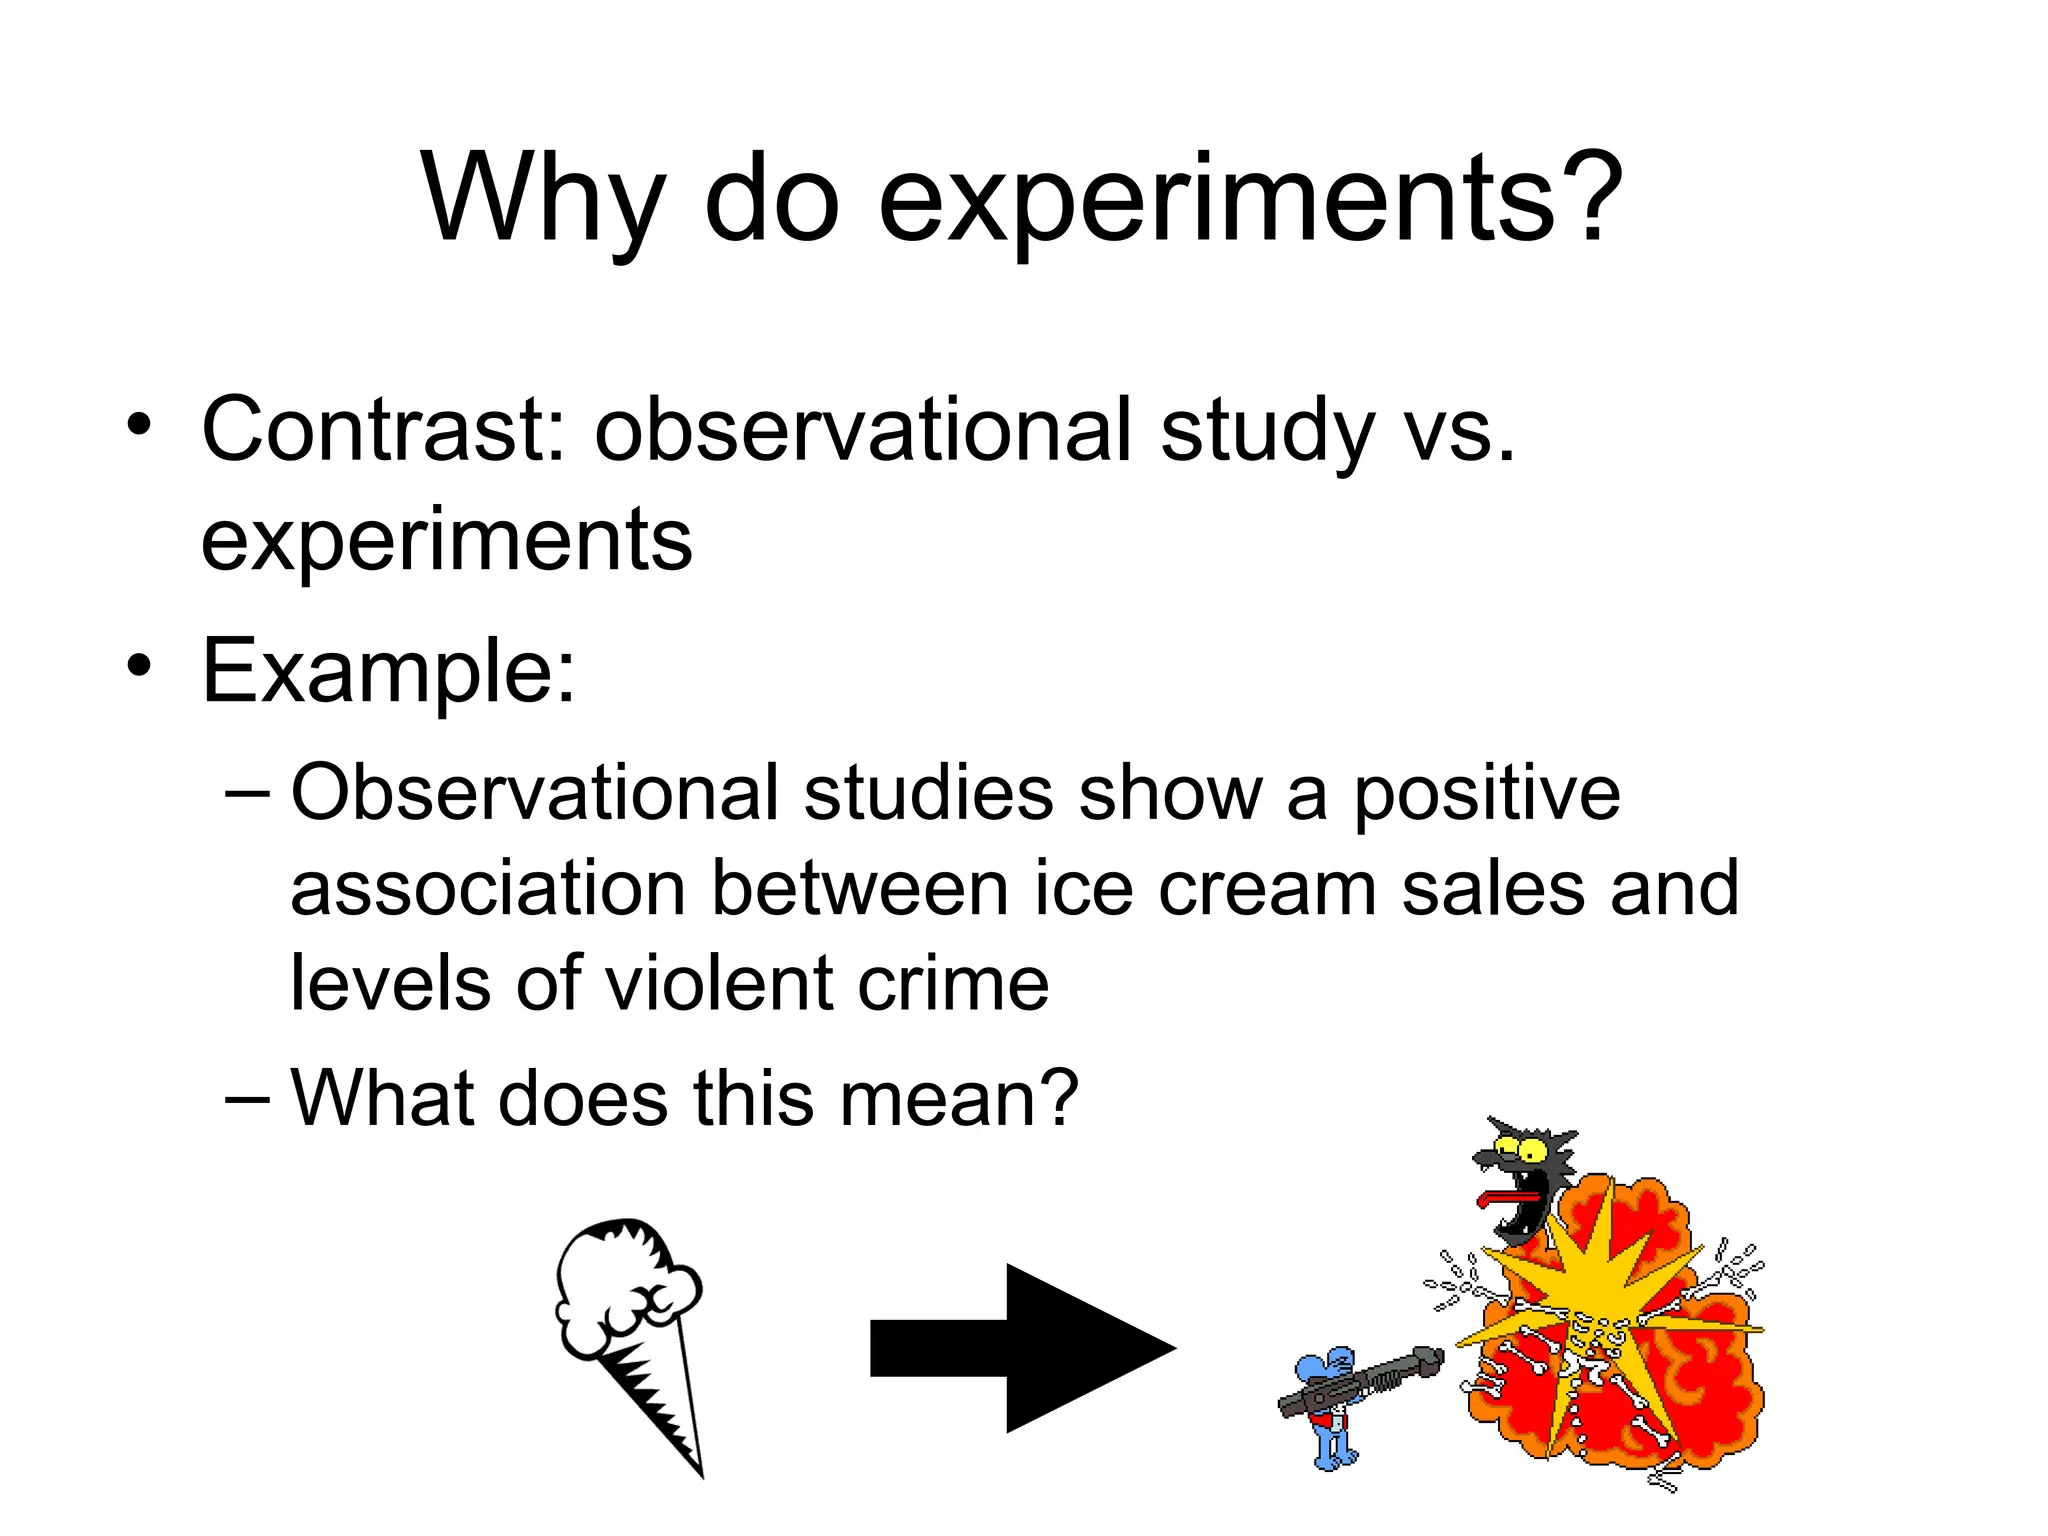
Why do experiments?
•Contrast: observational study vs.
experiments
• Example:
– Observational studies show a positive
association between ice cream sales and
levels of violent crime
– What does this mean?
Why do experiments?
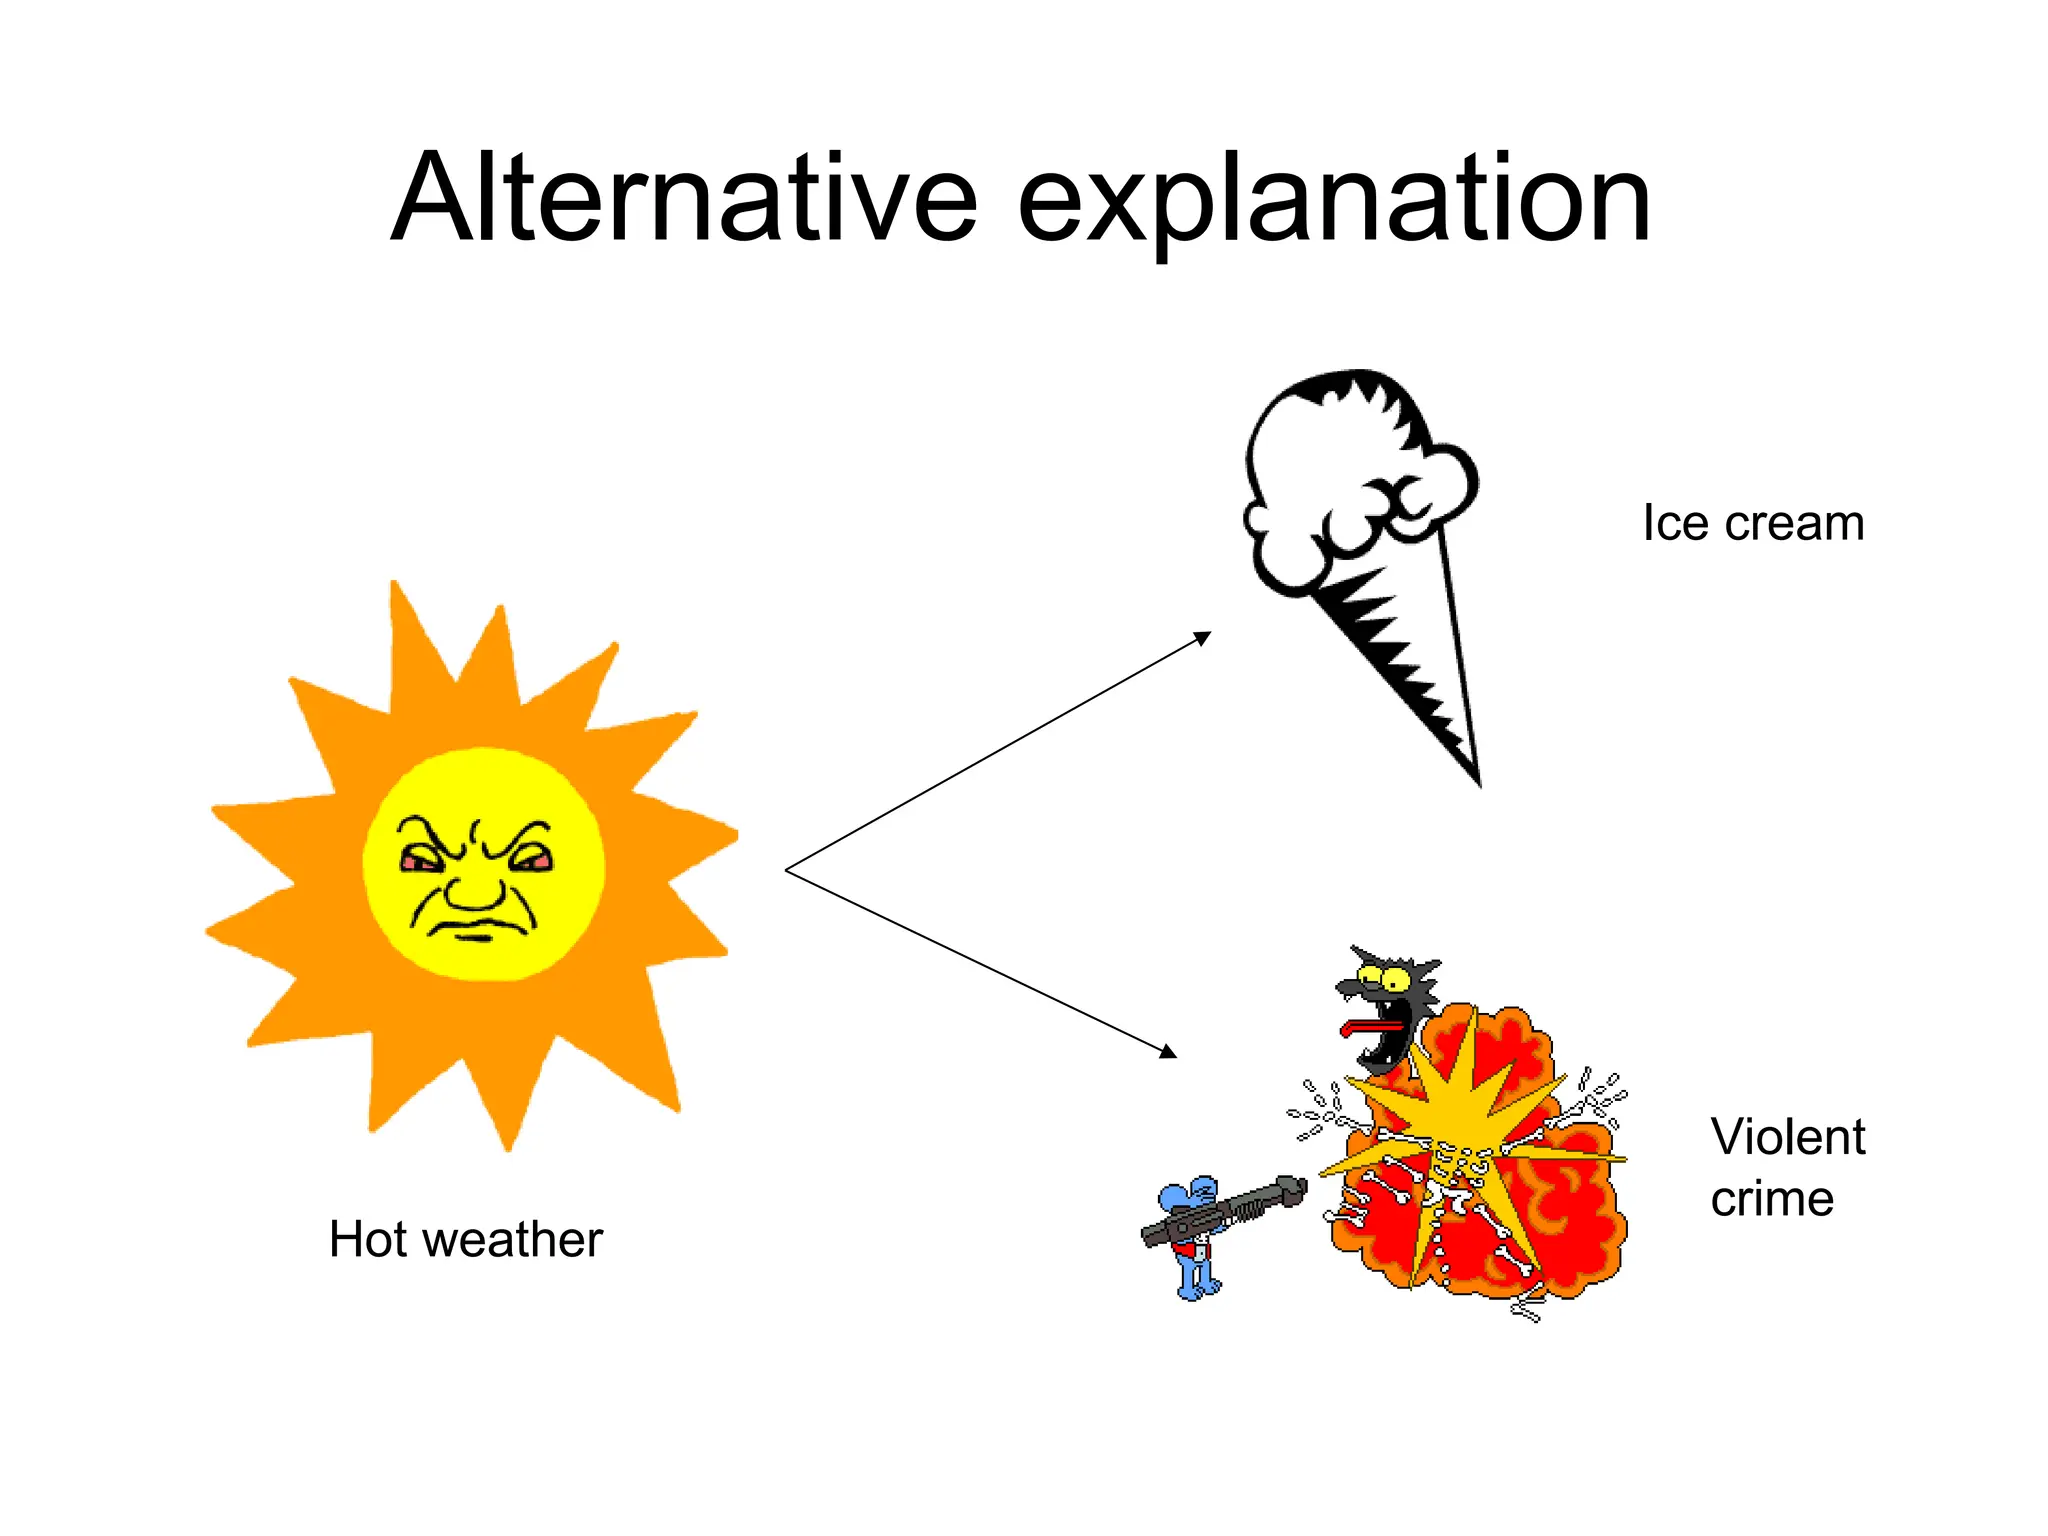
•Observational studies are prone to
confounding variables: Variables that
mask or distort the association between
measured variables in a study
– Example: hot weather
• In an experiment, you can use random
assignments of treatments to individuals to
avoid confounding variables
10.
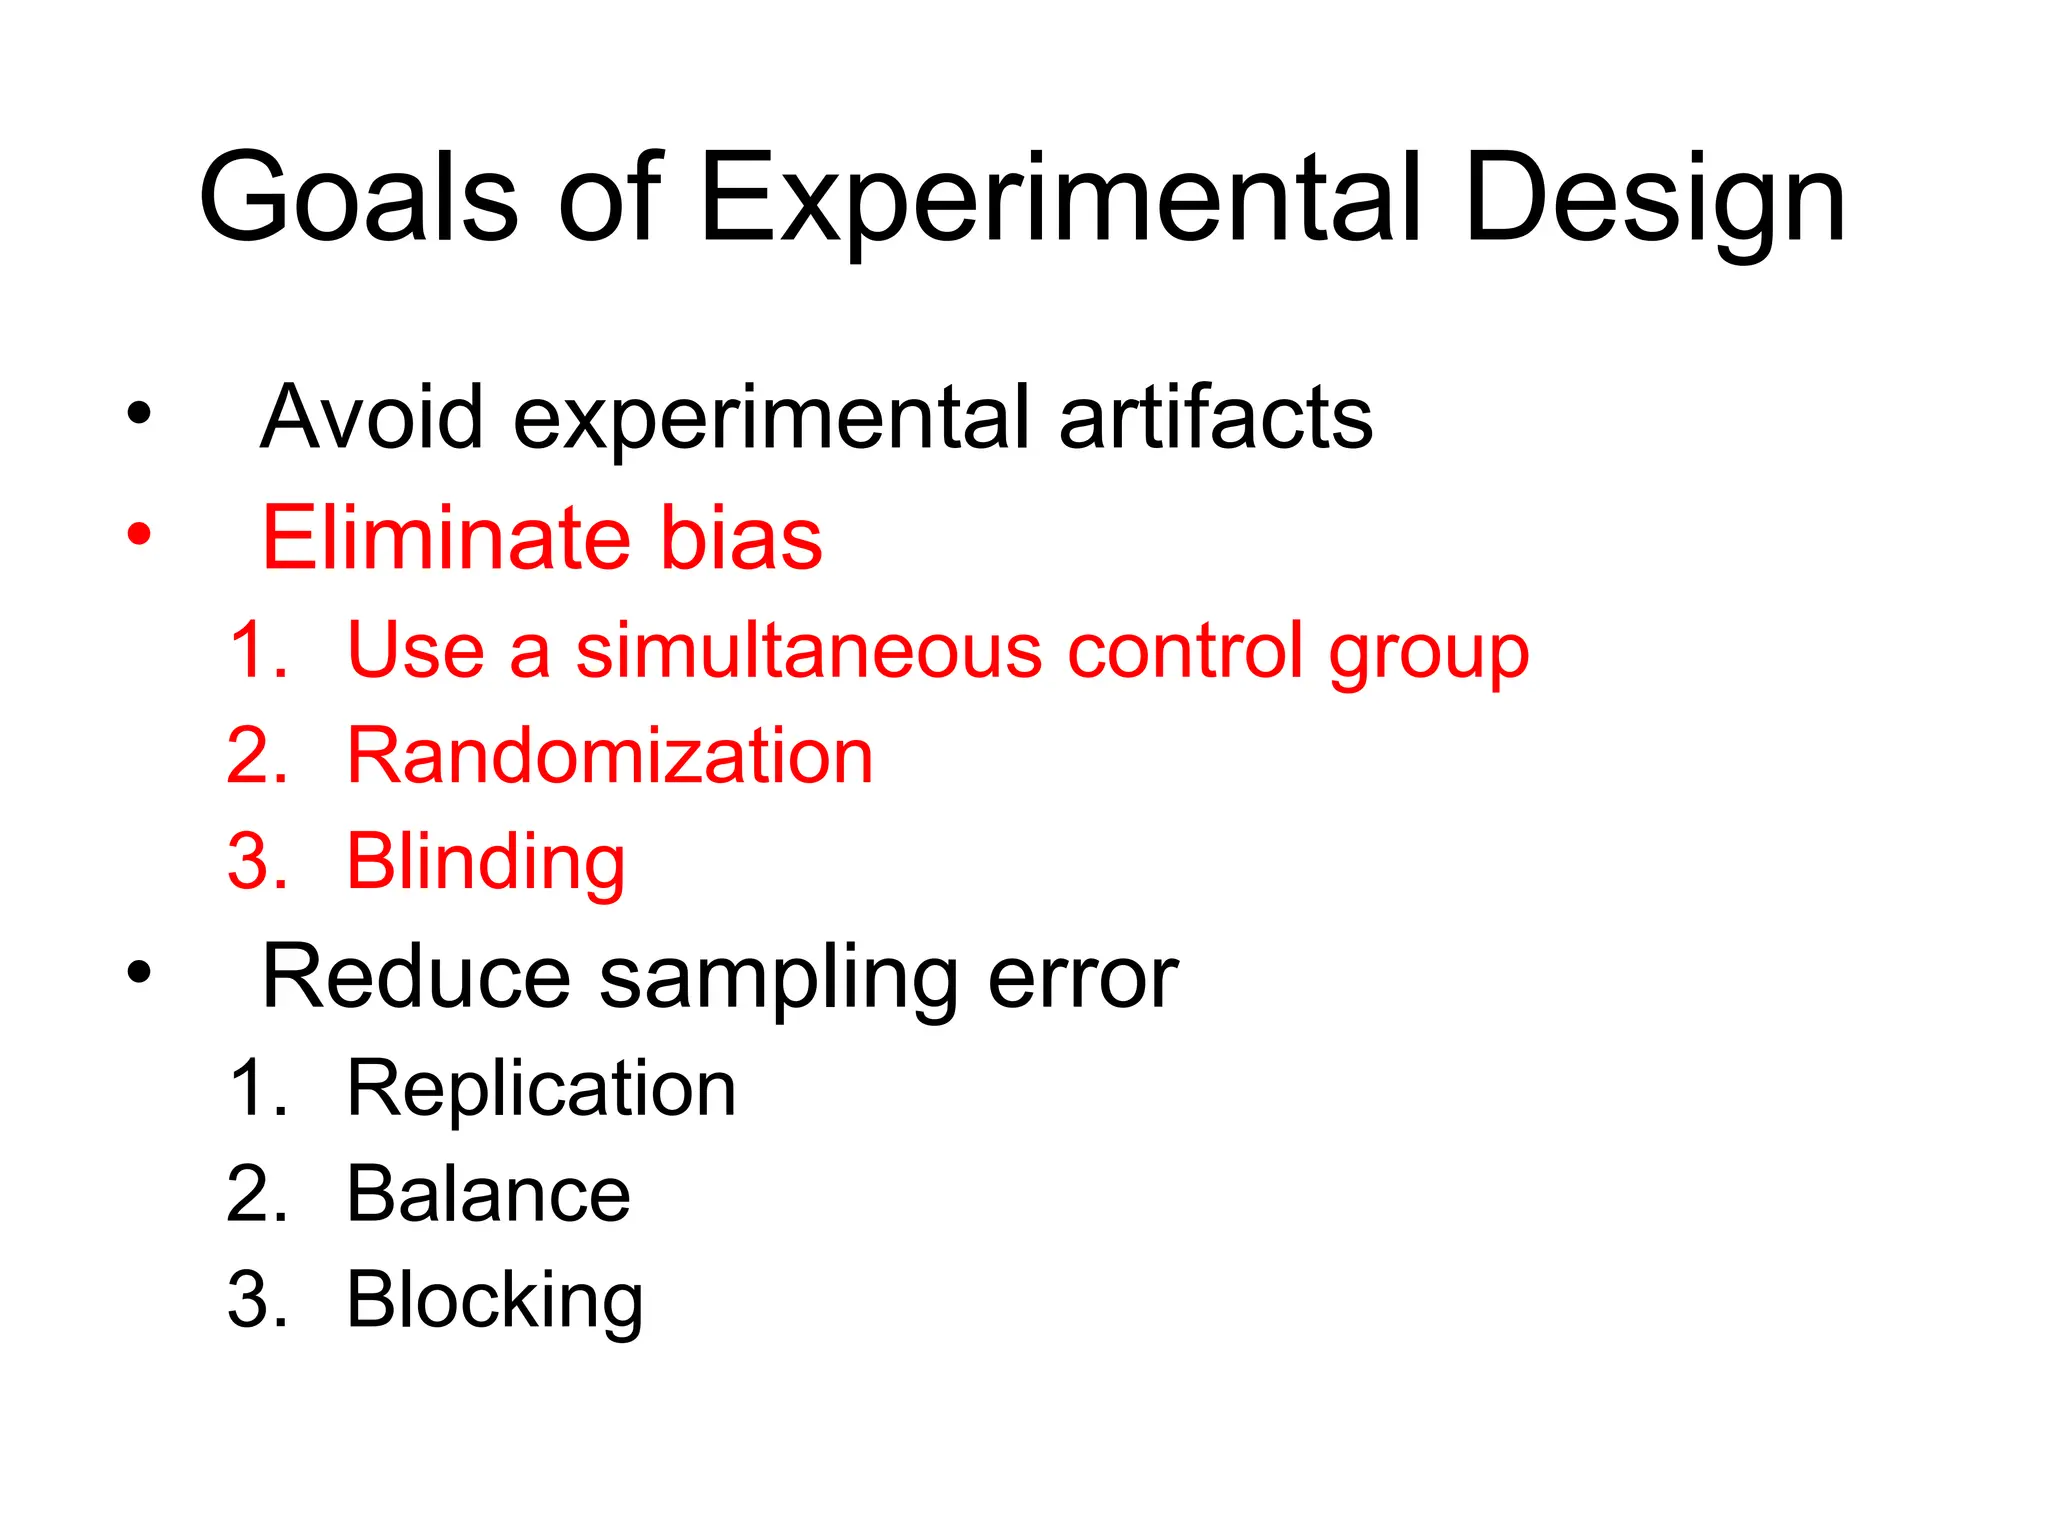
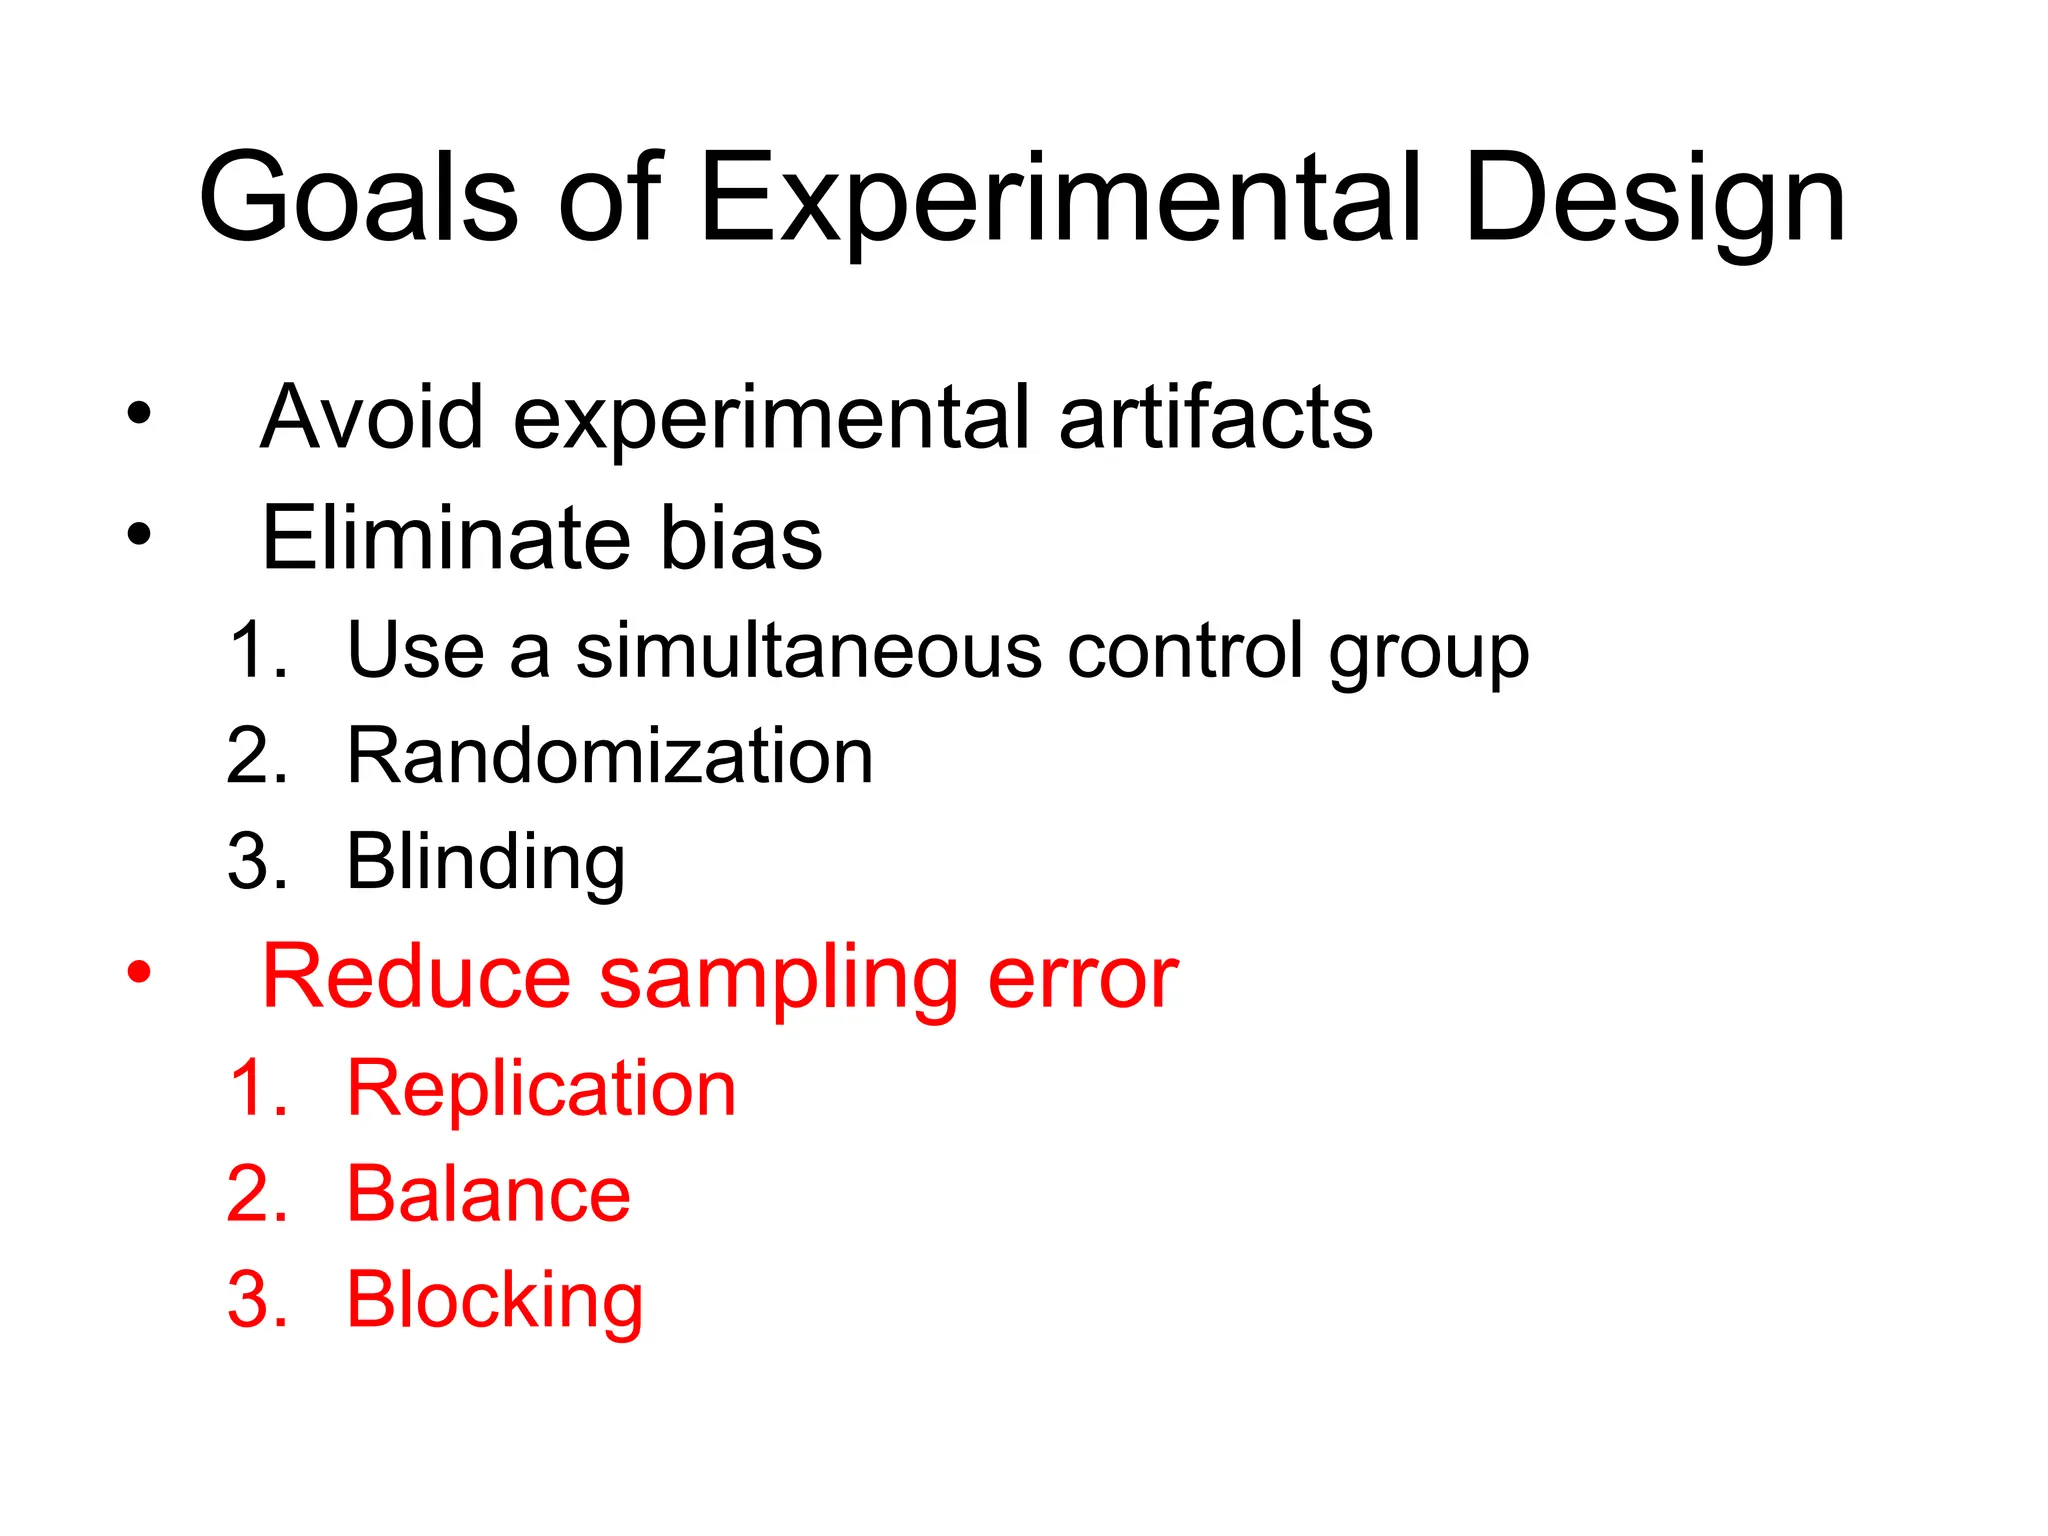
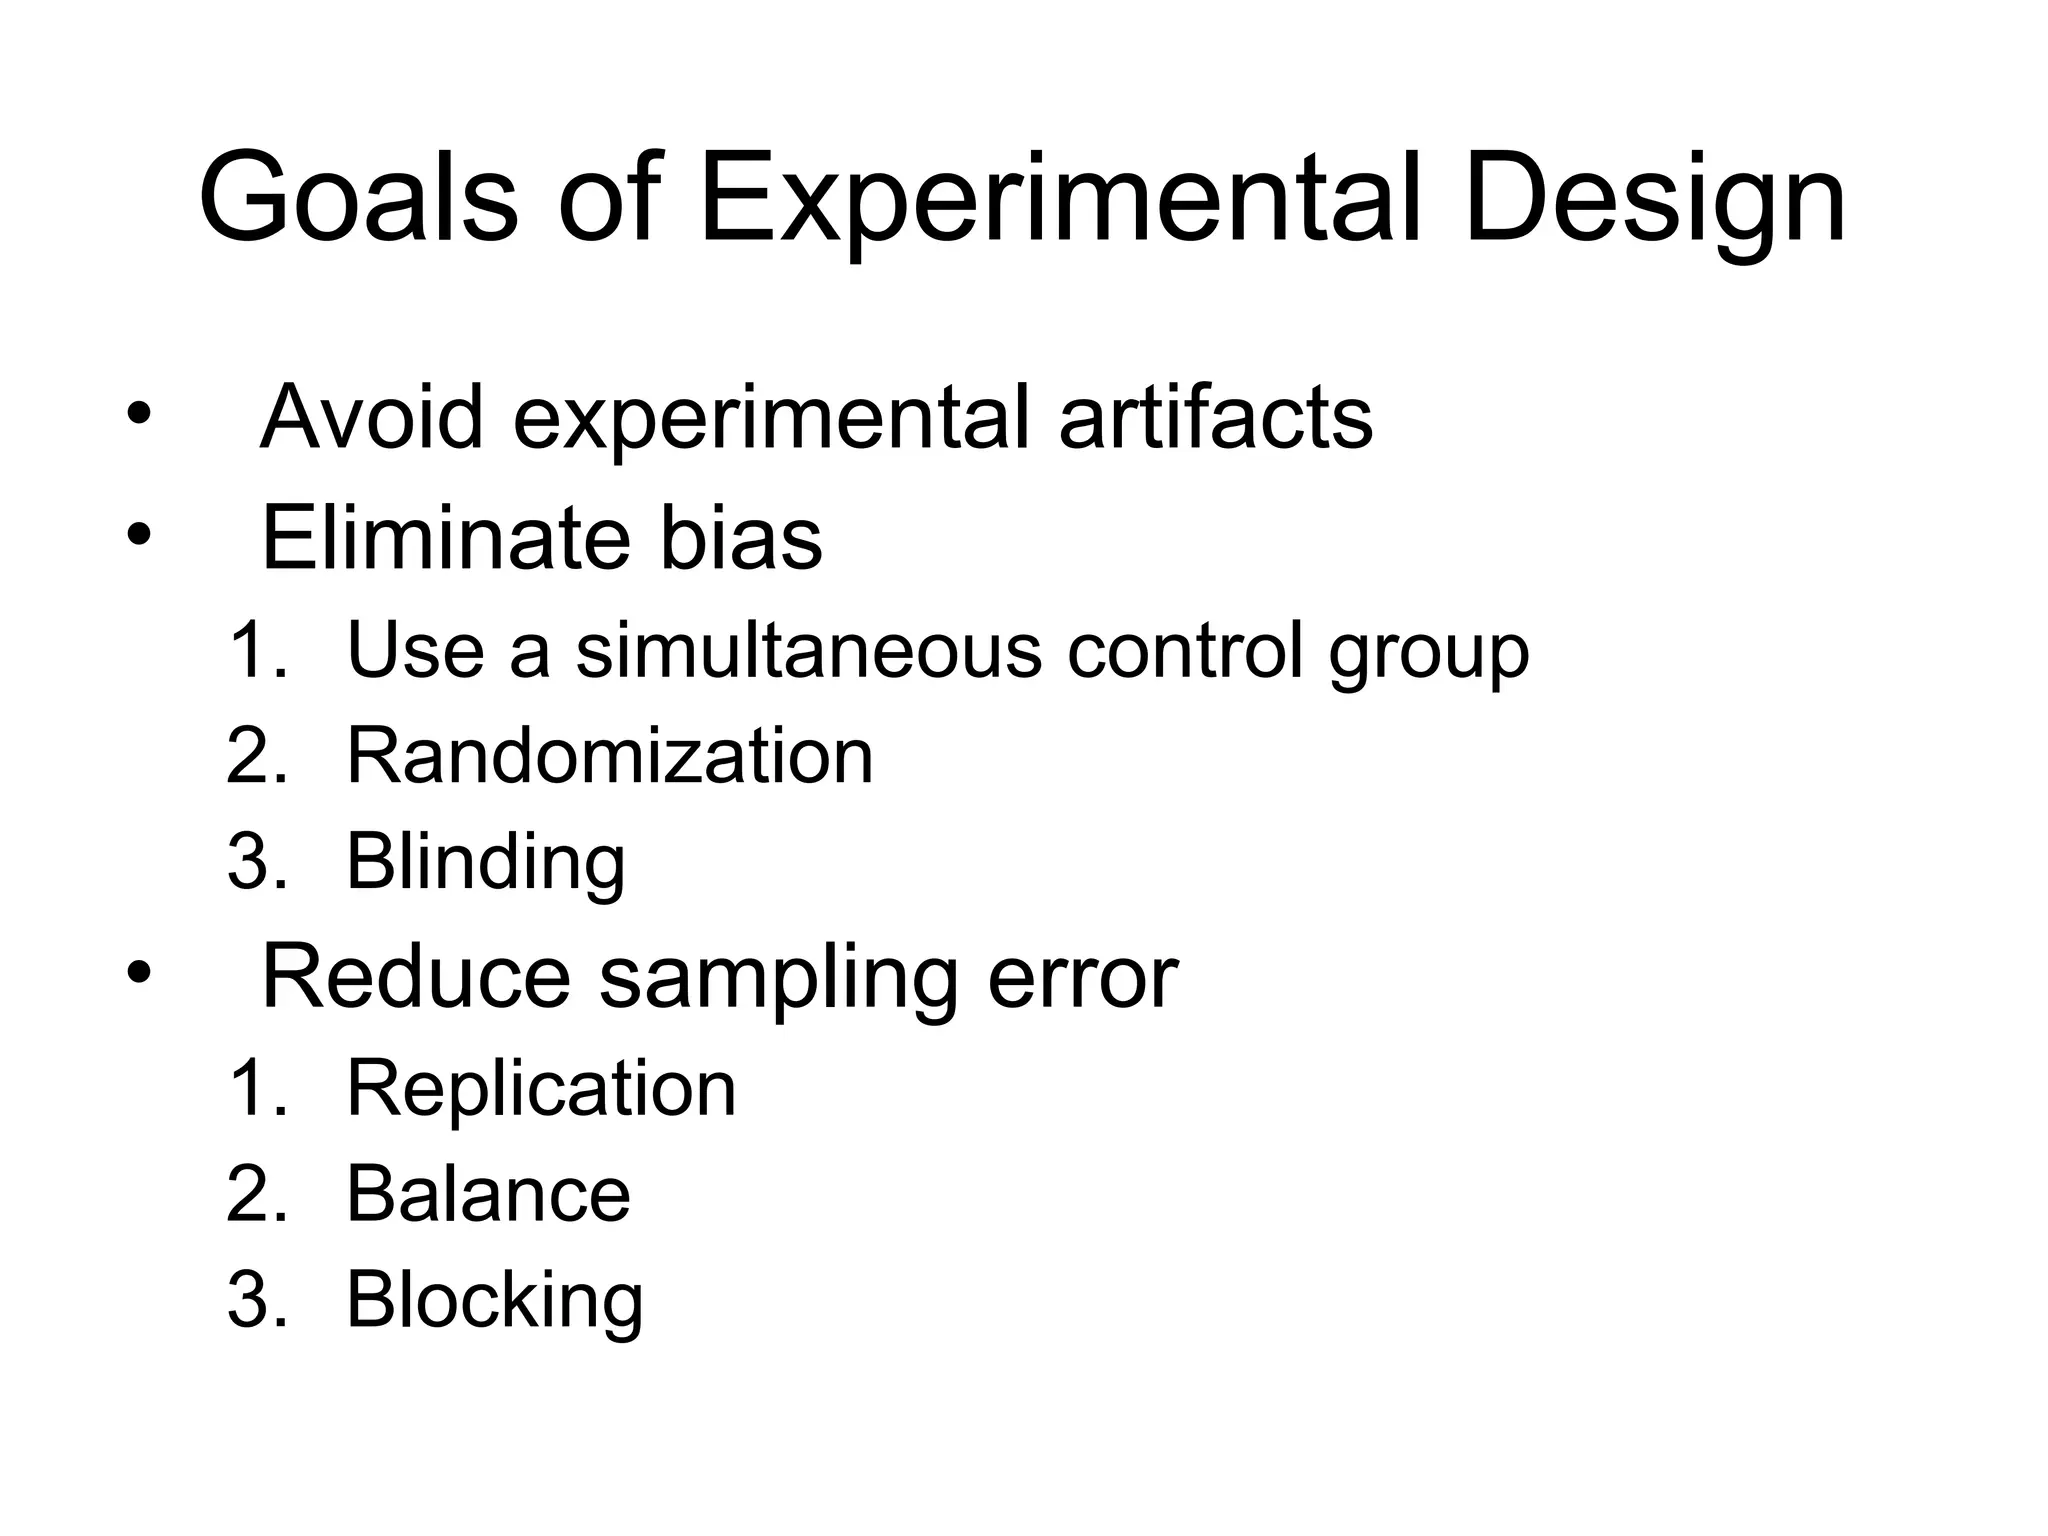
Goals of ExperimentalDesign
• Avoid experimental artifacts
• Eliminate bias
1. Use a simultaneous control group
2. Randomization
3. Blinding
• Reduce sampling error
1. Replication
2. Balance
3. Blocking
11.
Goals of ExperimentalDesign
• Avoid experimental artifacts
• Eliminate bias
1. Use a simultaneous control group
2. Randomization
3. Blinding
• Reduce sampling error
1. Replication
2. Balance
3. Blocking
12.
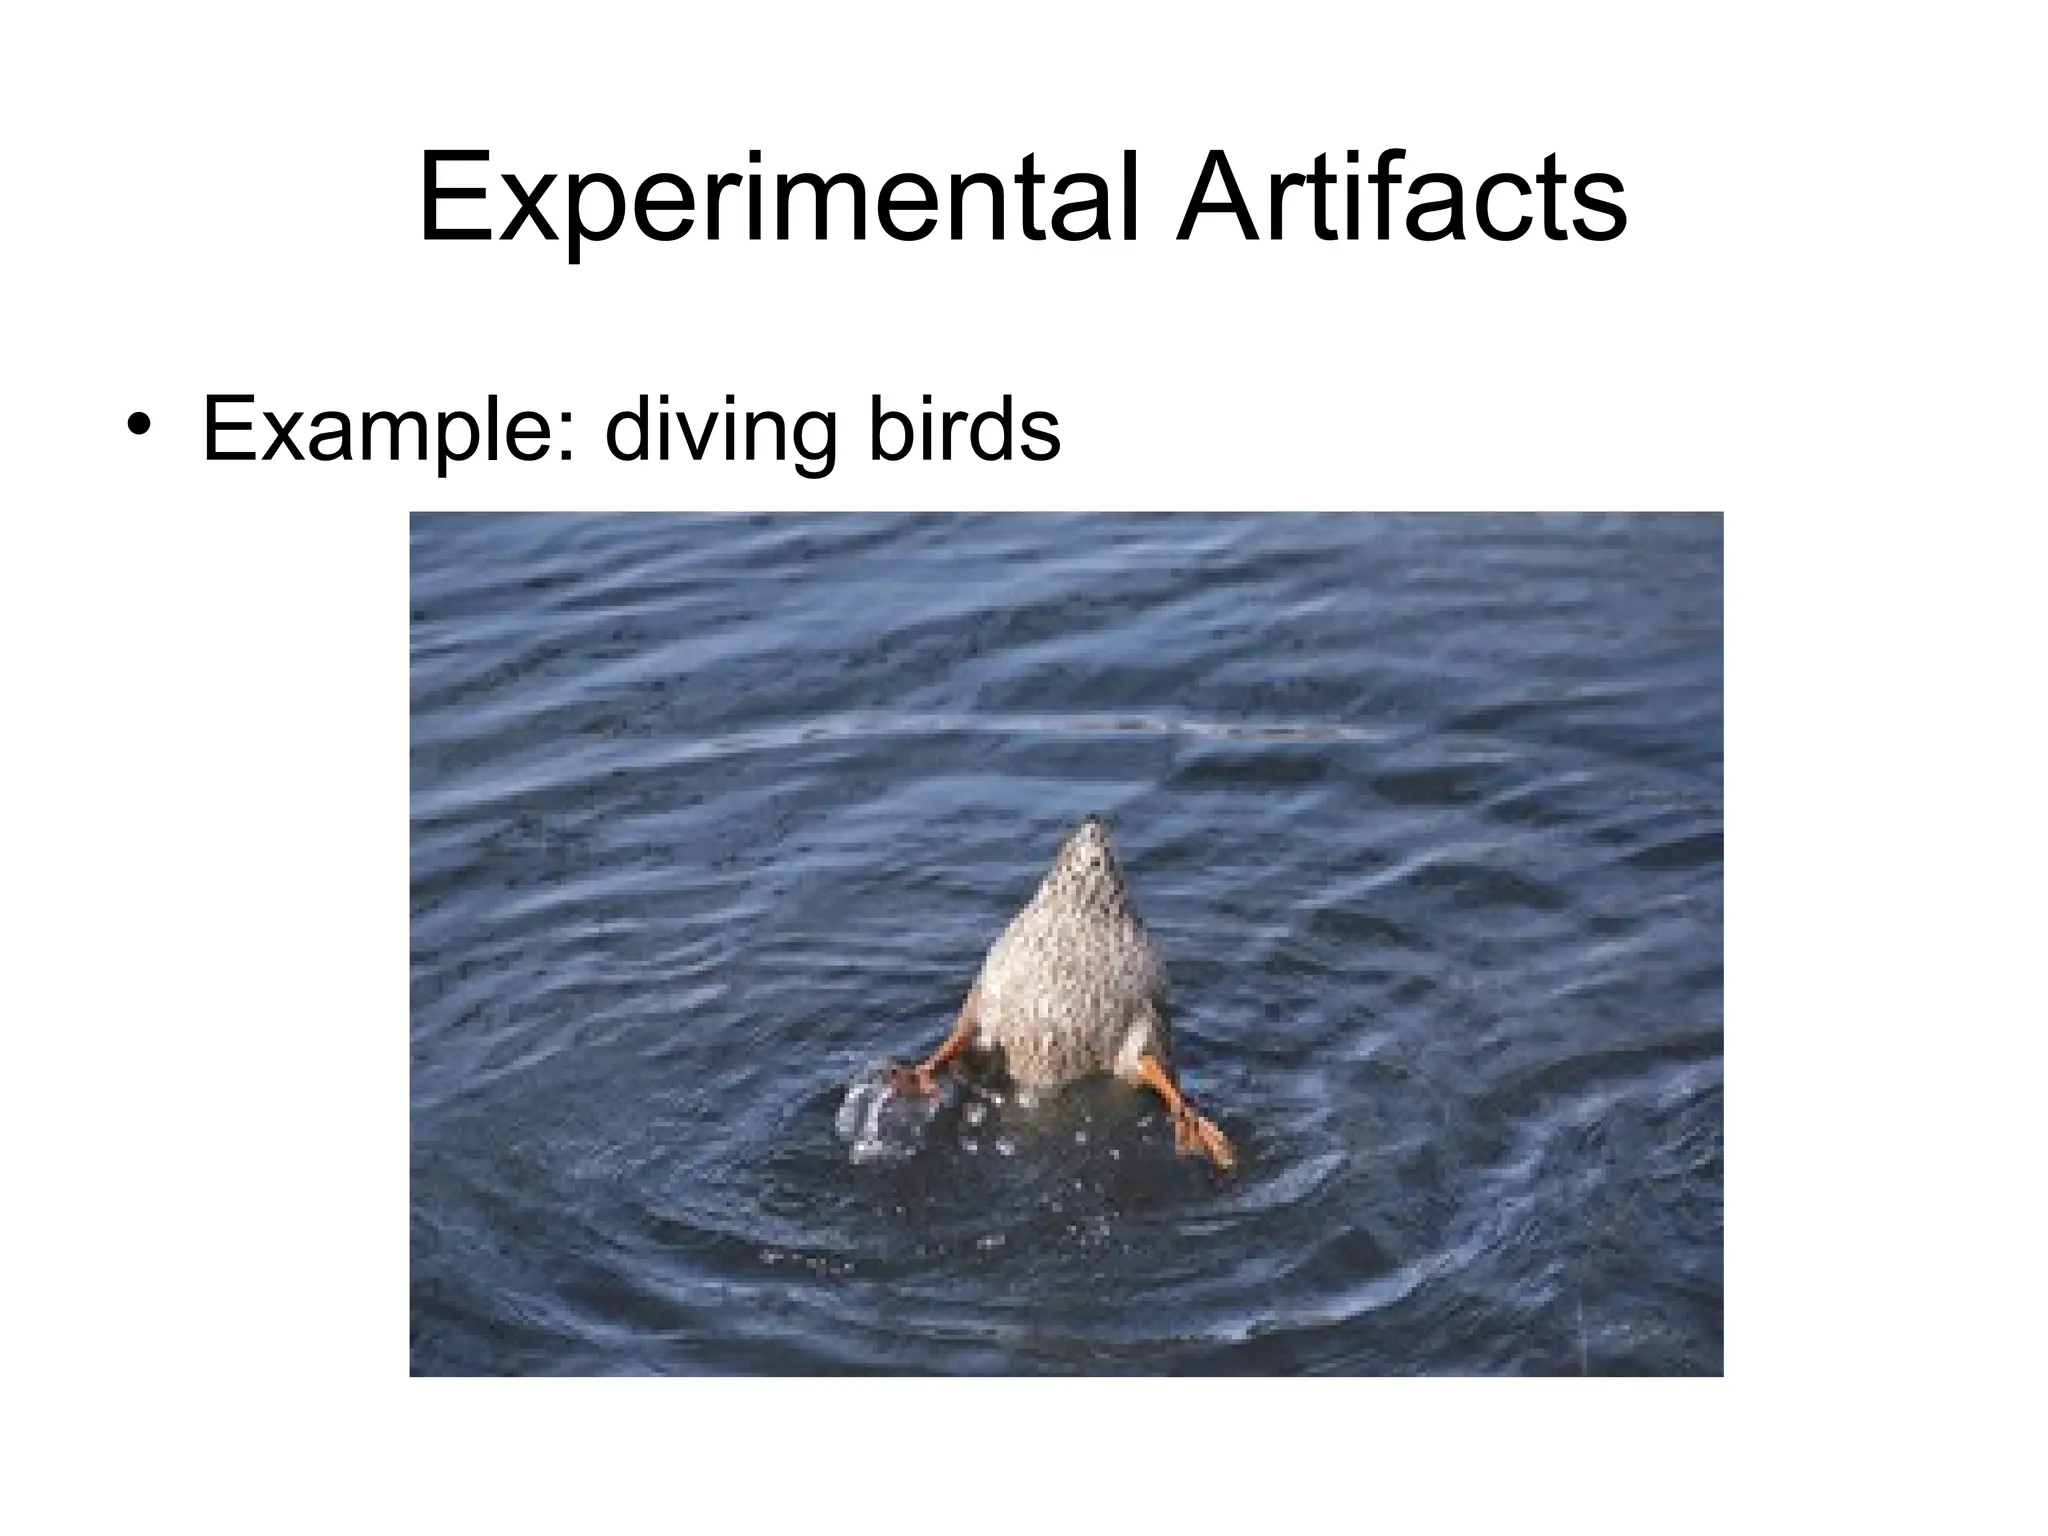
Experimental Artifacts
• Experimentalartifacts: a bias in a
measurement produced by unintended
consequences of experimental procedures
• Conduct your experiments under as
natural of conditions as possible to avoid
artifacts
Goals of ExperimentalDesign
• Avoid experimental artifacts
• Eliminate bias
1. Use a simultaneous control group
2. Randomization
3. Blinding
• Reduce sampling error
1. Replication
2. Balance
3. Blocking
15.
Control Group
• Acontrol group is a group of subjects left
untreated for the treatment of interest but
otherwise experiencing the same
conditions as the treated subjects
• Example: one group of patients is given an
inert placebo
16.
The Placebo Effect
•Patients treated with placebos, including
sugar pills, often report improvement
• Example: up to 40% of patients with
chronic back pain report improvement
when treated with a placebo
• Even “sham surgeries” can have a positive
effect
• This is why you need a control group!
17.
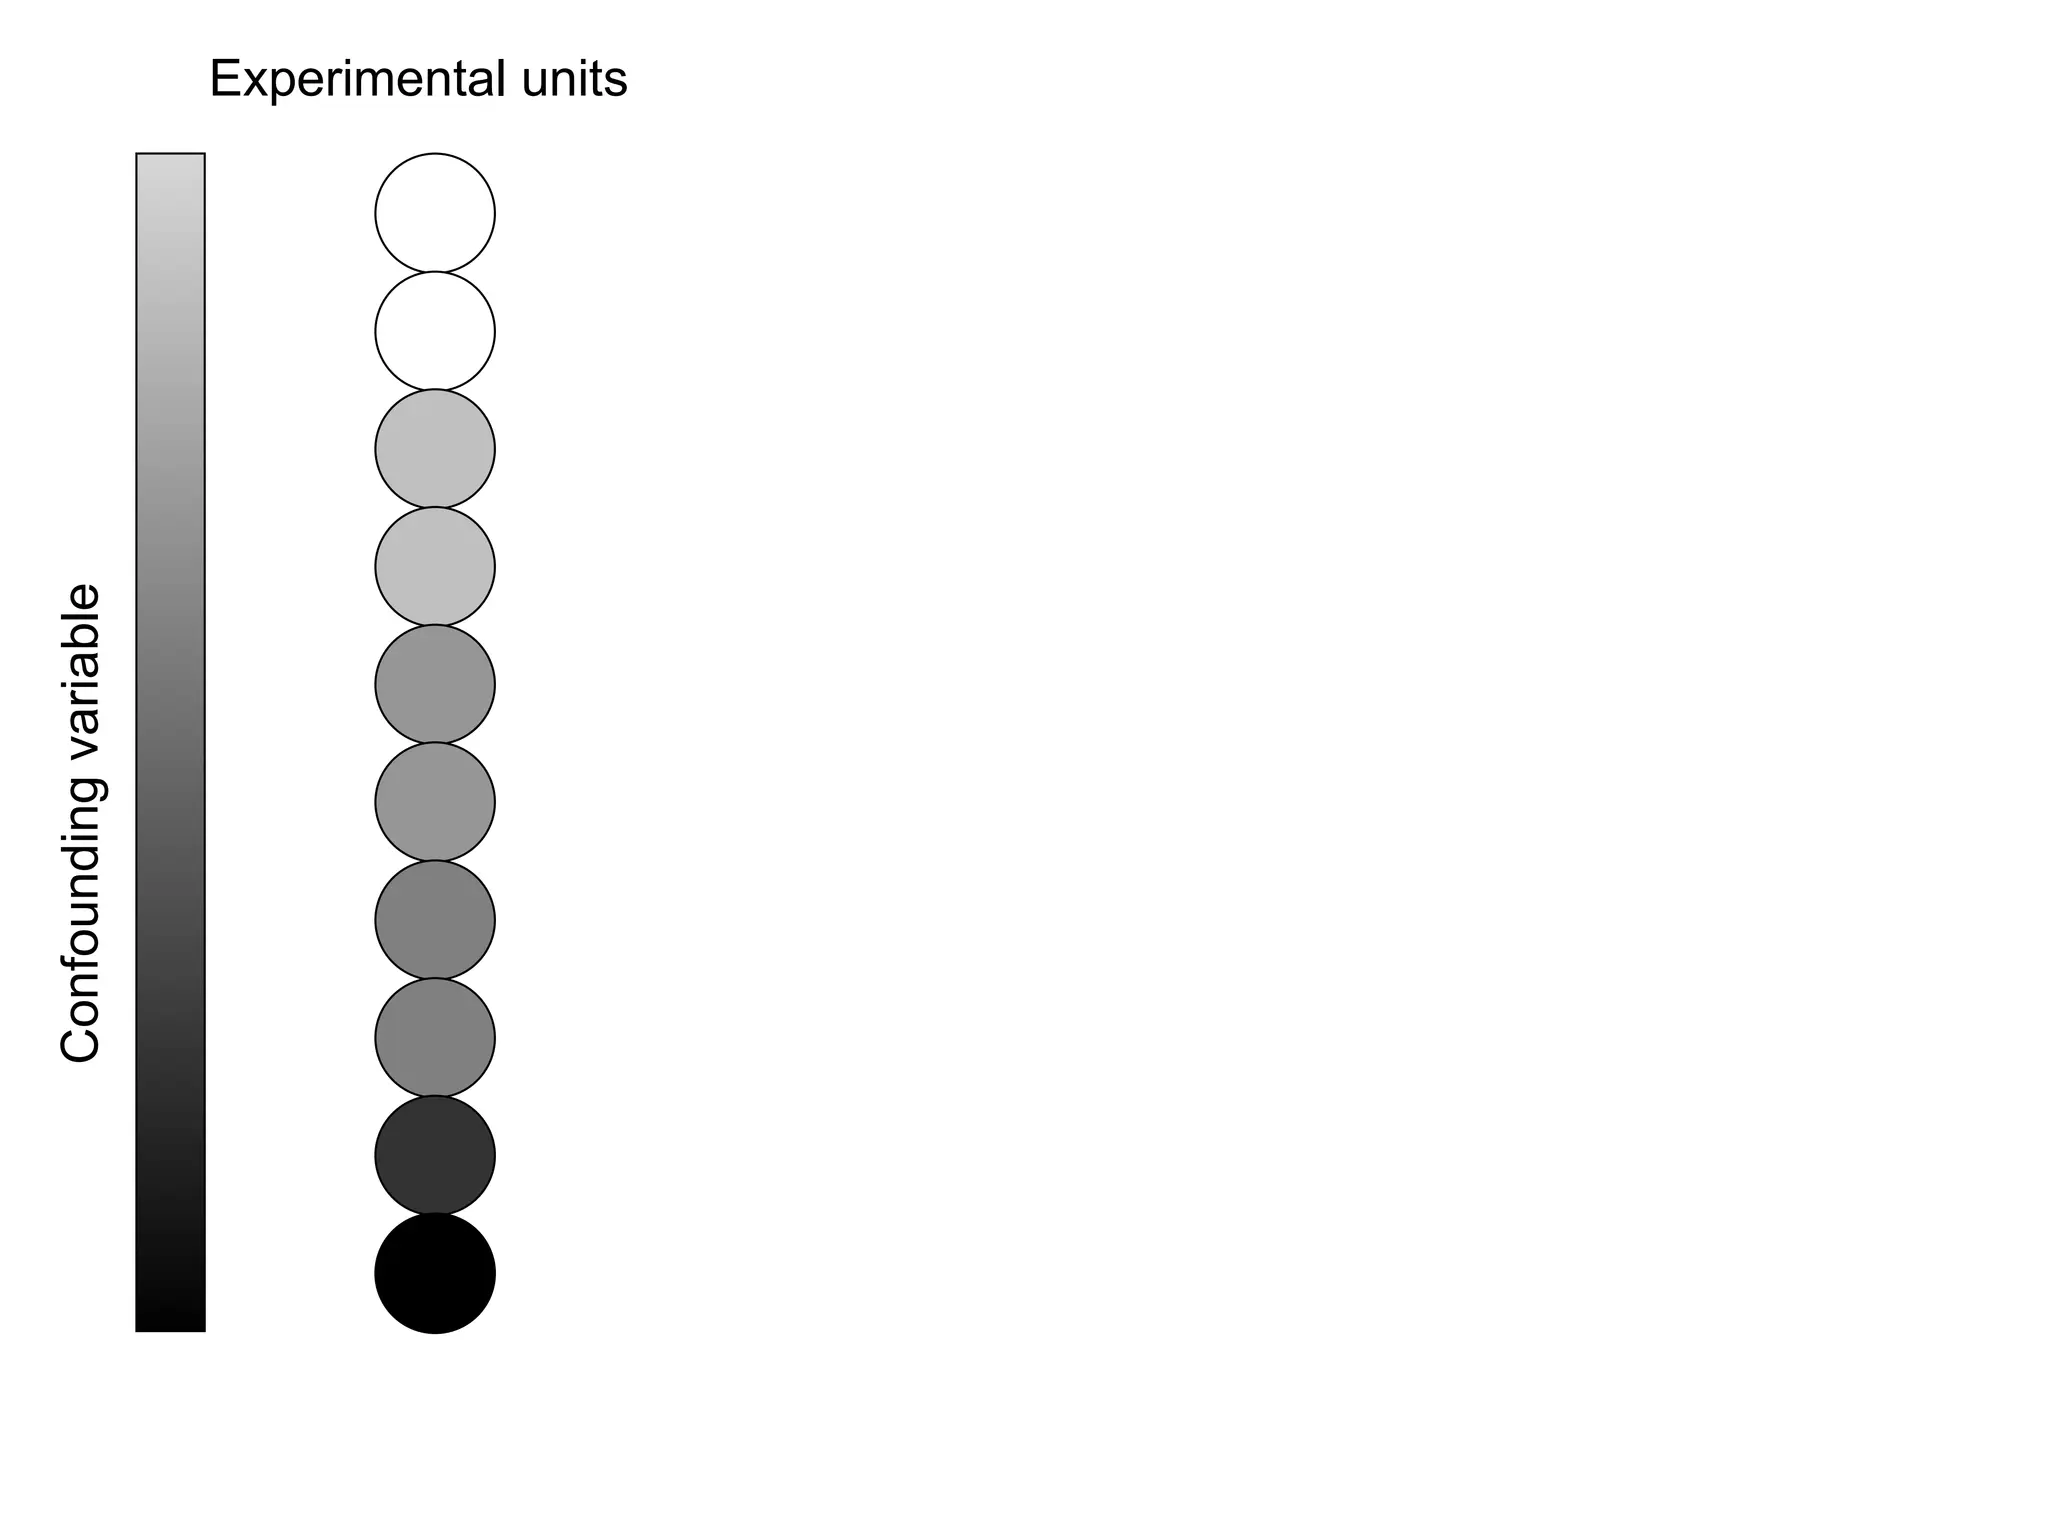
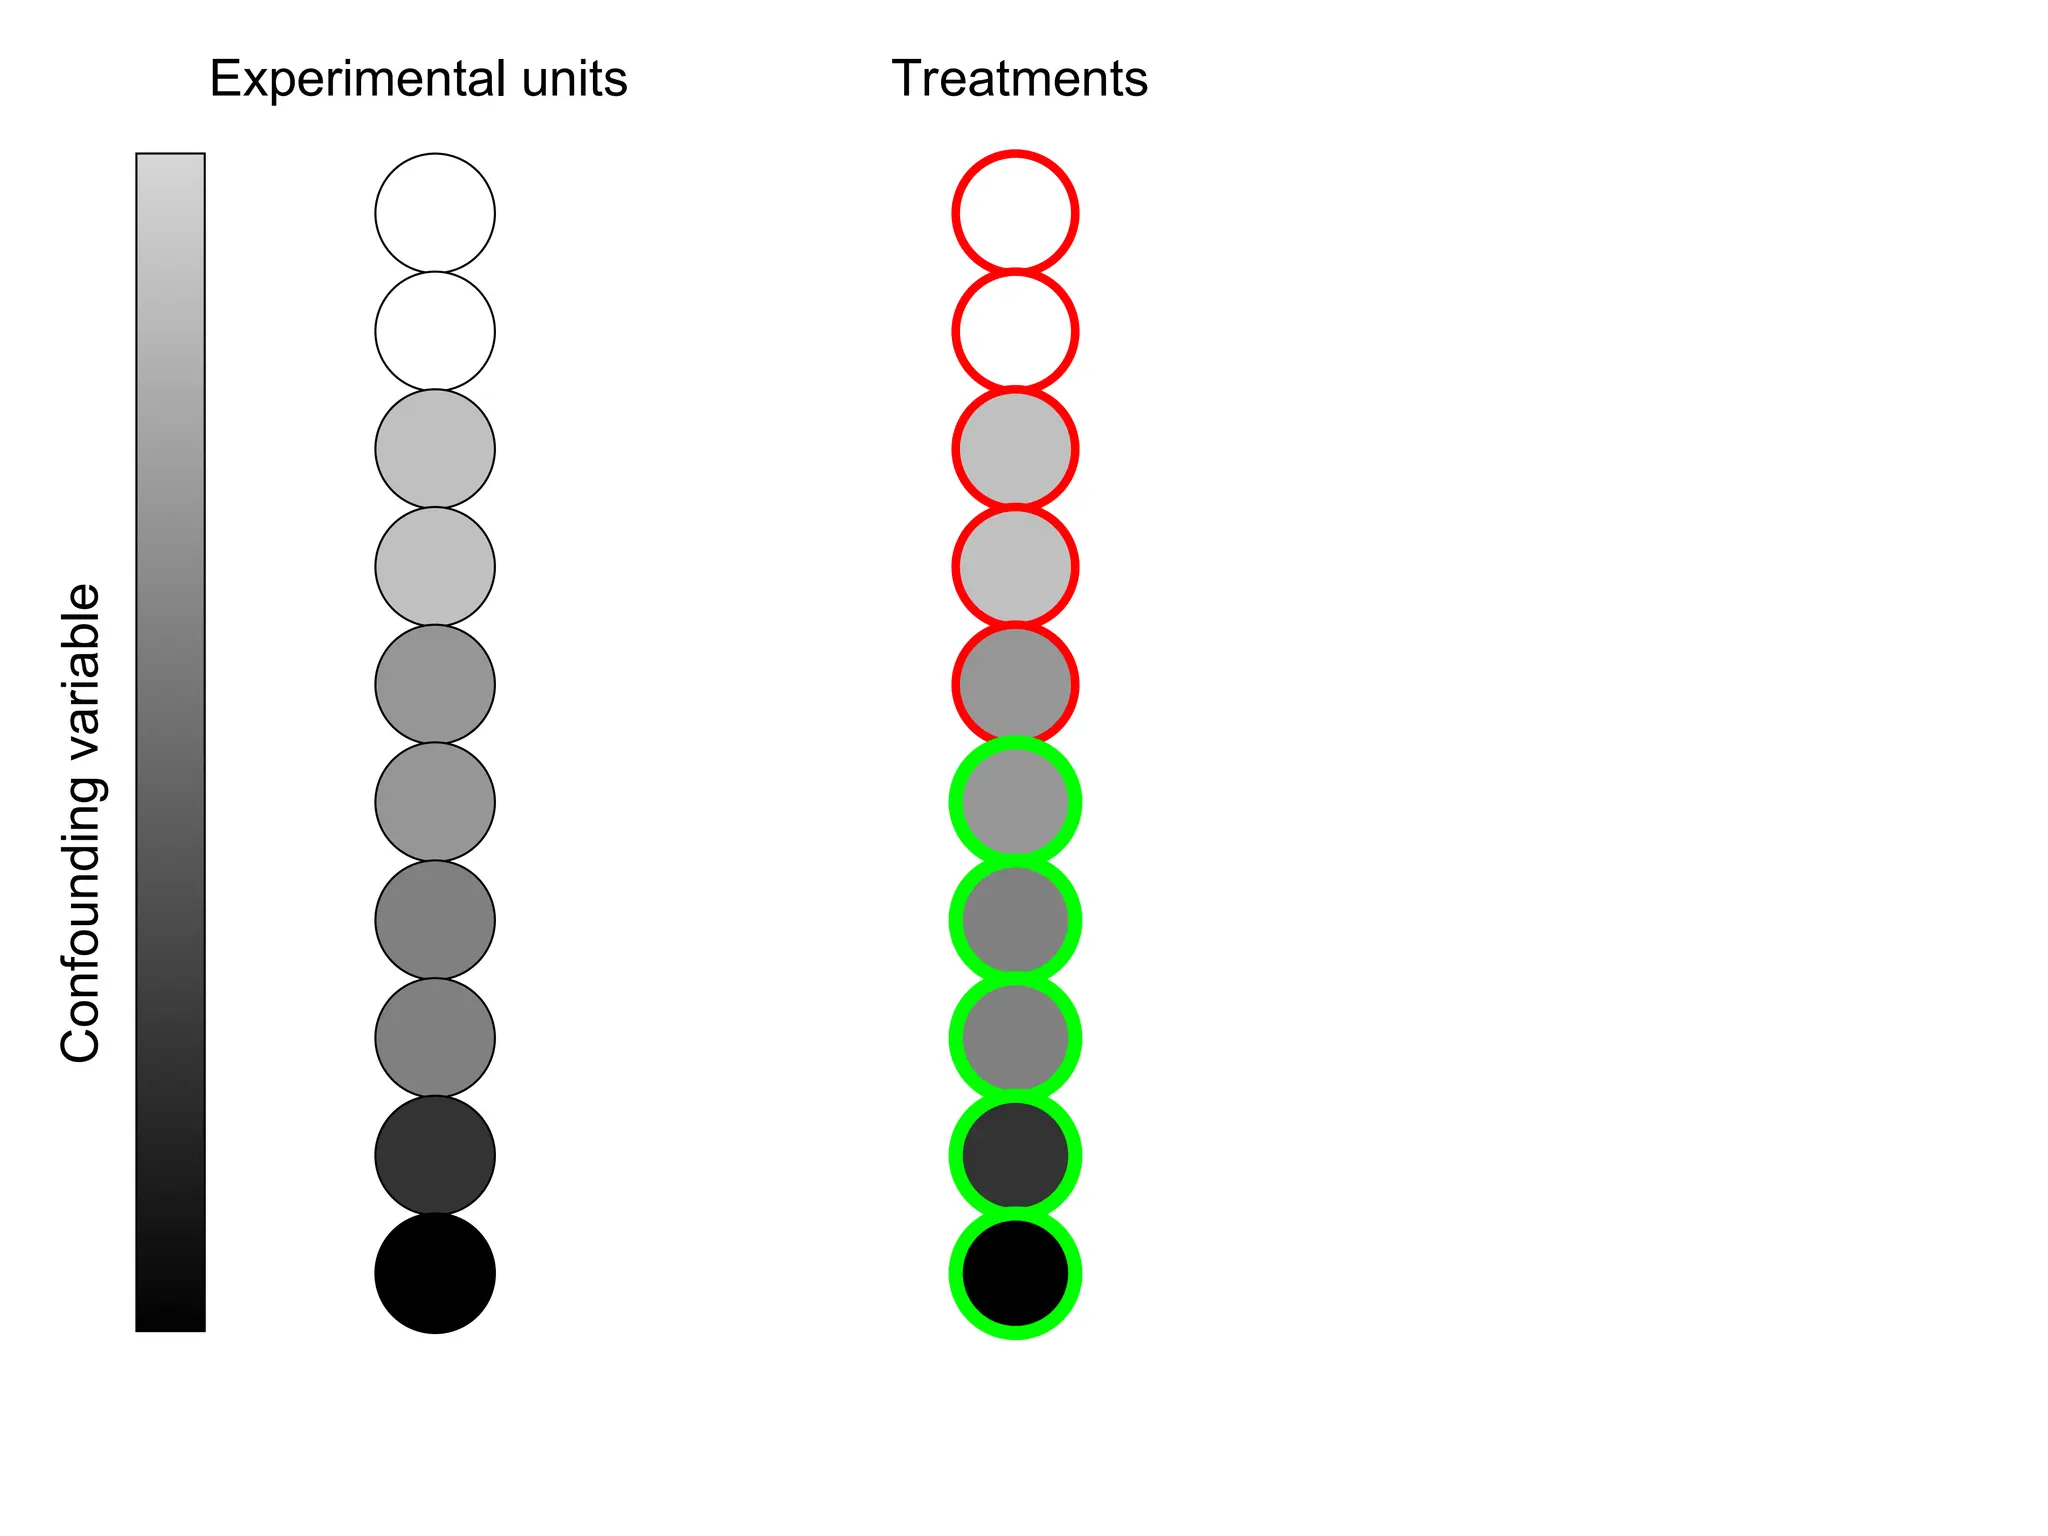
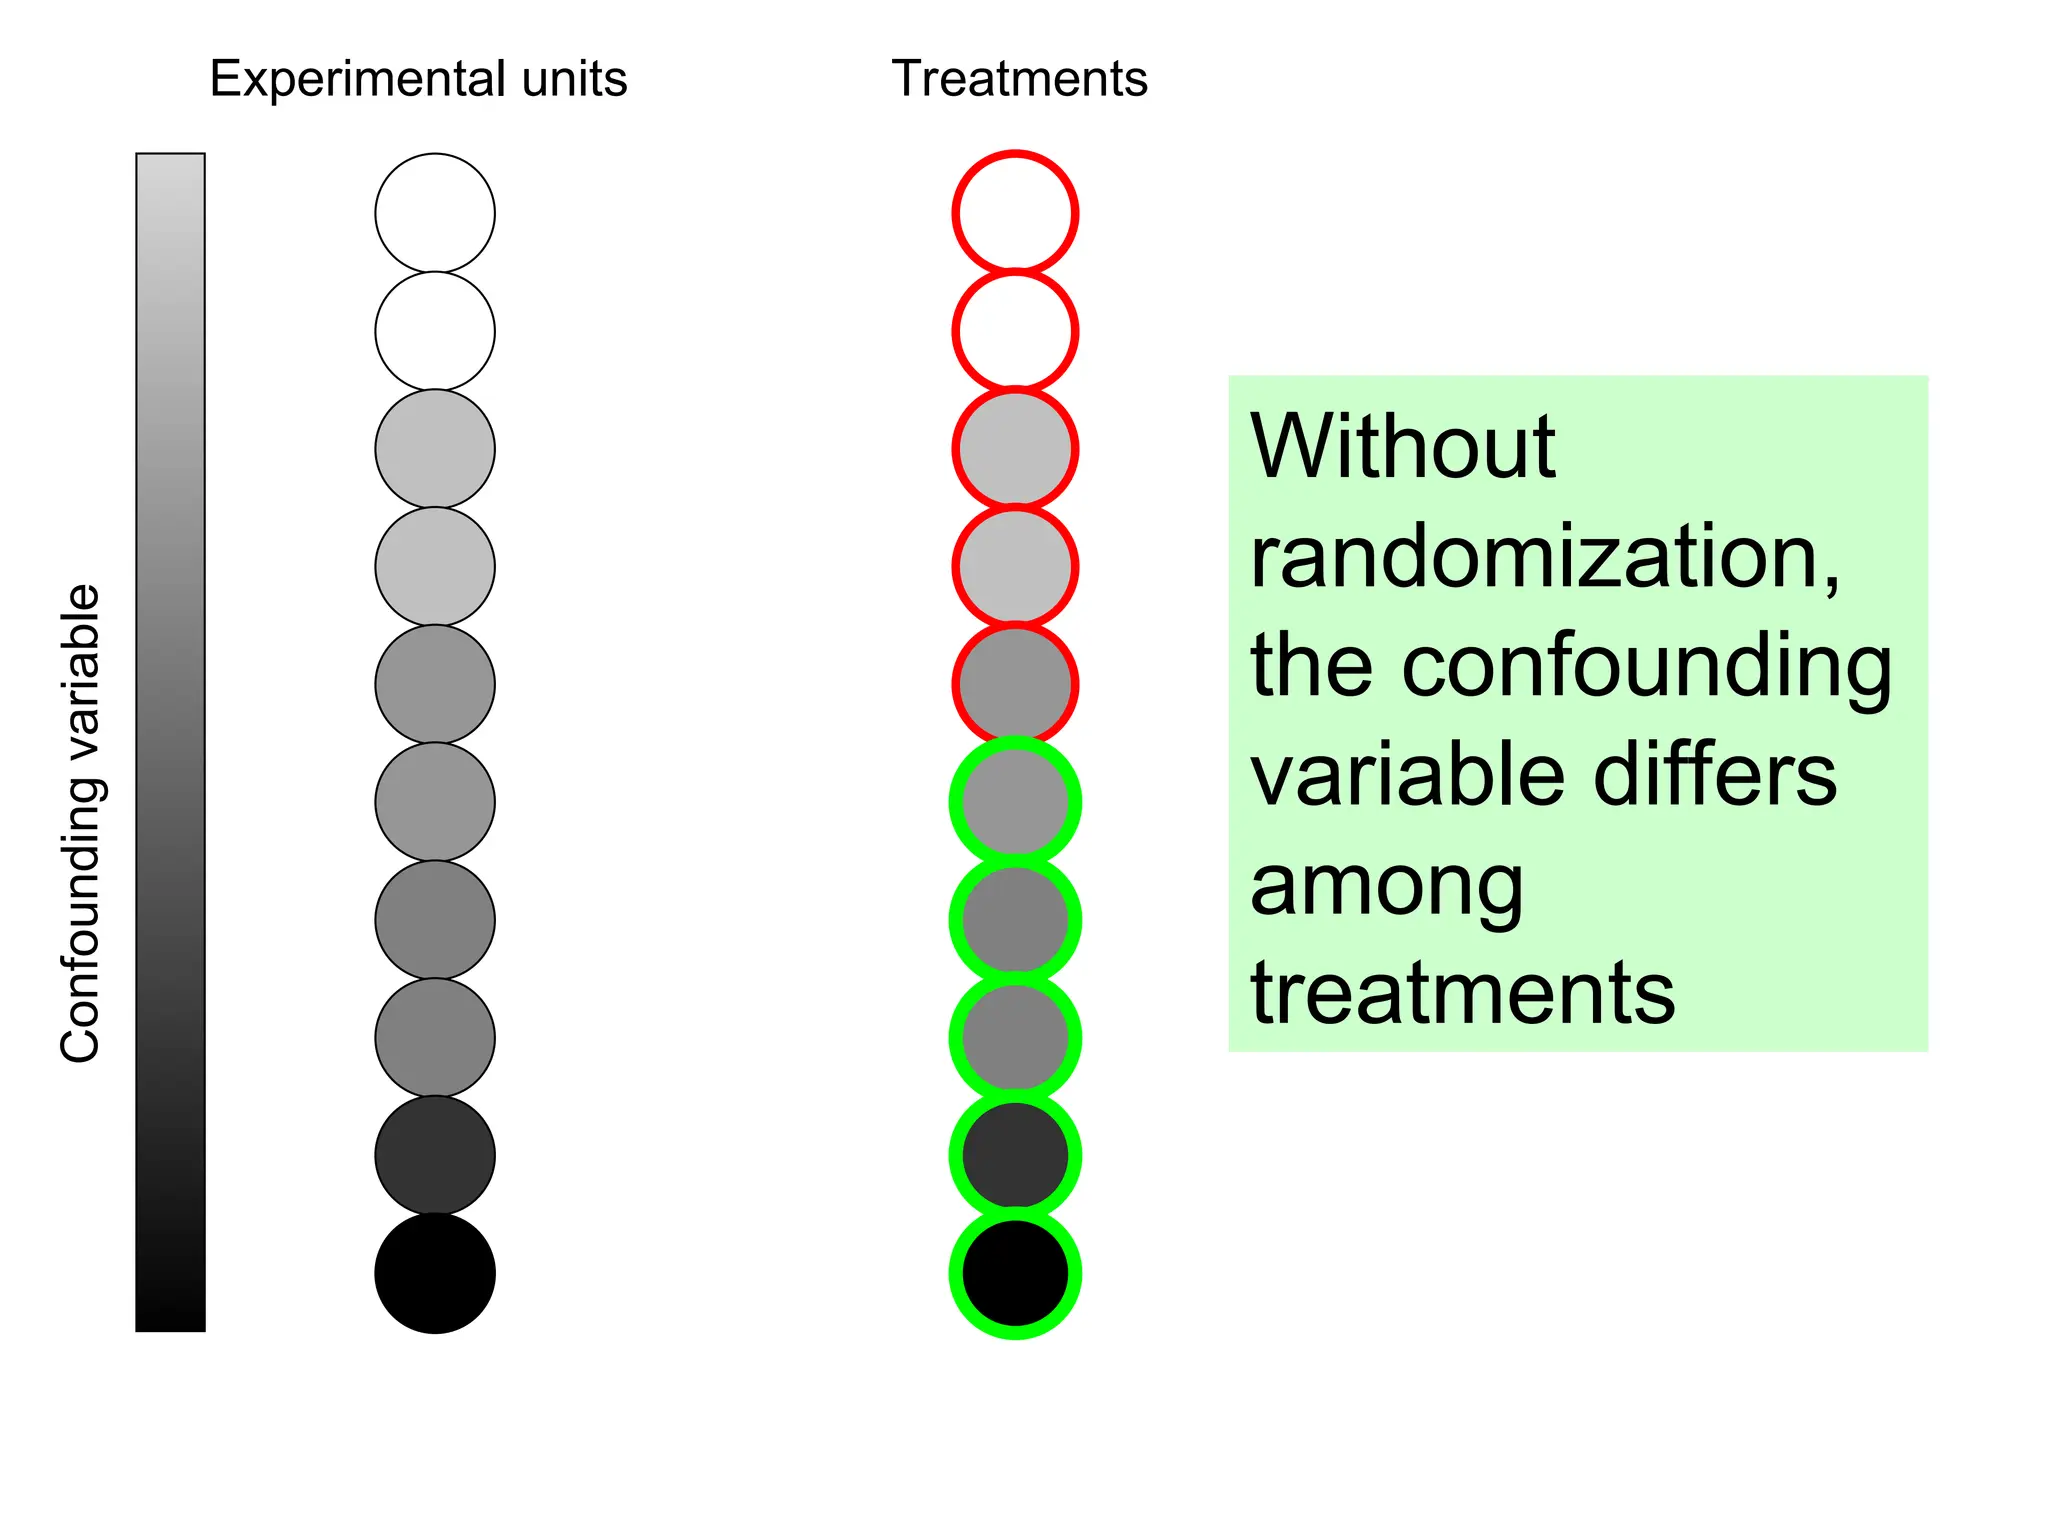
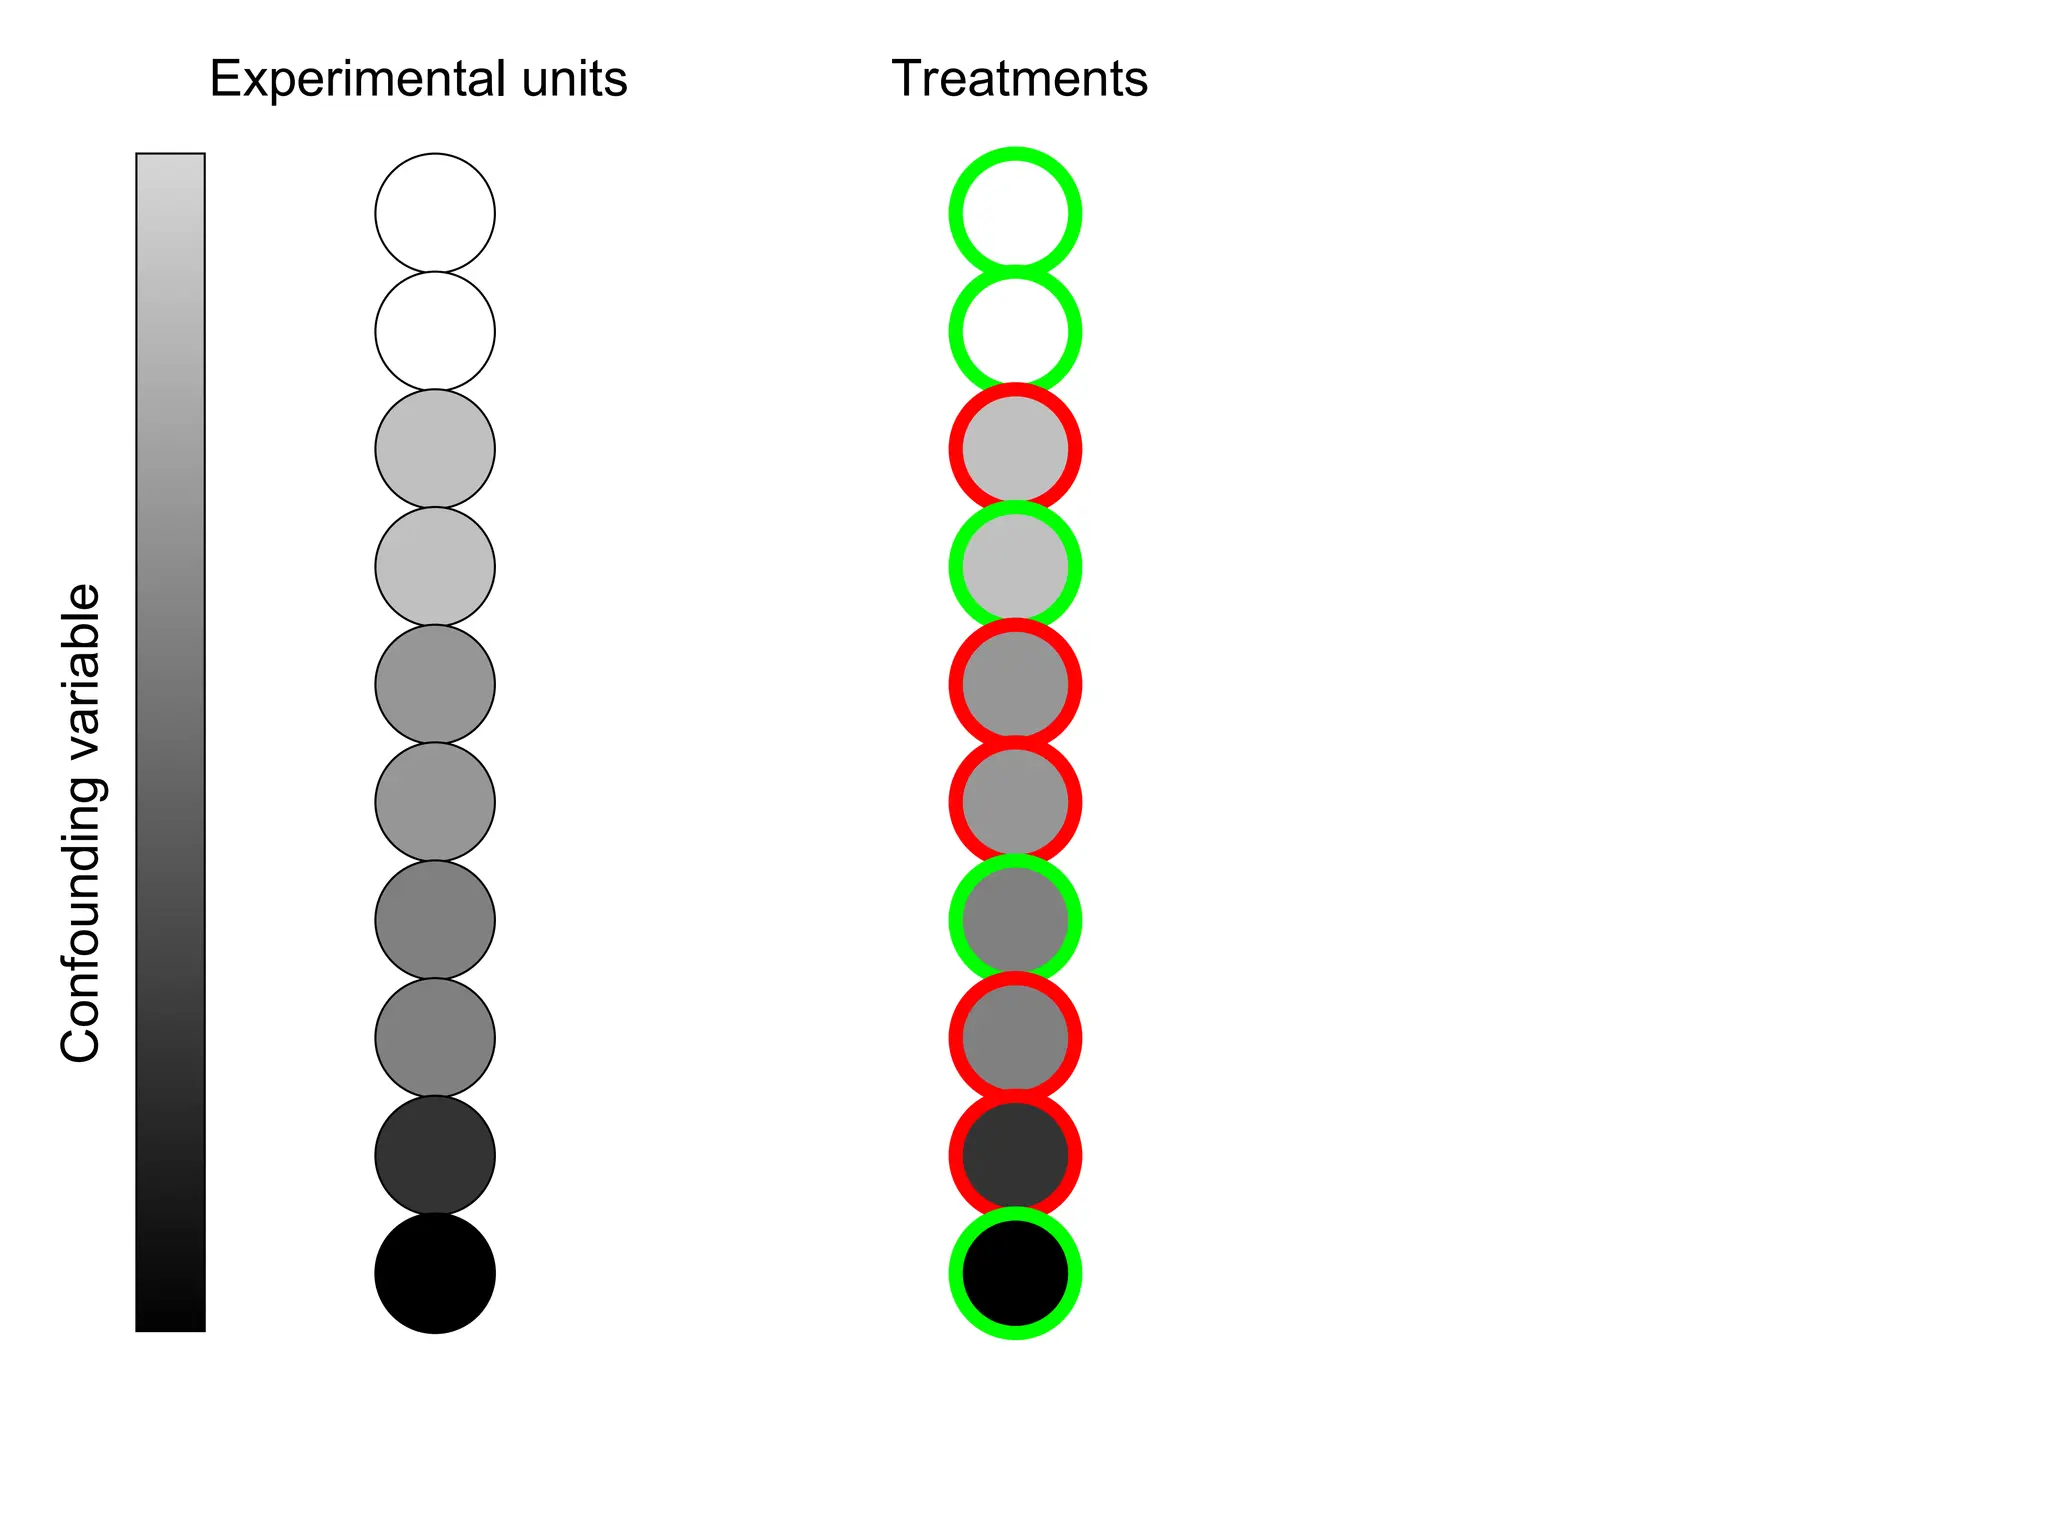
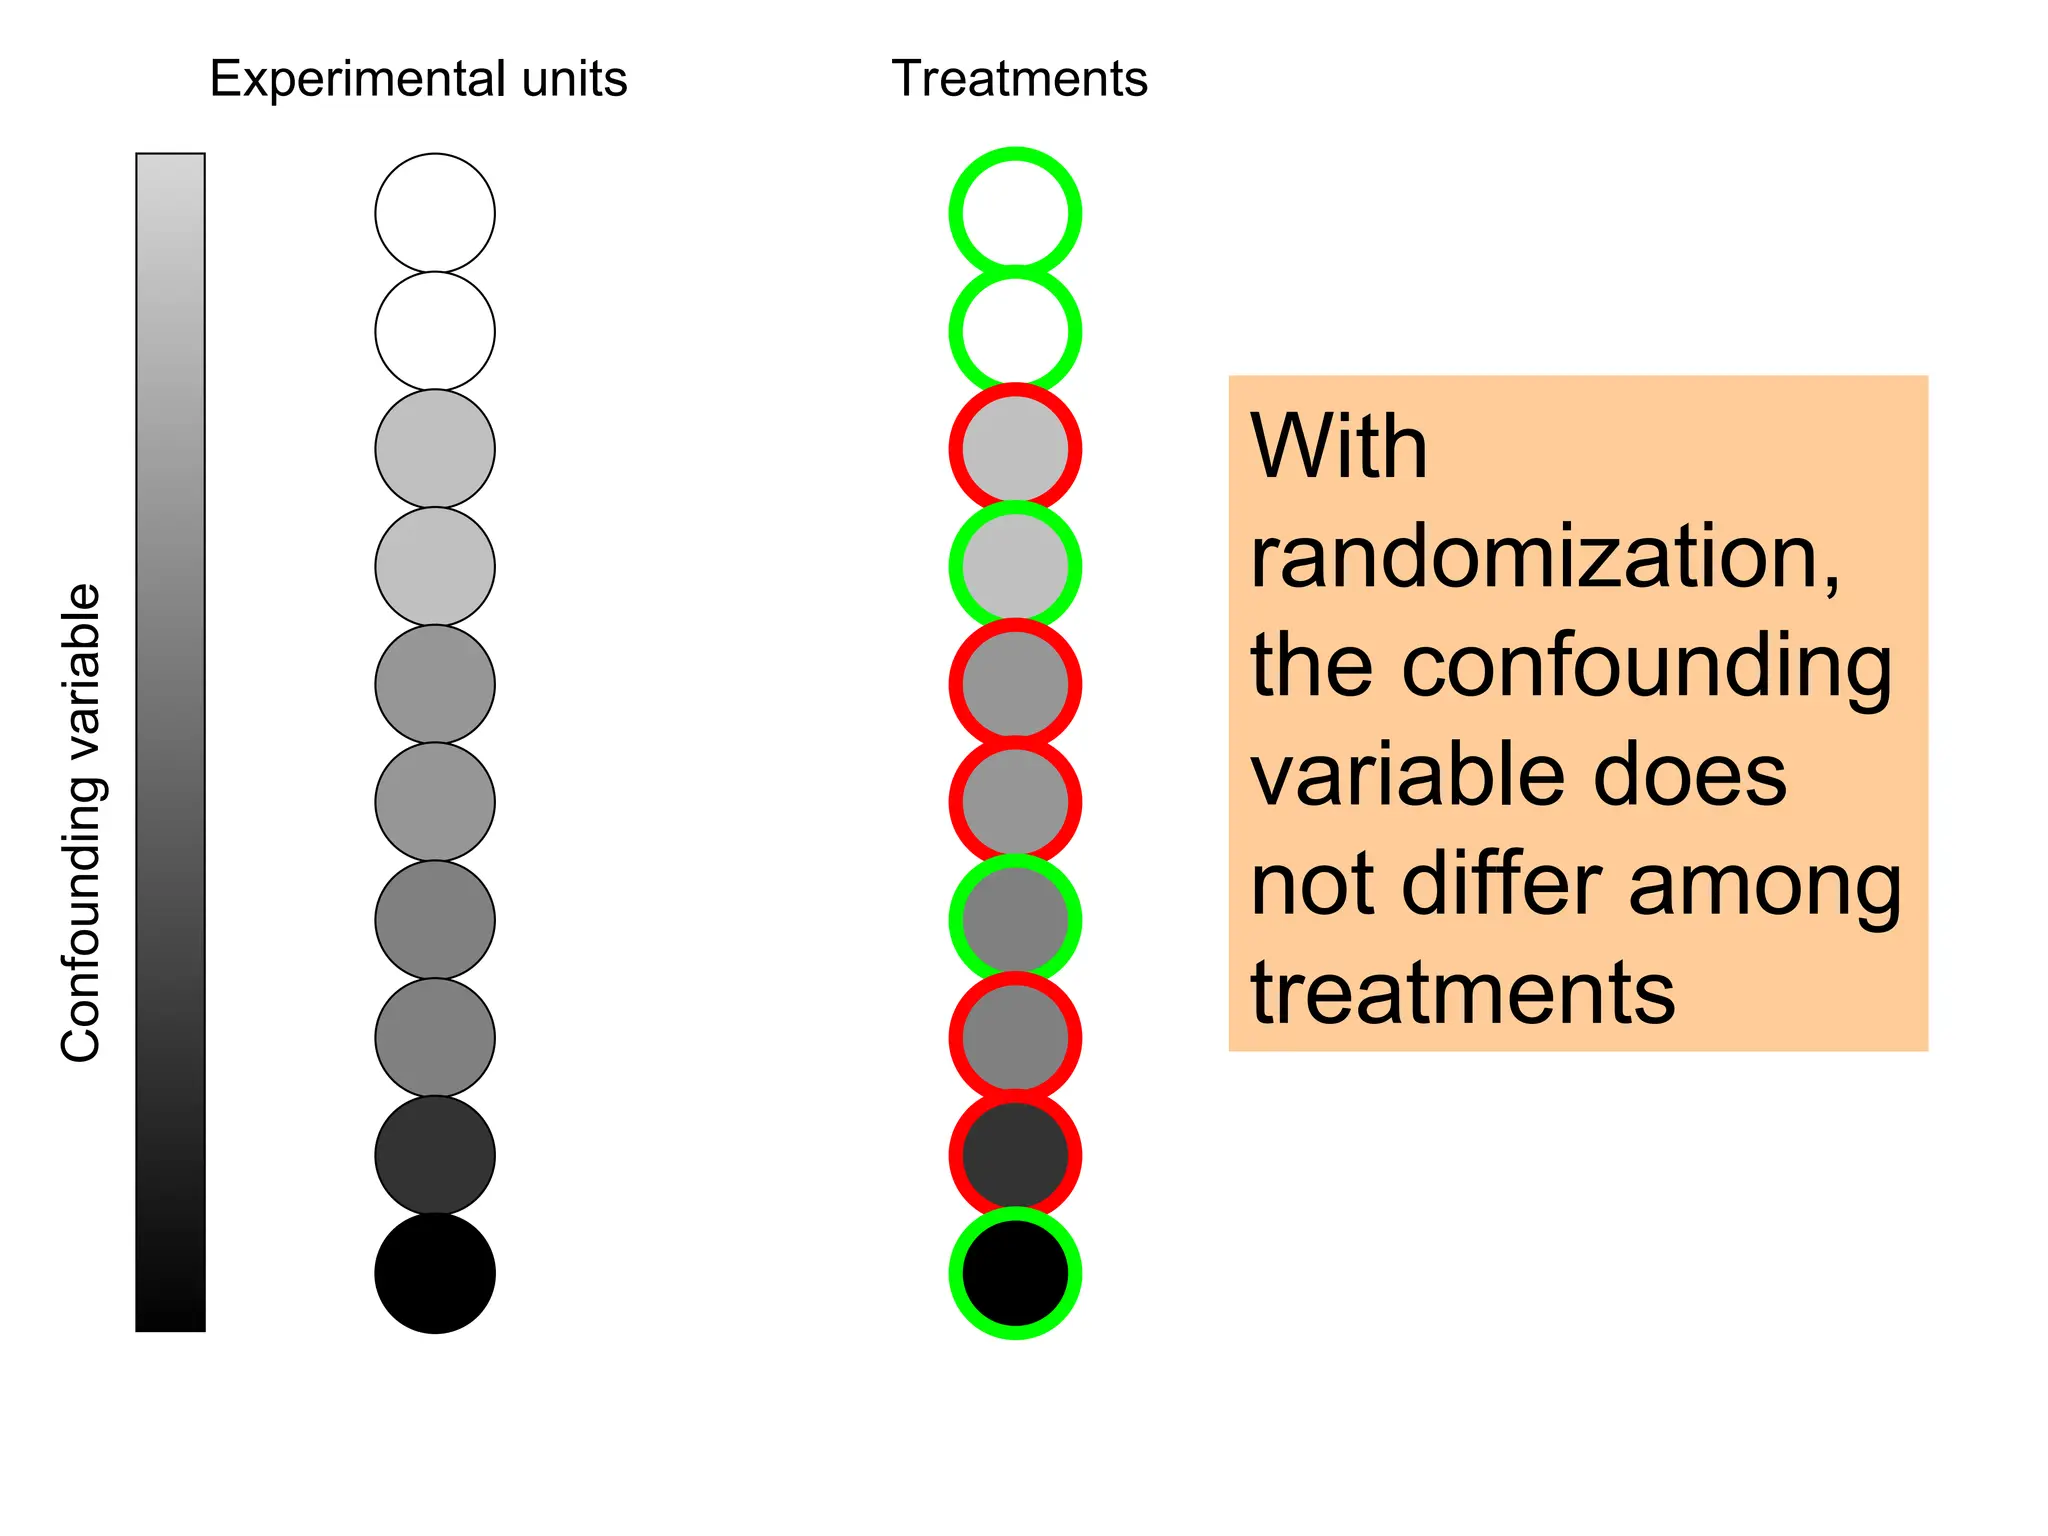
Randomization
• Randomization isthe random assignment
of treatments to units in an experimental
study
• Breaks the association between potential
confounding variables and the explanatory
variables
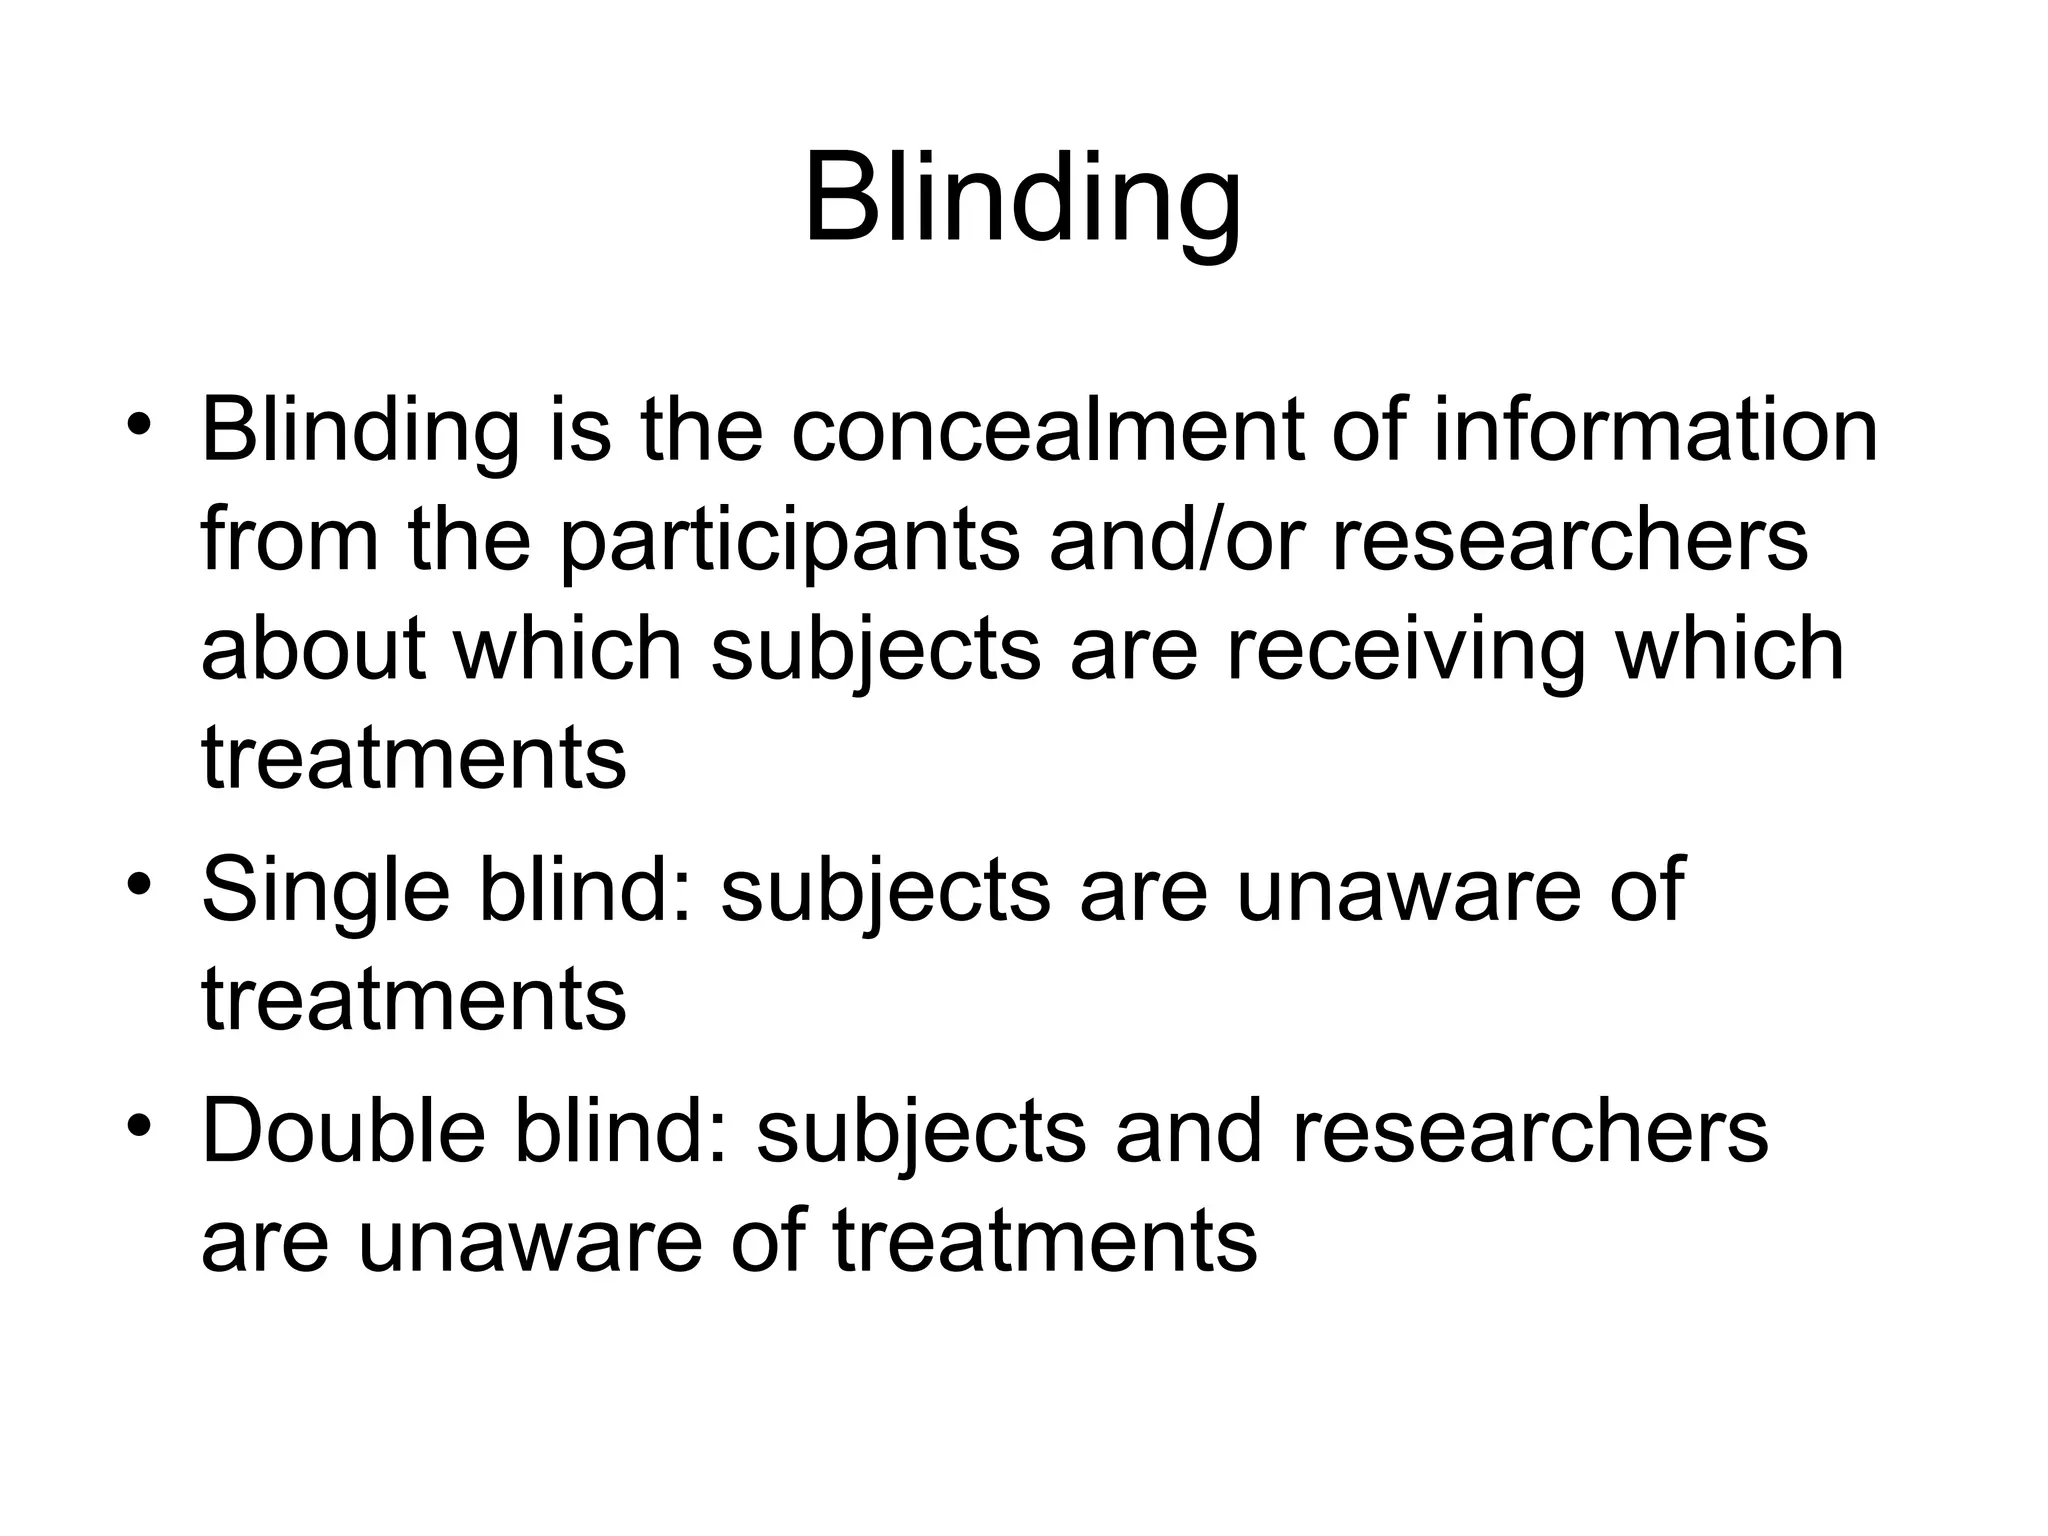
Blinding
• Blinding isthe concealment of information
from the participants and/or researchers
about which subjects are receiving which
treatments
• Single blind: subjects are unaware of
treatments
• Double blind: subjects and researchers
are unaware of treatments
24.
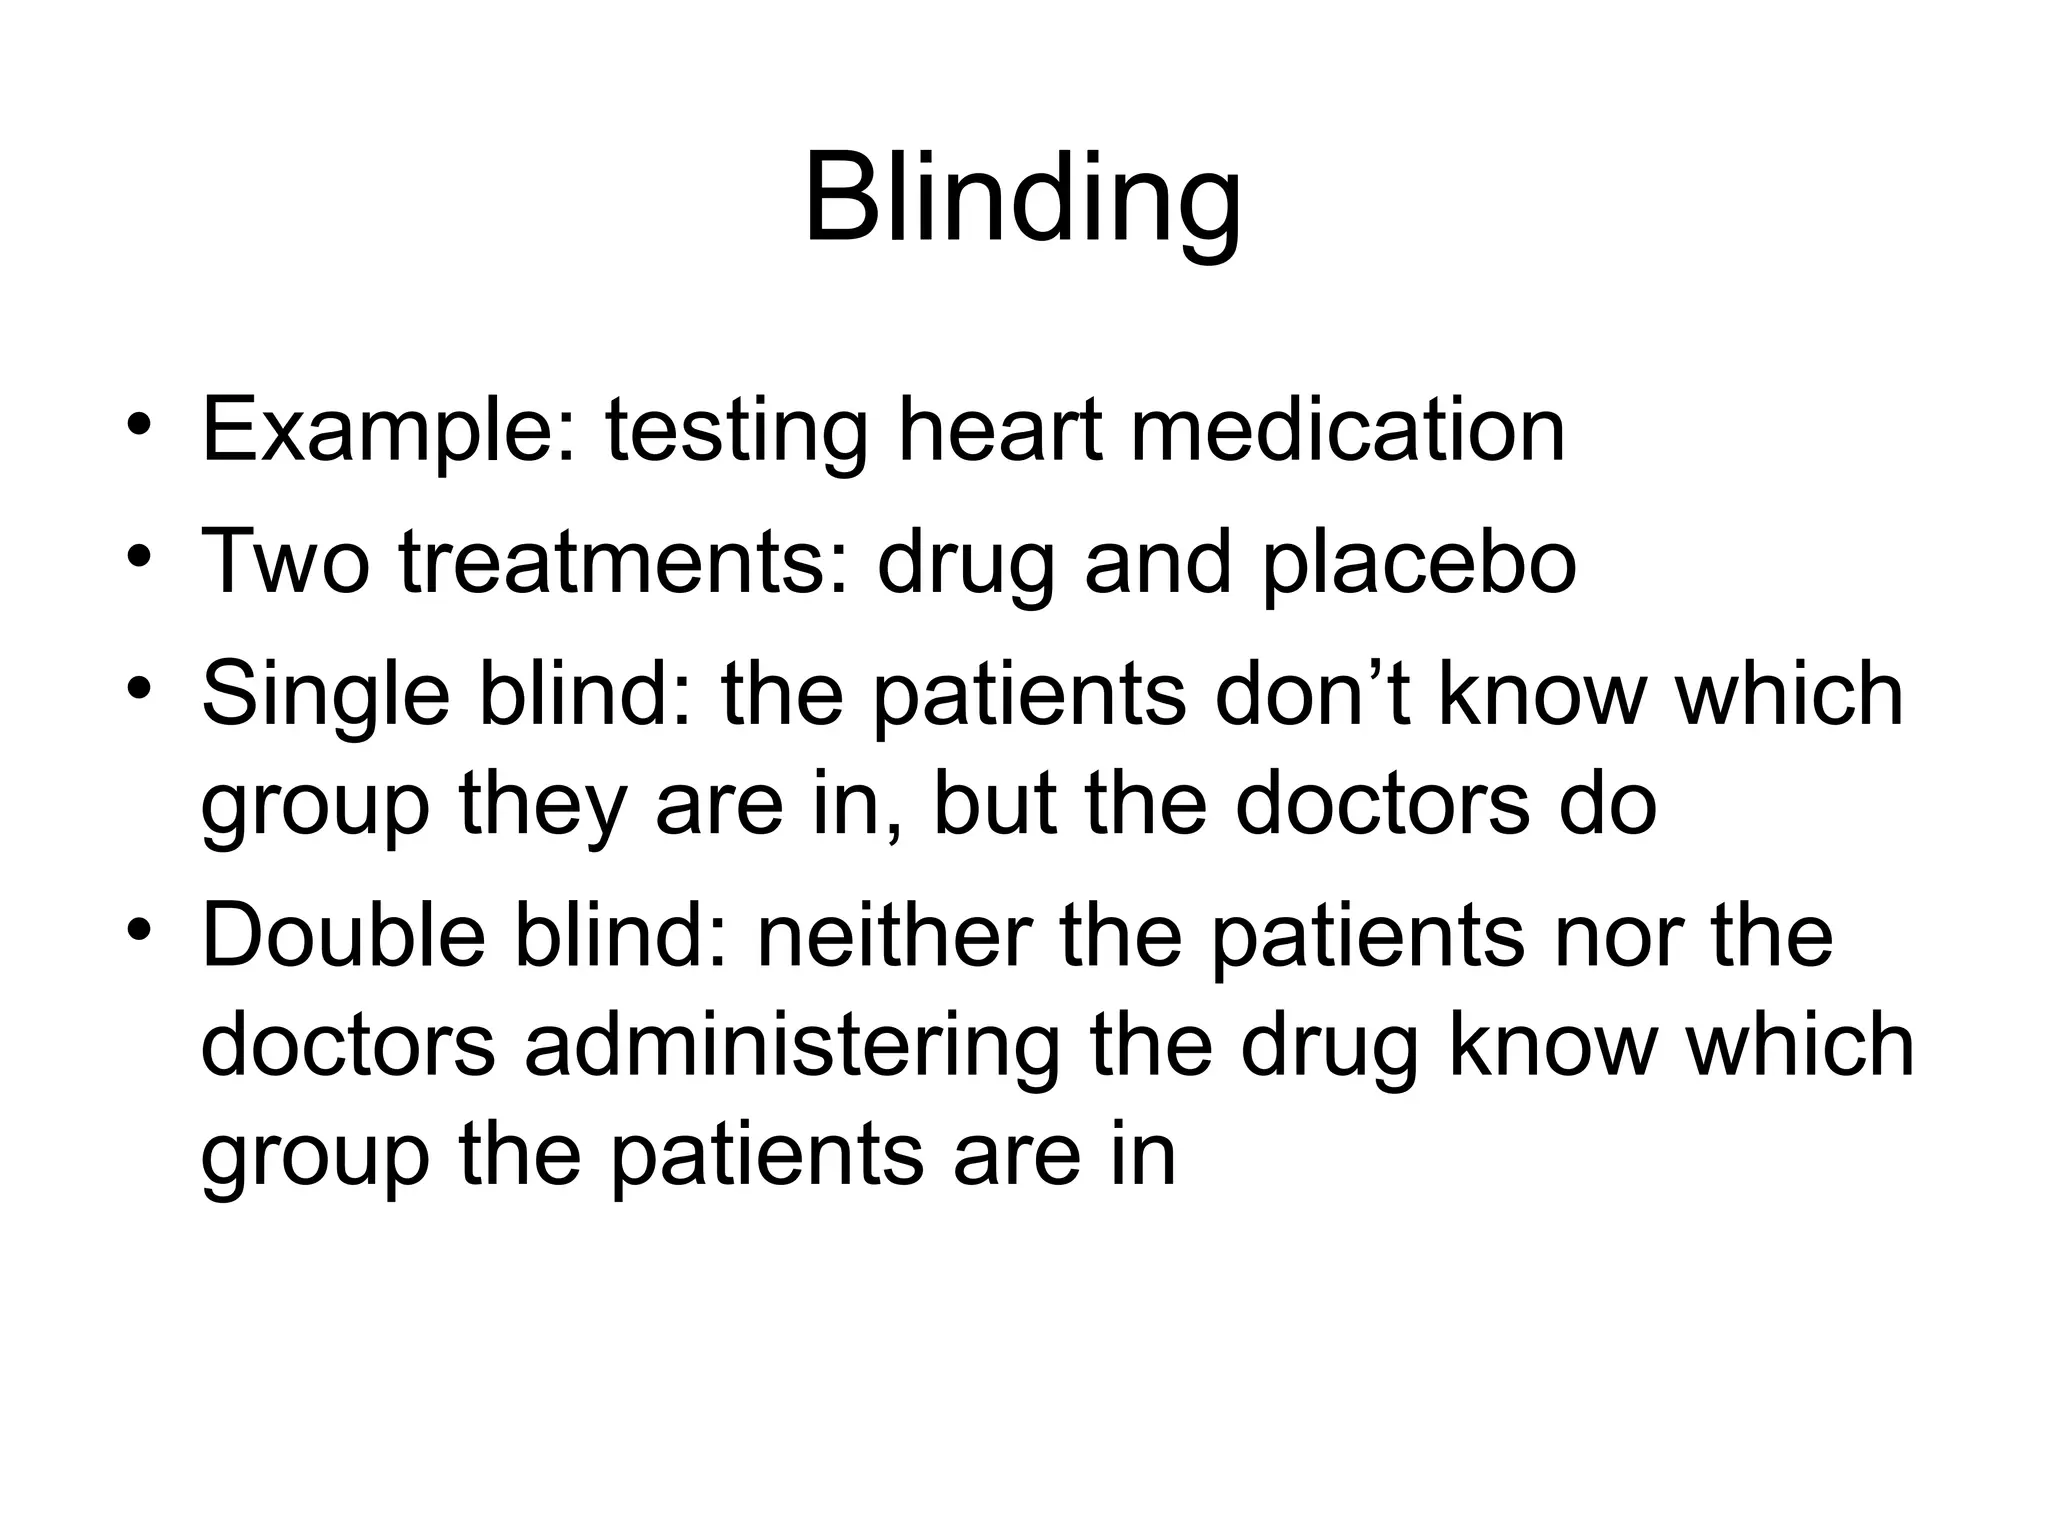
Blinding
• Example: testingheart medication
• Two treatments: drug and placebo
• Single blind: the patients don’t know which
group they are in, but the doctors do
• Double blind: neither the patients nor the
doctors administering the drug know which
group the patients are in
25.
Goals of ExperimentalDesign
• Avoid experimental artifacts
• Eliminate bias
1. Use a simultaneous control group
2. Randomization
3. Blinding
• Reduce sampling error
1. Replication
2. Balance
3. Blocking
26.
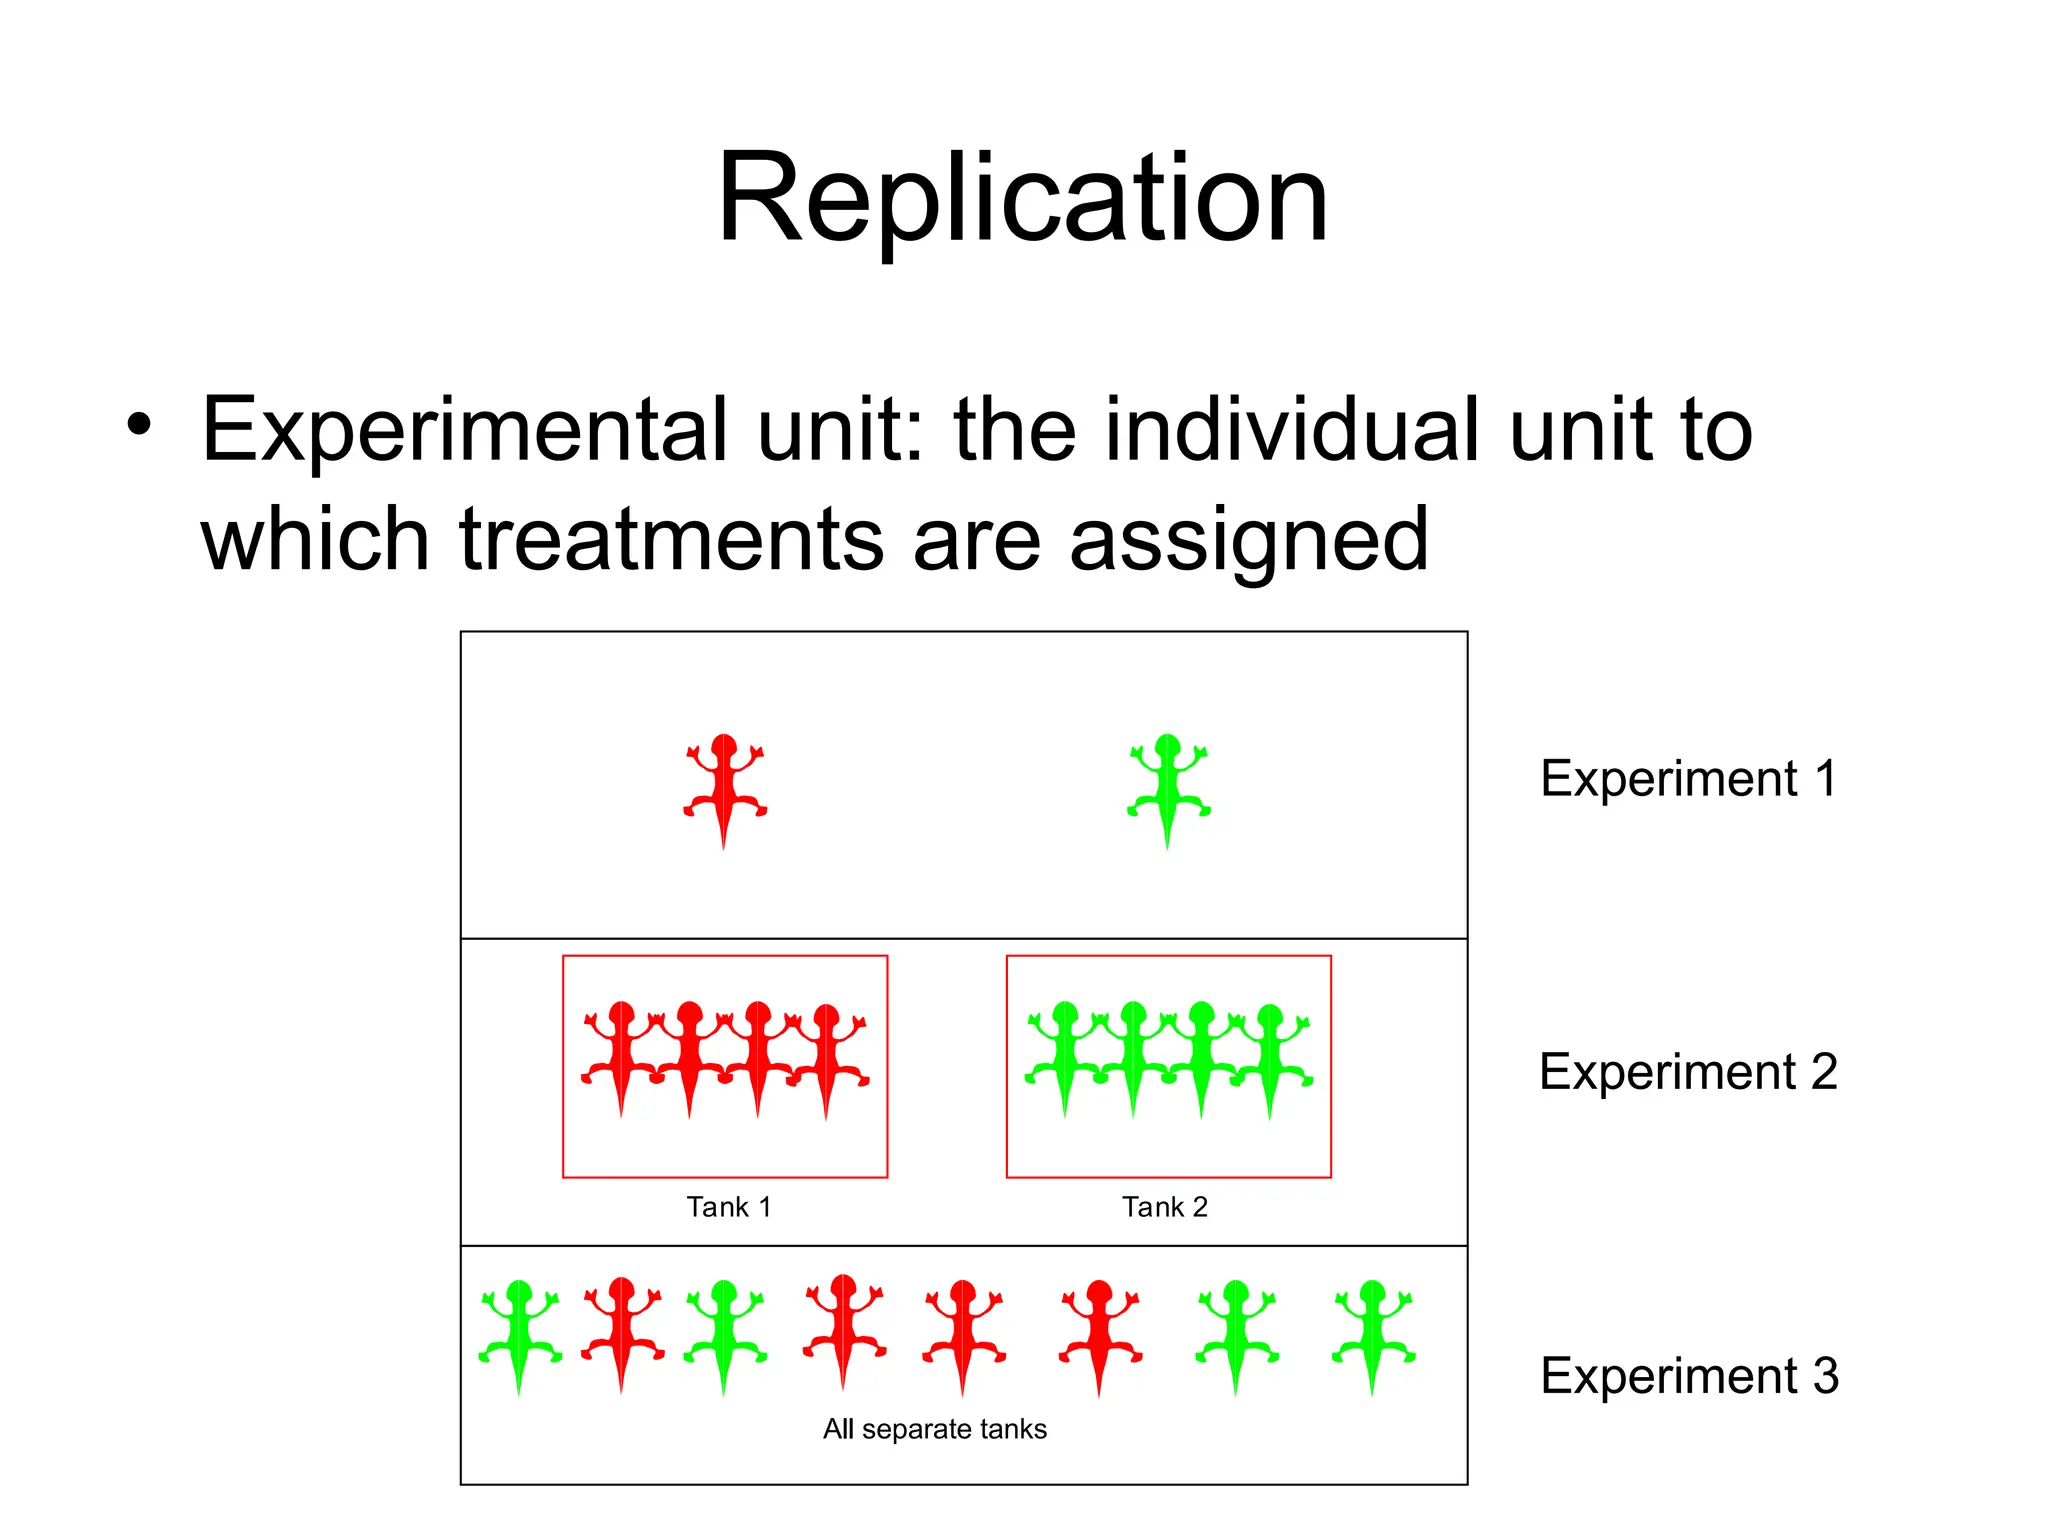
Replication
• Experimental unit:the individual unit to
which treatments are assigned
Experiment 1
Experiment 2
Experiment 3
Tank 1 Tank 2
All separate tanks
27.
Replication
• Experimental unit:the individual unit to
which treatments are assigned
Experiment 1
Experiment 2
Experiment 3
Tank 1 Tank 2
All separate tanks
2 Experimental
Units
2 Experimental
Units
8 Experimental
Units
28.
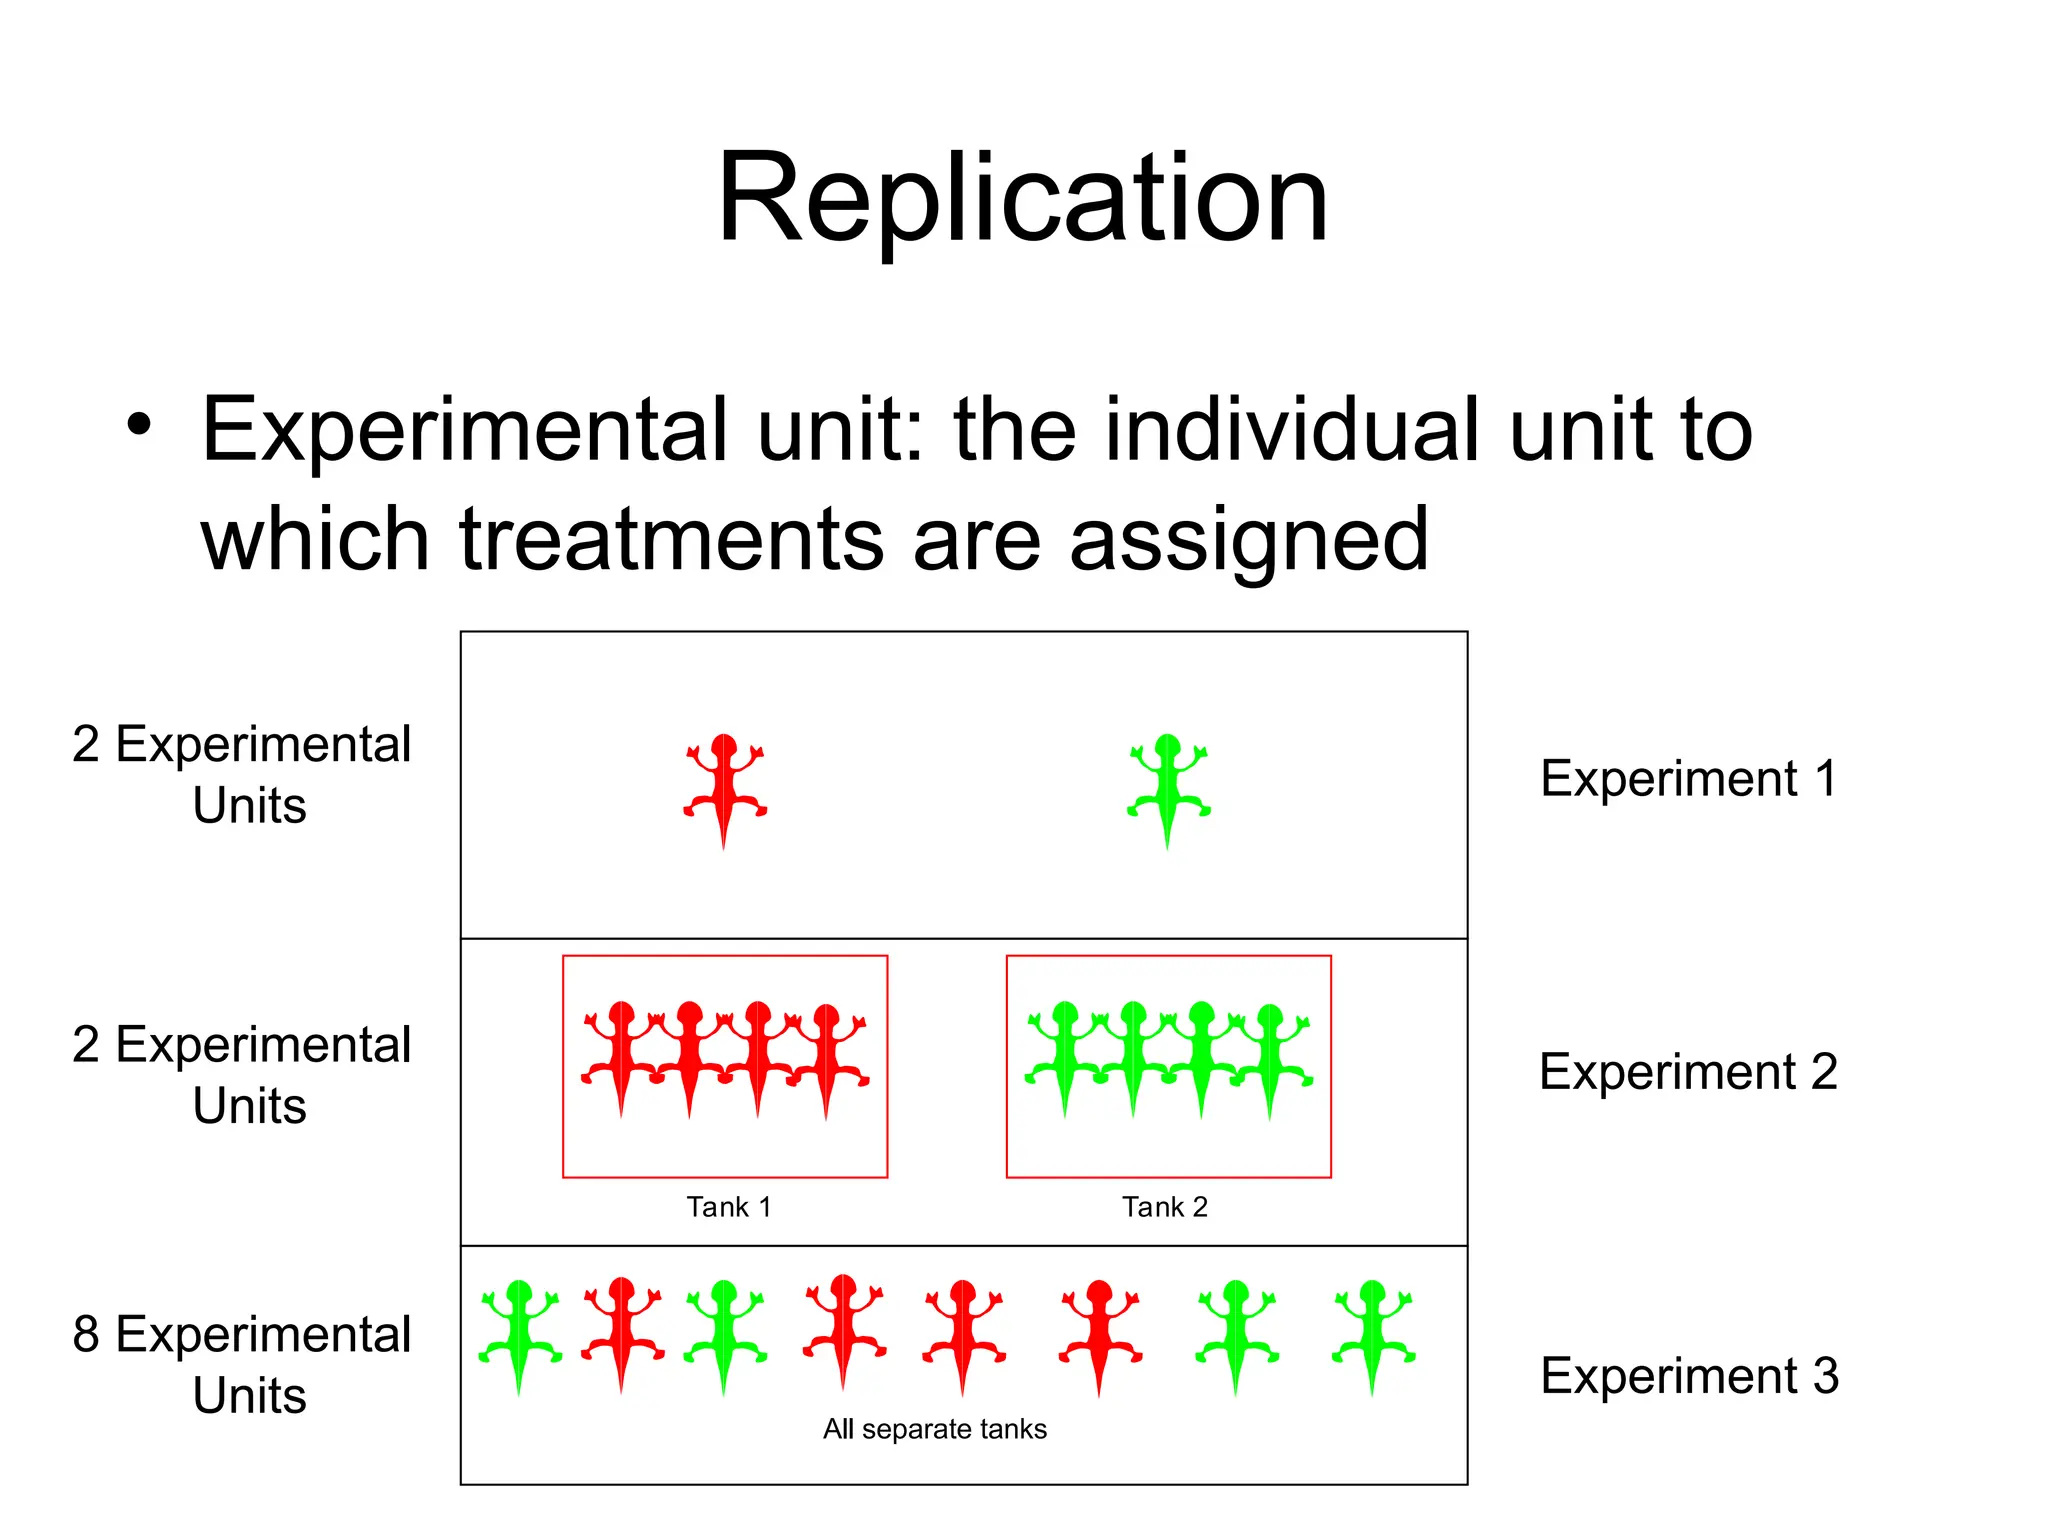
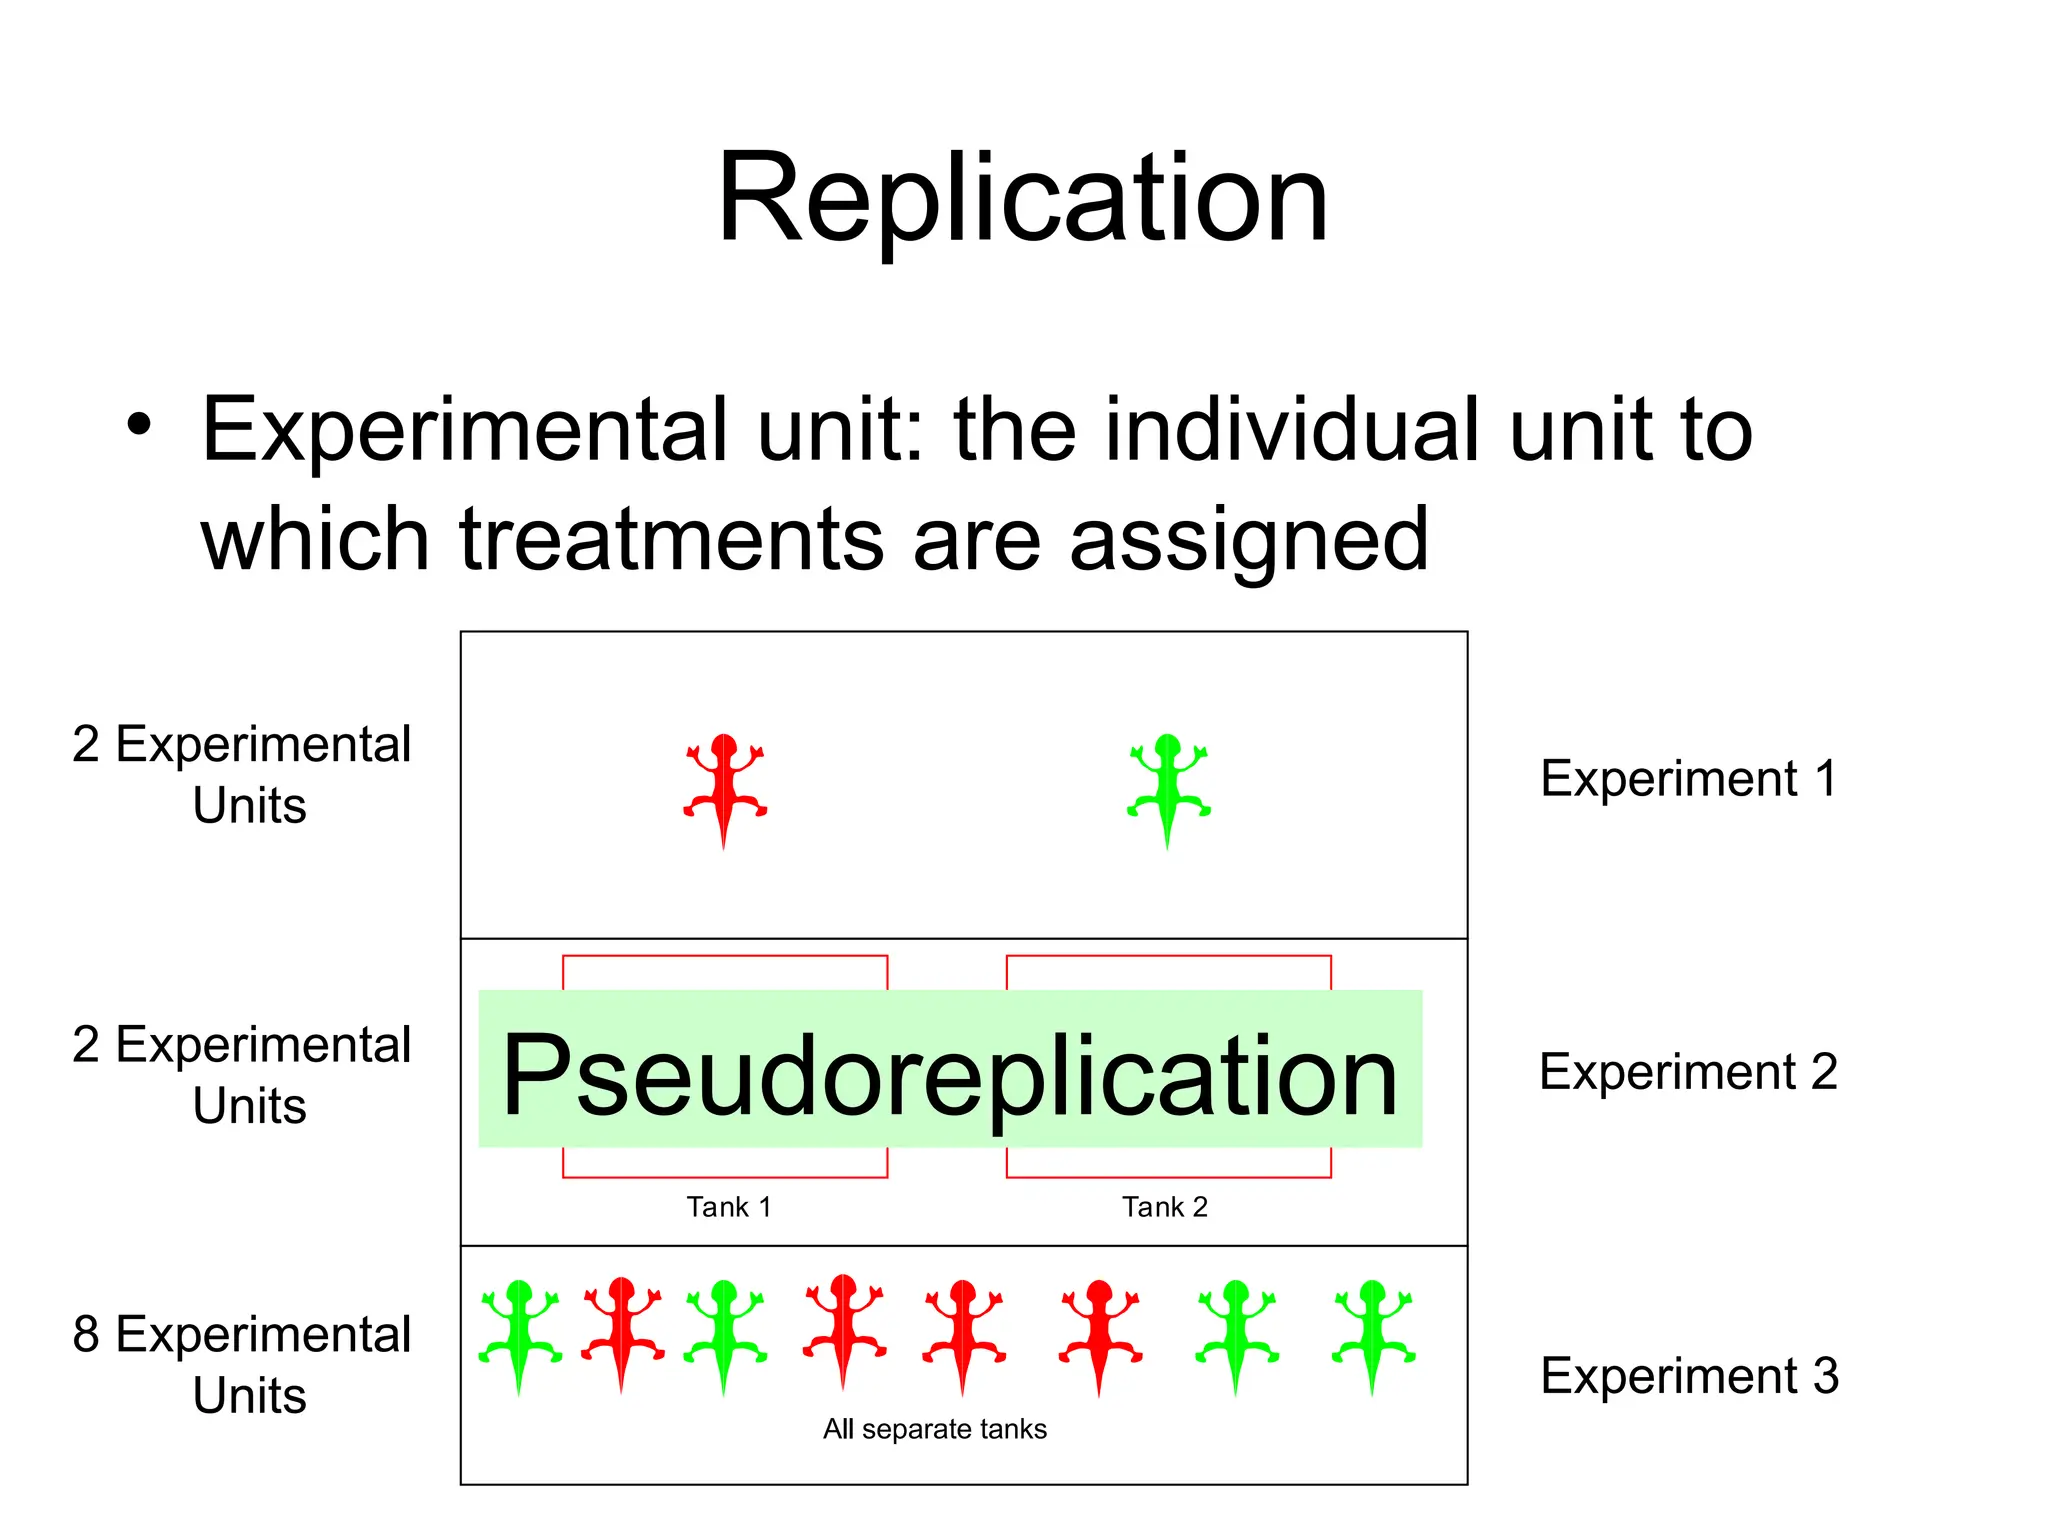
Replication
• Experimental unit:the individual unit to
which treatments are assigned
Experiment 1
Experiment 2
Experiment 3
Tank 1 Tank 2
All separate tanks
2 Experimental
Units
2 Experimental
Units
8 Experimental
Units
Pseudoreplication
29.
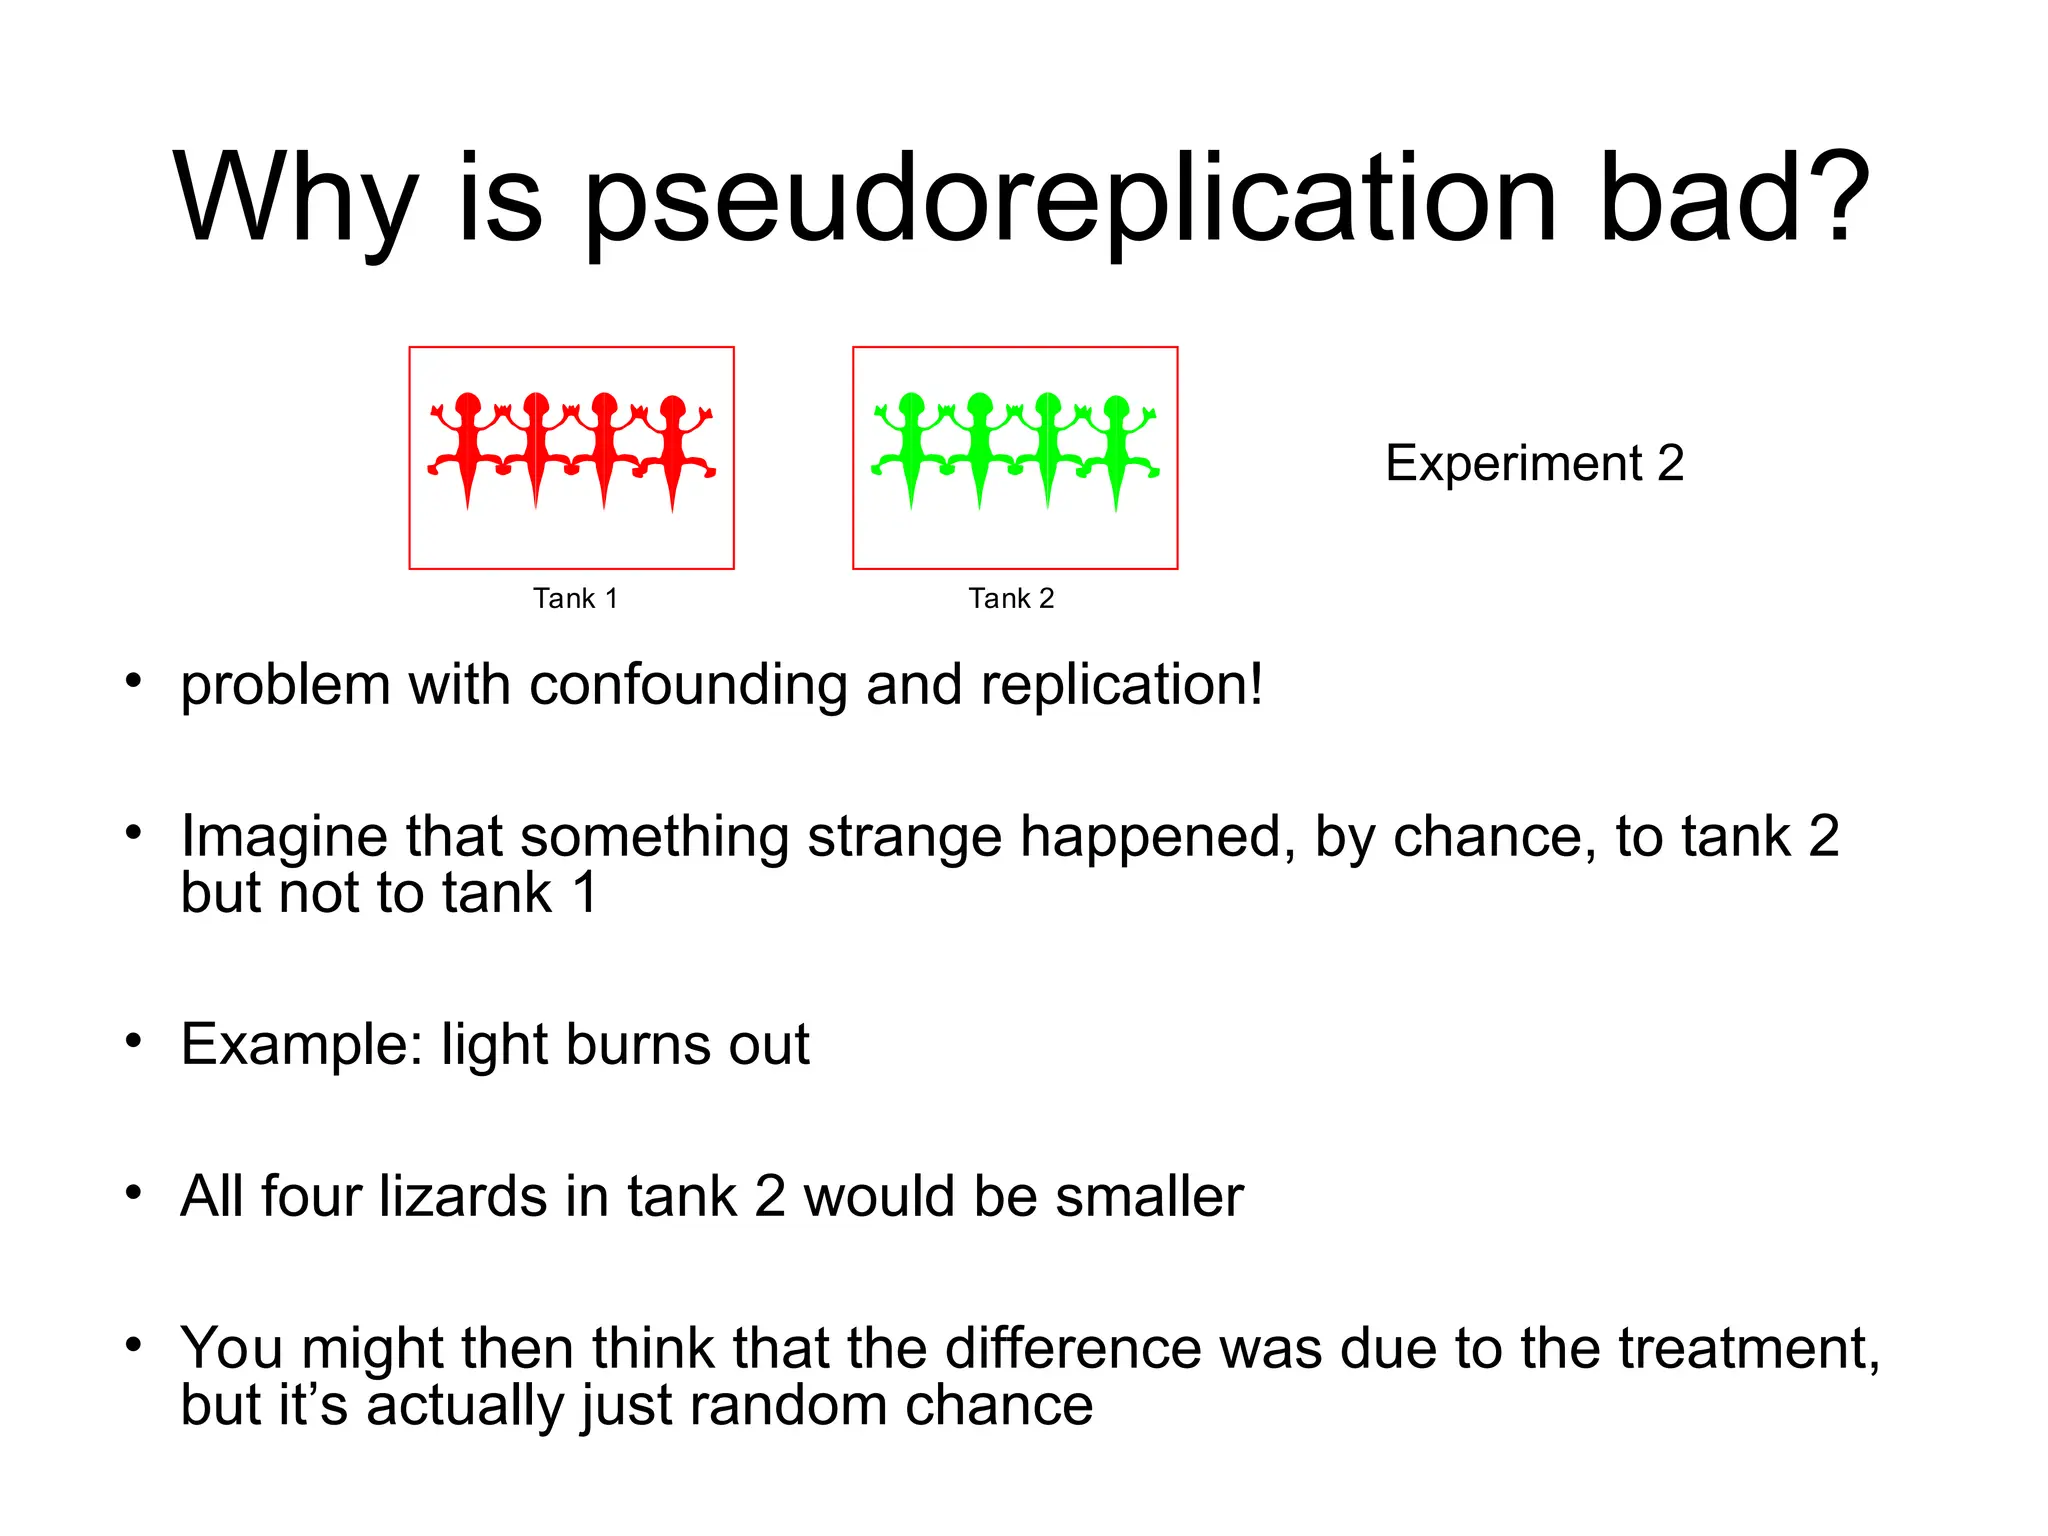
Why is pseudoreplicationbad?
• problem with confounding and replication!
• Imagine that something strange happened, by chance, to tank 2
but not to tank 1
• Example: light burns out
• All four lizards in tank 2 would be smaller
• You might then think that the difference was due to the treatment,
but it’s actually just random chance
Experiment 2
Tank 1 Tank 2
30.
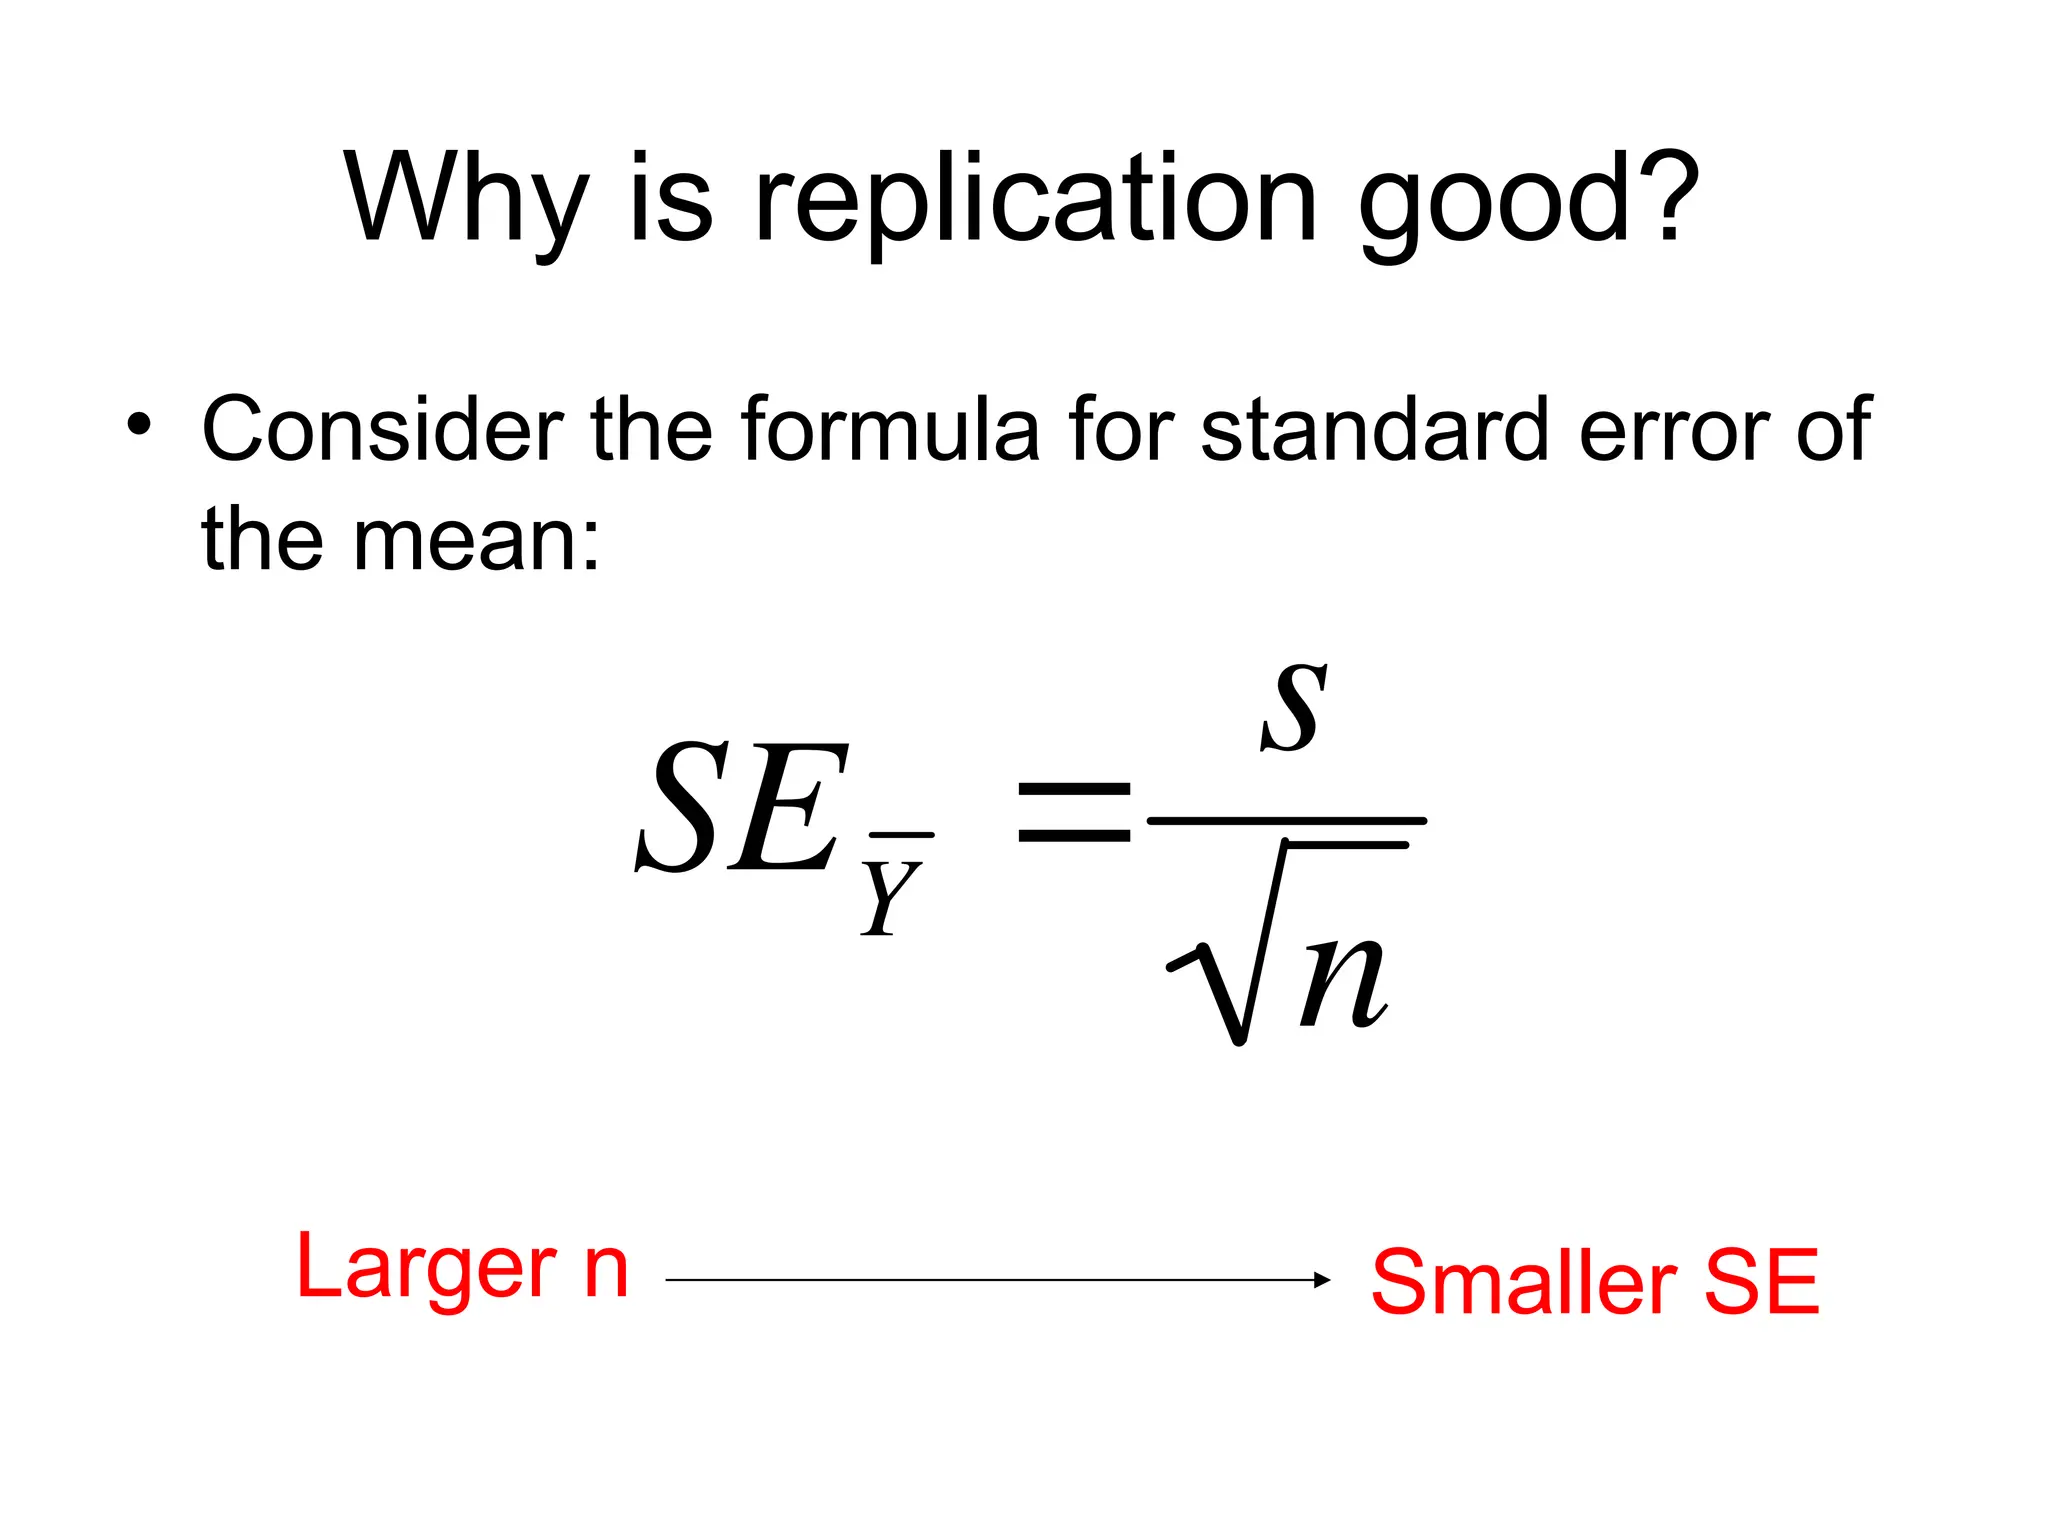
Why is replicationgood?
• Consider the formula for standard error of
the mean:
SEY
s
n
Larger n Smaller SE
31.
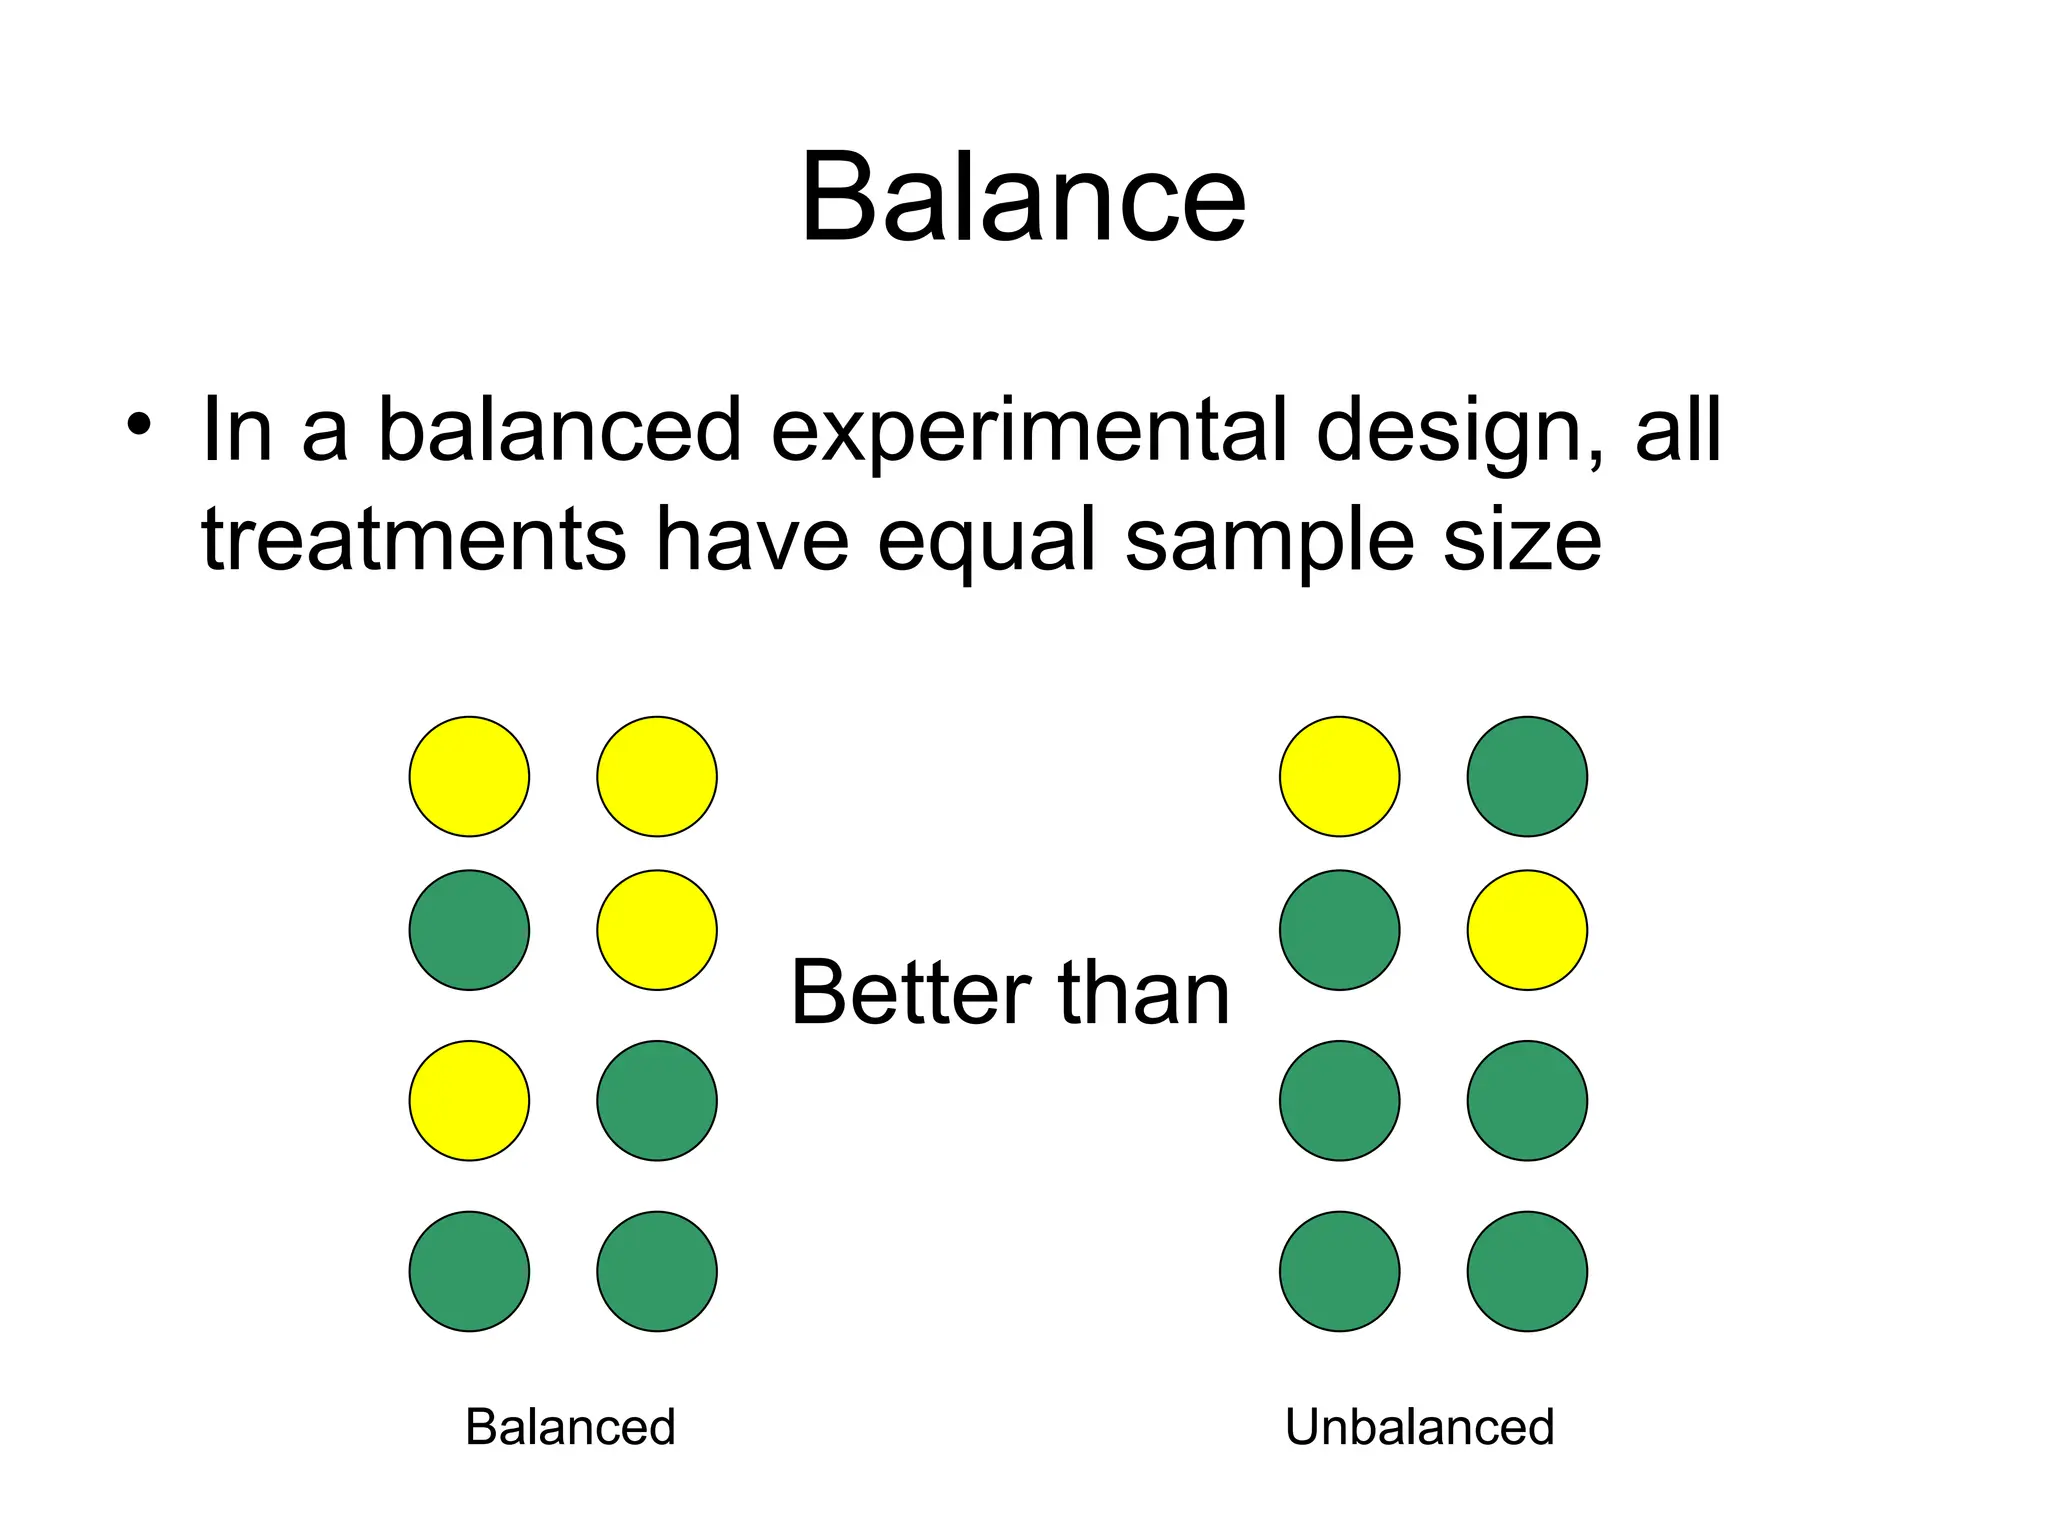
Balance
• In abalanced experimental design, all
treatments have equal sample size
Better than
Balanced Unbalanced
32.
Balance
• In abalanced experimental design, all
treatments have equal sample size
• This maximizes power
• Also makes tests more robust to violating
assumptions
33.
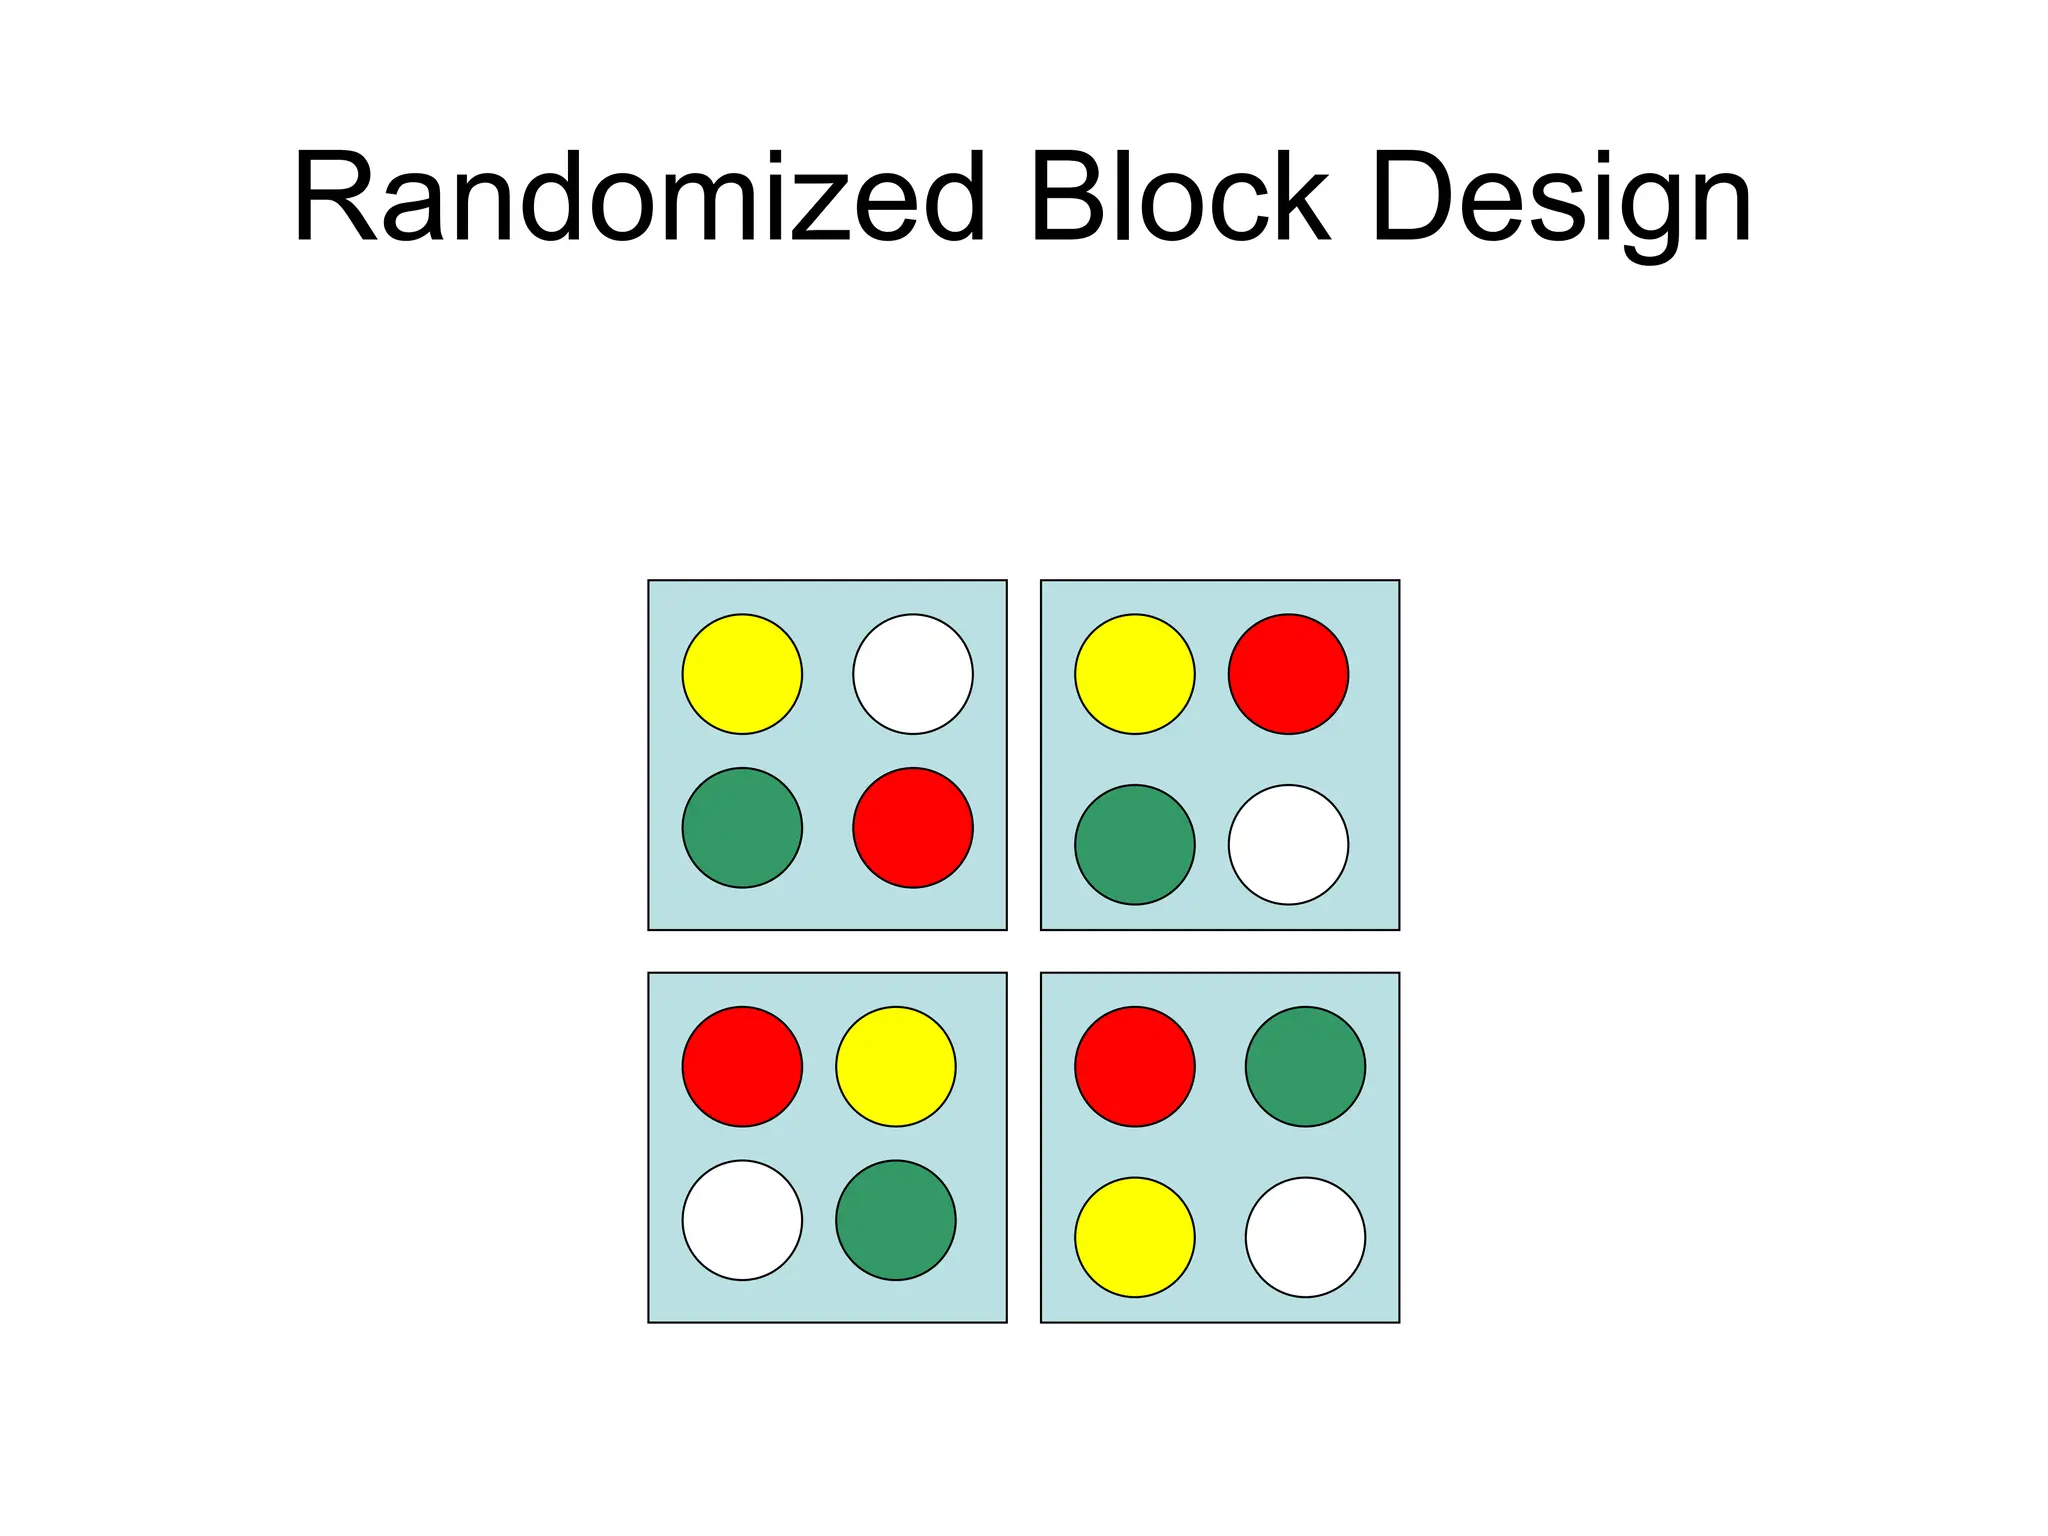
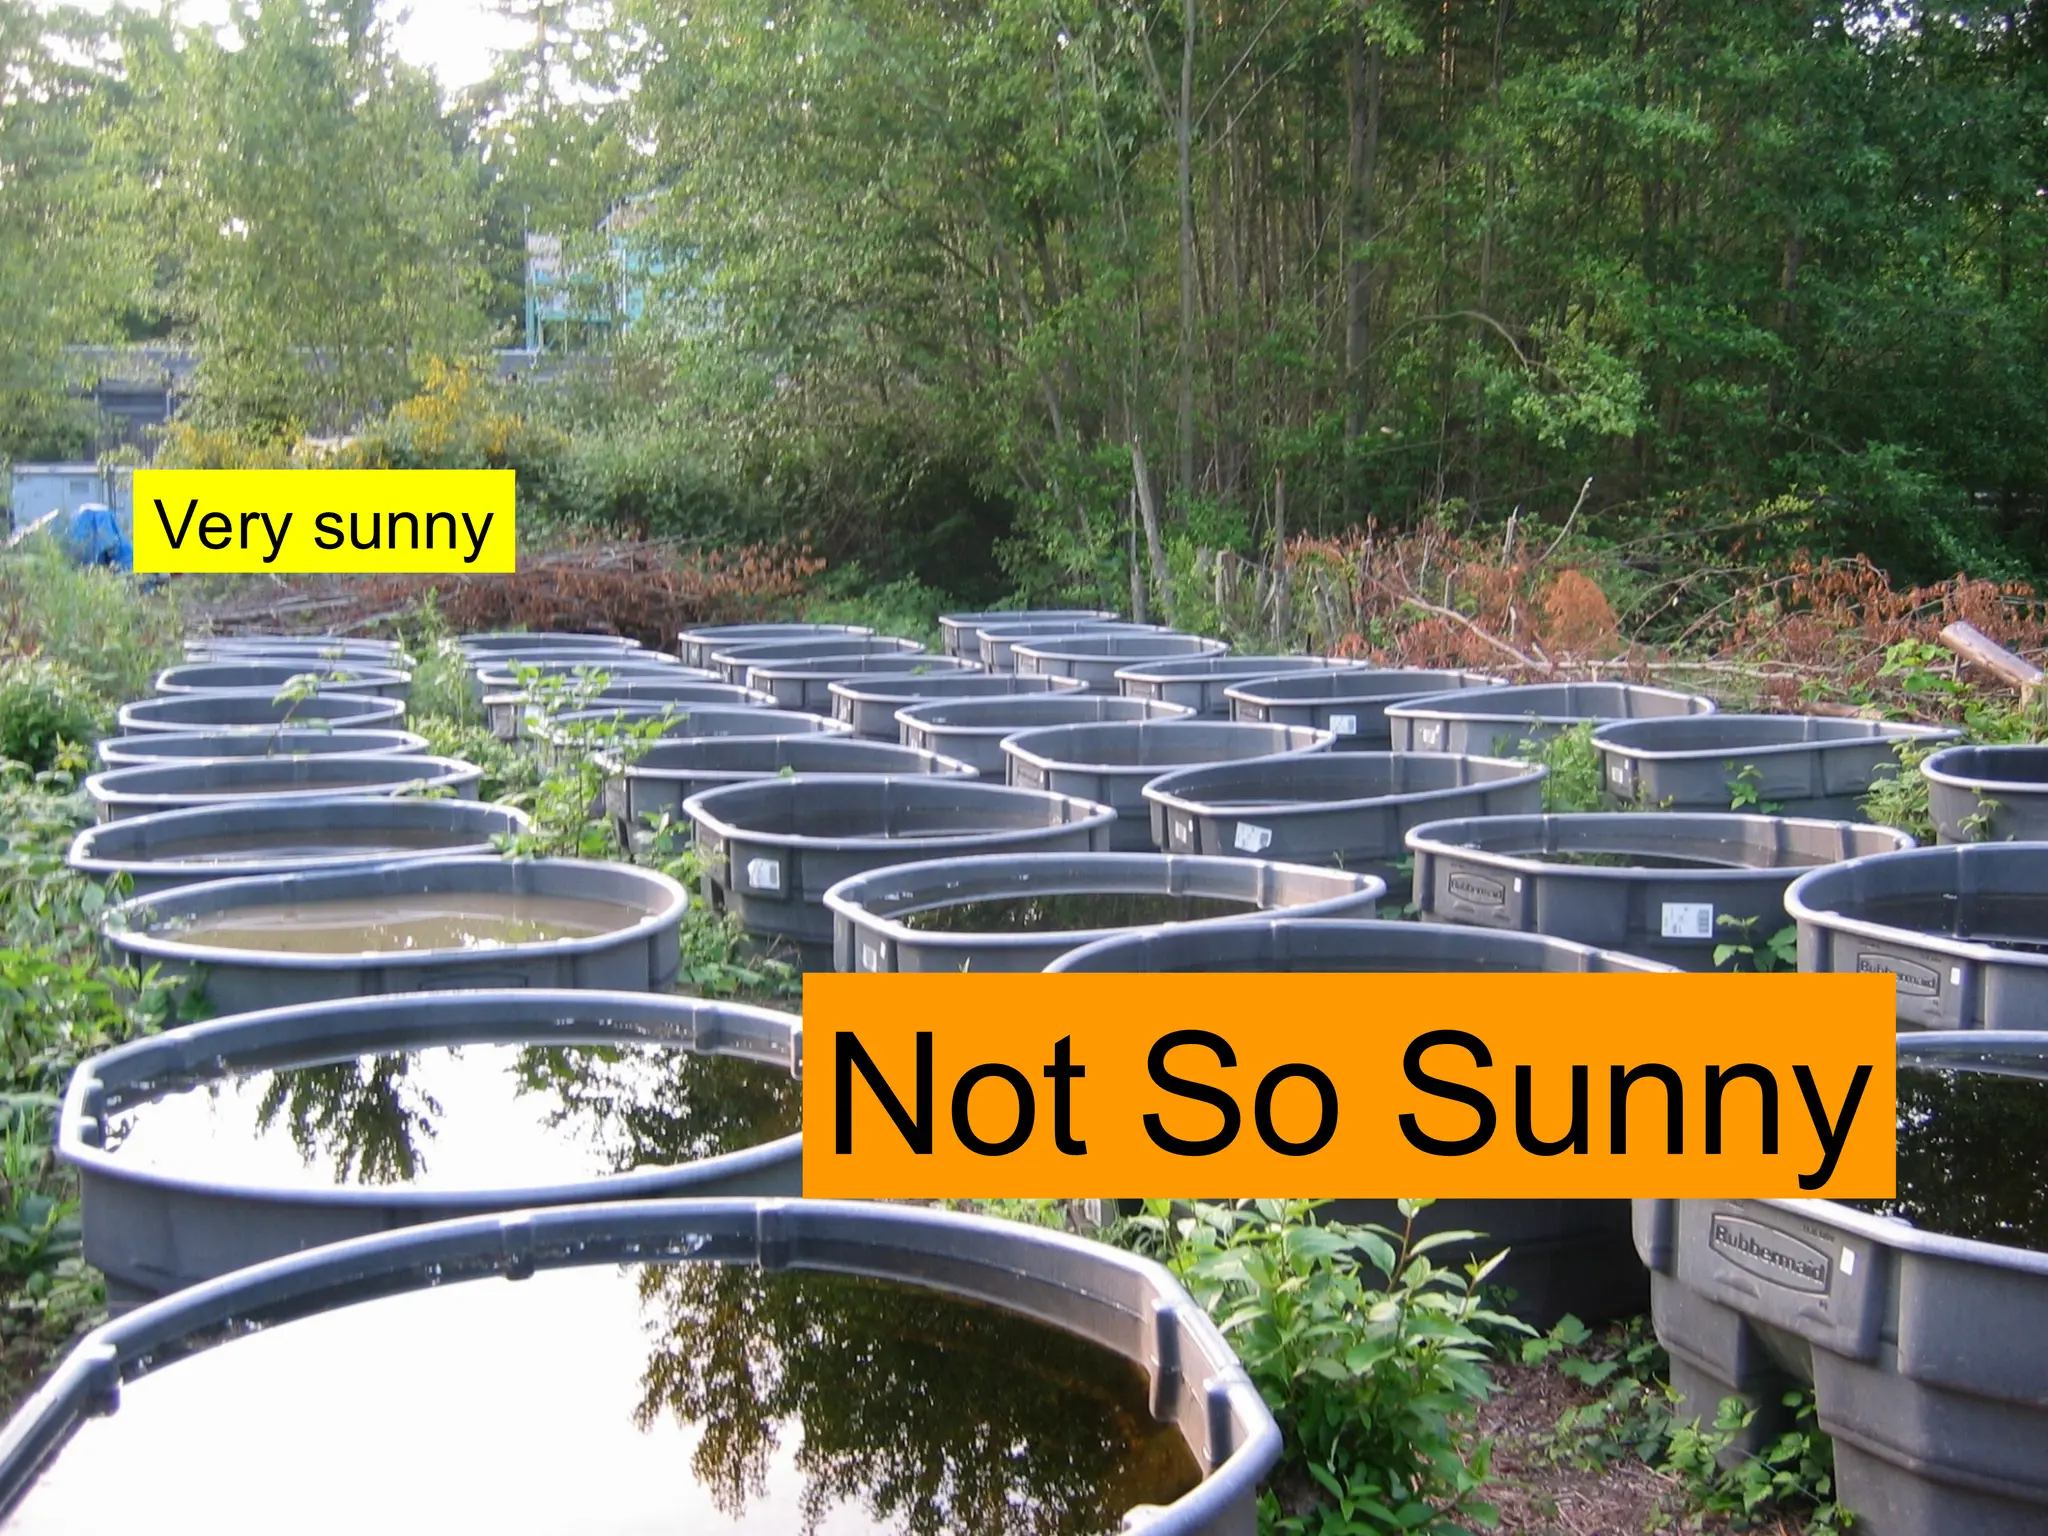
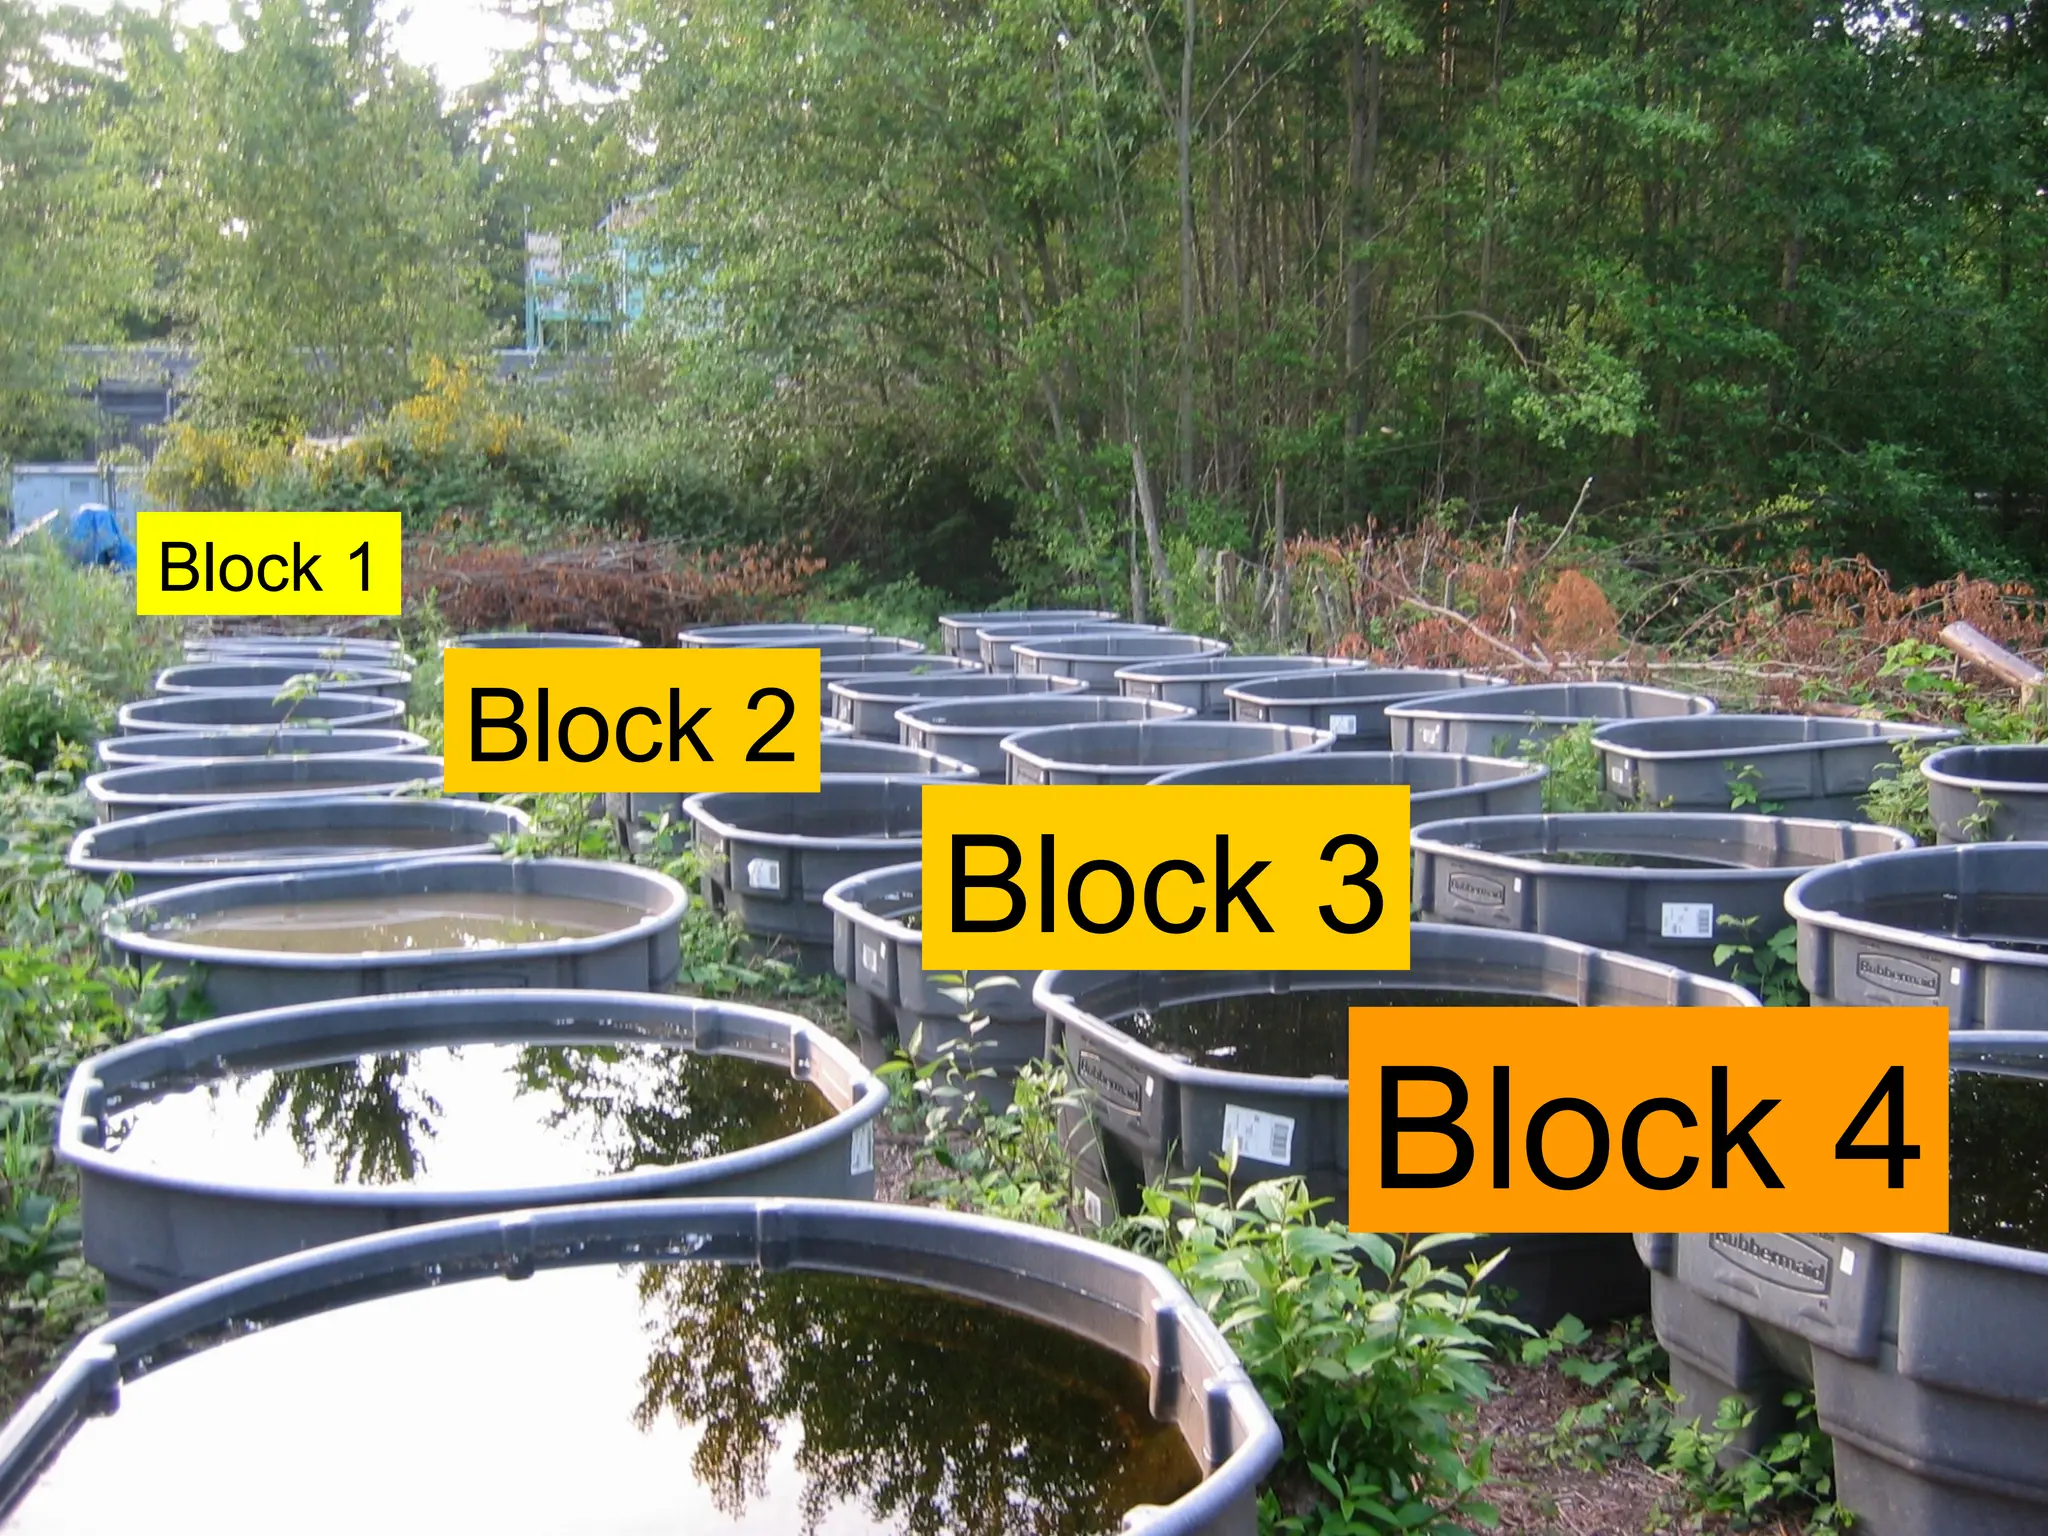
Blocking
• Blocking isthe grouping of experimental
units that have similar properties
• Within each block, treatments are
randomly assigned to experimental
treatments
• Randomized block design
What good isblocking?
• Blocking allows you to remove extraneous
variation from the data
• Like replicating the whole experiment
multiple times, once in each block
• Paired design is an example of blocking
40.
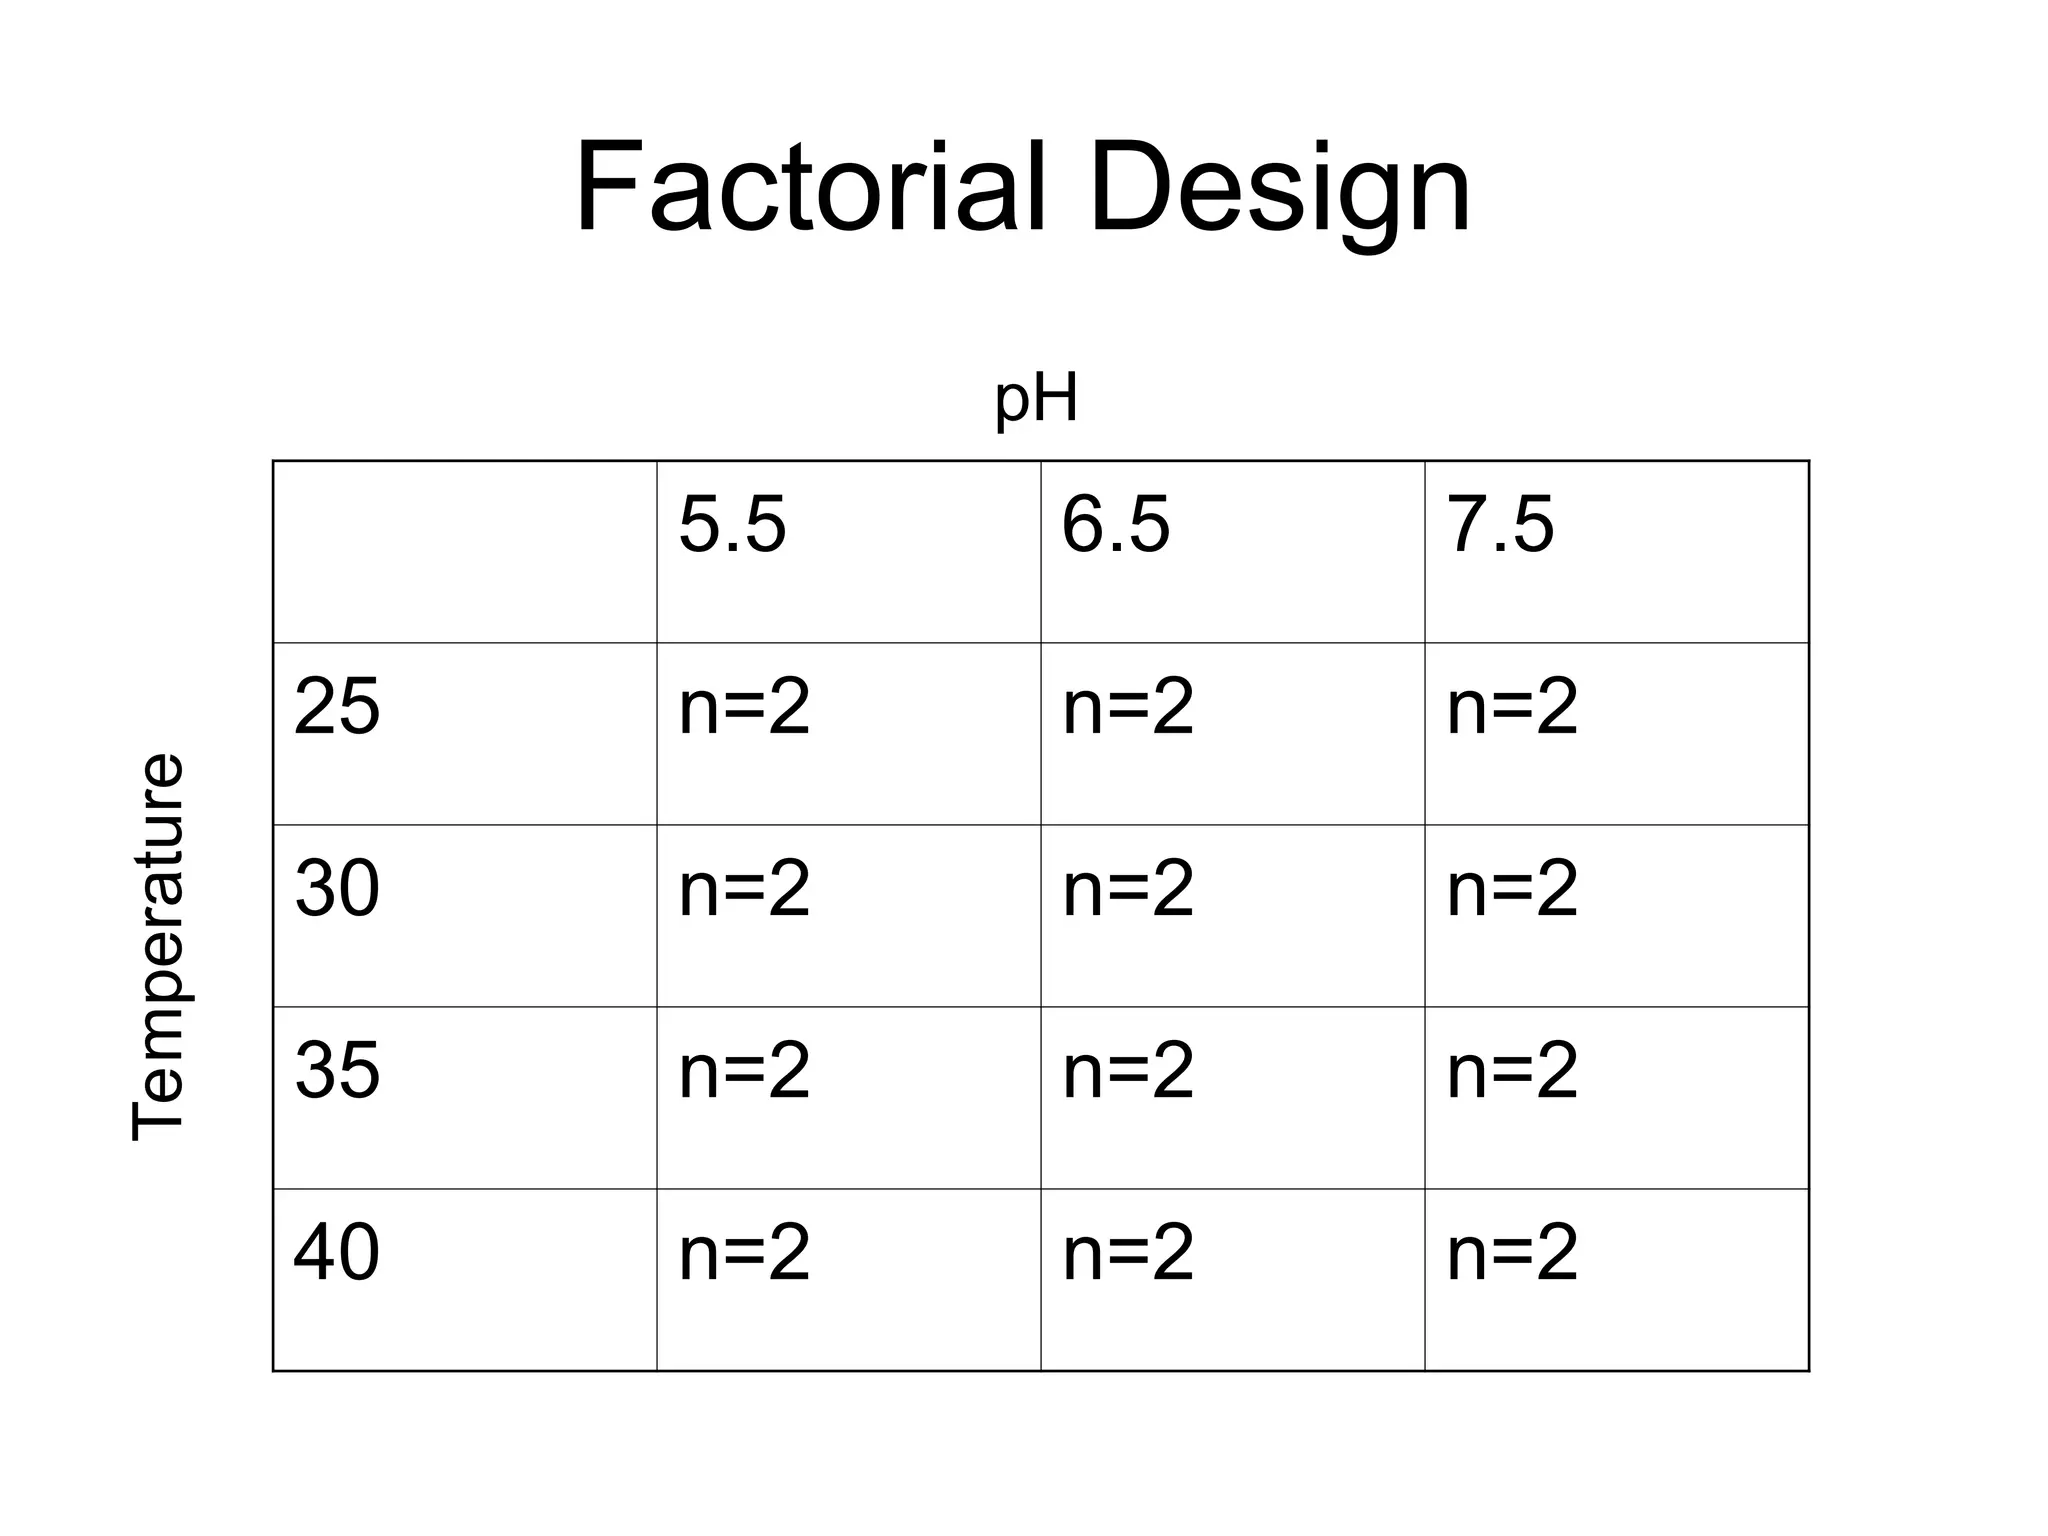
Experiments with 2Factors
• Factorial design – investigates all
treatment combinations of two or more
variables
• Factorial design allows us to test for
interactions between treatment variables
Interaction Effects
• Aninteraction between two (or more)
explanatory variables means that the
effect of one variable depends upon the
state of the other variable
43.
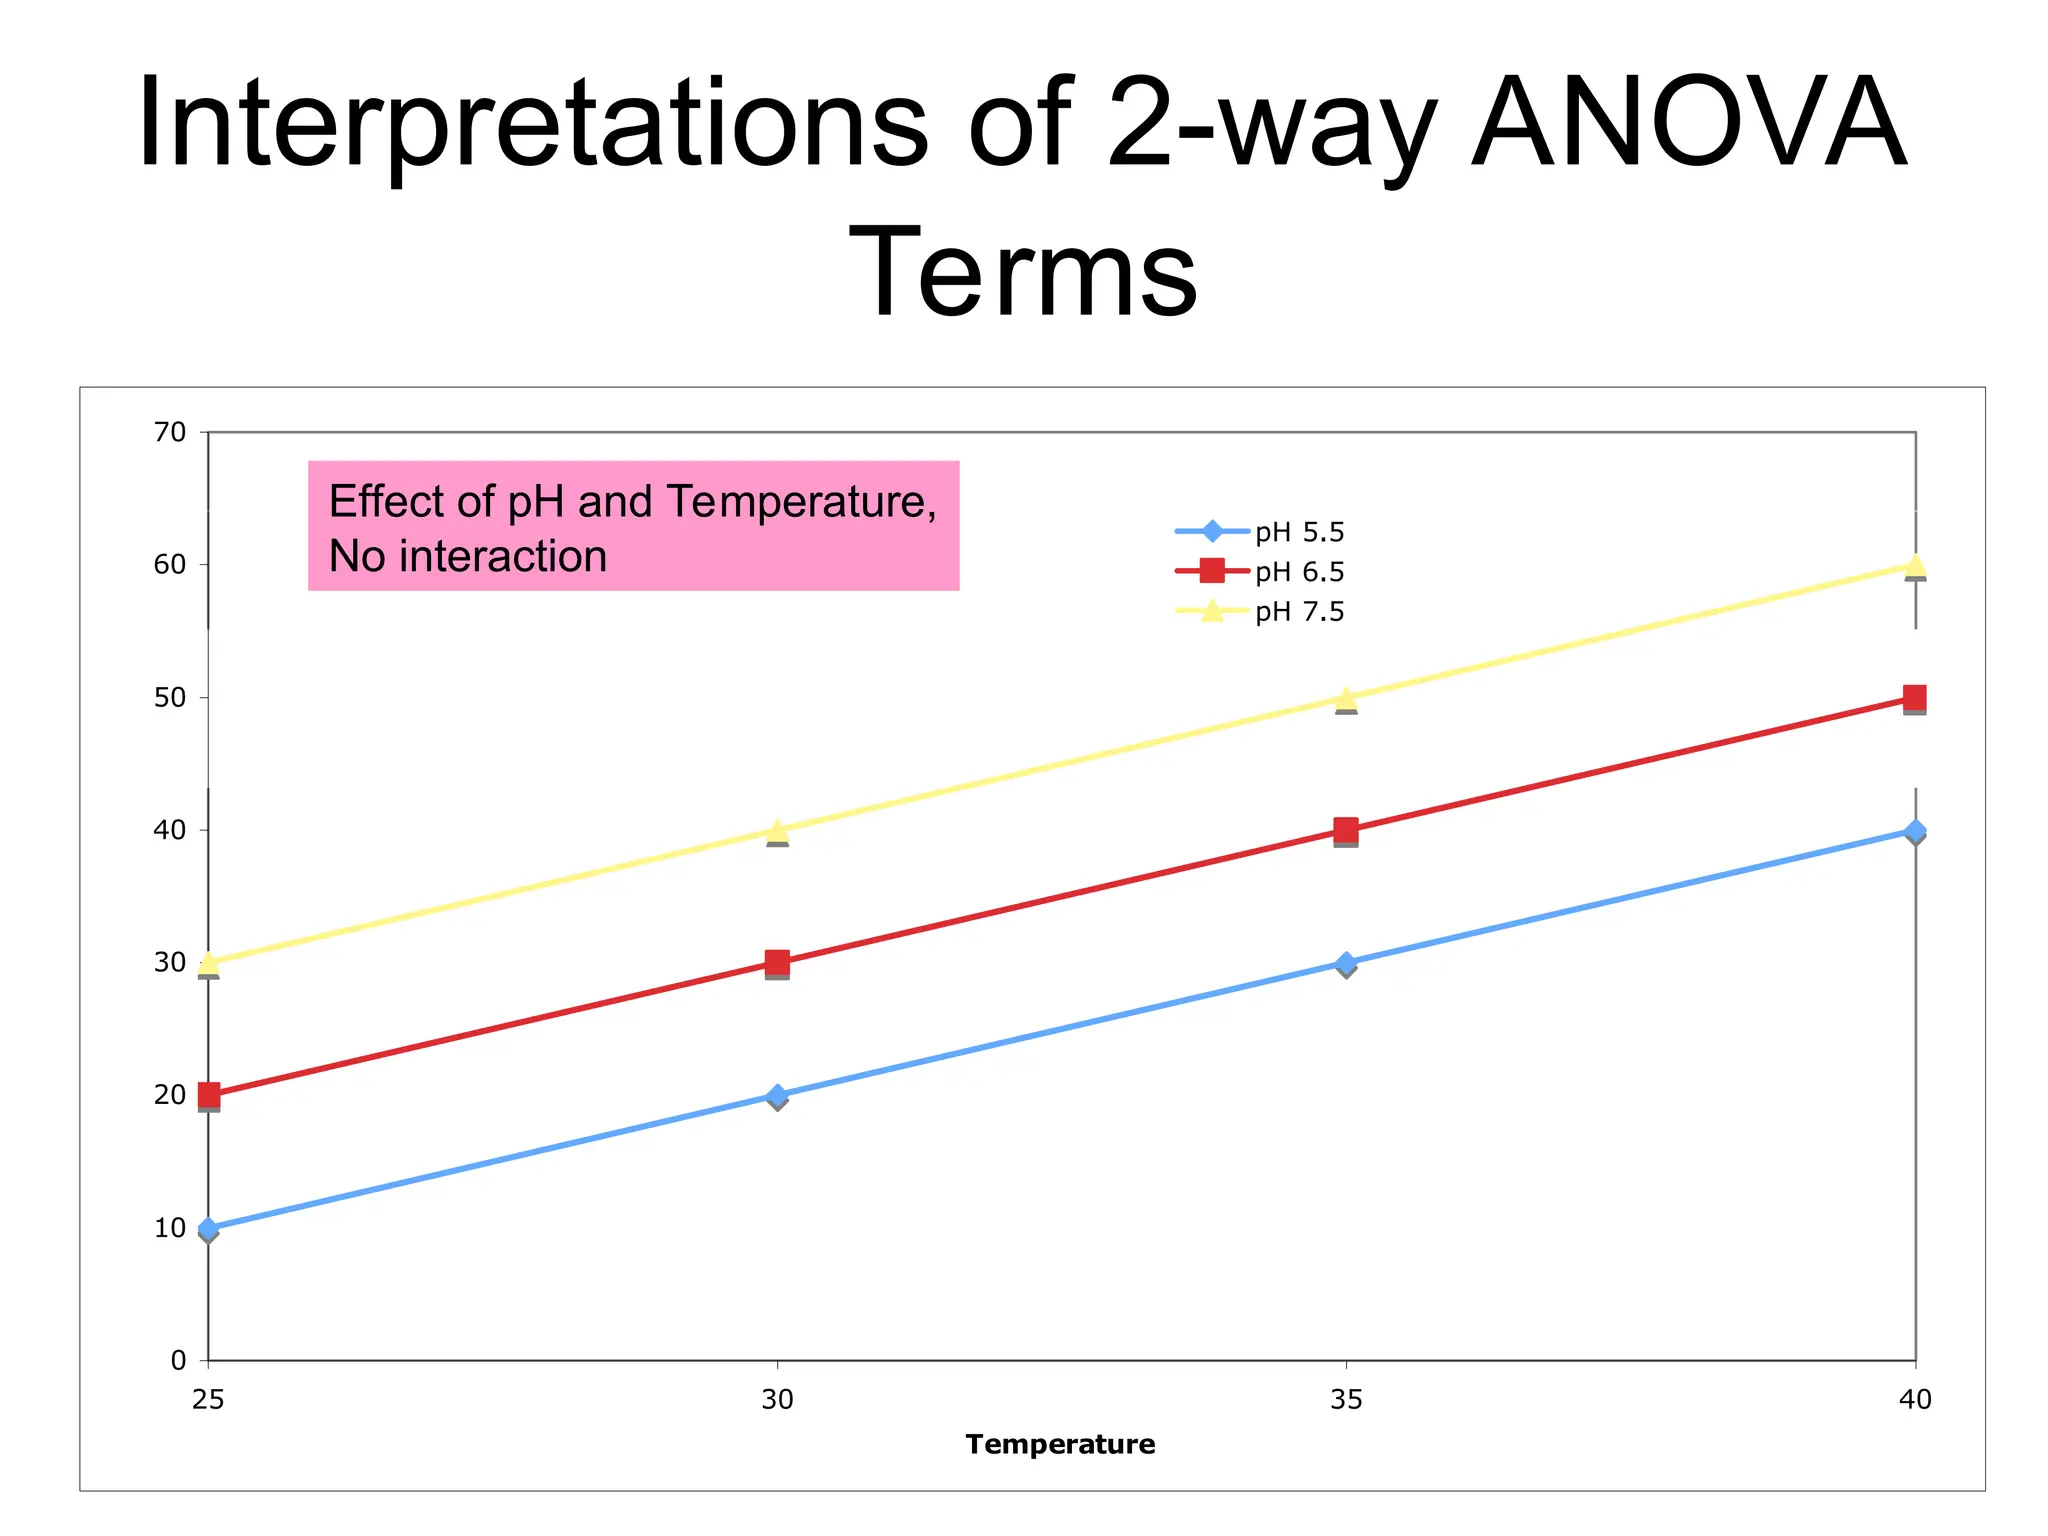
Interpretations of 2-wayANOVA
Terms
0
10
20
30
40
50
60
70
25 30 35 40
Temperature
Growth
Rate
pH 5.5
pH 6.5
pH 7.5
Effect of pH and Temperature,
No interaction
44.
0
5
10
15
20
25
30
35
40
45
25 30 3540
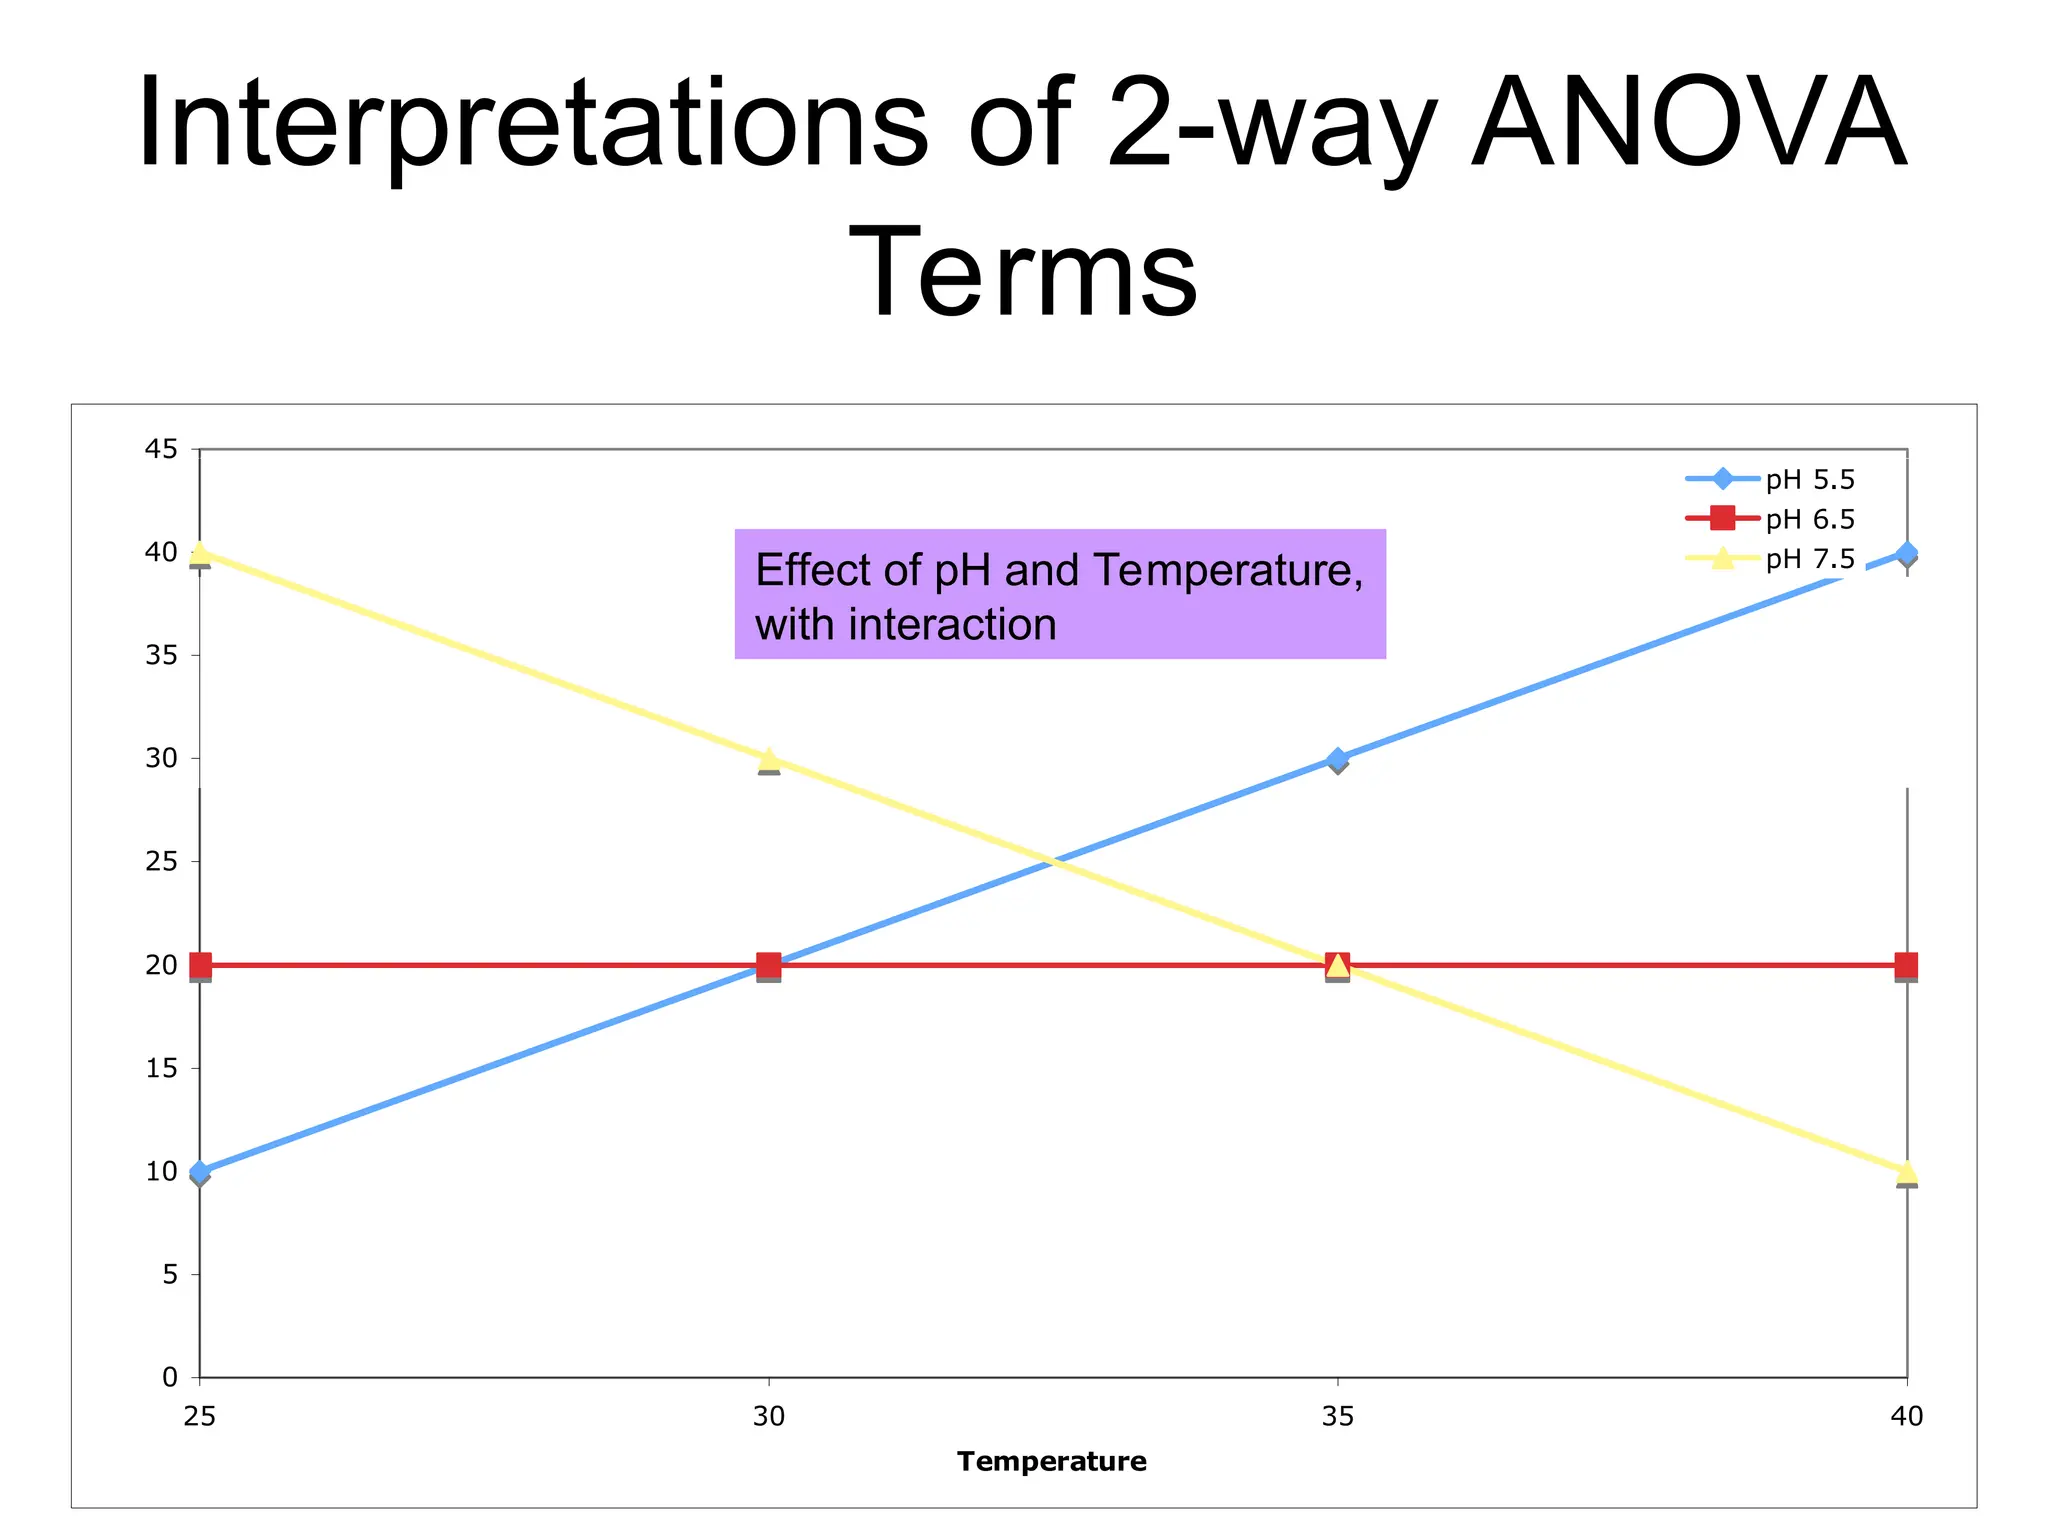
Temperature
Growth
Rate
pH 5.5
pH 6.5
pH 7.5
Interpretations of 2-way ANOVA
Terms
Effect of pH and Temperature,
with interaction
45.
Goals of ExperimentalDesign
• Avoid experimental artifacts
• Eliminate bias
1. Use a simultaneous control group
2. Randomization
3. Blinding
• Reduce sampling error
1. Replication
2. Balance
3. Blocking
46.
What if youcan’t do experiments?
• Sometimes you can’t do experiments
• One strategy:
– Matching
– Every individual in the treatment group is
matched to a control individual having the
same or closely similar values for known
confounding variables
47.
What if youcan’t do experiments?
• Example: Do species on islands change
their body size compared to species in
mainland habitats?
• For each island species, identify a closely
related species living on a nearby
mainland area
48.
Power Analysis
• Beforecarrying out an experiment you
must choose a sample size
• Too small: no chance to detect treatment
effect
• Too large: too expensive
• We can use power analysis to choose our
sample size
49.
Power Analysis
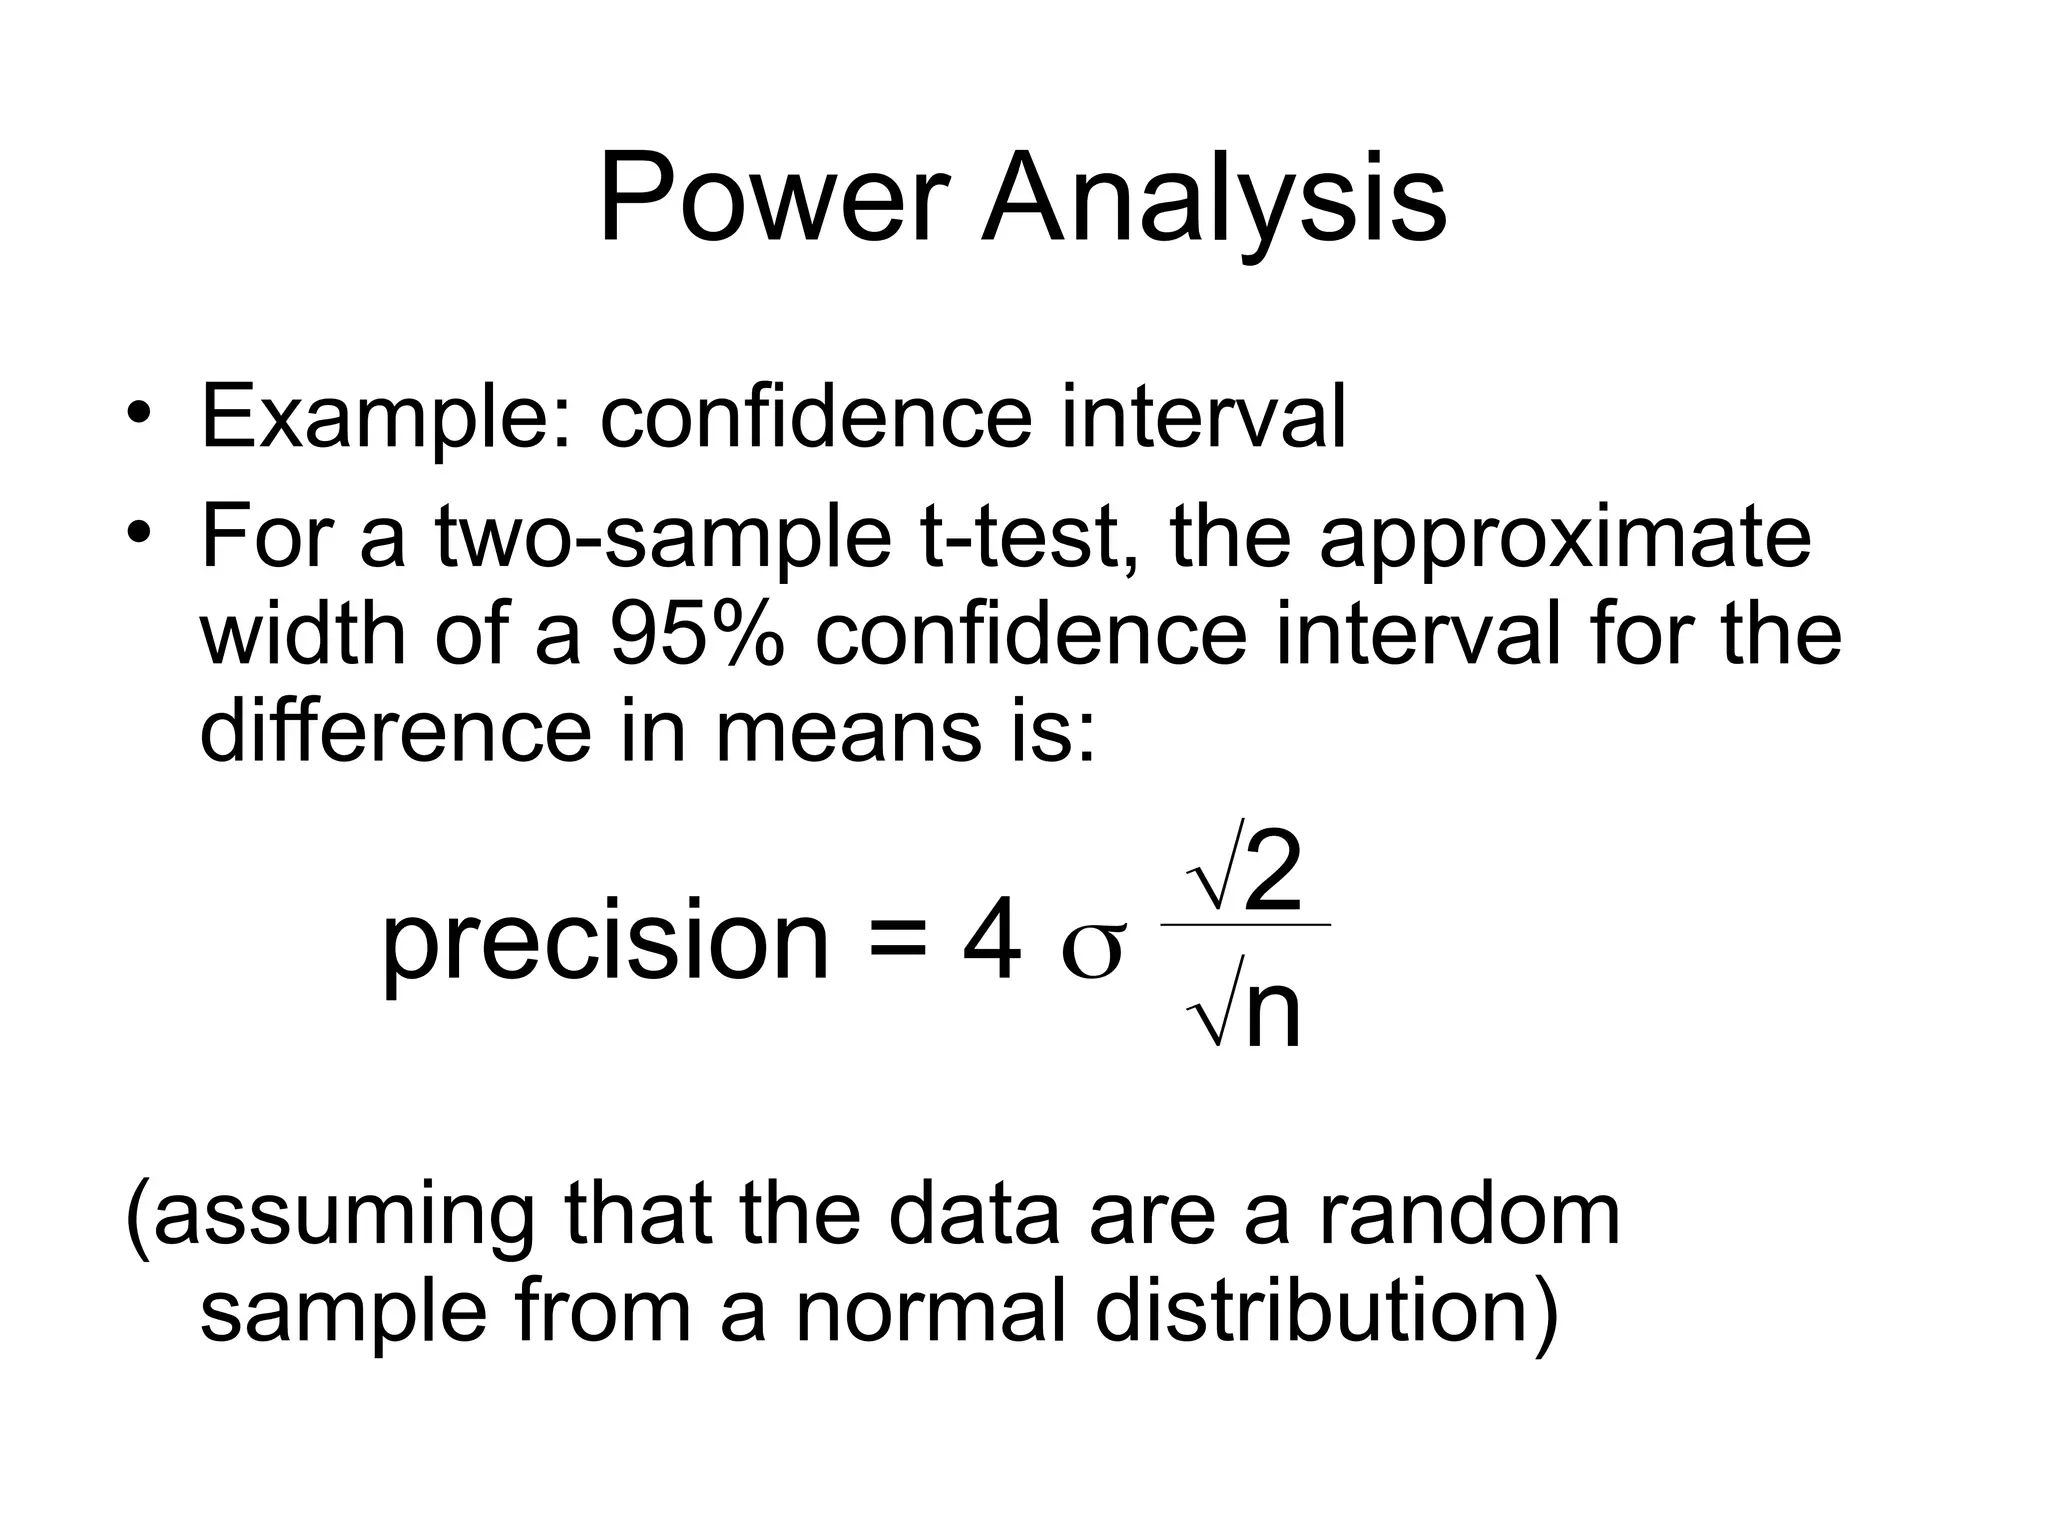
• Example:confidence interval
• For a two-sample t-test, the approximate
width of a 95% confidence interval for the
difference in means is:
(assuming that the data are a random
sample from a normal distribution)
precision = 4
2
n
50.
Power Analysis
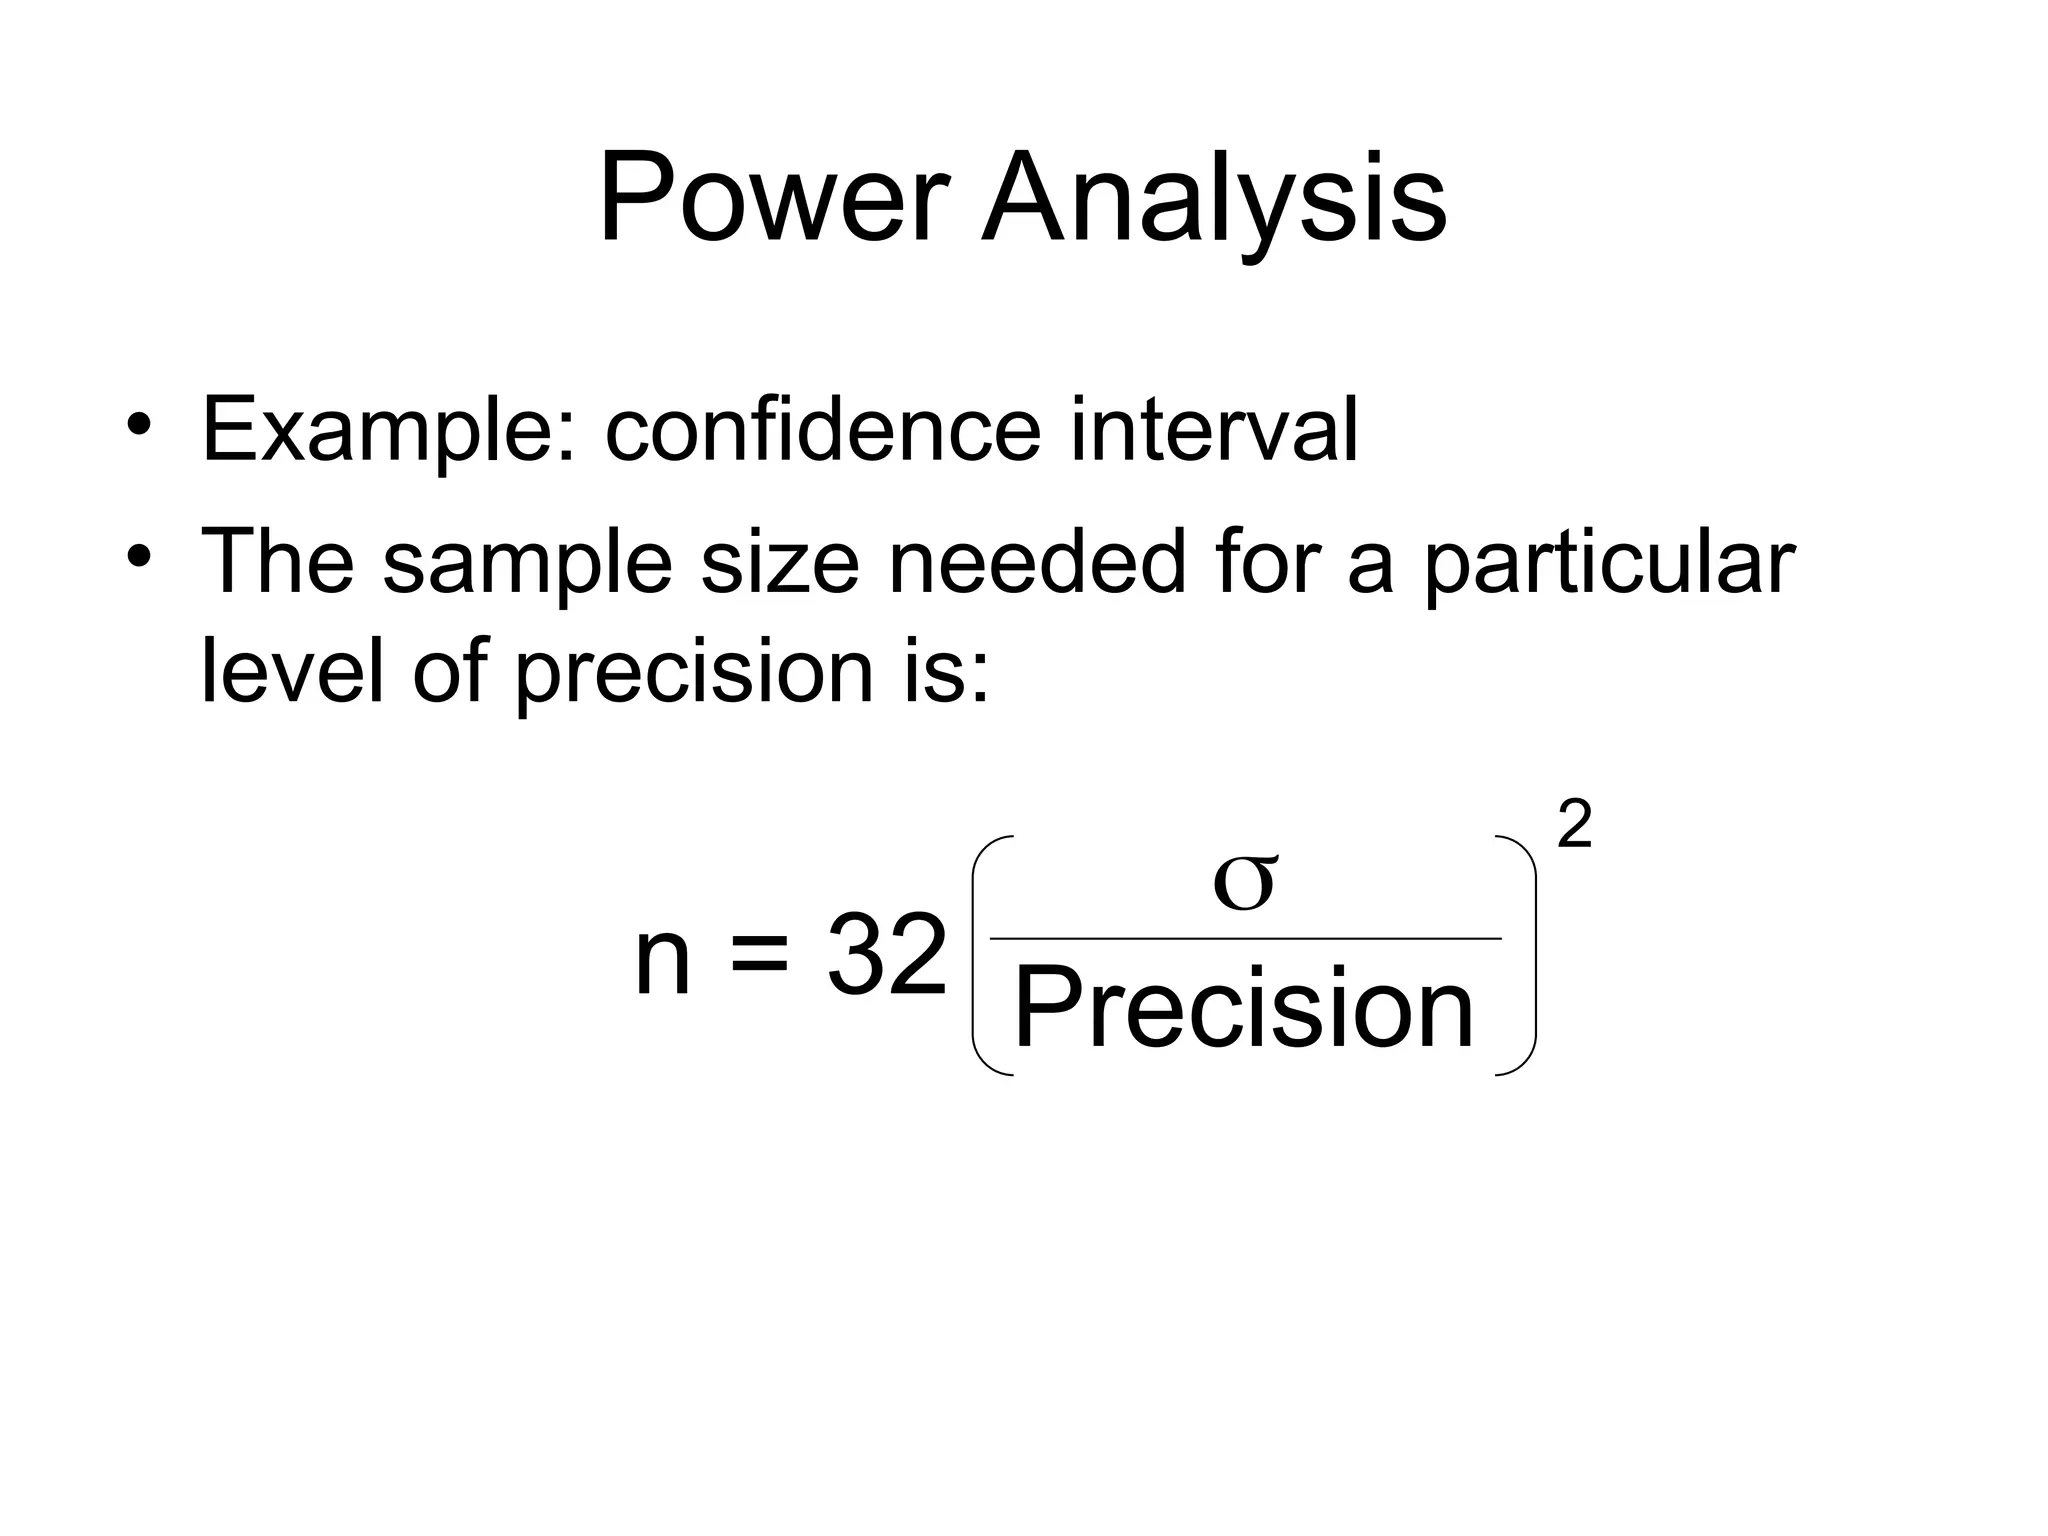
• Example:confidence interval
• The sample size needed for a particular
level of precision is:
n = 32
Precision
2
51.
Power Analysis
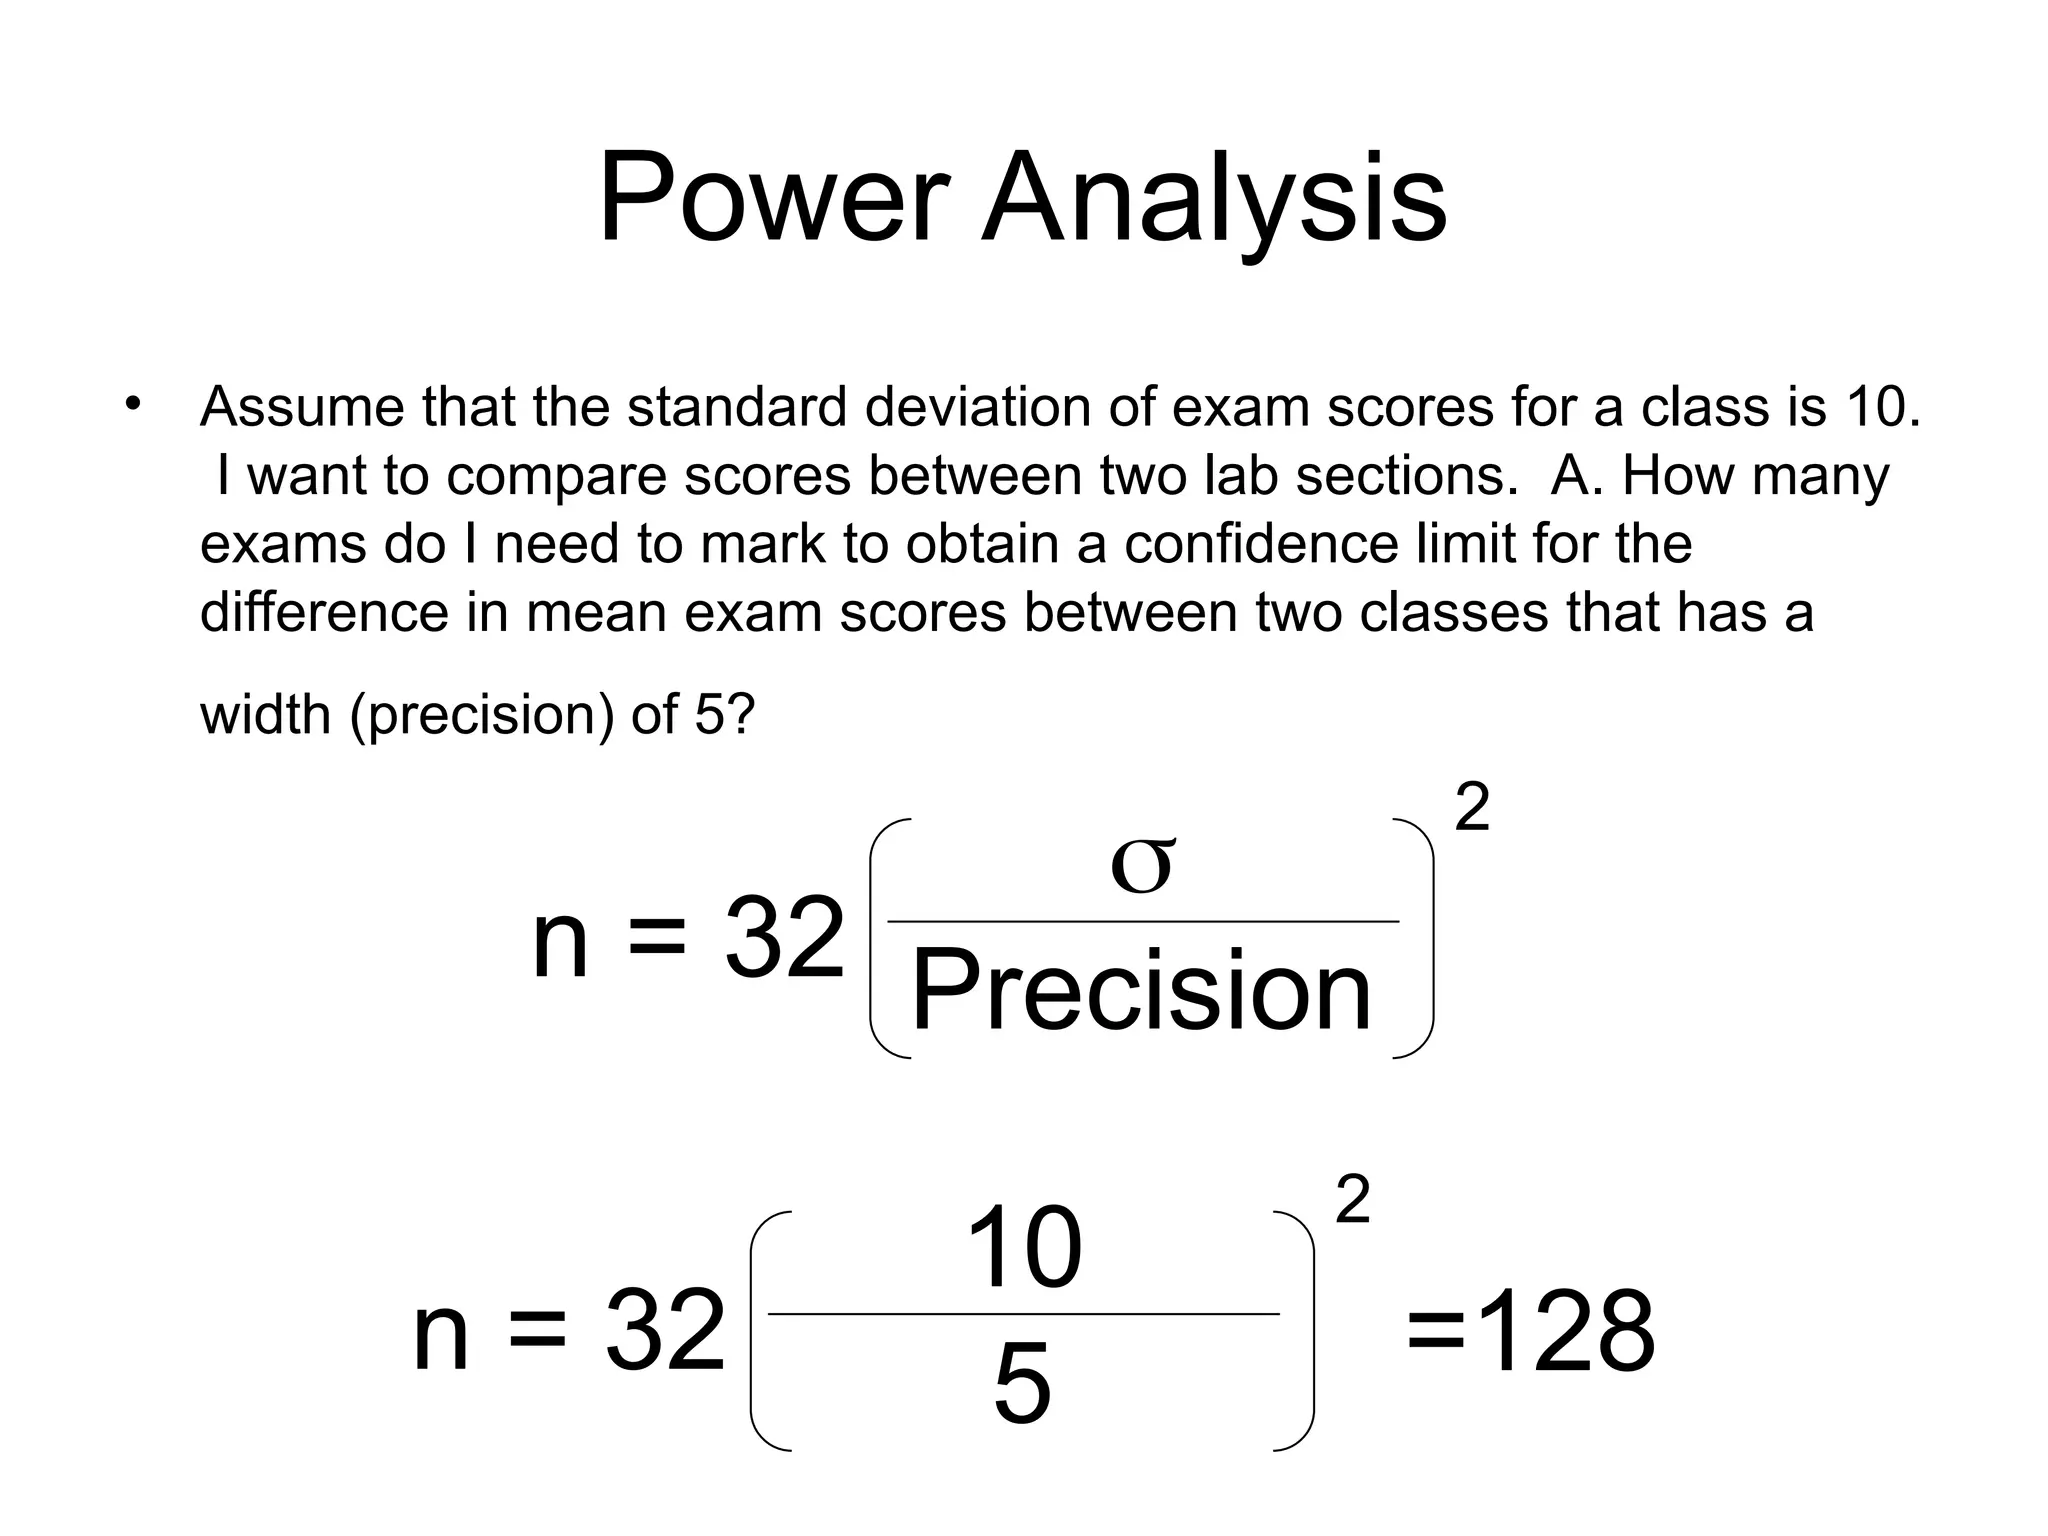
• Assumethat the standard deviation of exam scores for a class is 10.
I want to compare scores between two lab sections. A. How many
exams do I need to mark to obtain a confidence limit for the
difference in mean exam scores between two classes that has a
width (precision) of 5?
n = 32
Precision
2
n = 32
10
5
2
=128
52.
Power Analysis
• Example:power
• Remember, power = 1 -
= Pr[Type II error]
• Typical goal is power = 0.80
• For a two-sample t-test, the sample size
needed for a power of 80% to detect a
difference of D is:
n = 16
D
2
53.
Power Analysis
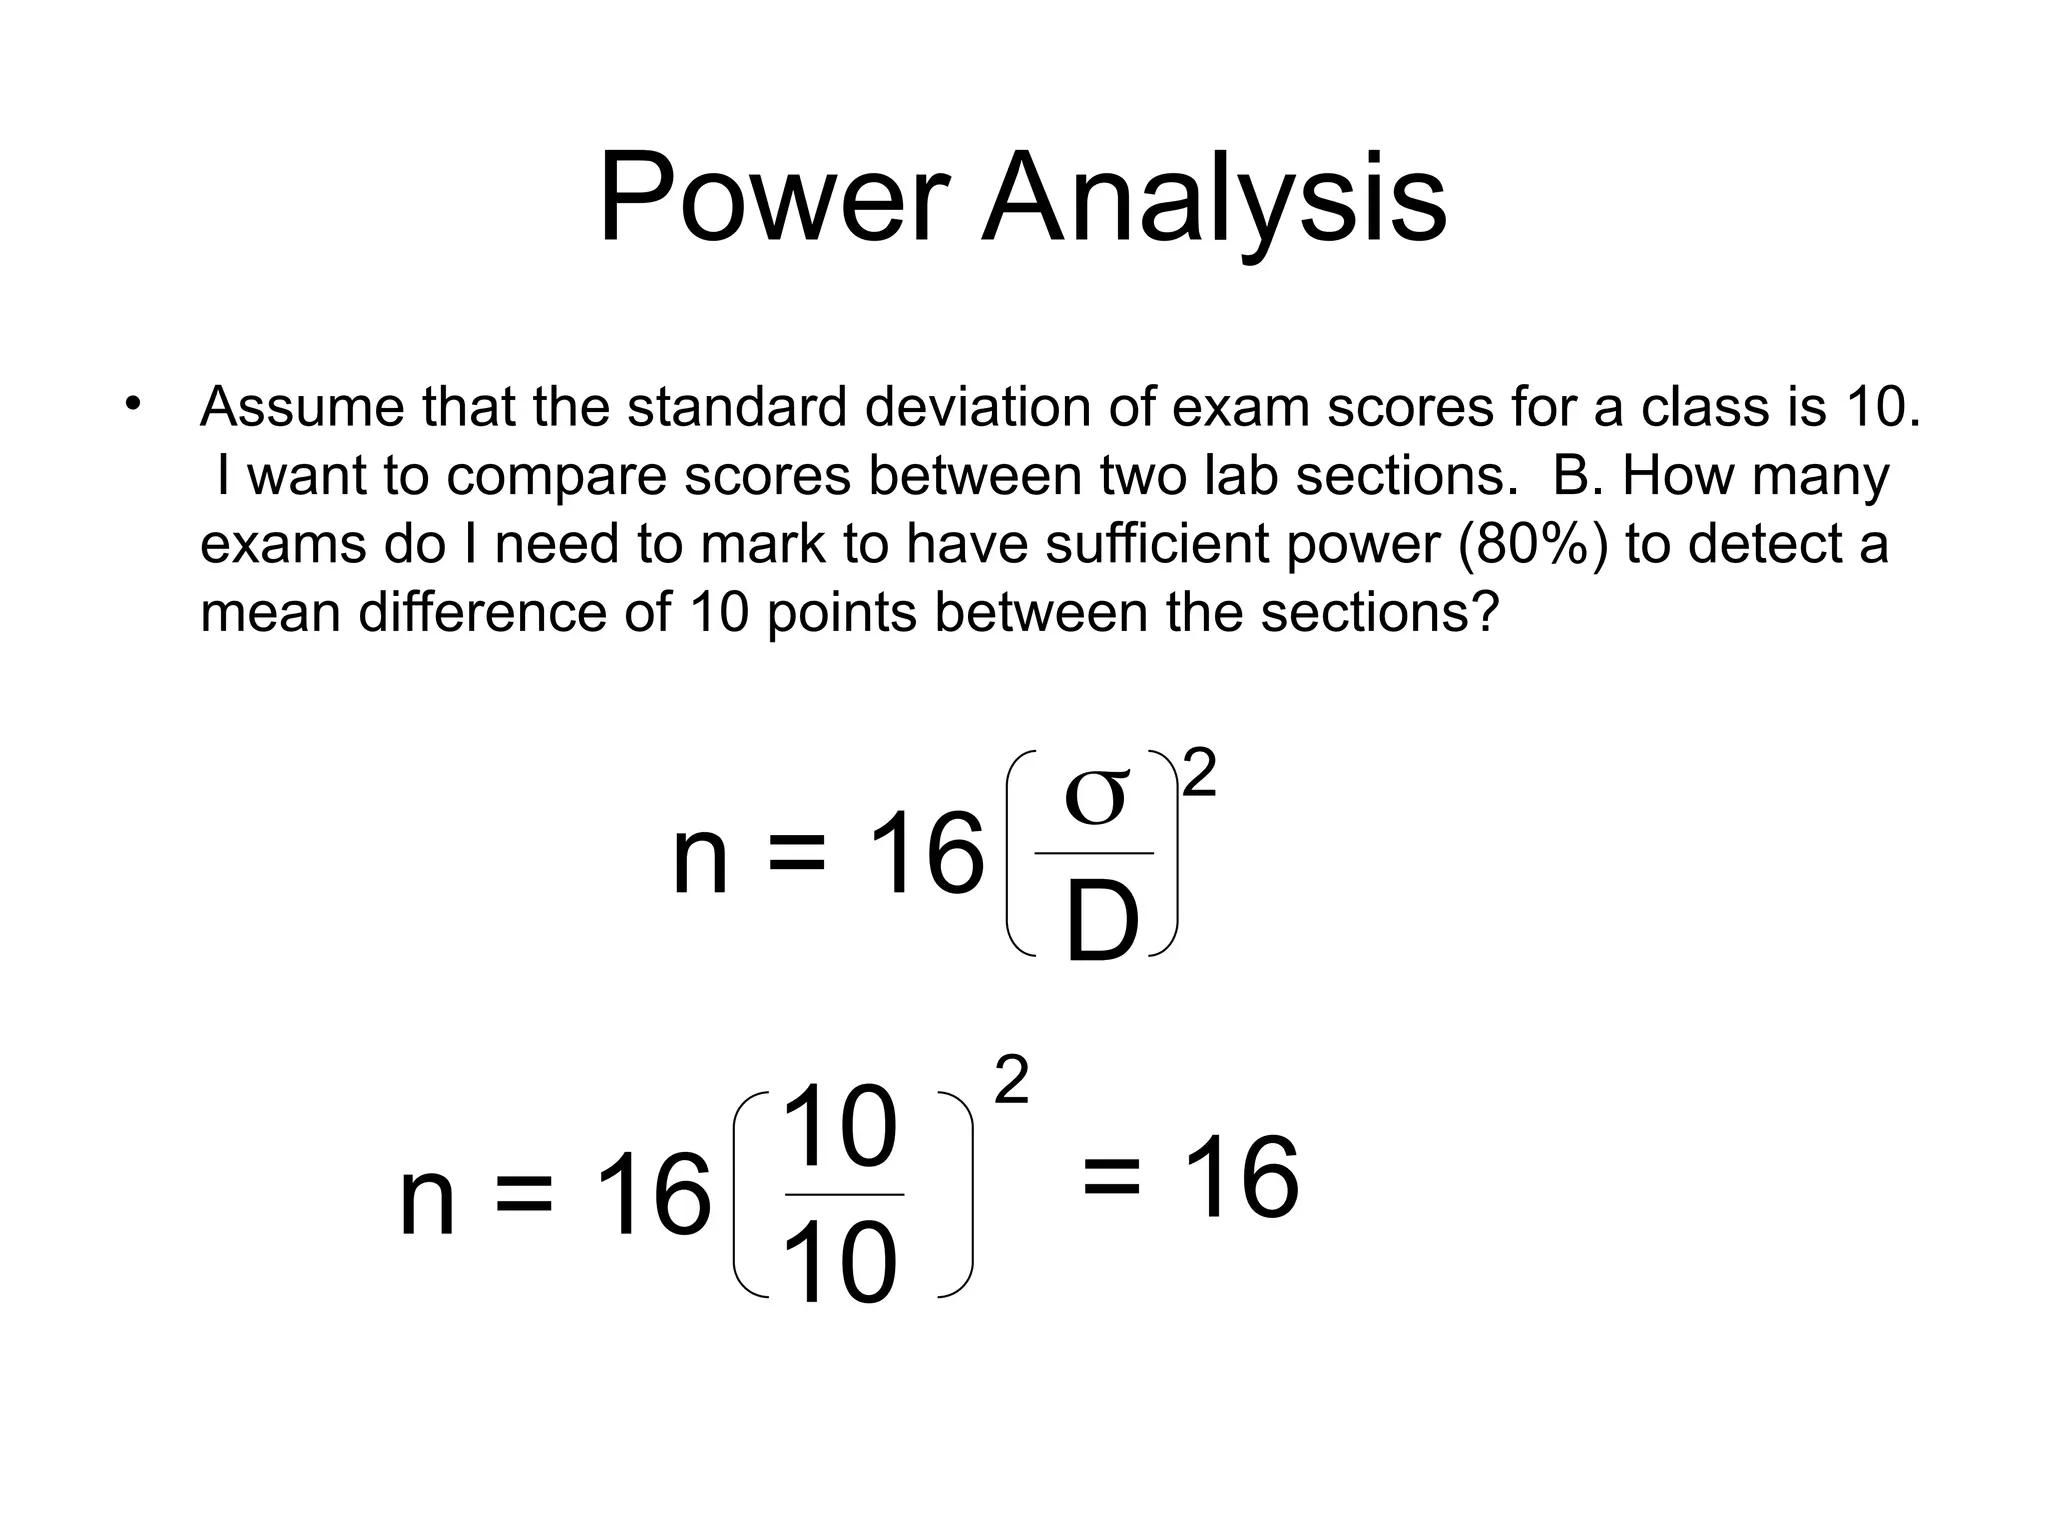
• Assumethat the standard deviation of exam scores for a class is 10.
I want to compare scores between two lab sections. B. How many
exams do I need to mark to have sufficient power (80%) to detect a
mean difference of 10 points between the sections?
n = 16
D
2
n = 16
10
10
2
= 16

![Power Analysis
• Example: power
• Remember, power = 1 -
= Pr[Type II error]
• Typical goal is power = 0.80
• For a two-sample t-test, the sample size
needed for a power of 80% to detect a
difference of D is:
n = 16
D
2](https://image.slidesharecdn.com/16exdesign-250706074654-3653c9a4/75/design-of-experiments-25-desigfnExDesign-ppt-52-2048.jpg)


![Power Analysis
• Example: power
• Remember, power = 1 -
= Pr[Type II error]
• Typical goal is power = 0.80
• For a two-sample t-test, the sample size
needed for a power of 80% to detect a
difference of D is:
n = 16
D
2](https://crownmelresort.com/image.slidesharecdn.com/16exdesign-250706074654-3653c9a4/75/design-of-experiments-25-desigfnExDesign-ppt-52-2048.jpg)