BIometrics- plotting DET and EER curve using Matlab
This document describes analyzing biometric sample data to evaluate a system's performance. It includes:
1) Plotting score distributions to visualize genuine and imposter data.
2) Generating a DET curve to evaluate accuracy at different operating points and determine equal error rate.
3) Calculating an optimal operating point that minimizes total costs based on false accept and reject rates.
The analysis uses MATLAB to load sample data, calculate performance metrics, and plot the results. Key results include an equal error rate of 0.08611 and optimal operating point with 0.02333 false accept rate and 0.1092 false reject rate minimizing total cost to 1.6725.
In this document
Powered by AI
Name of presenter: Shivakumar Koppad, submission date: 12/03/2015 to Dr. Richard Conway.
Introduction to data files G.dat and I.dat. Task includes plotting score distributions, DET curve, determining EER, and evaluating cost using MATLAB.
MATLAB code to plot score distribution between genuine and imposter users, showing counts across 10 score ranges.
Overview of Detection Error Tradeoff (DET) curves, their properties and significance in detection tasks.
MATLAB function for generating the DET curve, calculating True Positive Rate (TPR) and False Positive Rate (FPR).
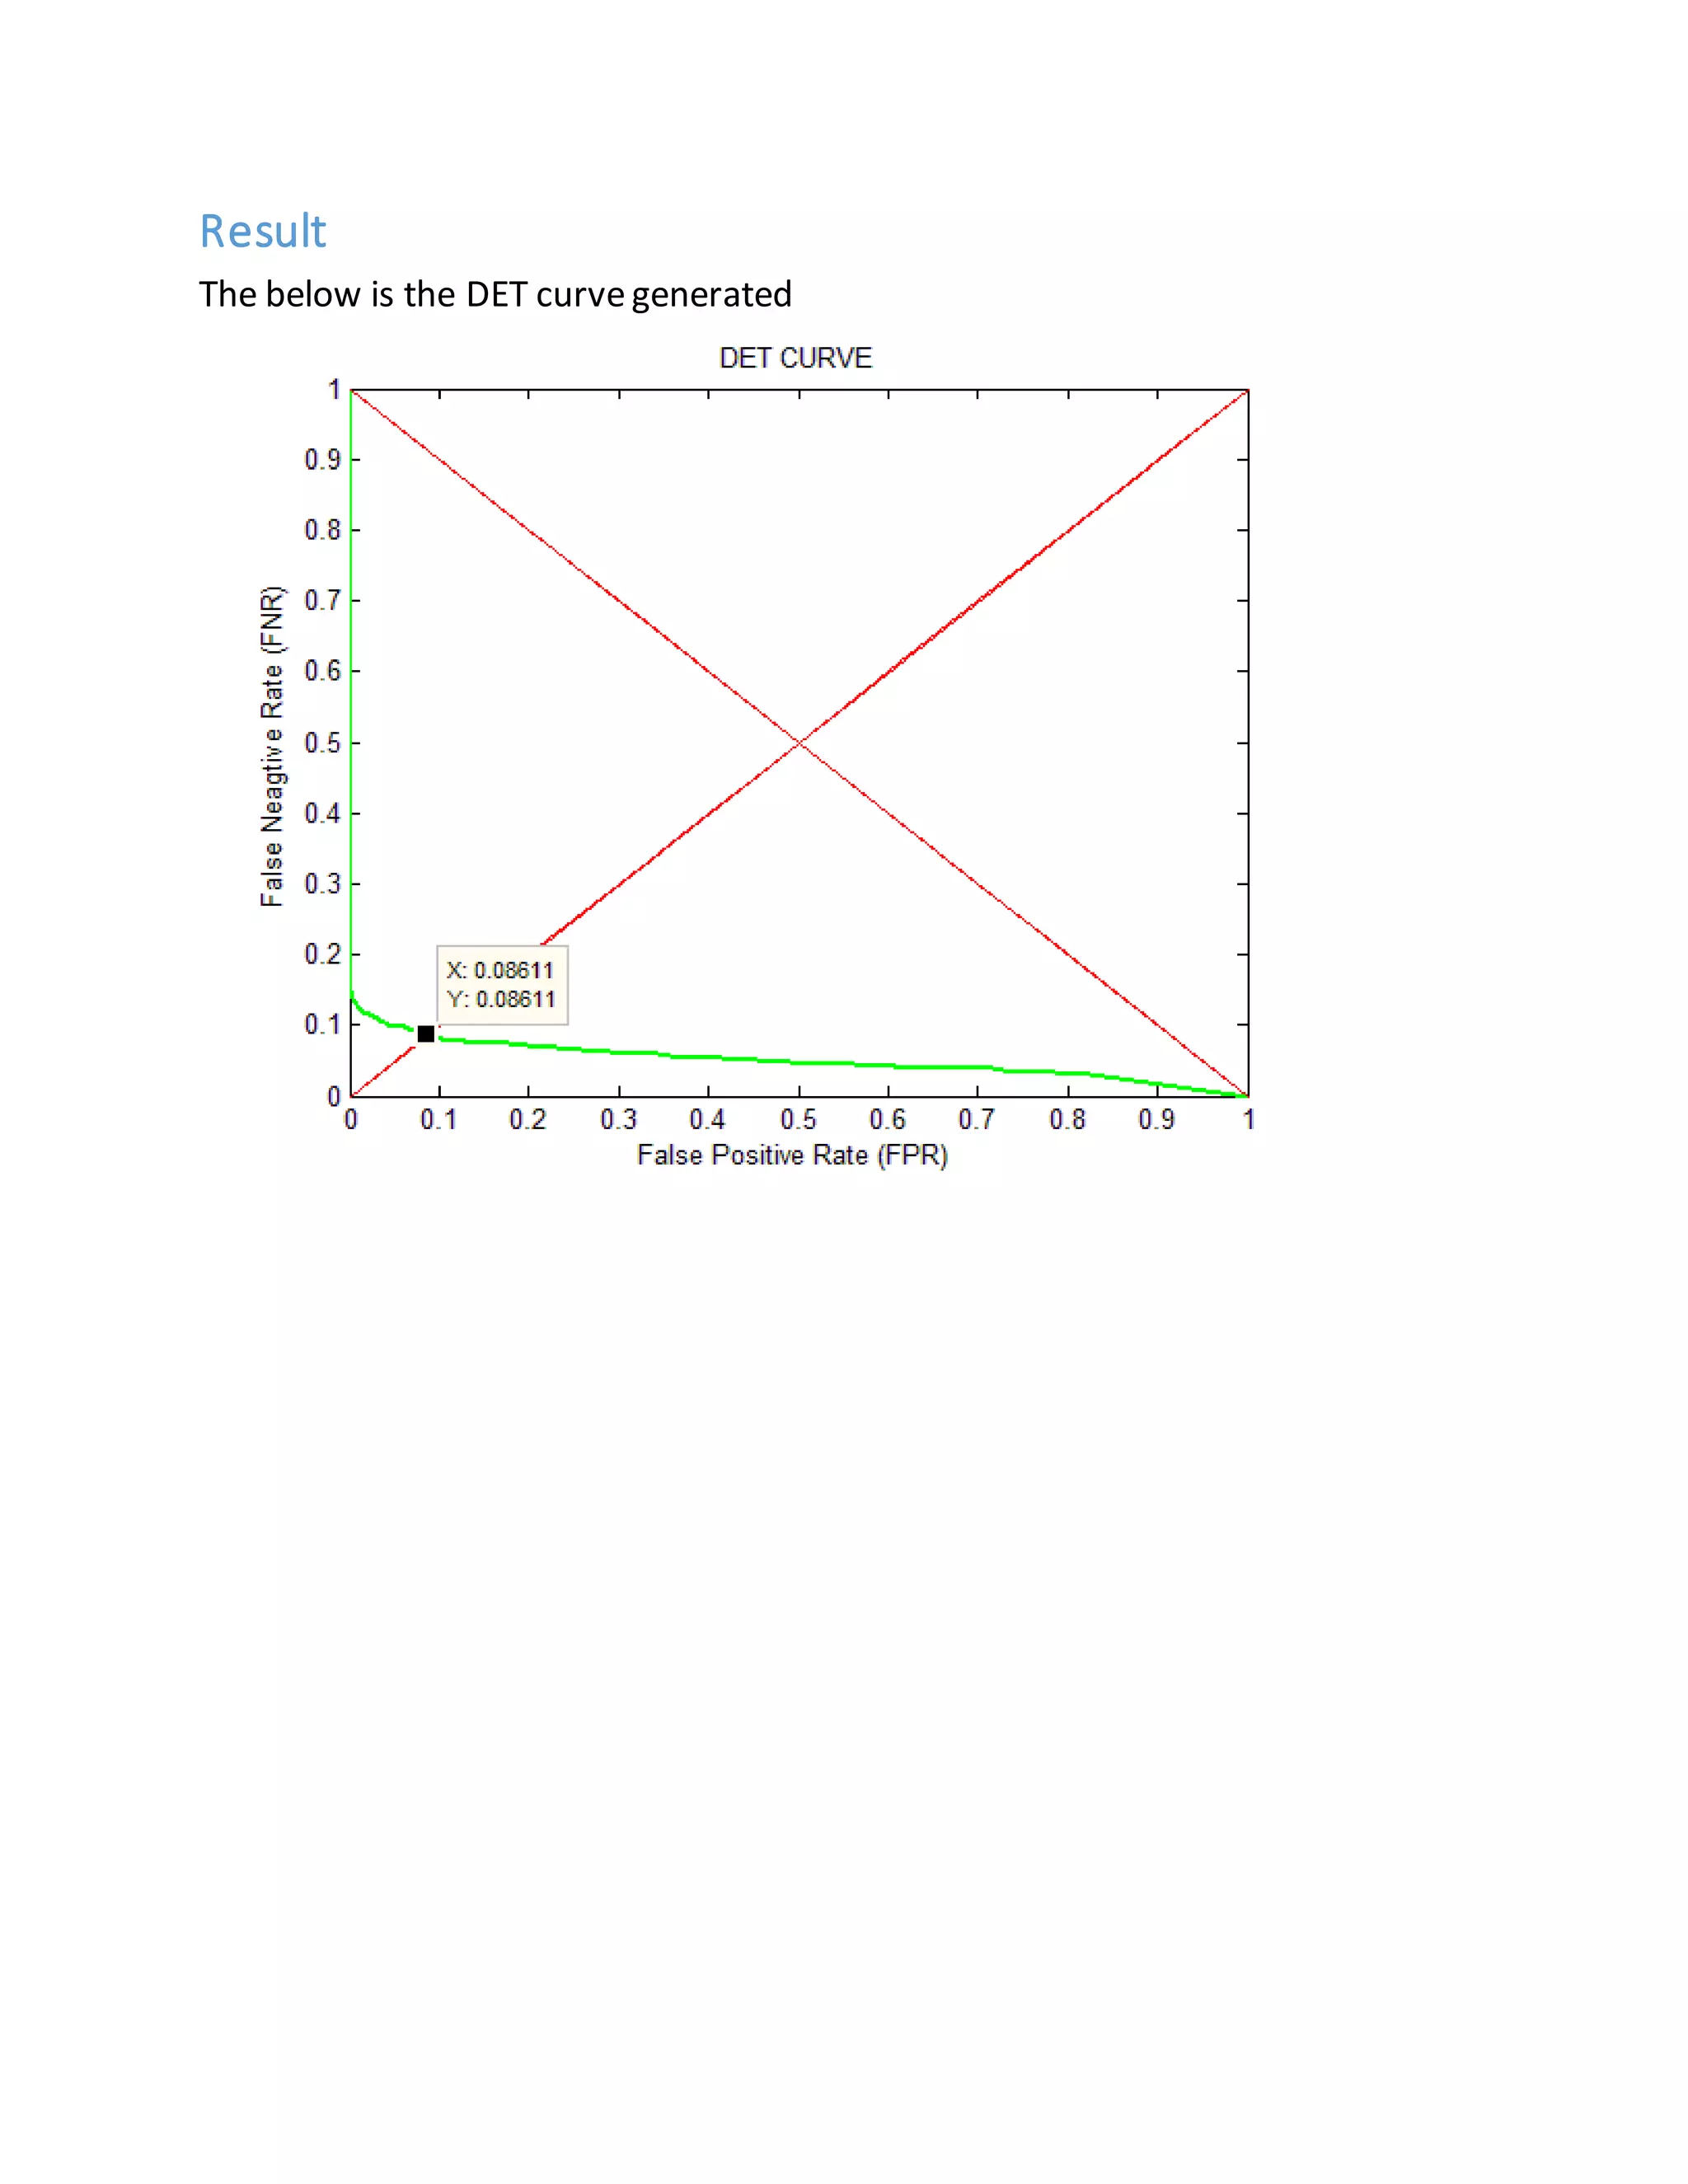
Result showcasing the DET curve generated through MATLAB, illustrating detection performance.
Explanation of EER, definitions, significance in biometric systems, and numerical EER values obtained from the DET curve.
Formula derivation for cost minimization in biometric systems based on false acceptance and rejection rates.
MATLAB function to calculate FRR and FAR; finding optimal operating point to minimize costs in detection.
Final results indicating FRR(T), FAR(T), and overall cost C calculated at 1.6725 based on graph data.
Two samplefiles G.datand I.datwith genuine and imposter sample scores
respectively were given and the following should be obtained from those.
Plot the scoredistributions for both
DET curve
Determining EER
Operation point to minimize the cost
MATLAB 2013a has been used to show the requirements
Scores Distributioncurve
The following code has been used to generate the graph to plot the score for
distribution curve.
%Name: Shivakumar Koppad
clc;
clear all;
close all;
% Importing data
load('G.dat');
load('I.dat');
% Implementing G file
gen=[0 0 0 0 0 0 0 0 0 0];
for g=1:1:1200
if 0<=G(g)<0.1
gen(1)=gen(1)+1;
elseif 0.1<=G(g)<0.2
gen(2)=gen(2)+1;
elseif 0.2<=G(g)<0.3
gen(3)=gen(3)+1;
elseif 0.3<=G(g)<0.4
gen(4)=gen(4)+1;
elseif 0.4<=G(g)<0.5
gen(5)=gen(5)+1;
elseif 0.5<=G(g)<0.6
gen(6)=gen(6)+1;
elseif 0.6<=G(g)<0.7
gen(7)=gen(7)+1;
elseif 0.7<=G(g)<0.8
gen(8)=gen(8)+1;
3.
elseif 0.8<=G(g)<0.9
gen(9)=gen(9)+1;
else
gen(10)=gen(10)+1;
end
end
% ImplementingI file
imp=[0 0 0 0 0 0 0 0 0 0];
for i=1:1:1200
if 0<=I(i)<0.1
imp(1)=imp(1)+1;
elseif 0.1<=I(i)<0.2
imp(2)=imp(2)+1;
elseif 0.2<=I(i)<0.3
imp(3)=imp(3)+1;
elseif 0.3<=I(i)<0.4
imp(4)=imp(4)+1;
elseif 0.4<=I(i)<0.5
imp(5)=imp(5)+1;
elseif 0.5<=I(i)<0.6
imp(6)=imp(6)+1;
elseif 0.6<=I(i)<0.7
imp(7)=imp(7)+1;
elseif 0.7<=I(i)<0.8
imp(8)=imp(8)+1;
elseif 0.8<=I(i)<0.9
imp(9)=imp(9)+1;
else
imp(10)=imp(10)+1;
end
end
% Defining Score
Score=[0 0.1 0.2 0.3 0.4 0.5 0.6 0.7 0.8 0.9];
hold on;
plot(Score,imp,'color','r');
plot(Score,gen,'color','b');
hold off;
xlabel('Scores')
ylabel('No. of users')
title('Distribution Diagram')
legend('genuine','imposter')
% End
Result:
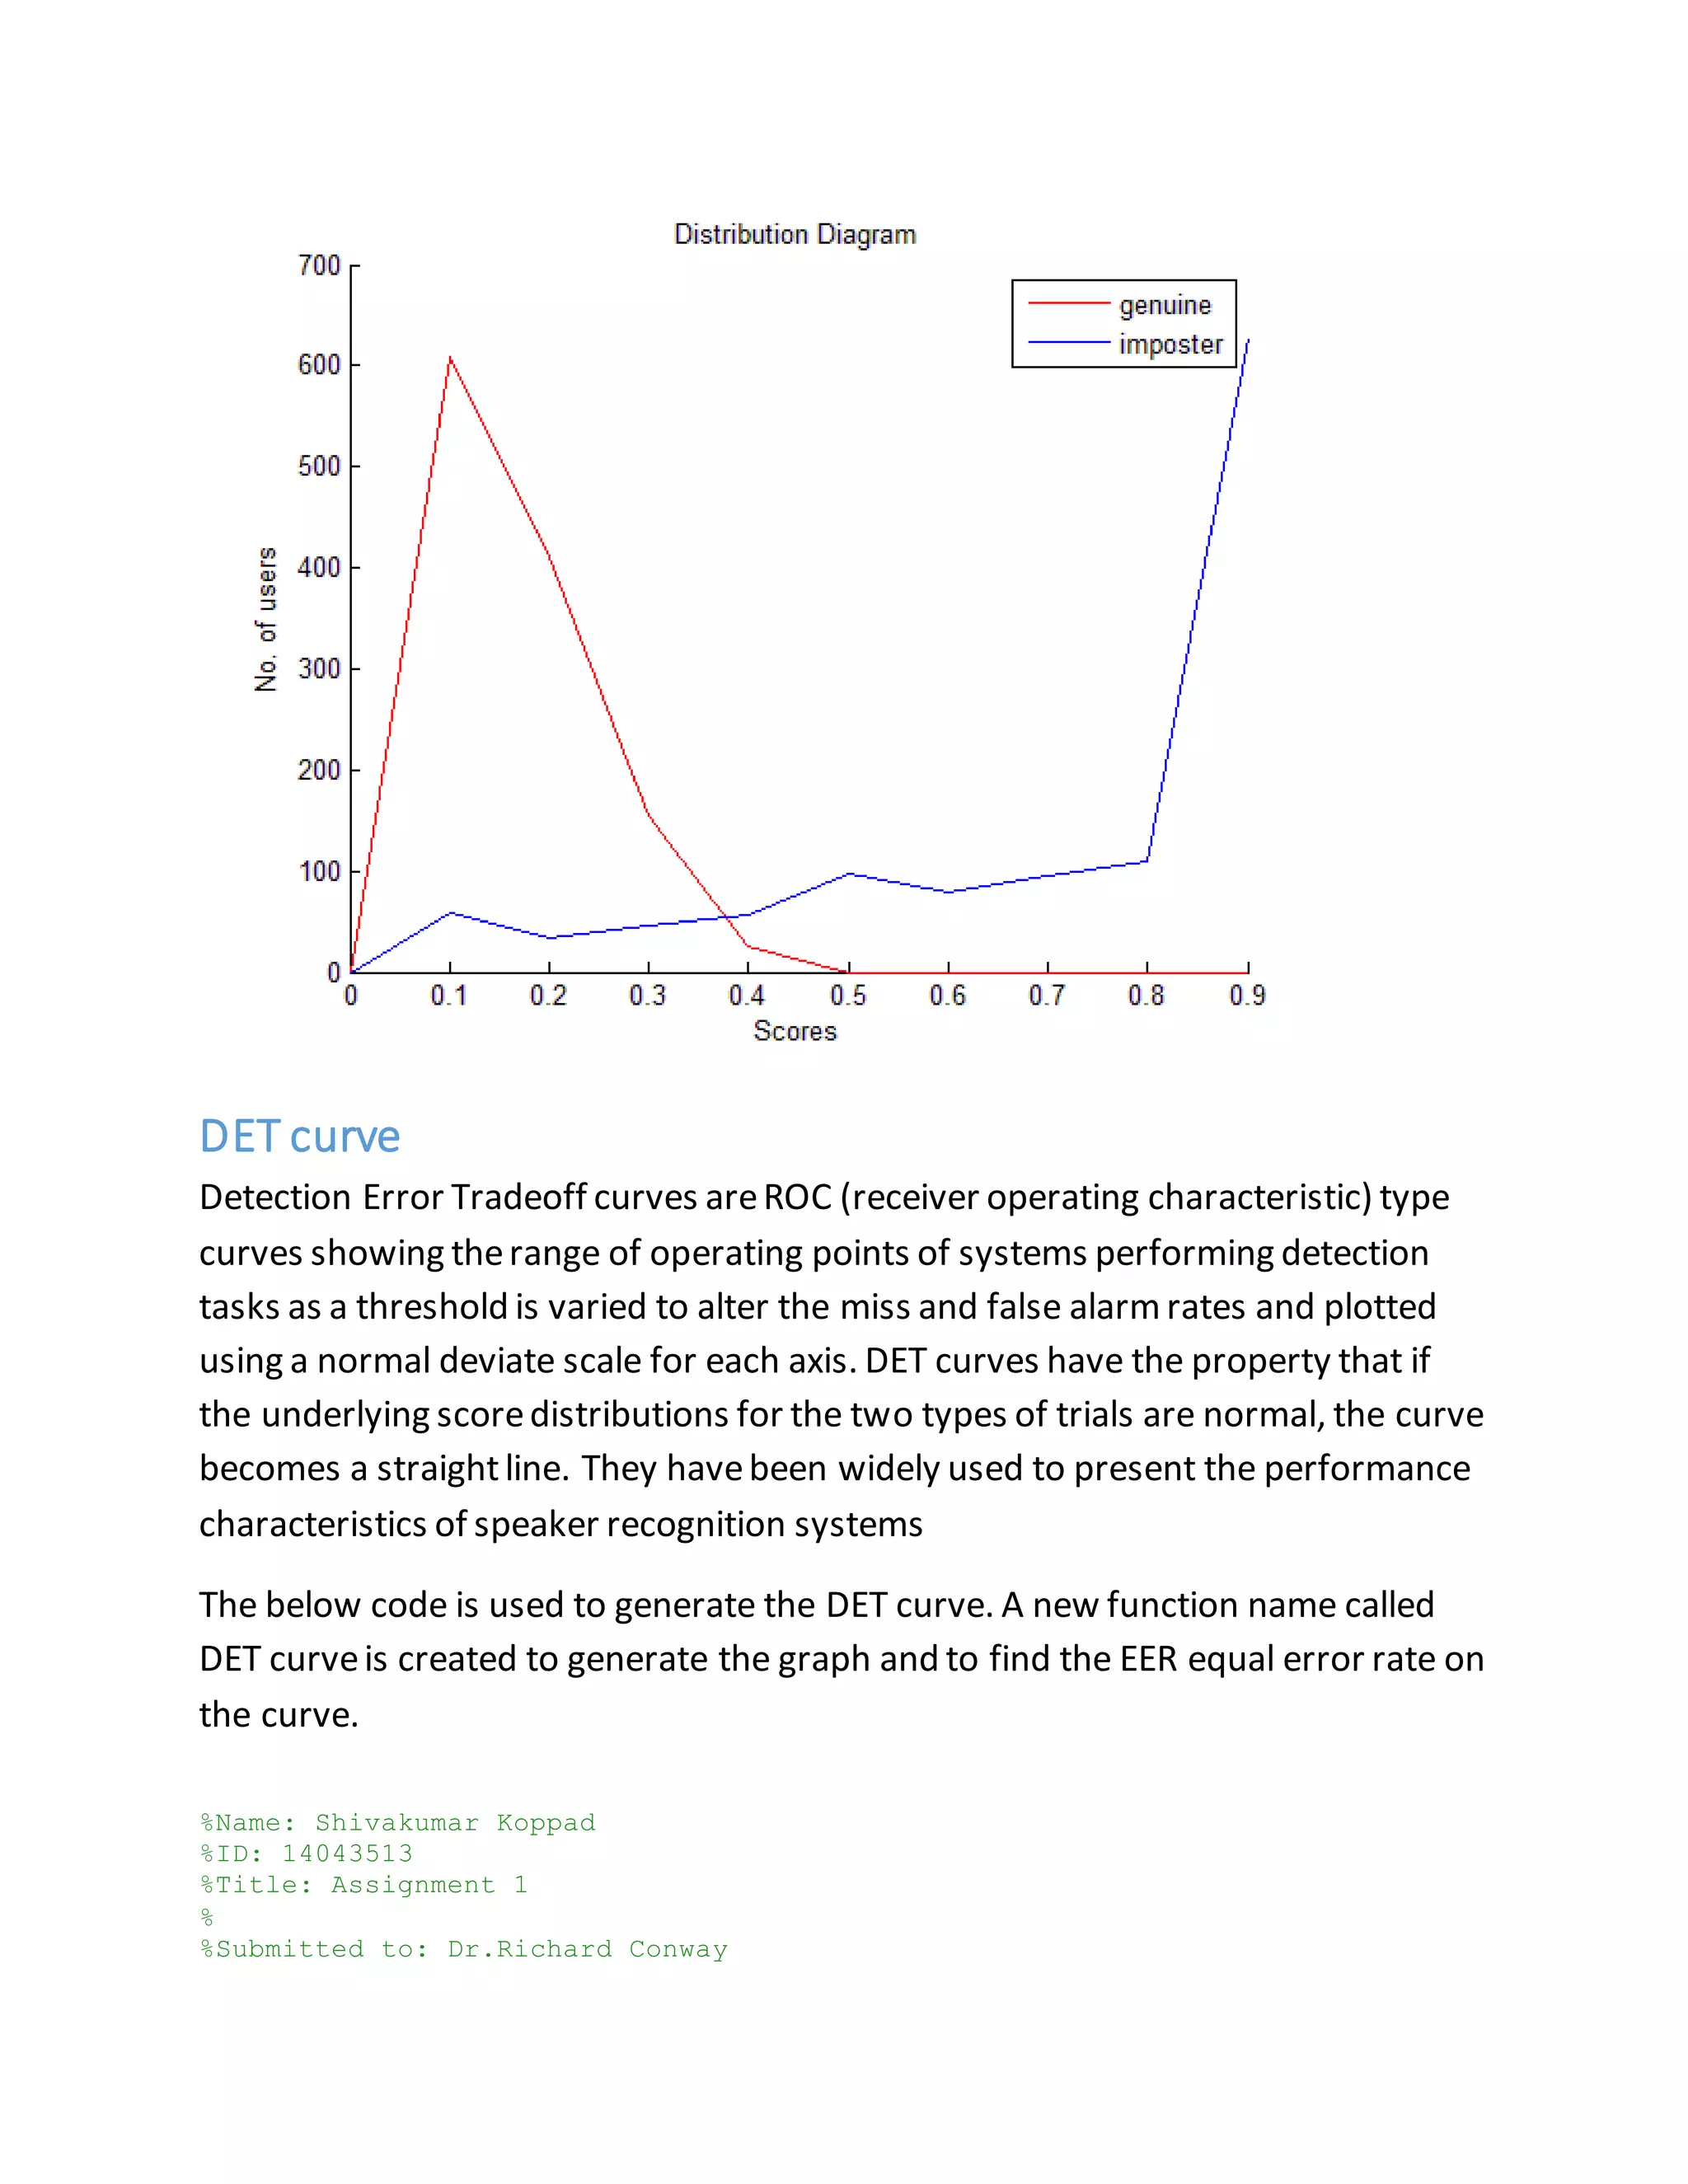
In the below output of the graph, X-axis represents the scores and Y-axis
represents the count for both genuine and imposter users.
4.
DET curve
Detection ErrorTradeoff curves areROC (receiver operating characteristic) type
curves showing therange of operating points of systems performing detection
tasks as a threshold is varied to alter the miss and false alarmrates and plotted
using a normal deviate scale for each axis. DET curves have the property that if
the underlying scoredistributions for the two types of trials are normal, the curve
becomes a straightline. They havebeen widely used to present the performance
characteristics of speaker recognition systems
The below code is used to generate the DET curve. A new function name called
DET curveis created to generate the graph and to find the EER equal error rate on
the curve.
%Name: Shivakumar Koppad
%ID: 14043513
%Title: Assignment 1
%
%Submitted to: Dr.Richard Conway
5.
function [TPR,FPR] =DETCurve(G,I)
load('G.dat');
load('I.dat');
% Creates a matrix
TPR = zeros(1, 1000);
FPR = zeros(1, 1000);
P = 1200;
N = 1200;
index = 0;
% Assume the threshold as 0.005
for threshold = 0:0.005:1
TP = 0;
FP = 0;
%Provides the genuine users count
for i = 1:1200
if (G(i) >= threshold)
TP = TP + 1;
end
end
% Provides the Imposters count
for i1 = 1:1200
if(I(i1) >= threshold)
FP = FP + 1;
end
end
index = index + 1;
% Calculating true positive rate
TPR(index) = TP/P;
% Calculating false positive rate
FPR(index) = FP/N;
end
% Calculating false negative rate(FNR) using TPR+FNR=1
FNR = (1-TPR);
x = 0:0.1:1;
y = x;
[x(i),y(i)] = polyxpoly(x,y,FPR,FNR);
fprintf('EER(X): %d n', x(i));
fprintf('EER(Y): %d n', y(i));
plot(FPR,FNR,'LineWidth',2, 'color','g');
hold on;
plot(x,y,x,1-y, 'color','r');
plot (x(i),y(i),'X','MarkerSize',10, 'LineWidth', 2,'Color','b');
hold off;
title('DET CURVE');
xlabel('False Positive Rate (FPR) ');
ylabel('False Neagtive Rate (FNR) ');
end
Equal error rate
Abiometric security systempredetermines the threshold values for its false
acceptance rate and its false rejection rate, and when the rates are equal, the
common value is referred to as the equal error rate. The value indicates that the
proportion of falseacceptances is equal to the proportion of false rejections. The
lower the equal error rate value, the higher the accuracy of the biometric system.
Fromabove figurewe can determine EER fromthe DET curve
EER(X, Y) = (FPR, FNR) = (0.08611, 0.08611)
Cost minimization
OP_min_costis created to find a suitable point on the DET curve which minimizes
the cost
FromBayesian statistics, the Cost (C) is calculated as:
C=CFAPIFAR(T) + CFRPGFRR(T)
Where,
CFA is the costof a single false accept
CFR is the cost of a single false reject
PI is probability of imposter users
PG is probability of genuine users
Given
Cost of False accept rate is 17
Cost of false reject rate is 27
Probability of Imposter users is 0.5
Probability of Genuine users is 0.5 (Weare assuming equal probabilities)
C = 17*0.5*FAR(T) +27*0.5*FRR(T)
8.
C = 8.5*FAR(T)+13.5*FRR(T)
13.5*FRR(T) =C- 8.5*FAR(T)
FRR(T) = [C- 8.5*FAR(T)]/13.5
FRR(T) = -0.6296*FAR(T) +C/13.5
This is in the form of y= mx+c
The following code has been used to generate the graph which can be used to
find FRR(T) and FAR(T) the point operated to minimize the cost
9.
function [FAR, FRR]= OPcost(G,I)
load('G.dat');
load('I.dat');
%Creates a matrix
FRR = zeros(1, 1000);
FAR = zeros(1, 1000);
i = 1200;
j = 1200;
index = 0;
%Assume the threshold as 0.001
for threshold = 0:0.001:1
FN = 0;
FP = 0;
for i = 1:1200
if (G(i) <= threshold)
FN = FN + 1;
end
end
for i1 = 1:1000
if(I(i1) >= threshold)
FP = FP + 1;
end
end
index = index + 1;
FRR(index) = FN/i;
FAR(index) = FP/j;
end
hold on;
plot(FAR,FRR,'LineWidth',1,'color','c');
%To start with assume the minimum cost as 100
min = 100;
min_new=0;
for i1=1:1000
if 17*0.5*FAR(i1) + 27*0.5*FRR(i1) < min
min = 17*0.5*FAR(i1) + 27*0.5*FRR(i1);
min_new = i1;
end
end
plot(FAR(min_new),FRR(min_new),'x','MarkerSize',14);
Xmin = 0:0.05:1;
Ymin = (-0.33)*Xmin + 0.06989*min;
plot (Xmin,Ymin,'color', 'm');
hold off;
title('Operating point to minimise cost');
xlabel('FAR ');
ylabel('FRR ');
10.
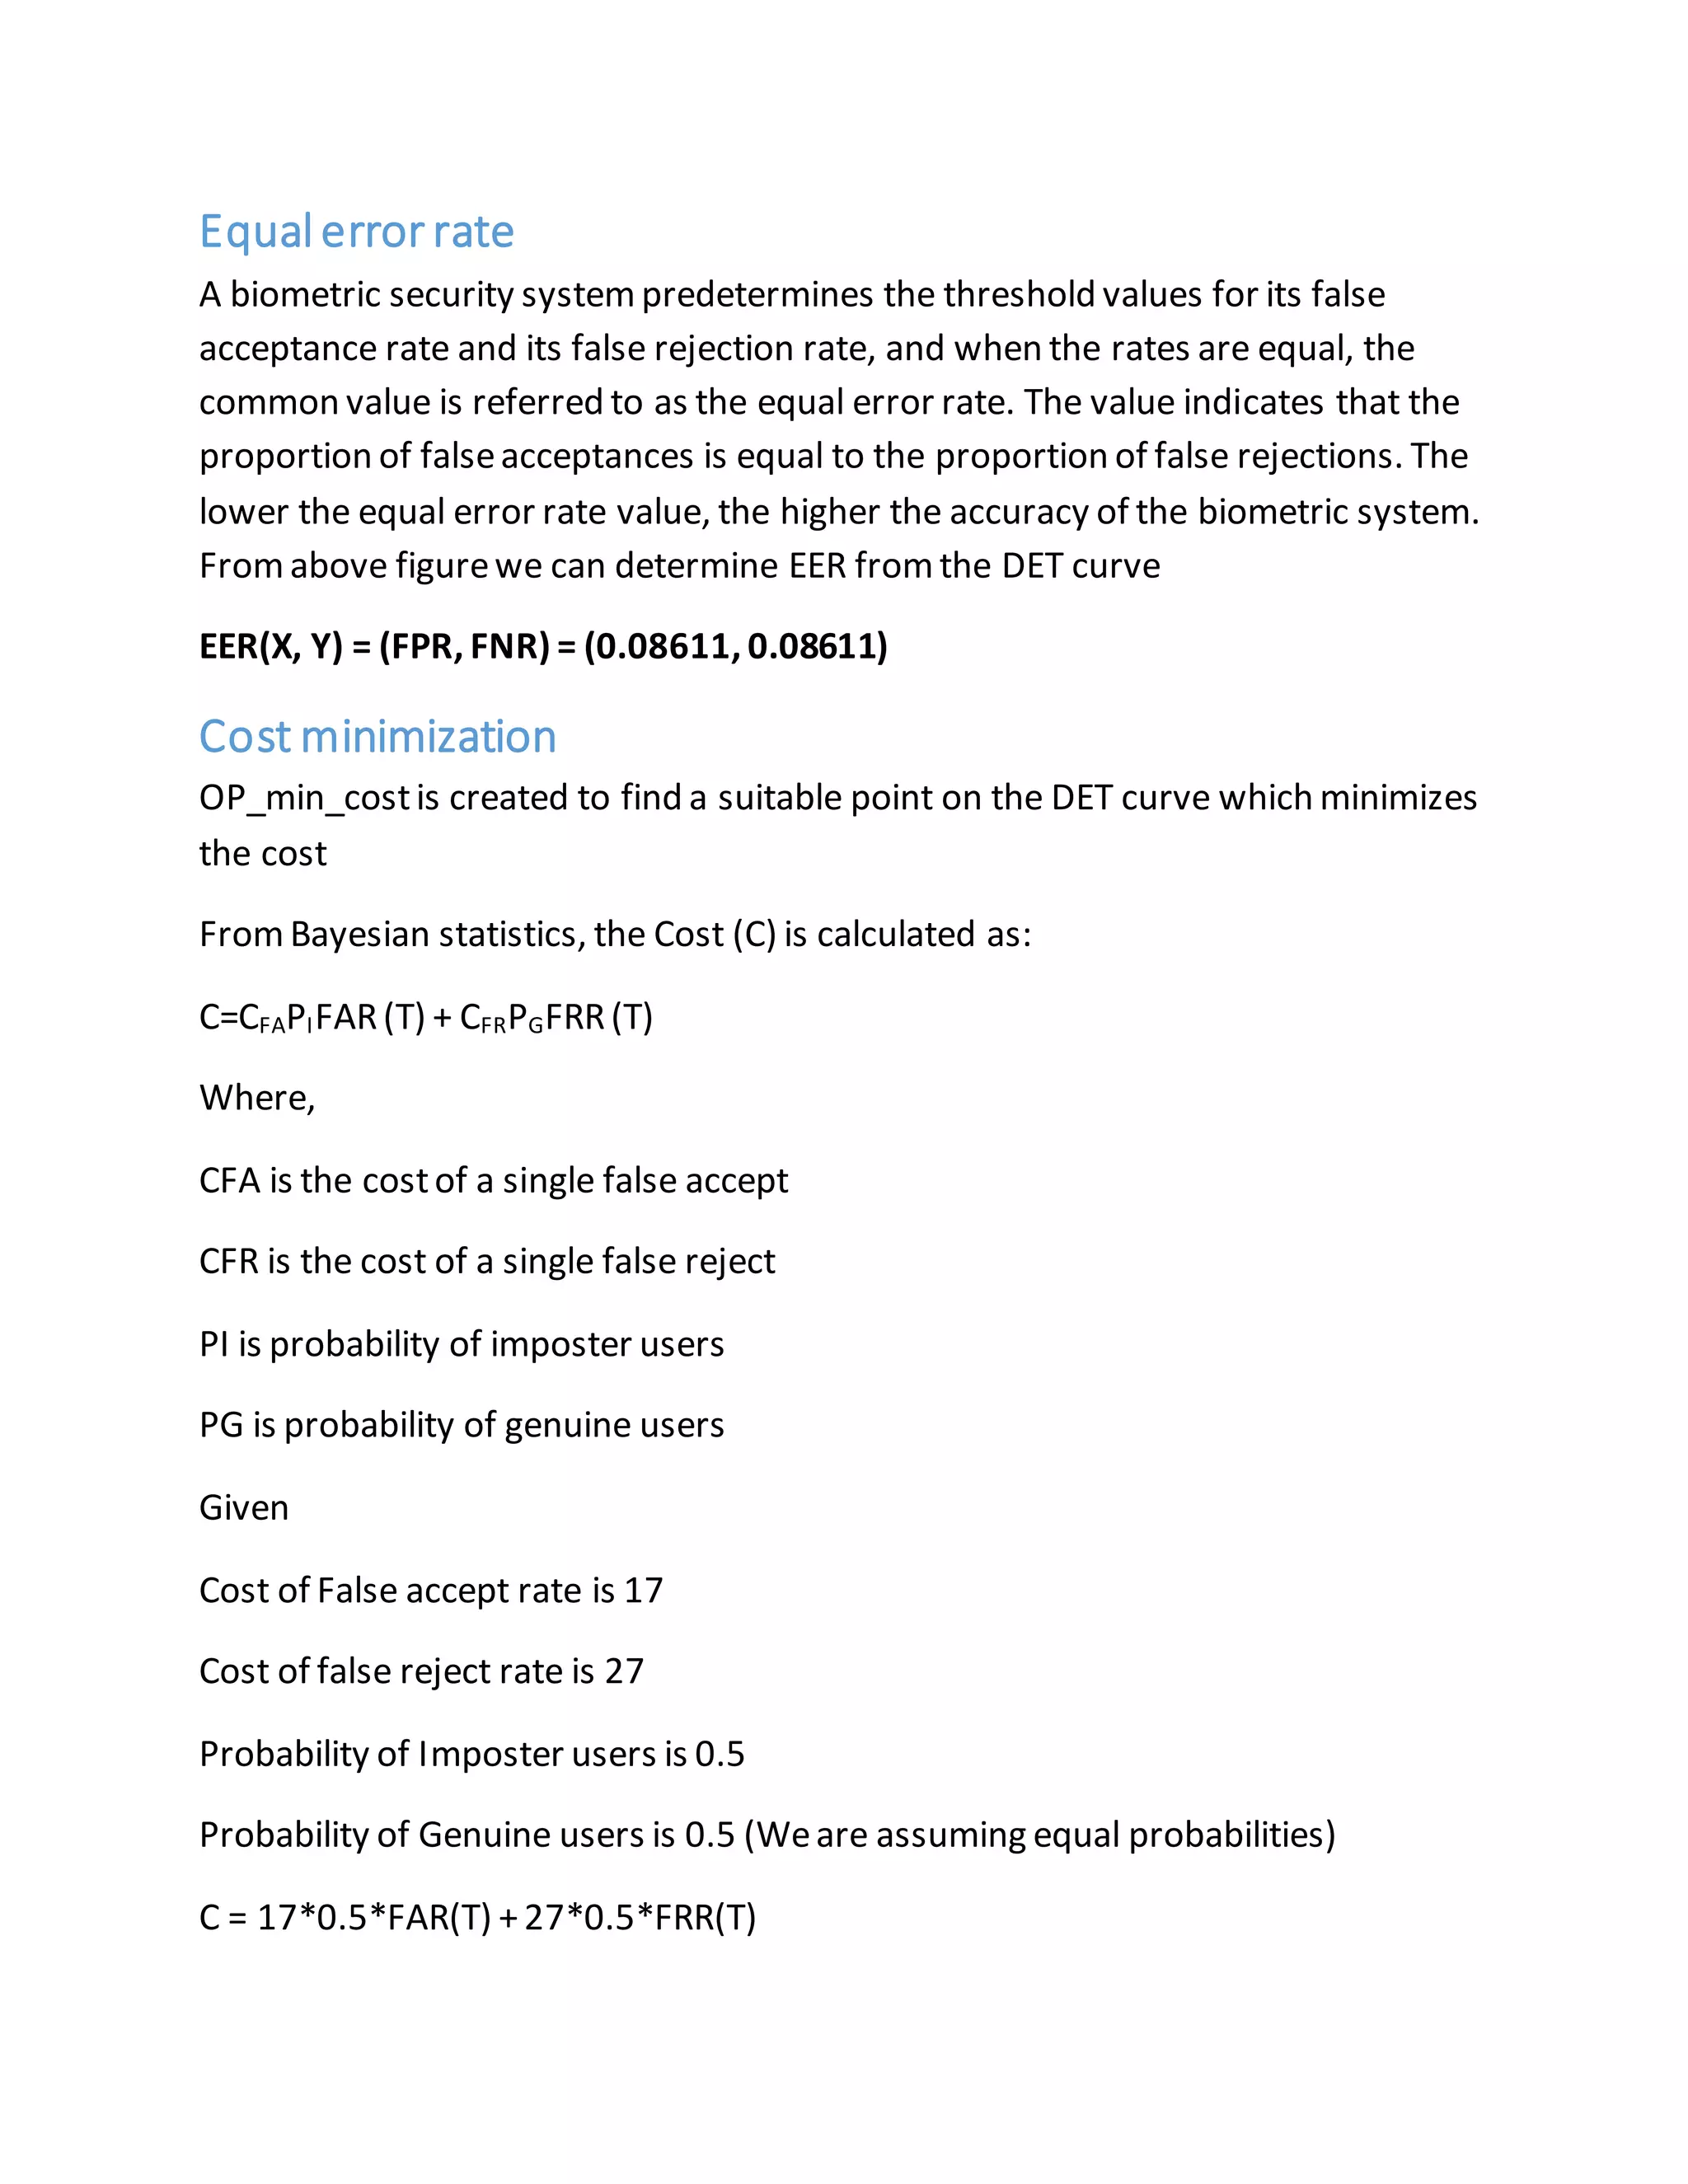
Result
According to thegraph
FAR(T) = 0.02333
FRR(T) = 0.1092
Now,
13.5*FRR(T) =C- 8.5*FAR(T)
13.5*0.1092=C-8.5*0.02333
1.4742=c-0.198305
Therefore, C = 1.6725
So the cost C is 1.6725

![Two samplefiles G.dat and I.datwith genuine and imposter sample scores
respectively were given and the following should be obtained from those.
Plot the scoredistributions for both
DET curve
Determining EER
Operation point to minimize the cost
MATLAB 2013a has been used to show the requirements
Scores Distributioncurve
The following code has been used to generate the graph to plot the score for
distribution curve.
%Name: Shivakumar Koppad
clc;
clear all;
close all;
% Importing data
load('G.dat');
load('I.dat');
% Implementing G file
gen=[0 0 0 0 0 0 0 0 0 0];
for g=1:1:1200
if 0<=G(g)<0.1
gen(1)=gen(1)+1;
elseif 0.1<=G(g)<0.2
gen(2)=gen(2)+1;
elseif 0.2<=G(g)<0.3
gen(3)=gen(3)+1;
elseif 0.3<=G(g)<0.4
gen(4)=gen(4)+1;
elseif 0.4<=G(g)<0.5
gen(5)=gen(5)+1;
elseif 0.5<=G(g)<0.6
gen(6)=gen(6)+1;
elseif 0.6<=G(g)<0.7
gen(7)=gen(7)+1;
elseif 0.7<=G(g)<0.8
gen(8)=gen(8)+1;](https://image.slidesharecdn.com/65e66fd9-217d-4328-b6ef-e1d2aab38f99-150729133947-lva1-app6891/75/BIometrics-plotting-DET-and-EER-curve-using-Matlab-2-2048.jpg)
![elseif 0.8<=G(g)<0.9
gen(9)=gen(9)+1;
else
gen(10)=gen(10)+1;
end
end
% Implementing I file
imp=[0 0 0 0 0 0 0 0 0 0];
for i=1:1:1200
if 0<=I(i)<0.1
imp(1)=imp(1)+1;
elseif 0.1<=I(i)<0.2
imp(2)=imp(2)+1;
elseif 0.2<=I(i)<0.3
imp(3)=imp(3)+1;
elseif 0.3<=I(i)<0.4
imp(4)=imp(4)+1;
elseif 0.4<=I(i)<0.5
imp(5)=imp(5)+1;
elseif 0.5<=I(i)<0.6
imp(6)=imp(6)+1;
elseif 0.6<=I(i)<0.7
imp(7)=imp(7)+1;
elseif 0.7<=I(i)<0.8
imp(8)=imp(8)+1;
elseif 0.8<=I(i)<0.9
imp(9)=imp(9)+1;
else
imp(10)=imp(10)+1;
end
end
% Defining Score
Score=[0 0.1 0.2 0.3 0.4 0.5 0.6 0.7 0.8 0.9];
hold on;
plot(Score,imp,'color','r');
plot(Score,gen,'color','b');
hold off;
xlabel('Scores')
ylabel('No. of users')
title('Distribution Diagram')
legend('genuine','imposter')
% End
Result:
In the below output of the graph, X-axis represents the scores and Y-axis
represents the count for both genuine and imposter users.](https://image.slidesharecdn.com/65e66fd9-217d-4328-b6ef-e1d2aab38f99-150729133947-lva1-app6891/75/BIometrics-plotting-DET-and-EER-curve-using-Matlab-3-2048.jpg)
![function [TPR,FPR] = DETCurve(G,I)
load('G.dat');
load('I.dat');
% Creates a matrix
TPR = zeros(1, 1000);
FPR = zeros(1, 1000);
P = 1200;
N = 1200;
index = 0;
% Assume the threshold as 0.005
for threshold = 0:0.005:1
TP = 0;
FP = 0;
%Provides the genuine users count
for i = 1:1200
if (G(i) >= threshold)
TP = TP + 1;
end
end
% Provides the Imposters count
for i1 = 1:1200
if(I(i1) >= threshold)
FP = FP + 1;
end
end
index = index + 1;
% Calculating true positive rate
TPR(index) = TP/P;
% Calculating false positive rate
FPR(index) = FP/N;
end
% Calculating false negative rate(FNR) using TPR+FNR=1
FNR = (1-TPR);
x = 0:0.1:1;
y = x;
[x(i),y(i)] = polyxpoly(x,y,FPR,FNR);
fprintf('EER(X): %d n', x(i));
fprintf('EER(Y): %d n', y(i));
plot(FPR,FNR,'LineWidth',2, 'color','g');
hold on;
plot(x,y,x,1-y, 'color','r');
plot (x(i),y(i),'X','MarkerSize',10, 'LineWidth', 2,'Color','b');
hold off;
title('DET CURVE');
xlabel('False Positive Rate (FPR) ');
ylabel('False Neagtive Rate (FNR) ');
end](https://image.slidesharecdn.com/65e66fd9-217d-4328-b6ef-e1d2aab38f99-150729133947-lva1-app6891/75/BIometrics-plotting-DET-and-EER-curve-using-Matlab-5-2048.jpg)
![C = 8.5*FAR(T) +13.5*FRR(T)
13.5*FRR(T) =C- 8.5*FAR(T)
FRR(T) = [C- 8.5*FAR(T)]/13.5
FRR(T) = -0.6296*FAR(T) +C/13.5
This is in the form of y= mx+c
The following code has been used to generate the graph which can be used to
find FRR(T) and FAR(T) the point operated to minimize the cost](https://image.slidesharecdn.com/65e66fd9-217d-4328-b6ef-e1d2aab38f99-150729133947-lva1-app6891/75/BIometrics-plotting-DET-and-EER-curve-using-Matlab-8-2048.jpg)
![function [FAR, FRR] = OPcost(G,I)
load('G.dat');
load('I.dat');
%Creates a matrix
FRR = zeros(1, 1000);
FAR = zeros(1, 1000);
i = 1200;
j = 1200;
index = 0;
%Assume the threshold as 0.001
for threshold = 0:0.001:1
FN = 0;
FP = 0;
for i = 1:1200
if (G(i) <= threshold)
FN = FN + 1;
end
end
for i1 = 1:1000
if(I(i1) >= threshold)
FP = FP + 1;
end
end
index = index + 1;
FRR(index) = FN/i;
FAR(index) = FP/j;
end
hold on;
plot(FAR,FRR,'LineWidth',1,'color','c');
%To start with assume the minimum cost as 100
min = 100;
min_new=0;
for i1=1:1000
if 17*0.5*FAR(i1) + 27*0.5*FRR(i1) < min
min = 17*0.5*FAR(i1) + 27*0.5*FRR(i1);
min_new = i1;
end
end
plot(FAR(min_new),FRR(min_new),'x','MarkerSize',14);
Xmin = 0:0.05:1;
Ymin = (-0.33)*Xmin + 0.06989*min;
plot (Xmin,Ymin,'color', 'm');
hold off;
title('Operating point to minimise cost');
xlabel('FAR ');
ylabel('FRR ');](https://image.slidesharecdn.com/65e66fd9-217d-4328-b6ef-e1d2aab38f99-150729133947-lva1-app6891/75/BIometrics-plotting-DET-and-EER-curve-using-Matlab-9-2048.jpg)

![Two samplefiles G.dat and I.datwith genuine and imposter sample scores
respectively were given and the following should be obtained from those.
Plot the scoredistributions for both
DET curve
Determining EER
Operation point to minimize the cost
MATLAB 2013a has been used to show the requirements
Scores Distributioncurve
The following code has been used to generate the graph to plot the score for
distribution curve.
%Name: Shivakumar Koppad
clc;
clear all;
close all;
% Importing data
load('G.dat');
load('I.dat');
% Implementing G file
gen=[0 0 0 0 0 0 0 0 0 0];
for g=1:1:1200
if 0<=G(g)<0.1
gen(1)=gen(1)+1;
elseif 0.1<=G(g)<0.2
gen(2)=gen(2)+1;
elseif 0.2<=G(g)<0.3
gen(3)=gen(3)+1;
elseif 0.3<=G(g)<0.4
gen(4)=gen(4)+1;
elseif 0.4<=G(g)<0.5
gen(5)=gen(5)+1;
elseif 0.5<=G(g)<0.6
gen(6)=gen(6)+1;
elseif 0.6<=G(g)<0.7
gen(7)=gen(7)+1;
elseif 0.7<=G(g)<0.8
gen(8)=gen(8)+1;](https://crownmelresort.com/image.slidesharecdn.com/65e66fd9-217d-4328-b6ef-e1d2aab38f99-150729133947-lva1-app6891/75/BIometrics-plotting-DET-and-EER-curve-using-Matlab-2-2048.jpg)
![elseif 0.8<=G(g)<0.9
gen(9)=gen(9)+1;
else
gen(10)=gen(10)+1;
end
end
% Implementing I file
imp=[0 0 0 0 0 0 0 0 0 0];
for i=1:1:1200
if 0<=I(i)<0.1
imp(1)=imp(1)+1;
elseif 0.1<=I(i)<0.2
imp(2)=imp(2)+1;
elseif 0.2<=I(i)<0.3
imp(3)=imp(3)+1;
elseif 0.3<=I(i)<0.4
imp(4)=imp(4)+1;
elseif 0.4<=I(i)<0.5
imp(5)=imp(5)+1;
elseif 0.5<=I(i)<0.6
imp(6)=imp(6)+1;
elseif 0.6<=I(i)<0.7
imp(7)=imp(7)+1;
elseif 0.7<=I(i)<0.8
imp(8)=imp(8)+1;
elseif 0.8<=I(i)<0.9
imp(9)=imp(9)+1;
else
imp(10)=imp(10)+1;
end
end
% Defining Score
Score=[0 0.1 0.2 0.3 0.4 0.5 0.6 0.7 0.8 0.9];
hold on;
plot(Score,imp,'color','r');
plot(Score,gen,'color','b');
hold off;
xlabel('Scores')
ylabel('No. of users')
title('Distribution Diagram')
legend('genuine','imposter')
% End
Result:
In the below output of the graph, X-axis represents the scores and Y-axis
represents the count for both genuine and imposter users.](https://crownmelresort.com/image.slidesharecdn.com/65e66fd9-217d-4328-b6ef-e1d2aab38f99-150729133947-lva1-app6891/75/BIometrics-plotting-DET-and-EER-curve-using-Matlab-3-2048.jpg)

![function [TPR,FPR] = DETCurve(G,I)
load('G.dat');
load('I.dat');
% Creates a matrix
TPR = zeros(1, 1000);
FPR = zeros(1, 1000);
P = 1200;
N = 1200;
index = 0;
% Assume the threshold as 0.005
for threshold = 0:0.005:1
TP = 0;
FP = 0;
%Provides the genuine users count
for i = 1:1200
if (G(i) >= threshold)
TP = TP + 1;
end
end
% Provides the Imposters count
for i1 = 1:1200
if(I(i1) >= threshold)
FP = FP + 1;
end
end
index = index + 1;
% Calculating true positive rate
TPR(index) = TP/P;
% Calculating false positive rate
FPR(index) = FP/N;
end
% Calculating false negative rate(FNR) using TPR+FNR=1
FNR = (1-TPR);
x = 0:0.1:1;
y = x;
[x(i),y(i)] = polyxpoly(x,y,FPR,FNR);
fprintf('EER(X): %d n', x(i));
fprintf('EER(Y): %d n', y(i));
plot(FPR,FNR,'LineWidth',2, 'color','g');
hold on;
plot(x,y,x,1-y, 'color','r');
plot (x(i),y(i),'X','MarkerSize',10, 'LineWidth', 2,'Color','b');
hold off;
title('DET CURVE');
xlabel('False Positive Rate (FPR) ');
ylabel('False Neagtive Rate (FNR) ');
end](https://crownmelresort.com/image.slidesharecdn.com/65e66fd9-217d-4328-b6ef-e1d2aab38f99-150729133947-lva1-app6891/75/BIometrics-plotting-DET-and-EER-curve-using-Matlab-5-2048.jpg)


![C = 8.5*FAR(T) +13.5*FRR(T)
13.5*FRR(T) =C- 8.5*FAR(T)
FRR(T) = [C- 8.5*FAR(T)]/13.5
FRR(T) = -0.6296*FAR(T) +C/13.5
This is in the form of y= mx+c
The following code has been used to generate the graph which can be used to
find FRR(T) and FAR(T) the point operated to minimize the cost](https://crownmelresort.com/image.slidesharecdn.com/65e66fd9-217d-4328-b6ef-e1d2aab38f99-150729133947-lva1-app6891/75/BIometrics-plotting-DET-and-EER-curve-using-Matlab-8-2048.jpg)
![function [FAR, FRR] = OPcost(G,I)
load('G.dat');
load('I.dat');
%Creates a matrix
FRR = zeros(1, 1000);
FAR = zeros(1, 1000);
i = 1200;
j = 1200;
index = 0;
%Assume the threshold as 0.001
for threshold = 0:0.001:1
FN = 0;
FP = 0;
for i = 1:1200
if (G(i) <= threshold)
FN = FN + 1;
end
end
for i1 = 1:1000
if(I(i1) >= threshold)
FP = FP + 1;
end
end
index = index + 1;
FRR(index) = FN/i;
FAR(index) = FP/j;
end
hold on;
plot(FAR,FRR,'LineWidth',1,'color','c');
%To start with assume the minimum cost as 100
min = 100;
min_new=0;
for i1=1:1000
if 17*0.5*FAR(i1) + 27*0.5*FRR(i1) < min
min = 17*0.5*FAR(i1) + 27*0.5*FRR(i1);
min_new = i1;
end
end
plot(FAR(min_new),FRR(min_new),'x','MarkerSize',14);
Xmin = 0:0.05:1;
Ymin = (-0.33)*Xmin + 0.06989*min;
plot (Xmin,Ymin,'color', 'm');
hold off;
title('Operating point to minimise cost');
xlabel('FAR ');
ylabel('FRR ');](https://crownmelresort.com/image.slidesharecdn.com/65e66fd9-217d-4328-b6ef-e1d2aab38f99-150729133947-lva1-app6891/75/BIometrics-plotting-DET-and-EER-curve-using-Matlab-9-2048.jpg)